Abstract
The penetration increase in distributed generators (DGs) into smart grids (SGs) will lead to new challenges, especially in protection systems. In the case of ring grids, the behavior of the short-circuit current is affected by DGs, and the medium voltage (MV) transformer connections significantly influence the changes; therefore, the protection strategies must be adapted for these scenarios. This study provides a comprehensive protection system for the MV distribution system (DS), including reconfigurable smart ring grids. The proposed protection methods contain three protection algorithms. The first protection algorithm relies on communication among all protective devices (PDs) in the grid, whereas the second protection method uses communication among PDs along the same line. Then, a third algorithm built on the local data of each PD is suggested as a backup to prevent communication issues and offer more reliable protection. MATLABTM SIMULINK simulations and experimental results on a scalable hardware grid were also employed to validate the protection algorithms.
1. Introduction
Distributed generator (DG) penetration in distribution systems (DSs) is growing significantly. However, this increase causes several challenges due to various power-generating sites and changes in the current value of relay short-circuits, which impact the protective device (PD) settings. The DG penetrations into a DS may also impact the grid power flow [1].
Transformers are one of the essential components of electric power systems that significantly impact a distribution system. They can affect system loss, zero-sequence currents, the grounding method, and the protection strategy [2]. Transformers are connected in various distribution system configurations, affecting the system performance, including the phase shift’s impact on the relay protection and system operation. An example of this is the phase shift caused by the delta-grounded wye connection of distribution step-down transformers [3], which alters positive- and negative-sequence voltages. Consequently, the three phases’ magnitudes and phase-angle jumps will shift due to unbalanced voltage sag.
Another important factor that significantly impacts system performance and protective relaying is selecting the type of neutral grounding [4]. For example, in the case of a delta–wye transformer with grounded neutral, if there is a single line-to-ground fault on the wye side, due to the infinite zero-sequence impedance between the two windings, the ground relays on the delta side will not detect the fault. On the other hand, the phase relays will identify it as a phase-to-phase fault with a magnitude of 58% [5], less than the wye side. Therefore, a number of technical obstacles emerge in relation to this potentiality. The detection of faults by conventional protection systems is a challenging and complex matter, posing a significant challenge. This highlights the importance of employing intelligent protection strategies in order to enhance the efficiency of the network [6].
Different territories adopt several earthing systems according to the rated voltage level. For example, Table 1, obtained from the Spanish electrical company ENDESA, demonstrates different transformer connections depending on the utility [7,8]. Moreover, the same utility can adopt different earthing systems for each region, as shown in the second table of the Iberdrola company document regarding the particular customer facility regulations [8].

Table 1.
Grounding connection of the hv/mv power transformer.
The protection of DSs has recently placed increasing emphasis on Artificial Intelligence (AI) approaches, mainly because of their ability to operate fast and deal with many inputs. Table 2 shows the advantages and disadvantages of the most common techniques. Furthermore, cyber security is one of the main challenges that has arisen with the increase in smart grids (SGs). Due to the increased reliance on communications for control and optimization in SGs, many issues have been raised, such as insecure communication protocols, insecure protocol translators similar to end-point device vulnerabilities, and poor communication network design [9]. Previous issues could lead to severe security problems as PD settings change or do not communicate promptly [10]. Moreover, communications and controls in the SG may differ due to the lack of standardization, leading to incompatibility issues [11].
It should also be considered that the SG may have different stability margins which improve the network operation but detrimentally impact system stability without proper understanding [12]. Also, in some cases, SGs suffer from a lack of firewalls and intrusion detection or have prevention systems that cannot block or detect malicious communications [13].
Table 2.
A comparative analysis of ai methods [14].
Table 2.
A comparative analysis of ai methods [14].
| Artificial Neural Network (ANN) | Support Vector Machine (SVM) | Fuzzy Logic Control (FLC) | Genetic Algorithm (GA) | Matching Approach | |
|---|---|---|---|---|---|
| Advantages |
|
|
|
|
|
| Disadvantages |
|
|
|
|
|
Various methods have been developed lately to locate and detect faults in DSs despite multiple fault sources. In [15], a protection scheme that uses a deep neural network (DNN) and sparse autoencoder (SAE) is proposed to discriminate between array and symmetrical line faults as well as guarantee secure fault detection. This scheme offers a rapid tripping action considering the communication rate under various DG penetration and fault resistance scenarios. However, it must be updated in case of grid reconfiguration and relies on communication channels. In [16], a fault detection method utilizing a communication-based directional relay system with an ANN is presented. However, the demerits of complex computations and long training are presented, and communication is employed. In [17], the authors proposed a two-step protection algorithm for detecting and isolating faults in DSs with DGs. The algorithm offers a fast and effective solution for the bi-directional power flow issue, especially in the cases of high fault resistances and high DG penetration. However, the algorithm regarding grid reconfiguration or communication dependability has not been tested.
In [18], a fault protection scheme has been proposed using negative- and positive-sequence components of the voltage signal. However, the scheme has not been tested in the case of an inverter-based DG. In [19], a protection algorithm has been proposed that relies on the harmonic analysis of each voltage phase. The algorithm utilizes the fast Fourier transform (FFT) to achieve lower harmonics and total harmonic distortion (THD). However, the FFT supposes a high computational burden for being implemented in a digital processor. The authors of [20] presented a communication-based algorithm that detects faults in various locations of a DS grid by utilizing a finite-state machine. The harmonics of the grid voltages are analyzed by the algorithm using a multiple second-order generalized integrator structure with a frequency-locked loop (MSOGI-FLL). This algorithm offers fast detection action with a low computational burden. However, security issues have not been avoided as the algorithm is based on communication channels.
Previous research has mainly focused on communication, with no solutions for poor communication. As seen from the aforementioned studies, an integrated protection strategy that can operate for ring and radial DSs with high DG penetration in the case of reconfigurable grids is still needed. The authors’ prior study presents an AI protection approach based on three strategies [21,22]. The first strategy, the centralized algorithm (CE), uses grid-wide communication amongst all PDs. Furthermore, in the second strategy, known as the zone algorithm (ZO), the communication between the PDs in the same line is utilized, while the third protection strategy, called the local algorithm (LO), relies on each PD’s local measurements without relying on communication.
Without any inter-PD contact, the LO is based only on the local data of each PD. This fault isolation and localization method considers diverse fault types, variable load consumption, DG penetration, multiple fault locations, HV/MV transformer configuration, and low and high fault resistance, resulting in more redundant and secure protection. Since no communication is required and the LO is simple to adapt to various grids without the requirement for training, as with AI approaches, it can offer a more reliable, supporting approach that is also a more cost-effective protection strategy than other protection algorithms. In addition, the LO protects if the other two layers of protection are ineffective. It is crucial to emphasize that the factors influencing inverter-based generators, such as short transient durations, low short-circuit currents, and reversible power flow, have been considered. Another factor to consider is the ground connection of the HV/MV transformer, since this will impact the short-circuit current in the network, changing the protection system’s behavior.
This paper investigates various transformer connections obtained from different facilities. The most typical setups are the grounded or isolated transformers. In the case of a grounded transformer, the secondary of the HV/MV transformer is connected to the ground, i.e., YNyn grounded. Furthermore, in the case of an isolated transformer, a zig-zag transformer is used to provide an artificial neutral and isolate the transformer YNd11, which is grounded through zig-zag [8].
The main difference between the proposed algorithms in this context and the authors’ previous publications [22] can be concluded as follows:
- The protection algorithms have been adapted for ring rather than radial grids. In this case, the algorithms depend on the direction of power flow (DPF).
- The study of different HV/MV transformer connections in the case of ring grids.
- The effect of HV/MV transformer connections on the proposed protection algorithms has been studied.
The rest of the paper is organized as follows: The proposed LO protection algorithm is first introduced. Secondly, a discussion of the proposed protection algorithm’s validation analysis is presented. The experimental results are then explained. Finally, the paper’s conclusion is discussed.
2. Three-Level Protection Algorithms
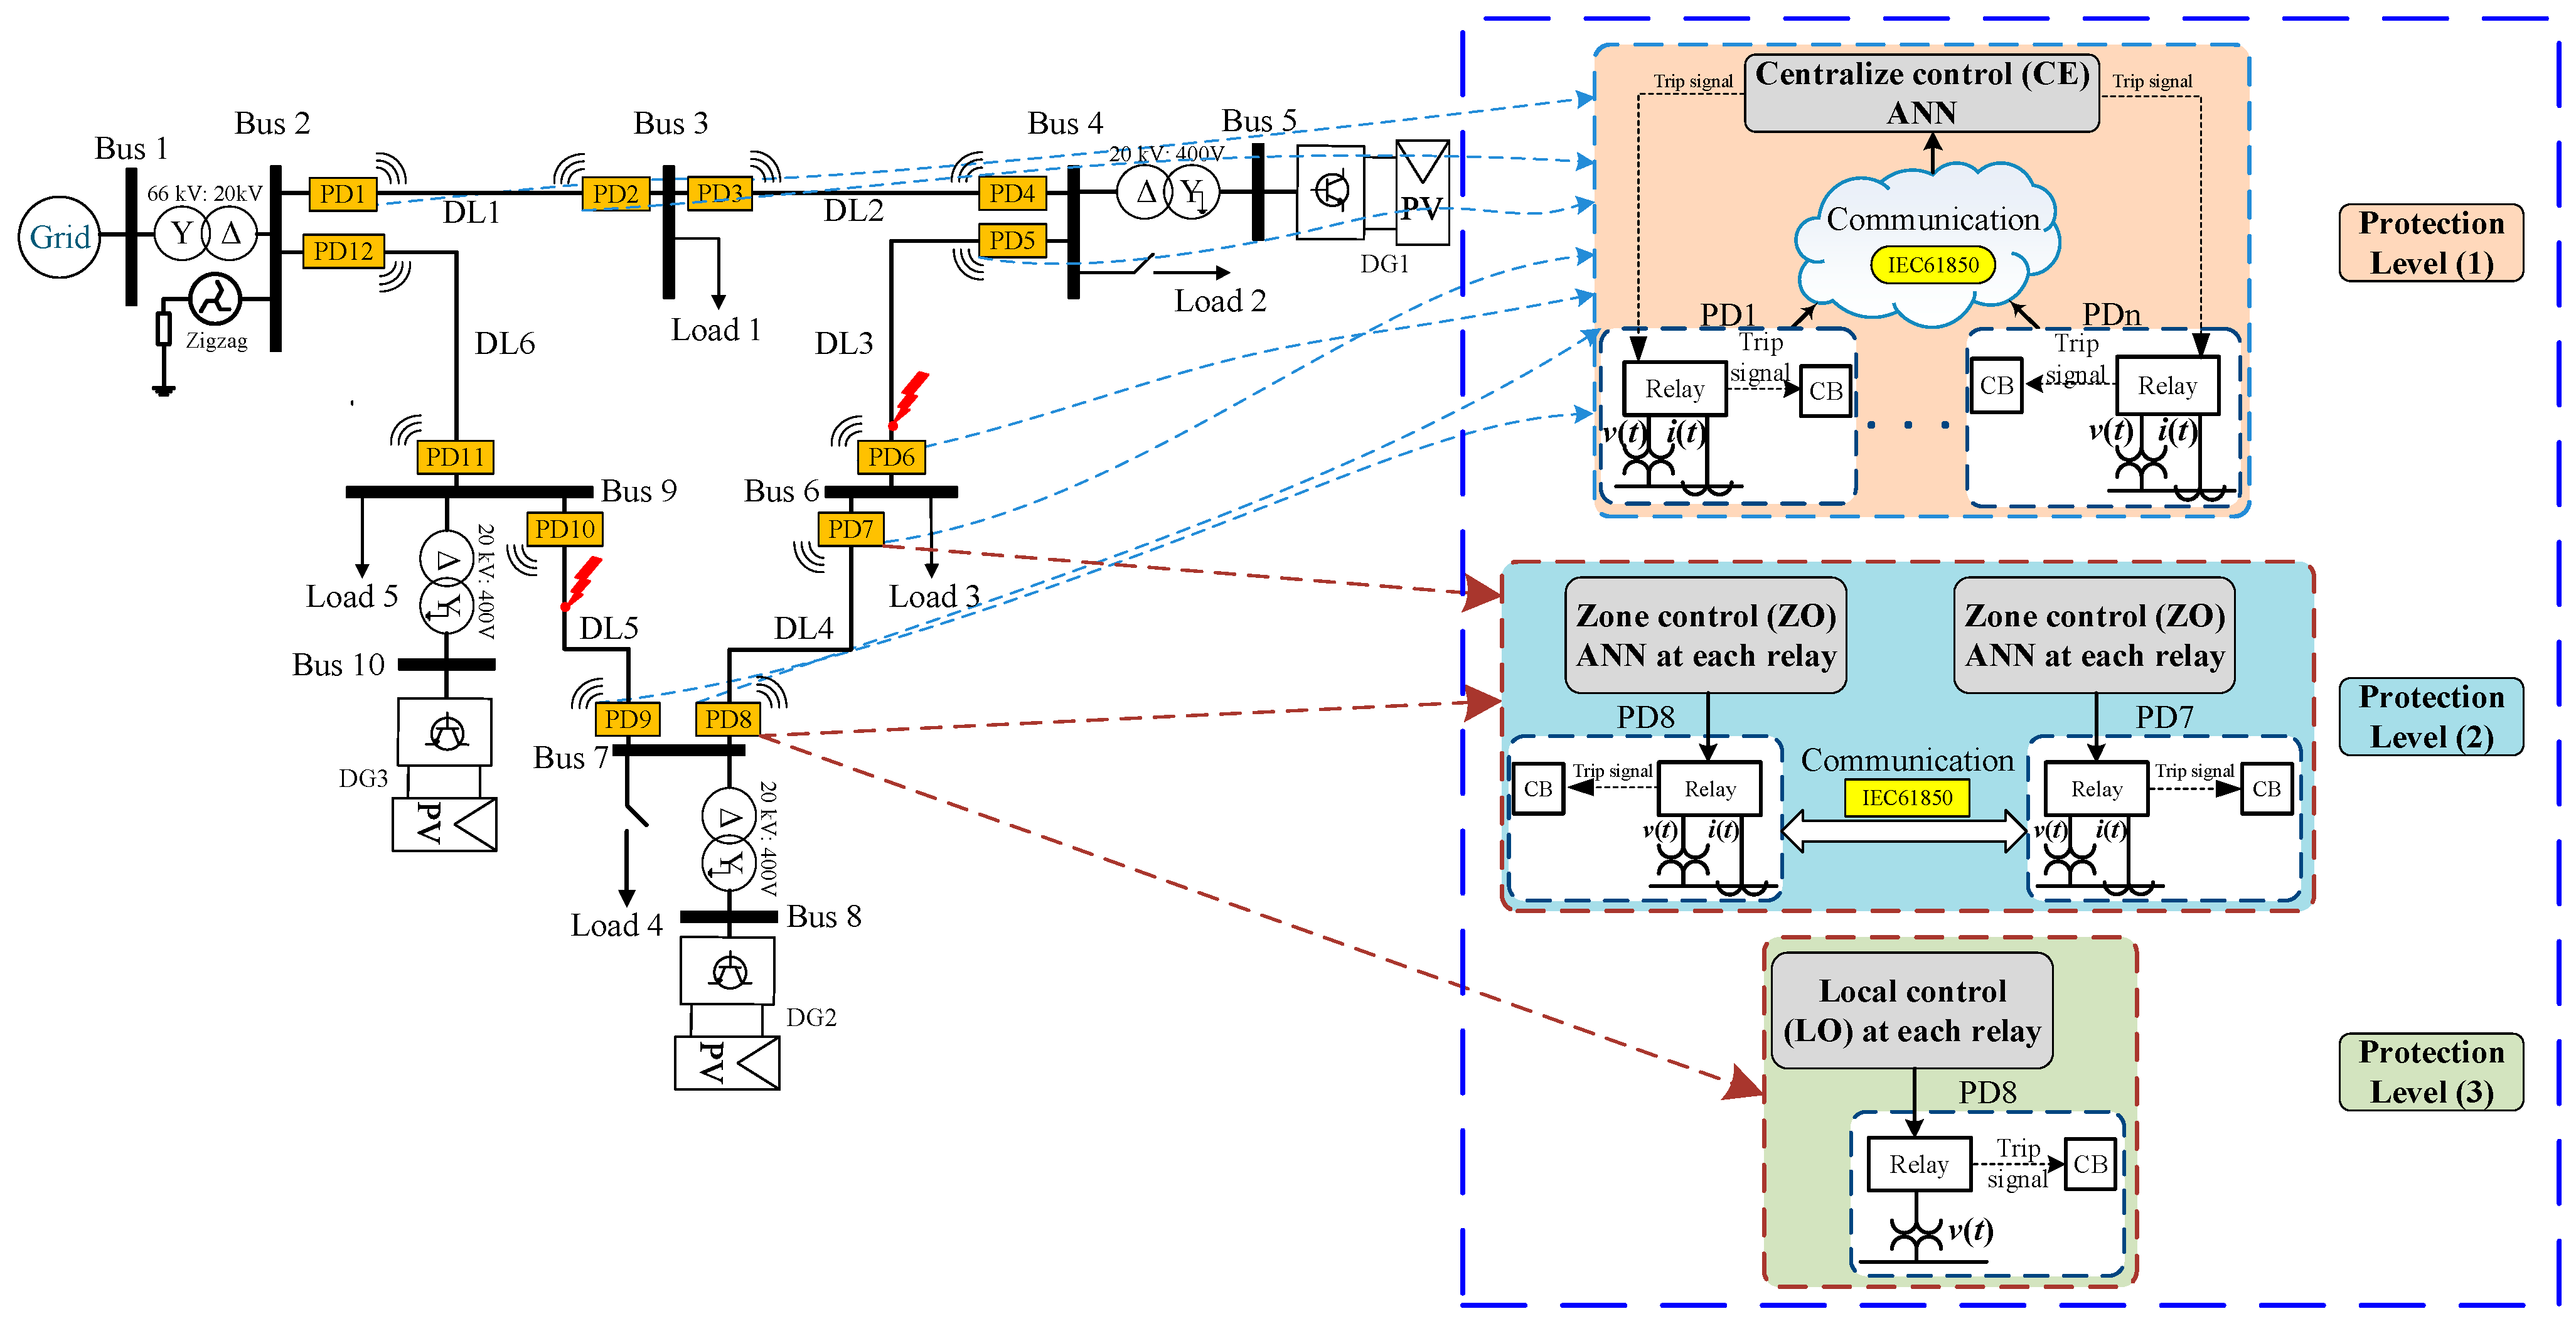
As shown in Figure 1, a protection strategy employing three-level algorithms has been proposed. The initial algorithm is established through the transmission of data analyzed by every PD in the grid to a CE. The second algorithm, on the other hand, is founded upon a ZO that utilizes peer-to-peer communication. The proposed approach relies on a comparison of the decisions made by both algorithms in order to develop a redundant and more dependable system. Moreover, in the event of inadequate communication, a more robust protection system will be implemented through the utilization of the third algorithm, the LO. The grid fault will be isolated through the algorithm’s analysis of the local voltage and the current data of each PD. Each algorithm was evaluated for stiff and weak grids in a variety of scenarios involving fault types, fault locations, fault resistance, the quantity and location of DGs, their contribution, load consumption, and diverse neutral connections for the MV side of the HV/MV transformer.
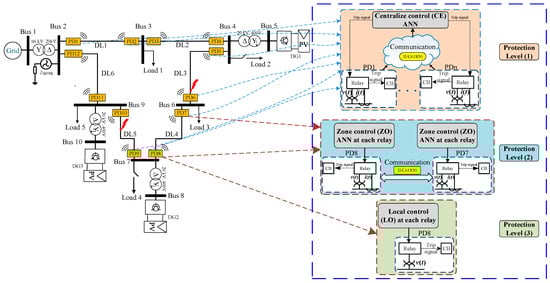
Figure 1.
Single line diagram of the analyzed ring DS with DG penetration and the three-level protection algorithms (CE, ZO and LO).
2.1. Level 1: Centralize Algorithm (CE)
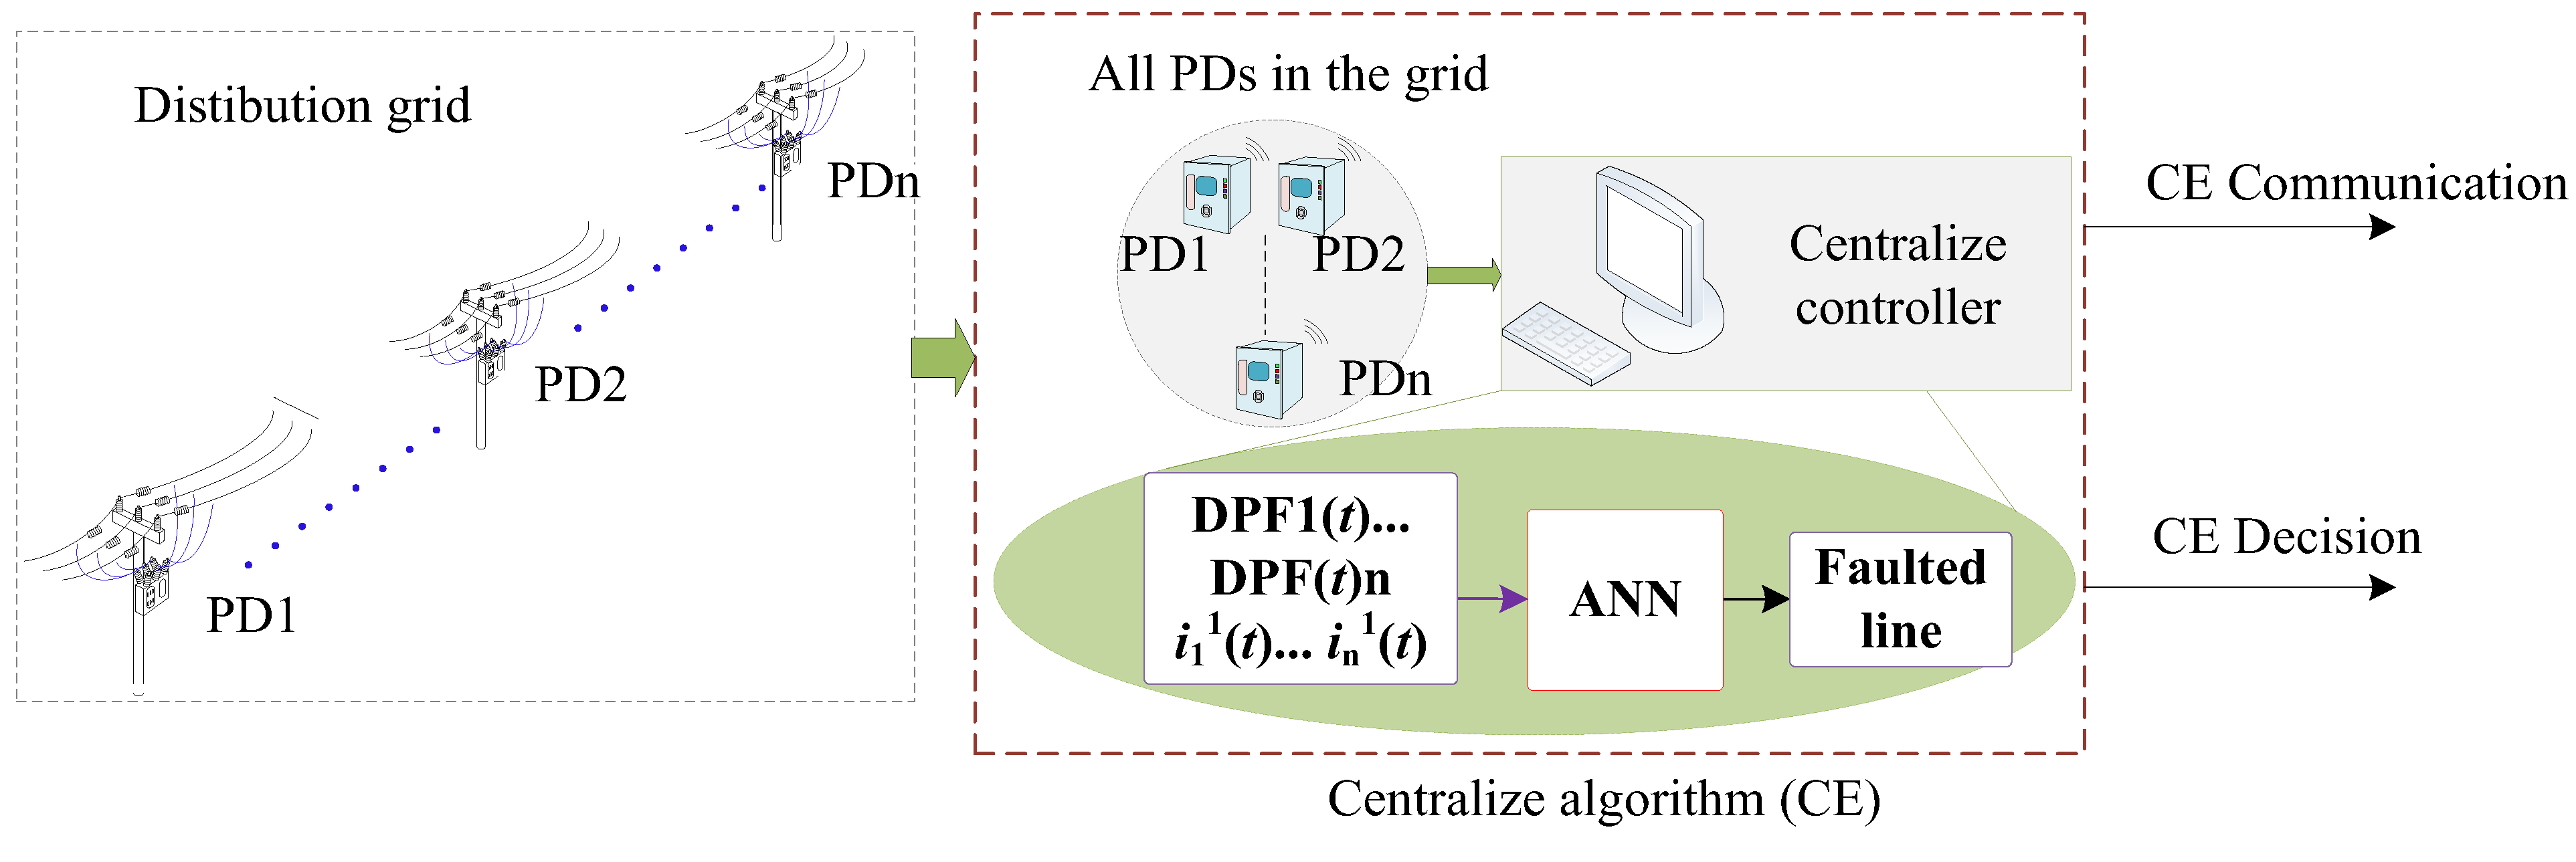
In this algorithm, every connection between the PDs and the CE is deemed to be accessible, as inputs to the CE, DPF data for the ring grid and positive-sequence current (i+) data for the radial grid are utilized in order to determine the correct course of action. This is feasible due to the short length of the lines and the insufficiency of the transversal capacitance to generate a significant current difference at both ends. The conceptual diagram of the CE controller is illustrated in Figure 2. Training for the ANN must incorporate variations in the short-circuit current and DPF of each PD. Using voltage and current, the DPF and i+ are computed locally at each PD; only the processed data are transmitted to the controller.
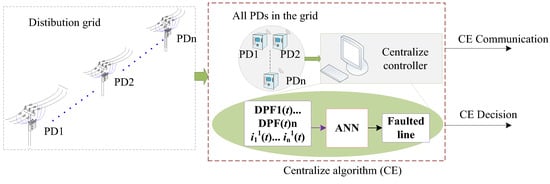
Figure 2.
Concept diagram of the CE algorithm.
By obviating the necessity to convey voltages and currents to the CE, thereby streamlining the communication process, this measure will enhance the accessibility of the learning experience and reduce the percentage of errors. The authors have previously documented the training and testing of an ANN in their publications [21,23].
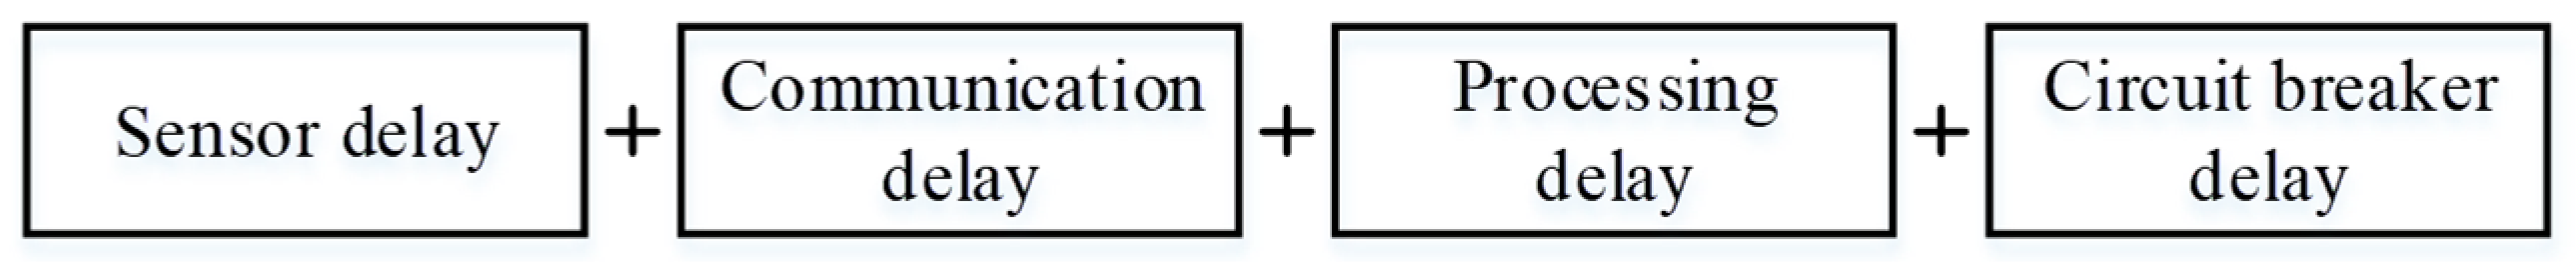
The main advantage of this system is that it performs state estimation and security evaluations while centralizing the whole system’s security into a single device [24]. On the other hand, problems with communications or the CE system caused by failure or safety concerns will result in a complete loss of protection until services are restored [25]. Additionally, communication delays must be considered. The overall communication delay comprises elements, as indicated in Figure 3, including transmission, queuing, propagation, and processing delays. The overall communication latency will be so minimal that the trip signals may be sent in less than one millisecond [26].
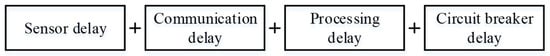
Figure 3.
Delay components of the total fault clearing time.
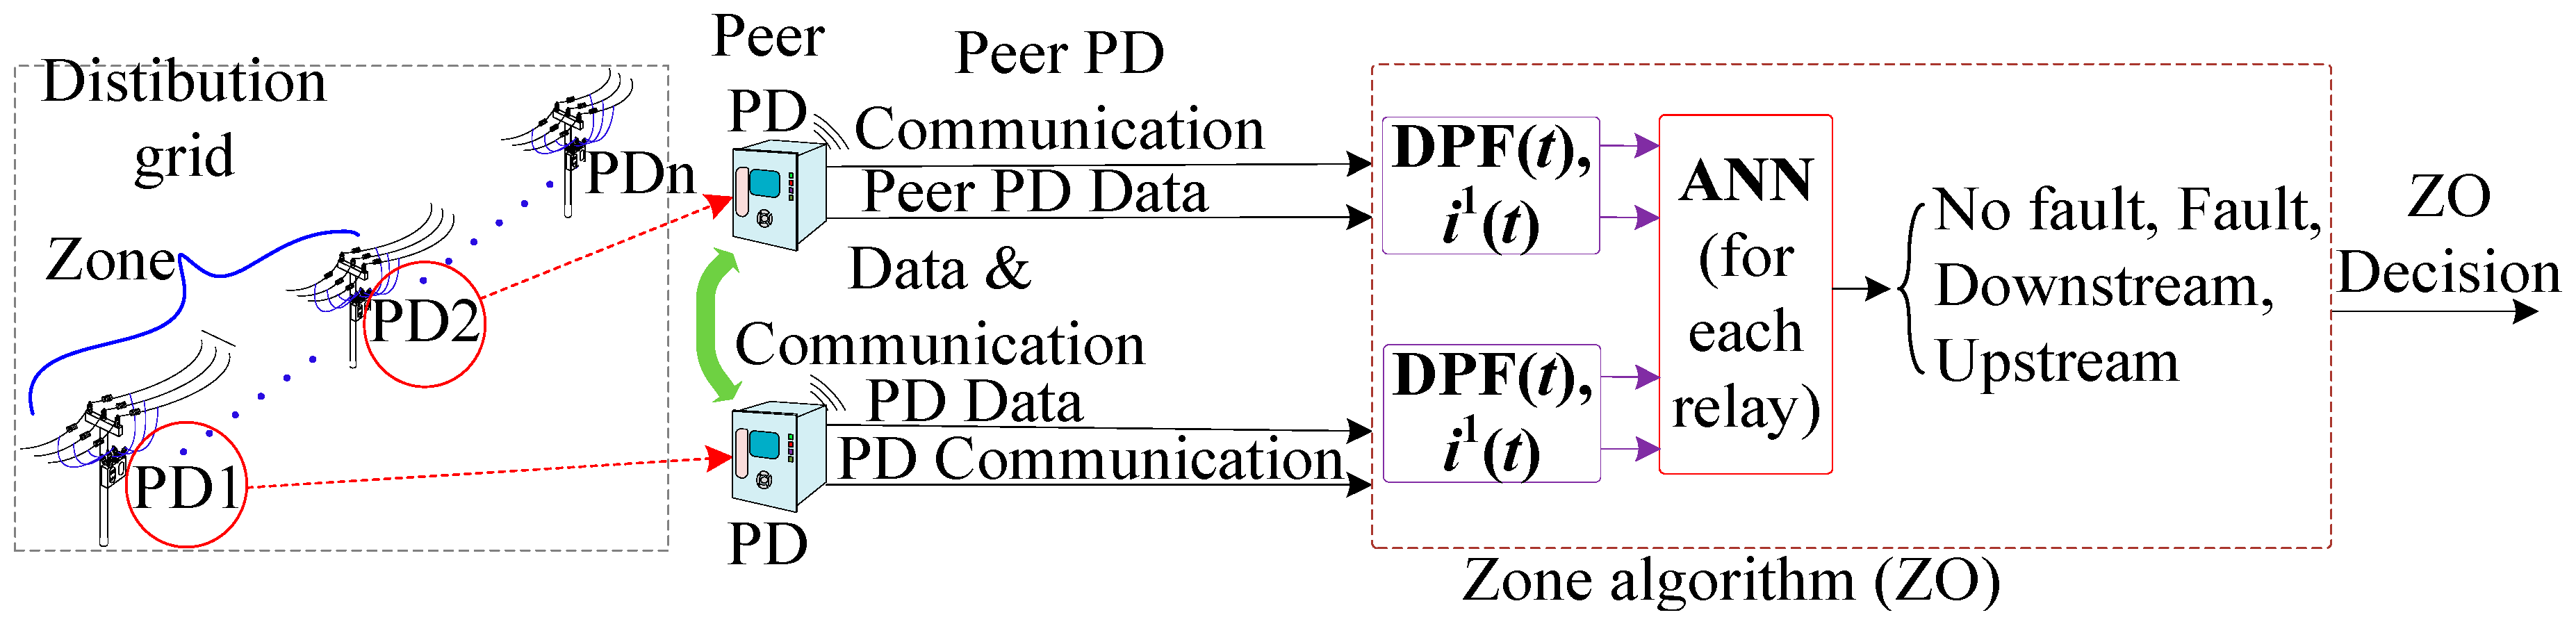
2.2. Level 2: Zone Algorithm (ZO)
This algorithm is found at each PD and relies on communicating between the two PDs in the same line to exchange DPF data to change each PD’s status under the defective area of the grid, as shown in Figure 4. The implementation of the ZO operates concurrently with the CE. Then, the decisions of both controllers are reviewed to increase the redundancy and security of the protection system. Encrypted communication and the ability to accommodate temporary grid reconfigurations are among its benefits. The trained fault ZO ANN controller parameters are detailed in the authors’ prior works [21,23].
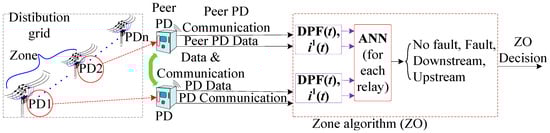
Figure 4.
Conceptualization of the ZO algorithm.
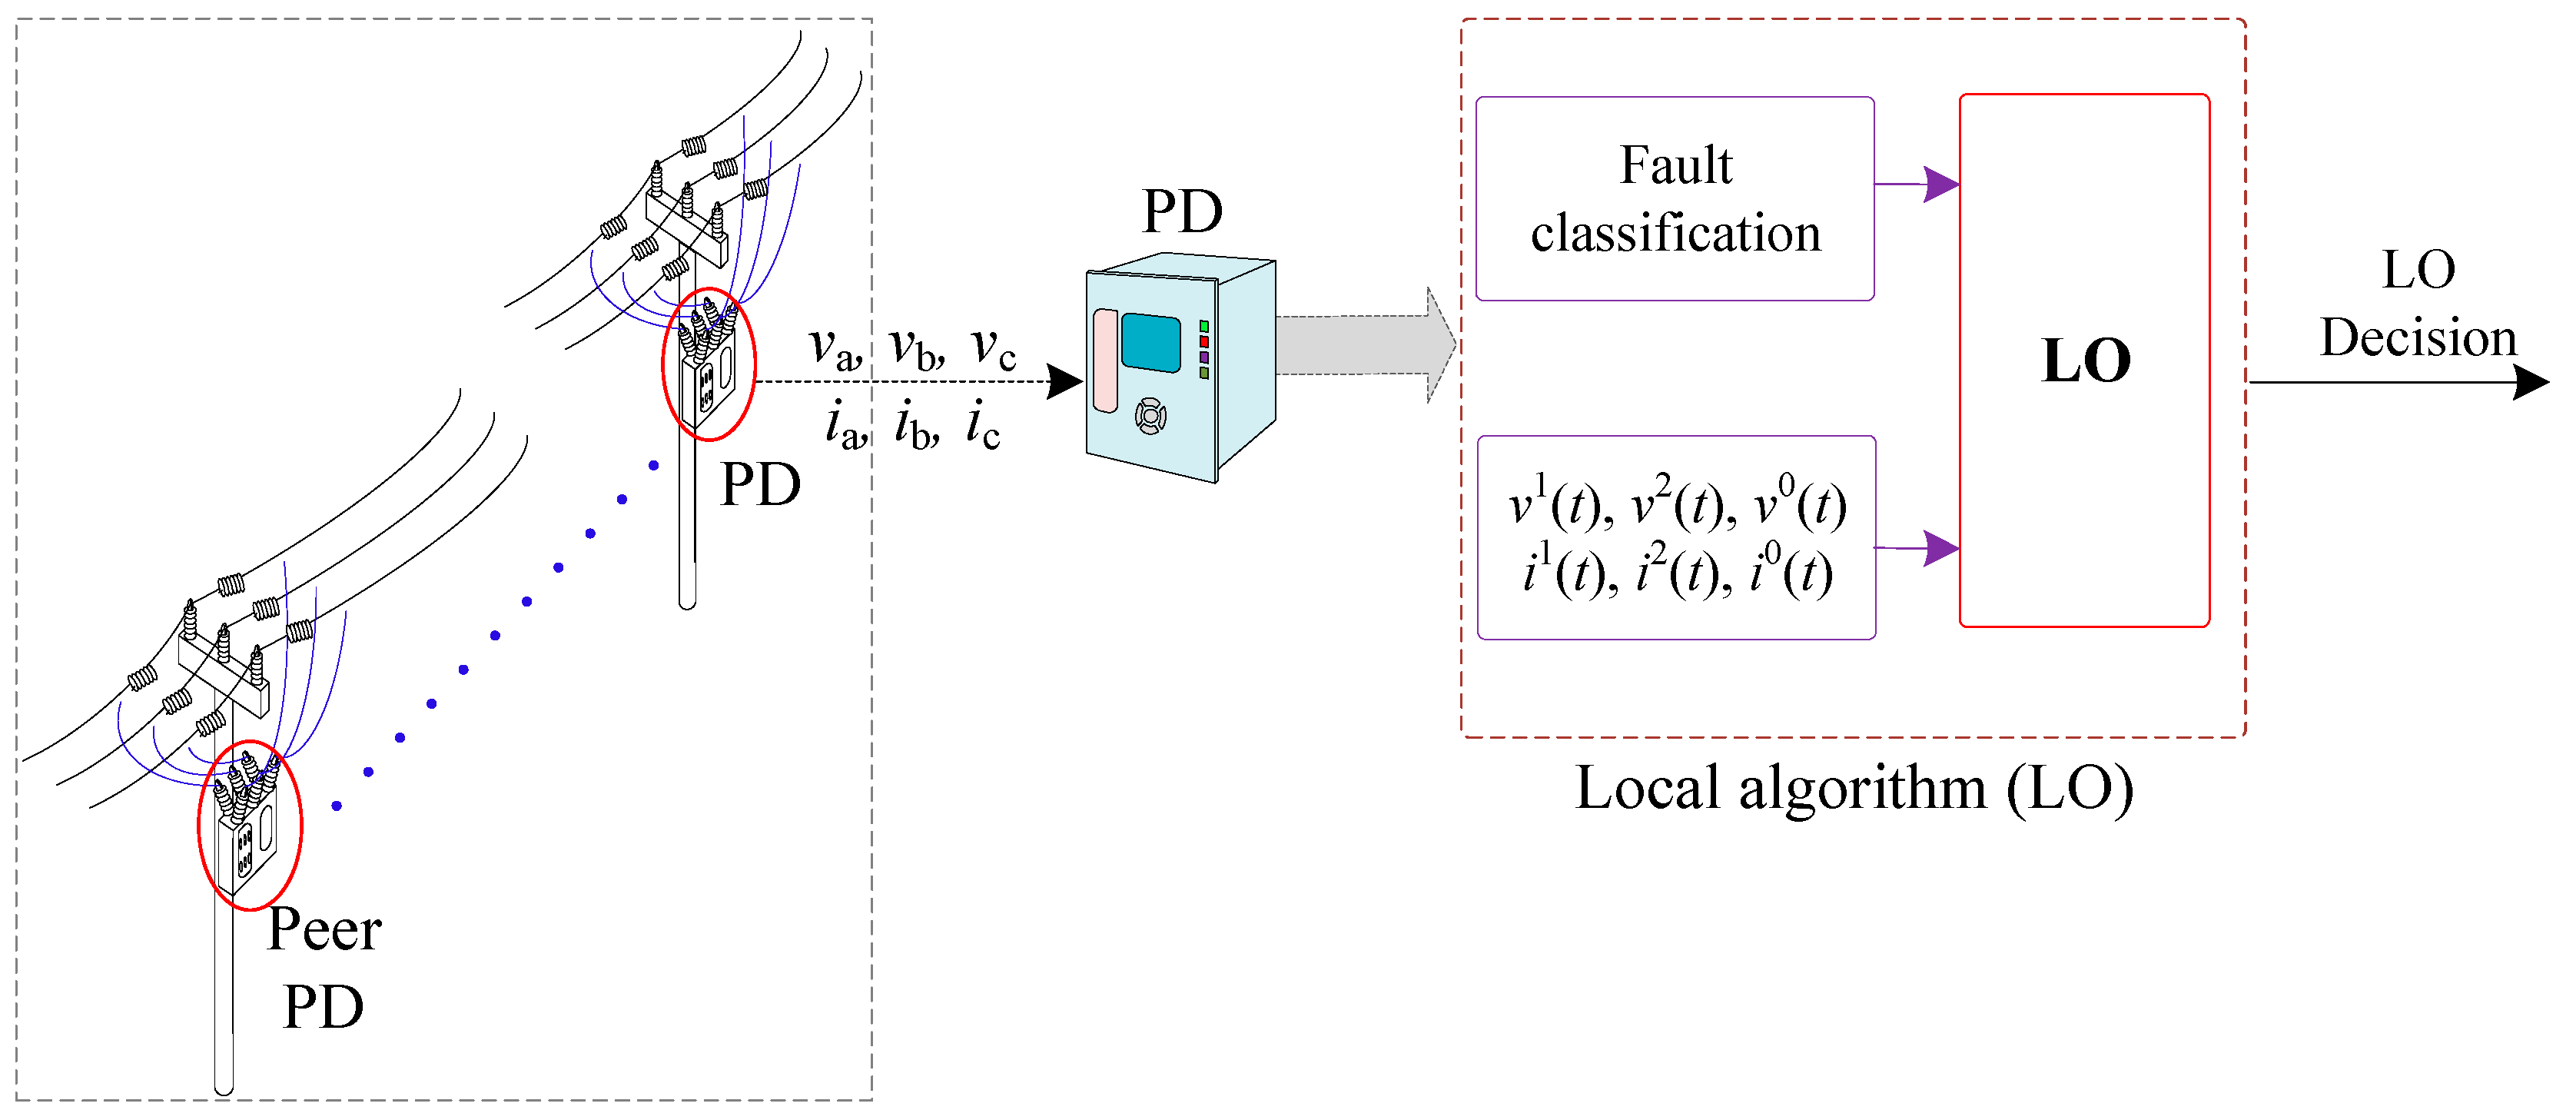
2.3. Level 3: Local Algorithm (LO)
This approach does not require a complete connection between the PDs, so the protective mechanism can continue functioning even if communication is lost. As shown in Figure 5, using just the local knowledge of the PD, each PD should be able to determine if the fault is on the protected line or another line. The concept is based on utilizing each PD’s voltage and current sequence components during fault events. Figure 6 displays a ring DS’s single-line diagram with DG penetration and an LO algorithm. An algorithm for fault localization that is specific to each type of fault has been implemented. The sequence components will differ depending on whether the fault is symmetrical or asymmetrical, highlighting the importance of employing a fault classification method to determine the fault type prior to implementing the suggested LO algorithm. An ANN is selected as the instrument utilized by the LO to determine the fault type. The training and evaluation of ANNs are detailed in a prior publication by the authors [22].
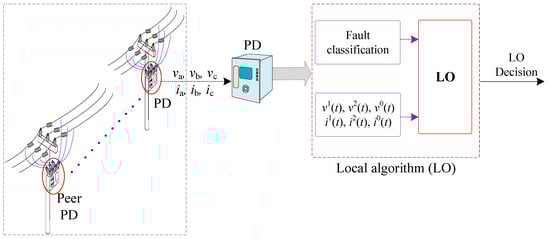
Figure 5.
Concept diagram of LO algorithm.
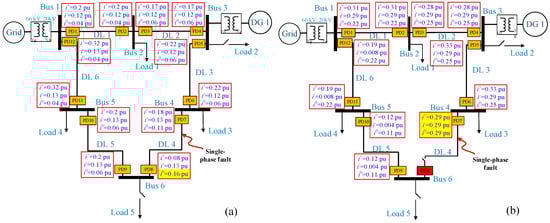
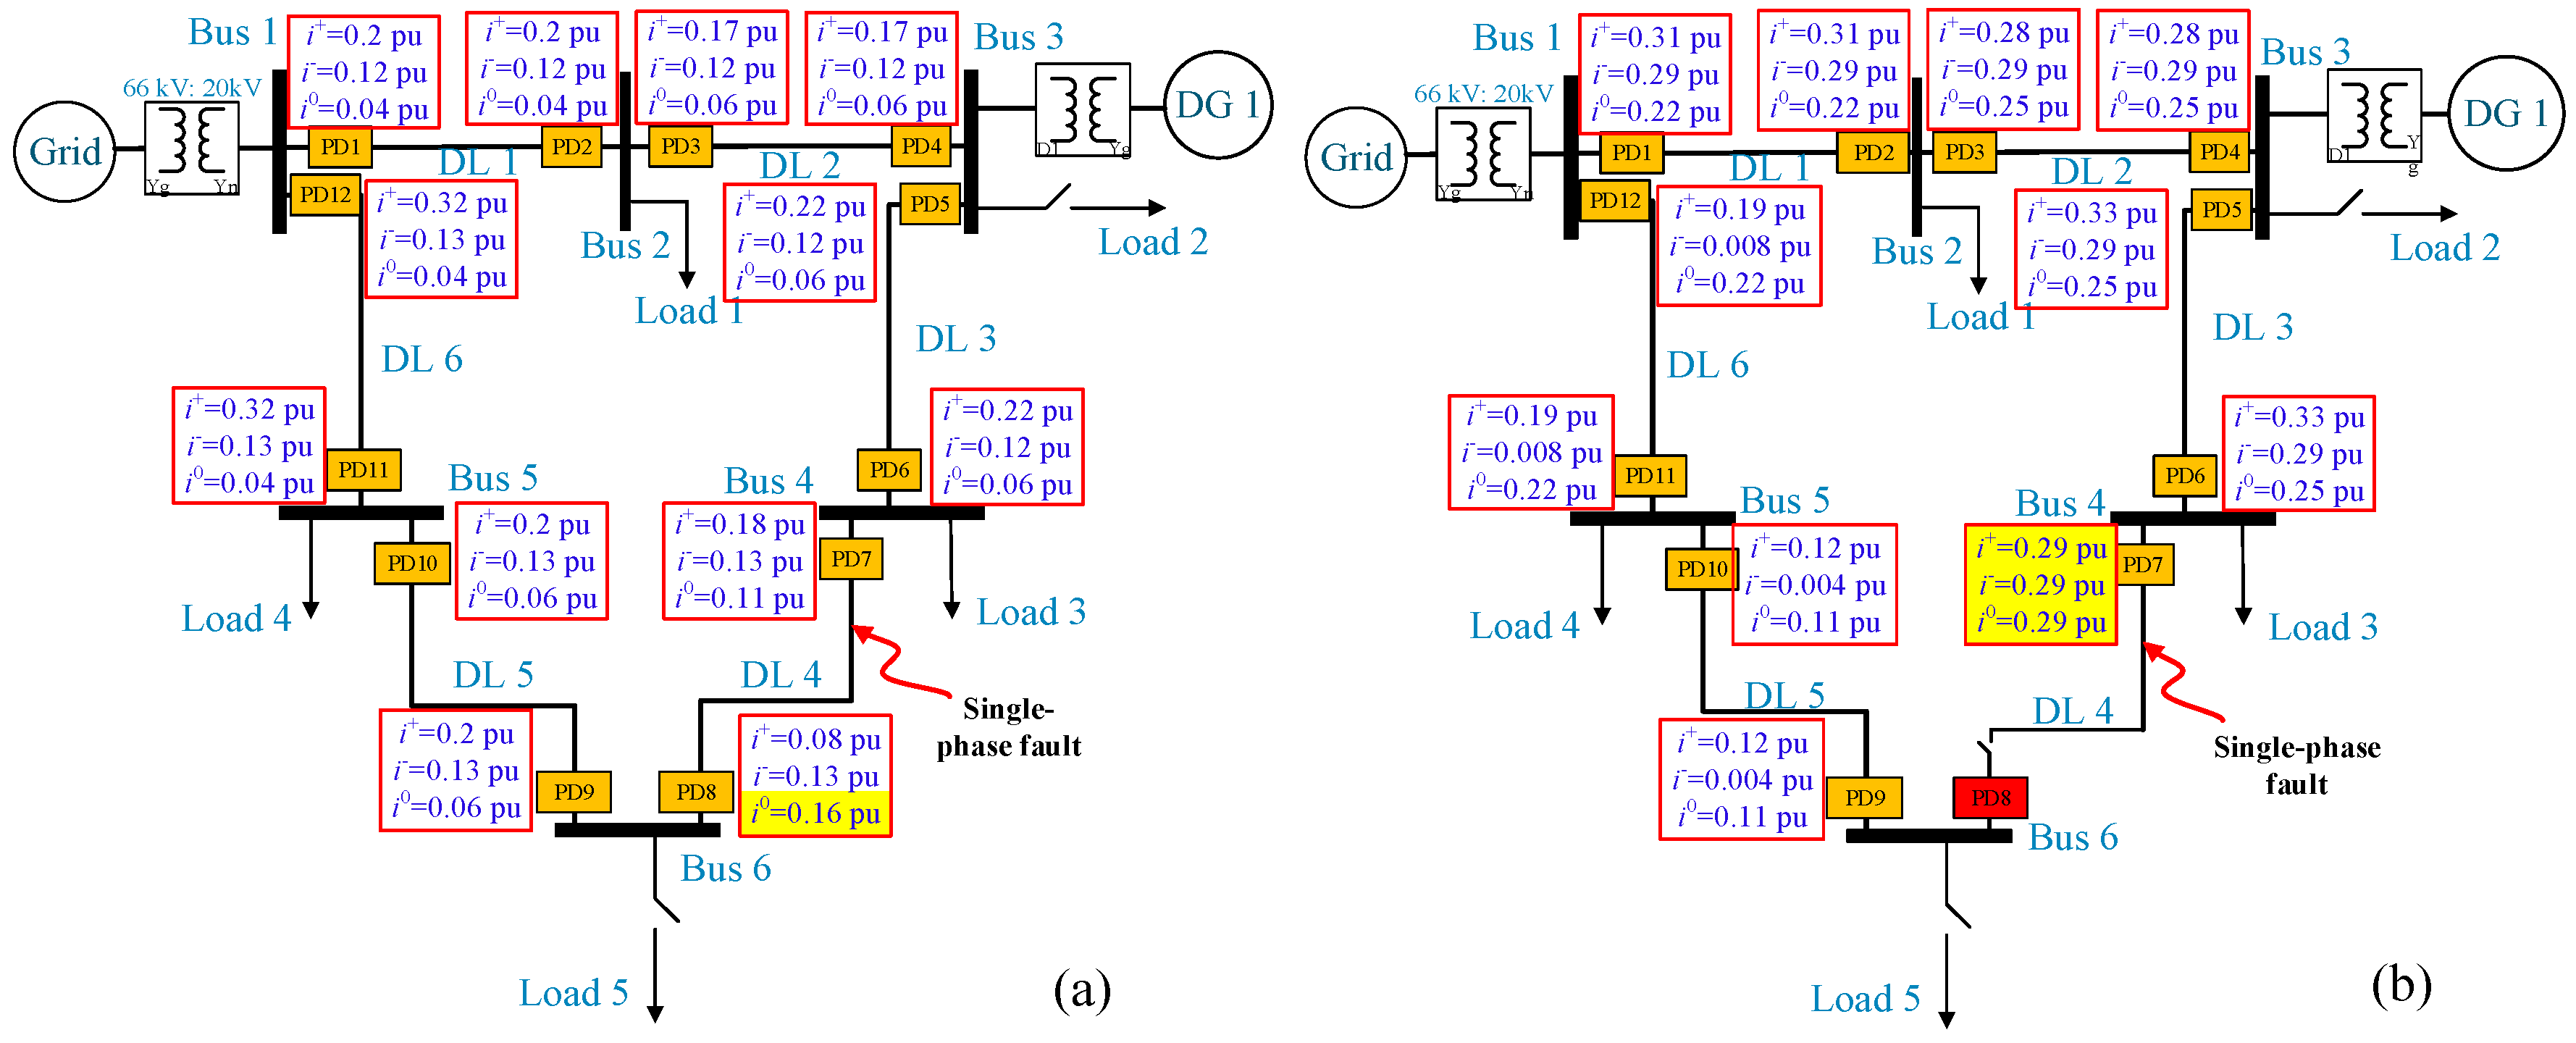
Figure 6.
Sequence current components during a single-phase to ground fault at DL4 (a) the first disconnection, (b) the second disconnection.
In order to present the differences between the three protection strategies (CE, ZO, and LO), the main advantages and disadvantages of each algorithm are shown in Table 3.
Table 3.
Comparison between CE, ZO, and LO protection algorithms.
3. Proposed Protection Algorithms Modifications
This research has chosen the most common transformer connections: YNyn grounded, not isolated in normal operation, and YNd11 grounded through zig-zag, isolated in regular operation.
A comprehensive explanation of the LO protection algorithm will be provided in the subsequent subsections, encompassing two scenarios and every fault type. The MV side of the HV/MV transformer not being isolated will constitute the first scenario. The magnitude of the short-circuit current in the analyzed grid will be altered by this connection, which isolates the second scenario. In addition, the PD priority strategy will be discussed.
3.1. YNyn Grounded HV/MV Transformer
The faulty line can be identified by analyzing the zero-sequence current during the fault in the case of a single-phase fault with unisolated ground. During the fault, the zero-sequence current at the faulty line’s one end will be higher than any zero-sequence value on any other line. Consequently, a higher number indicates a quicker disengagement, as seen in Figure 6.
Examining the grid after disconnecting the PD with the highest zero-sequence current is the subsequent procedure. Upon disconnecting one end of the defective line, the three sequence currents at the other end will acquire an approximation of the identical value, as illustrated in Figure 6b. Thus, the faulty line in a single-phase fault can be isolated using these data.
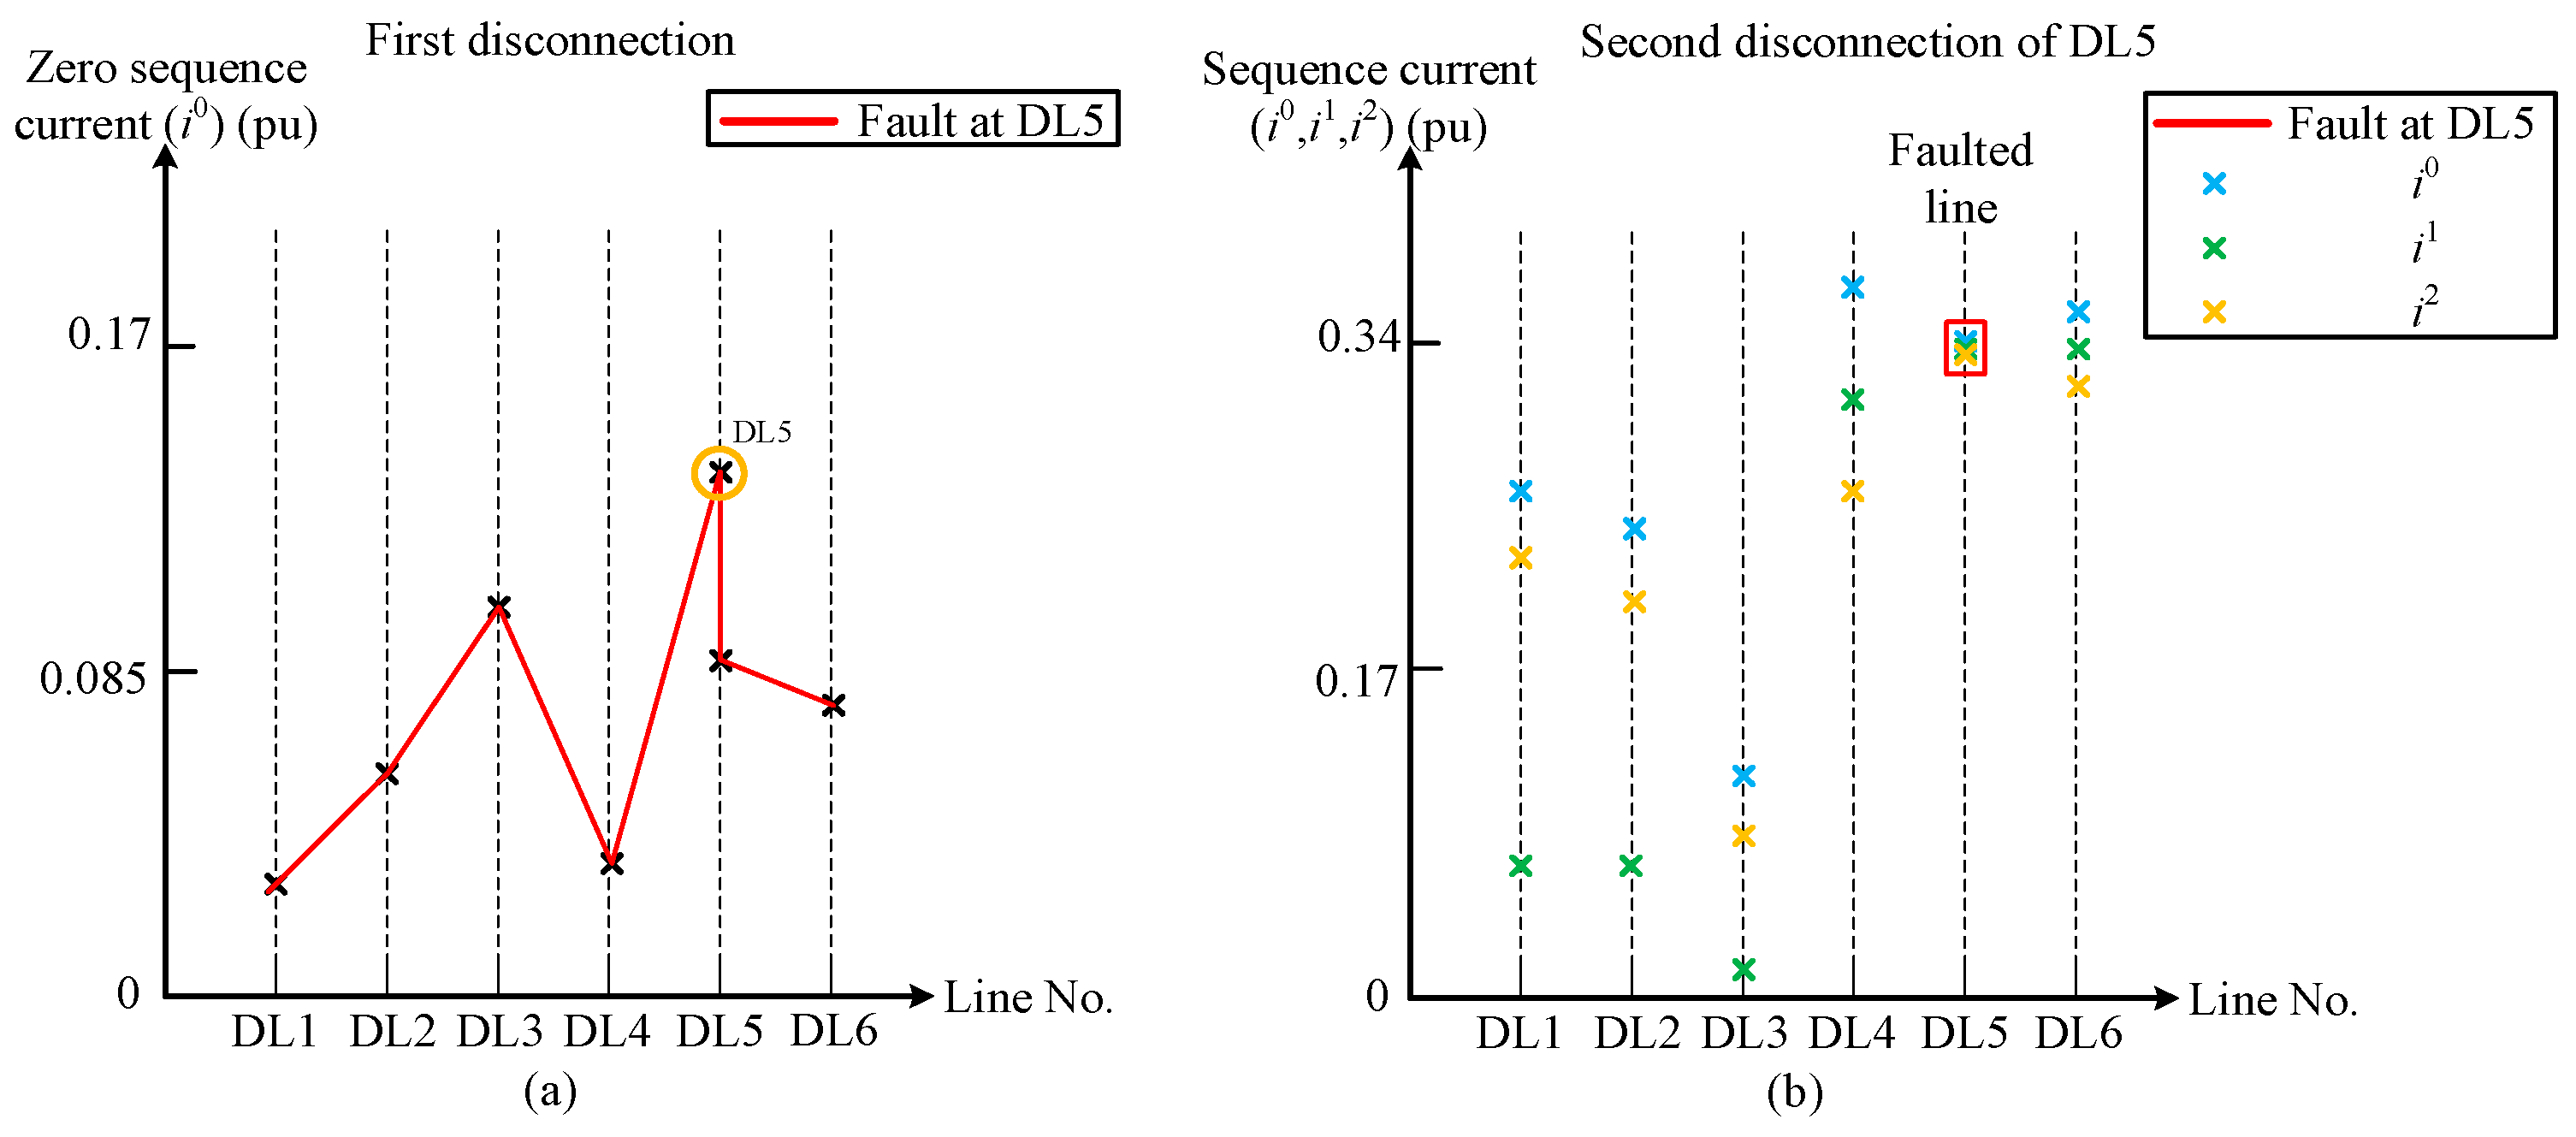
The zero-sequence current profile for a single-phase to ground fault at DL5 is illustrated in Figure 7. As shown in Figure 7, the trip is determined by the maximum zero-sequence current during the initial disconnection (a). As shown in Figure 7, the trip for the second disconnection is determined by three sequence currents at the opposite end of the faulted line that have values that are approximately equivalent (b).

Figure 7.
Zero-sequence current profile with one DG connected at bus 3; (a) the first disconnection, (b) second disconnection when a single-phase fault at DL5.
When confronted with two-phase or two-phase to-ground faults, the initial disconnection can be executed using the identical methodology employed for single-phase faults. The zero-sequence current at one end of the faulted line during the fault can be utilized to locate the fault. Following the initial disconnection, a subsequent analysis of the grid is conducted. For the second disconnection, the maximum value of zero-sequence current at the opposite end of the faulty line will be acquired.
The current profile of the zero-sequence for the two-phase to-ground fault at DL2 and the two-phase fault at DL4 is illustrated in Figure 8. If the fault is located at DL4, this line has the greatest i0 (0.106 pu). When the highest i0 (0.145 pu) is observed at the opposite end of DL4 following the initial disconnection, both ends of the faulty line can be severed. Using the same principle, if the fault at DL2 causes the highest i0 value (0.101 pu) to be at one end of DL2, then i0 will be at its highest value (0.103 pu) at the other end of DL2 following the initial disconnection; therefore, the faulted line will be disconnected.
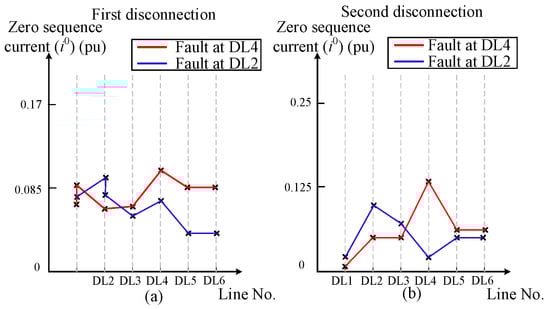
Figure 8.
Zero-sequence current profile during two-phase fault at DL4 and two-phase to ground fault at DL2, with one DG connected at bus 3; (a) the first disconnection, (b) second disconnection.
The designed curve for unsymmetrical faults utilizing a zero-sequence current is depicted in Figure 9. In order to design the curve, the zero-sequence current values for various grid configurations and scenarios were considered. This curve is adaptable to voltage levels and alternative grid configurations.
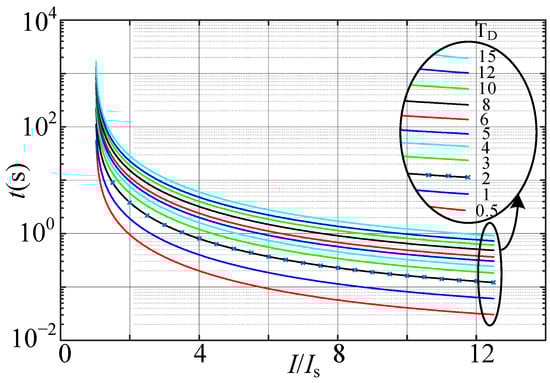
Figure 9.
Inverse time–current characteristic curve for unsymmetrical faults.
The under-voltage relay will be utilized to cut off one end of the faulty line in the case of a three-phase fault. After the initial disconnection, the opposite end of the faulty line will be disconnected using the same under-voltage criterion. Two ends of lines can achieve the same voltage by employing the under-voltage relay, which implies two PDs might disconnect simultaneously. So, a new method called the recloser algorithm will disconnect the PD at the faulty line.
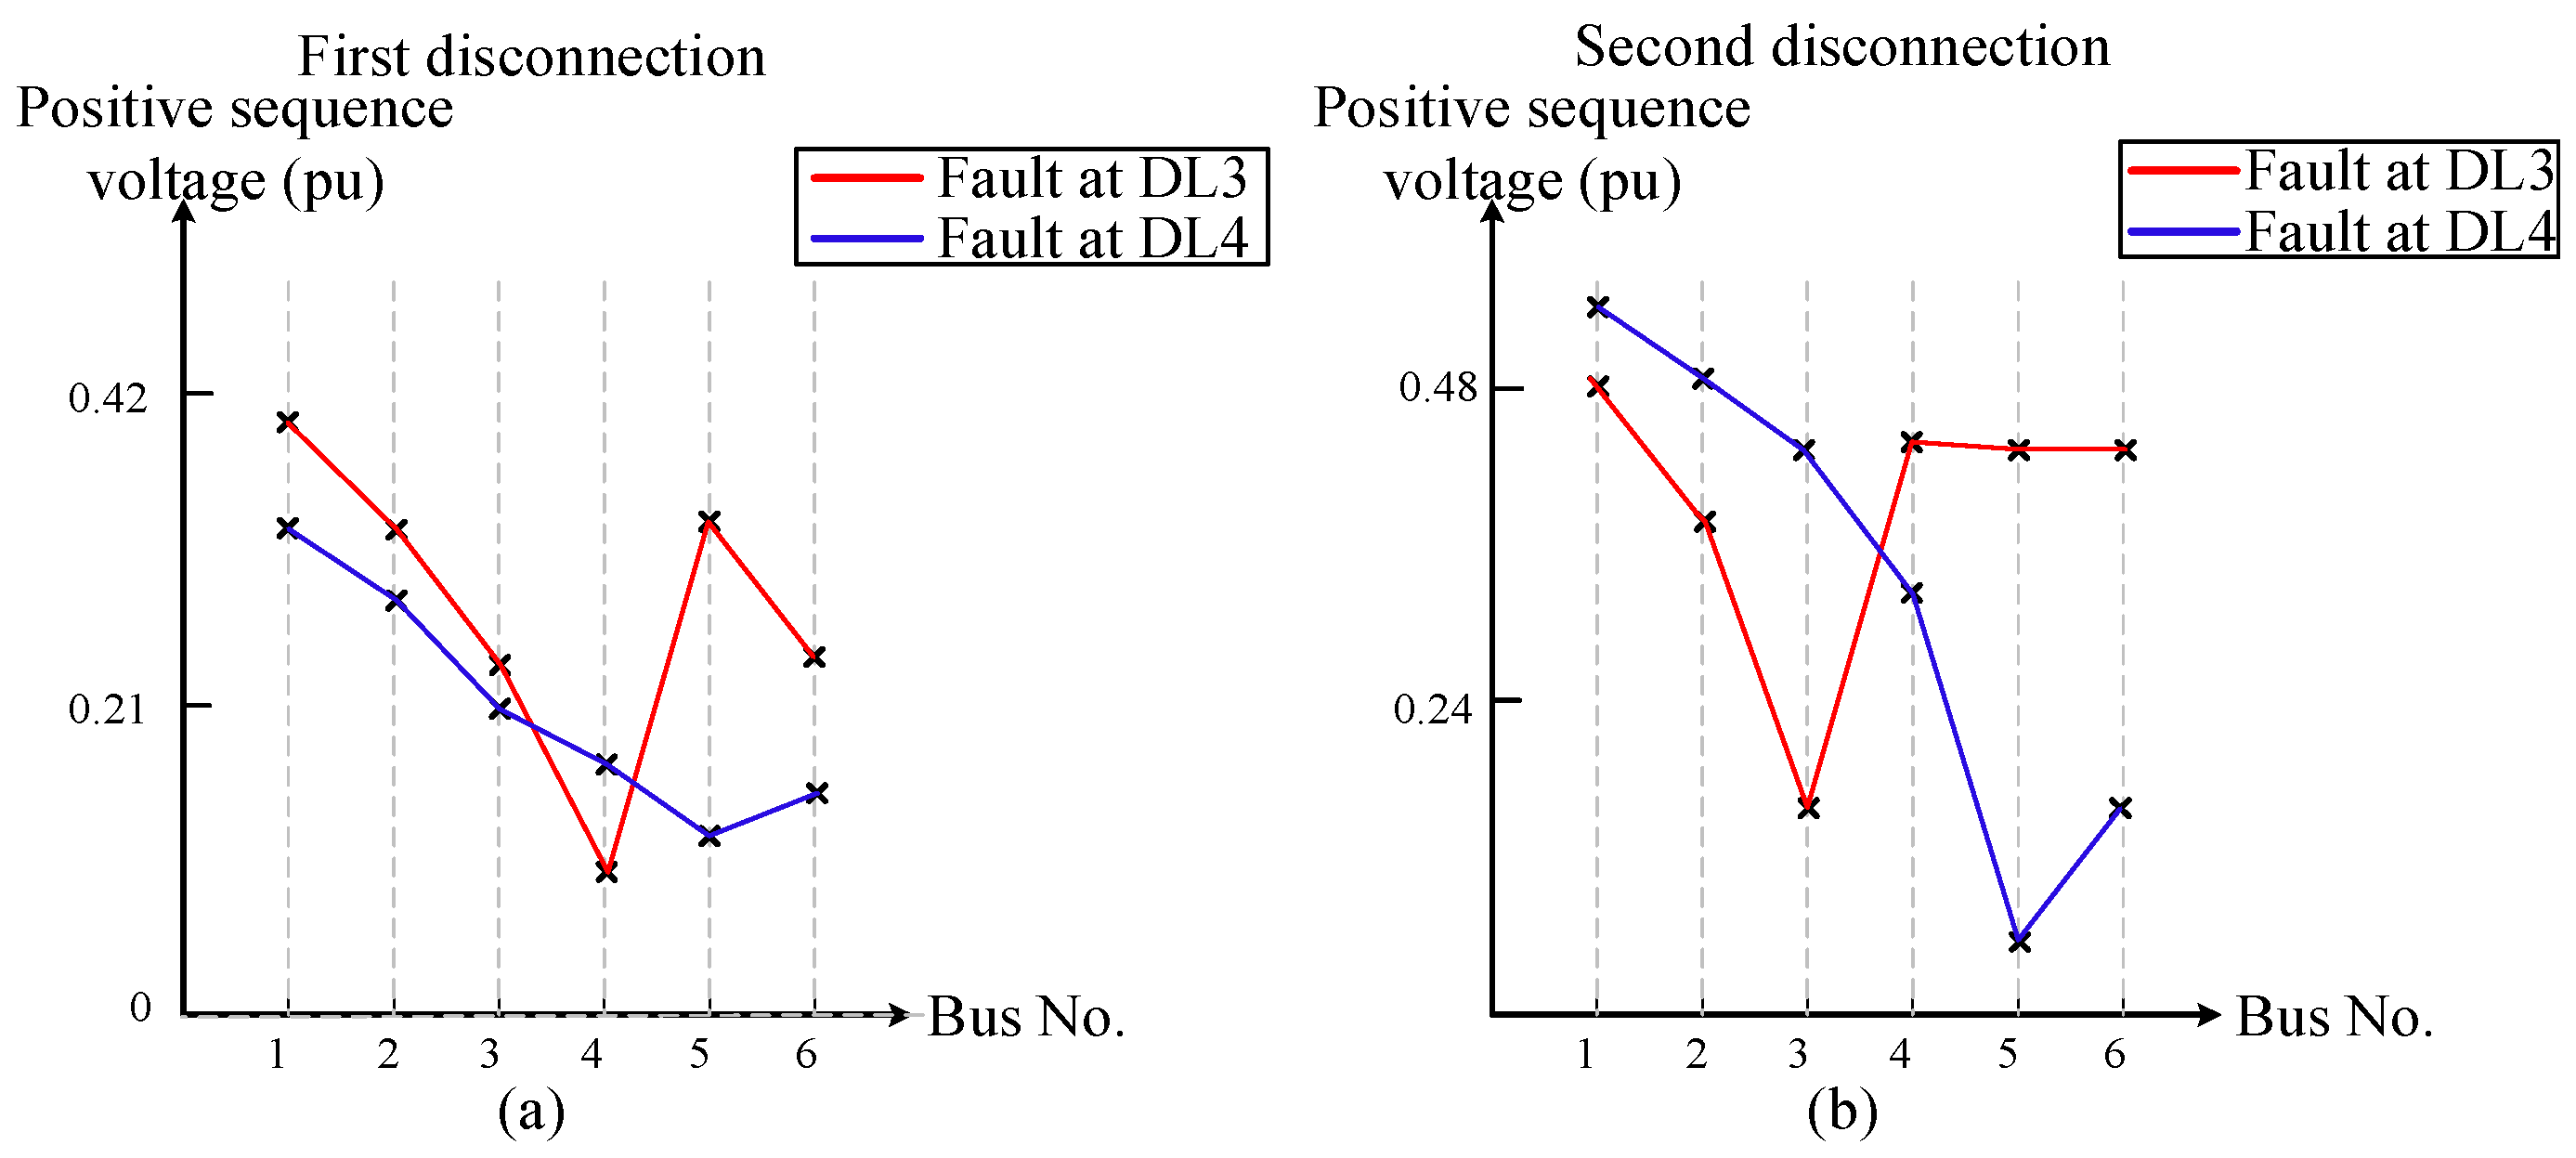
Explaining the LO algorithm for grounding the transformer with the zig-zag transformer connected to the MV side, the subsequent subsection will provide further clarification on the design of the definite time curve. The algorithm’s fundamental idea is to open and close using the recloser after a specific delay. The following subsection will cover the recloser algorithm’s precise concept. Figure 10 illustrates the voltage profile when a three-phase fault occurs. It has been demonstrated that, in the event of a three-phase fault at DL3, the minimum positive-sequence voltage (v+) is observed at one terminal of DL3, specifically bus 4. Subsequent to the disconnection of the faulty line at bus 3, identical behavior is observed. As seen in Figure 10, similar behavior is noticed when the fault is located at DL4.
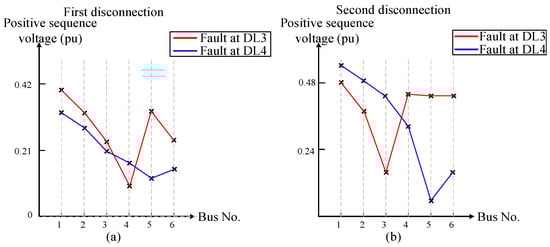
Figure 10.
Positive-sequence voltage profile during three-phase fault with one DG connected at bus 3; (a) the first disconnection, (b) the second disconnection.
3.1.1. Recloser Algorithm
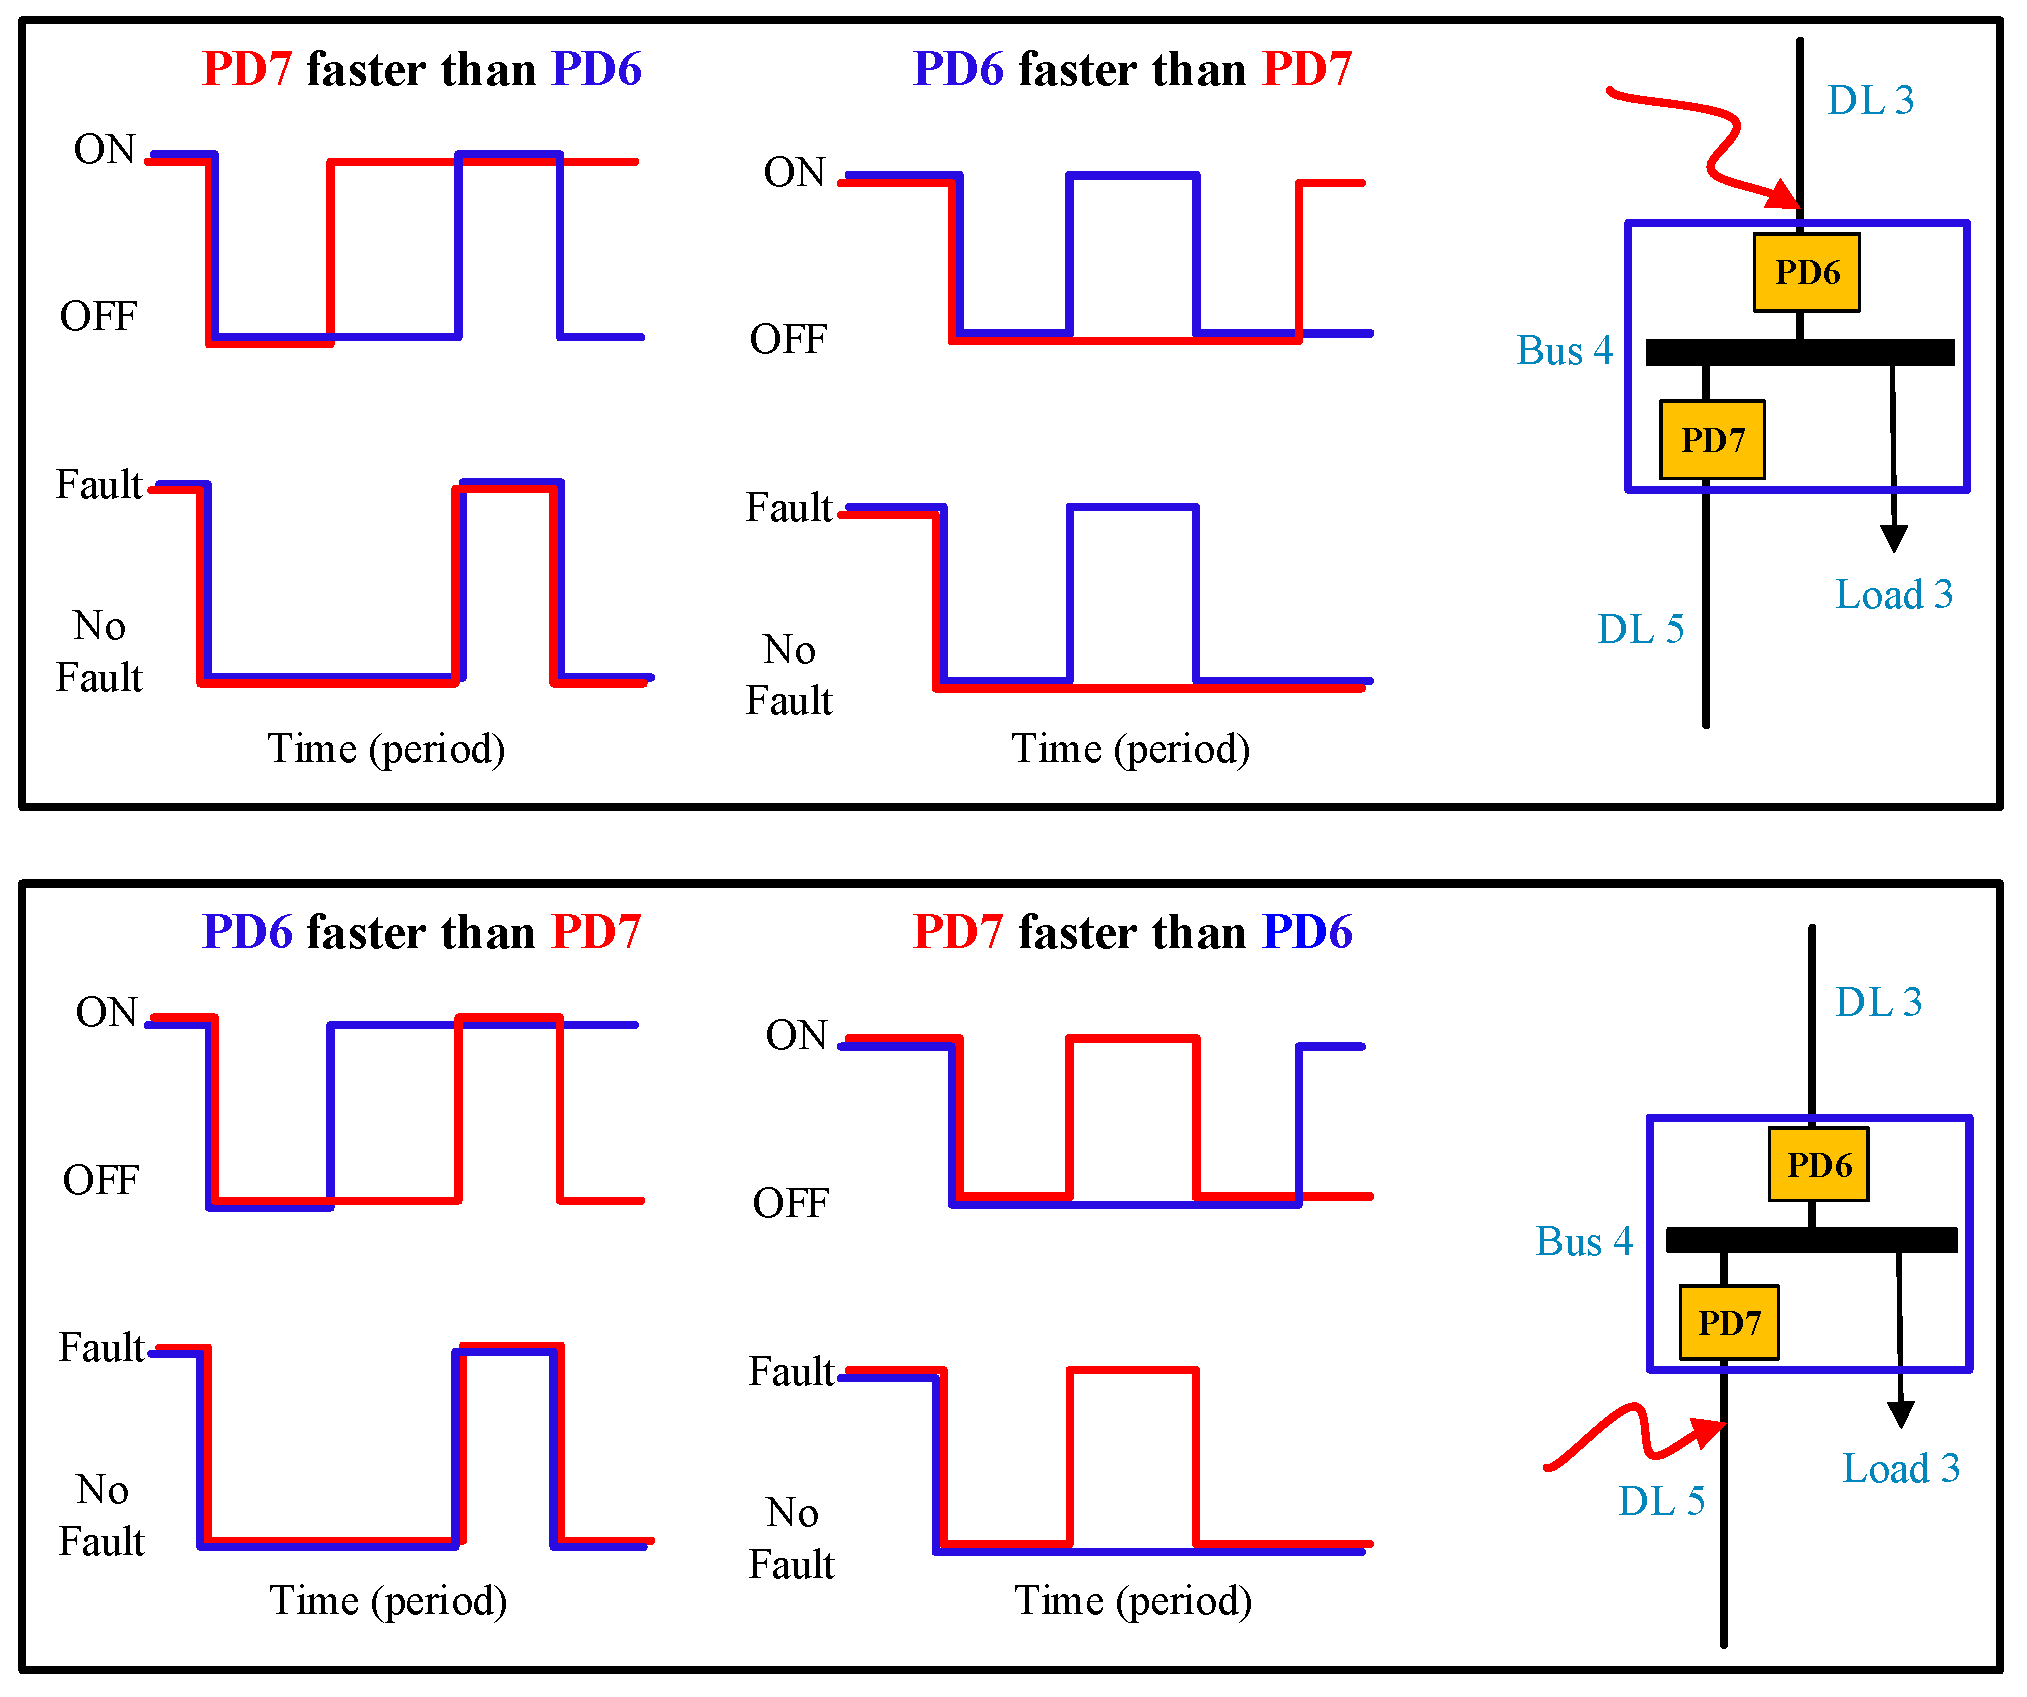
Two signals are utilized in Figure 11. The first is used to switch on and off the PD, while the second is used to indicate whether the PD has detected a fault. As shown in Figure 1, if there is a fault at the end of line 3 (DL3), PD6 and PD7 should disconnect simultaneously since they have the same under-voltage. If PD6 is a bit quicker than PD7, then they should both disconnect. Nevertheless, PD6 will reconnect after a predetermined interval. As shown in Figure 11, PD6 will permanently disconnect, and PD7 will connect after a longer specified time if there is a fault.
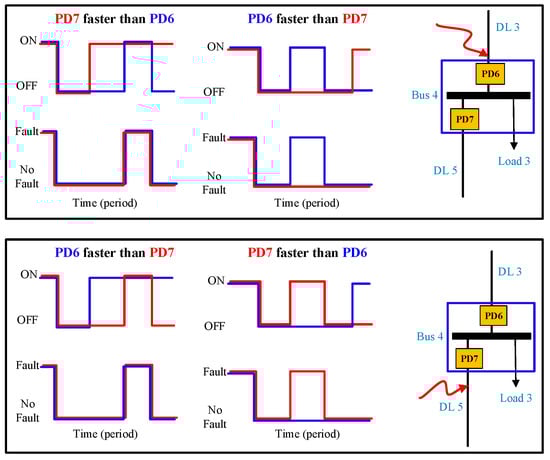
Figure 11.
Explanation of the recloser algorithm when the error occurs in multiple lines.
On the other hand, if PD7 is quicker than PD6, they both disconnect at first because of under-voltage. Since PD6 is still disconnected, PD7 will not detect errors and will connect first. As a result, PD7 will stay connected. After a delay, PD6 will reconnect and detect the fault, causing PD6 to disconnect again.
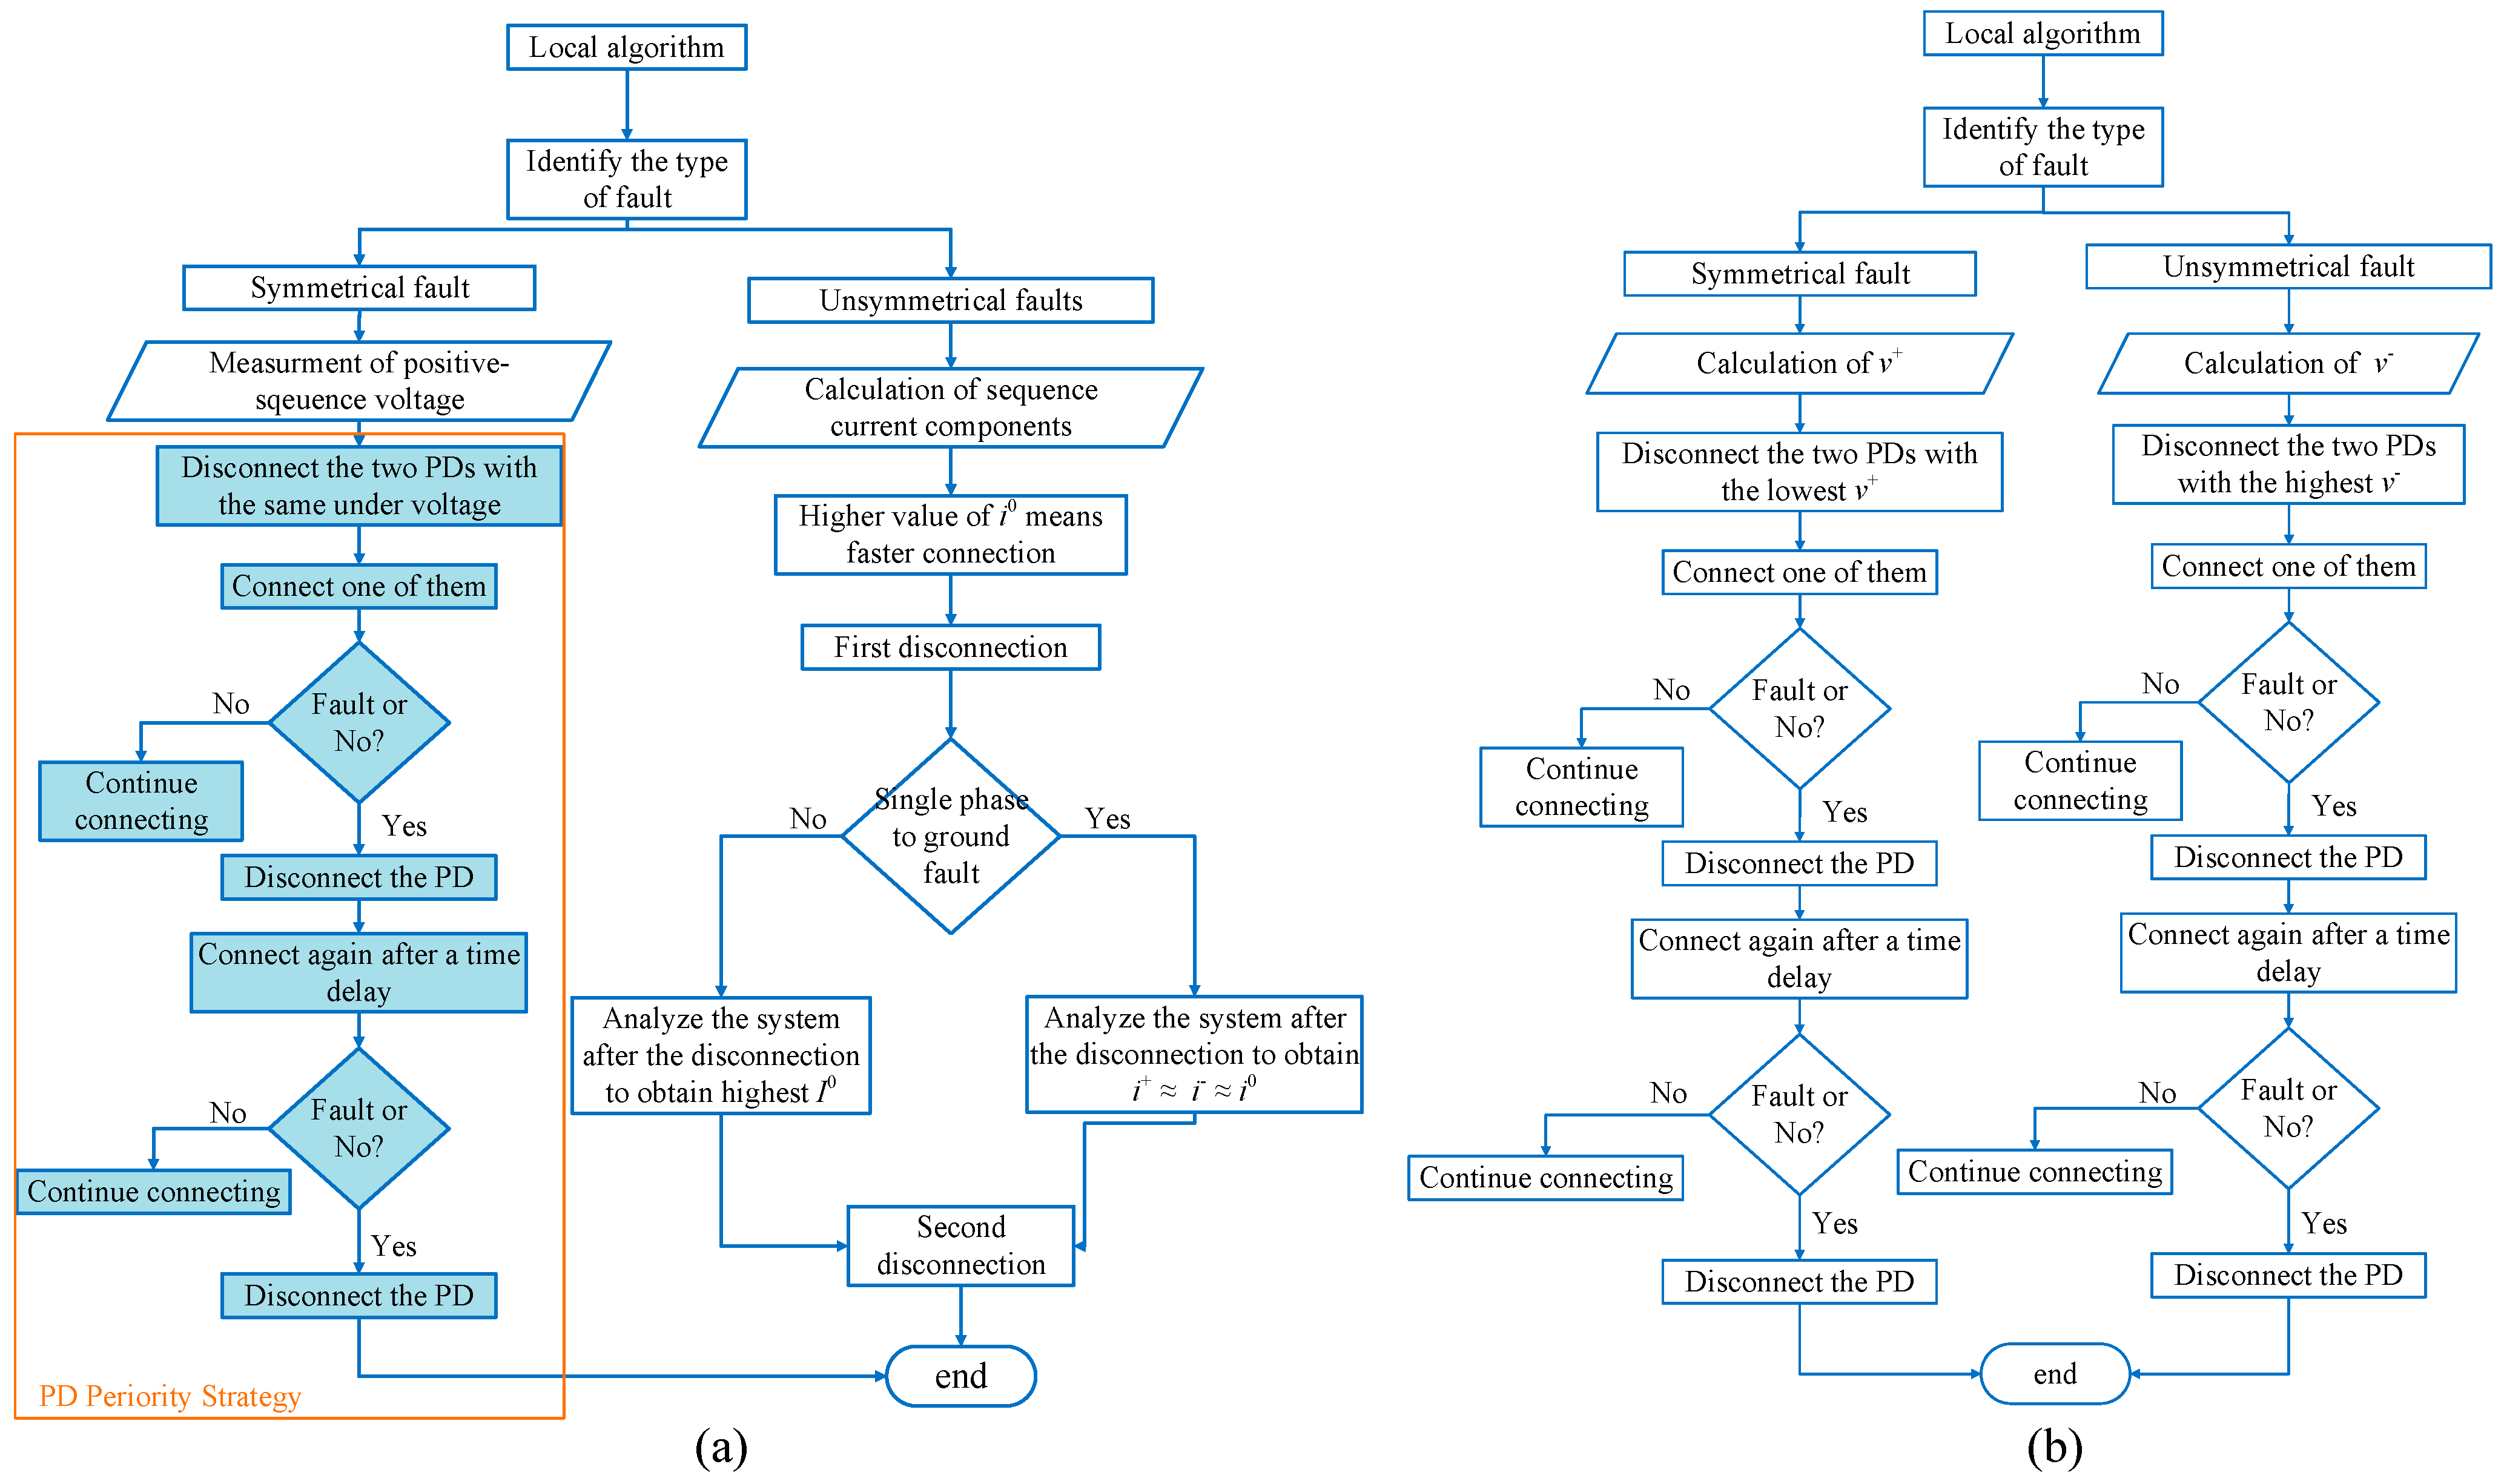
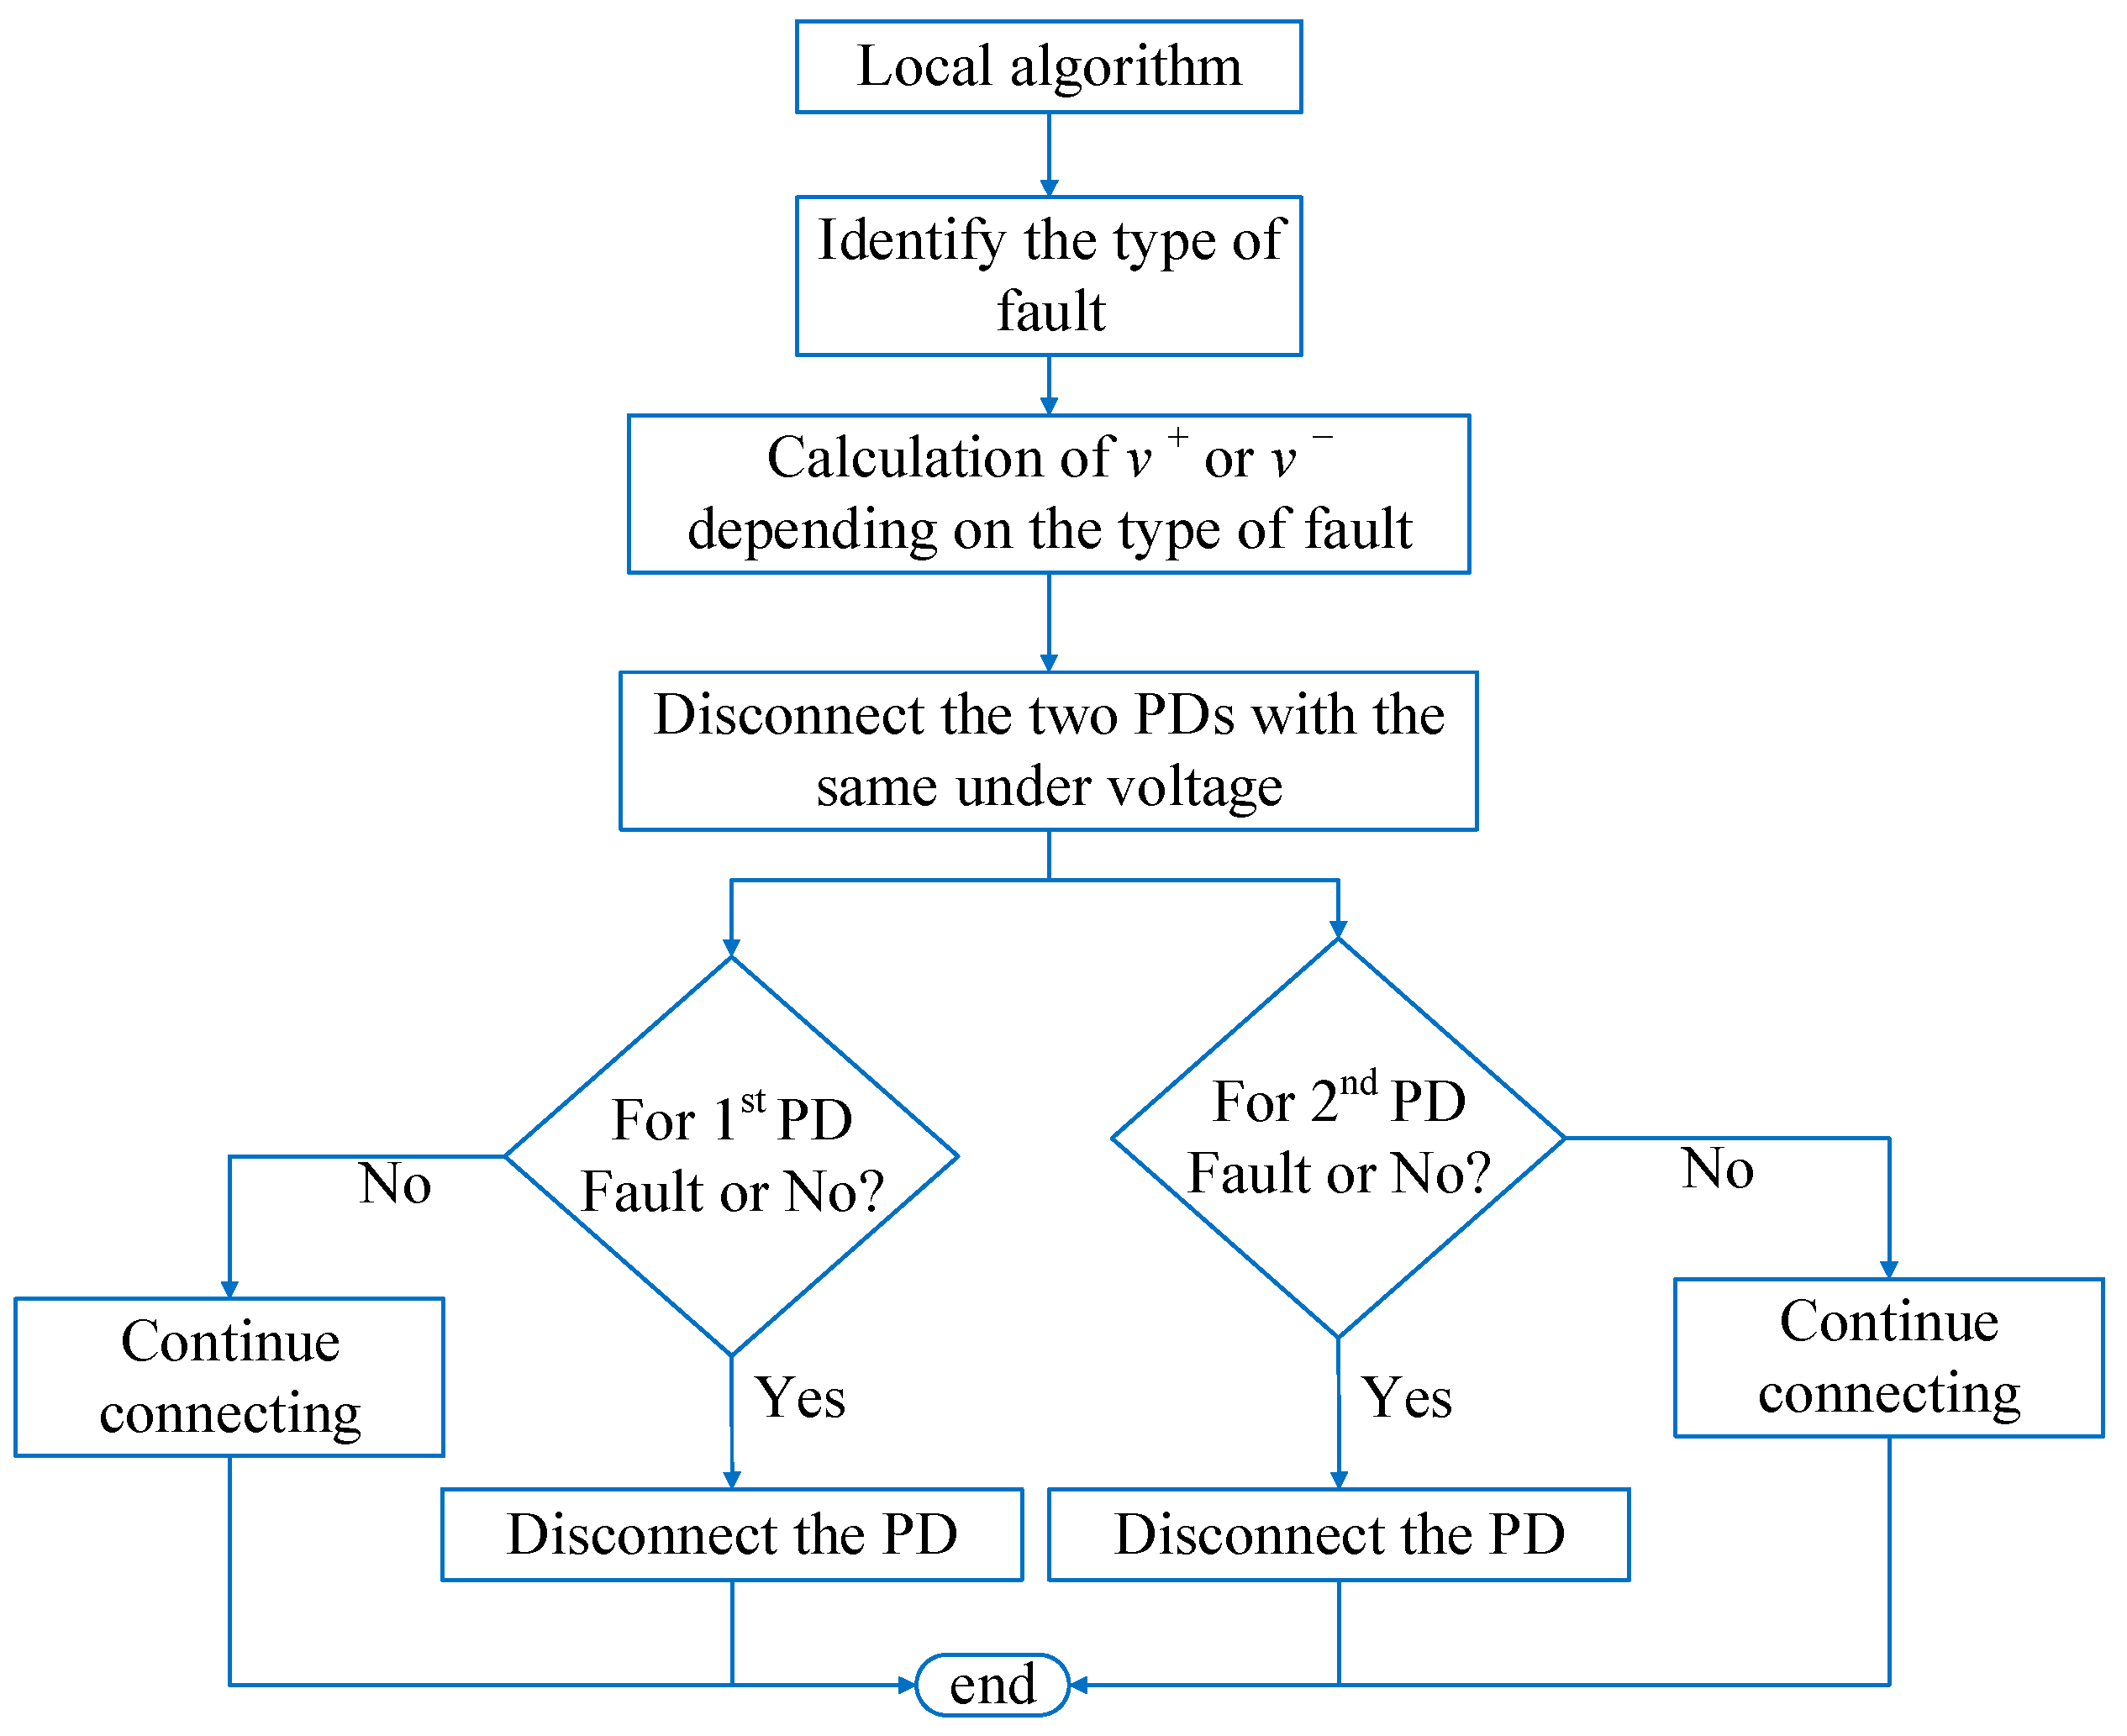
Four PDs connected to the two buses at either end of the faulty line will have the same under-voltage in the event of a line fault, and the recloser algorithm will be used for both ends of the line. Figure 12a shows the flowchart of the LO with the recloser algorithm. The highlighted blue part in the figure is related to the recloser algorithm.
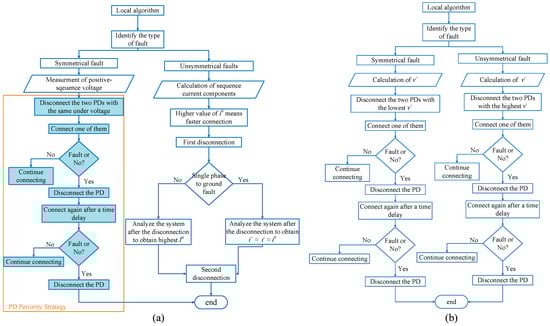
Figure 12.
Flowchart of the LO proposed protection algorithm with (a) a grounded transformer, (b) an isolated transformer.
3.1.2. Proposed LO Algorithm without Recloser
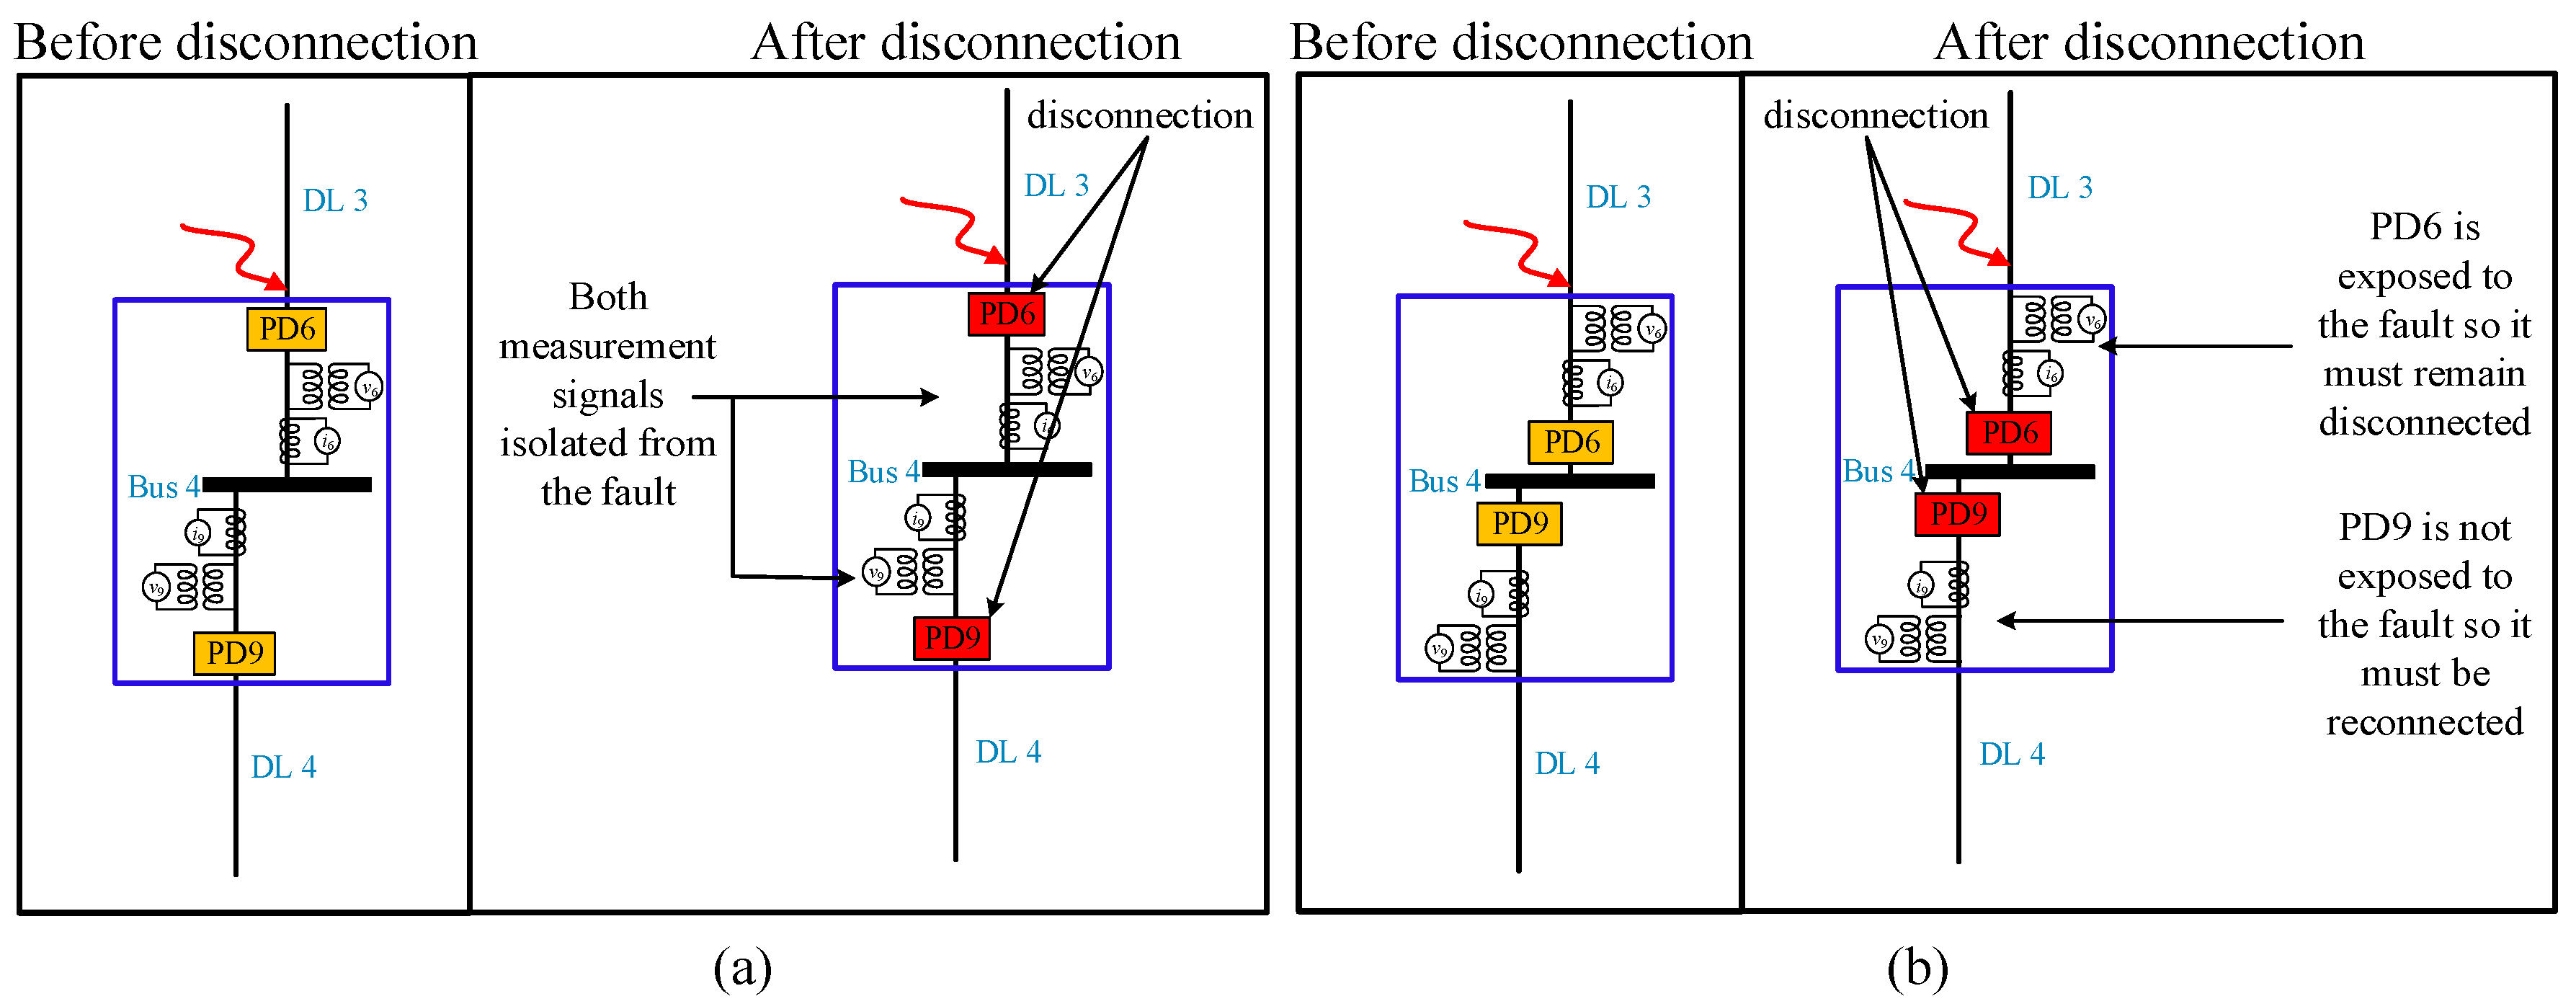
The recloser concept has the drawback of requiring additional time and steps to disconnect the fault. Consequently, an additional concept that has been put forth involves relocating the measurement signals. By positioning the measuring devices in front of the circuit breaker (Figure 13b) as opposed to behind it (Figure 13a), the concept is implemented. Instead of employing the time-consuming and multi-step recloser algorithm, which requires measured voltages to clear the fault, the presence of the fault can be determined directly.
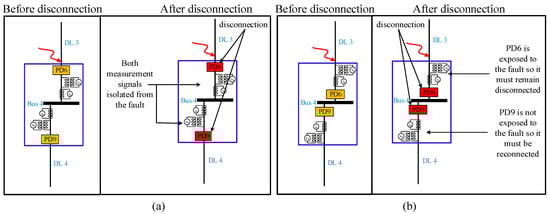
Figure 13.
Measurement signals (a) behind the breaker, (b) in front of the breaker.
As illustrated in Figure 13, measurement devices positioned between the bus and the circuit breaker will observe the same voltage and be disconnected from the fault when both beakers are disconnected subsequent to the disconnection of the bus. A recloser algorithm must subsequently be implemented to deactivate the circuit breaker in the faulty line.
However, if the measurement signals are positioned in front of the circuit breaker, one of them will be isolated from the fault while the other remains exposed to it following the disconnection of both breakers caused by under-voltage. Since this is the case, the recloser algorithm is unnecessary. Conversely, each breaker is capable of rendering an immediate and delay-free decision. Consequently, the duration required to detach the faulty component from the power grid is shortened.
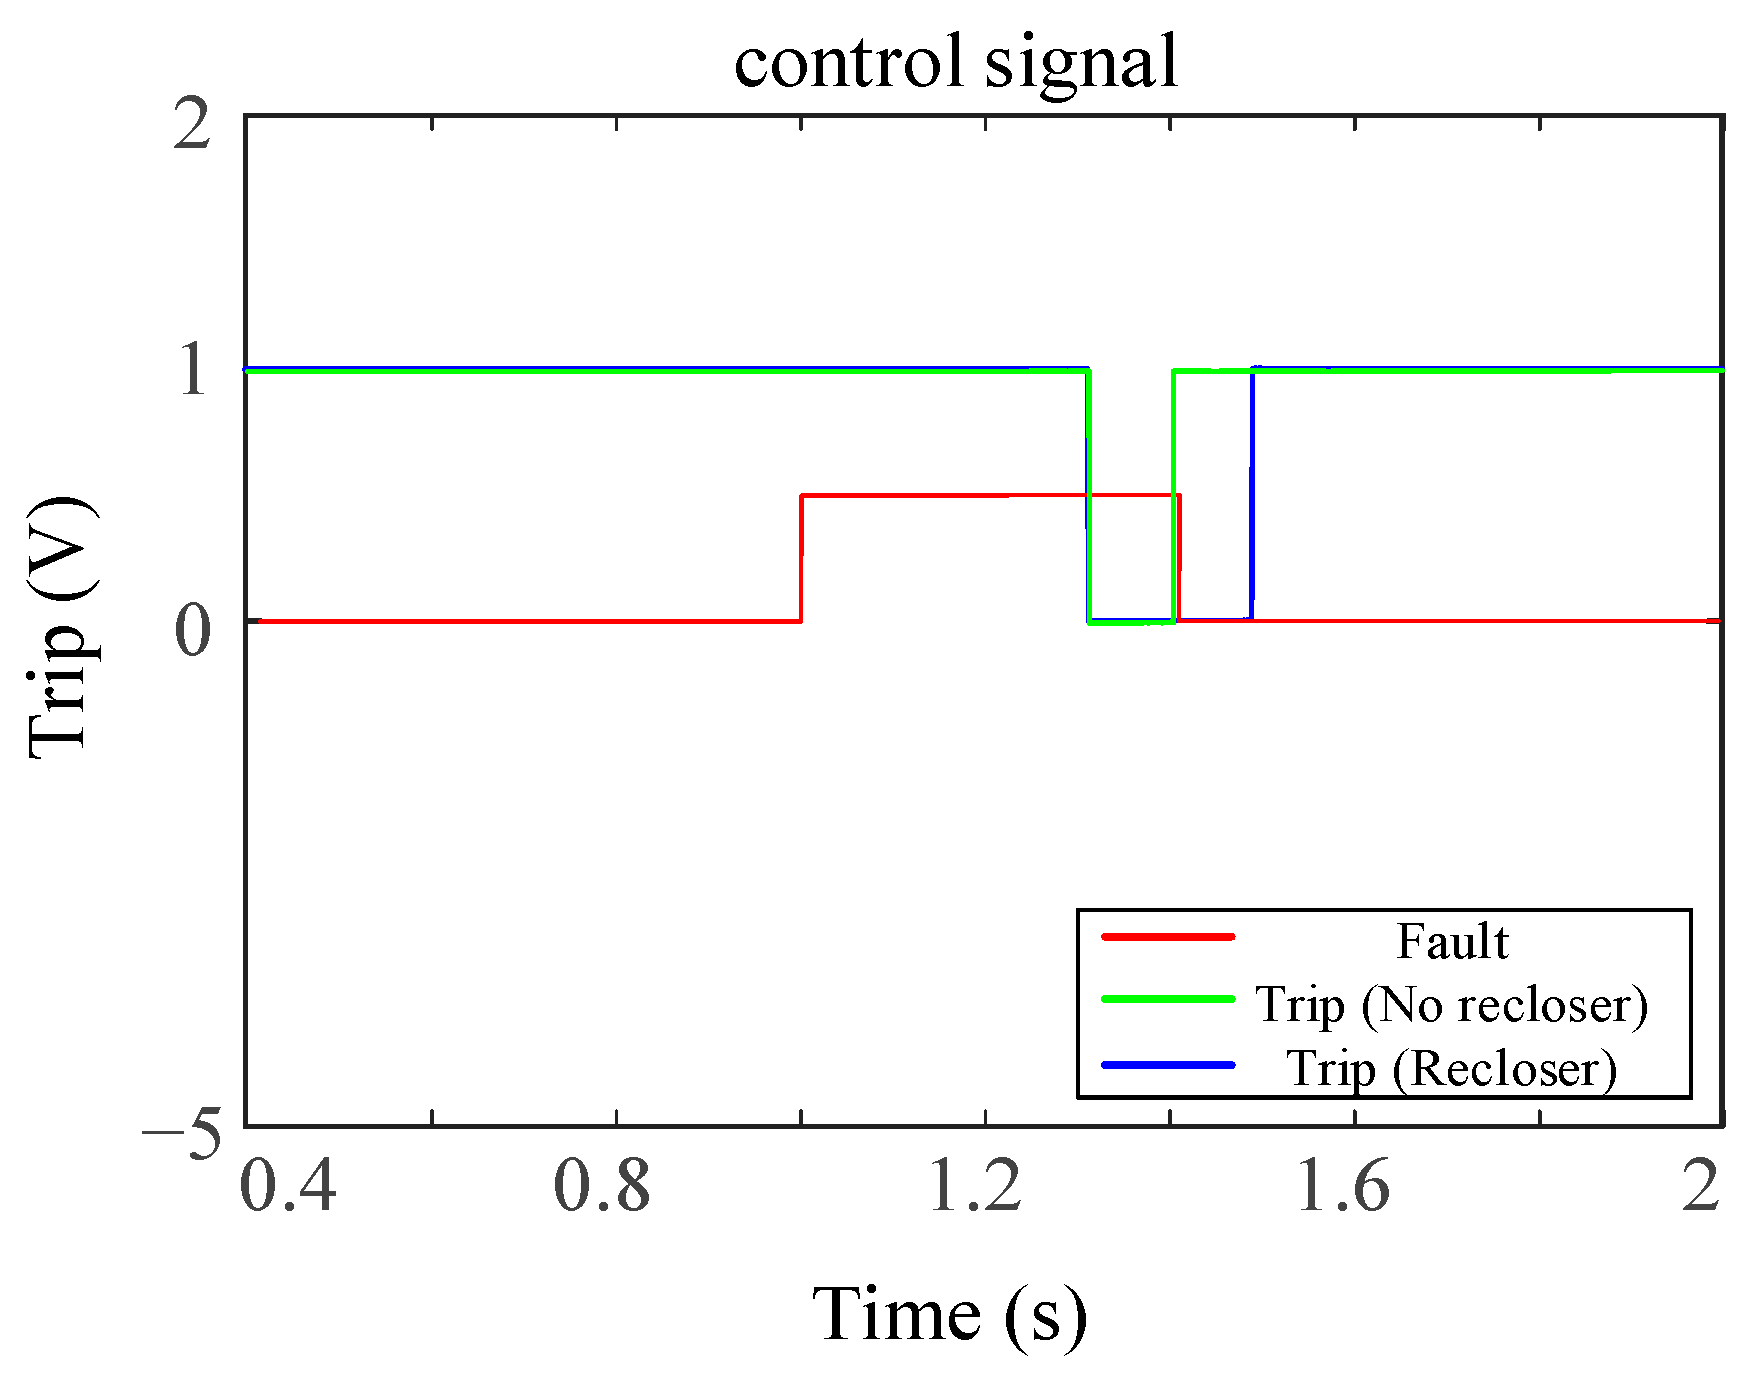
The clearing time required to disconnect the faulted side of the line in the event of a three-phase fault with the LO is illustrated in Table 4 and Figure 14. The delay time of the measuring instruments is deemed to be included in the total tripping time. That is to say, an additional delay time is acquired with each open or close, which indicates that the clearing time of the fault will be longer with the recloser algorithm than it would be without the algorithm.
Table 4.
Fault clearing time.
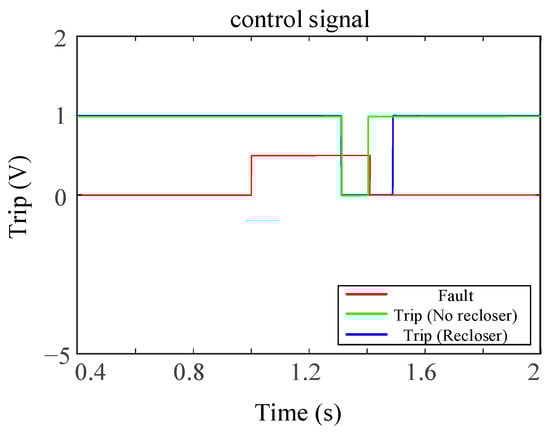
Figure 14.
Variation between trip signals generated with and without recloser algorithms.
It is essential to note that the algorithms for the other fault types will not be impacted by the implementation of this concept. The flowchart of the proposed LO algorithm without a recloser is illustrated in Figure 15.
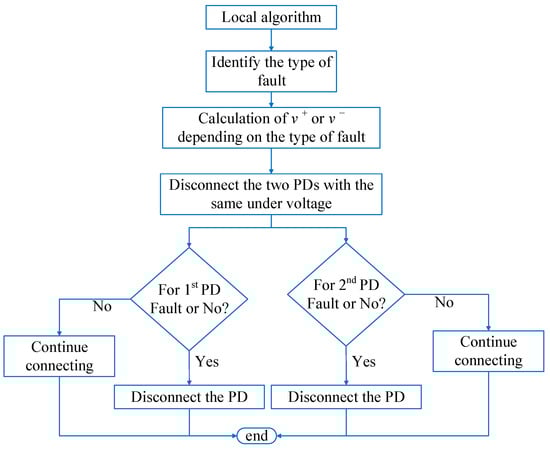
Figure 15.
Proposed LO algorithm flowchart excluding the recloser.
3.2. YNd11 Isolated HV/MV Transformer
The principal advantage of this algorithm is that it operates independently from the grounding connection of the HV/MV transformer. It accomplishes this by relying on the sequence abc voltages at each bus and subsequently employing the recloser algorithm to isolate the defective component of the system.
One end of the faulty line can be identified by observing the negative-sequence voltage that occurs during a single-phase fault. When the negative-sequence voltage at one end of the faulty line between two PDs connected to the same bus (bus 3) is greater than any other negative-sequence voltage values observed on other lines during the fault, the recloser algorithm will be utilized to isolate the PD at the faulty line. The highest value, therefore, corresponds to a more rapid disconnection. Figure 12 illustrates the flowchart of the LO algorithm in the case where the grounded YNd11 side of the HV/MV transformer is connected via a zig-zag transformer (b).
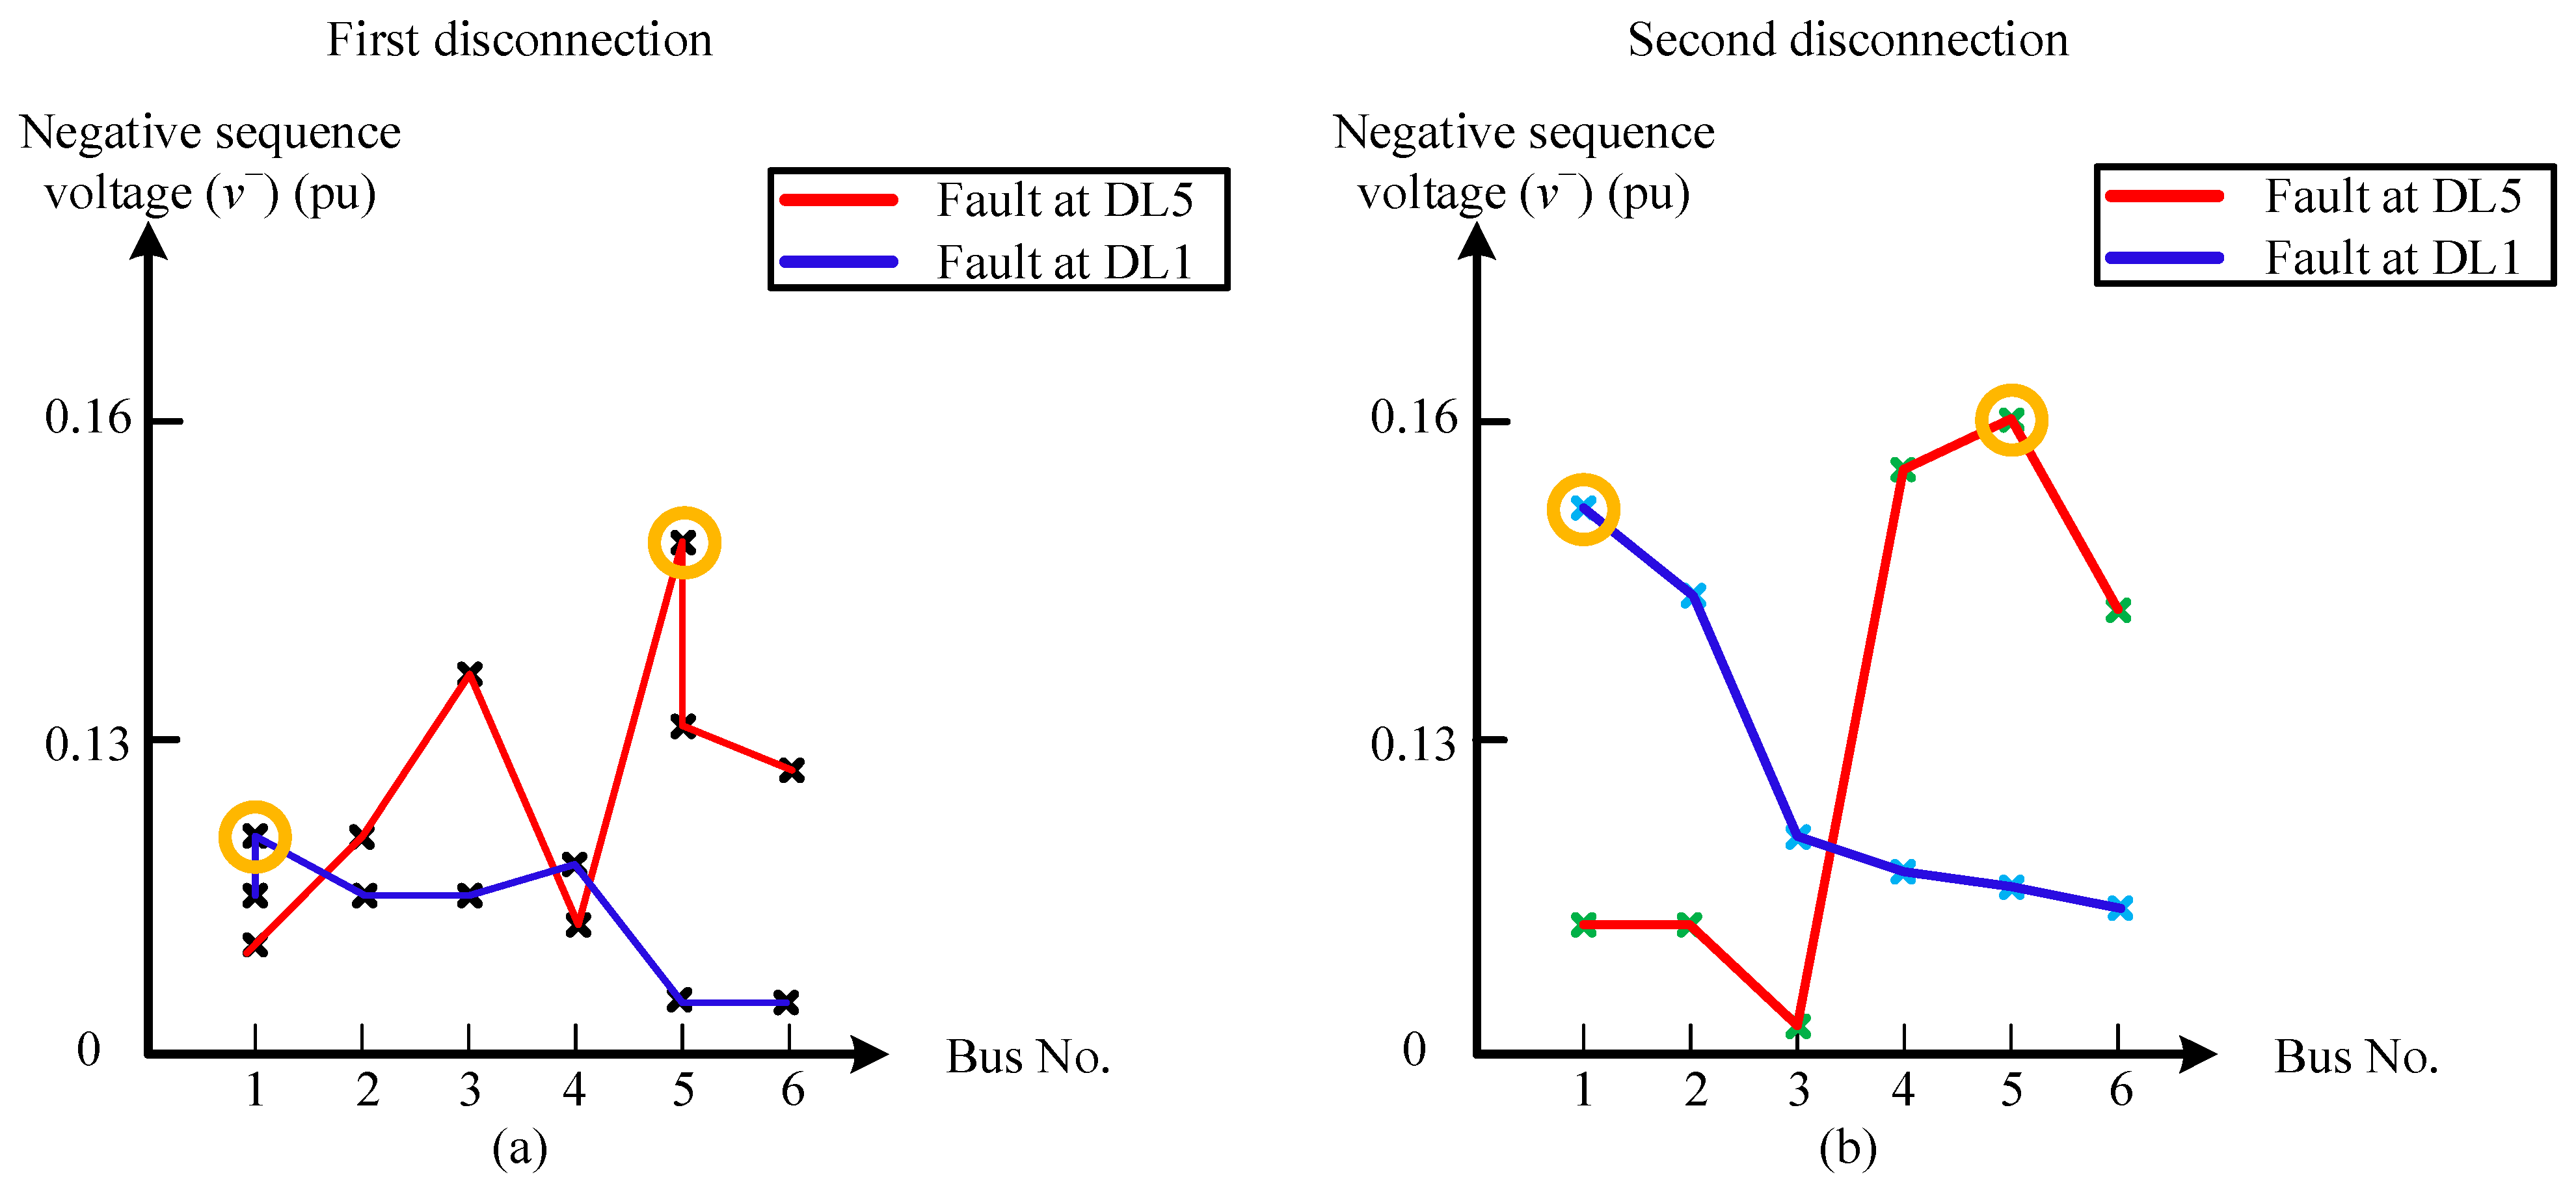
Following the disconnection of the PD with the highest voltage in the negative sequence, the grid is analyzed. In the event of a single-phase fault, the most significant value of the negative-sequence currents is obtained at the opposite end of the faulty line subsequent to disconnecting one end. This principle is employed to isolate the faulty line. Figure 16 illustrates the single-phase to ground fault zero-sequence current profile. The faulty line (DL5) has the greatest value for negative-sequence voltage (v−). Therefore, the first disconnection can be performed. The other end of the faulted line (DL5) can be disconnected using the same method. The behavior is similar when the fault is at DL1, as presented in Figure 16.
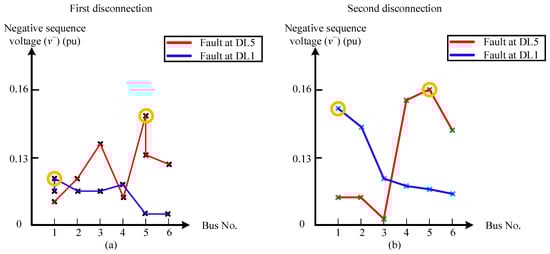
Figure 16.
Negative-sequence voltage profile during single-phase fault with one DG connected at bus 3; (a) the first disconnection, (b) the second disconnection.
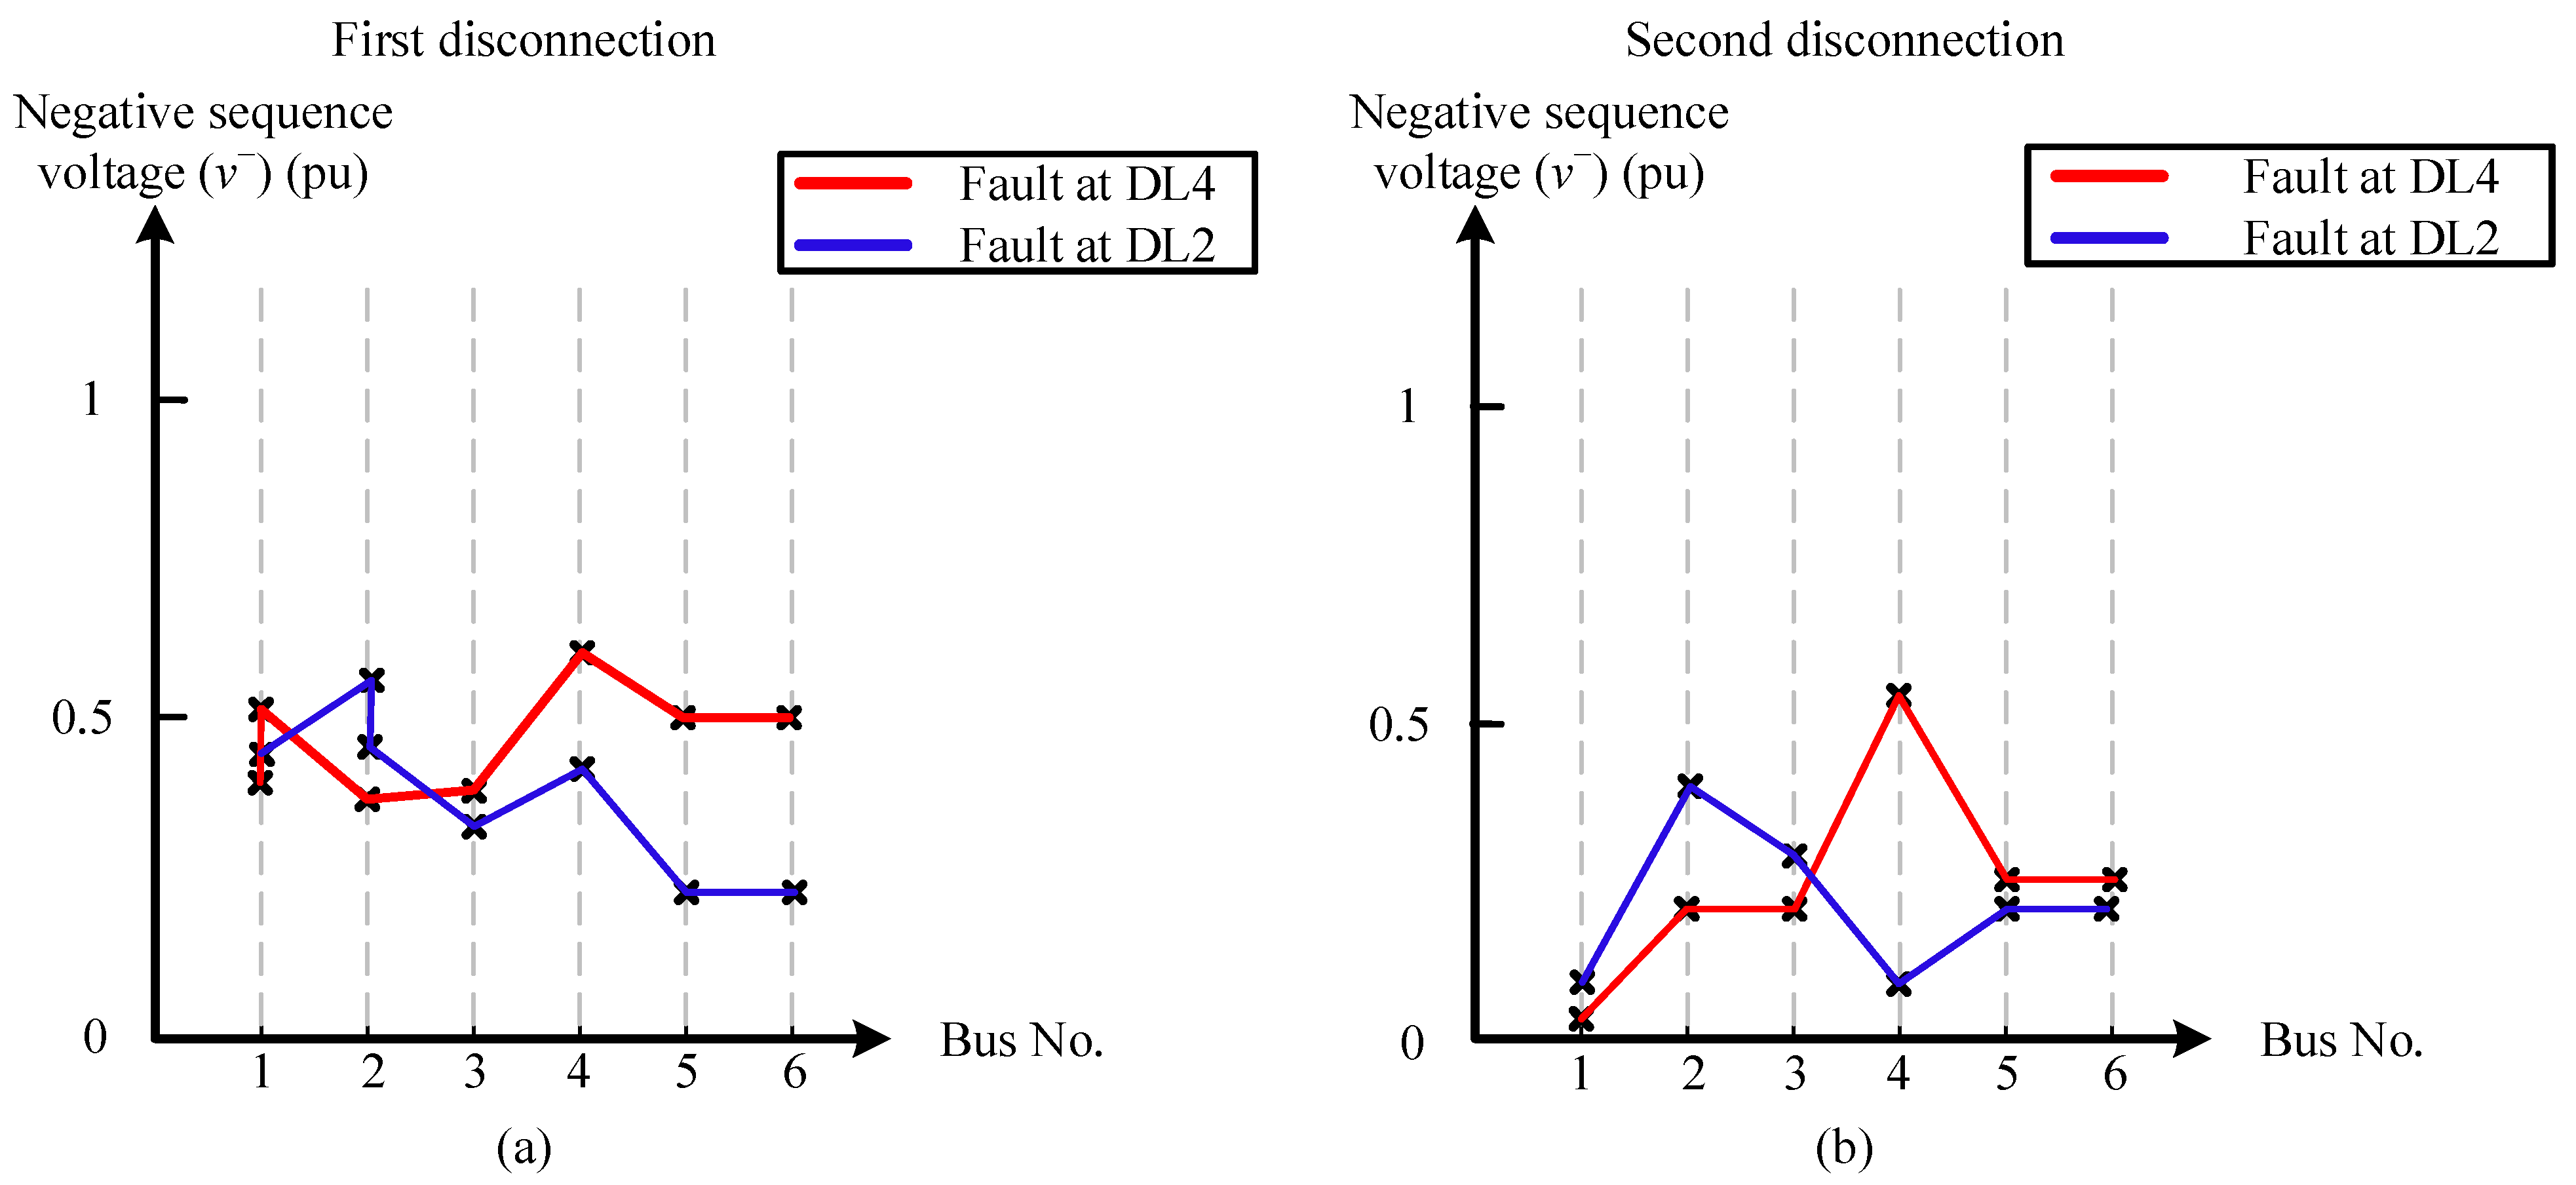
One end of the faulty line can be found in the case of a two-phase or two-phase to-ground fault using the same concept used in the case of a single-phase fault through the fault’s negative-sequence voltage. Figure 17 shows the case of two-phase faults. The negative-sequence voltage profile at the faulty line (DL4 or DL2) has the most significant value of v− for implementing the first disconnection. The opposite end of the faulted line (DL4 or DL2) is disconnected using the same method.

Figure 17.
Negative-sequence voltage profile during two-phase fault with one DG connected at bus 3; (a) the first disconnection, (b) the second disconnection.
Positive-sequence voltage is used in three-phase fault scenarios to identify the fault’s location and disconnect one end of the faulted line. First to trip is the PD, with the lowest positive-sequence voltage that recognizes the three-phase fault. After the initial disconnect, the opposite end of the faulty line is disconnected using the same principles.
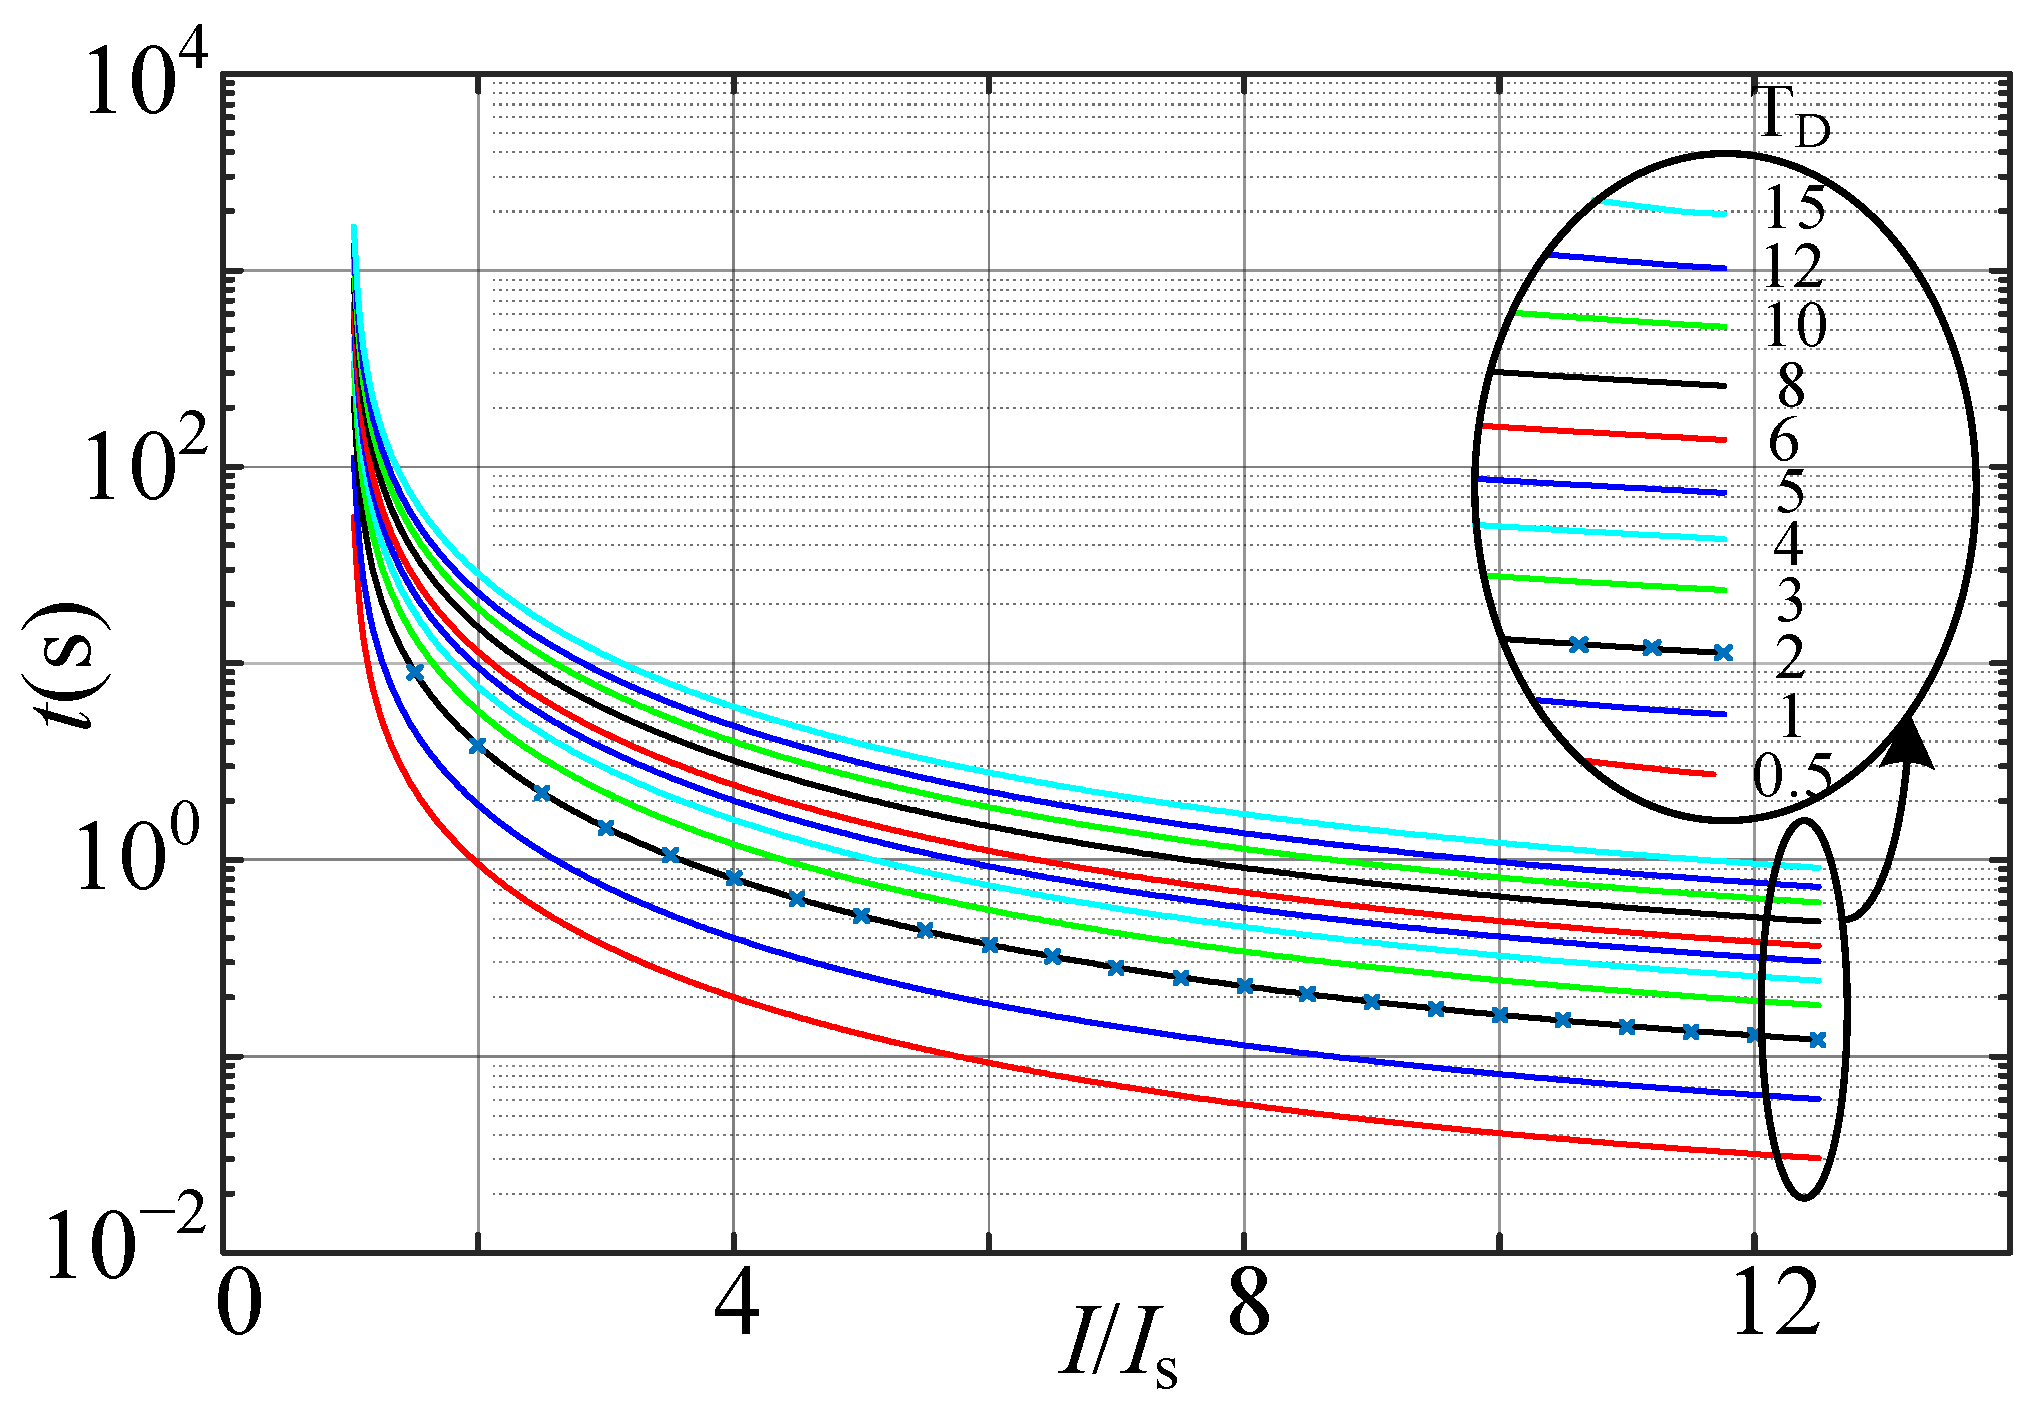
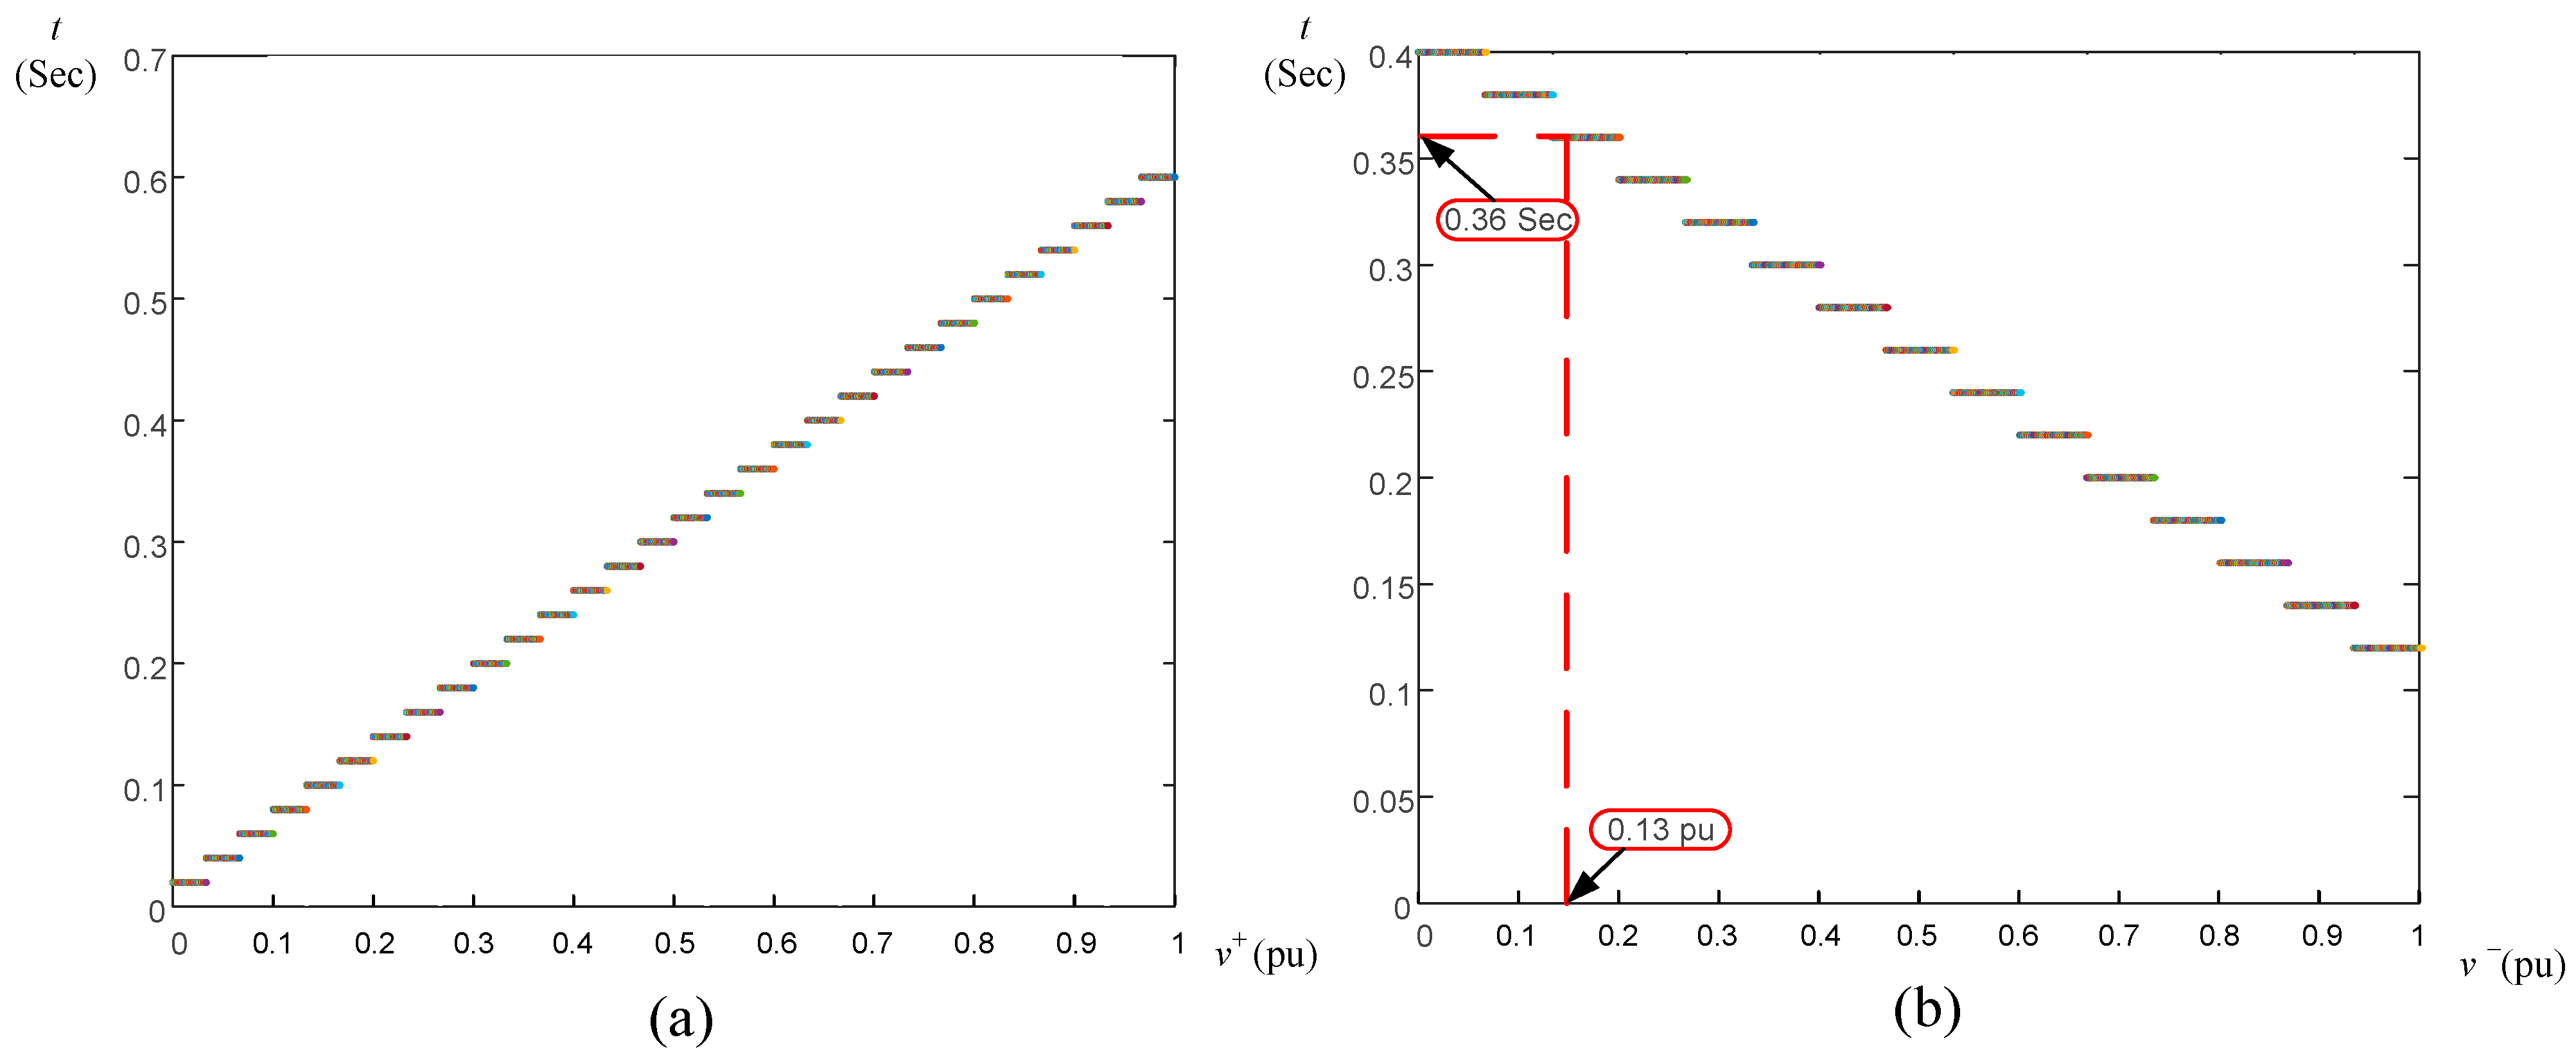
The algorithm’s fundamental concept is to employ the recloser to reopen after a while, as explained in the preceding part. The IEEE Definite Time Standard [27,28] provides the basis for the equation used to describe the definite time–voltage characteristic curve. According to the fault type, the first PD is disconnected based on the magnitude of the positive- or negative-sequence voltages’ definite time curves, as illustrated in Figure 18. Following that, the second PD is disconnected in accordance with the fault type algorithm. Positive- and negative-sequence voltages were considered for various grid configurations and circumstances when designing the curve. Depending on the analyzed grid, this curve may be adjusted to other grid configurations and voltage levels.
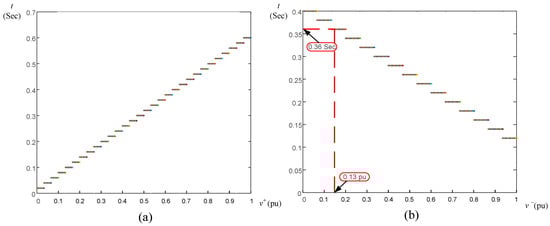
Figure 18.
Definite time curve: (a) positive-sequence voltage, (b) negative-sequence voltage.
3.3. PD Priority Strategy
Each PD must render a local decision contingent on the results of the two algorithms, CE and ZO. This action will increase the redundancy of the system, thereby bolstering its security and dependability in the event of a failure. As illustrated in Figure 19, each algorithm is also required to transmit a communication check signal (represented by green arrows) to ensure that the decision is accessible (a).
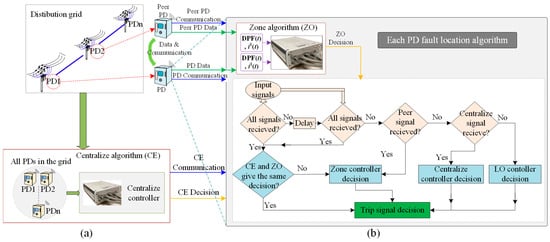
Figure 19.
Concept diagram of (a) CE algorithm, (b) each PD fault location controller including ZO and LO algorithms.
Orange arrows indicate the evaluation of the CE and ZO controllers’ decisions (upon signal reception). If both controllers reach the same conclusion, the decision is executed; otherwise, the ZO’s decision is prioritized due to its possession of a greater number of encrypted communication signals. Only the peer signal would be assessed in the absence of received signals; the ZO determination would be reached in the event that the signals were received. In the absence of such signals, the CE will be examined; if none are detected, the LO algorithm will be implemented, and a trip signal will be transmitted to the PD. The flowchart of each PD fault location algorithm is illustrated in Figure 19b.
Due to the fact that the grounding connection of the HV/MV transformer modifies the configuration of all PDs in the grid and affects the values of the short-circuit current in the grid, this method has the benefit of grounding connection-independent algorithm operations. The new method would accelerate the protection system’s response to unanticipated grid disturbances while improving the system’s precision and efficiency. The benefits and drawbacks of three-level protection algorithms are detailed in Table 5.
Table 5.
Comparison between CE, ZO, and LO protection algorithms.
4. Interoperability of Proposed Protection Algorithms
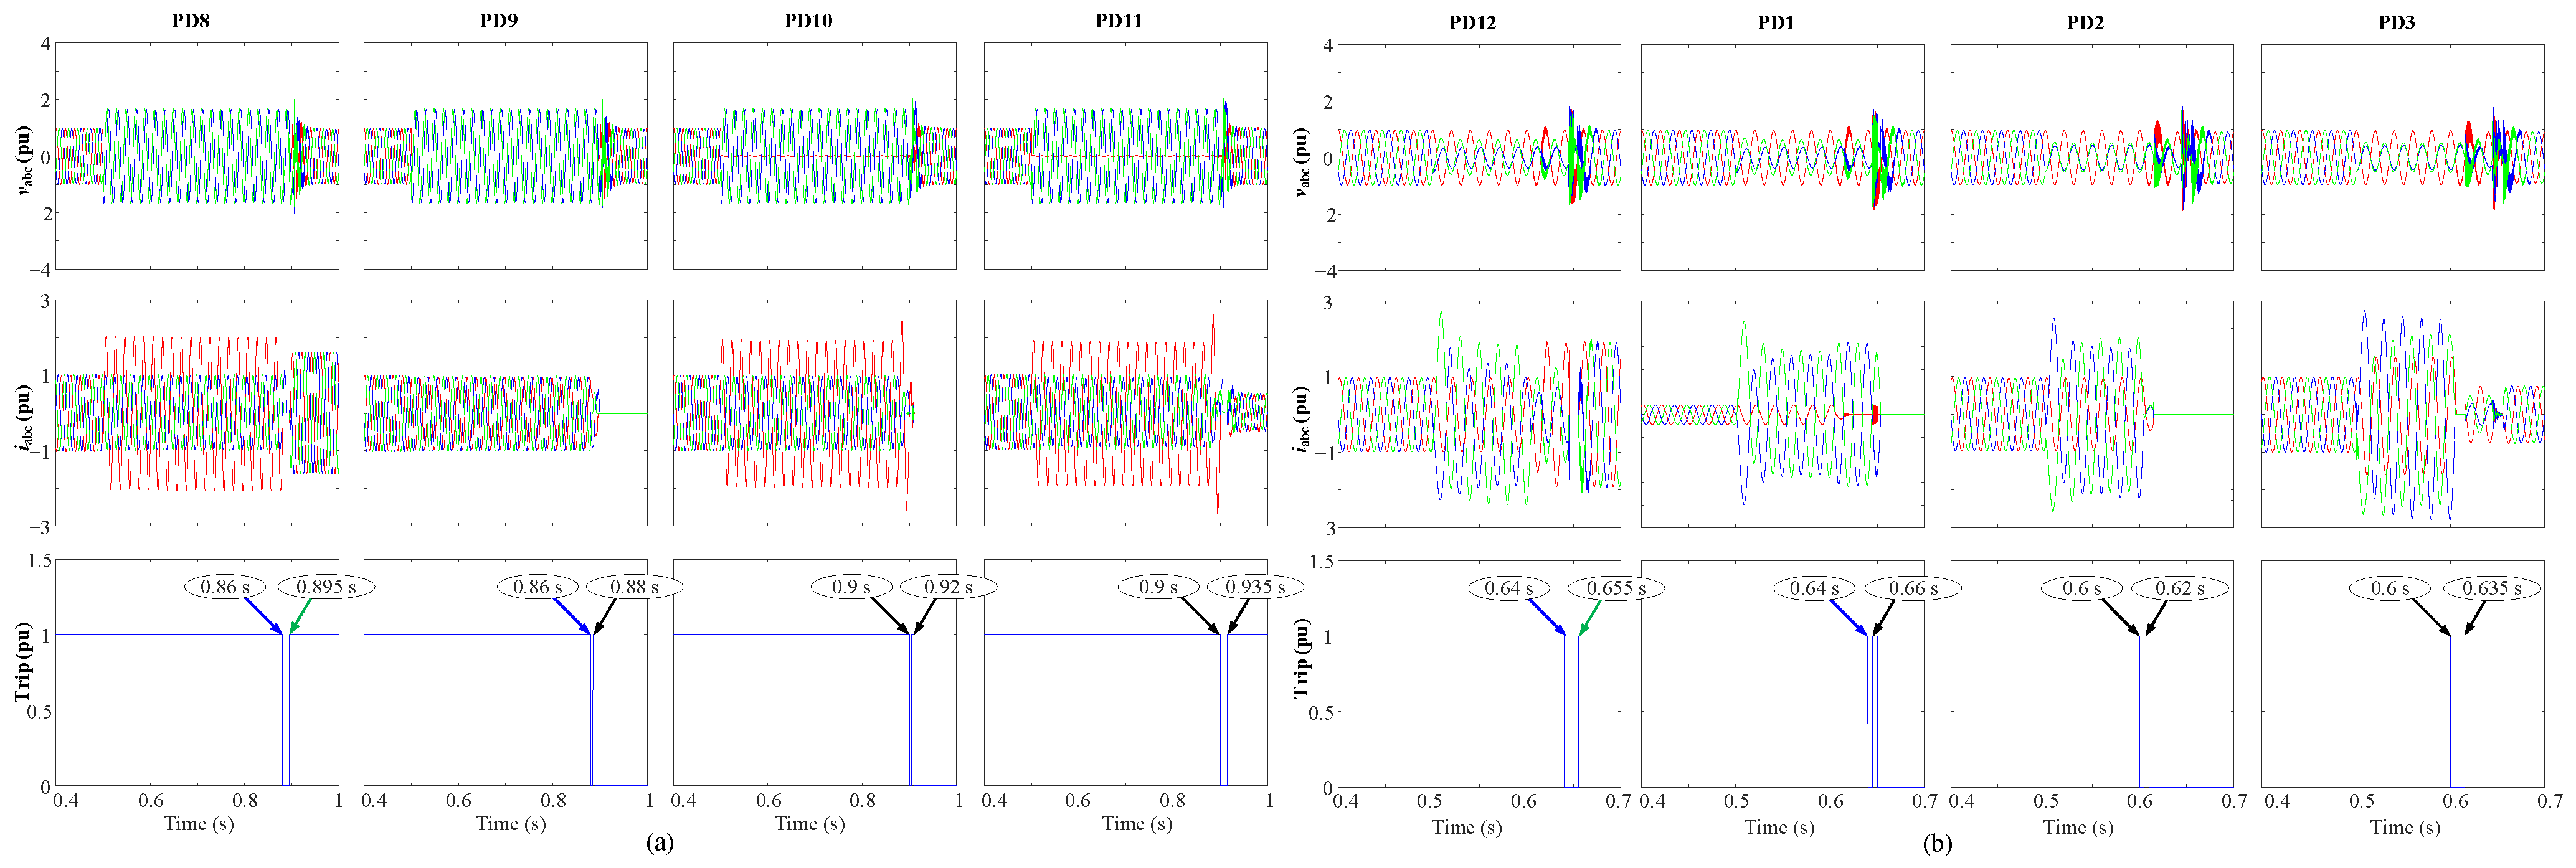
To validate the proposed protection algorithms, various fault types at various locations are examined. To examine the impact of DG penetration on the analyzed ring grid, Figure 20 illustrates asymmetrical faults located at DL1 and DL5. The analyzed ring grid with two DGs is shown in Figure 20a during a single-phase to-ground fault that occurred at DL5 at 0.5 s. Given that both PDs, PD8, and PD9, are both subject to the same negative-sequence voltage (0.13 pu), which corresponds to (0.36 s) in Figure 18, both PDs, PD8, and PD9, will trip at the same time of 0.86 s (blue arrows in Figure 20a). The recloser algorithm will then be used. As PD9 is exposed to the fault, it will close faster than PD8. When reconnected, it will still be exposed to the fault, which will cause PD9 to trip. At 0.895 s (green arrow in Figure 20a), PD8 will be connected again, and the fault will be cleared at that time, causing it to remain connected.
Figure 20.
abc voltages, abc currents, and trip signals for LO, with the analyzed ring grid (a) with 2 DGs during 1 ph to ground (AG) at DL5, (b) without DG during 2 ph (BC) at DL1.
Since PD10 and PD11 are linked to the same bus and will measure the same negative-sequence voltage, the same concept is also repeated there. Then, PD10 will be connected first using the recloser procedure and will trip when it is exposed to the fault, as opposed to PD11, which will be appropriately connected following a delay of 0.015 s.
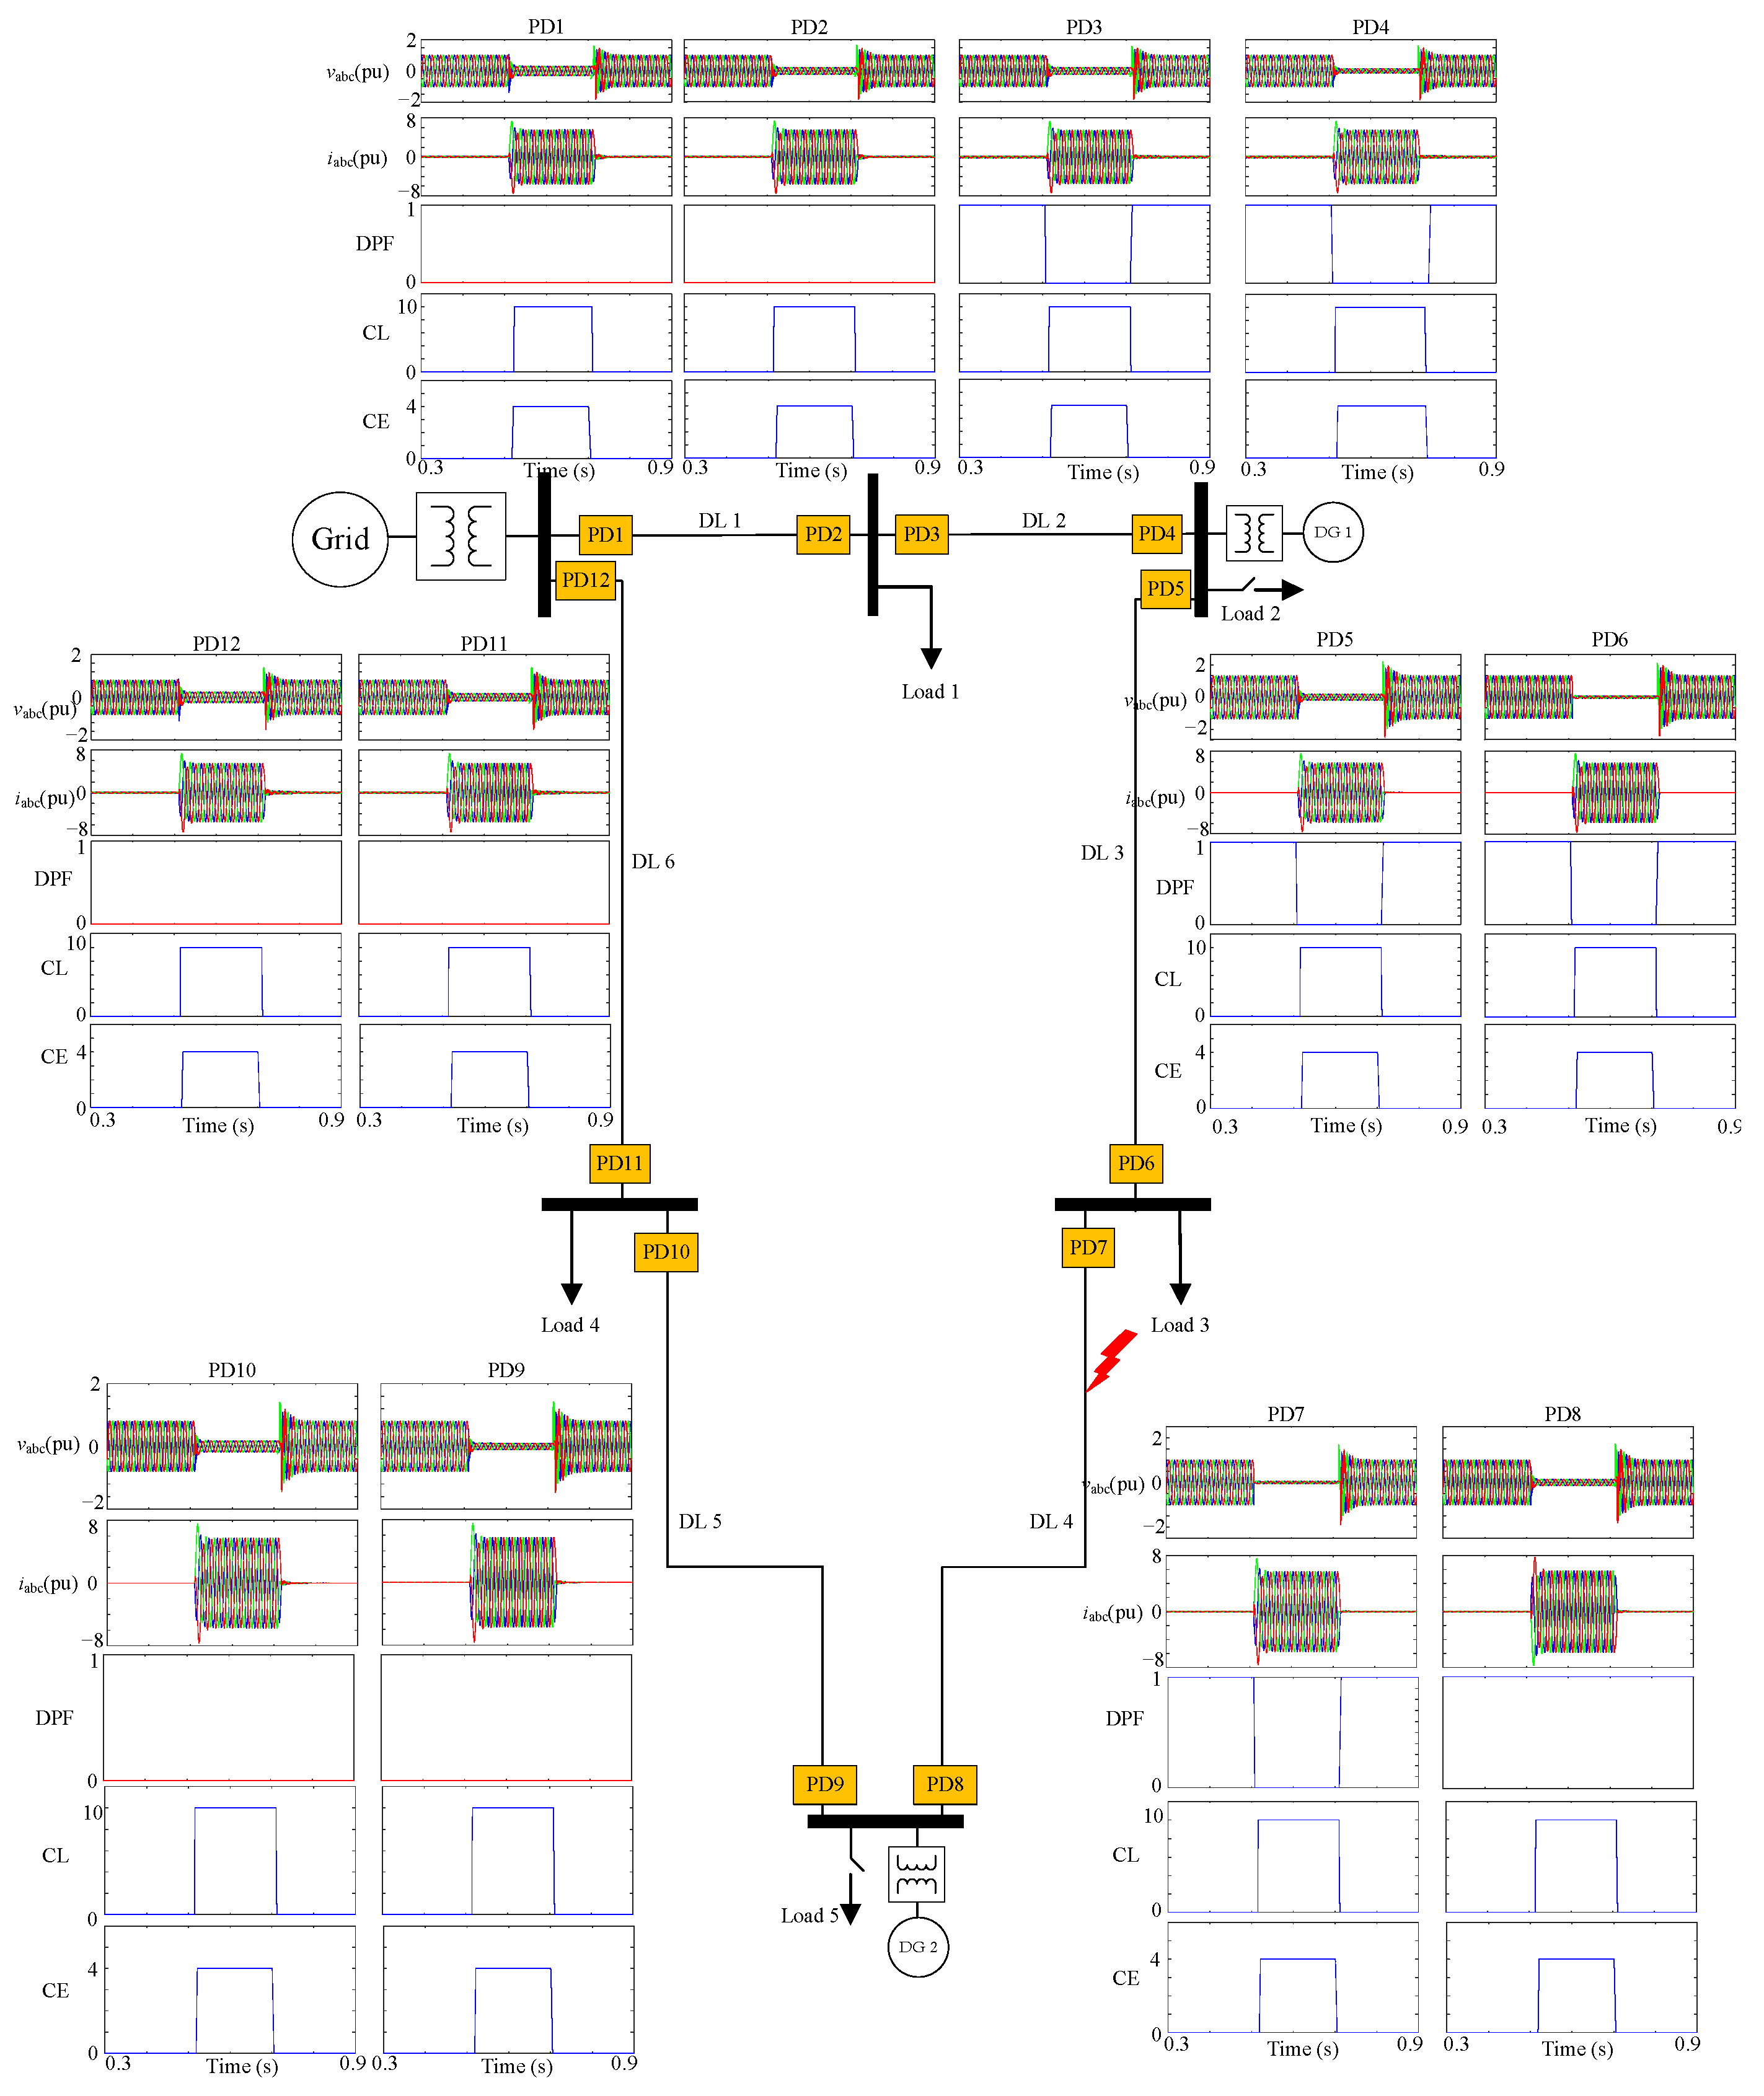
The behavior of the CE-ZO algorithm during symmetrical faults at DL4 is illustrated in Figure 21. The diagram illustrates the centralized ANN (CE), abc voltages, currents, DPF, and fault classification ANN (CL) of every relay in the grid. Using the fault classifier ANN, each relay is capable of accurately identifying the type of fault, as illustrated in the figure. If the fault is permanent, the fault location algorithm can identify the location of the fault and disconnect the affected portion of the network. As demonstrated, the DPF for the faulted line (DL4) breakers is altered from (1 → 0) at one end of the line, indicating that the fault is located at this line.
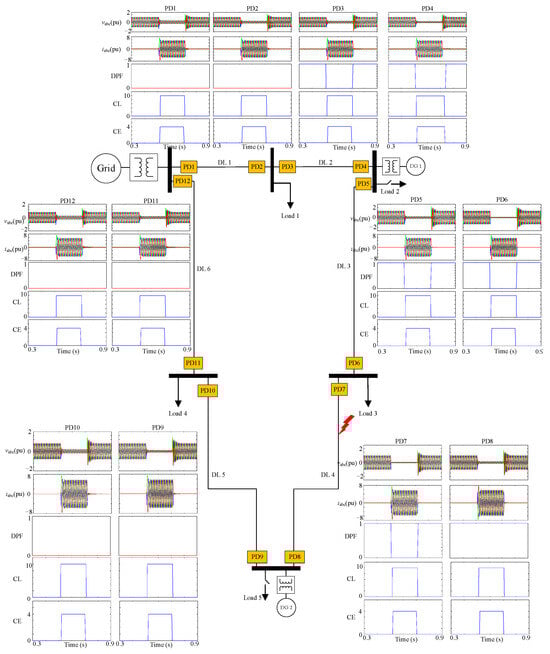
Figure 21.
System response during a symmetrical fault at DL4 when r = 0.1 Ω for CE-ZO.
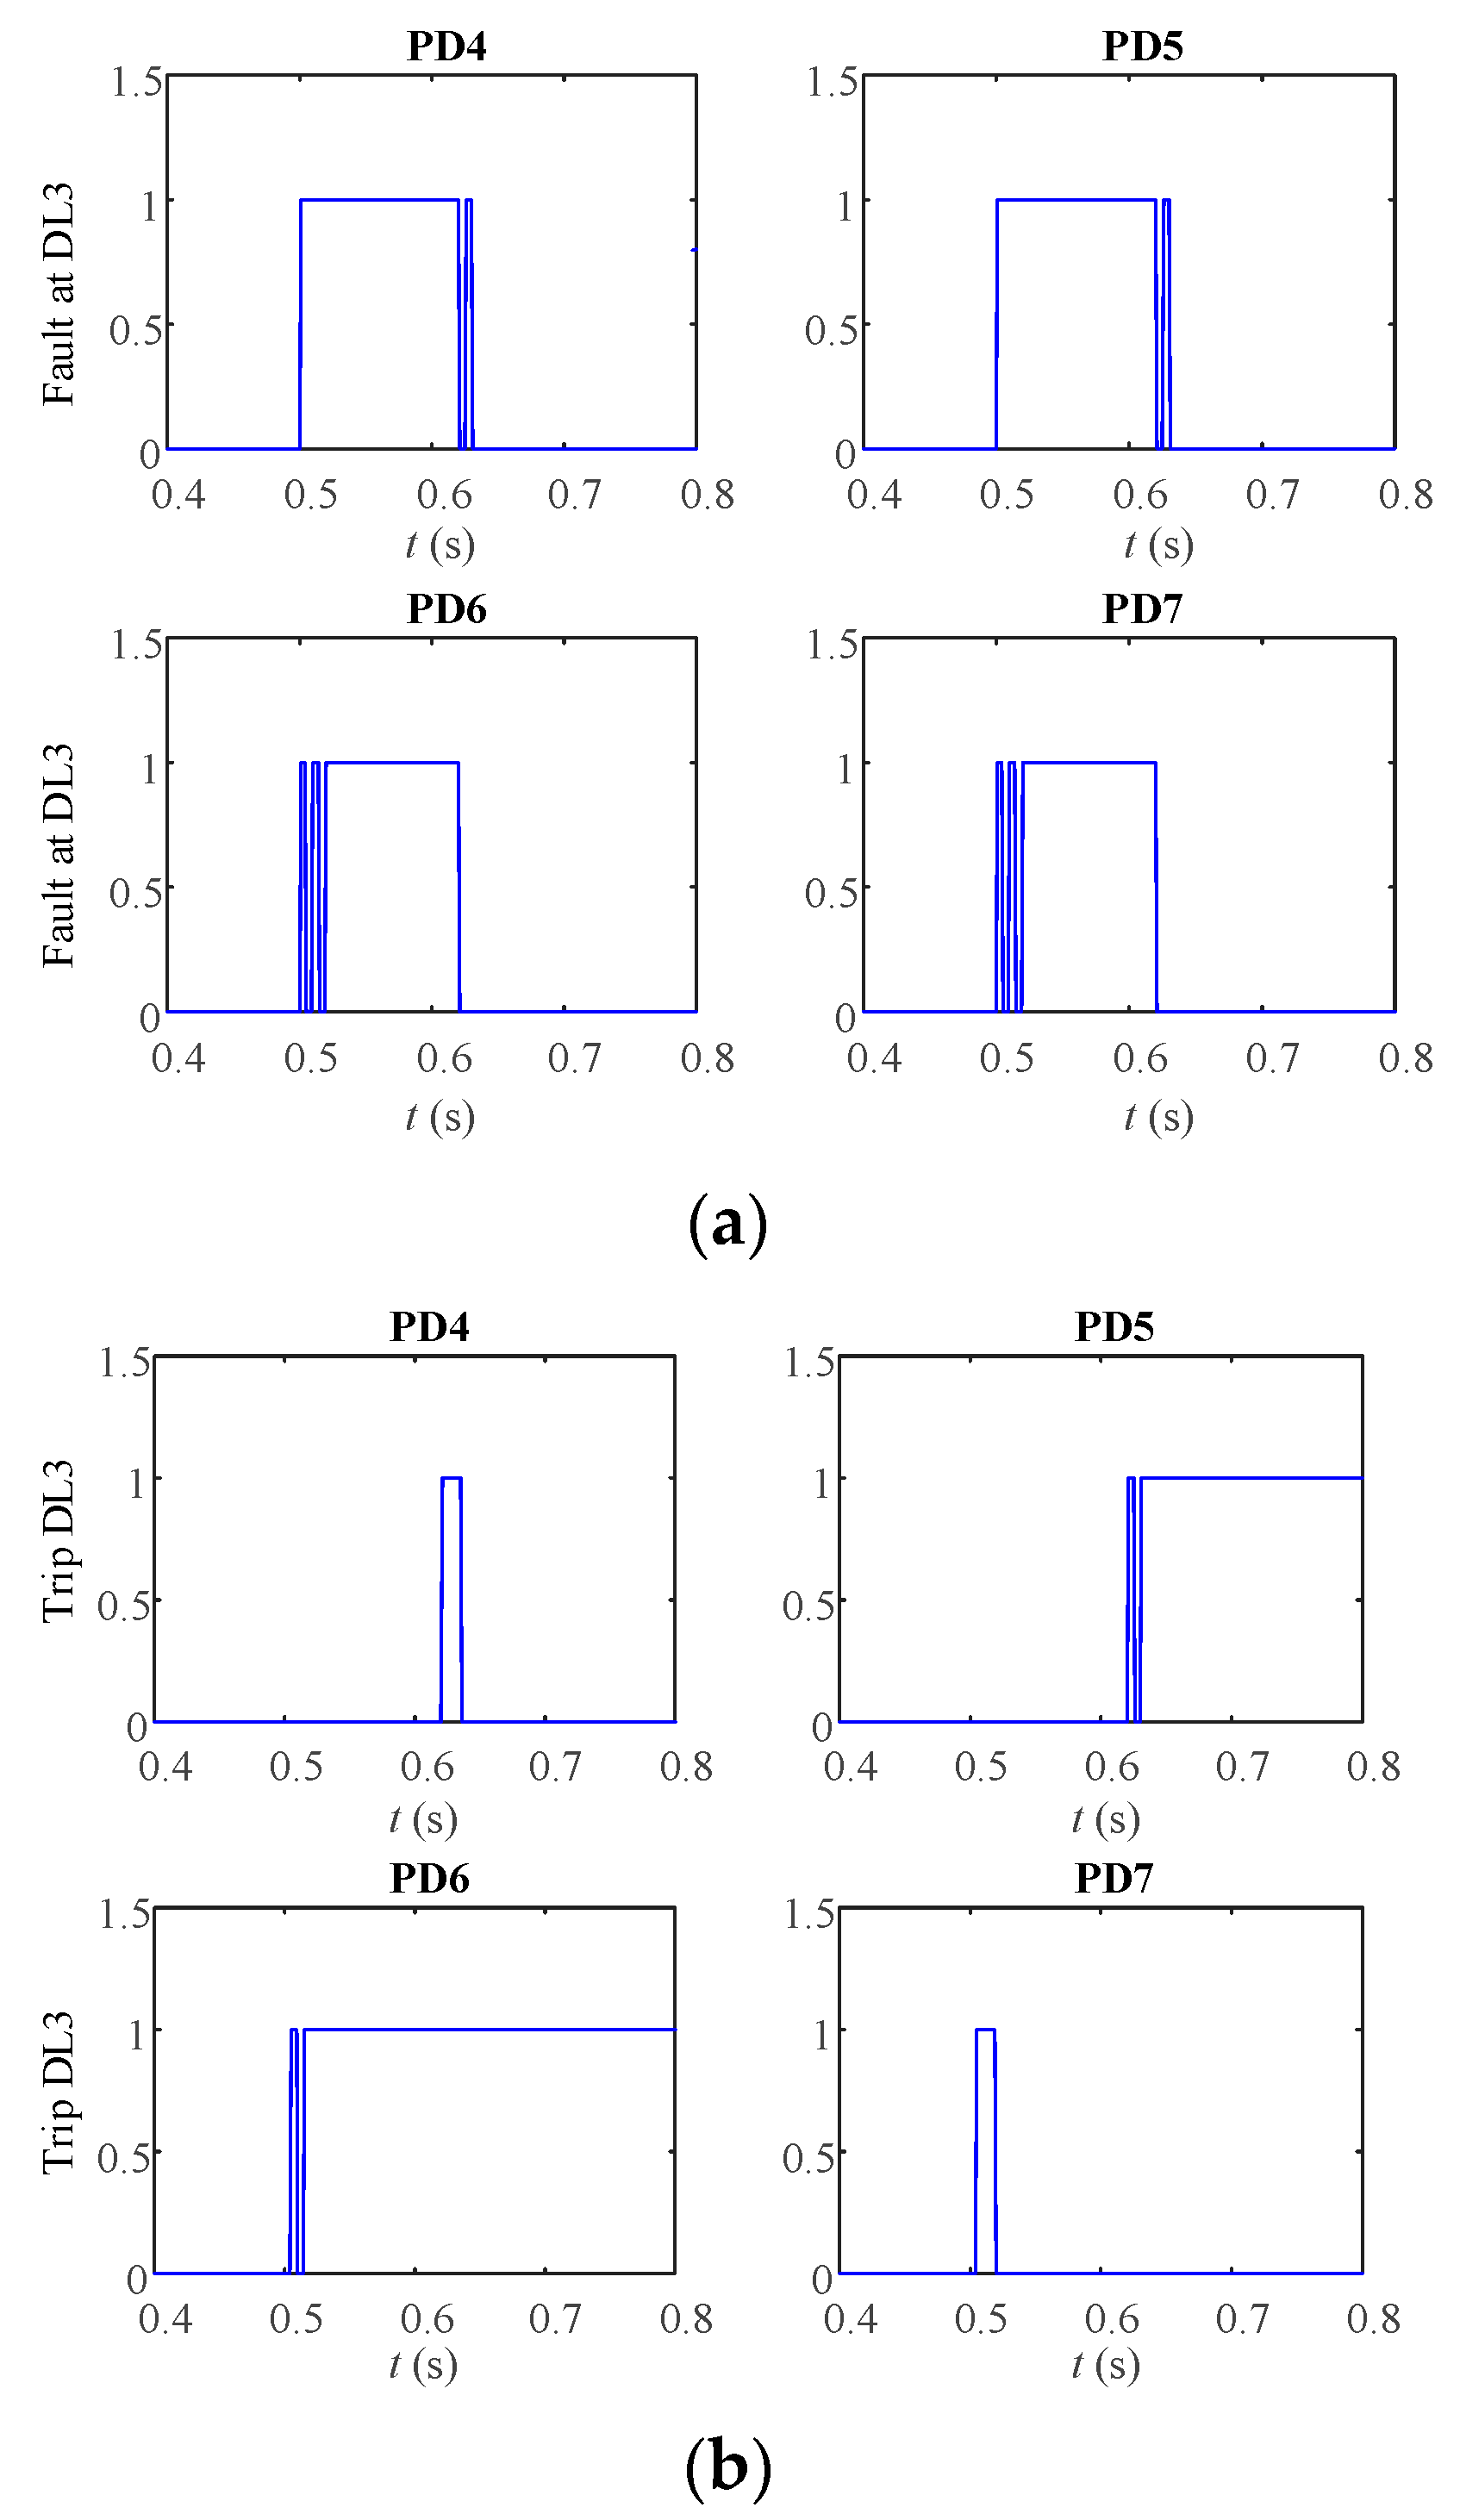
Figure 22 might provide a more accurate understanding of the LO with the recloser procedure when a symmetrical fault happens at DL3. These graphs display all the PDs linked to the buses at the end of the faulty line and trip signals. The protection method depends on the definite time curve corresponding to the positive-sequence voltage, as shown in Figure 22a. Due to their connection to the same bus, the fault signal at PD4 and PD5 is the same bus 3. The PD6 and PD7 linked to bus 4 experienced the same results. The trip signals of the corresponding PDs are shown in Figure 22b. PD6 and PD7 have the first disconnection because they have the same minimum positive-sequence value, and the two PDs are connected to the same bus trip simultaneously. PD4 and PD5 have the second disconnection in this case because their positive-sequence values are higher than the other PDs, PD6 and PD7. Then, after connecting PD6, which is exposed to the fault, the recloser procedure is used, causing it to trip another time. As soon as PD6 is disconnected and PD7 is attached, PD7 is not exposed to the fault and does not trip. The preceding conclusion applies to an unsymmetrical fault; the only difference is that the protection procedure in this situation depends on the negative-sequence voltage.
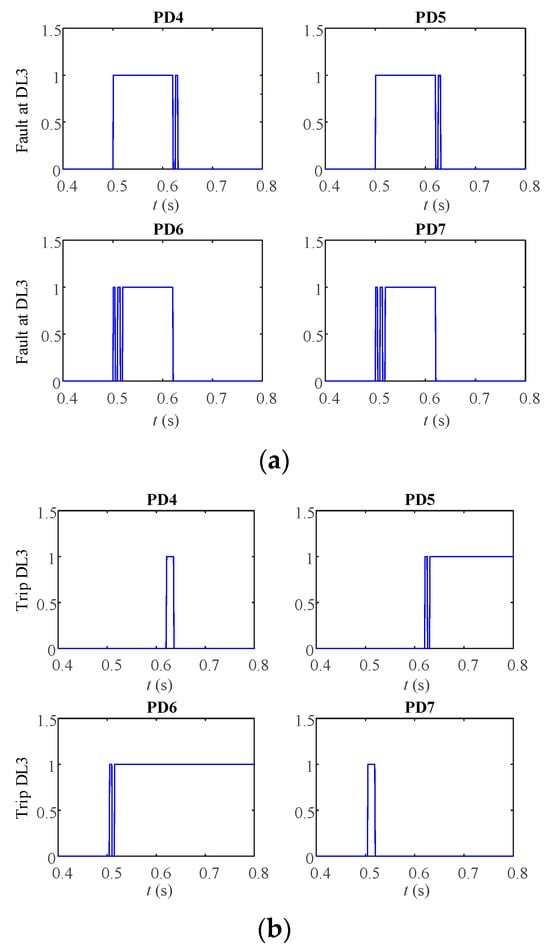
Figure 22.
Ring grid with 2 DGs during 3 ph (abc) at DL3, (a) fault, (b) trip.
5. Experimental Validation
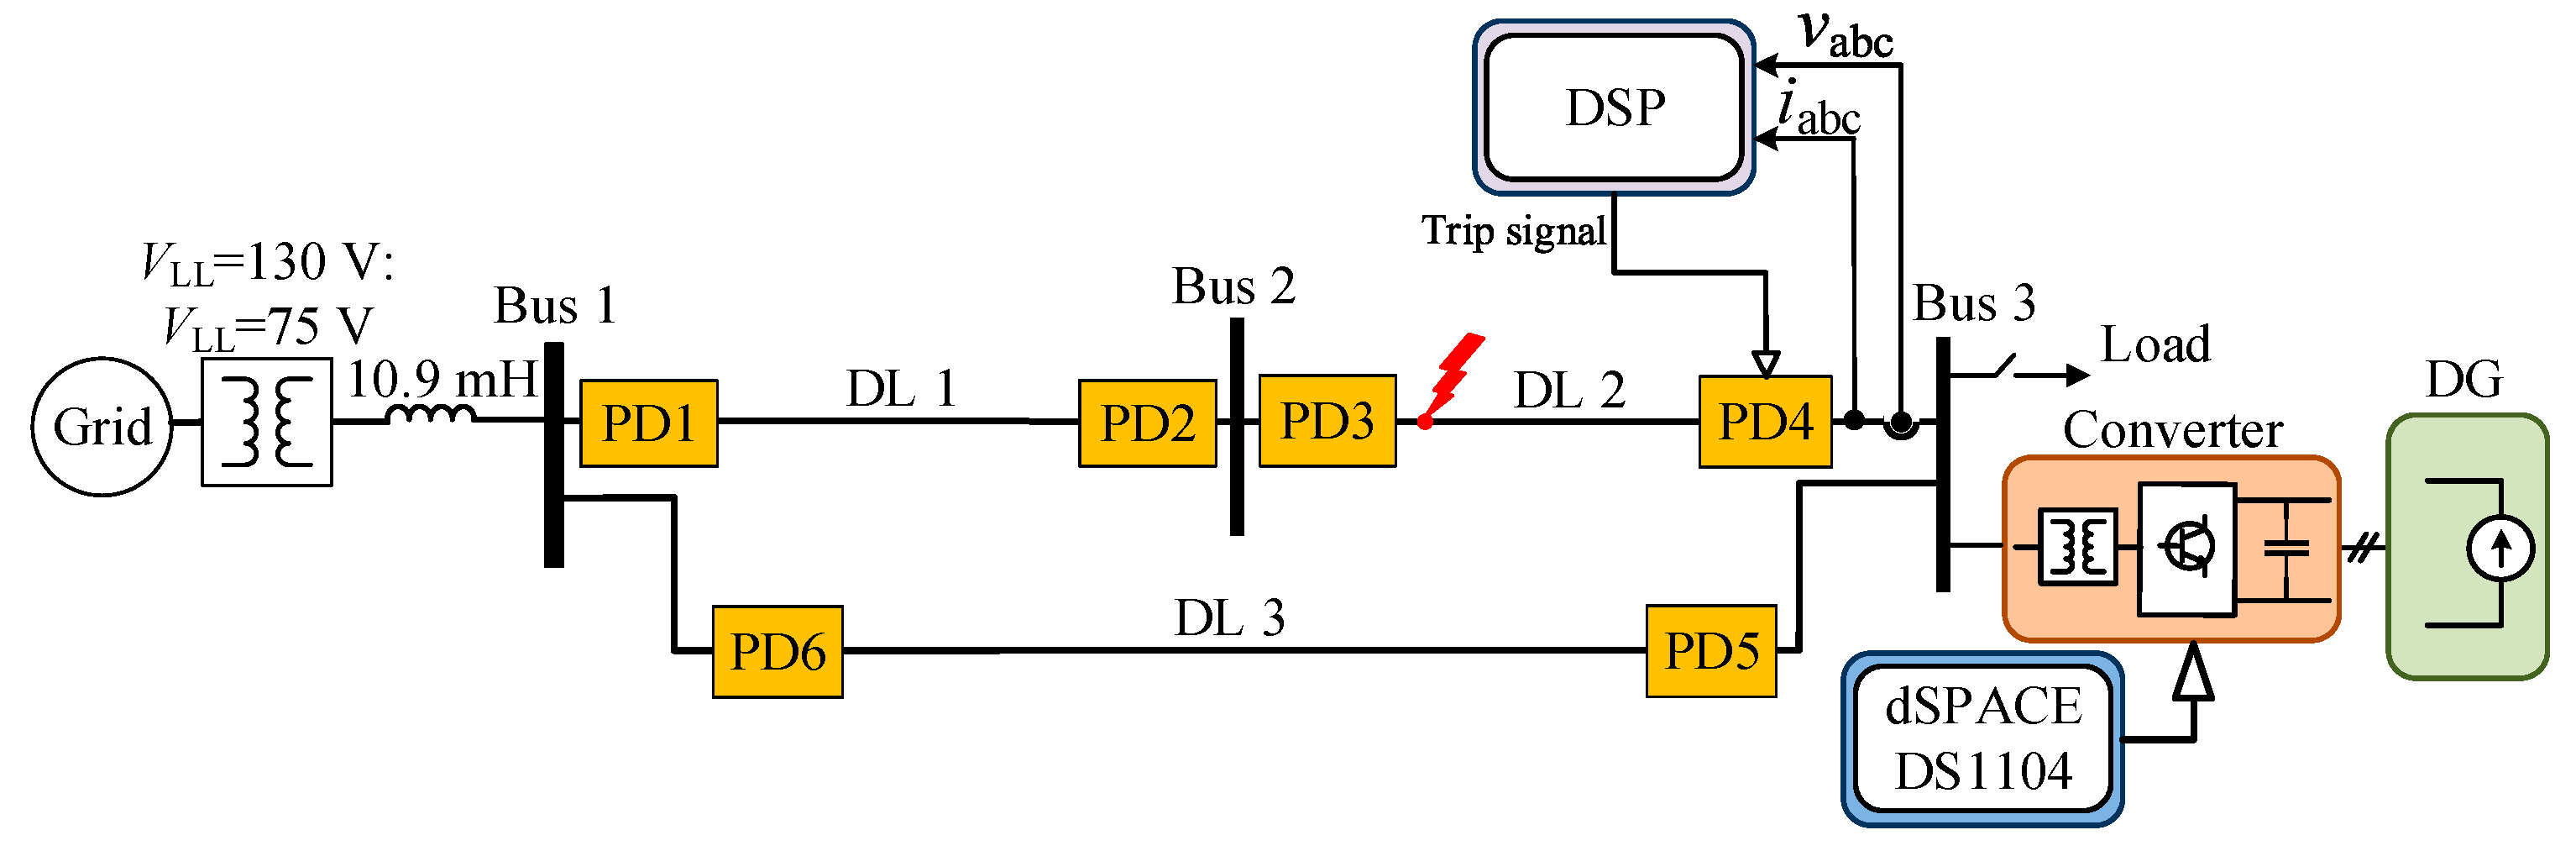
This section delineates the experimental validation of the proposed methodologies through the utilization of a physically scaled grid in an alternative grid configuration. In order to experimentally evaluate the proposed method, a model that replicates the response and dynamic behavior of the analyzed ring and radial grid was developed in the laboratory. An examination was conducted on two distinct network configurations, a ring grid and a radial grid, both with and without DGs. The suggested approach was executed utilizing a DSP-based numerical relay. Following the processing of sensor measurement data and execution of algorithms, the appropriate decision regarding trip signals was generated. In the analyzed radial grids, a solid-state relay (SSR) served as the PD; in the analyzed ring grids, a mechanical relay was utilized in place of the SSR. The ring grid implemented in the laboratory is illustrated in Figure 23. The parameters of the devices utilized to establish the grid are presented in Table 6. To streamline the experiment while ensuring that the overall analysis remained unaffected by the symmetry, aggregated lines were utilized to construct the grid in the laboratory. Nonetheless, analogous performance was attained. In addition, as illustrated in Figure 23, an inductor was positioned prior to bus 1 in order to replicate the grid impedance.
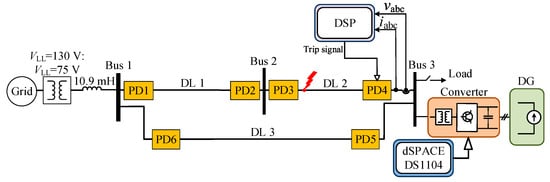
Figure 23.
Laboratory implementation of ring grid.
Table 6.
List of components and their parameters for the grid.
The goal is to perfectly correlate the constructed laboratory system and the real system regarding voltages, currents, and impedances. The actual DS grid has the following base values: VBase = 20 kV, SBase = 25 MVA, and IBase = 721.69 A. For both systems, the base values are presented in Table 7. The objective is to calibrate the laboratory base values to operate at lower voltages and currents; however, the resulting values remain consistent with those acquired from the actual grid. The selection of these values ensures that the steady-state voltage and current in both grids are identical.
Table 7.
A comparison of the parameters of the actual grid and the laboratory grid.
Table 8 presents the parameters of the laboratory grid, while Table 7 presents a comparison between these values and the observed real grids. In the laboratory, two grid configurations are implemented and evaluated to simulate the actual analyzed grid: (1) A three-line radial grid in its entirety, as illustrated in Figure 24. One DL is represented by DL1, two DLs by DL2, and three DLs by DL3. (2) The ring grid, as illustrated in Figure 25, is composed of three lines in order to simulate the actual analyzed grid. Multiple grid configurations that modify load consumption, DG penetration, fault locations, fault types, and the configuration of HV/MV transformers are utilized to assess the system.
Table 8.
System parameters.
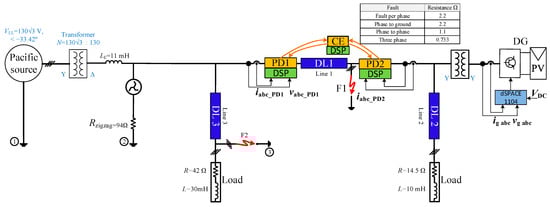
Figure 24.
Complete radial grid.
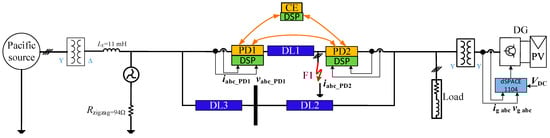
Figure 25.
Ring grid.
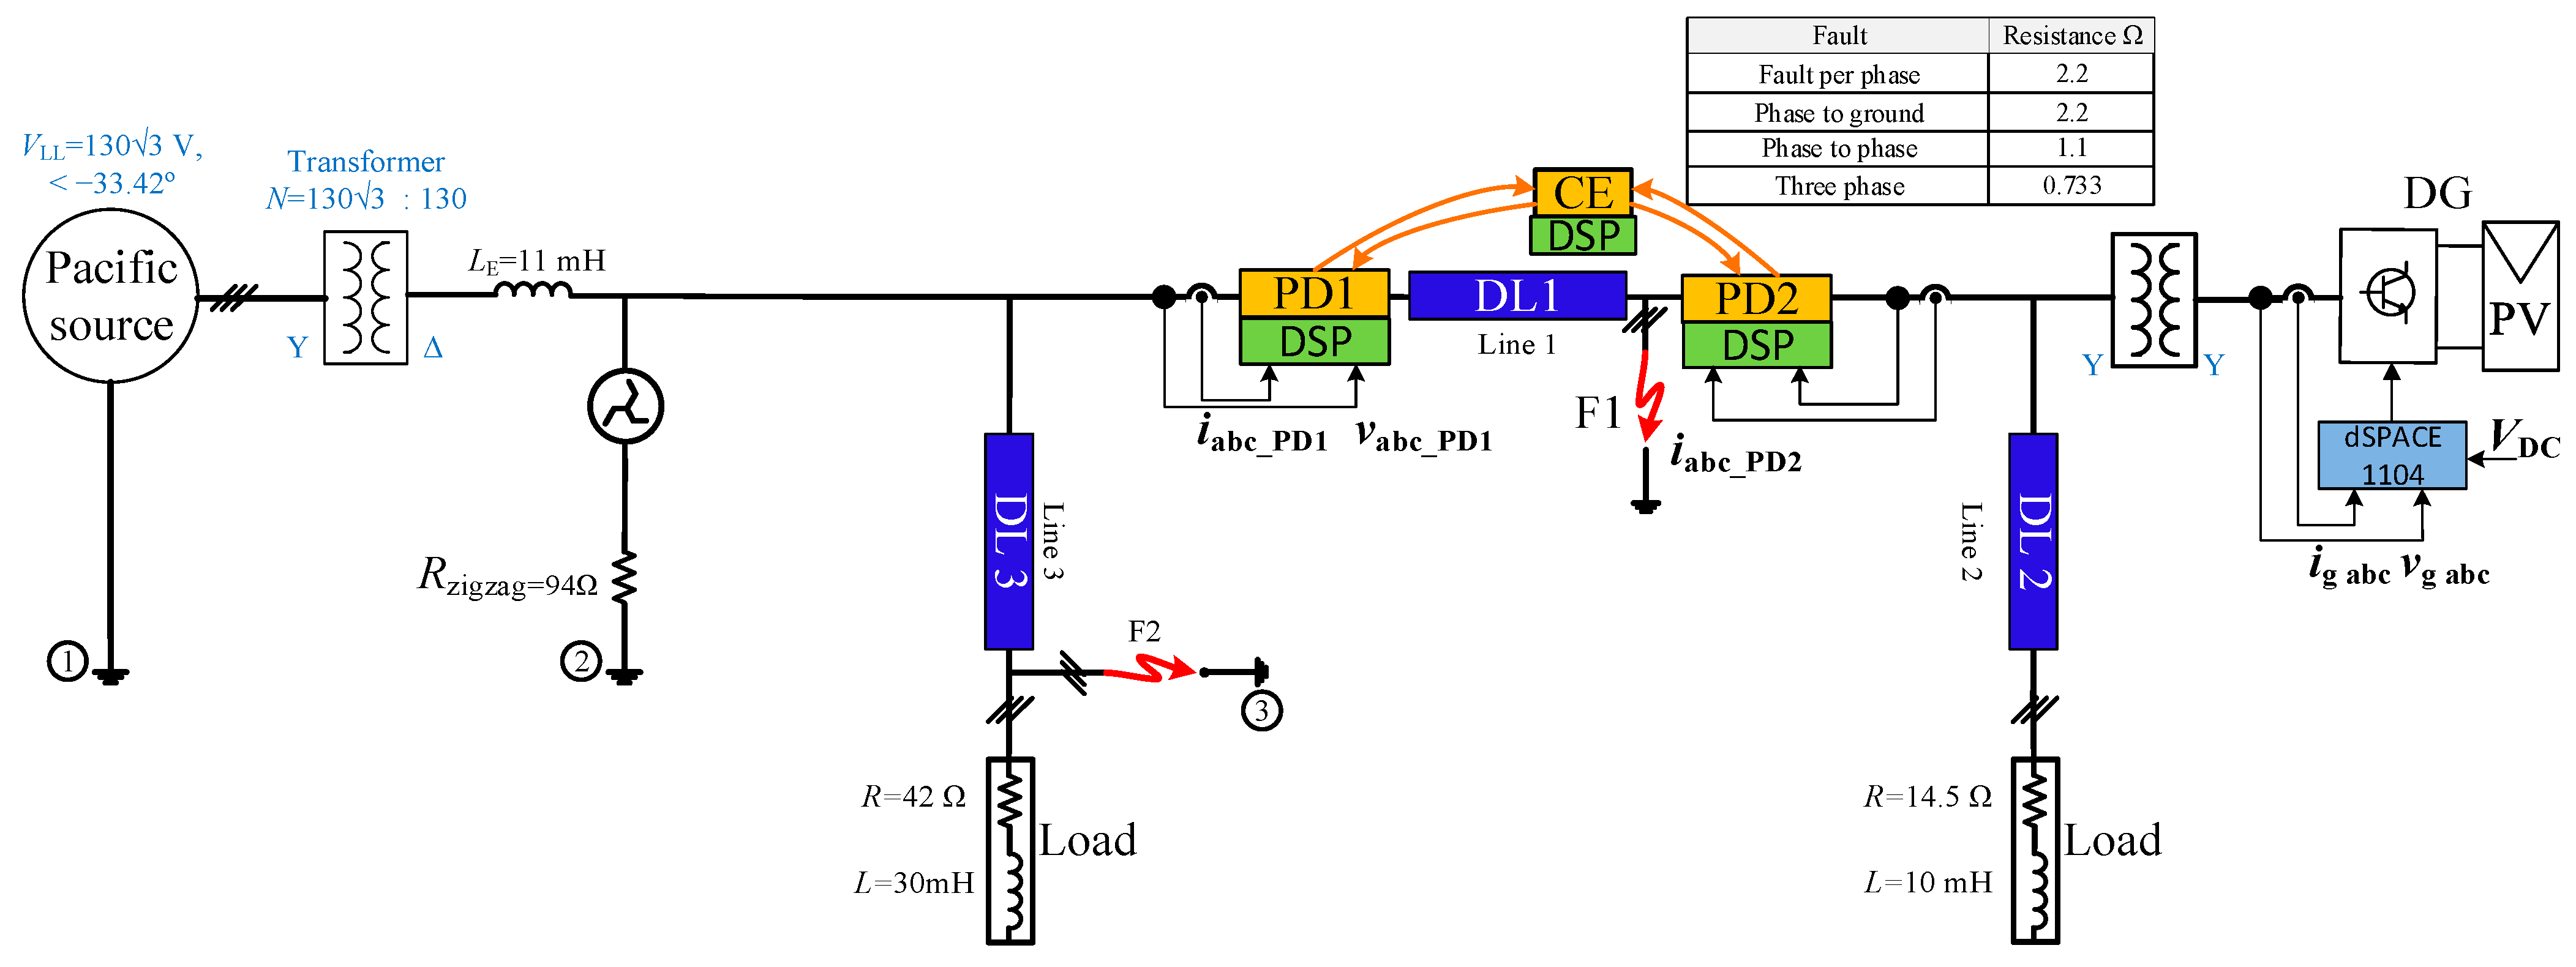
Figure 26 illustrates the experimental laboratory assembly of an equivalent system. The CE and ZO protection algorithms have been implemented using three DSPs of the TMS320F28335 type. ControlDesk and dSPACETM DS1104 were used to implement the inverter control. Utilizing the MatlabTM software, all of the protection algorithms and inverter control have been developed. Due to the absence of DSPs in each line, the data corresponding to the remaining PDs are imposed in the DSP of the CE controller.

Figure 26.
The laboratory setup.
Figure 27 also provides the trip signals for the LO and CE-ZO protection strategies for symmetrical faults when the fault occurs at the F1 and F2. CE-ZO almost gives the same results in this case, while the LO is worse due to the trip curve.
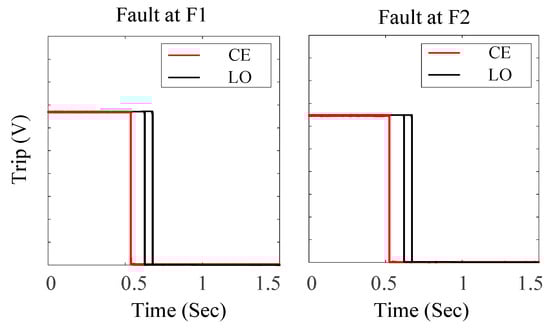
Figure 27.
Digital output of LO, and CE-ZO with DG during three-phase fault.
The performance of the CE-ZO algorithm has been evaluated for both types of faults, as illustrated in Figure 28 and Figure 29. The fault locations are indicated in Figure 25 at DL1 or DL2. The abc voltages and currents for both PDs at each end of the faulted line are depicted in the figures. Furthermore, the trip signal in opposition to the fault is displayed in the third row. The CE acquires the data of a single line as well as the data of the additional PDs imposed in the CE controller’s DSP.
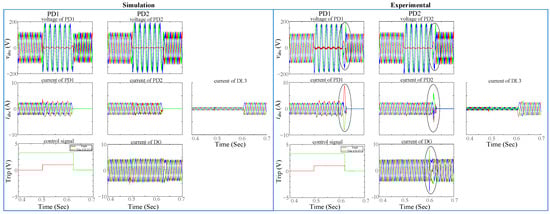
Figure 28.
CE-ZO behavior in the presence of a single-phase to ground fault at DL1.
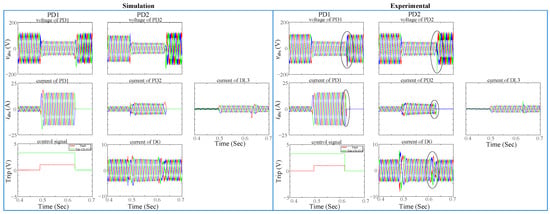
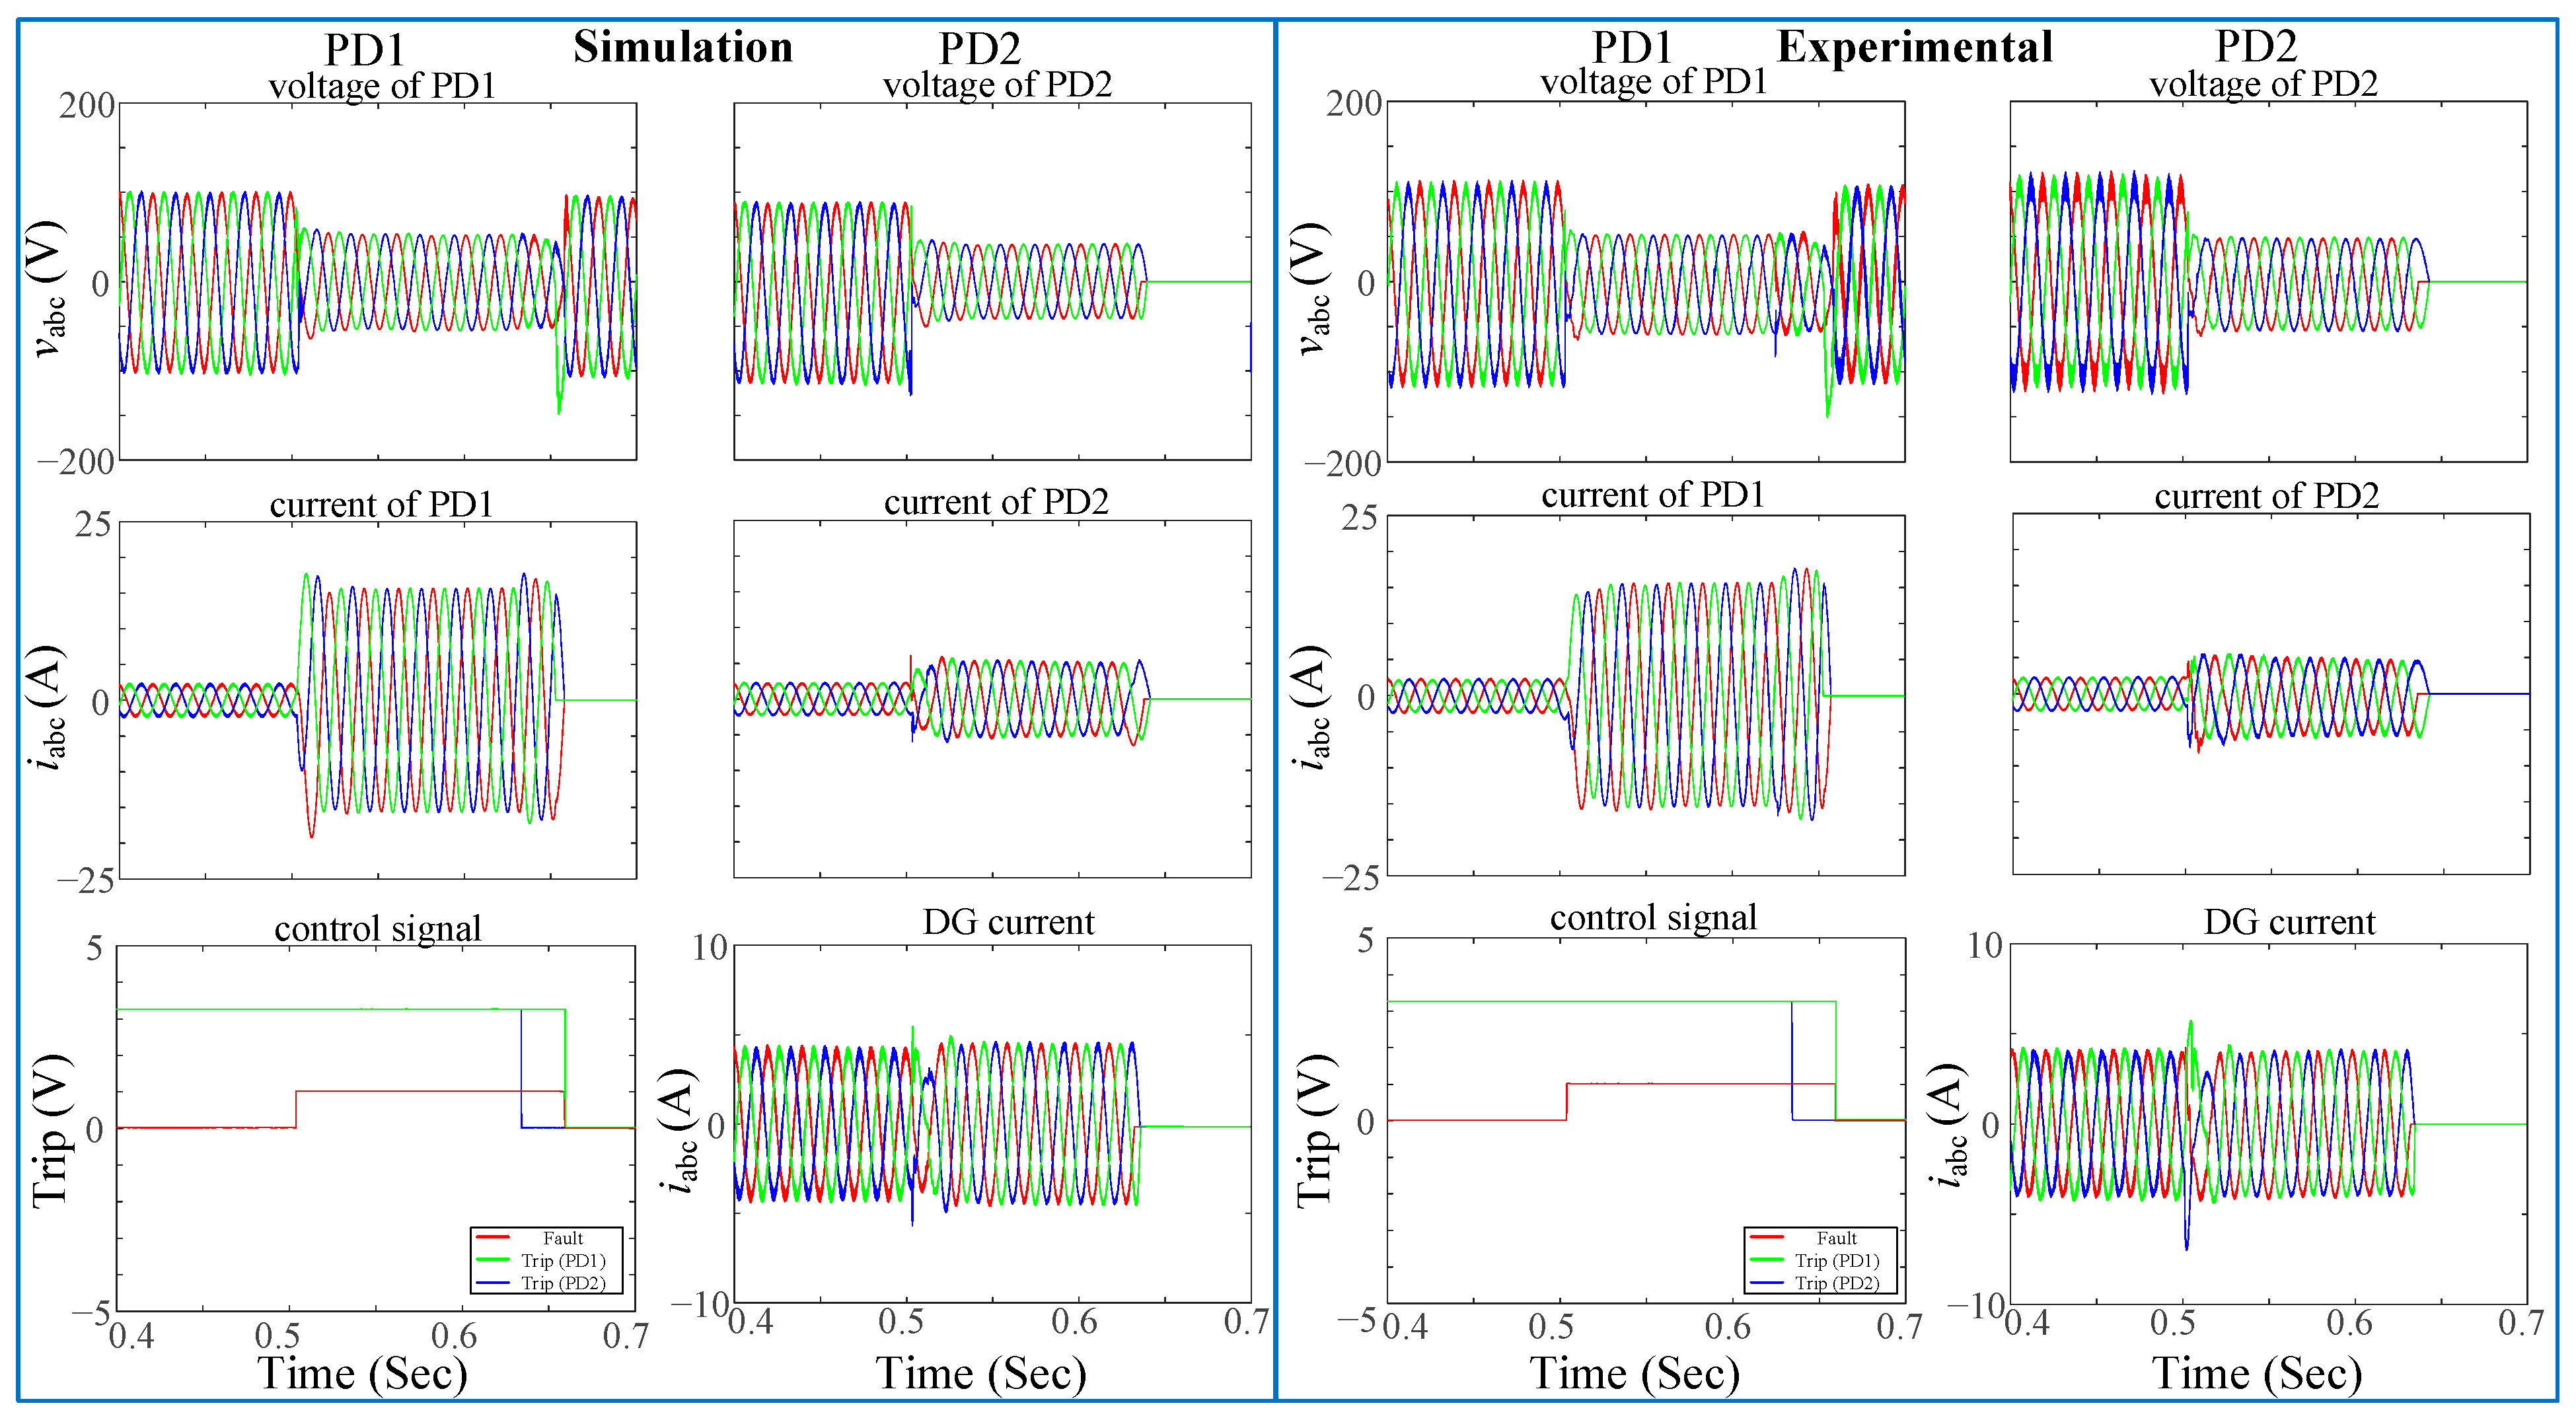
Figure 29.
The response of CE-ZO to a three-phase fault occurring at DL1.
The experimental abc currents of PD1 and PD2 in the second row and third column of Figure 28 and Figure 30, respectively, differ from the simulated result in terms of overcurrent. The substitution of mechanical switches for SSRs in ring grids has caused this. In order to obtain a similar behavior to the experimental results, especially at the disconnection time, a mechanical switch model could be used in the simulation. However, the model of the mechanical switch is out of the scope of this research. The proposed protection algorithms, nevertheless, remain unaffected by this modification, as their operation is not contingent upon the type of switch.
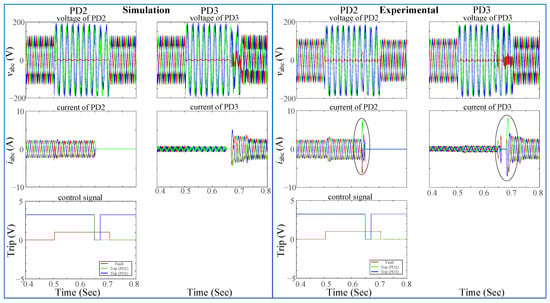
Figure 30.
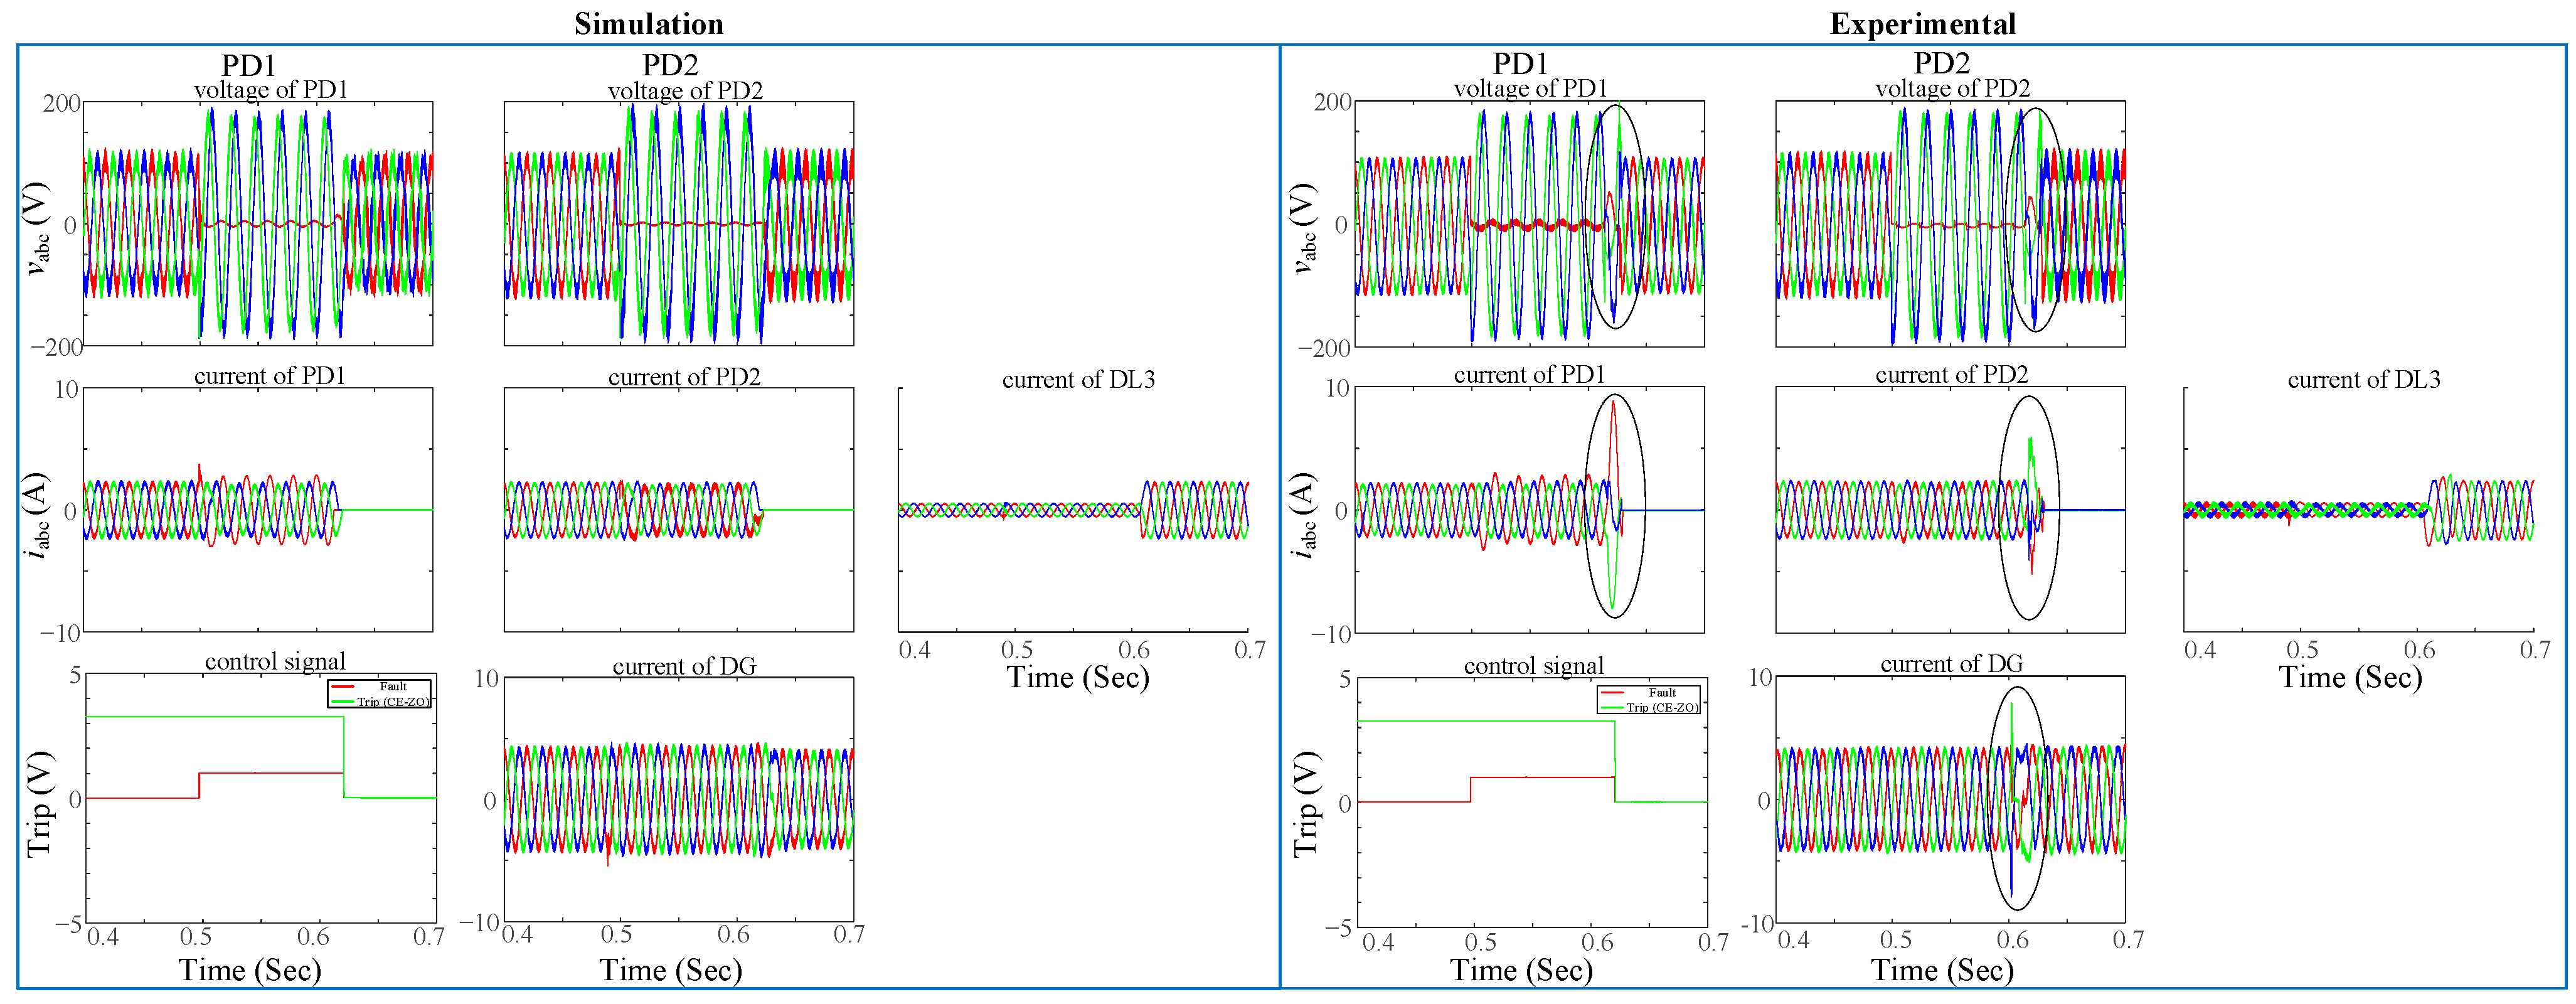
Behavior of LO in the absence of a recloser during a single-phase to ground fault at DL1.
There is a concurrence between the experimental and simulation outcomes depicted in Figure 28 and Figure 29. The injected current and voltage are disturbed due to the precise model and commutation frequency of the converter. Furthermore, the DLs are directly connected to the inverter of the DG. Connecting the two circuits via a Y-Y transformer to isolate them is an additional concept for future research.
The fault location was at F1 or F2. The difference between simulation and experimental observations throughout steady-state, fault, and recovery periods is 5% for instantaneous abc voltages and 2% for instantaneous abc currents. The protection algorithm of the LO algorithm has been evaluated under both conditions—with and without a recloser. Without the recloser algorithm, the behavior of the LO algorithm for PD2 and PD3 is illustrated in Figure 30. The connections between a DG and the ring grid result in alterations to the values of the positive- and negative-sequence voltages. Figure 31 illustrates how the LO algorithm interacts with the recloser algorithm. Specifically, the recloser algorithm is utilized here.
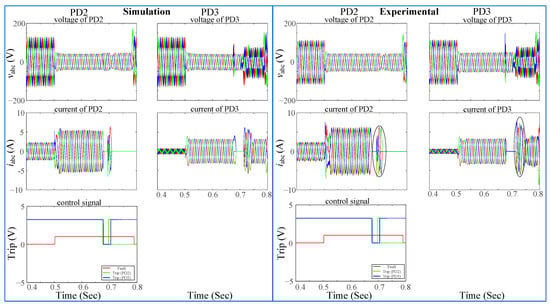
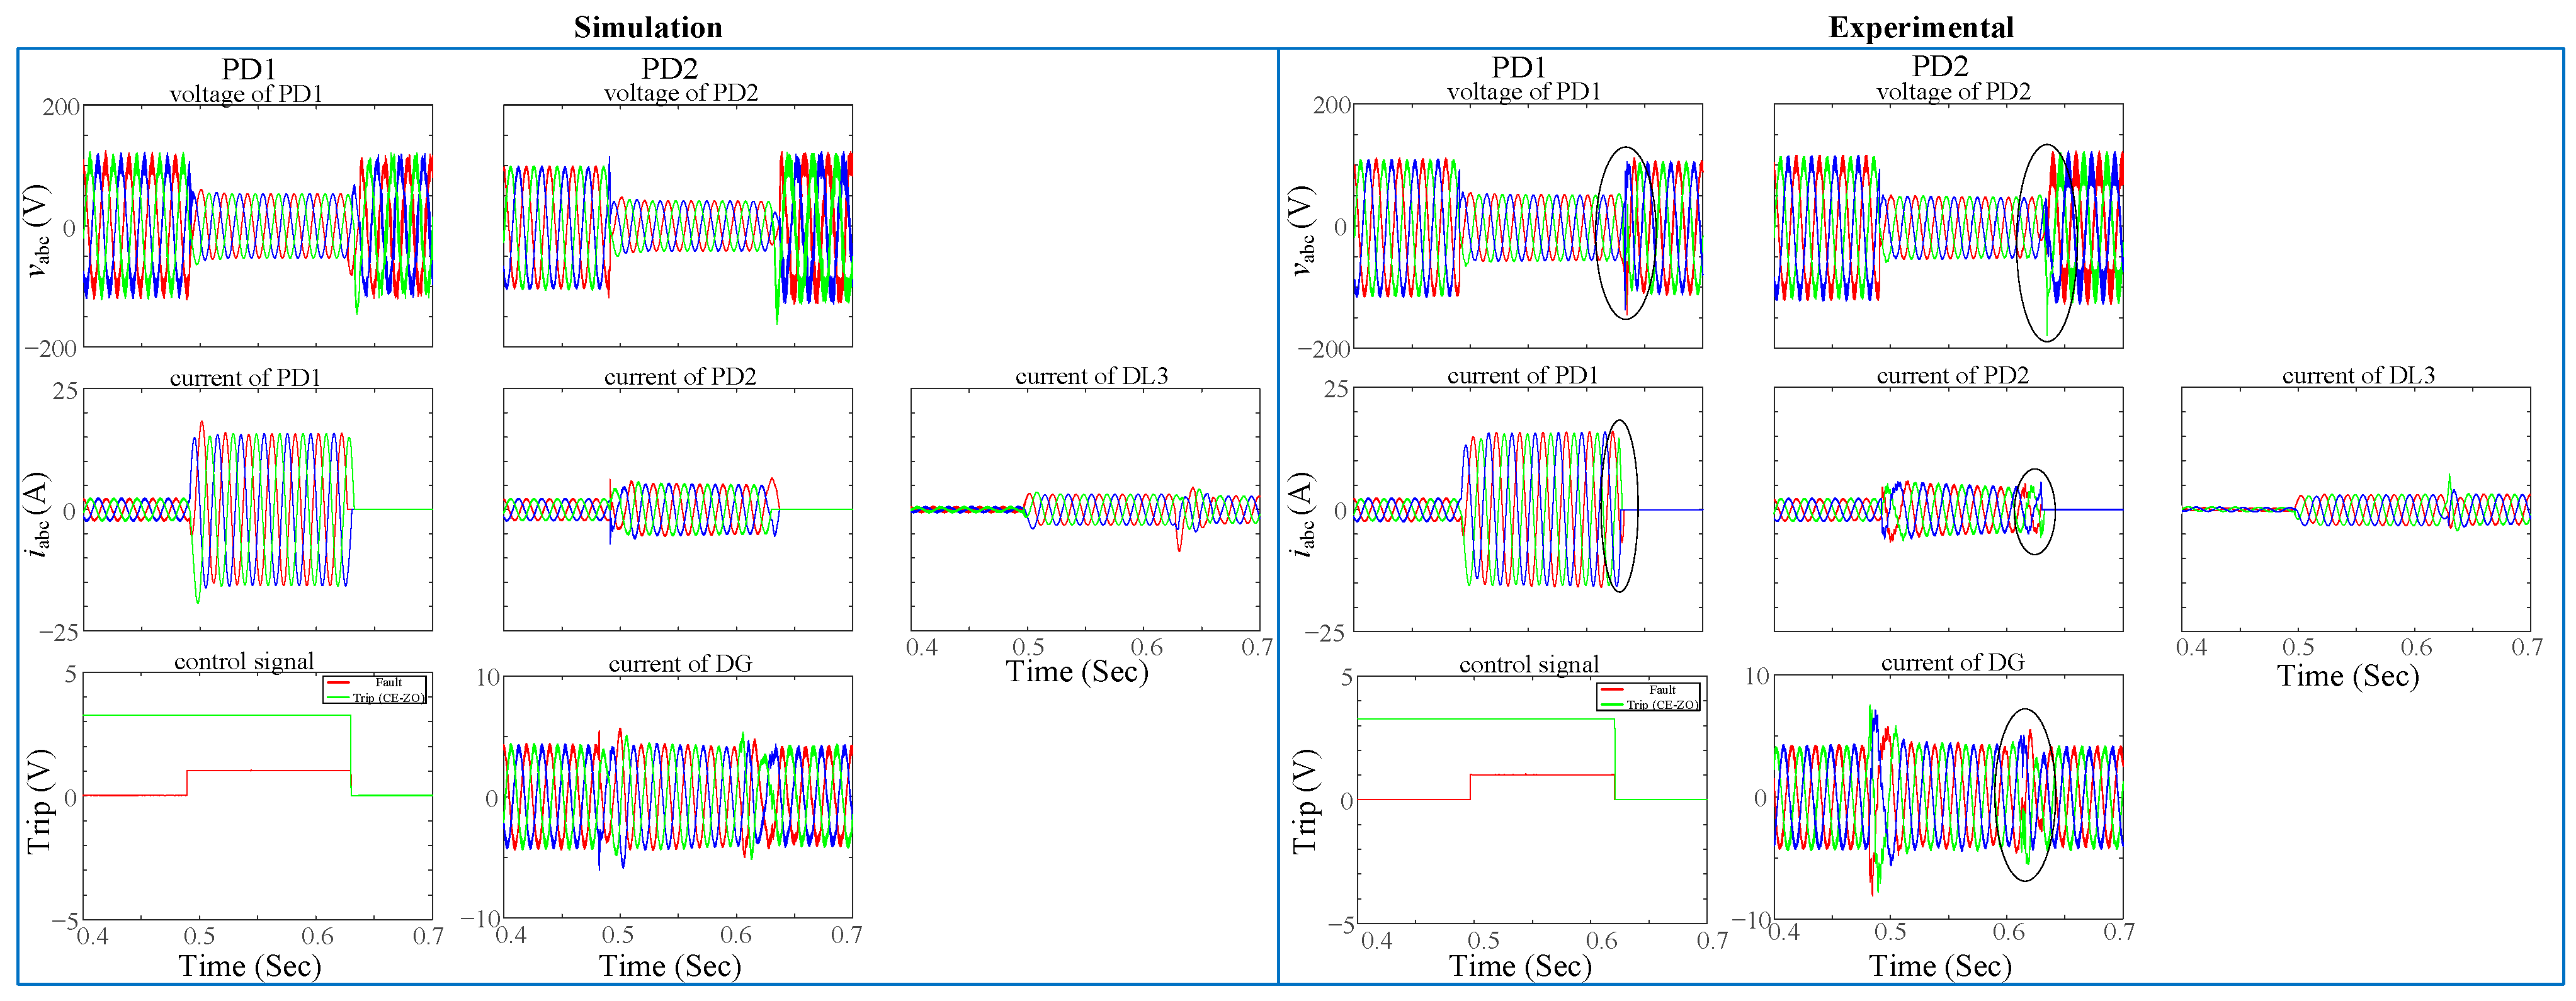
Figure 31.
Recloser behavior of the LO in the presence of a three-phase fault at DL1.
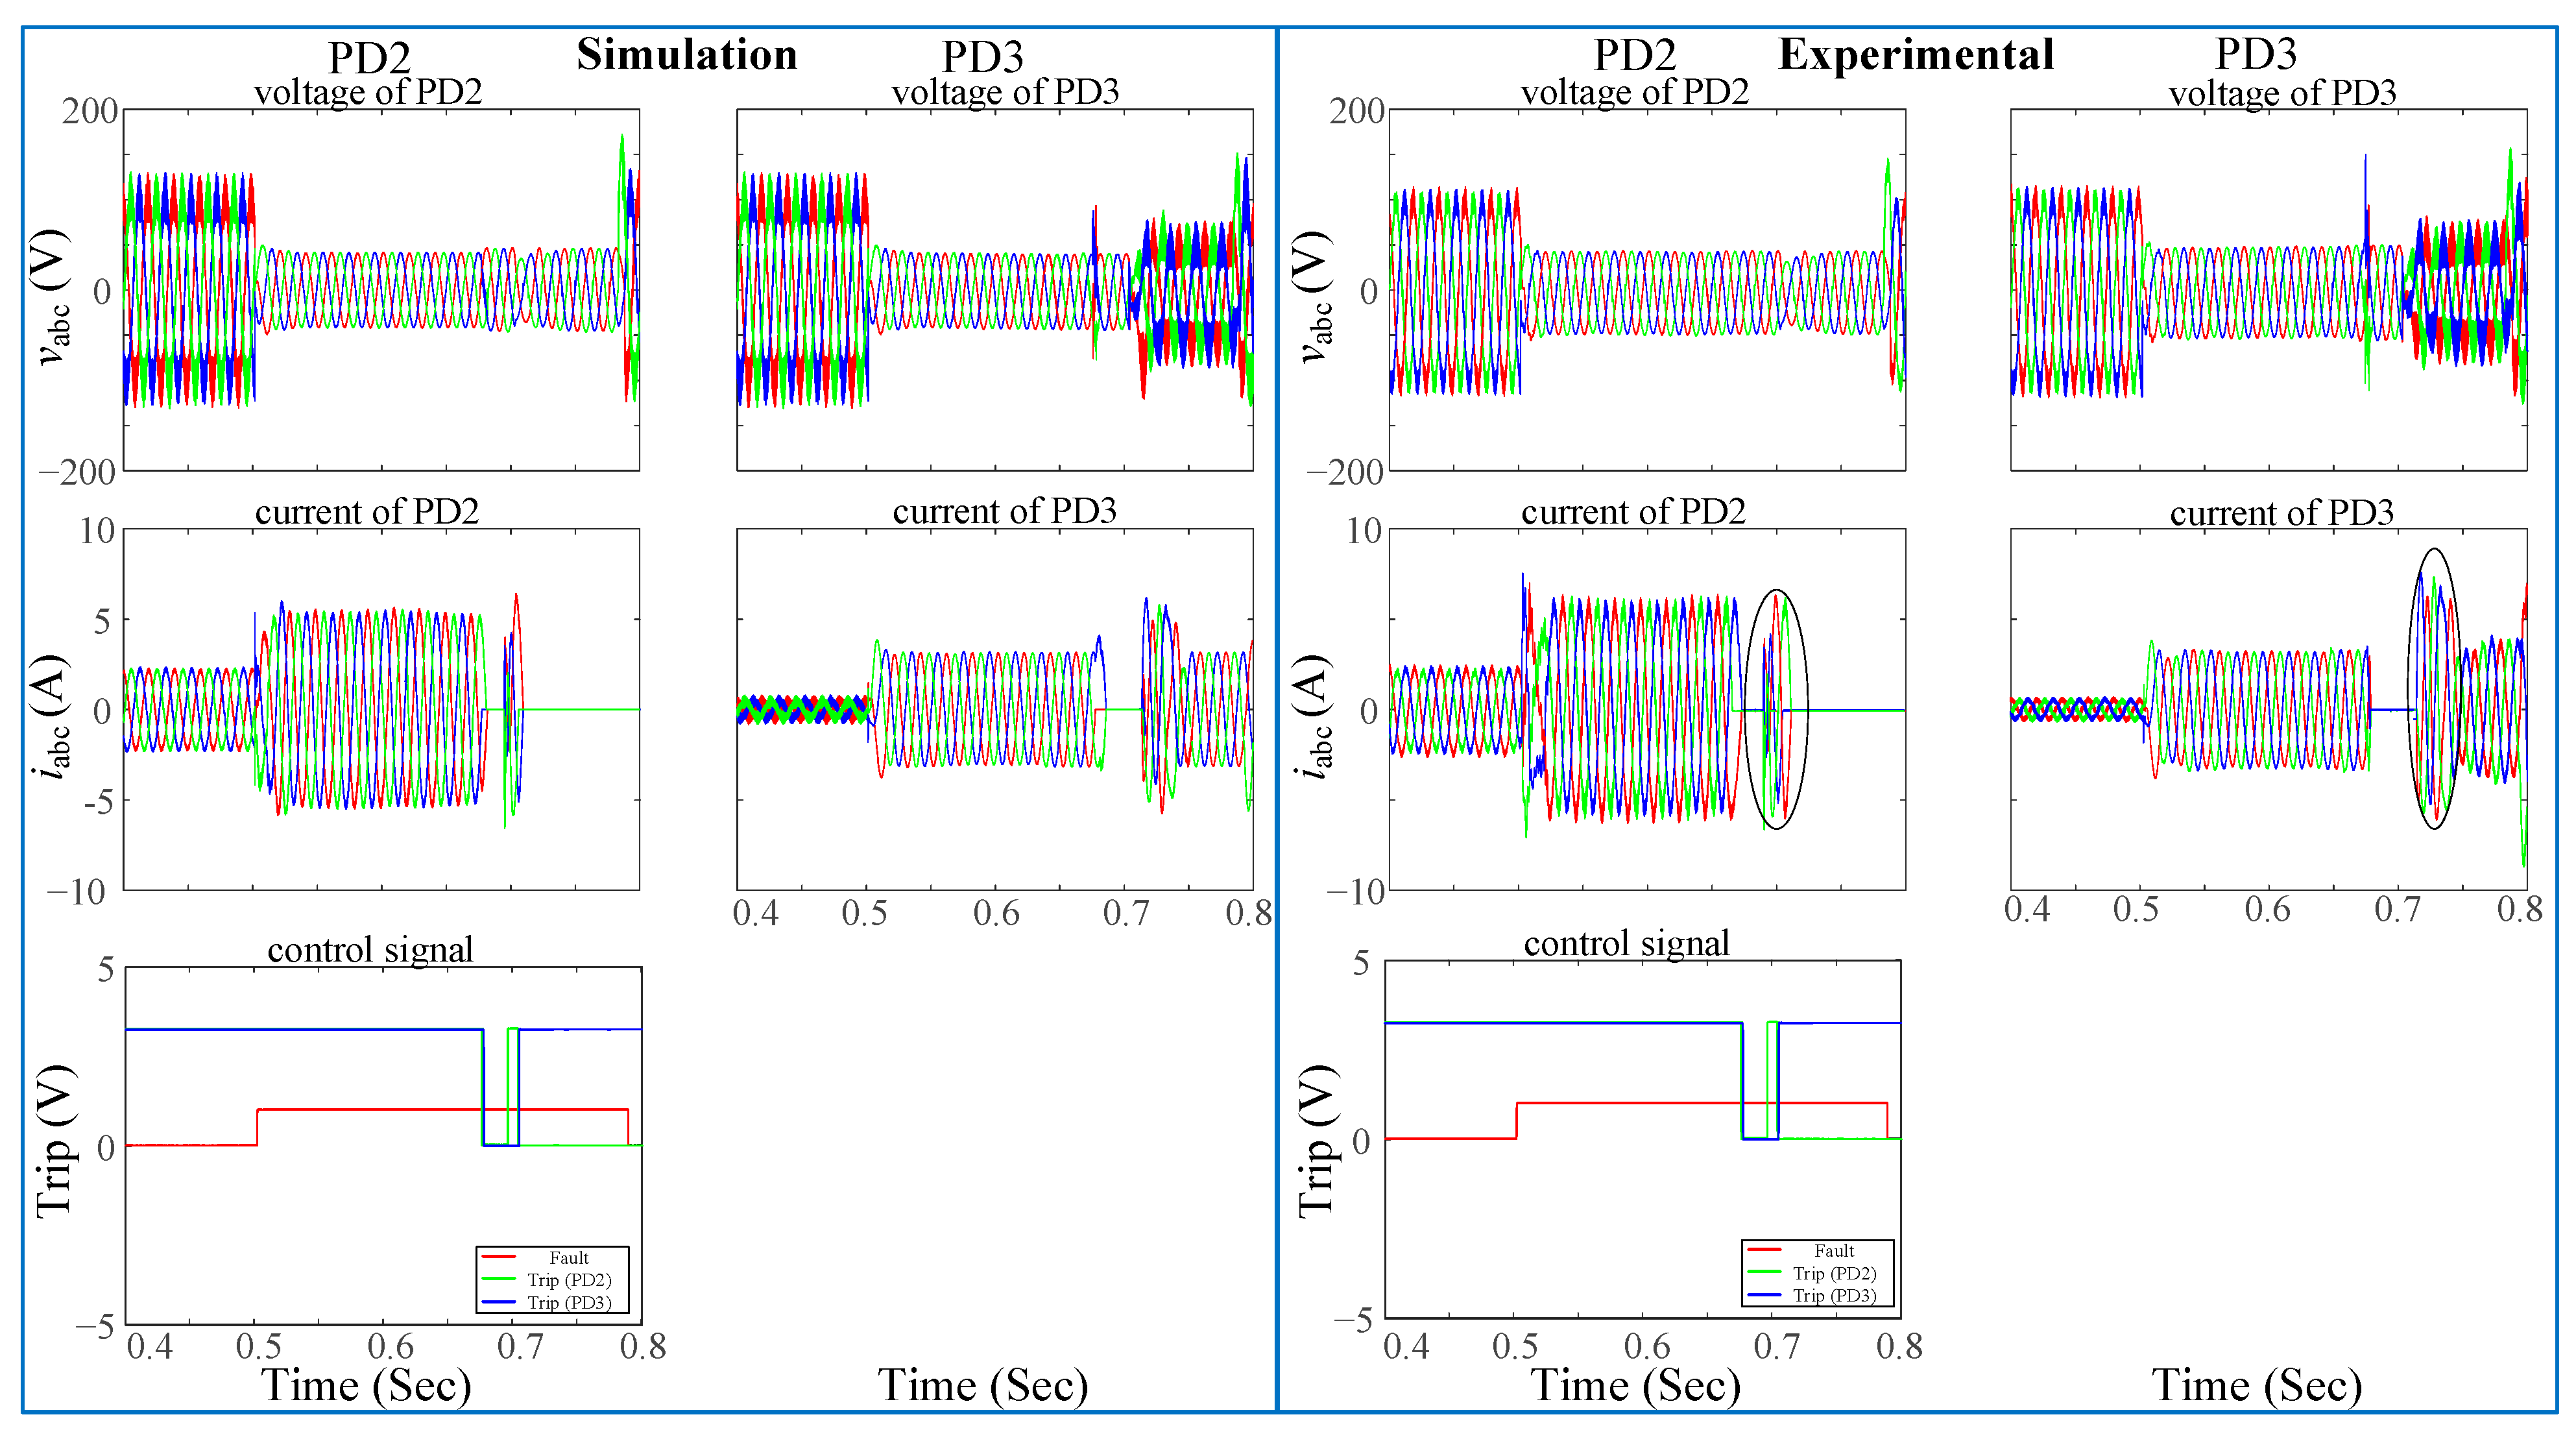
Figure 32 displays the trip signals, abc voltages, and currents at PD1 and PD2 at each end of DL1. The behavior of the LO algorithm for a three-phase faulty is demonstrated. The fault being close to the end of the line will cause PD2 to be disconnected first. In this scenario, the main grid and the DG would contribute to the value of the short-circuit current. An evaluation of the protection algorithms for symmetrical three-phase and unsymmetrical single-phase to-ground faults has been conducted.
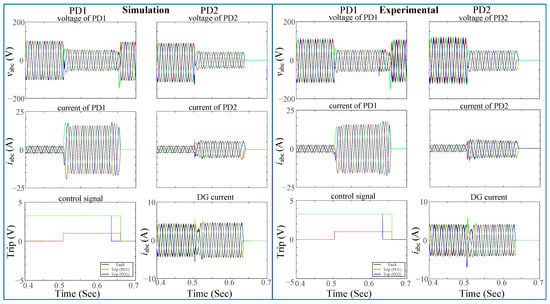
Figure 32.
Behavior of LO control for three-phase fault with BCC.
Table 9 illustrates different protection techniques from different aspects, including the DG connection, the grid configuration, and the speed of tripping decision.
Table 9.
Comparison between different protection strategies.
6. Conclusions
Different algorithms for fault location in the MV DS ring grid with high DG penetration have been proposed in this study in order to prevent unintended tripping when inverter-based DGs are connected to the grid. Three protection algorithms comprise the proposed protection scheme: a CE, ZO, and LO. The three algorithms that are provided are capable of precisely identifying the location of a fault and isolating the defective component of the system.
All grid-wide PD data are collected and transmitted to a centralized controller via the CE. Its integration of the entire system’s security into a single device is its primary benefit. However, in the event that data are lost due to inadequate communication, the CE will be unable to pinpoint the precise location of the fault. The ZO, which integrates the data from the two PDs on the same line, is therefore proposed as an outcome of zone control via peer-to-peer communication. In contrast to the CE, which remains fixed to the given grid configuration, this methodology has the capability to accommodate any modifications in the grid. A third protection algorithm, the LO, is proposed that utilizes the local data acquired at each PD to pinpoint the precise location of a fault. Different methods are used based on the fault type, symmetrical or unsymmetrical, calculated using the sequence component. The LO has been suggested to operate independently from the communication between the PD; thus, the protection system can function efficiently in the event of communication loss. The primary benefit of this algorithm is that each PD makes an independent decision, thereby eliminating communication issues. Moreover, each algorithm functions as a redundancy for the others.
A variety of fault resistances, symmetrical and asymmetrical faults, fault locations, and stiff and weak grids were utilized to evaluate the algorithms. The protection strategies could adapt to different grid reconfigurations. Furthermore, comparing simulation results and experimental implementation demonstrated the high efficiency and dependability of the proposed algorithms in various grid circumstances for radial and ring structures with and without DG penetration.
Author Contributions
Conceptualization: M.B. and S.B.; Funding acquisition: A.A. and S.W.; Investigation: M.B., S.B., F.C. and J.I.; Methodology: M.B. and S.B.; Software: M.B. and S.B.; Supervision: S.B., F.C. and S.W.; Validation: M.B.; Writing—original draft preparation: M.B. and S.B.; Writing—review and editing: M.B., S.B., F.C., A.A., S.W. and J.I. All authors have read and agreed to the published version of the manuscript.
Funding
This work was supported by the Ningbo Natural Science Foundation Program with project code 2023J191.
Institutional Review Board Statement
Not applicable.
Informed Consent Statement
Not applicable.
Data Availability Statement
Data are contained within the article.
Conflicts of Interest
Javier Iglesias is employed by ABB Power Grids Spain S.A.U. The authors declare no conflicts of interest.
References
- Yeh, C.-C.; Chen, C.-S.; Ku, T.-T.; Lin, C.-H.; Hsu, C.-T.; Chang, Y.-R.; Lee, Y.-D. Design of Special Protection System for an Offshore Island with High-PV Penetration. IEEE Trans. Ind. Appl. 2016, 53, 947–953. [Google Scholar] [CrossRef]
- Cho, N.; Yoon, M.; Choi, S. Impact of Transformer Topology on Short-Circuit Analysis in Distribution Systems with Inverter-Based Distributed Generations. Sustainability 2022, 14, 9781. [Google Scholar] [CrossRef]
- Jou, H.-L.; Wu, J.-C.; Wu, K.-D.; Chiang, W.-J.; Chen, Y.-H. Analysis of Zig-Zag Transformer Applying in the Three-Phase Four-Wire Distribution Power System. IEEE Trans. Power Deliv. 2005, 20, 1168–1173. [Google Scholar] [CrossRef]
- Barreto, R.M. Transformers Connections (Distribution of Electric Energy); Independently Published, Online Version; 2019; pp. 1–74. [Google Scholar]
- Parise, G.; Parise, L.; Martufi, M.; Su, C.-L.; Ben Chavdarian, P.; Panetta, S.A.R. Neutral Grounding in MV Transformers Substations for Cranes Service. IEEE Trans. Ind. Appl. 2016, 52, 2070–2076. [Google Scholar] [CrossRef]
- Ates, Y.; Uzunoglu, M.; Karakas, A.; Boynuegri, A.R.; Nadar, A.; Dag, B. Implementation of adaptive relay coordination in distribution systems including distributed generation. J. Clean. Prod. 2016, 112, 2697–2705. [Google Scholar] [CrossRef]
- NTP-GEN. Technical and Safety Conditions of the FECSA ENDESA Distribution Facilities; 2007; pp. 14510–14512. [Google Scholar]
- SRZ001: Particular Technical Specifications of HV/MV Substations; Laboratorio Central Oficial de Electrotecnia: Madrid, Spain, 2018.
- Kawoosa, D.P.A.I. A Review of Cyber Securities in Smart Grid Technology. In Proceedings of the 2nd International Conference on Computation, Autonation and Knowledge Management (ICCAKM 2021), Dubai, United Arab Emirates, 19–21 January 2021; pp. 6–11. [Google Scholar]
- El Mrabet, Z.; Kaabouch, N.; El Ghazi, H.; El Ghazi, H. Cyber-security in smart grid: Survey and challenges. Comput. Electr. Eng. 2018, 67, 469–482. [Google Scholar] [CrossRef]
- Meegahapola, L.; Sguarezi, A.; Bryant, J.S.; Gu, M.; Conde, D.E.R.; Cunha, R.B.A. Power System Stability with Power-Electronic Converter Interfaced Renewable Power Generation: Present Issues and Future Trends. Energies 2020, 13, 3441. [Google Scholar] [CrossRef]
- Faquir, D.; Chouliaras, N.; Sofia, V.; Olga, K. Cybersecurity in smart grids, challenges and solutions. AIMS Electron. Electr. Eng. 2021, 5, 24–37. [Google Scholar]
- Sharaf, H.M.; Zeineldin, H.H.; El-Saadany, E. Protection Coordination for Microgrids with Grid-Connected and Islanded Capabilities Using Communication Assisted Dual Setting Directional Overcurrent Relays. IEEE Trans. Smart Grid 2018, 9, 143–151. [Google Scholar] [CrossRef]
- Gururajapathy, S.; Mokhlis, H.; Illias, H. Fault location and detection techniques in power distribution systems with distributed generation: A review. Renew. Sustain. Energy Rev. 2017, 74, 949–958. [Google Scholar] [CrossRef]
- Manohar, M.; Koley, E.; Ghosh, S. Enhancing the reliability of protection scheme for PV integrated microgrid by discriminating between array faults and symmetrical line faults using sparse auto encoder. IET Renew. Power Gener. 2018, 13, 308–317. [Google Scholar] [CrossRef]
- Karimi, H.; Shahgholian, G.; Fani, B.; Sadeghkhani, I.; Moazzami, M. A protection strategy for inverter-interfaced islanded microgrids with looped configuration. Electr. Eng. 2019, 101, 1059–1073. [Google Scholar] [CrossRef]
- He, J.; Liu, L.; Xu, Y.; Ding, F.; Zhang, D. A two-step protection algorithm for smart distribution systems with DGs. Int. Trans. Electr. Energy Syst. 2018, 28, e2506. [Google Scholar] [CrossRef]
- Mahamedi, B.; Eskandari, M.; Fletcher, J.E.; Zhu, J. Sequence-Based Control Strategy with Current Limiting for the Fault Ride-Through of Inverter-Interfaced Distributed Generators. IEEE Trans. Sustain. Energy 2018, 11, 165–174. [Google Scholar] [CrossRef]
- Kamel, T.; Biletskiy, Y.; Chang, L. Fault Diagnoses for Industrial Grid-Connected Converters in the Power Distribution Systems. IEEE Trans. Ind. Electron. 2015, 62, 6496–6507. [Google Scholar] [CrossRef]
- Al Hanaineh, W.; Matas, J.; El Mariachet, J.; Xie, P.; Bakkar, M.; Guerrero, J.M. A THD-Based Fault Protection Method Using MSOGI-FLL Grid Voltage Estimator. Sensors 2023, 23, 980. [Google Scholar] [CrossRef]
- Bakkar, M.; Bogarra, S.; Córcoles, F.; Iglesias, J. Overcurrent protection based on ANNs for smart distribution networks with grid-connected VSIs. IET Gener. Transm. Distrib. 2020, 15, 1159–1174. [Google Scholar] [CrossRef]
- Bakkar, M.; Bogarra, S.; Córcoles, F.; Iglesias, J.; Al Hanaineh, W. Multi-Layer Smart Fault Protection for Secure Smart Grids. IEEE Trans. Smart Grid 2022, 14, 3125–3135. [Google Scholar] [CrossRef]
- Bakkar, M.; Bogarra, S.; Córcoles, F.; Aboelhassan, A.; Wang, S.; Iglesias, J. Artificial Intelligence-Based Protection for Smart Grids. Energies 2022, 15, 4933. [Google Scholar] [CrossRef]
- van der Walt, H.L.; Bansal, R.C.; Naidoo, R. PV based distributed generation power system protection: A review. Renew. Energy Focus 2018, 24, 33–40. [Google Scholar] [CrossRef]
- Manditereza, P.T.; Bansal, R. Renewable distributed generation: The hidden challenges—A review from the protection perspective. Renew. Sustain. Energy Rev. 2016, 58, 1457–1465. [Google Scholar] [CrossRef]
- Shabani, A.; Mazlumi, K. Evaluation of a Communication-Assisted Overcurrent Protection Scheme for Photovoltaic-Based DC Microgrid. IEEE Trans. Smart Grid 2020, 11, 429–439. [Google Scholar] [CrossRef]
- Benmouyal, G.; Meisinger, M.; Burnworth, J.; Elmore, W.; Freirich, K.; Kotos, P.; Leblanc, P.; Lerley, P.; McConnell, J.; Mizener, J.; et al. IEEE standard inverse-time characteristic equations for overcurrent relays. IEEE Trans. Power Deliv. 1999, 14, 868–872. [Google Scholar] [CrossRef]
- VIP400-VIP410. Electrical Network Protection Reference Manual; Schneider-Electric: Bangkok, Thailand, 2013. [Google Scholar]
- Shih, M.Y.; Enríquez, A.C.; Hsiao, T.-Y.; Treviño, L.M.T. Enhanced differential evolution algorithm for coordination of directional overcurrent relays. Electr. Power Syst. Res. 2017, 143, 365–375. [Google Scholar] [CrossRef]
- Mishra, P.; Pradhan, A.K.; Bajpai, P. Adaptive Relay Setting for Protection of Distribution System with Solar PV. In Proceedings of the 2018 20th National Power Systems Conference (NPSC), Tiruchirappalli, India, 14–16 December 2018; pp. 1–5. [Google Scholar]
- Yuan, C.; Haj-Ahmed, M.A.; Illindala, M.S. Protection Strategies for Medium-Voltage Direct-Current Microgrid at a Remote Area Mine Site. IEEE Trans. Ind. Appl. 2015, 51, 2846–2853. [Google Scholar] [CrossRef]
- Adewole, A.C. Investigation of Methodologies for Fault Detection and Diagnosis in Electric Power System Protection. Master’s Thesis, Cape Peninsula University of Technology, Cape Town, South Africa, 2012. [Google Scholar]
- Yogee, G.S.; Mahela, O.P.; Kansal, K.D.; Khan, B.; Mahla, R.; Alhelou, H.H.; Siano, P. An Algorithm for Recognition of Fault Conditions in the Utility Grid with Renewable Energy Penetration. Energies 2020, 13, 2383. [Google Scholar] [CrossRef]
- Pujiantara, R.F.; Pujiantara, M.; Priyadi, A.; Asfani, D.A. Protection coordination using zone selective interlocking method and neural network in IEEE 9 bus plan. In Proceedings of the 2018 International Conference on Information and Communications Technology (ICOIACT), Yogyakarta, Indonesia, 6–7 March 2018; pp. 196–201. [Google Scholar]


Disclaimer/Publisher’s Note: The statements, opinions and data contained in all publications are solely those of the individual author(s) and contributor(s) and not of MDPI and/or the editor(s). MDPI and/or the editor(s) disclaim responsibility for any injury to people or property resulting from any ideas, methods, instructions or products referred to in the content. |
© 2024 by the authors. Licensee MDPI, Basel, Switzerland. This article is an open access article distributed under the terms and conditions of the Creative Commons Attribution (CC BY) license (https://creativecommons.org/licenses/by/4.0/).