Article

A Grid-Wide Comprehensive Evaluation Method of Power Quality Based on Complex Network Theory

1
Hubei Key Laboratory of Power Equipment & System Security for Integrated Energy, Wuhan 430072, China
2
School of Electrical Engineering and Automation, Wuhan University, Wuhan 430072, China
3
Electric Power Research Institute, State Grid Fujian Electric Power Co., Ltd., Fuzhou 350007, China
4
State Grid Fujian Electric Power Co., Ltd., Fuzhou 350007, China
*
Author to whom correspondence should be addressed.
Energies 2024, 17(13), 3193; https://doi.org/10.3390/en17133193
Submission received: 4 June 2024 / Revised: 21 June 2024 / Accepted: 26 June 2024 / Published: 28 June 2024
(This article belongs to the Special Issue Power Quality and Disturbances in Modern Distribution Networks)

Abstract

:
To achieve a hierarchical and quantitative evaluation of grid-wide power quality in the distribution network, reflecting the overall power quality level of the distribution network, a comprehensive evaluation method for power quality in a grid-wide system based on complex network theory is proposed. Firstly, based on the propagation characteristics of power quality disturbances, a power quality evaluation index system is constructed. Secondly, to reflect the constraint effect of the local power quality level of nodes on the overall power quality level of the distribution system, corresponding indices such as improved node degree, improved node electrical betweenness, and node self-healing capability are proposed based on complex network theory, and the power quality influence degree of nodes is calculated. Then, the GRA-ANP (Grey Relational Analysis–Analytic Network Process) subjective weight calculation method is improved by introducing grey relational analysis to address the impact of differences in different decision-making results. Based on power quality monitoring data, the entropy weight method is used for objective weighting. To avoid the partiality of a single weight evaluation result, the game equilibrium algorithm is employed to calculate the comprehensive weight of each power quality index. Subsequently, considering the correlation and dependency among indices, the VIKOR (VIseKriterijumska Optimizacija I Kompromisno Resenje) method is used to obtain the power quality grade of each node. Combining this with the calculation of the power quality influence degree of nodes, the overall power quality grade of the distribution network is determined, achieving a hierarchical and quantitative evaluation of power quality in the entire distribution system. Finally, through a case study analysis of an improved 13-node distribution network, it is verified that the proposed method can fully extract data information and produce comprehensive and accurate power quality assessment results by comparing it with other methods. This provides strong support for the safe and stable operation of the distribution system and the subsequent optimization and management of power quality.

1. Introduction

In recent years, with the gradual industrialization of renewable energy and power electronic devices, represented by photovoltaic and wind power generation equipment, and the increasing penetration rate of flexible sources such as electric vehicles and energy storage in distribution systems, high levels of integration of these new types of loads have posed more severe challenges to the stable operation and power quality of distribution networks [1,2,3].
On the power supply side, renewable energy generation is highly influenced by external natural factors such as wind, sunlight, and temperature. This results in intermittent, fluctuating, and stochastic output characteristics, thereby causing disturbances in power quality within distribution systems, including voltage fluctuations, frequency instability, and phase imbalances. On the load side, electric vehicles and energy storage systems no longer follow the regular electricity consumption patterns seen with traditional loads. This irregularity makes it challenging to predict and manage energy consumption, exacerbating issues related to energy integration and load balancing within distribution systems [4,5,6]. Therefore, to ensure the safe and stable operation of distribution systems under the context of increasing integration of renewable energy and flexible loads, it is crucial to establish a scientifically sound system for evaluating power quality indicators. Conducting comprehensive assessments of power quality across distribution networks is of great engineering significance for guaranteeing high-quality electricity supply to users, guiding efforts in power quality optimization, and facilitating initiatives like differentiated pricing in the electricity market [7,8].
In recent years, domestic and international scholars have conducted extensive research on the comprehensive assessment of power quality in distribution systems. Studies have shown that power quality in distribution systems is a multifactorial and multi-indicator aggregate, making it difficult to determine the overall power quality level of the distribution system based on a single indicator. Therefore, it is necessary to conduct a comprehensive evaluation of power quality from multiple perspectives and dimensions. The results of a comprehensive power quality assessment are closely related to the selection of evaluation indicators, the establishment of assessment models, and the adoption of assessment methods [9,10,11]. Hence, constructing a complete evaluation index system, adopting reasonable power quality assessment methods, and establishing a comprehensive assessment model are crucial for improving the scientific accuracy of comprehensive assessment results [12].
Currently, power quality assessment indicators are primarily constructed from aspects such as voltage, frequency, and waveform. These include voltage deviations, voltage fluctuations, harmonics, frequency deviations, and three-phase imbalances. Typical power quality assessment methods include fuzzy mathematics, weight-based decision making, and intelligent algorithms. Fuzzy mathematics methods utilize fuzzy theory and membership functions to convert fuzzy problems into quantitative analysis issues, which have been widely applied in power quality assessment. However, membership functions can be easily influenced by subjective factors [13,14,15]. Weight-based decision-making methods determine the weight coefficients for each indicator and combine them with measured data to derive comprehensive power quality assessment results. However, these methods still face challenges in balancing subjective and objective weights [16,17,18]. Intelligent algorithm methods, while highly adaptive, require substantial historical sample data, limiting their applicability to scenarios with sufficient original data accumulation [19].
Moreover, due to the large number of nodes, diverse load types, varied topological structures, and complex spatiotemporal evolution characteristics of distribution systems, current power quality assessment models are primarily based on measured data from individual nodes within the distribution network. These models use diverse methods to evaluate each node, reflecting only local power quality levels rather than providing a comprehensive quantitative assessment of the overall power quality of the distribution network. Complex network theory can partially address this by illustrating the distribution system’s ability to withstand disturbances or its evolution post-disturbance. It also identifies weak nodes or critical links within the distribution system, offering valuable insights for developing measures to ensure stable operation. This theory has been widely applied in grid security analysis and vulnerability identification.
In summary, although substantial research has been conducted on power quality assessment methods for distribution systems, further optimization and refinement are needed. The primary shortcomings lie in two areas: firstly, the impact of integrating new types of sources and loads into the distribution network has not been considered; secondly, the overall power quality level of the distribution system is not reflected.
To address the aforementioned issues, this paper proposes a comprehensive and rational power quality assessment framework by leveraging complex network theory. This involves considering multiple factors such as improved node degree, node short-circuit ratio, node electrical betweenness, and node self-healing capability to determine the comprehensive impact degree of each node within the entire network. Firstly, the gray relational coefficient is introduced to improve the ANP, ensuring the accuracy of subjective weight determination for each indicator. Concurrently, the entropy weight method is employed to establish objective weights, and a balanced algorithm is used to derive the comprehensive weights, enhancing the authenticity and effectiveness of the indicator weights. Next, the VIKOR method is utilized to assess the power quality of each node, taking into account the interdependence and the amount of information provided by each indicator. Combining the comprehensive impact degree of each node’s power quality, a holistic power quality evaluation of the distribution network is conducted. Finally, the feasibility and effectiveness of this model are verified using an improved 13-node distribution network. The goal is to determine the overall power quality level of the distribution network, providing robust support for subsequent optimization and governance efforts.

2. Analysis and Construction of the Power Quality Evaluation Index System

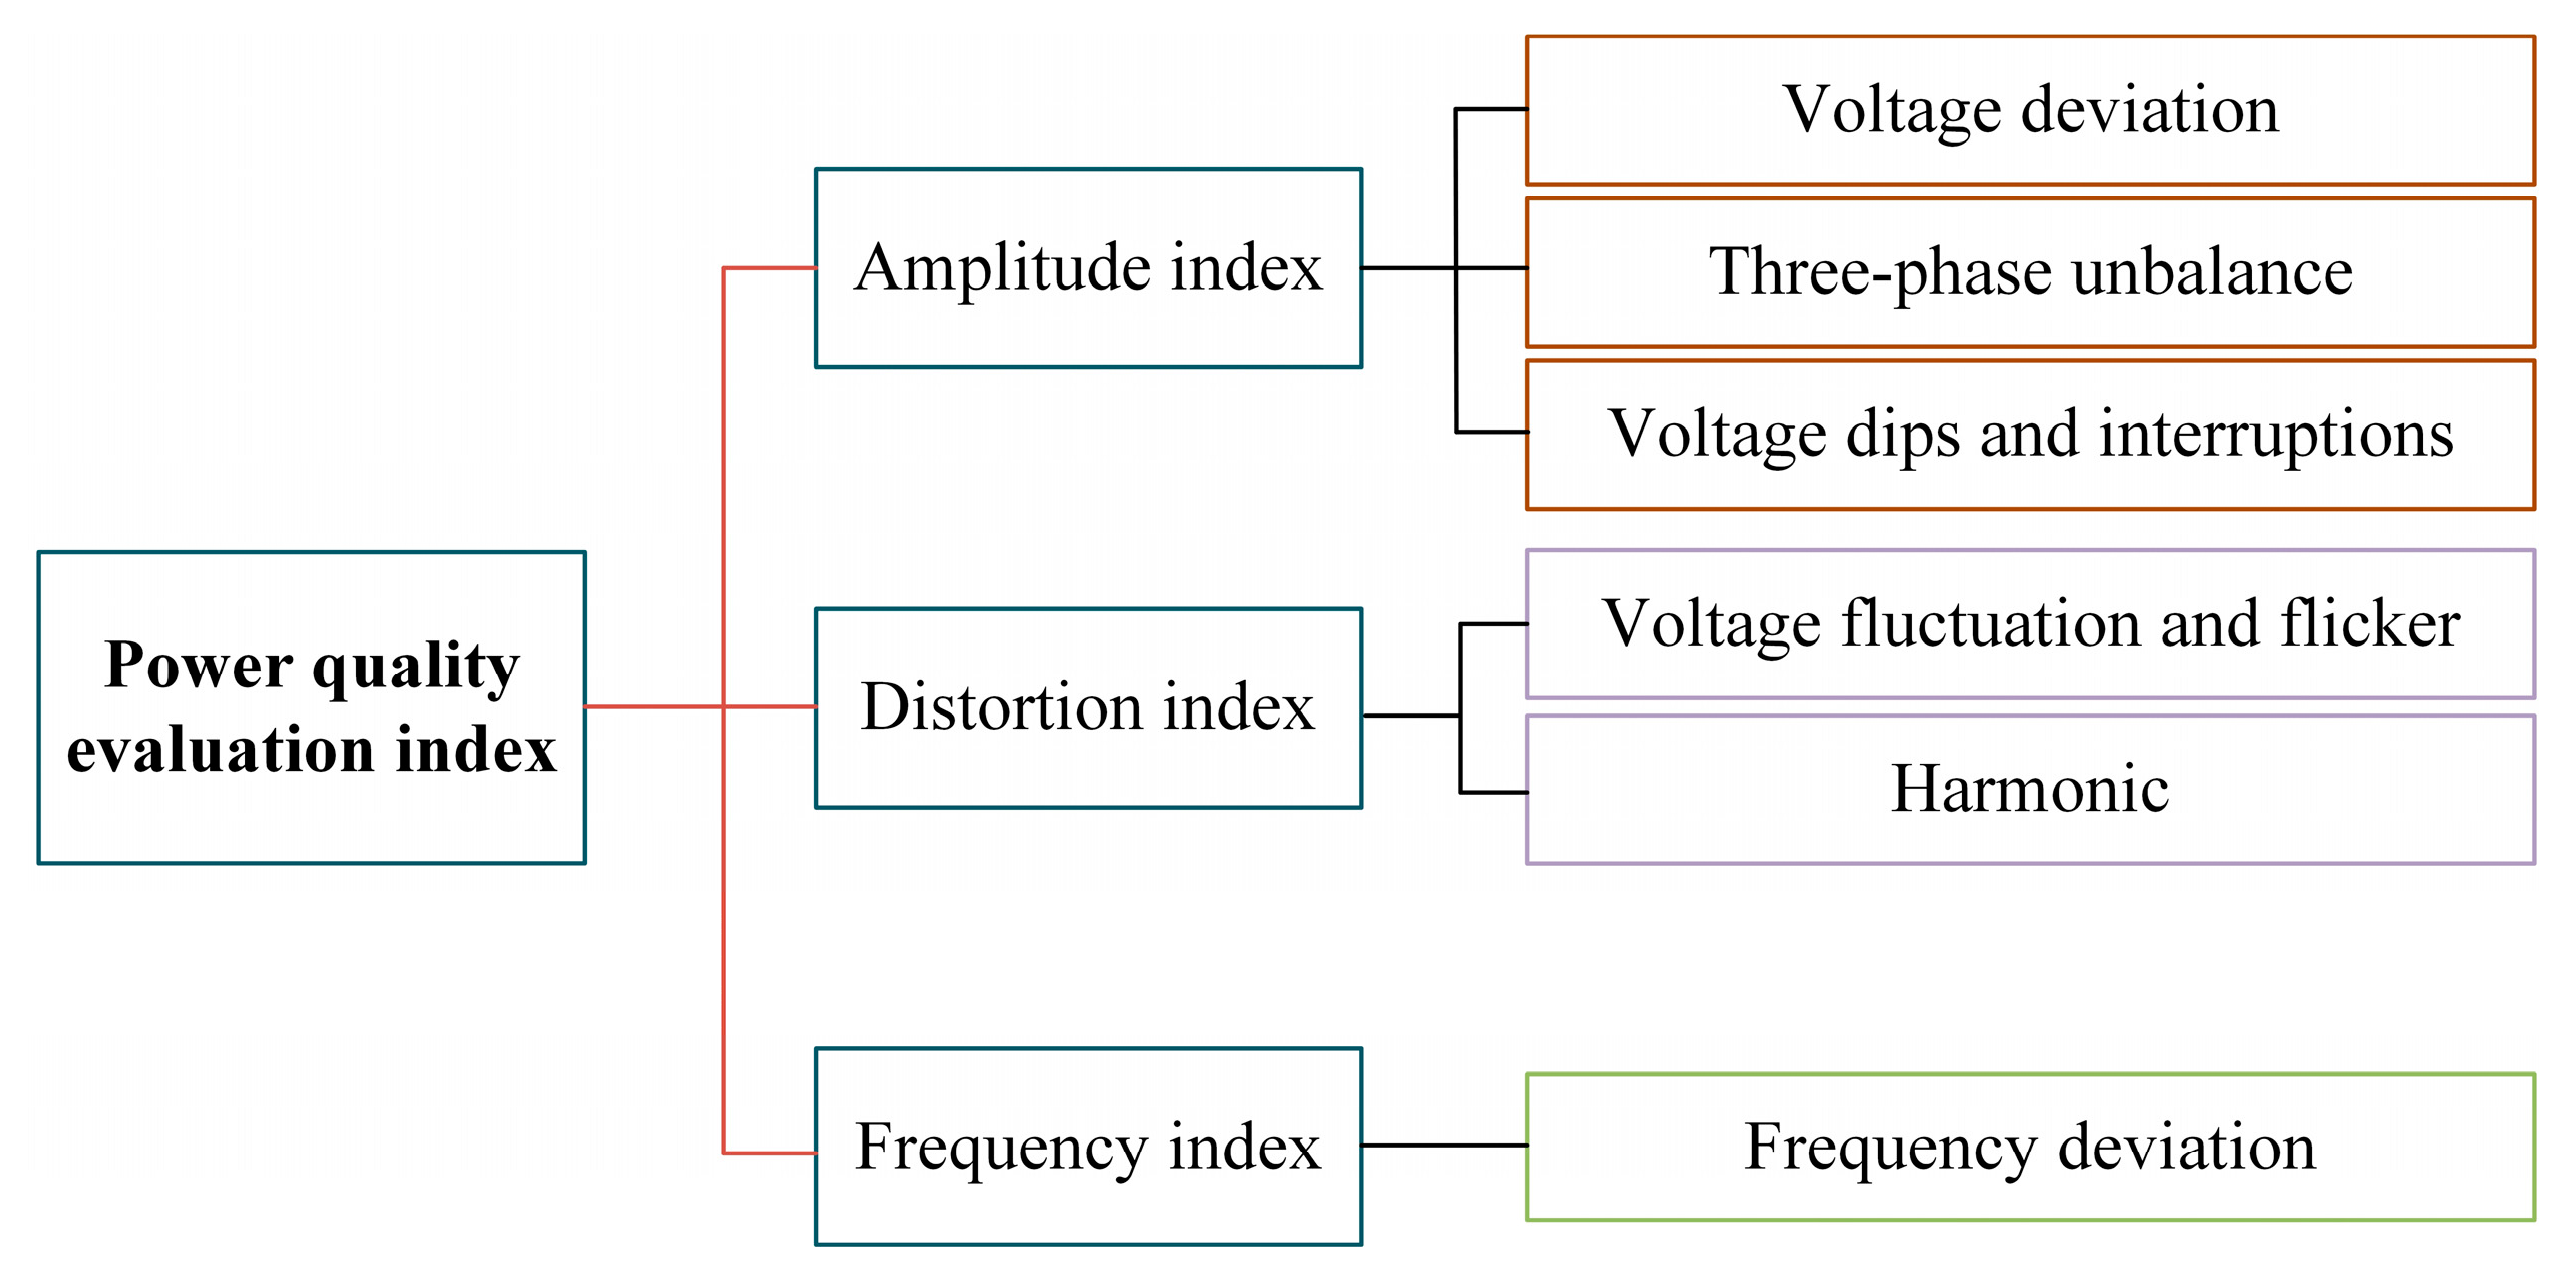
2.1. Power Quality Characteristic Analysis

The shift from “source following load” to “source–load interaction” poses new challenges for the power quality of distribution networks due to the characteristics of distributed power sources such as instantaneously variable output and uncertain power generation. References [20,21,22,23] point out that, on one hand, renewable energy sources like wind and photovoltaic generators are strongly influenced by natural factors such as sunlight and wind speed, resulting in uncontrollable voltage and frequency at their terminals, unlike traditional generators. This exacerbates issues such as voltage deviations, fluctuations, frequency deviations, and voltage dips. On the other hand, flexible sources like electric vehicle chargers and energy storage systems exhibit on-demand characteristics with irregular electricity demand patterns, highlighting the growing imbalance between energy supply and demand, which further leads to voltage imbalances and deviations caused by power imbalance. Therefore, addressing existing power quality issues through rational assessment and management is a pressing challenge.

2.2. Comprehensive Evaluation Index

In distribution systems, various disturbances in power quality coexist and occur simultaneously. However, in comprehensive power quality assessment, single power quality indicators or polarized power quality indicators cannot fully reflect the overall quality of power in the distribution network. Therefore, based on the previous discussion on modern power quality in distribution networks and the existing power quality issues, a power quality assessment index system is constructed as shown in Figure 1.

3. Node Power Quality Influence Degree Based on Complex Network Theory

Currently, in the comprehensive assessment of power quality in distribution networks, most studies only reflect the local power quality levels at individual nodes, failing to determine the overall power quality of the distribution network. Based on complex network theory, nodes in a distribution network are analogous to independent entities within a complex system, while lines represent the relationships between these entities [24]. Therefore, leveraging the topology of distribution networks allows for in-depth exploration of the propagation characteristics of power quality disturbances and the importance of nodes within the system. This approach enables the determination of the overall power quality level of the distribution network. This paper focuses on the topology of distribution networks, considering the characteristics of power quality propagation and the impact of newly integrated sources and loads at each node. By refining the parameters of complex network theory, the study aims to quantify the influence degree of each node in the distribution network.

3.1. Improved Node Degree Index D1

The definition of node degree in distribution systems is the number of directly connected lines to that node. Considering that most distribution networks currently adopt a radial supply topology, a higher node degree indicates more connections to other nodes. Therefore, when this node experiences power quality disturbances, it affects more neighboring nodes, resulting in broader propagation within the distribution network. However, due to the sparse connectivity between network nodes during normal operation, multiple nodes may have the same node degree. A single node degree cannot reflect the propagation characteristics of power quality disturbances. To enhance the reliability of node degrees, the definition of network power quality propagation efficiency is introduced. The propagation efficiency Ii of node i is as follows:
I i = 1 n j = 1 , j i 1 r i j
where n is the total number of nodes in the network, and rij is the electrical distance between node i and node j.
The concept of propagation efficiency measures how easily power quality disturbances from a node spread to other nodes in the network. A higher power quality propagation efficiency indicates that the node has a greater impact on the overall power quality level of the network and is more strategically positioned within it. Combining the local and global characteristics of the network, the improved node degree index Di1 for node i is defined as the following:
D i 1 = I i K i e D a v 1
where Kie is the degree of node I, and Dav1 is the mean of the network improvement node degree.

3.2. Node Short-Circuit Ratio D2

As renewable energy penetration and grid integration of power electronic devices increase, power quality issues become more prevalent. Therefore, the ability of each node to withstand disturbances is an important indicator of node influence. This paper uses the short-circuit ratio (SCR) to measure each node’s resistance to power quality disturbances in multi-feed-in systems with significant renewable energy integration. The SCR index SCRi for node i is defined as the ratio between the AC system’s short-circuit capacity Sac,i at node i and the equivalent grid-connected capacity Seq,i, as shown in Equation (3):
D i 2 = S C R i S C R ¯ = S ac , i S eq , i / i = 1 n 1 n S ac , i S eq , i
where S C R ¯ is the average short-circuit ratio of nodes in the system, and n is the total number of nodes in the network.

3.3. Improved Node Electrical Betweenness Index D3

Unlike information flow in complex networks, electrical energy does not transmit through the shortest paths of each node in the distribution system; instead, it depends on specific load distribution and control strategies [25]. Therefore, to reflect the utilization of power transmission among “generator-distributed energy resource–load” nodes, based on the generation and consumption profiles of each node and the flow direction, considering the propagation characteristics of power quality disturbances, and integrating factors such as node capacity and branch impedance, this paper defines the improved electrical betweenness centrality Di3 at node i as follows:
D i 3 = m V 1 , n V 2 , k V 3 S m S n S k C m , n , k ( i )
where V1 is the set of traditional power generation nodes, V2 is the set of distributed power supply nodes, and V3 is the set of load nodes. Sm is the output power of the traditional generation node m, Sn is the output power of the distributed power node n, and Sl is the output power of the load node l. Cm,n,k(i) is the transit capability of node i, and the method to obtain it is shown in Equation (5) [25]:
C m , n , k ( i ) = 1 2 j V 1 , V 2 , V 3 I m , n , k ( i , j ) , i m , n , k 1 , i = m , n , k
where Im,n,k is the current generated between lines ij after adding a unit current source between nodes m, n, and k.

3.4. The Node Self-Healing Index D4

In large-scale distribution systems with the integration of new types of sources and loads, most power electronic devices currently operate as grid-following equipment. When the system experiences power quality disturbances, there is a tendency for positive feedback between phase-locked loops (PLLs) and power quality disturbances, which can further degrade the overall power quality of the system. In contrast, grid-forming devices do not rely on grid-side voltage and current measurements and thus possess a certain degree of self-healing capability against power quality disturbances. Therefore, considering the control modes and output characteristics of sources and loads at each node, the node self-healing index Di4 for node i is defined as the following:
D i 4 = 1 + S i 1 s t S i 2 s t S b
where S i 1 s t denotes the capacity of grid-following devices connected at node i, S i 2 s t denotes the capacity of grid-forming devices connected at node i, and Sb represents the average capacity of devices connected across the network nodes. Clearly, a larger Di4 indicates a poorer self-healing capability at the node, whereas a smaller value indicates a better capability.

4. Comprehensive Power Quality Assessment Considering the Node Power Quality Impact at a Grid-Wide Level

4.1. Determining the Weighting of Power Quality Indicators

4.1.1. The GRA-ANP Method Determines Subjective Weights

Unlike the traditional AHP (Analytic Hierarchy Process), the ANP considers that power quality indicators are not independent, further emphasizing their interdependencies and couplings. However, due to variations in how different experts rate power quality indicators at each node, relying solely on a single decision-maker’s subjective weights or averaging them has limitations and cannot effectively quantitatively determine the subjective weights of each node. Therefore, this paper introduces the GRA method to improve the determination of subjective weights in ANP. By combining grey relational degrees with the structure matrix, GRA addresses the deficiencies in accuracy of subjective weights, with the following steps:
1.
Analyze and construct the ANP network structure
Firstly, based on the power quality assessment index system, analyze the relationships and influences among various indicators. Classify the issues requiring decisions, and construct different elements and sets of elements. Secondly, analyze the correlations and dependencies among these elements. Based on the analysis and decision-making requirements, construct an ANP network structure consisting of a criteria layer, decision layer, and indicator layer, as shown in Figure 2.
2.
Construct the supermatrix and calculate the individual ANP weights
Suppose ANP’s control layer has m sets of elements P1, P2, …, Pm, and the network layer has n elements C1, C2, …, Cm. Each Ci includes elements ei1, ei2, …, ein. Use elements Ps (s = 1, 2, …, m) from the control layer as criteria and elements ejl (j = 1, 2, …, n) from Cj as sub-criteria. Firstly, based on the correlation analysis between each index, pairwise comparisons of the importance of each index are conducted. Decision-makers use the Saaty scale method for scoring. Secondly, based on the scoring results, the weight matrix Wij and the unweighted supermatrix W are constructed among the indices. This process constructs weight matrices Wij and an unweighted supermatrix W based on the relationships between each indicator.
W i j = w i 1 ( j 1 ) w i 1 ( j 2 ) w i 1 ( j n j ) w i 2 ( j 1 ) w i 2 ( j 2 ) w i 2 ( j n j ) w i n i ( j 1 ) w i n i ( j 2 ) w i n i ( j n j )
where the column vector of Wij is the element ei1, ei2, …, eini for Cj elements’ ej1, ej2, …, ejnj impact rankings.
W = W 11 W 12 W 1 n W 21 W 22 W 2 n W n 1 W n 2 W n n
where Wij is the corresponding weight matrix. The weighted supermatrix can be obtained from W ¯ by normalizing it. To perform stable processing for W ¯ , that is [26]
W = lim ( 1 / n ) k k = 1 n W ¯ k
If the W limit converges and is unique, then the corresponding row vector is the ANP weight of each index, denoted as A = [a1, a2, …, an].
3.
Improve the ANP weights using GRA
(1)
Determine the reference sequence and comparison sequence
Assuming that there are k power quality indicators and h decision-makers in each node, aly represents the ANP weight value of the l indicator given by the y decision-maker, and al0 = max(aly) is taken as the reference sequence X0 = {a10, a20, …, ak0}, then the comparison sequence is Xk = {ak1, ak2, …, akh}.
(2)
Obtain the sequence difference
Δ l y = X 0 X k
(3)
Obtain the correlation coefficient
ζ i ( y ) = min l min y Δ l y + ρ max l max y Δ l y Δ l y + max l max y Δ l y
where P is the resolution coefficient, P ∈ (0,1), usually set to 0.5.
(4)
Obtain the correlation degree qi [27]
q i = 1 h y = 1 v ζ i ( y )
(5)
Determine the subjective weight w1 of each power quality index of node i
w 1 = q i i = 1 h q i

4.1.2. Entropy Weight Method to Determine Objective Weights

In the new distribution network, power quality disturbances exhibit multi-scale spatiotemporal variations. A single subjective weight cannot capture the dynamic changes and the extent of disturbances for each indicator. Therefore, this paper utilizes the entropy weight method to determine the objective weights of each power quality indicator based on the objective attributes of the actual power quality measurement data. The specific steps are as follows:
1.
Collect power quality monitoring data from the distribution network:
Y = ( y i j ) m × n
The entropy weight method determines the objective weights where i = 1, 2, …, m; j = 1, 2, …, n; and yij samples the data of the j-th power quality index for the i time.
2.
Standardize the collected data:
Y i j = y i j i = 1 m y i j
3.
Solve the information entropy ej and information effective value dj:
e j = 1 ln m i = 1 m Y i j ln Y i j d j = 1 e j
4.
Determine the objective weight w1 of each power quality index of node i:
w 2 = d j j = 1 n d j

4.1.3. Comprehensive Weights Based on Equalization Algorithm

In the power quality evaluation process, considering only subjective weights neglects the disturbance probability and variation characteristics of power quality indicators under operating conditions of the distribution network. Conversely, considering only objective weights overlooks the harmful impact of each indicator, leading to reduced accuracy in power quality assessment. To fully integrate the advantages of both and avoid the inaccuracy of single weights, this paper employs a game equilibrium algorithm to determine comprehensive weights. This approach reflects the importance of each power quality indicator from subjective judgment and incorporates probabilistic information from objective data, making it more practical for real-world engineering applications. The solving process is as follows:
1.
Construct comprehensive weight w. Any comprehensive weight can be represented linearly by the subjective weight w1 and the objective weight w2:
w = a w 1 + b w 2
2.
Solve for the combination coefficients. To ensure that both weights are in a balanced state, use the principle of deviation minimization. Determine the optimization objective function and constraints based on the properties of matrix differentiation:
min ( | | a w 1 T + b w 2 T w 1 T | | + | | a w 1 T + b w 2 T w 2 T | | ) i = 1 m w i = 1 w i 0 s . t .   a + b = 1 a , b 0

4.2. A Comprehensive Power Quality Evaluation Model for Nodes Based on the VIKOR Method

The VIKOR method is a compromise multi-criteria decision-making method based on ideal point solutions, proposed by Serafim Opricovic and Gongzhi Fan. Its fundamental principle involves obtaining the positive and negative ideal solutions for each indicator and making optimal selections based on these values. By considering the weights of various criteria and the acceptable range, it derives the optimal strategy. Compared to the classical TOPSIS method, VIKOR offers a compromise solution with a superiority rate, effectively preventing the neutralization of specific indicators under poor conditions by other indicators. It also reflects the intrinsic connections among indicators to a certain extent, significantly improving the accuracy of power quality assessment results. The comprehensive power quality evaluation model for nodes based on the VIKOR method is as follows:
(1)
Sample data processing and establishment of an index standardization matrix.
(2)
Find the positive ideal solution A+ and the negative ideal solution A of each index:
A + = ( max ( Y 1 ) , max ( Y 2 ) , , max ( Y i ) , , max ( Y m ) ) A = ( min ( Y 1 ) , min ( Y 2 ) , , min ( Y i ) , , min ( Y m ) )
where max(Yi) and min(Yi) are, respectively, the maximum and minimum values of the i index data after standardization.
(3)
Determine the group benefit S and individual regret R of the evaluated objects:
S j = i = 1 n w i ( max ( Y i ) - Y j i ) ( max ( Y i ) - min ( Y i ) ) R j = max i w i ( max ( Y i ) - Y j i ) ( max ( Y i ) - min ( Y i ) )
where Yij is the standardized value of the j-th index of the i evaluated object, and wi is the comprehensive weight of the i evaluated object after normalization.
(4)
Determine the benefit ratio Qj of the evaluated object j:
Q j = ν S j min j S j max j S j min j S j + ( 1 ν ) R j min j R j max j R j min j S j
where v is the decision mechanism coefficient (usually 0.5, to ensure the maximization of group utility and the minimization of negative impact).
(5)
Rank the decisions based on the benefit ratio. According to the principle “the higher the benefit ratio Qj, the better the solution; conversely, the lower the ratio, the worse the solution”, this provides strong support for subsequent decision making and planning.

4.3. A Comprehensive Grid-Wide Power Quality Assessment Model

As mentioned earlier, most current comprehensive power quality assessment models only evaluate the power quality of individual nodes in distribution networks, reflecting only the local characteristics of power quality in distribution systems. However, there are significant limitations in evaluating the overall grid-wide power quality of distribution systems. Therefore, to achieve a grid-wide graded quantification of power quality in distribution systems, this paper establishes a comprehensive power quality assessment model based on the evaluation results of each node’s power quality, combined with the proposed power quality impact indicators for distribution network nodes. The model structure is as follows, and the flow chart is shown in Figure 3:
(1)
Establish a power quality assessment index system for the distribution system.
(2)
Consider the interdependence and coupling among various indicators, and use the GRA-ANP method to determine the subjective weights of each indicator. To reflect the disturbance of power quality under actual engineering operation, utilize the entropy weighting method to determine the objective weights of each indicator based on monitoring data.
(3)
To fully integrate the advantages of subjective and objective weights while avoiding the shortcomings of single-weight evaluation results, use game equilibrium algorithms to determine the comprehensive weights of each indicator.
(4)
To avoid errors in the evaluation results caused by large differences between positive and negative ideal solutions, use the VIKOR method to classify and evaluate the power quality of each node.
(5)
Based on complex network theory, construct node power quality impact indicators. The comprehensive power quality impact of node i is represented by Equation (23).
D i = D i j j = 1 n D i j
(6)
Integrating the classification assessment results of each node and the comprehensive electrical quality impact index of nodes, conduct a holistic electrical quality comprehensive assessment of the distribution system using Equation (24).
F = Q j D j

5. Case Study Verification

Based on the IEEE 33-node standard distribution network and expanded with additional sources and loads, the topology is shown in Figure 4. The specific line and load parameters are detailed in Appendix A Table A1, Table A2 and Table A3. Power quality monitoring equipment is used to monitor and record the power quality indices at each node. The 95% probability maximum value is selected as the sampled value for each index. The power quality indices data at the monitoring points are summarized in Appendix A Table A4.
Taking Node 1 as an example, the subjective weights of each index are determined by decision-makers using the GRA-ANP method. The objective weights of each index are calculated using the entropy weight method. The comprehensive weights of each index are then determined based on the game equilibrium algorithm, with combination coefficient a as 0.717 and b as 0.283, as shown in Table 1. The comprehensive weights for other nodes are detailed in Appendix A Table A5.
According to national power quality standards, the VIKOR method is used to determine the benefit ratios Qj of each node in the distribution network and the value ranges for each power quality level. The power quality levels of the nodes are ranked from poor to excellent, as shown in Table 2. The power quality levels of each node are detailed in Table 3.
Based on the analysis of the distribution network topology in Figure 4, the power quality disturbance monitoring data in Appendix A, and Table 3, it can be observed that nodes 3, 0, 2, and 1 have higher power quality levels due to their proximity to the upstream power supply, making them less susceptible to power quality disturbances. Nodes 16 and 21, on the other hand, have lower power quality levels due to the photovoltaic (PV) generation systems at these nodes, which are highly affected by external environmental factors such as light intensity, leading to voltage fluctuations and deviations.
Nodes 12, 15, and 5, located near PV generation systems or electric vehicle (EV) charging stations, also exhibit lower power quality levels due to the power quality disturbances caused by flexible loads, which affect both the nodes themselves and nearby nodes. Additionally, nodes 8 and 28 have integrated energy storage devices, which can improve issues such as voltage sags and deviations to some extent, effectively mitigating power quality disturbances and resulting in higher power quality levels for these nodes. In summary, the evaluation results of the proposed method align with the actual operating conditions of the distribution network, demonstrating its practical engineering value.
In order to verify the effectiveness of the power quality evaluation model of the improved VIKOR method proposed in this paper, different evaluation methods were used to analyze and evaluate the power quality level of each node, and the evaluation results are shown in Table 4.
As shown in Table 4, the comprehensive evaluation results of the proposed method are consistent with those of the traditional TOPSIS method and the Extension Cloud Theory method, verifying the applicability of the proposed method. In the TOPSIS evaluation results, there are discrepancies in the power quality evaluation levels of nodes 6, 13, 16, and 22 compared to the VIKOR method results. This is because the TOPSIS method solely relies on Euclidean distance as the evaluation criterion, making it difficult to comprehensively assess the relationship between each index and the positive and negative ideal solutions, and it is easily influenced by single indices with excessive disturbance amplitudes [28]. In the Extension Cloud Theory evaluation method, the selection of the membership function is influenced by subjective factors, which can lead to errors in the evaluation results [29].
The VIKOR method based on comprehensive weights used in this paper not only reflects the correlation between various indices but also combines subjective and objective factors, reducing the errors caused by using a single weight in the evaluation results. Moreover, its compromise coefficient can more comprehensively reflect the relative positional relationships of each scheme, further improving the accuracy of the evaluation results.
According to the calculation method for power quality node influence based on the complex network theory proposed in this paper, the improved node degree indicator D1, short-circuit ratio indicator D2, improved electrical betweenness indicator D3, self-healing indicator D4, and node comprehensive influence indicator D after standardization were obtained as shown in Appendix A Table A6. The standardized results are shown in Figure 5.
As shown in Figure 5, the comprehensive power quality influence of nodes 0, 1, and 2 is relatively large. This is primarily due to the high weights of the improved node degree D1, short-circuit ratio D2, and improved electrical betweenness D3. When these nodes experience power quality disturbances, they affect many other nodes, leading to a decline in the overall power quality level of the distribution network, thus occupying a significant position within the network. On the other hand, nodes 24, 32, 17, and 21 are located at the ends of the distribution network, with a low weight for the improved node degree D1. The power quality disturbances at these nodes have a limited impact on the overall power quality level of the distribution network, resulting in a lower comprehensive influence.
Additionally, nodes 8 and 28, which have energy storage devices, and nodes 24 and 29, which have PV generation systems, exhibit strong self-healing capabilities. This results in a lower weight for D4, enabling them to resist some power quality disturbances, thereby reducing their comprehensive power quality influence. In summary, the proposed method for calculating the power quality influence of nodes based on complex network theory is both scientific and reasonable.
Using Equation (24), the grid-wide quality level of the distribution network is calculated as F = 0.3994. According to Table 3, this places the power quality of the distribution network at Level III, which is consistent with the actual operating conditions. This demonstrates that the proposed network-wide power quality evaluation method based on complex network theory reflects the overall power quality level of the distribution network while considering both network characteristics and operational status. This provides a theoretical foundation for the safe and stable operation of the distribution network and offers strong support for subsequent power quality optimization and management.

6. Conclusions

This paper conducts a comprehensive grid-wide power quality assessment of distribution networks based on complex network theory, reflecting the overall power quality level of the distribution system and providing strong support for its safe and stable operation. The conclusions drawn are as follows:
  • This paper analyzes the mechanism characteristics of power quality disturbances in modern distribution networks and establishes a scientific power quality assessment system. To reflect the impact of power quality disturbances at each node on the overall power quality level of the distribution network, the power quality influence of nodes is determined based on improved node degree, short-circuit ratio, improved electrical betweenness, and node self-healing capability, laying the foundation for subsequent power quality assessments.
  • By combining the GRA and ANP methods, the paper avoids the differences brought by different decision-makers, ensuring the rationality of subjective weights. The entropy weight method is used to determine objective weights, and a balanced algorithm is adopted to obtain comprehensive weights, eliminating the errors brought by a single weight and further improving the accuracy of the weight coefficients.
  • Considering the correlation between various indicators and the impact of data integration, the VIKOR method is used to evaluate the power quality of each node. Based on the node power quality influence, the power quality level of the distribution network is determined, achieving a comprehensive and quantitative grid-wide power quality assessment. This assessment reflects the overall power quality level of the distribution network and provides a reference direction for subsequent optimization and management of power quality.
Of course, this study has certain limitations. Firstly, the evaluation process requires specific distribution network topology data and extensive power quality monitoring data. Without these data, there may be some inaccuracies. Secondly, the power quality indices considered are not comprehensive enough, such as transient overvoltages, interharmonics, and so on. Therefore, future research on comprehensive power quality evaluation should focus on the comprehensiveness and rationality of index construction. It should fully integrate data mining and digital twin concepts, and comprehensively utilize intelligent grid monitoring systems, energy management systems, and user-side measurement data to ensure the rationality of the evaluation results.

Author Contributions

Conceptualization, Y.X. and Y.L.; Methodology, Y.X., J.L. and Y.Z.; Software, Y.L. and J.L.; Validation, M.H. and L.W.; Formal analysis, Y.X. and J.W.; Investigation, Y.L.; Resources, Y.Z.; Data curation, J.L. and J.W.; Writing—original draft preparation, Y.X.; Writing—review and editing, L.Q.; Visualization, Y.L. and M.H.; Supervision, Y.Z.; Project administration, L.Q.; Funding acquisition, Y.L. All authors have read and agreed to the published version of the manuscript.

Funding

This research was funded by State Grid Corporation of China grant number 5400-202421209A-1-1-ZN, State Grid Corporation of China Science and Technology Project Funding.

Data Availability Statement

The original contributions presented in the study are included in the article, further inquiries can be directed to the corresponding author.

Conflicts of Interest

Authors Yan Lin, Yan Zhang, Jinchen Lan, Meimei Hao and Lianhui Wang were employed by the company State Grid Fujian Electric Power Co., Ltd. The remaining authors declare that the research was conducted in the absence of any commercial or financial relationships that could be construed as a potential conflict of interest.

Appendix A

Table A1. Branch data of improved IEEE33 node distribution network.
BranchB01B02B03B04B05B06B07B08B09B10B11B12B13
R/Ω0.092 0.493 0.366 0.381 0.819 0.187 0.711 1.030 1.044 0.197 0.374 1.468 0.542
X/H0.047 0.251 0.186 0.194 0.707 0.619 0.235 0.740 0.740 0.065 0.124 1.155 0.713
BranchB14B15B16B17B18B19B20B21B22B23B24B25B26
R/Ω5.910 7.463 3.289 7.320 0.164 1.504 0.410 0.709 4.512 0.898 0.896 0.203 0.284
X/H5.260 5.450 4.721 5.740 0.157 1.355 0.478 0.937 3.083 0.709 0.701 0.103 0.145
BranchB27B28B29B30B31B32B33B34B35B36B37
R/Ω1.059 0.804 0.508 0.974 0.311 0.341 2.000 2.000 2.000 0.500 0.500
X/H0.934 0.701 0.259 0.963 0.362 0.530 2.000 2.000 2.000 0.500 0.500
Table A2. Load data of improved IEEE33 node distribution network.
Node0123456789101112
P/kW01009012060602002006060456060
Q/kW060408030201001002020303535
Node13141516171819202122232425
P/kW12060606090909090909042042060
Q/kW8010202040404040405020020025
Node2627282930313226272829
P/kW6060120200150210606060120200
Q/kW2520106007010040252010600
Table A3. Flexible source load data of improved IEEE33 node distribution network.
Node813162124282932
TypeESSV2GPVPVPVESSPVV2G
Capacity/kW500 400 150300 200 500 300 200
Table A4. Power quality monitoring data.
Index
Voltage
Deviation/%
Harmonic Wave/%Three-Phase Unbalance/%Voltage
Fluctuation and Flicker/%
Voltage Dips and
Interruptions/%
Frequency
Deviation/%
Node
00.514 2.070 1.273 0.815 0.156 0.131
13.043 3.492 1.182 1.768 0.783 0.117
25.802 2.146 0.723 1.096 2.287 0.124
35.310 1.672 2.524 0.738 3.091 0.209
42.012 2.983 1.572 0.417 3.661 0.130
55.406 3.510 1.891 0.882 2.175 0.333
62.320 4.510 1.467 1.912 1.477 0.324
75.427 1.887 0.661 0.248 2.913 0.223
82.568 3.675 0.679 0.942 0.914 0.105
90.167 4.771 1.610 1.714 2.275 0.272
104.009 2.714 1.286 0.087 1.174 0.093
111.425 2.701 1.043 1.383 4.427 0.183
124.785 1.556 1.384 1.958 2.039 0.154
137.124 3.356 1.918 0.567 4.182 0.215
143.691 0.910 2.752 0.268 3.731 0.397
156.618 0.465 0.485 1.371 0.774 0.302
161.696 4.317 2.147 1.819 3.720 0.392
172.788 0.047 1.733 1.222 3.030 0.094
181.982 4.575 1.300 1.800 1.272 0.211
191.951 3.214 2.653 0.387 1.621 0.021
204.268 4.007 1.179 1.509 2.009 0.303
215.803 4.152 0.537 0.693 2.032 0.241
224.711 1.042 1.900 0.837 1.931 0.343
235.040 4.275 1.872 0.311 3.049 0.395
242.792 5.636 0.984 1.638 5.834 0.372
253.689 1.043 2.409 1.250 0.940 0.164
264.075 3.635 2.998 1.477 0.473 0.000
272.445 1.771 2.943 1.610 1.616 0.216
283.153 2.902 0.381 0.134 3.848 0.083
292.766 4.183 0.697 1.902 1.171 0.088
303.772 2.183 0.071 0.995 3.702 0.130
315.849 4.246 1.822 1.510 3.464 0.038
326.650 0.248 0.332 1.485 4.120 0.299
Table A5. Comprehensive weight of each node.
Index
Voltage
Deviation
Harmonic WaveThree-Phase UnbalanceVoltage Fluctuation and FlickerVoltage Dips and InterruptionsFrequency
Deviation
Node
00.228 0.248 0.111 0.092 0.141 0.189
10.196 0.174 0.153 0.164 0.126 0.184
20.276 0.123 0.133 0.123 0.146 0.198
30.281 0.130 0.126 0.119 0.163 0.174
40.209 0.157 0.154 0.140 0.152 0.184
50.142 0.179 0.159 0.170 0.122 0.226
60.149 0.159 0.167 0.161 0.191 0.169
70.158 0.141 0.163 0.189 0.195 0.154
80.186 0.151 0.124 0.162 0.241 0.136
90.165 0.130 0.118 0.185 0.279 0.120
100.149 0.189 0.158 0.150 0.182 0.171
110.153 0.147 0.127 0.207 0.216 0.149
120.166 0.142 0.163 0.169 0.183 0.182
130.153 0.162 0.128 0.204 0.173 0.180
140.140 0.178 0.146 0.188 0.178 0.166
150.117 0.236 0.133 0.224 0.137 0.150
160.100 0.299 0.121 0.224 0.115 0.132
170.123 0.241 0.135 0.163 0.128 0.200
180.125 0.279 0.137 0.150 0.123 0.195
190.160 0.149 0.136 0.184 0.134 0.234
200.138 0.174 0.166 0.182 0.152 0.190
210.147 0.161 0.153 0.190 0.122 0.223
220.112 0.129 0.195 0.249 0.102 0.211
230.098 0.122 0.215 0.282 0.112 0.172
240.143 0.139 0.225 0.228 0.133 0.133
250.131 0.176 0.198 0.154 0.185 0.161
260.163 0.202 0.129 0.157 0.136 0.202
270.136 0.198 0.104 0.198 0.195 0.169
280.133 0.157 0.134 0.207 0.190 0.180
290.159 0.164 0.115 0.172 0.222 0.174
300.153 0.162 0.108 0.197 0.245 0.138
310.158 0.172 0.118 0.192 0.220 0.140
320.148 0.145 0.109 0.216 0.206 0.168
Table A6. Comprehensive impact degree of power quality of each node.
Index D1D2D3D4D
Node
00.058 0.048 0.035 0.035 0.044
10.064 0.033 0.026 0.030 0.038
20.042 0.038 0.031 0.030 0.035
30.029 0.036 0.027 0.021 0.028
40.022 0.030 0.008 0.034 0.023
50.025 0.029 0.030 0.017 0.025
60.033 0.007 0.013 0.045 0.024
70.052 0.018 0.032 0.021 0.031
80.049 0.034 0.030 0.010 0.021
90.038 0.023 0.026 0.030 0.029
100.045 0.032 0.029 0.037 0.036
110.014 0.040 0.050 0.035 0.035
120.011 0.030 0.027 0.029 0.024
130.008 0.015 0.037 0.057 0.029
140.037 0.040 0.042 0.031 0.038
150.002 0.030 0.020 0.037 0.022
160.051 0.044 0.018 0.033 0.037
170.016 0.022 0.029 0.036 0.016
180.018 0.031 0.028 0.029 0.027
190.037 0.042 0.043 0.029 0.038
200.062 0.031 0.043 0.031 0.042
210.009 0.041 0.033 0.022 0.016
220.015 0.042 0.025 0.023 0.026
230.046 0.008 0.040 0.020 0.028
240.013 0.003 0.042 0.042 0.015
250.034 0.040 0.037 0.037 0.037
260.014 0.061 0.017 0.036 0.032
270.054 0.056 0.018 0.011 0.026
280.022 0.021 0.055 0.006 0.015
290.025 0.002 0.002 0.047 0.019
300.032 0.030 0.041 0.029 0.033
310.017 0.009 0.032 0.029 0.022
320.006 0.034 0.035 0.044 0.013

References

  1. Li, B.; Chen, M.; Zhong, H.; Ma, Z.; Liu, D.; He, G. A Review of Long-term Planning of New Power Systems with Large Share of Renewable Energy. Proc. CSEE 2023, 43, 555–581. [Google Scholar]
  2. Denholm, P.; Arent, D.J.; Baldwin, S.F.; Bilello, D.E.; Brinkman, G.L.; Cochran, J.M.; Cole, W.J.; Frew, B.; Gevorgian, V.; Heeter, J.; et al. The challenges of achieving a 100% renewable electricity system in the United States. Joule 2021, 5, 1331–1352. [Google Scholar] [CrossRef]
  3. Gielen, D.; Boshell, F.; Saygin, D.; Bazilian, M.D.; Wagner, N.; Gorini, R. The role of renewable energy in the global energy transformation. Energy Strategy Rev. 2019, 24, 38–50. [Google Scholar] [CrossRef]
  4. Srivastava, M.; Goyal, S.K.; Saraswat, A.; Shekhawat, R.S.; Gangil, G. A Review on Power Quality Problems, Causes and Mitigation Techniques. In Proceedings of the Sustainable Technology for Power and Energy Systems (STPES), Srinagar, India, 4–6 July 2022. [Google Scholar]
  5. Zhang, X.; Chen, Y.; Wang, Y.; Ding, R.; Zheng, Y.; Wang, Y.; Zha, X.; Cheng, X. Reactive voltage partitioning method for the power grid with comprehensive consideration of wind power fluctuation and uncertainty. IEEE Access 2020, 8, 124514–124525. [Google Scholar] [CrossRef]
  6. Yi, G.; Hu, R. Survey on the Power Quality Question Resultant from Connection of Distributed Power Generation to the Grid. Power Syst. Clean Energy 2015, 31, 38–46. [Google Scholar]
  7. Wang, Z.; Guo, X.; Li, J.; Wang, X. Impact of Voltage Sags on Electric-Vehicle Charger and Critical Voltage Sag Determination. IEEE Trans. Power Deliv. 2016, 31, 1397–1399. [Google Scholar] [CrossRef]
  8. Jiang, Y.; Ren, Z.; Li, Q.; Guo, Y.; Xu, Y. An Accommodation Strategy for Renewable Energy in Distribution Network Considering Coordinated Dispatching of Multi-Flexible Resources. Trans. China Electrotech. Soc. 2022, 37, 1820–1835. [Google Scholar]
  9. Liu, Y.; Feng, D.; Lin, C.; Zhang, Y. Current status and development trend of power quality comprehensive assessment. Power Syst. Prot. Control. 2020, 48, 167–176. [Google Scholar]
  10. Liu, R.; Wang, R.; Liu, Q.; Yang, L.; Xi, C.; Wang, W.; Li, L.; Zhao, Z.; Zhou, Y. Review of Comprehensive Evaluation Methods for Power Quality and Its Trend in New Generation Energy System. In Proceedings of the International Conference on Advances in Energy Resources and Environment Engineering, Harbin, China, 8–10 December 2017. [Google Scholar]
  11. Zhu, X.; Zhang, J.; Liu, W.; Qiu, W.; Wu, X.; Jiang, C. Regional Power Grid Quality Evaluation Method Considering Index Characteristics. Proc. CSU-EPSA 2022, 34, 150–158. [Google Scholar]
  12. Elbasuony, G.S.; Aleem, S.H.A.; Ibrahim, A.M.; Sharaf, A.M. A unified index for power quality evaluation in distributed generation systems. Energy 2018, 149, 607–622. [Google Scholar] [CrossRef]
  13. Liu, P.C.Y.; Lo, H.W.; Liou, J.J.H. A combination of DEMA-TEL and BWM-based ANP methods for exploring the system in Taiwan. Sustain. Green Build. Rat. 2020, 12, 1–19. [Google Scholar]
  14. Lin, C.; Zhang, Y.; Shao, Z.; Liu, Y. Comprehensive Evaluation of Power Quality on Long-time Scale Based on Fuzzy DEA. High Volt. Eng. 2021, 47, 1751–1761. [Google Scholar]
  15. Cheng, Z.-Y.; Liu, D.; Wu, J.; Chen, L. Comprehensive Evaluation of Power Quality Based on Set Pair Analysis and Variable Fuzzy Sets. Power Syst. Technol. 2020, 44, 1950–1956. [Google Scholar]
  16. Fu, X.; Chen, H.; Liu, G.; Jin, X.M. Power Quality Comprehensive Evaluation Method for Distributed Generation. Proc. CSEE 2014, 34, 4270–4276. [Google Scholar]
  17. Li, J. Research on evaluation method of power quality based on cooperative game theory and improved TOPSIS. Power Syst. Prot. Control. 2018, 46, 109–115. [Google Scholar]
  18. Lv, Z.; Wu, M.; Song, Z.; Zhao, T.; Du, G. Comprehensive evaluation of power quality on CRITIC-TOPSIS method. Electr. Mach. Control. 2020, 24, 137–144. [Google Scholar]
  19. Jia, X.; Li, X.; Yan, S.; Wang, S.; Xu, S. Power Quality Assessment of SESN Power Supply Network Based on Deep Learning. Control. Eng. China 2021, 28, 2052–2059. [Google Scholar]
  20. Wei, Y.; Wang, J.; Li, N. An Analysis of the Influence of Grid-Connected Renewable Energy on Power Quality of Power Grids. Power Syst. Clean Energy 2022, 38, 108–114. [Google Scholar]
  21. Barros, J.; de Apraiz, M.; Diego, R.I. Power quality in DC distribution networks. Energies 2019, 12, 848. [Google Scholar] [CrossRef]
  22. Yu, H.; Huang, L.; Zhang, S.; Chen, H.; Tang, C. Effects of distributed photovoltaic generation and electric vehicle integrating into distribution network on line loss and voltage drift. Smart Power 2020, 48, 28–34. [Google Scholar]
  23. Chishti, F.; Murshid, S.; Singh, B. LMMN-based adaptive control for power quality improvement of grid intertie wind-PV system. IEEE Trans. Ind. Inform. 2019, 15, 4900–4912. [Google Scholar] [CrossRef]
  24. Wang, Z.; Miao, S.; Guo, S.; Han, J.; Yin, H. Node vulnerability evaluation of distribution network considering randomness characteristic of distributed generation output. Electr. Power Autom. Equip. 2021, 41, 33–40. [Google Scholar]
  25. Xu, H.; Li, H.; Zhao, X.; Huang, Z. Assessment on Nodal Comprehensive Vulnerability Based on Operational State and Network Structure. Power Syst. Technol. 2014, 38, 731–735. [Google Scholar]
  26. Zeng, Q.; Yang, H.; Yang, X.; Li, H. Comprehensive Evaluation on Power Quality Considering the Relevance of Indexes. Proc. CSU-EPSA 2016, 28, 73–78. [Google Scholar]
  27. Yu, Q.; Chen, X.; Li, X.; Zhou, C.; Li, Z. Using Grey Target Theory for Power Quality Evaluation Based on Power Quality Monitoring Data. Energy Eng. J. Assoc. Energy Eng. 2022, 119, 359–369. [Google Scholar] [CrossRef]
  28. Tan, W.; Ge, Y.; Chen, B.; Ding, J.; Luo, X.; Lin, Z.; Qiu, W.; Lin, Z. Gaussian cloud and TOPSIS based power supply quality evaluation method. Energy Rep. 2022, 8, 377–384. [Google Scholar] [CrossRef]
  29. Yu, H.; Liu, Y.; Huang, T.; Wu, Z.; Liu, Y. Power Quality Evaluation Based on Extension Cloud Model and Fuzzy Proximity Degree. Smart Power 2022, 50, 23–29+52. [Google Scholar]
Figure 1. Power quality comprehensive evaluation index.
Energies 17 03193 g001
Figure 2. The network structure of ANP.
Energies 17 03193 g002
Figure 3. Grid-wide comprehensive power quality assessment flowchart.
Energies 17 03193 g003
Figure 4. The topology of the improved IEEE33-node distribution network.
Energies 17 03193 g004
Figure 5. Comprehensive influence degree of power quality of each node after standardization.
Energies 17 03193 g005
Table 1. The subjective weights, objective weights, and comprehensive weights of the indices at Node 1.
IndexVoltage
Deviation
HarmonicThree-Phase UnbalanceVoltage Fluctuations and FlickersVoltage DipFrequency DeviationWeight
Combination Coefficient
Subjective weight0.1910.1590.1680.1700.1220.1900.717
Objective weight0.2150.2130.1100.1530.1350.1740.283
Comprehensive weight0.1960.1740.1530.1640.1260.184/
Table 2. Interest ratio value of each node.
Node1615512221820271323282514
Qj0.0110.0510.0770.1310.1380.1650.1660.2200.2290.2390.2590.2820.298
Node17193111629249322630710
Qj0.3130.3180.3480.3530.3650.3900.3910.4100.4130.4820.4870.4940.506
Node21184302
Qj0.5280.6340.6600.6900.8110.9060.989
Table 3. Power quality level of each node.
LevelQj Indicates the Value RangeNode
I≥0.7803, 0, 2
II≥0.47626, 30, 7, 10, 21, 1, 8, 4
III≥0.34731, 11, 6, 29, 24, 9, 32
IV≥0.15318, 20, 27, 13, 23, 28, 25, 14, 17, 19
V≥016, 15, 5, 12, 22
Table 4. Power quality levels of each node evaluated by different methods.
Node012345678910111213141516
Power quality levelProposed methodIIIIIIIVIVIIIIIIIIIIIIVIVIVVV
TOPSIS methodIIIIIIIVIIIIIIIIIIIIIIIVIIIIVVIV
Extension Cloud TheoryIIIIIIIVIVIIIIIIIIIIIIIVIVIVVIV
Node17181920212223242526272829303132
Power quality levelProposed methodIVIVIVIVVIIIVIIIIVIIIVIIIIIIIIIIIIII
TOPSIS methodIVIVIVIVIVIIIVIVIVIIIVIIIIIIIIIIIIII
Extension Cloud TheoryIVIVIVIVVIIIVIIIIVIIIVIIIIVIIIIIIIV
Disclaimer/Publisher’s Note: The statements, opinions and data contained in all publications are solely those of the individual author(s) and contributor(s) and not of MDPI and/or the editor(s). MDPI and/or the editor(s) disclaim responsibility for any injury to people or property resulting from any ideas, methods, instructions or products referred to in the content.

