Article

Design of a Wave Generation System Using an Oscillating Paddle-Type Device Anchored to Fixed Structures on the Coast

by
Juan Pablo Castaño Serna
1,
Ainhoa Rubio-Clemente
1,2 and
Edwin Chica
1,*
1
Grupo de Energía Alternativa, Facultad de Ingeniería, Universidad de Antioquia, Calle 70 No. 52-21, Medellín 050010, Colombia
2
Escuela Ambiental, Facultad de Ingeniería, Universidad de Antioquia, Calle 70 No. 52-21, Medellín 050010, Colombia
*
Author to whom correspondence should be addressed.
Energies 2024, 17(13), 3209; https://doi.org/10.3390/en17133209
Submission received: 9 May 2024 / Revised: 11 June 2024 / Accepted: 25 June 2024 / Published: 29 June 2024
(This article belongs to the Section A3: Wind, Wave and Tidal Energy)

Abstract

:
Wave energy, a form of renewable energy, is derived from the movement of sea waves. Wave energy generation devices are technologies designed to harness this resource and convert it into electricity. These devices are classified based on their location, size, wave direction, and operating principle. This work presents the design of an oscillating device for harnessing wave energy. For this purpose, computational fluid dynamics and response surface methodology were employed to evaluate the influence of the percentage of the blade height submerged below the water surface (X1) and the distance from the device to the breakwater in terms of the percentage of the wave length (X2). The response variable studied was the hydrodynamic efficiency ( η ) of the device. Transient fluid dynamic simulations were carried out using Ansys Fluent software 2023 R1, with input conditions based on a wave spectrum characteristic of the Colombian Pacific Ocean. Analysis of variance determined that both factors and their interaction have significant effects on the response variable. Using the obtained regression model, the optimal point of the system was determined. Numerical results showed that the maximum η of the system was achieved when the device was submerged at 75% of its height and was positioned 10% of the wave length away from the vertical breakwater. Under this configuration, η was 64.8%. Experimental validations of the optimal configuration were conducted in a wave channel, resulting in a η of 45%. The difference in efficiencies can be attributed to mechanical losses in the power take-off system, which were not considered during the numerical simulations.

1. Introduction

The escalating emissions of greenhouse gases (GHGs) resulting from the utilization of fossil fuel sources for energy generation, encompassing gas, oil, and coal, represent a formidable environmental challenge in the contemporary era. According to data from the World Bank, the alarming 35% surge in emissions observed between 2000 and 2020 underscores the urgency of addressing this growing environmental concern. Projections indicate that without a transformative shift in global energy generation and consumption practices, these emissions will persistently increase, exacerbating the impact on our climate. From a scientific perspective, the correlation between continued fossil fuel use and the relentless rise in GHG emissions is unequivocal [1]. This necessitates a paradigm shift towards adopting renewable energy sources (RESs) as a sustainable and environmentally responsible alternative. The scientific rationale behind this transition lies in the inherent capacity of RESs to harness renewable resources, such as sunlight, wind, and water, to generate power without the deleterious environmental consequences associated with fossil fuel combustion.
The incorporation of various energy sources into the global energy mix, including nonconventional renewable energy (NCRE), represents a commendable technological stride. However, despite these advancements, the persistent dominance of fossil fuel sources remains evident [2]. This emphasizes the necessity for a more profound shift in our energy landscape, highlighting the importance of accelerating the transition to RESs. The continuous increase in GHGs raises red flags about the future climate scenario [3]. In this regard, the scientific community underscores the critical role of renewable energy in mitigating carbon emissions, thereby averting the impending environmental threats [4,5]. REN21’s 2021 global report reinforces the scientific consensus on the urgency of transitioning to renewable energies as a pivotal response to climate change on a global scale [1].
Wave energy, derived from the undulating motion of ocean waves, emerges as a scientifically viable and environmentally responsible renewable energy source. The unique capacity of waves to vary in size and strength based on lunar cycles, winds, and weather conditions provides an intriguing avenue for harnessing this energy to drive devices and generate electricity [3]. This not only minimizes the negative environmental impact compared to other renewable energies but also demonstrates the potential of substantially contributing to global energy demands [6]. The estimated ocean wave energy potential globally is an impressive 2.11 TW, with a power density (2–3 kW/m2) surpassing that of other renewable sources such as wind (0.4–0.6 kW/m2) and solar (0.1–0.2 kW/m2) energy sources [7,8]. This underscores the substantial energy potential of wave energy on a global scale, providing a scientifically grounded basis for its consideration in the broader renewable energy portfolio. Although the wave energy resource in Colombia is relatively lower compared to other regions globally, it holds significant potential for utilization in energy generation processes. The scientific exploration and development of wave energy technologies can further contribute to expanding the renewable energy portfolio, aligning with both environmental and scientific imperatives for a sustainable and resilient energy future. To harness the energy of ocean waves, converters like the oscillating wave surge converter (OWSC) can be employed, necessitating the efficient design of power take-off (PTO) systems. The PTO serves as the vital link in converting absorbed mechanical, pneumatic, or potential energy from the primary conversion stage into a valuable form, primarily mechanical energy. This transformed energy can subsequently undergo further conversion, with electricity being the prevalent outcome when a connected generator is integrated into the PTO system. The OWSC, as an example, relies on the precise and effective conversion of wave motion into electrical power. The optimization of PTO systems plays a crucial role in enhancing the overall efficiency and reliability of wave energy conversion technologies, ensuring the successful utilization of this renewable energy source.
Numerical modeling methods for OWSC can be broadly categorized into three groups: straightforward conceptual models, high-fidelity simulation tools using meshes, and high-fidelity mesh-free simulation tools [9]. Concerning simple conceptual models, hydrodynamic conceptual models of the seafloor and bottom-hinged OWSC have been presented [10]. Since simple conceptual models have limited ability to explain the interactions between OWSC and waves, their numerical results can be inconsistent with reality. Subsequently, some researchers have opted for high-fidelity simulation tools based on mesh modeling, using software such as OpenFOAM, and fictitious domain and simplified boundary element methods to simulate WEC interactions [11,12]. Leveraging the numerical simulation tools mentioned above, researchers have refined the structural parameters and power take-off systems of WECs while investigating their energy capture performance. The methodology used in this study differs from the previous ones in the following actions: (i) an analysis of the specific wave resource of the WEC installation site is carried out, followed by an experimental design that involves factors affecting a response variable such as the performance of the device, and (ii) from the design of the experiments, a regression model is constructed that is optimized to finally obtain the best performance combination of the WEC.
Under this context, this study focuses on designing an ocean wave generation system with an adaptable oscillating paddle fixed to coastal structures, introducing a unique PTO system. Departing from conventional hydraulic or pneumatic piston-based PTO, this system employs a compact gearbox with bevel gears and two unidirectional clutches for optimal energy utilization in both directions of the paddle’s rotation. The novel PTO design not only represents a mechanical innovation but also contributes to the scientific understanding of efficient wave energy conversion, addressing the drawbacks associated with hydraulic and pneumatic PTO. These conventional systems often encounter issues related to maintenance, inefficiency, and environmental impact, making the presented compact gearbox with bevel gears and unidirectional clutches a promising alternative for more effective and environmentally friendly wave energy conversion. Through rigorous fluid dynamics simulations and real-world experimentation in a wave channel, the study validates the efficiency of PTO, establishing a comprehensive scientific foundation for advancing ocean wave energy conversion technologies.

2. Materials and Methods

2.1. Geometry of the Wave Energy Converter Device

In the development and research of paddle-type devices like the OWSC, characterized by articulated paddles at the bottom and submersion, rectangular parallelepiped geometries have commonly been employed. Table 1 reveals several studies that report the geometric configuration of OWSC as a rectangular parallelepiped. Additionally, the dimensions and scaling factors used in the development of these oscillating paddle wave energy converters (WECs) are provided in the table. This consistent use of rectangular parallelepiped geometries in various studies demonstrates a prevalent design choice, likely influenced by considerations of simplicity, manufacturability, and efficiency in harnessing the wave energy.
Kumawa and coworkers assessed two distinct geometries for a paddle-type WEC, one in the shape of a rectangular parallelepiped and the other resembling a wedge. They concluded that the paddle’s geometry does not significantly impact the power generation of the WEC. Hence, the study adopts the geometry of the oscillating paddle WEC in the form of a rectangular parallelepiped [29].
Considering the recommendations of the International Towing Tank Conference (ITTC), the ratio between the paddle width and the width of the experimental tank should not exceed 0.25. This limitation aims to minimize the blocking effect caused by the waves radiating against the tank walls [19,30]. Consequently, for the laboratory’s available channel with a width of 0.36 m, it is determined that the maximum width of the paddle should be 0.09 m to maintain the aforementioned ratio.
Several studies have established that large-scale WEC devices exhibit low efficiencies in low-energy density wave conditions. These findings highlight the necessity of a significant scaling-down process for WEC devices to achieve optimal operation and performance under low-energy wave scenarios [31,32,33].
In this context, the geometry of the oscillating paddle is derived from Ning et al.’s design of the OWSC, serving as the foundational framework. The width of the paddle is set at 0.09 m, which is determined by its relationship to the channel width. While maintaining the aspect ratio from Ning et al.’s geometry, the dimensions of the paddle are specified as 0.07 m for height, 0.09 m for width, and 0.013 m for thickness. Figure 1 illustrates in detail the adapted geometry employed in the study, engineered to articulate within a fixed coastal structure. This geometry bears a resemblance to oscillating pendulum-type devices (PeWEC) informed in the literature [34,35,36].

2.2. Wave Resource

The power generation system to be developed consisted, firstly, of an oscillating paddle WEC device, set in motion by the impact of waves. This paddle was connected to a direct mechanical PTO system through an articulated axis within the WEC. Subsequently, after obtaining a unidirectional rotation at the PTO output, energy generation becomes feasible.
For the experimental design and analysis of the power generation system, it is essential to scale the wave resource to a laboratory scale. The wave spectrum used was based on the information listed in Table 2 regarding the wave spectrum reported for the Colombian Pacific Ocean region. This spectrum was scaled to the conditions of a laboratory-scale wave flume with dimensions of 5 m in length, 0.5 m in depth, and 0.36 m in width.
The key parameters characterizing waves include the wave length (L), height (H), period (T), and depth (d) along which the waves propagate. Figure 2 provides a visual representation representing the motion of the waves in the X direction over time (t). Celerity, another term for wave speed, is calculated by dividing the distance traveled by the wave within a specified time t, i.e., it is expressed as the ratio L/t [38,39].
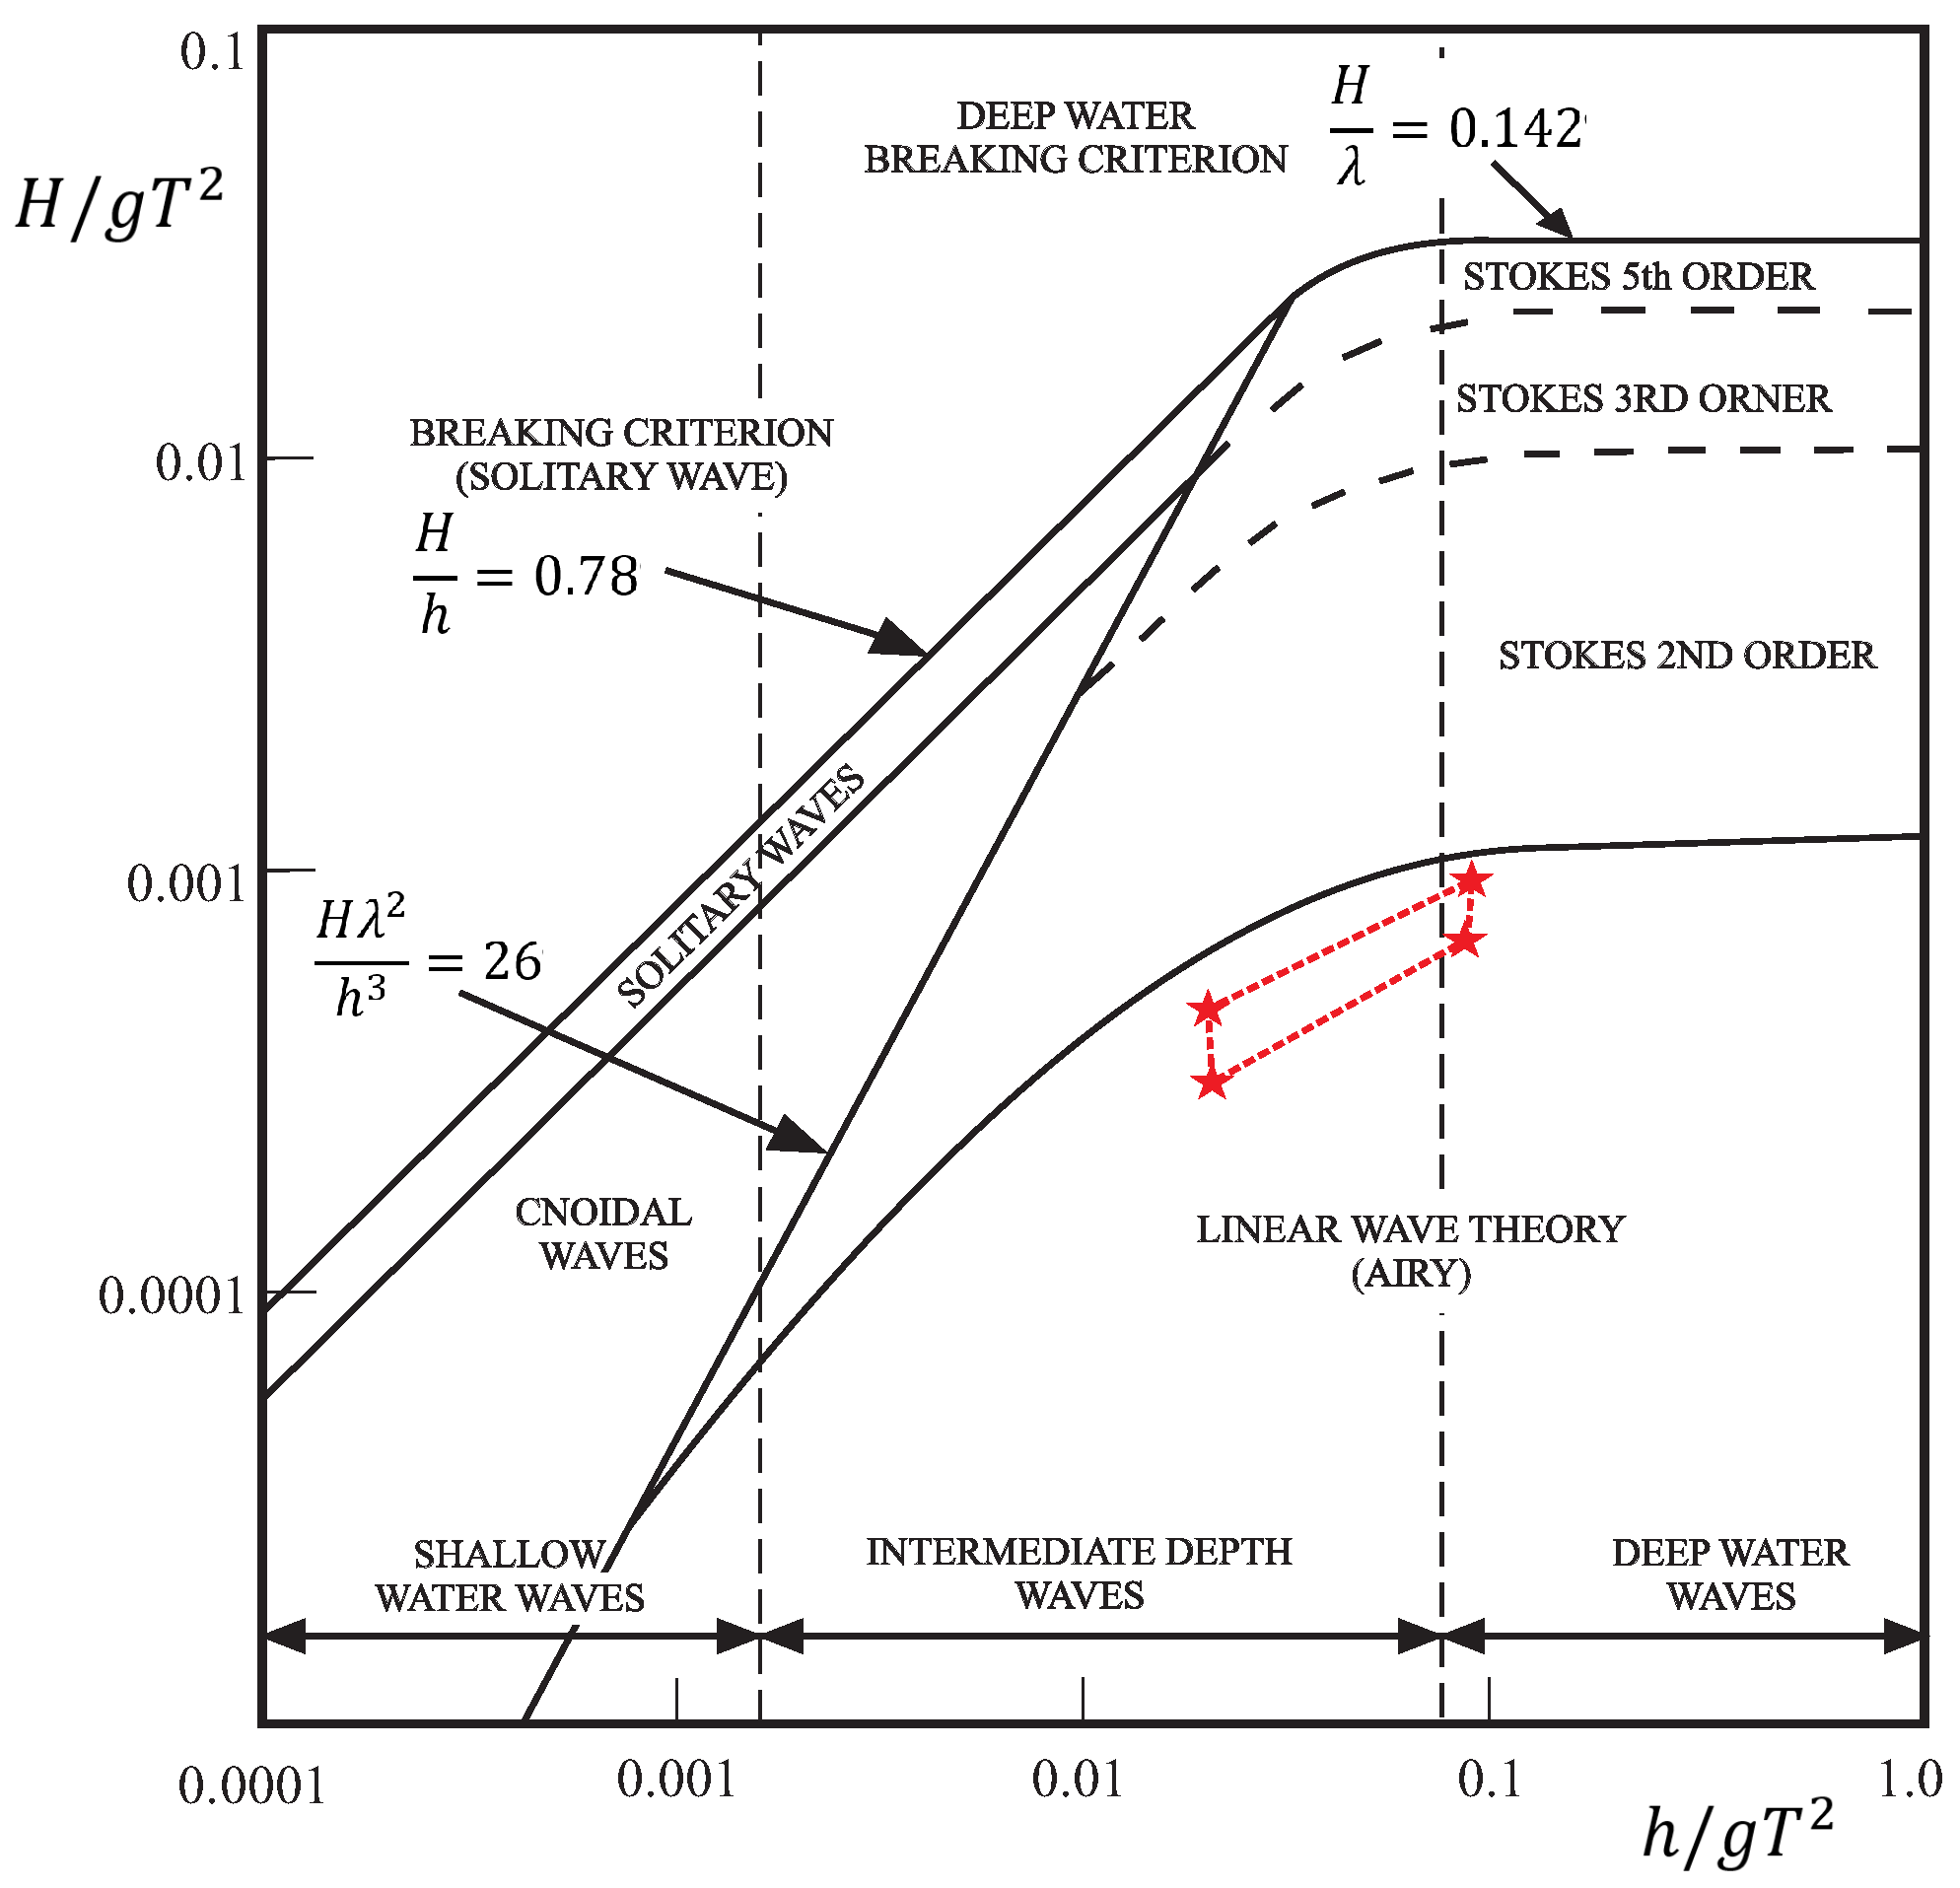
Several mathematical theories have emerged to explain the behavior of waves. Among these, the linear wave theory or the first-order Stokes theory is commonly employed. Le Mehaute proposed qualitative criteria to determine which of these theories is most suitable for describing a particular wave, based on dimensionless values such as T, H, and d [40,41]. By utilizing Le Mehaute’s diagram presented in Figure 3 and the wave conditions from Table 2, for the given wave spectrum, the system was determined to operate within the framework of the linear wave theory. The red zone represents the limit states of the sea that can occur in the specified area of study.
For the scaling process of the wave spectrum, dynamic and kinematic similarities must exist between waves generated in nature and those produced in the wave flume, enabling the scalability of experimental results [37,42]. It is crucial to account for forces influencing fluid dynamics, such as viscosity, gravity, pressure, surface tension, and elasticity, as they are most significant in hydraulic studies. To represent these forces in a nondimensional form, the ratio of forces to the resulting inertial force was considered, leading to the utilization of numbers like Reynolds (Re), Froude (Fr), Strouhal (St), Euler (Eu), Weber, and Cauchy [43]. It is worth noting that, due to the very small values of Weber and Cauchy numbers, they could be neglected. Nevertheless, it was essential to consider the nondimensional numbers Re and Fr [44,45,46]. Additionally, the Euler number, representing pressure forces, will automatically adjust if the other nondimensional numbers are satisfied [47].
The relationship between inertial or gravity-induced forces (Froude number, Fr) can be considered in the scaling process when viscous effects are negligible. Fr is expressed by Equation (1):
F r = ρ V 2 ρ g d = V 2 g d
where V is the fluid velocity; ρ is the density of seawater; and g is the acceleration due to gravity.
In the scaling process using the Fr, it was assumed to be a constant value between the model and the real scale (Equation (2)), thus obtaining λ (Equation (3)). Through λ , the geometric scale is expressed, with p and m representing the prototype and model, respectively [48,49]:
V 2 g d p = V 2 g d m
λ = V m V p 2 = d m d p
Thus, the velocity ratio is expressed as λ 1 / 2 , and the distance ratio or geometric scale is λ . The relationship for the time scale follows the expression described by Equation (4) [48,50]:
T m T p = L m / V m L p / V p = L m L p V p V m = λ 1 λ 1 / 2 = λ 1 / 2
The methodology employed in the scaling process ensures that the values of Fr, St, and Eu obtained under the real wave spectrum conditions are identical [48,49,50].
Finally, the wave spectrum is scaled considering the height ( H a v g ) and average period ( T a v g ) of two of the wave spectra with the lowest energy density reported in Table 3 and a depth of 13 m.
In this context, Table 3 displays the wave spectrum under real conditions and at scale ( λ = 30) for the available wave tank with 5 m long, 0.35 m wide and 0.5 m deep.

2.3. Computational Simulation

Numerical simulation plays a pivotal role in the study and design of wave energy conversion systems. In this context, computational fluid dynamics (CFD) emerges as a valuable tool that enables a detailed analysis of the complex interactions between the fluid and the structures of the WEC. To accurately address the hydrodynamic characteristics of this WEC, a simulation strategy is implemented, which divides the domain into two fundamental regions: a rotational part, modeling the oscillating motion of the paddle, and a stationary region representing the surrounding environment (Figure 4). This approach allows for the precise capture of the flow complexity around the paddles and their interaction with the surrounding fluid.
The simulation was conducted in a two-dimensional (2D) environment, leveraging the computational advantages of simplified models without compromising precision in representing system behavior. It is important to note that a crucial aspect of the simulation is the generation of an appropriate mesh for each of the defined domains. The meshing process plays a critical role in the accuracy and efficiency of the CFD simulation, allowing for a detailed representation of the geometries and flows involved. Figure 5 presents the mesh generated for the stationary Figure 5a and rotational Figure 5b domains. In Table 4, the mesh quality metrics used in the study are presented.
To select the size of the elements by which the domains were discretized and to determine the size of the time step for simulations, an analysis of the spatial and temporal independence was performed using the Richardson extrapolation method. This method is widely employed to quantify the error between the results of different mesh sizes [51,52,53,54]. As the size of the elements or time step approaches zero, i.e., when the number of elements tends to infinity, this method enables to estimate the solution and measure the difference between the obtained numerical results and the calculated asymptotic value [55].
Figure 6 graphically presents the spatial independence results, where the three plotted points correspond to mesh element sizes of 2, 3, and 4 mm, denoted as fine, medium, and coarse meshes, respectively. Table 5 provides the results of the application of the method, where ϕ represents the torque on the paddle axis, which is the variable analyzed as a result of each simulation; N 1 , N 2 , and N 3 correspond to the number of elements in the fine, medium, and coarse meshes, respectively; ϕ h 0 represents the torque value calculated when the element size tends to zero; G C I 1 , 2 and G C I 2 , 3 are the convergence indices between meshes 1 and 2 and meshes 2 and 3, respectively; and R is the convergence ratio, which is expected to be close to 1 for monotonic convergence [56].
This procedure was carried out to determine the appropriate time step; the results are reported in Figure 7 and Table 6.
It can be concluded that for time step values below 0.0005 s, the torque on the paddle’s shaft will not exhibit significant variations in the simulation results. It is determined that a time step of 0.0005 s should be used to optimize the computational cost and computation time in the numerical solution. On the other hand, spatial independence was achieved with an average element size of 2 mm, thus maintaining a ratio of 16 mesh elements describing the wave H (33 mm). This aligns with findings reported in the literature [15], where in the discretization of the domain for wave generation through numerical simulation, at least 12 mesh cells per wave H were ensured.
The numerical wave tank simulation is based on the Volume of Fluid (VOF) method, which has been extensively developed by various authors for the numerical simulation of WEC devices, both at laboratory-scale wave tanks and at full scale [15,20,24,25,26,27,28]. Additionally, the numerical model adopts the Implicit Pressure Splitting with Operator Splitting (PISO) algorithm to couple the pressure and momentum equations. This noniterative technique resolves the pressure–velocity coupling at the discrete level [57]. In Figure 8, the initial phase contour of the simulation is shown. The blue color represents 100% air, while the red color indicates 100% water. Additionally, the interface between the two phases and a portion of the paddle immersed in the water are identifiable.
The numerical studies were conducted based on turbulence models regarding simulations of paddle-type devices similar to a pendulum [23,34,35,58]. In this regard, the turbulence model established to be used was the standard k- ϵ model. Table 7 presents the conditions under which the numerical simulations were performed.

2.4. Optimization of the Wave Energy Generation System

Response surface methodology (RSM) was employed since it allows a reasonable distribution of points in the defined space and many experimental runs are not required; thus, the execution time is optimized [59,60]. To model the existing quadratic relationship between the factors X1 and X2, it was determined that a 3 k factorial design was the most suitable design of the experiments, given that 2 factors were analyzed at 3 levels of variation ( 3 2 ). Therefore, only 9 experimental runs were required to analyze the design behavior.
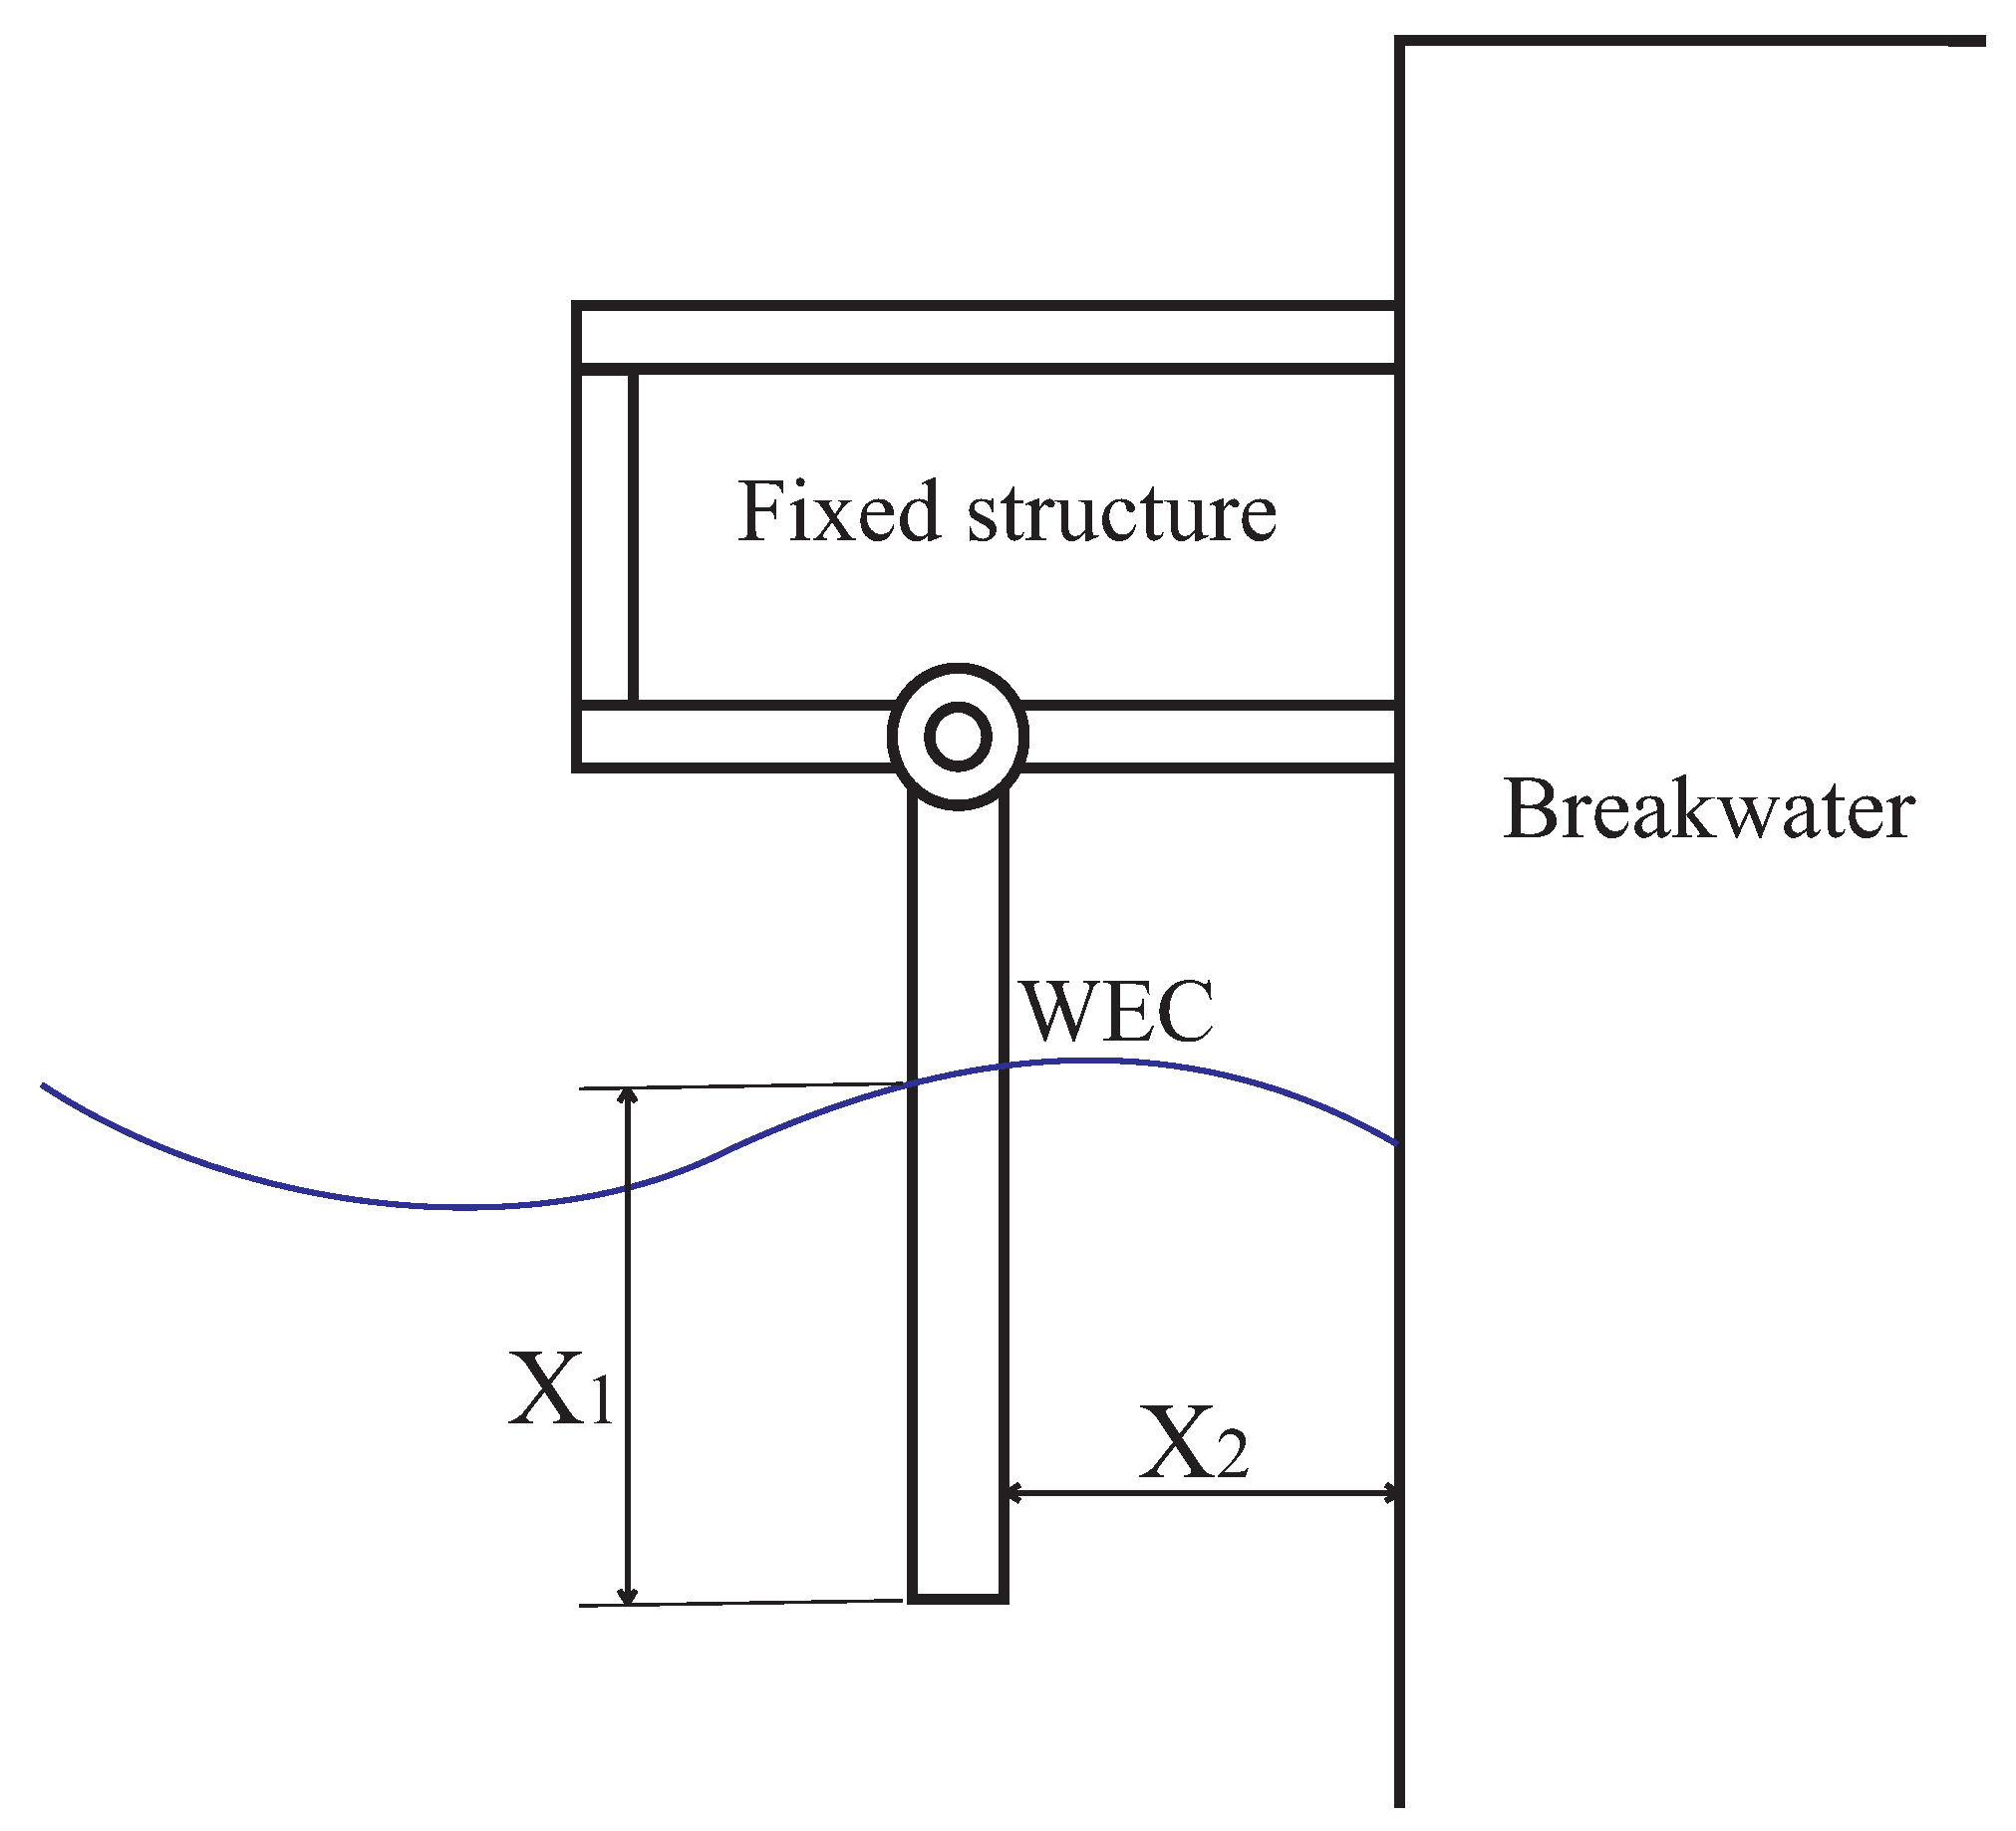
For the oscillating paddle-type WEC under consideration, two factors were defined, related to the percentage of the paddle submerged below the water surface (X1) and in terms of the distance from the device to the breakwater as a percentage of the wave’s length (X2) (Figure 9). The factors X1 and X2 were defined considering the aforementioned insignificance of the paddle profile regarding the device’s performance. Additionally, we took into account the study conducted by Sarkar et al. [61], where they demonstrated that, for a paddle-type device resembling a pendulum, the distance from the device to the breakwater significantly affects the WEC performance. The response variable was defined as the system’s generation efficiency ( η ) through the oscillating WEC. The value of η was defined as the ratio between the power generated by the device ( P g ) (Equation (5)) and the available wave power ( P w ) (Equation (6)); η is represented by Equation (7). After obtaining the torque on the WEC axis and its angular velocity through numerical simulations, it was possible to determine the power available in it (Equation (5)); in addition, the available power was known in relation to the available wave spectrum (Equation (6)). Finally, the efficiency of the WEC was defined as the ratio between the generated power and the available power (Equation (7)). Likewise, in the experimental setup, it was possible to obtain the angular velocity and torque on the axis with the use of the torque sensor with encoder while the brake was applied to the other end of the sensor, and in this way, it was possible to obtain torque data and angular velocity on the axis of the WEC. Finally, the efficiency was calculated in the same way as in the results of the numerical simulations:
P g = T ω
where T is the torque, and ω is the mean angular velocity at the device’s axis.
P w = 0.344 H 2 T
η = P g P w
Based on these considerations and aiming to model the quadratic relationship between the factors X1 and X2, the factors were varied within 3 levels, namely, (i) high, (ii) medium, and (iii) low, represented as −1, 0, and 1, respectively. The values of each level, as well as their standardization for experimental analysis, are presented in Table 8.
Factors X1 and X2 play crucial roles in this study due to their impact on the interaction between the WEC and both incident and reflected waves, as well as on the volume of water involved. Factor X1 represents the percentage of submergence of the WEC blade height beneath the water surface, with variations ranging from 25% to 75% of b. These values were carefully selected to optimize interaction with the surrounding water volume. A submergence percentage that is too low may limit the WEC ability to harness the wave energy, while an excessively high submergence may increase hydrodynamic resistance and lead to stability issues. The range between 25% and 75% of the blade height was considered suitable for maximizing the energy capture efficiency while striking a balance between an adequate submergence and minimizing the hydrodynamic resistance. Concerning Factor X2, which represents the distance from the device to the breakwater as a percentage of L, it has variations ranging from 5% to 10% of L. This range was chosen considering the potential consequences of being too close or too far from the breakwater. Proximity to the breakwater may result in an excessive interaction with the incident and the reflected waves, potentially causing performance and stability issues. Conversely, being too far away may reduce the energy capture efficiency due to a diminished wave amplitude. Therefore, the range from 5% to 10% of the wave length allows for the exploration of distances that encompass a significant wave interaction while still ensuring an effective energy capture.

2.5. Experimental Validation

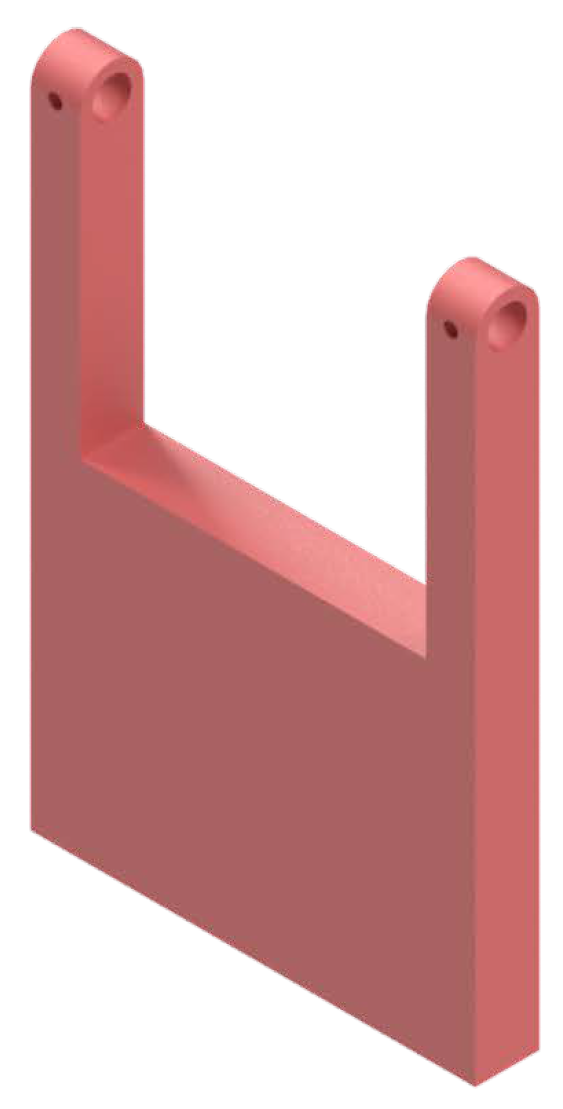
Figure 10 depicts the oscillating paddle manufactured through 3D printing, utilizing PLA as the fabrication material. PLA was chosen for its favorable mechanical properties, suitable for the low loads experienced in the laboratory-scale PTO system.
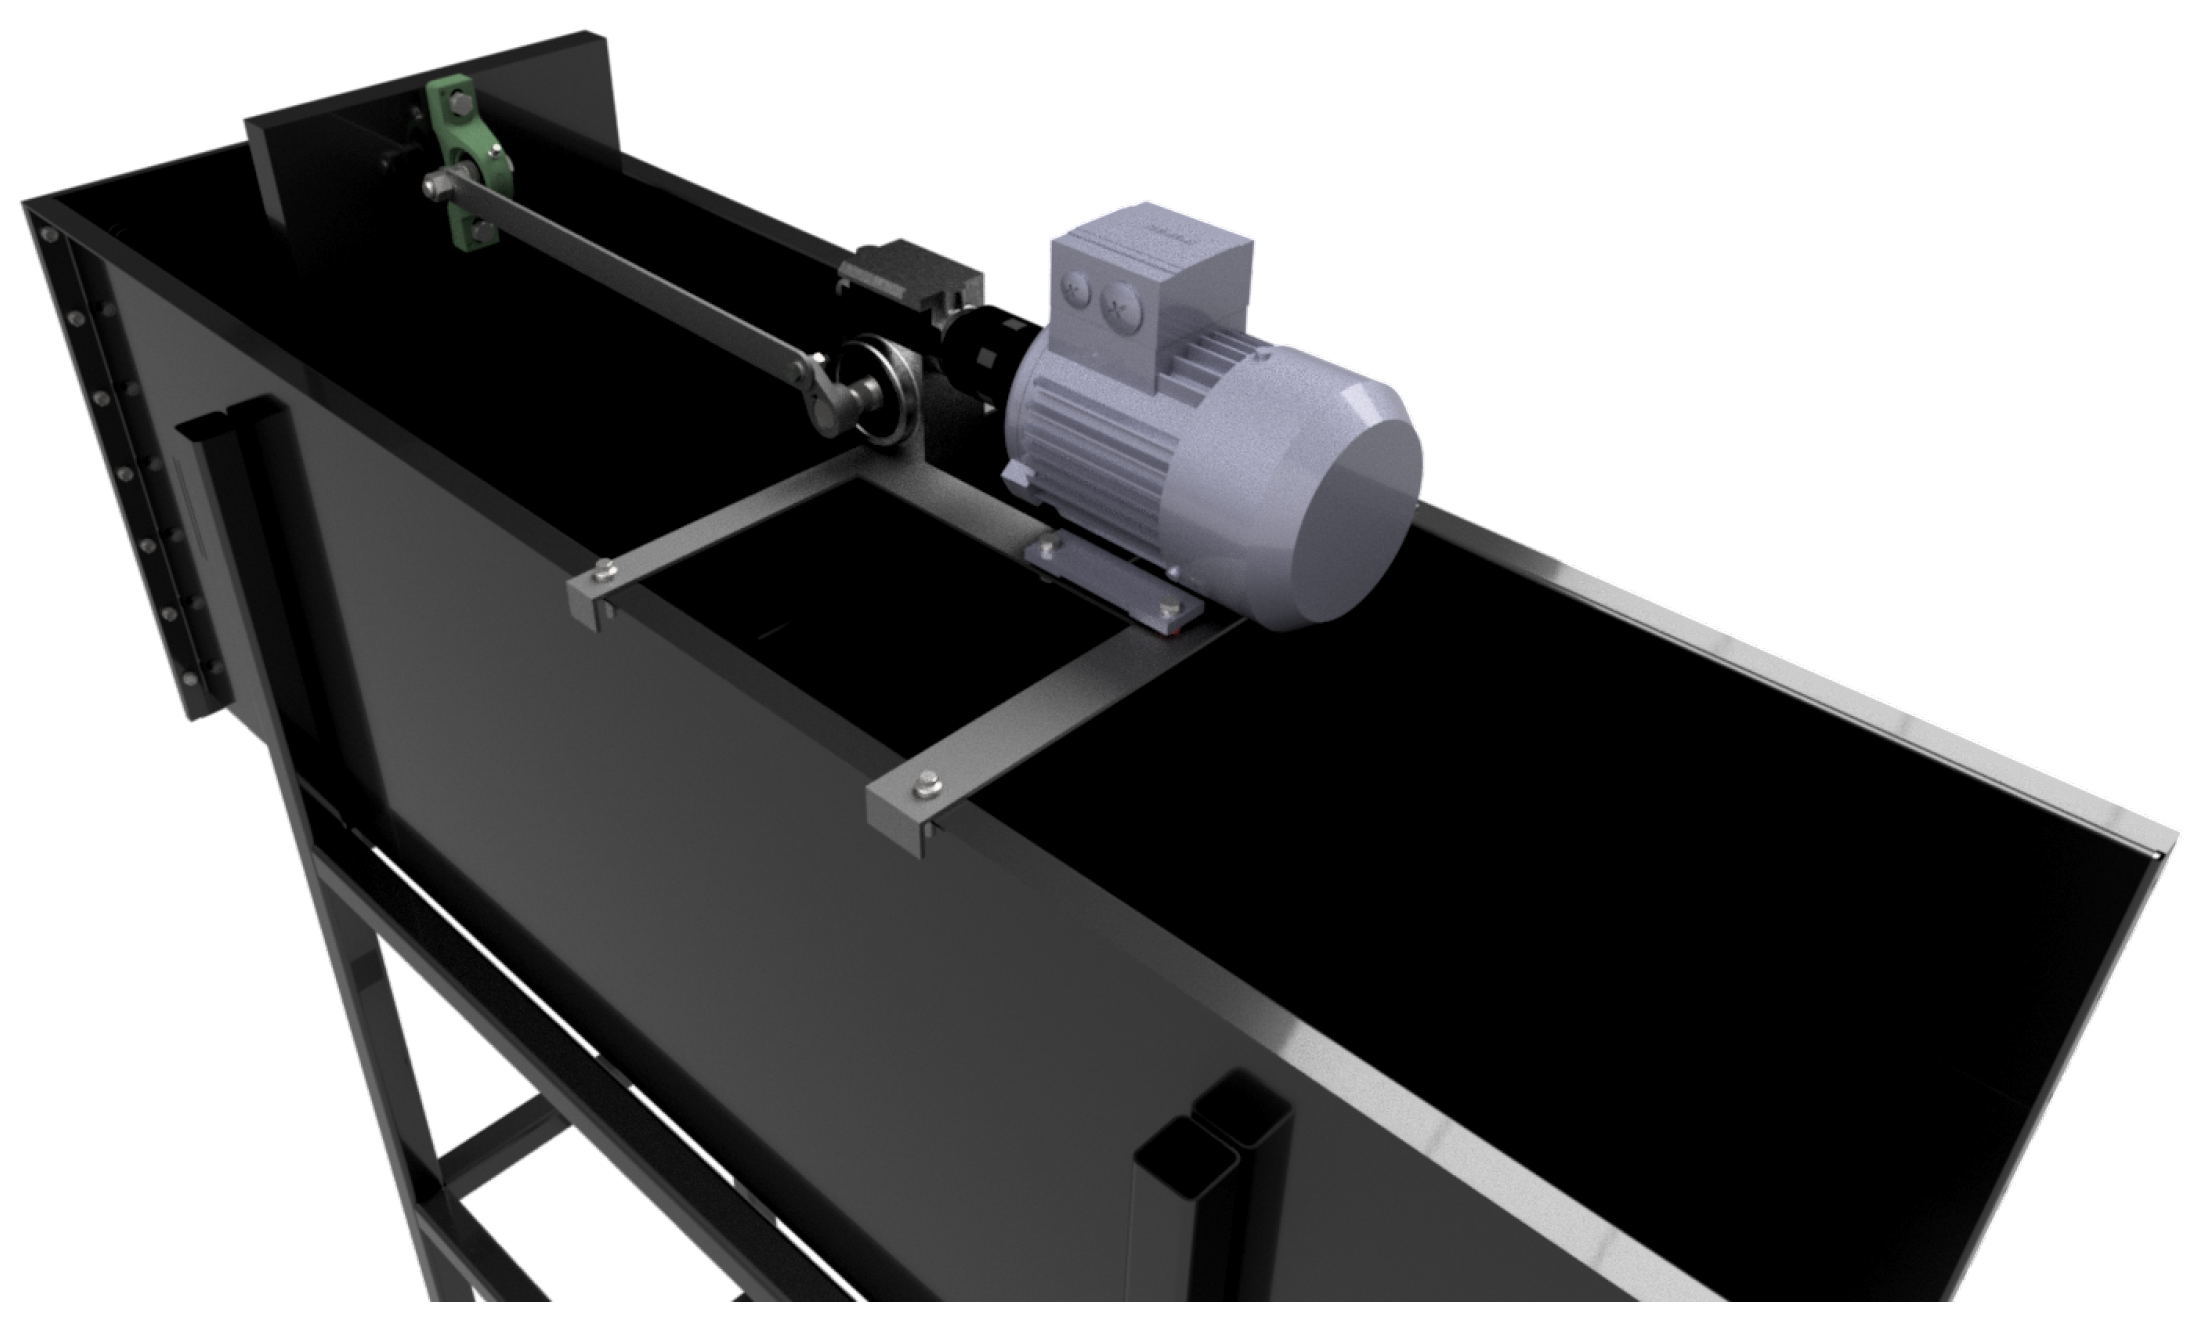
In the wave generation process, parameters controlling the movement of the wave generator must be incorporated into the system, such as the stroke of the wave-generating paddle, velocity, and acceleration–deceleration. These parameters describe the motion of the wave generator. The period during which the generation system moves corresponds to the period of the generated wave [61]. The shape of the wave generator is depicted in Figure 11.
It is assumed that the wave generator frequency is the same as the frequency of the waves to be produced as determined in [43]. Therefore, using Equation (8), the wave height (H) to be generated can be related to the stroke of the wave generator (S) [49].
H S = 4 S i n h ( k d ) k d k h S i n h ( k d ) C o s h ( k d ) + 1 S e n h ( 2 k d ) + 2 k d
where k is considered the wave number, which is equal to 2 π /L, and d is the water depth. In this context, for a d of 0.43 m, H of 0.033 m, L of 2.3 m, and T of 1.33 s, the stroke and frequency of the wave generator are 0.043 m and 0.75 Hz, respectively, meaning the motor responsible for moving the wave generator should rotate at 45 RPM. Figure 12 illustrates the mechanism by which the necessary wave spectrum for experimental tests is generated. The mechanism was designed using a synthesis of two-position mechanisms, incorporating a 30:1 ratio gearbox to decrease the initial motor speed from 3320 to 110 RPM. Additionally, to ensure the required rotation speed of 45 RPM, a frequency inverter was employed, running the motor at 24.5 Hz. The torque delivered by the gearbox to the mechanism was 65.2 Nm, which was sufficient to move the paddle and push the required volume of water. The mechanism consisted of two bars, the connecting rod and the crank, with lengths of 394 mm and 31 mm, respectively.
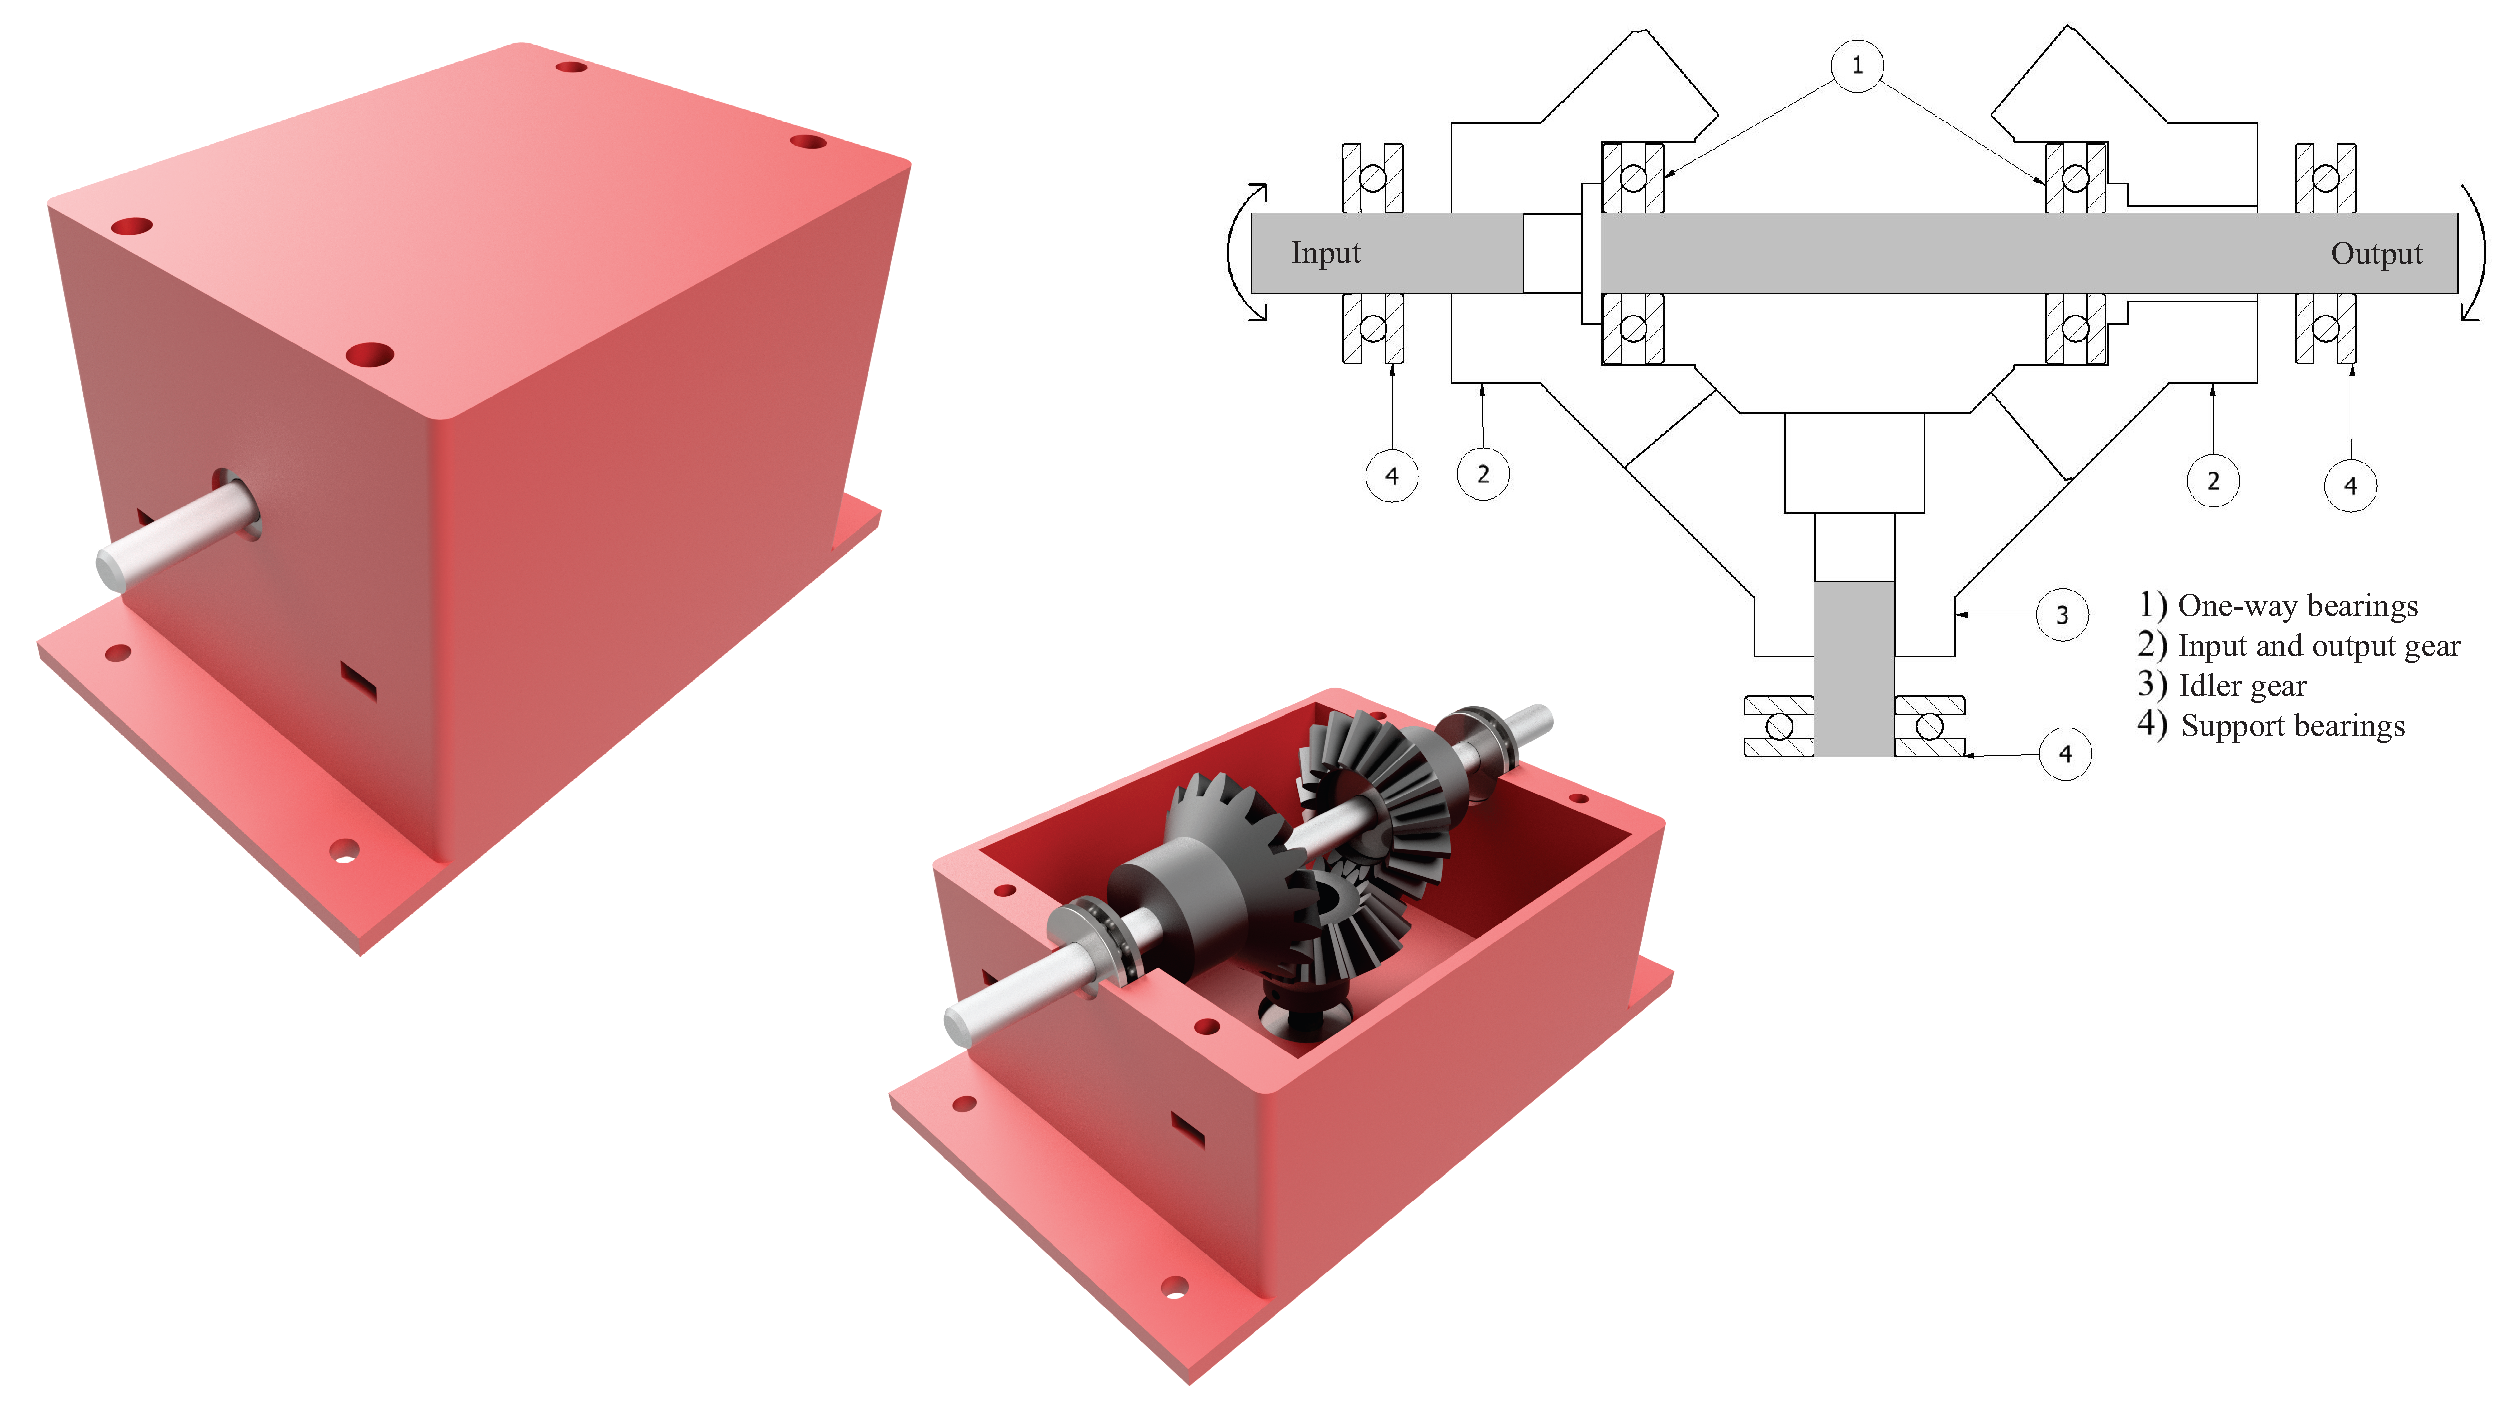
The PTO system shown in Figure 13 consists of a set of bevel gears arranged in a differential configuration, two one-way or ratchet bearings, an input shaft, an output shaft, and finally, an intermediate gear shaft. The mechanism can convert the alternative rotational motion in two directions into unidirectional motion on the output shaft, achieved by using two one-way bearings coupled to the input and output bevel gears positioned opposite each other. In this regard, the input motion will activate one of the ratchet bearings coupled to the mentioned bevel gears. In one scenario, the motion was transmitted through the input gear to the output shaft; in the other case, the motion was transmitted through the idler gear located at the bottom of the mechanism. This ensured that the same direction of rotation would be obtained on the output shaft as in the former case.
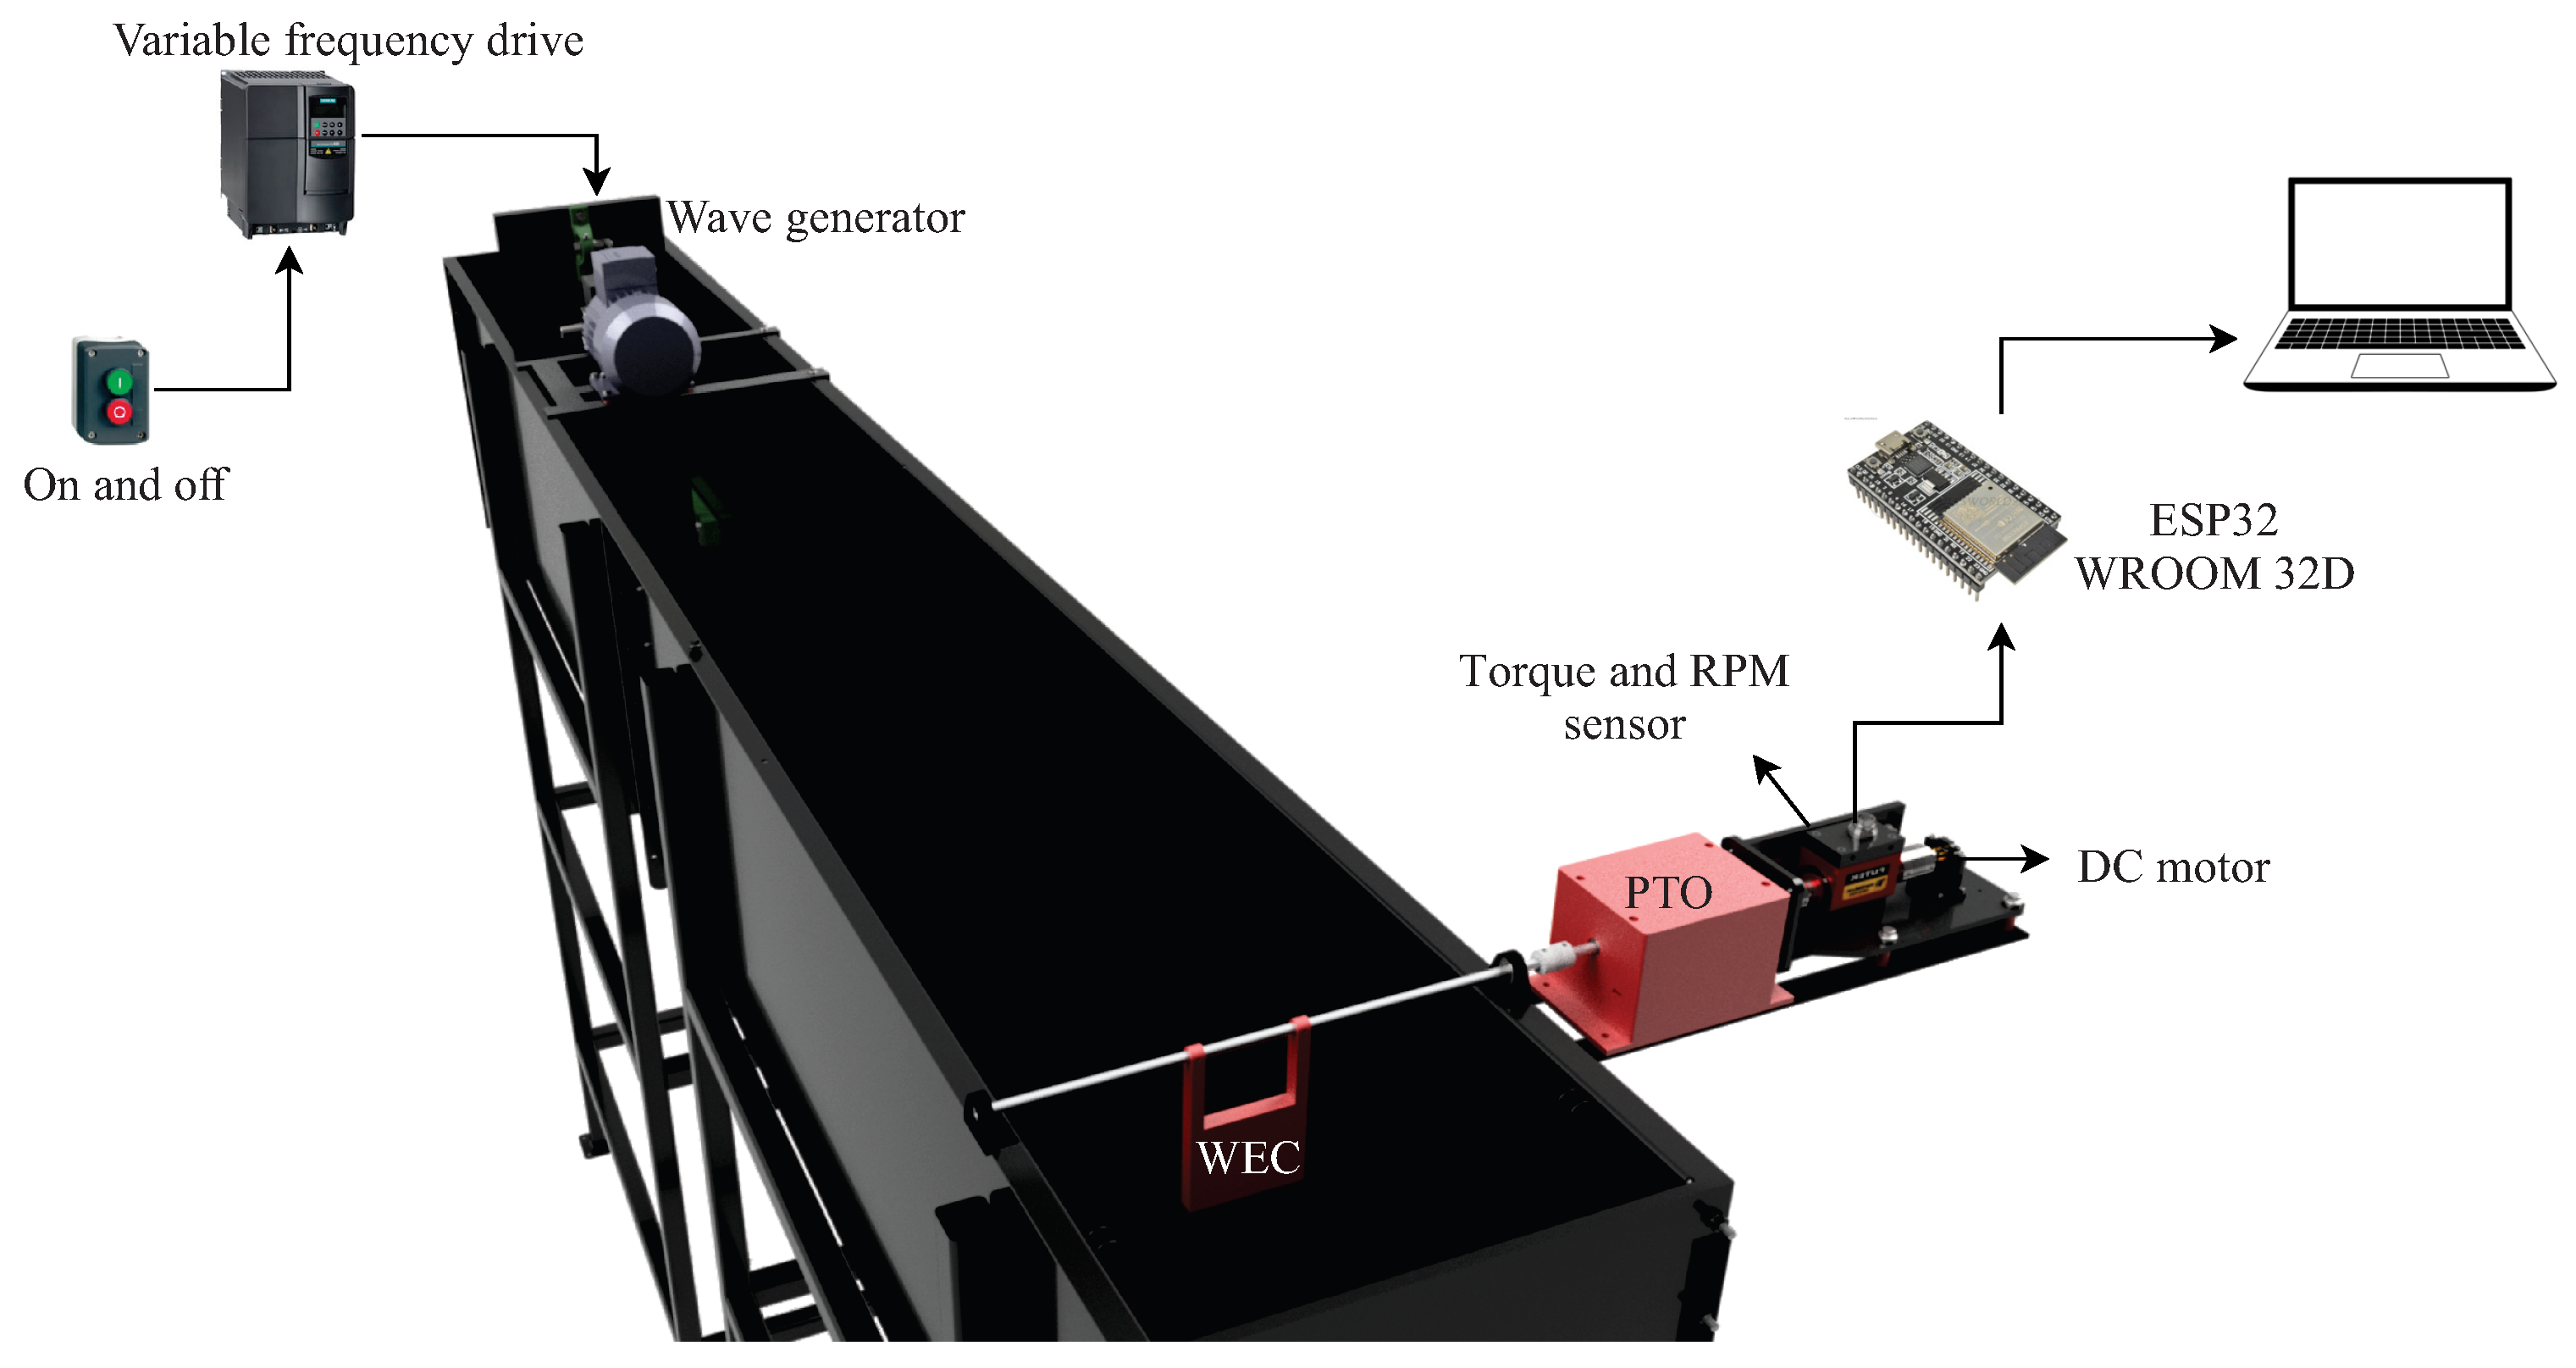
Once the laboratory-scale model of the paddle was obtained through 3D printing, the experimental setup was constructed to determine the operating conditions of the WEC under the previously mentioned wave conditions and to be compared with the data obtained through numerical simulations. The experimental assembly of the system consisted of 7 parts: the measurement system, bearing supports, PTO system, shaft, oscillating paddle, flexible mechanical couplings, and the base supporting the components, as illustrated in Figure 14.
The measurement system used consisted of a torque sensor and a DC motor. The torque sensor employed was the FUTEK TRS 605-FSH02052 sensor (Futek, Irvine, CA, USA) which had an operating range of 0 to 1 Nm. Additionally, this sensor was equipped with an encoder, enabling the measurement of the shaft’s rotational speed. The primary function of the DC motor was to provide resistance to the movement of the oscillating paddle, acting as a brake.
As mentioned earlier, the rotary torque sensor TRS605 with a measurement range of −1 to 1 Nm and an output of −5 to 5 V was used for torque and speed measurements. It was connected to a data acquisition system composed of a 16-bit resolution analog-to-digital converter (ADS1115, Texas Instruments, Dallas, TX, USA) and an 80 MHz microcontroller (ESP32 WROOM 32D, Espressif Systems, Shanghai, China). The measurements of speed and torque were stored on a computer in a plain text file using the open-source software Putty, (version 0.78) through the USB communication port. A sampling frequency of 50 Hz was employed for torque measurement. Figure 15 represents the experimental setup.
To determine the torque generated by the paddle, it was necessary to apply a brake on the opposite side of the torque sensor, as mentioned earlier. This was accomplished by progressively increasing the load on the DC motor, which opposes the rotational movement at the output of the PTO system, causing a decrease in the speed and an increase in the generated torque. The motor load was increased until completely stopping the shaft, thereby concluding the experimental test. Finally, with the obtained data, the power under different operating conditions was determined, and the point of maximum η of the device was identified.

3. Results

3.1. Results of the Numerical Simulations

Firstly, it is important to mention that, during the numerical simulation of the blade, perturbations in the position of the interface between the rotational and stationary domains occurred. Consequently, significant pressure gradients arose on both sides of the blade. This resulting pressure on the device led to large displacements and caused the divergence of the iterations. Similar behavior in numerical simulations was reported in previous studies, and consequently, ω was determined using a fourth-order multipoint Adams–Moulton scheme [15,25,26].
The paddle-type WEC is a single-degree-of-freedom device. The rotation of this can be calculated by numerically integrating the Newton–Euler equations of motion as shown in Equation (9):
I α = T
where I is the moment of inertia of the blade, α is the angular acceleration, and T is the total torque exerted on the blade.
Once the accelerations were calculated from Equation (9), ω was determined by integrating Equation (9). A fourth-order multipoint Adams–Moulton scheme was utilized for this purpose. Subsequently, the ω was time-updated as described in Equation (10) [20,26,27]:
ω k + 1 = ω k + Δ t 24 ( 9 α k + 1 + 19 α k 5 α k 1 + α k 2 )
After conducting numerical simulations for different arrangements of the device, the η values of the device were obtained for each treatment. These results are summarized in Table 9. Subsequently, the data were statistically analyzed to establish a mathematical model that could predict the best combination of levels to achieve the highest system η with the blade. This analysis was performed using the R Studio open-source statistical software, version 4.3.2 allowing for data modeling and processing.
In numerous engineering applications requiring the approximation of a function, the choice is often made to create second-order polynomial models. This is because such models can effectively represent the main effects of independent variables and their interactions on the response variable. Furthermore, in the field of WEC device design, second-order response surfaces were utilized [62]. Accordingly, the analysis was based on a quadratic regression model, aiming to assess the individual, combined, and quadratic effects of the independent factors ( X 1 and X 2 ) on the response variable ( η ). In this regard, the mathematical expression describing the WEC performance response in relation to X 1 and X 2 is given by Equation (11):
η = 0.2501 1.3612 X 1 1.1933 X 2 + 1.2872 X 1 2 + 11.1680 X 1 X 2
Table 10 reports the results from the analysis of variance (ANOVA) for the constructed regression model, which relates the independent variables to the response variable. (SS), (d.f), and (MS) refer to the sum of squares, degrees of freedom, and mean squares, respectively. The results show a p-value for the model of 7.70 × 10 5 ; R 2 of 97.56%, and a R a d j 2 of 95.93%, indicating that the model is highly significant and suitable for representing the relationship between the independent variables and the response variable.
According to the results obtained from the ANOVA, it is possible to determine that the variable associated with how much the paddle-type WEC should be submerged in the water ( X 1 ) has a greater impact on η and, subsequently, a greater significance in the model, considering the p-value in comparison with the other terms of the regression model.
The constructed model allows determining the optimal design point, which involves identifying the combination of factors that results in the maximum or minimum value of the response variable [59]. In the case of the response surface optimization, the optimal point is, by definition, the point where a tangent plane to the response surface has a slope equal to zero [63].
For this purpose, the Statgraphics Centurion software, version 18 package was employed. Numerical data from the treatments were input into the software, which internally analyzed the results, yielding a combination of levels considered optimal. During the optimization process, the aim was to maximize the response variable, and it was found that the combination of values for the independent variables achieving this goal was 0.75 b for X 1 and 0.1 L for X 2 . It was observed that the optimal point was located at one of the limits of the experimental design, suggesting that by expanding the range of experimental design levels, larger values for the device performance could be achieved. However, it is crucial to note that the arrangement is limited in terms of the separation of the device from the vertical breakwater since the objective was a WEC that could be coupled to the breakwater. Increasing the distance from the device to the breakwater might result in higher performance points, but the anchoring process would become impractical.
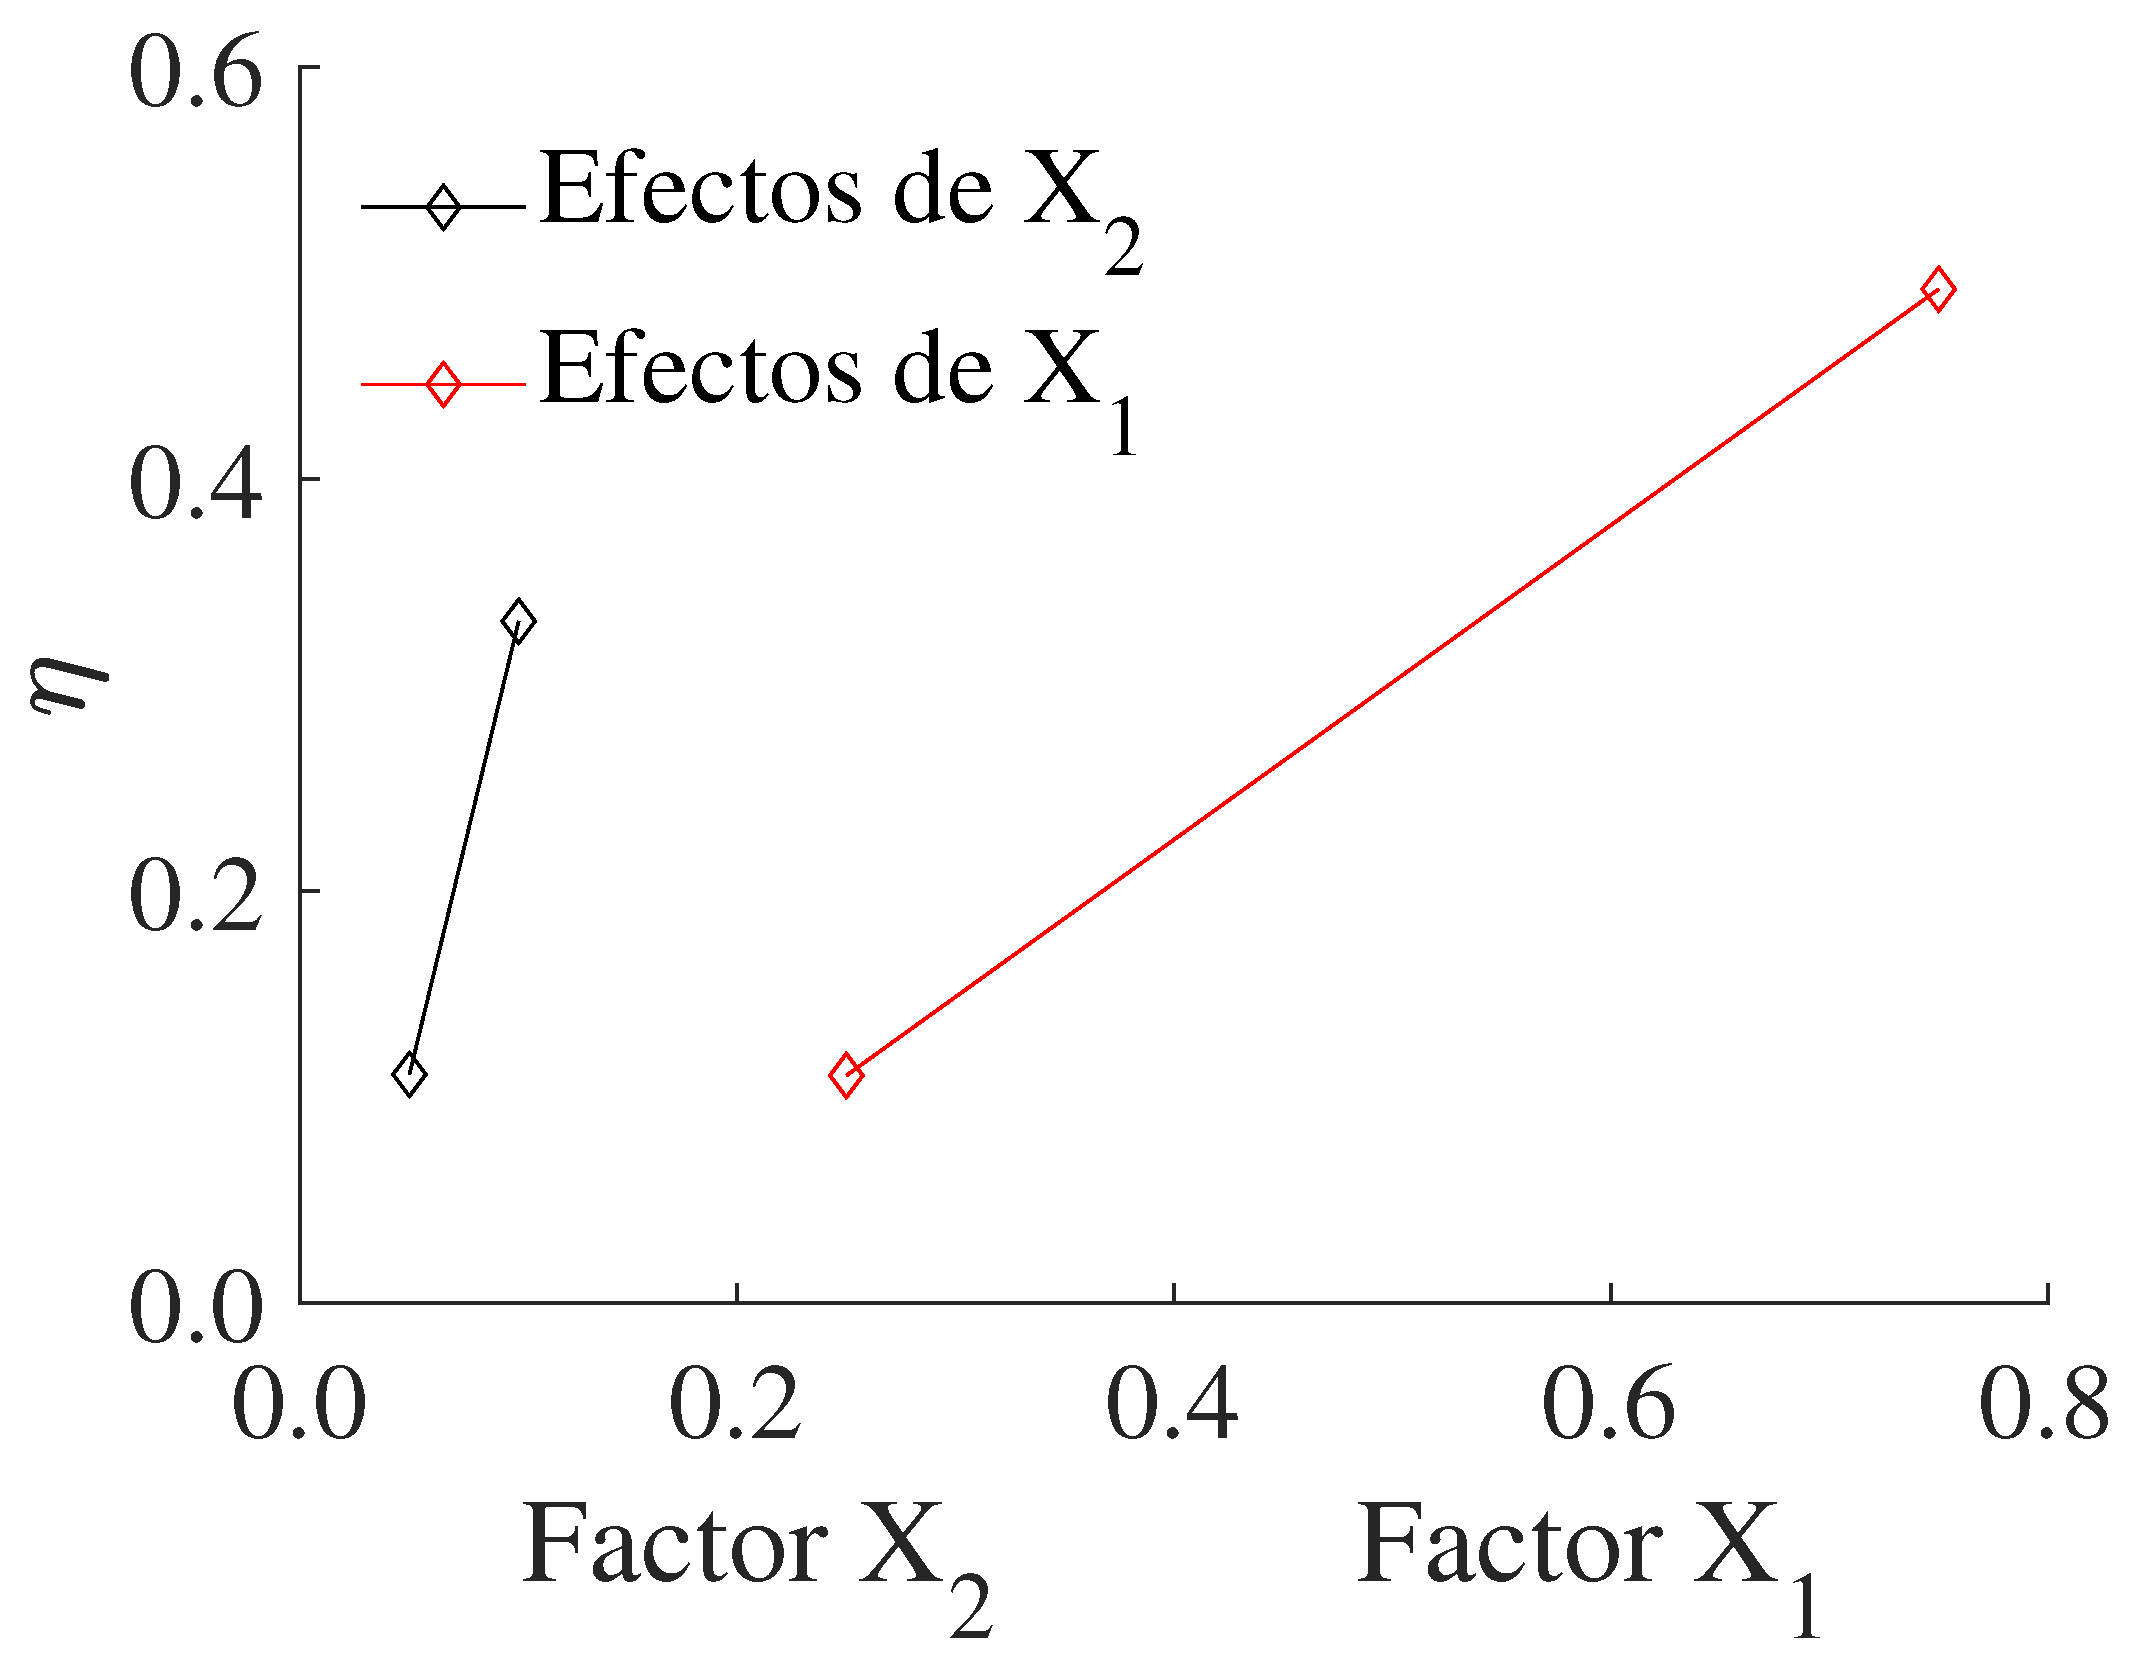
Figure 16 illustrates the interaction graph of the factors, clearly demonstrating the impact of each factor on the efficiency of the WEC. The graph reveals that as the values of X1 and X2 increase, the WEC efficiency is correspondingly improved. This positive correlation highlights the significance of optimizing these factors to enhance the overall performance of the system.
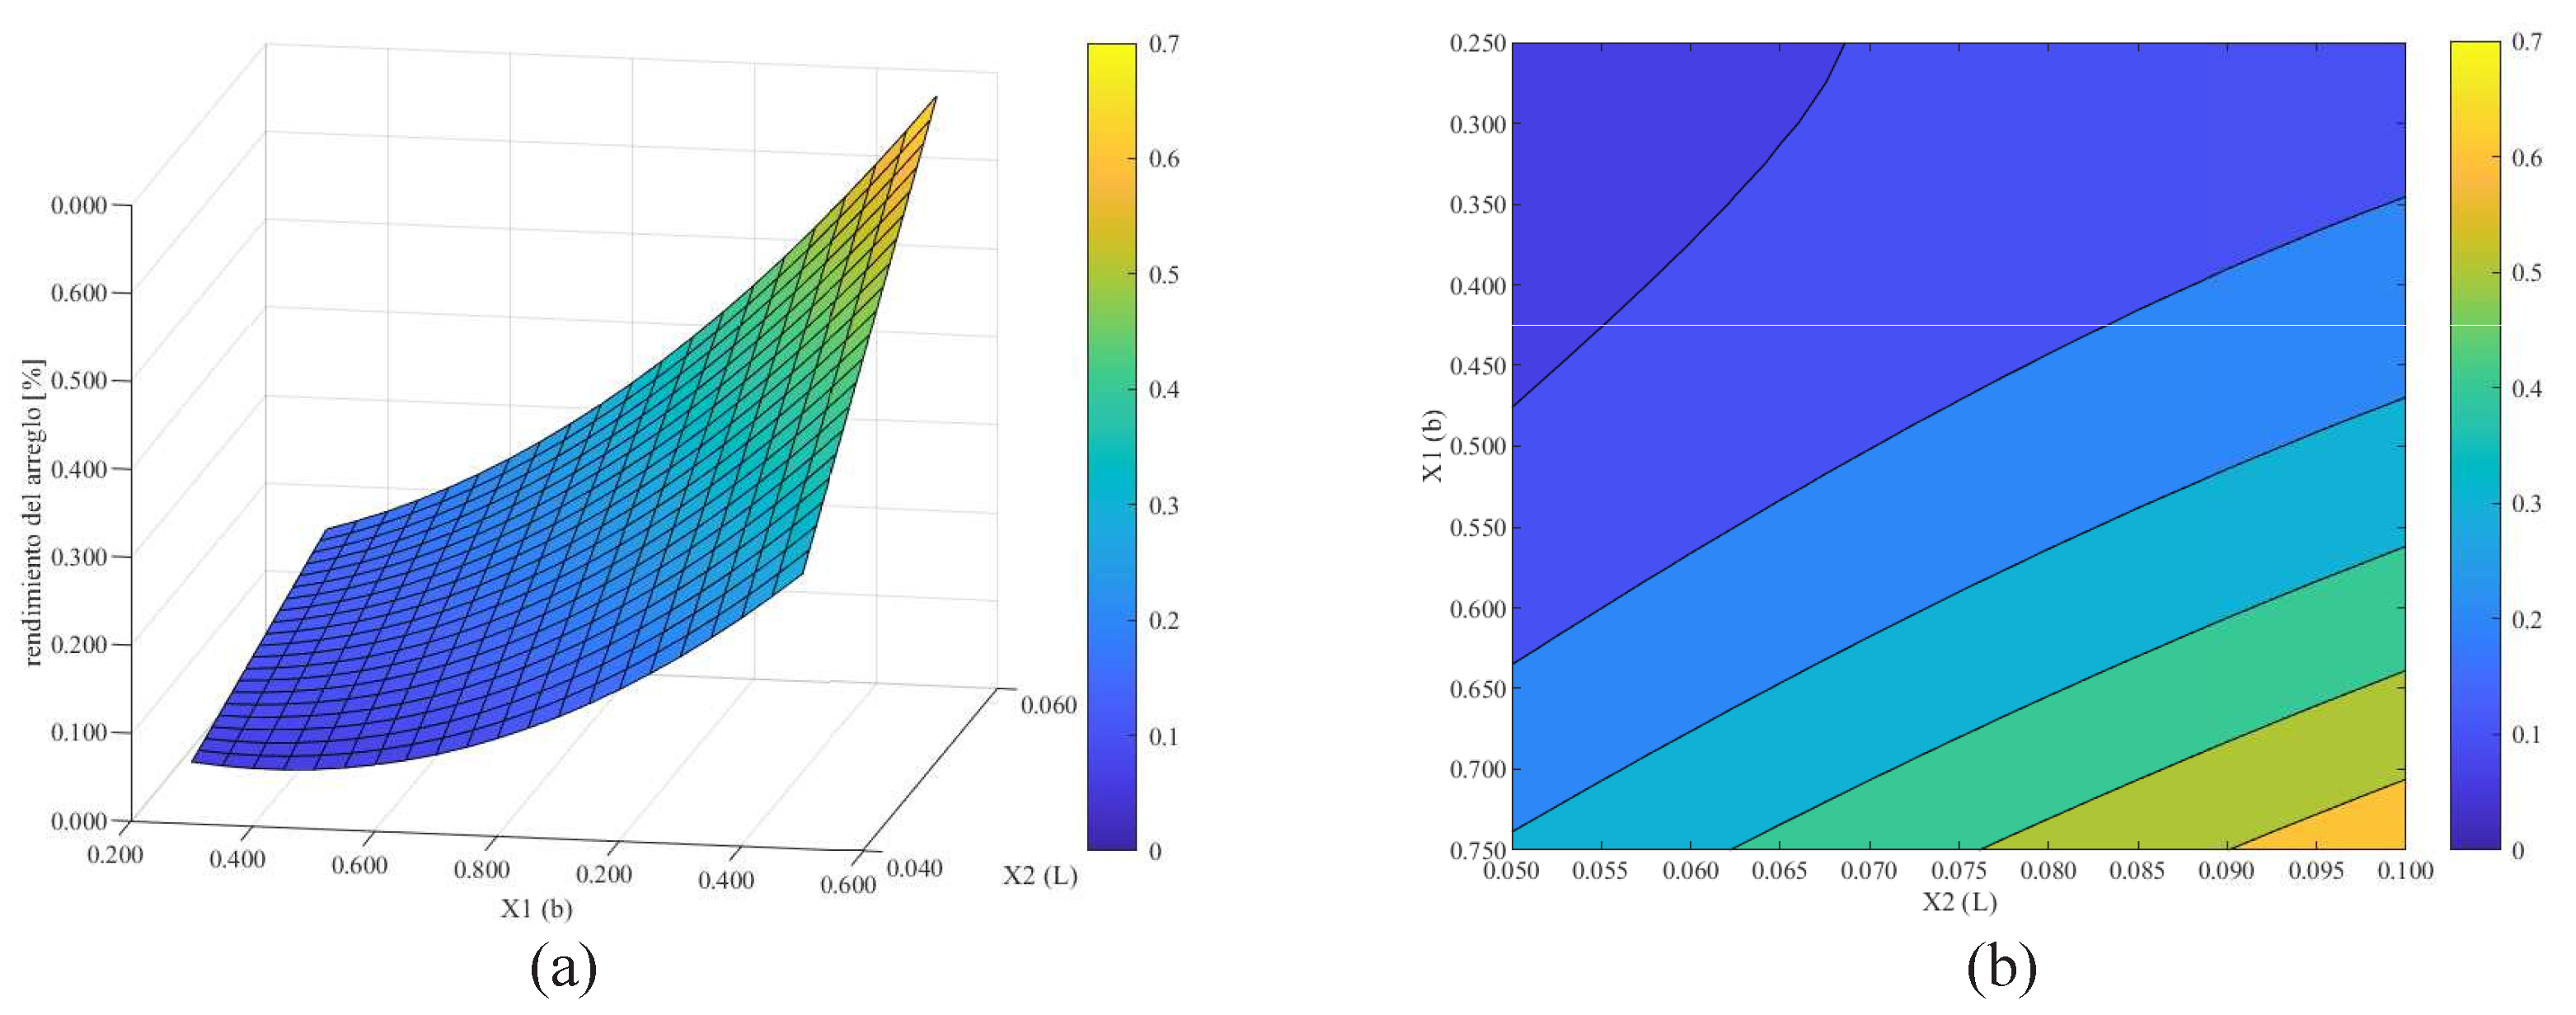
Figure 17 presents different perspectives of the response surface obtained from the optimization process described above, which comprises combinations of treatments obtained in the experimental design.
In this context, based on numerical simulations and the constructed regression model, it is found that within the evaluated range, for the specific wave spectrum, the maximum η obtained for the WEC was 64.8%. This was achieved when the paddle was submerged by 75% of its length and was positioned at a d of 10% of the wave L from the breakwater. As mentioned earlier, it would be possible to find points of higher performance by moving the device away from the breakwater; however, this would complicate the anchoring process. For this reason, the goal was to position the WEC at the maximum possible distance from the vertical breakwater while still being able to anchor it.

3.2. Experimental Results

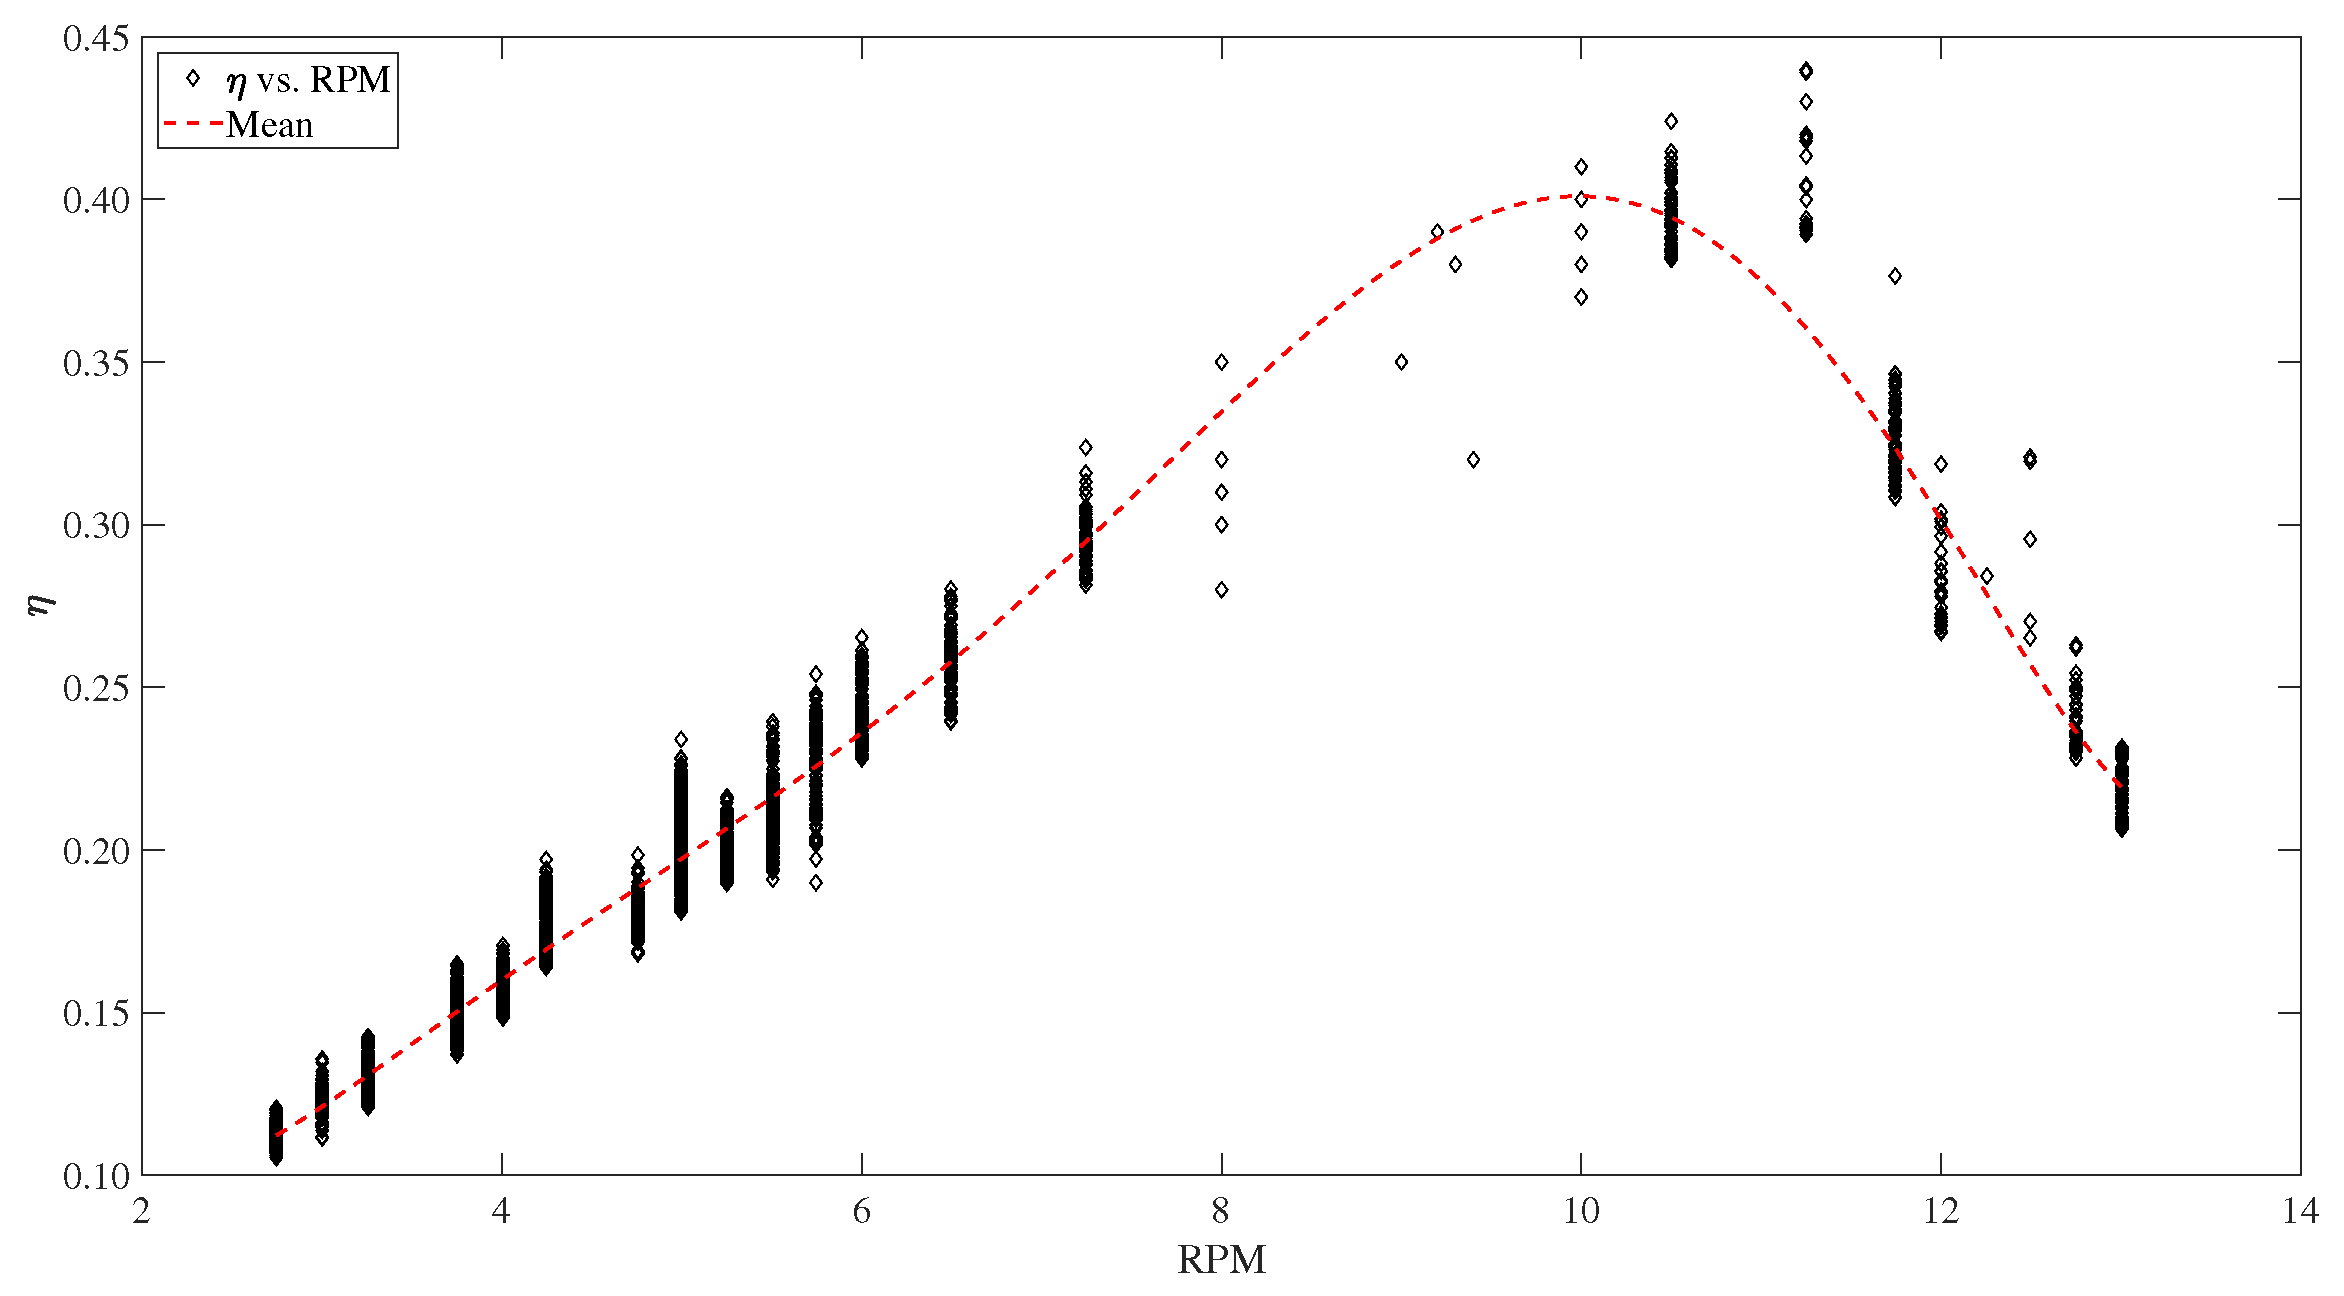
Upon completion of the experimental tests, data were collected to construct the curve of η vs. RPM. The experimentally obtained data for the oscillating paddle WEC system and the direct mechanical PTO system are summarized in Figure 18.
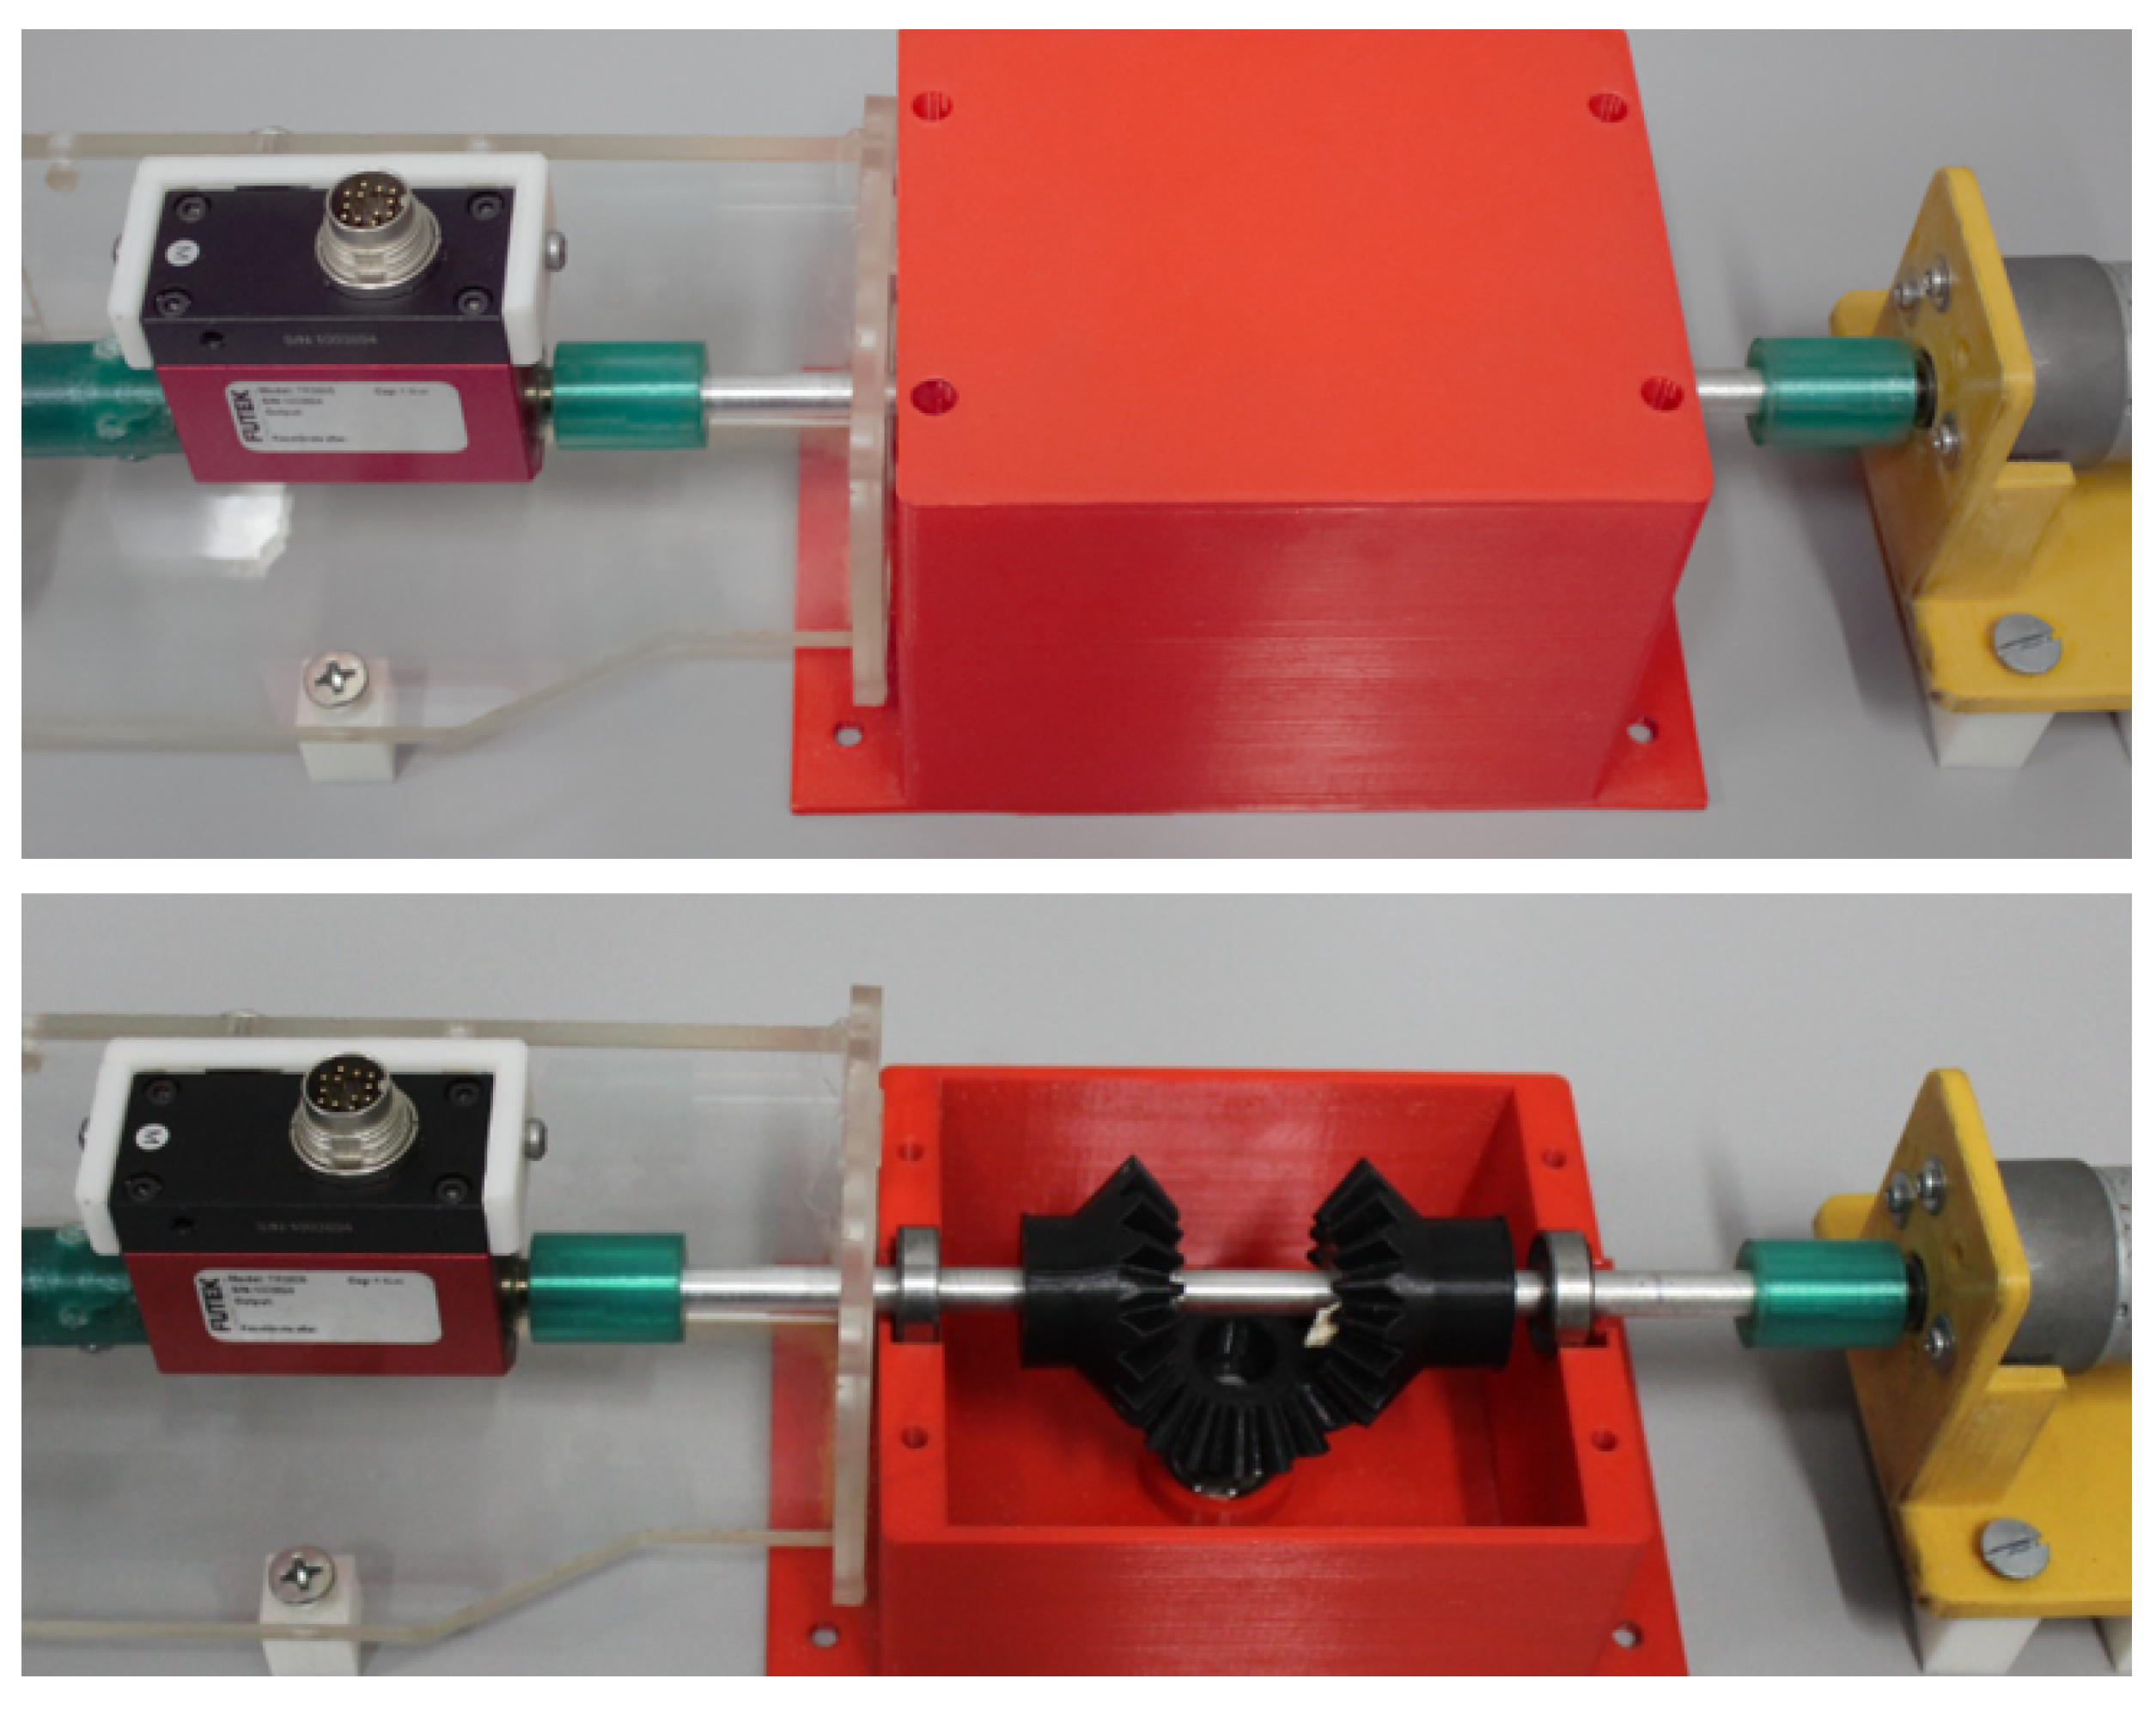
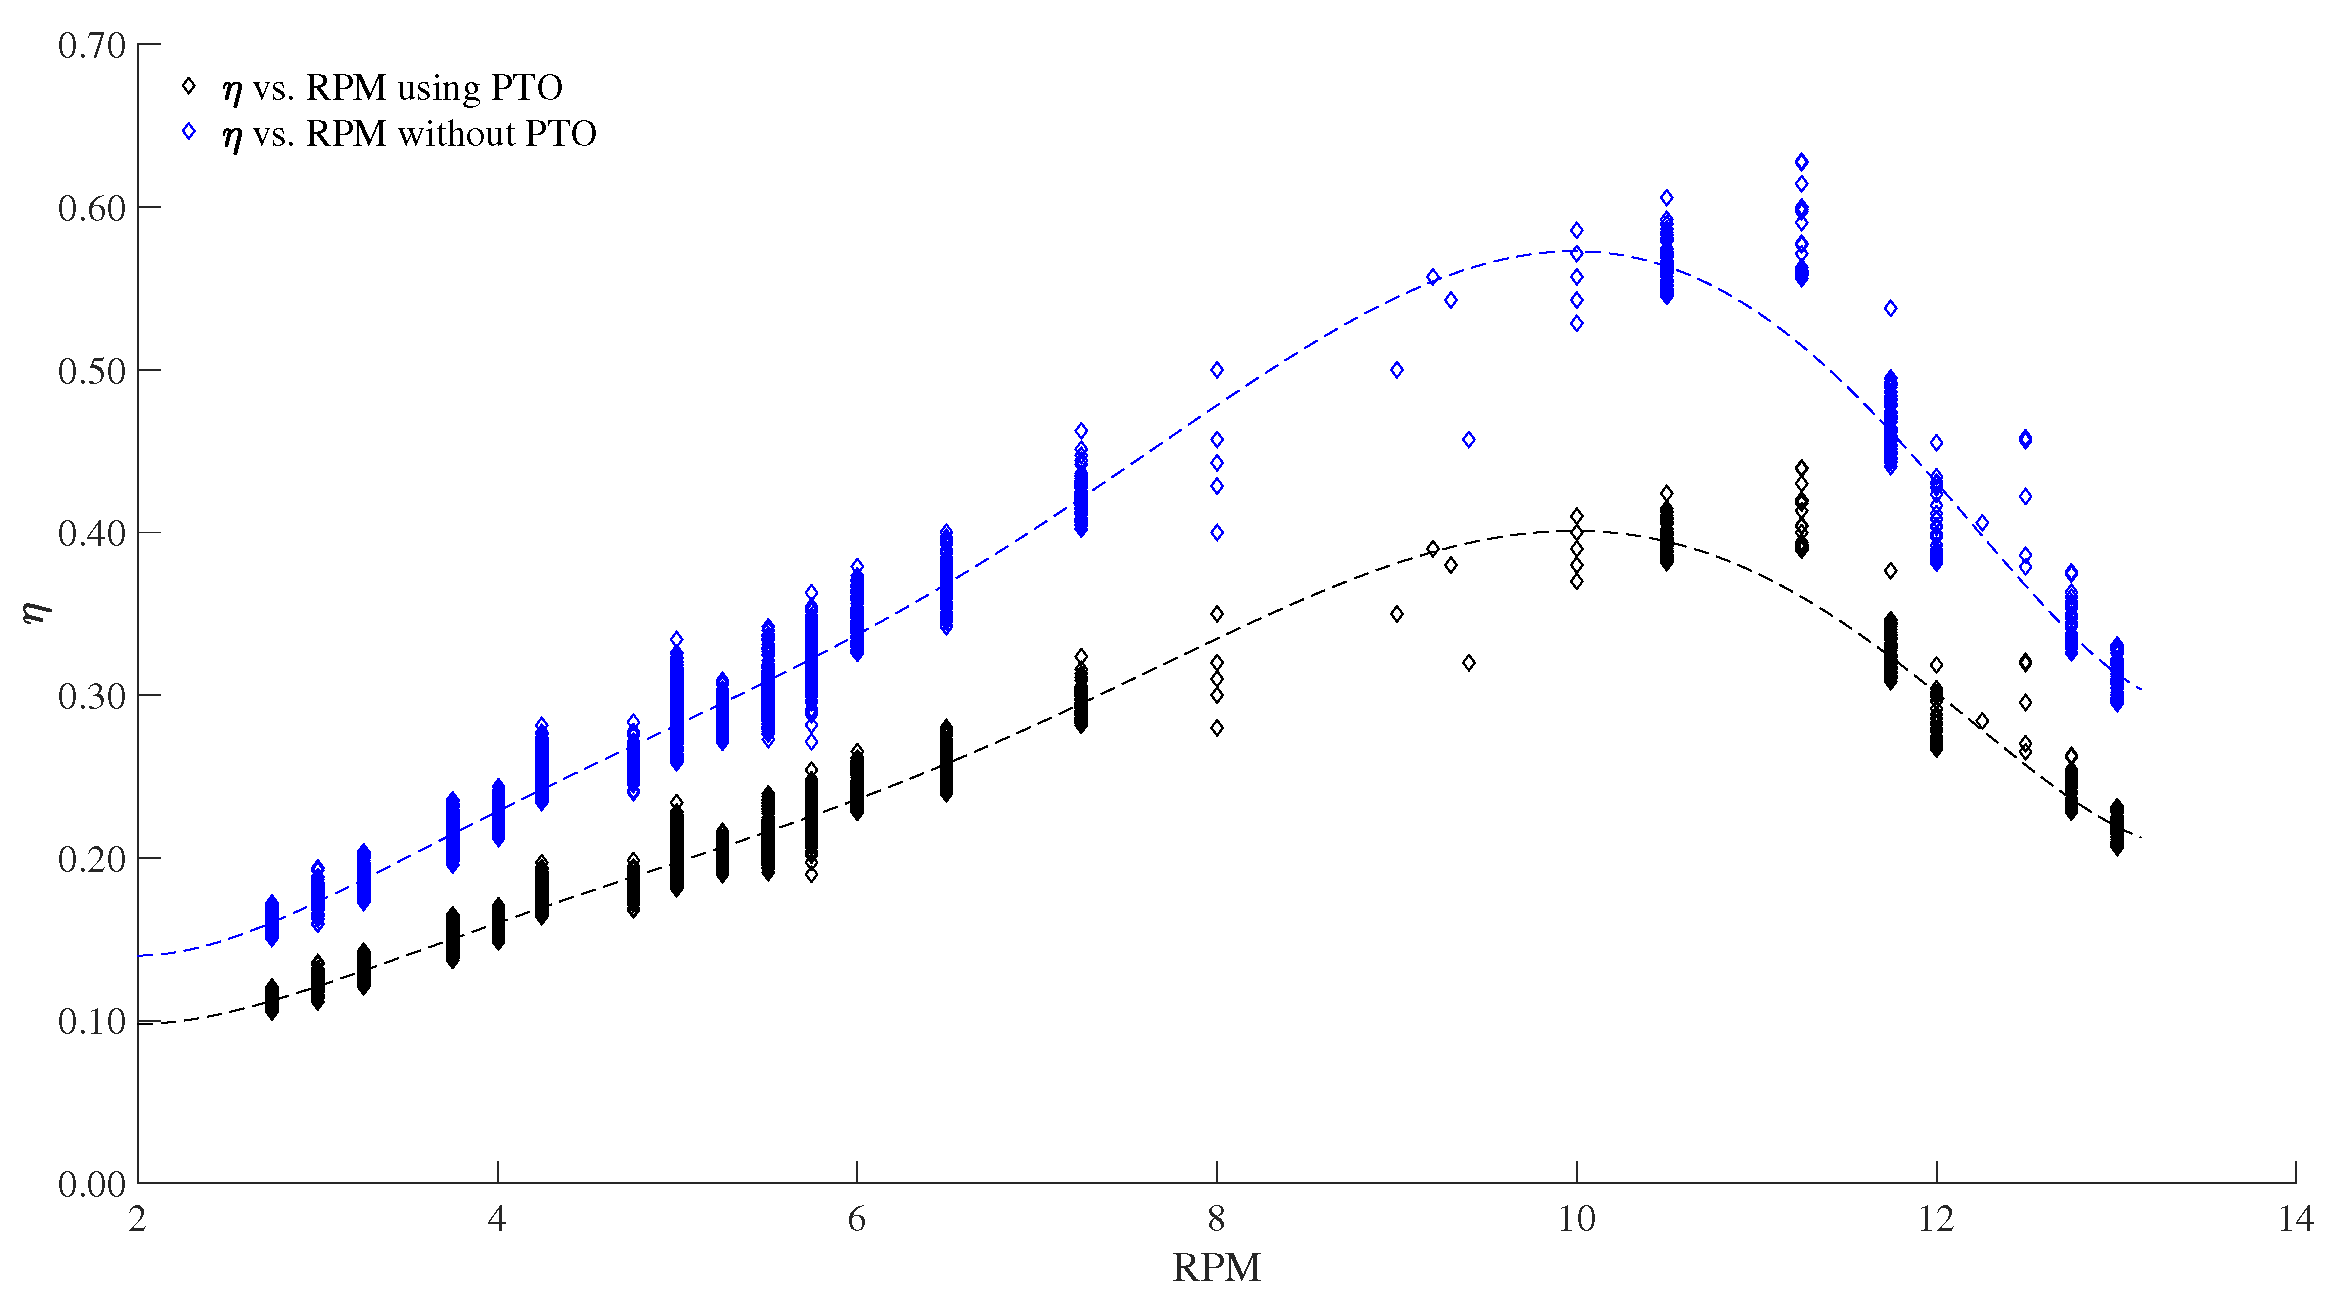
In Figure 18, it can be observed that the highest values for the WEC η achieved by the device correspond to values near 45%. From this, it is evident that the η values obtained were below those presented in the results of the numerical simulations. There is a notable difference between the numerical and experimental results in the system efficiency, with a discrepancy of around 19.8% (64.8% in the numerical simulations versus 45% in the experimental tests). This difference is primarily due to the omission of mechanical losses in the PTO system in the numerical simulations, owing to the complexity of including such a system in the simulation. To address this issue, a quantification of the PTO system losses was conducted. Figure 19 shows the setup used to quantify the mechanical losses. A known power magnitude was applied at the input shaft of the PTO system, and using a torque sensor with an encoder, the system losses were quantified at 28.2%. Therefore, Figure 20 presents the efficiency of the oscillating paddle without including the PTO. This graph allows for a comparison under the same conditions between the numerical simulation and the experimental tests. In this context, the maximum efficiency of the device obtained experimentally was 62.7%, which is very close to the numerically obtained efficiency.
It is important to recognize that avoiding the inclusion of the PTO system in the numerical simulation can significantly impact the overall efficiency of the energy conversion system. The complexity of the PTO system, with multiple gears and bearings, inherently introduces frictional and mechanical losses. Each component has its specific contribution to the total losses: bevel gears can introduce friction and wear losses due to the continuous contact of the teeth, along with inefficiencies due to imperfect alignment and vibrations; one-way bearings present internal friction losses and resistance to movement when operated, in addition to suffering wear over time, which increases mechanical losses; friction losses in the shafts, especially at the contact points with the bearings and gears, also contribute to the system efficiency reduction; and the quality and type of lubricant used can significantly affect friction losses throughout the system, as an inadequate lubrication can increase friction and, consequently, mechanical losses. To reduce these losses, mitigation techniques such as optimizing the gear design, using low-friction bearings, and improving lubrication could be explored. These measurements would contribute to a better alignment between numerical and experimental results and, ultimately, a more efficient and reliable WEC system. However, the optimization of the PTO system was not an objective of this study.
The maximum η obtained aligned with the η values found by several authors. For instance, in a study conducted by Kamizuru [64], η values of up to 61% were reported for a bottom-hinged oscillating paddle, emphasizing that this η value was derived from a numerical study. On the other hand, Babarit [65] presented a database where η values of various WEC were reported. For devices like the oscillating wave surge converter (OWSC), η values varied between 17% and 72% depending on the device characteristics. An experimental study for an oscillating paddle-type WEC yielded a η of 44% [66]. This result aligned with the experimental findings achieved in this study with PTO.
To properly scale the designed WEC, it is essential to ensure geometric, dynamic, and kinematic similarity between the model and the full-scale prototype. Regarding geometric similarity, it is necessary to ensure that the shape of the model device is an exact replica of the prototype. This means that all linear dimensions of the scaled device must be proportional to those of the scaled model. To guarantee kinematic similarity between the model and the prototype, the motion patterns must be similar. This implies that the relationships between velocities and accelerations in the model and the prototype must be consistent. Finally, for dynamic similarity, it is essential to ensure that the forces acting on the system maintain the same relationship. This includes inertial forces, buoyant forces, and drag forces, among others.
To ensure these similarities, key dimensionless numbers are used in scale analysis, such as the Froude (Fr) and Reynolds (Re) numbers, which ensure that gravitational and inertial forces, as well as viscous effects, behave consistently at both scales. The Froude number, which relates fluid velocity to gravity and depth, must be equal in the model and the prototype to accurately replicate the waves. Simultaneously, the Re number, which compares inertial and viscous forces, ensures that flow effects are appropriately scaled. The scaling methodology includes computational fluid dynamics (CFD) simulations and wave tank tests to validate the model behavior before constructing and testing the prototype at sea. This systematic approach, combined with continuous monitoring and optimization, is crucial for developing efficient and viable WECs on a large scale, overcoming technical challenges such as selecting durable materials and optimizing energy efficiency. Among these methods for scaling WEC, Fr and Re scaling are particularly suitable for the PTO. In this study, the Fr scaling method can be applied to all parameters. In this regard, the Fr number can be used for scaling the converter, which can be calculated with Equation (1) [48].
Using the same procedure shown in Equations (3) and (4), various quantities of interest can be derived. Some of these are shown in Table 11. The Fr scaling law ensures similarity between models and prototypes at different scales. Here, λ represents the geometric scale. When this scale equals 1, the magnitude of the quantity is unaffected by scaling. An important concept in this context is power density, which refers to the amount of power generated per unit length.
Highlighting the significance of the Fr scaling law in designing WECs is crucial. This principle ensures that dynamic and kinematic relationships between the small-scale model and the full-scale prototype remain consistent. This is particularly critical for quantities such as power density, which measures the efficiency of energy generation per unit length of the device. Consistency in these relationships allows for accurate predictions of the WEC performance under real conditions based on tests with reduced-scale models. Additionally, proper scaling ensures that key factors like fluid velocity and water depth do not disproportionately affect the tests, making the results applicable and reliable when transferred to full scale. This thorough approach not only optimizes the WEC design and operation but also helps identify and resolve technical issues before implementation at sea, which is vital for the successful and efficient development of wave energy technologies. Often, data collected from the model scale are converted into full-scale data. To achieve this, Fr scaling laws are applied to all data signals. Table 11 lists the conversion factors used to adjust the model scale data to the prototype scale. From the scaling factors, it is possible to predict how the model will behave in various marine environments and wave conditions [67,68].

4. Conclusions

The results obtained in this study indicated that the constructed regression model was representative of the data obtained through numerical simulation. It was found that both the submerged depth (X1) and the distance from the device to the breakwater (X2) were significant variables in relation to the device’s performance. At the optimal point, the system exhibited a η of 64.8% before passing through the power take-off (PTO) and the electrical generator.
Numerical simulations served as a powerful tool, although they involved certain simplifications and assumptions in the models employed. These simplifications may lead to an overestimation of η in simulations; nonetheless, these simplifications were necessary for efficient and rapid computation. Therefore, experimental results might more accurately reflect the real conditions and characteristics of the device.
Experimental tests were conducted in a wave flume, and a mechanism was built to generate the required wave spectrum for the channel conditioning. This ensured that the tests were carried out under the initially specified conditions. Experimental results demonstrated that achieving overall η of up to 45% was possible, considering losses in the PTO system and potential losses in other components of the assembly. There was a reduction compared to the results of numerical simulations, which could be attributed to the fact that simulations did not consider the PTO system or other external factors that might impact the results.

Author Contributions

Writing—original draft preparation, J.P.C.S.; methodology, J.P.C.S., E.C. and A.R.-C.; formal analysis, J.P.C.S., A.R.-C. and E.C.; experimental setup, J.P.C.S., A.R.-C. and E.C.; writing—review and editing, A.R.-C. and E.C.; funding acquisition, A.R.-C. and E.C.; project administration, A.R.-C. and E.C.; supervision, E.C. All authors have read and agreed to the published version of the manuscript.

Funding

The research was funded by the University of Antioquia through Project No. 2022-53143.

Data Availability Statement

The data used for the preparation of the manuscript and discussion of results are contained within.

Acknowledgments

The authors acknowledge the financial support provided by University of Antioquia (Project No. 2022-53143).

Conflicts of Interest

No conflicts of interest are declared by the authors.

References

  1. Murdock, H.E.; Gibb, D.; André, T.; Sawin, J.L.; Brown, A.; Ranalder, L.; Collier, U.; Dent, C.; Epp, B.; Hareesh Kumar, C.; et al. Renewables 2021-Global Status Report 2021. Available online: https://www.ren21.net/wp-content/uploads/2019/05/GSR2021_Full_Report.pdf (accessed on 17 April 2022).
  2. Wilches, C.R.T. Planeamiento Estratégico del Sector de las Fuentes No Convencionales de Energía Renovable en Colombia. Ph.D. Thesis, Pontificia Universidad Catolica del Peru, San Miguel, Peru, 2017. [Google Scholar]
  3. AK-BHD. WMO Greenhouse Gas Bulletin; World Meteorological Organization: Geneva, Switzerland, 2021.
  4. Tu, Q.; Mo, J.; Betz, R.; Cui, L.; Fan, Y.; Liu, Y. Achieving grid parity of solar PV power in China-The role of Tradable Green Certificate. Energy Policy 2020, 144, 111681. [Google Scholar] [CrossRef]
  5. Dato, P. Investment in energy efficiency, adoption of renewable energy and household behavior: Evidence from OECD countries. Energy J. 2018, 39, 213–244. [Google Scholar] [CrossRef]
  6. Sun, P.; Xu, B.; Wang, J. Long-term trend analysis and wave energy assessment based on ERA5 wave reanalysis along the Chinese coastline. Appl. Energy 2022, 324, 119709. [Google Scholar] [CrossRef]
  7. Gunn, K.; Stock-Williams, C. Quantifying the global wave power resource. Renew. Energy 2012, 44, 296–304. [Google Scholar] [CrossRef]
  8. López, I.; Andreu, J.; Ceballos, S.; De Alegría, I.M.; Kortabarria, I. Review of wave energy technologies and the necessary power-equipment. Renew. Sustain. Energy Rev. 2013, 27, 413–434. [Google Scholar] [CrossRef]
  9. Wang, Y.; Liu, Z.; Tao, T. A novel oscillating wave surge converter by hollowing out the flap bottom: Numerical studies using smoothed particle hydrodynamics. Ocean Eng. 2024, 303, 117694. [Google Scholar] [CrossRef]
  10. Henry, A.; Folley, M.; Whittaker, T. A conceptual model of the hydrodynamics of an oscillating wave surge converter. Renew. Energy 2018, 118, 965–972. [Google Scholar] [CrossRef]
  11. Mottahedi, H.R.; Anbarsooz, M.; Passandideh-Fard, M. Application of a fictitious domain method in numerical simulation of an oscillating wave surge converter. Renew. Energy 2018, 121, 133–145. [Google Scholar] [CrossRef]
  12. Liu, Y.; Cho, Y.H.; Mizutani, N.; Nakamura, T. Simplified BEM-based mathematical model for bottom-hinged oscillating wave surge converters under large-amplitude regular waves. Ocean Eng. 2023, 272, 113893. [Google Scholar] [CrossRef]
  13. Dias, F.; Renzi, E.; Gallagher, S.; Sarkar, D.; Wei, Y.; Abadie, T.; Cummins, C.; Rafiee, A. Analytical and computational modelling for wave energy systems: The example of oscillating wave surge converters. Acta Mech. Sin. 2017, 33, 647–662. [Google Scholar] [CrossRef]
  14. Zhang, C.; Wei, Y.; Dias, F.; Hu, X. An efficient fully Lagrangian solver for modeling wave interaction with oscillating wave surge converter. Ocean Eng. 2021, 236, 109540. [Google Scholar] [CrossRef]
  15. Pathak, A.; Freniere, C.; Raessi, M. Advanced computational simulations of water waves interacting with wave energy converters. Eur. J. Comput. Mech. 2017, 26, 172–204. [Google Scholar] [CrossRef]
  16. Brito, M.; Ferreira, R.M.; Teixeira, L.; Neves, M.G.; Gil, L. Experimental investigation of the flow field in the vicinity of an oscillating wave surge converter. J. Mar. Sci. Eng. 2020, 8, 976. [Google Scholar] [CrossRef]
  17. Saeidtehrani, S. Flap-type wave energy converter arrays: Nonlinear dynamic analysis. Ocean Eng. 2021, 236, 109463. [Google Scholar] [CrossRef]
  18. Ning, D.; Liu, C.; Zhang, C.; Göteman, M.; Zhao, H.; Teng, B. Hydrodynamic performance of an oscillating wave surge converter in regular and irregular waves: An experimental study. J. Mar. Sci. Technol. 2017, 25, 4. [Google Scholar]
  19. Jiang, X.; Day, S.; Clelland, D. Hydrodynamic responses and power efficiency analyses of an oscillating wave surge converter under different simulated PTO strategies. Ocean Eng. 2018, 170, 286–297. [Google Scholar] [CrossRef]
  20. Wei, Y.; Rafiee, A.; Elsaesser, B.; Dias, F. Numerical simulation of an oscillating wave surge converter. In Proceedings of the International Conference on Offshore Mechanics and Arctic Engineering. American Society of Mechanical Engineers, Nantes, France, 9–14 June 2013; Volume 55317, p. V001T01A012. [Google Scholar]
  21. Cheng, Y.; Li, G.; Ji, C.; Fan, T.; Zhai, G. Fully nonlinear investigations on performance of an OWSC (oscillating wave surge converter) in 3D (three-dimensional) open water. Energy 2020, 210, 118526. [Google Scholar] [CrossRef]
  22. Whittaker, T.; Folley, M. Nearshore oscillating wave surge converters and the development of Oyster. Philos. Trans. R. Soc. A Math. Phys. Eng. Sci. 2012, 370, 345–364. [Google Scholar] [CrossRef]
  23. Liu, Y.; Cho, Y.H.; Mizutani, N.; Nakamura, T. Study on the resonant behaviors of a bottom-hinged oscillating wave surge converter. J. Mar. Sci. Eng. 2021, 10, 2. [Google Scholar] [CrossRef]
  24. Schmitt, P.; Elsäßer, B. The application of Froude scaling to model tests of Oscillating Wave Surge Converters. Ocean Eng. 2017, 141, 108–115. [Google Scholar] [CrossRef]
  25. Cheng, Y.; Xi, C.; Dai, S.; Ji, C.; Cocard, M. Wave energy extraction for an array of dual-oscillating wave surge converter with different layouts. Appl. Energy 2021, 292, 116899. [Google Scholar] [CrossRef]
  26. Wei, Y.; Rafiee, A.; Henry, A.; Dias, F. Wave interaction with an oscillating wave surge converter, Part I: Viscous effects. Ocean Eng. 2015, 104, 185–203. [Google Scholar] [CrossRef]
  27. Wei, Y.; Abadie, T.; Henry, A.; Dias, F. Wave interaction with an oscillating wave surge converter. Part II: Slamming. Ocean Eng. 2016, 113, 319–334. [Google Scholar] [CrossRef]
  28. Ferrer, P.; Causon, D.; Qian, L.; Mingham, C.; Ma, Z. Numerical simulation of wave slamming on a flap type oscillating wave energy device. In Proceedings of the Twenty-Sixth (2016) International Ocean and Polar Engineering Conference, Rhodes, Greece, 26 June–1 July 2016. [Google Scholar]
  29. Kumawat, A.; Karmakar, D.; Guedes Soares, C. Wave energy conversion by multiple bottom-hinged surging WEC. In Proceedings of the Fourth International Conference in Ocean Engineering (ICOE2018); Springer: Berlin, Germany, 2019; Volume 2, pp. 913–929. [Google Scholar]
  30. Spyrou, K.; Themelis, N.; Tigkas, I. International Towing Tank Conference. 2004. Available online: https://www.ittc.info/media/10938/volume-i.pdf (accessed on 20 January 2023).
  31. Bozzi, S.; Besio, G.; Passoni, G. Wave power technologies for the Mediterranean offshore: Scaling and performance analysis. Coast. Eng. 2018, 136, 130–146. [Google Scholar] [CrossRef]
  32. Bozzi, S.; Archetti, R.; Passoni, G. Wave electricity production in Italian offshore: A preliminary investigation. Renew. Energy 2014, 62, 407–416. [Google Scholar] [CrossRef]
  33. Hadadpour, S.; Etemad-Shahidi, A.; Jabbari, E.; Kamranzad, B. Wave energy and hot spots in Anzali port. Energy 2014, 74, 529–536. [Google Scholar] [CrossRef]
  34. Gunawardane, S.; Bandara, G.; Lee, Y.H. Hydrodynamic analysis of a novel wave energy converter: Hull Reservoir Wave Energy Converter (HRWEC). Renew. Energy 2021, 170, 1020–1039. [Google Scholar] [CrossRef]
  35. De Alwis, V.; De Silva, A.; Gunawardane, S.; Lee, Y.H. Computational fluid dynamic simulation of hull reservoir wave energy device. In Proceedings of the Journal of Physics: Conference Series; IOP Publishing: Bristol, UK, 2022; Volume 2217, p. 012041. [Google Scholar]
  36. Gioia, D.G.; Pasta, E.; Brandimarte, P.; Mattiazzo, G. Data-driven control of a pendulum wave energy converter: A gaussian process regression approach. Ocean Eng. 2022, 253, 111191. [Google Scholar] [CrossRef]
  37. Portilla, J.; Caicedo, A.L.; Padilla-Hernández, R.; Cavaleri, L. Spectral wave conditions in the Colombian Pacific Ocean. Ocean Model. 2015, 92, 149–168. [Google Scholar] [CrossRef]
  38. Dean, R.G.; Dalrymple, R.A. Water Wave Mechanics for Engineers and Scientists; World Scientific Publishing Company: Singapore, 1991; Volume 2. [Google Scholar]
  39. Beneduce, M. Design of a Wavemaker for the Water Tank at the Politecnico di Torino. Ph.D. Thesis, Politecnico di Torino, Turin, Italy, 2019. [Google Scholar]
  40. Izquierdo, U.; Esteban, G.A.; Blanco, J.M.; Albaina, I.; Peña, A. Experimental validation of a CFD model using a narrow wave flume. Appl. Ocean Res. 2019, 86, 1–12. [Google Scholar] [CrossRef]
  41. Le Méhauté, B. An Introduction to Hydrodynamics and Water Waves; Springer Science & Business Media: Berlin, Germany, 2013. [Google Scholar]
  42. Bouali, B.; Larbi, S. Sequential optimization and performance prediction of an oscillating water column wave energy converter. Ocean Eng. 2017, 131, 162–173. [Google Scholar] [CrossRef]
  43. Rubio-Clemente, A.; Velásquez, L.; Chica, E. Design of a water channel to model the wave conditions in the Colombian Pacific Ocean. Renew. Energy Power Qual. J. 2022, 20, 405–412. [Google Scholar] [CrossRef]
  44. Guo, B.; Ringwood, J.V. Geometric optimisation of wave energy conversion devices: A survey. Appl. Energy 2021, 297, 117100. [Google Scholar] [CrossRef]
  45. Hayati, M.; Nikseresht, A.H.; Haghighi, A.T. Sequential optimization of the geometrical parameters of an OWC device based on the specific wave characteristics. Renew. Energy 2020, 161, 386–394. [Google Scholar] [CrossRef]
  46. Ning, D.z.; Zhou, Y.; Mayon, R.; Johanning, L. Experimental investigation on the hydrodynamic performance of a cylindrical dual-chamber Oscillating Water Column device. Appl. Energy 2020, 260, 114252. [Google Scholar] [CrossRef]
  47. Sorensen, R.M. Basic Wave Mechanics: For Coastal and Ocean Engineers; John Wiley & Sons: Hoboken, NJ, USA, 1993. [Google Scholar]
  48. Liu, Y.; Cavalier, G.; Pastor, J.; Viera, R.J.; Guillory, C.; Judice, K.; Guiberteau, K.; Kozman, T.A. Design and construction of a wave generation system to model ocean conditions in the Gulf of Mexico. Int. J. Energy Technol. 2012, 4, 1–7. [Google Scholar]
  49. Saincher, S.; Banerjeea, J. Design of a numerical wave tank and wave flume for low steepness waves in deep and intermediate water. Procedia Eng. 2015, 116, 221–228. [Google Scholar] [CrossRef]
  50. Qin, S.; Fan, J.; Zhang, H.; Su, J.; Wang, Y. Flume experiments on energy conversion behavior for oscillating buoy devices interacting with different wave types. J. Mar. Sci. Eng. 2021, 9, 852. [Google Scholar] [CrossRef]
  51. Castedo, R.; Reifarth, C.; Santos, A.P.; Losada, J.; López, L.M.; Chiquito, M.; Mancilla, J.M. Application of grid convergence index to shock wave validated with LS-DYNA and ProsAir. Ing. Investig. 2019, 39, 20–26. [Google Scholar] [CrossRef]
  52. Schleicher, W.; Riglin, J.; Oztekin, A. Numerical characterization of a preliminary portable micro-hydrokinetic turbine rotor design. Renew. Energy 2015, 76, 234–241. [Google Scholar] [CrossRef]
  53. Riglin, J.D.; Schleicher, W.C.; Oztekin, A. Cavitation Phenomena and Performance Implications in Archimedes Flow Turbines. J. Fluids Eng. 2016, 138, 031303. [Google Scholar] [CrossRef]
  54. Mansour, A.; Laurien, E. Numerical error analysis for three-dimensional CFD simulations in the two-room model containment THAI+: Grid convergence index, wall treatment error and scalability tests. Nucl. Eng. Des. 2018, 326, 220–233. [Google Scholar] [CrossRef]
  55. Roy, C.J. Grid convergence error analysis for mixed-order numerical schemes. AIAA J. 2003, 41, 595–604. [Google Scholar] [CrossRef]
  56. Phillips, T.S.; Roy, C.J. Richardson extrapolation-based discretization uncertainty estimation for computational fluid dynamics. J. Fluids Eng. 2014, 136, 121401. [Google Scholar] [CrossRef]
  57. Gutiérrez Marcantoni, L.F. Simulación de Flujos Compresibles con openFoam™. Master’s Thesis, Universidad Nacional de Córdoba, Córdoba, Argentina, 2013. [Google Scholar]
  58. Yang, I.; Tezdogan, T.; Incecik, A. Numerical investigations of a pivoted point absorber wave energy converter integrated with breakwater using CFD. Ocean Eng. 2023, 274, 114025. [Google Scholar] [CrossRef]
  59. Humberto, G.P.; De La Vara, R. Análisis y Diseño de Experimentos; Mc Graw Hill: New York, NY, USA, 2008. [Google Scholar]
  60. Yaguas, O.J. Metodología de superficie de respuesta para la optimización de una producción agrícola. Rev. Ing. Ind. 2017, 16, 205–222. [Google Scholar] [CrossRef]
  61. Sun, B.; Li, C.; Yang, S.; Zhang, H. A simplified method and numerical simulation for wedge-shaped plunger wavemaker. Ocean Eng. 2021, 241, 110023. [Google Scholar] [CrossRef]
  62. Rezaei, S.; Rahimi, A.; Parvizian, J.; Mansourzadeh, S.; Düster, A. Dimensional optimization of a two-body Wave energy converter using response surface methodology. Ocean Eng. 2022, 261, 112186. [Google Scholar] [CrossRef]
  63. Myers, R.H.; Montgomery, D.C.; Anderson-Cook, C.M. Response Surface Methodology: Process and Product Optimization Using Designed Experiments; John Wiley & Sons: Hoboken, NJ, USA, 2016. [Google Scholar]
  64. Kamizuru, Y. Development of Hydrostatic Drive Trains for Wave Energy Converters; Shaker: Herzogenrath, Germany, 2014; Volume 352. [Google Scholar]
  65. Babarit, A. A database of capture width ratio of wave energy converters. Renew. Energy 2015, 80, 610–628. [Google Scholar] [CrossRef]
  66. Flocard, F.; Finnigan, T. Experimental investigation of power capture from pitching point absorbers. In Proceedings of the Eight European Wave and Tidal Energy Conference, Upsalla, Sweden, 7–10 September 2009. [Google Scholar]
  67. Islam, M.; Jahra, F.; Hiscock, S. Data analysis methodologies for hydrodynamic experiments in waves. J. Nav. Archit. Mar. Eng. 2016, 13, 1. [Google Scholar] [CrossRef]
  68. Windt, C.; Davidson, J.; Ringwood, J.V. Numerical analysis of the hydrodynamic scaling effects for the Wavestar wave energy converter. J. Fluids Struct. 2021, 105, 103328. [Google Scholar] [CrossRef]
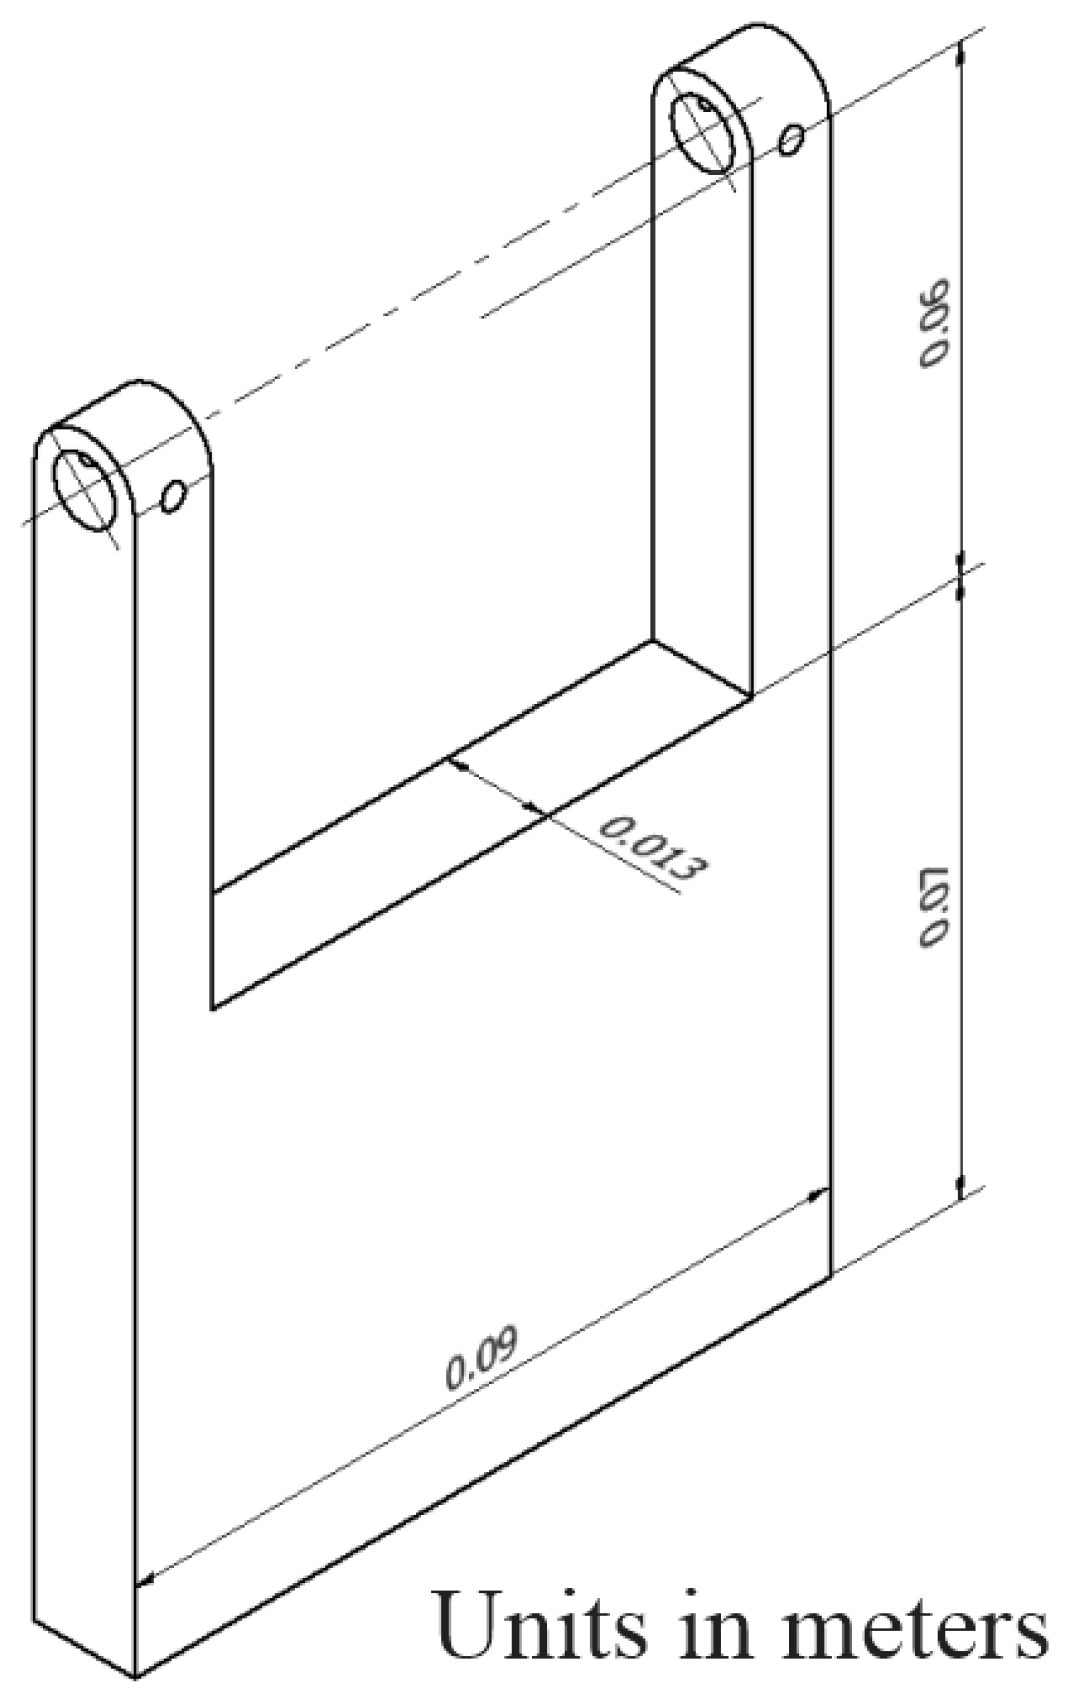
Figure 1. Oscillating paddle geometry.
Energies 17 03209 g001
Figure 2. Characteristics of the wave spectrum.
Energies 17 03209 g002
Figure 3. The Le Mehaute diagram considering the conditions of the Colombian Pacific Ocean.
Energies 17 03209 g003
Figure 4. Domain and boundary conditions.
Energies 17 03209 g004
Figure 5. Mesh of the (a) stationary and (b) rotational domains.
Energies 17 03209 g005
Figure 6. Independence of meshing through convergence index (Richardson extrapolation).
Energies 17 03209 g006
Figure 7. Independence of the time step using the convergence index method (Richardson extrapolation).
Energies 17 03209 g007
Figure 8. Representative phase contour from numerical simulations.
Energies 17 03209 g008
Figure 9. Experimental design factors.
Energies 17 03209 g009
Figure 10. Laboratory-scale oscillating paddle.
Energies 17 03209 g010
Figure 11. Wave generator in the form of a paddle.
Energies 17 03209 g011
Figure 12. Mechanism generating the wave spectrum.
Energies 17 03209 g012
Figure 13. Power take-off (PTO) systems.
Energies 17 03209 g013
Figure 14. Experimental setup. (1) Oscillating paddle; (2) shaft; (3) shaft support; (4) PTO system; (5) torque sensor; (6) DC motor; (7) base support.
Energies 17 03209 g014
Figure 15. Experimental setup.
Energies 17 03209 g015
Figure 16. Interaction graph of the factors.
Energies 17 03209 g016
Figure 17. (a) Response surface and (b) contour plot for the WEC performance as a function of the independent variables.
Energies 17 03209 g017
Figure 18. Experimental results.
Energies 17 03209 g018
Figure 19. Experimental setup to determine mechanical losses of the PTO.
Energies 17 03209 g019
Figure 20. Efficiency of the oscillating paddle.
Energies 17 03209 g020
Table 1. Vane-type WEC studies in the shape of a rectangular parallelepiped. H: height; W: width; T: thickness; AR: aspect ratio.
AuthorH × W × T (m)ScaleRemarks
Dias et al. [13]Oyster WEC1:25 y 1:40A numerical simulation was performed through the smoothed particle hydrodynamics (SPH) method. Efficiency up to 80% was found.
Zhang et al. [14]1.08 × 0.48 × 0.121:25A numerical simulation was performed through the SPH method.
The numerical wave tank (NWT) was 18.4 m long, 4.58 m wide and 1 m high.
A maximum efficiency of 40% was achieved.
Ashish et al. [15]1.08 × 0.48 × 0.121:33A numerical simulation was performed.
The computational domain was 28.8 m × 4.608 m × 1.152 m.
Brito et al. [16]0.84 × 1.13 × 0.171:25An experimental investigation was conducted.
The wave tank (WT) was 60 m long, 1.5 m wide and 1.8 m high. A power capture up to 40% was found.
Saeidtehrani et al. [17]0.072 × 0.05 × 0.0431:40Experimental and numerical investigations were carried out.
The WT was 9 m long, 0.27 m wide, and 0.5 m deep.
Ning et al. [18]1.05 × 0.8 × 0.151:05An experimental study was conducted.
The WT was 60 m long, 4 m wide, and 2.5 m deep.
A power capture up to 60% was found.
Jiang et al. [19]0.305 (RA: Oyster WEC)1:40Experimental research was conducted.
The WT was 21.6 m long, 1.6 m wide, and 0.45 m deep. the output power found was around 10 W.
Wei et al. [20]1.04 × 0.48 × 0.121:30A numerical simulation was performed.
The VOF method was used.
The NWT was 39.13 m long, 4.58 wide and an operating depth up to 0.8 m. Power capture factor up to 80% was found.
Cheng et al. [21]--A numerical investigation was carried out, and a maximum efficiency of 57% was achieved.
Whittaker et al. [22]11 × 18 × 1.8 (Oyster)-The study reported the state-of-the-art about oyster devices.
Ferrer et al. [23]10 × 26 × 4-A numerical model was performed.
The VOF method and the standard k-epsilon turbulence model were used. Capture width ratio up to 0.6 was found.
Liu et al. [24]-1:40Experimental and numerical investigations were conducted.
The WT was 20 m long, 4.58 m wide, and 0.8 m deep.
The standard k-omega SST turbulence model was used.
Schmitt et al. [25]0.31 × 0.646 × 0.08751:40A numerical investigation was performed.
Efficiencies of up to 67% were achieved within an array of wave energy converters.
Cheng et al. [26]1.04 × 0.48 × 0.121:25Experimental and numerical studies were used.
The WT was 18 m long, 4.58 m wide, and 0.4–0.8 m deep.
The standard k-epsilon turbulence model and the VOF method were implemented.
Wei et al. [27]0.31 × 0.646 × 0.08751:40Experimental and numerical studies; WT is 16.7 m long, 0.65 m wide, and 0.305 deep.
Ferrer et al. [28]0.31 × 0.646 × 0.08751:40A numerical investigation was implemented.
The NWT was 16.77 m long, 1.5 m wide, and 0.646 m deep.
The VOF method was used.
Table 2. Colombian Pacific Ocean wave spectrum [37].
LocationWave Height Mean (H, m)Wave Period Mean (T, s)
Tumaco1.01 m6.86 s
Gorgona Island1.13 m7.76 s
Buenaventura Harbour0.96 m8.21 s
Solano Bay1.17 m10.61 s
Table 3. Laboratory scale wave spectrum.
λ = 30Wave Height (H)Wave Period (T)Wave Length (L)Depth (d)
Real0.99 m7.31 s80.9 m13 m
Scaled model0.033 m1.33 s2.3 m0.43 m
Table 4. Mesh quality metrics.
Mesh QualityMinimumMaximumAverage
Element Quality0.738410.9999
Aspect Ratio12.02021.0024
Orthogonal Quality0.750510.9999
Skewness1.30 × 10 10 0.4853.78 × 10 3
Table 5. Discretization error—meshing independence.
ϕ = Torque [Nm]
N 1
0.93 × 10 6
N 2
0.41 × 10 6
N 3
0.19 × 10 6
ϕ 1 0.91301
ϕ 2 0.89569
ϕ 3 0.85959
ϕ h 0 0.91878
G C I 1 , 2 2.18%
G C I 2 , 3 4.64%
R1.019
Table 6. Discretization error—independence of the time step.
ϕ = Torque [Nm]
t 1
0.00025
t 2
0.0005
t 3
0.001
ϕ 1 0.242465
ϕ 2 0.246874
ϕ 3 0.262861
ϕ h 0 0.240995
G C I 1 , 2 0.86%
G C I 2 , 3 3.08%
R0.982
Table 7. Conditions of the numerical simulation of the vane-type WEC.
ParametersValue
Wave height0.33 m
Wave length2.3 m
Turbulence modelstandard k- ϵ
MethodPISO-VOF
Material of oscillating paddlePLA
Mass of oscillating paddle0.109 kg
Inertia0.0019 kg m2
Table 8. Independent factors and levels used for the optimization process of the oscillating WEC generation system. b refers to the paddle height, and L stands for the wave length.
Independent FactorValues
Factor level−101
X1 (%b)0.250.500.75
X2 (%L)0.050.0750.10
Table 9. Numerical results obtained for different configurations of the WEC.
X 1 ( b ) X 2 ( L ) η
0.250.050.058
0.500.050.142
0.750.050.269
0.250.0750.113
0.500.0750.212
0.750.0750.557
0.250.100.158
0.50.100.321
0.750.100.648
Table 10. Analysis of variance (ANOVA) results for the constructed regression model.
TermEffectSum of Squares (SS)Degrees of Freedom (df)Mean Square (MS)F-Ratiop-Value
Model 0.3251340.3251354.967.70 × 10 5
X1−13.6120.2186210.21862147.711.89 × 10 5
X2−11.9330.0702010.0702047.430.000463
X1212.8720.0168210.0168211.360.015024
X1X2111.6800.0194910.0194913.170.010983
Error 0.038476
Table 11. Froude scaling conversion factors.
ParametersScaling
Wave height and length λ
Wave period λ 0.5
Wave frequency λ 0.5
Power density λ 2.5
Linear displacement λ
Angular displacement1
Linear velocity λ 0.5
Angular velocity λ 0.5
Linear acceleration1
Angular acceleration λ 1
Mass λ 3
Force λ 3
Torque λ 4
Power λ 3.5
Linear stiffness λ 2
Angular stiffness λ 4
Linear damping λ 2.5
Angular damping λ 4.5
Disclaimer/Publisher’s Note: The statements, opinions and data contained in all publications are solely those of the individual author(s) and contributor(s) and not of MDPI and/or the editor(s). MDPI and/or the editor(s) disclaim responsibility for any injury to people or property resulting from any ideas, methods, instructions or products referred to in the content.