Article

Real-Time Solar Power Generation Scheduling for Maintenance and Suboptimally Performing Equipment Using Demand Response Unified with Model Predictive Control

1
School of Electrical and Electronic Engineering, North China Electric Power University, Beijing 102206, China
2
Beijing Key Laboratory of Demand Side Multi-Energy Complementary Optimization and Supply-Demand Interaction Technology, China Electric Power Research Institute Co., Ltd., Beijing 100035, China
*
Author to whom correspondence should be addressed.
Energies 2024, 17(13), 3212; https://doi.org/10.3390/en17133212
Submission received: 3 June 2024 / Revised: 25 June 2024 / Accepted: 25 June 2024 / Published: 29 June 2024
(This article belongs to the Section F3: Power Electronics)

Abstract

:
This paper proposes a novel approach that unifies a demand response (DR) with a master plan of the model predictive control method focusing on scheduling maintenance and replacement for suboptimal equipment in real-time solar power plants. By leveraging DR mechanisms and MPC algorithms, our proposed framework starts with understanding the correlation between solar module temperature, surrounding temperature, and irradiation—essential for predicting and optimizing the performance of solar energy installations. It extends to evaluate the DC to AC conversion ratio, which is an indicator of the efficiency of the inverters. This integration enables proactive decisions for repair, maintenance, or replacement of equipment. Through exploratory data analysis using Python, we establish the efficiency and benefits of our anticipated approach in identifying the relationship between the factors that affect solar power generation.

Graphical Abstract

1. Introduction

Integrating solar power sources into the electrical grid is becoming increasingly essential for achieving sustainable energy systems. Solar photovoltaic (PV) systems play a pivotal role in the reduction of greenhouse gas emissions and the diversification of energy sources [1,2]. However, the nature of solar power is extremely affected by the weather; therefore, it necessitates innovative solutions to enhance reliability and efficiency [3,4]. Various factors affect solar power integration, some of the core challenges are weather conditions, shading, and equipment performance [5]. Advanced control methods and scheduling techniques are significant for addressing these encountered challenges [6]. Real-time scheduling of solar power generation joined with predictive maintenance strategies, can reduce the influence of equipment failures and suboptimal performance on overall system efficiency [7].
DR strategy offers a significant path for managing fluctuation in solar power generation by incentivizing consumers to modify their electricity usage in response to grid conditions [8,9]. Considering both supply-side variability and demand-side flexibility, operators can optimize the scheduling of real-time solar power generation using the combination of DR mechanisms with model predictive control (MPC) [9,10,11].
Several studies have looked at the optimization of renewable energies, especially solar power. The author in [12] used advanced ensemble numerical weather prediction (NWP) forecasts to generate optimal point forecasts in alignment with the statistical theories of consistency and eligibility. Here, a two-stage physics-based approach was employed for solar power forecasting. Initially, point irradiance forecasts were derived from NWP, which were then converted to power forecasts using a model chain. In [13], to optimize energy management, a design has been developed for a solar energy storage battery (SESB) as an effective alternative to conventional consumer energy management and time-based pricing systems. This study, to authenticate the SESB model, examined one with domestic load and another integrating electric vehicle load. Additionally, to ensure an intensity of alignment between day-ahead grid commitments and actual grid injections, a multi-time scale was introduced in [14]. For day-ahead scheduling, the uncertainty conditions due to forecasting were addressed using a two-step resource-based probability optimization framework, and the fluctuations caused by short-term variability were handled by MPC.
Furthermore, in [15], a quasi-oppositional fast convergence real-coded a genetic program to find the short-term optimal generation schedule for renewable energy sources and the system includes solar energy, wind turbine power, and pump storage hydro plants. This program considers the uncertainty of load demand and renewable energy by integrating the different factors that are richer estimations. The paper in [16] designed a framework based on a bald eagle search optimization program for the optimal operation of households and offered a multi-structure to analyze the appliance waiting time, real-time price and price signal, and total cost. Also, in [17], a nano grid (NG) was designed in MATLAB, including PV power connected to a grid system for testing an optimization scheme and to maximize a profit schedule of flexible loads; this was done using an artificial neural network. Moreover, in [18], an interdependent relationship of the price of the responsive demand with the settlement price was modeled to evaluate the long-term effect of demand response in solar power systems. In [19] by taking into consideration both carbon trading and demand response factors, the author proposed strategic scheduling for a virtual power plant that integrated a concentrated solar energy plant.
Additionally, the author [14] presents multi-timescale decision-making strategies for controlling the output of a PV producer utilizing energy storage. They employed advanced state-of-the-art decision models and MPC to optimize near-term battery schedules. This approach leverages paramount temporal decision layers, as well as short-term, mid-term, and long-term planning, to improve operational efficiency and reliability. Consequently, the deviation from the scheduled value was successfully minimized. Furthermore, [20] presents a feed forward neural network designed to forecast AC power output in a real-time solar power plant. This strategy employs an advanced artificial neural network, leveraging predictive algorithms and machine learning techniques to precisely estimate the power production based on real-time data sets. To study the techniques and approaches of power grid systems engaging in price-based demand response and incentive-based demand response, a solar-assisted heat pump drying system with thermal storage was proposed in [21]. The heat requirement for the drying process was examined using drying kinetics and an equivalent thermal parameter model. Furthermore, a virtual energy storage model was formulated based on the thermal storage properties of the drying chamber.
To address the lack of a review on integrated energy management systems (IEMS), [10] reviewed the research gap in the current IEMS frameworks/architecture by finding and providing a thorough overview of the IEMS components, including energy prediction, diversified energy production, energy storage solutions, demand-side control, and supply-side regulation. The author in [22] designed a flexible model predictive control to facilitate demand response with adaptable boundaries and variable heat pump effectiveness over time. By applying adaptive parameters, the controller improves its responsiveness and accomplishes optimal regulation under different disturbance scenarios. Particularly, the MPC confirmed further performance enhancements in situations involving real-time pricing, high-density load, and restricted heat pump capacity. The research in [23], to maximize solar energy, while considering maintaining a safe and stable energy system, introduces and assesses a solar-powered system combined with a solid oxide fuel cell and the supercritical carbon dioxide cycle. The study examines the joined system under several off-design situations and analyzes its dynamic response over periods such as seconds, minutes, and hours. The study in [24] uses different machine learning techniques to concentrate on forecasting solar power and the performance of these programs was enhanced through hyperparameter turning utilizing Bayesian optimization and random search methods. To enhance the robustness and cost-effectiveness of system scheduling, the author [25] proposed a combination of two scheduling models: multi-objective distributionally robust optimization (MODRO) and adaptive step double-loop model predictive control (ASDL-MPC). Since this research was based on distributionally robust adaptive model predictive control (DRAMPC) for integrated energy systems (IES), the unpredictability of demand response can disrupt the optimization scheduling of IES.
This research paper presents the novel concept of scheduling real-time solar power generation for maintenance and suboptimally performing equipment, exploiting demand response (DR) strategies unified with model predictive control (MPC). Considering insights from previous research in solar power integration, we propose a framework by leveraging DR mechanisms and MPC algorithms that optimize the function of solar PV systems, while improving grid stability and resilience. Our proposed framework starts from the understanding of the relationship between solar module temperature, surrounding temperature, and irradiation, which are essential for predicting and enhancing the performance of solar energy installations, and the DC to AC conversion ratio, which is an indicator of the efficiency of the inverters. This integration enables proactive decisions for repair, maintenance, or replacement of equipment. Through exploratory data analysis using Python, we validate the efficiency and benefits of the anticipated approach in finding the relationship between the factors that affect solar power generation. Therefore, the main contributions of this research are as follows:
  • Designing a novel framework to optimize the scheduling of maintenance of real-time solar power generation by combining DR with MPC.
  • Creating advanced real-time algorithms using Python (Visual Studio Code) for scheduling the maintenance and the replacement of solar power generation equipment.
  • Identifing equipment that is not performing at its optimal level to enhance the efficiency and reliability of the solar power system.
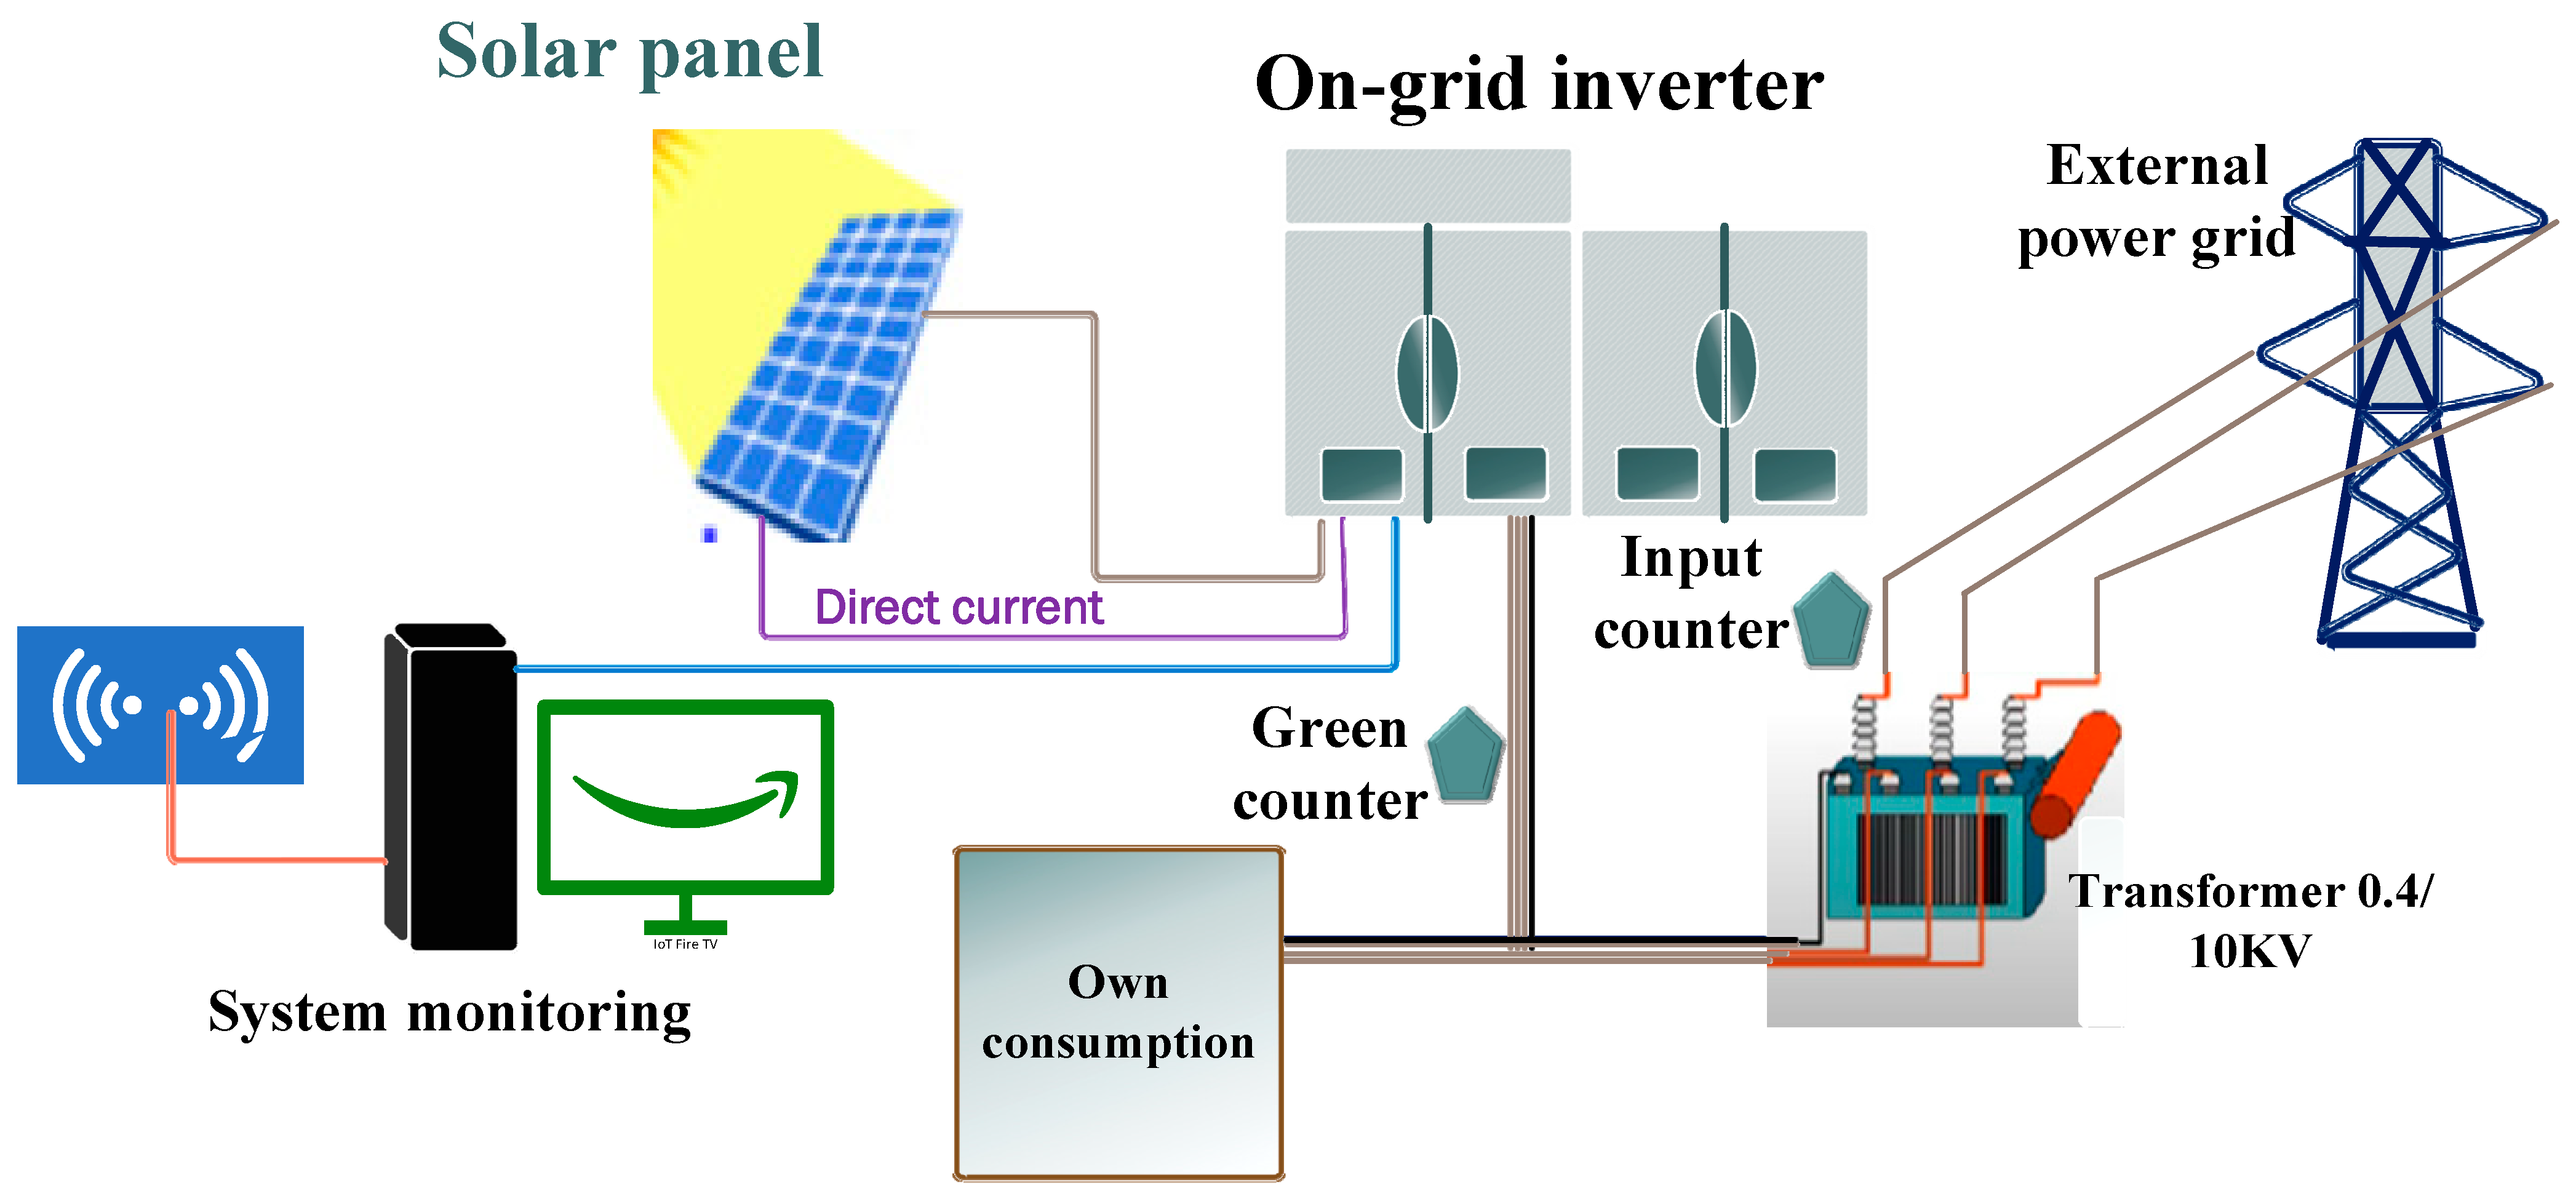
2. Site Background

Solar power generation data has been collected from two solar power plants in India over 34-day periods. In the schematic diagram, as shown in Figure 1, we have a set of solar panels that are connected to an on-grid inverter. The energy that is generated from the solar panels is in the form of direct current, and the on-grid inverter converts the direct current into alternating current. Each inverter is connected to a monitoring system that collects data over time and allows for analysis of energy production patterns in the solar power system. The AC is then sent to the transformer to step up the required voltage and connect to the external grid.
For each power plant, we have two sets of data, the first is the power generation dataset that is collected at the inverter level. This collects information about the AC power, the DC power, the daily yield, which is the accumulated sum of the power on that particular day, and the total yield. The second set of data consists of weather sensor data collected at the plant level, which includes information on solar module temperature, surrounding temperature, and irradiance. For the power generation, the data is collected at different inverters and each of them has a separate ID, which is called source-key, and these are collected at 15-min intervals for 34 days, in the same way we used for the sensor dataset. Exploratory data analysis is performed using Python 3.12.0 (Visual Studio Code).

3. Overall Model Development

3.1. Solar Energy Production Model

The degradation of solar energy equipment over time can be described as follows:
D t = D 0 × e λ t
where D t is the decline rate at time t , D 0 is the initial decline rate, and λ represents the degradation rate.
The impact of demand response actions on power generation schedules and grid demand can be calculated as follows:
G r i d   D e m a n d   t = B a s e   D e m a n d + D e m a n d   R e s p o n s e   F a c t o r × P D C t B a s e l i n e   G e n e r a t i o n
The objective function aims to optimize power generation scheduling while considering equipment degradation, demand response requirements, and grid constraints.
Minimize   J = t = 0 N [ c 1 × P D C t + c 2 × D t + c 3 × G r i d   D e m a n d   t   ]
where c 1 , c 2 , and c 3 describe the weighting factors, and N is the prediction horizon.
The system constraints can be defined as follows:
P D C , m i n   P D C t P D C , m a x
D t D m a x
G r i d   D e m a n d   t G r i d   C a p a c i t y

3.2. Formulation of the Mean Values Using Model Predictive Control (MPC)

The DC power generated by the solar panels ( P D C t ), can be calculated by the following:
P D C t = I i r r t × A × η P V ( T t e m p t , I i r r t )
where η P V ( T t e m p t , I i r r t ) is the efficiency of solar panels, which is a function of temperature and irradiance, I i r r t represents the solar irradiance at time t , and A represents the surface area of solar panels.
The mean value of the DC Power over a period of T is calculated as follows:
P D C ¯ = 1 T 0 T P D C t d t
The daily yield of DC power:
Y d a i l y , D C = 0 24 P D C t d t
The total yield of DC power:
Y t o t a l , D C = 0 T P D C t d t
The AC power can be described as follows:
P A C t = P D C t × η i n v
where η i n v is the inverter’s efficiency.
The mean value of the AC Power is calculated as follows:
P A C ¯ = 1 T 0 T P A C t d t
We can simplify by substituting Equation (11) into Equation (12) to show that the AC power is simply the mean value of DC power scaled by the inverter efficiency and this is described as:
P A C ¯ = 1 T 0 T P D C t × η i n v d t = η i n v × P D C ¯
The daily yield of AC power:
Y d a i l y , A C = 0 24 P A C t d t = η i n v × Y d a i l y , D C
The total yield of AC power:
Y t o t a l , A C = 0 T P A C t d t = η i n v × Y t o t a l , D C

3.3. Modeling of the Relationship between Solar Module Temperature, Surrounding Temperature, and Irradiation

3.3.1. Statistical Correlation Model

The statistical correlation between solar module temperature and surrounding temperature using historical data can be expressed as follows:
Let T s _ m [ i ] and T s [ i ] be the solar module temperature and surrounding temperatures at time step i , respectively. The correlation r can be described as follows:
r = i = 1 n ( T s _ m i T s _ m ¯ ) ( T s i T s ¯ ) i = 1 n ( T s _ m i T s _ m ¯ ) ( T s i T s ¯ ) 2
where T s _ m ¯ and T s ¯ are the mean values of solar module temperature and surrounding temperatures over n time steps.

3.3.2. Empirical Model

The solar module temperature T s _ m is related to the surrounding temperature T s and the solar irradiation I i r r , therefore, a common empirical model to estimate the solar model temperature is described as follows:
T s _ m t = T s t + I i r r ( t ) N O C T 20
where N O C T (nominal operating cell temperature) is the T s _ m under the standard condition (usually I i r r   800 W m 2 , T s _ m   20   ° C , and wind speed of 1 m s ).

3.3.3. Efficiency Model

When temperature increases, the efficiency of the photovoltaic (PV) module decreases linearly. This can be calculated as follows:
η P V T s _ m = η P V , r e f [ 1 β T s m T r e f ]
where η P V , r e f represents the reference efficiency at a standard reference temperature T r e f (usually 25   ° C ), and β is a negative value indicating the drop in efficiency per degree increase in temperature coefficient.
Therefore, by combining Equations (17) and Equation (18), we get the efficiency of the PV:
η P V t = η P V , r e f 1 β ( T s t ) + I i r r t N O C T 20 T r e f

3.4. System Model Using MPC for Maintenance Scheduling

The system model explains in detail the behavior of solar power generation, including the inverter efficiency, the dynamic of power generation, and the degradation patterns.
Predicted DC power output ( P D C ) at the next time step ( t + 1 ) is calculated as follows:
P D C t + 1 = f D C ( P D C t , T s _ m t ,   I i r r t )
where f D C is a function that could be a linear or non-linear model derived from historical data that captures how the DC power output depends on the current DC power output, solar module temperature, and solar irradiance.
The predicted inverter efficiency at the next time step ( η i n v t + 1 ) is described as follows:
η i n v t + 1 = f η ( η i n v t , T s t )
where f η is a function that captures how the inverter efficiency changes based on the current efficiency and surrounding temperature.
The predicted AC power output at the next time step ( P A C t + 1 ) is calculated as follows:
P A C t + 1 = P D C t + 1 × η i n v t + 1

3.5. Maintenance Cost Function

The cost function for maintenance, performance penalties, and failure risks are described as follows:
J m a i n t = k = 0 N p 1 C m a i n t k + P f a i l k × C f a i l k U ( k )
where C m a i n t k represents the cost of maintenance at step k, P f a i l k is the probability of failure at step k, C f a i l k is the cost related to failure, and U ( k ) is the utility or performance of the system at step k.
Based on equipment performance, environmental factors, and demand response dynamics, MPC algorithms can be used to optimize real-time solar power generation schedules. This can maximize energy generation efficiency, minimize maintenance costs, and ensure compliance with grid constraints and demand response requirements.

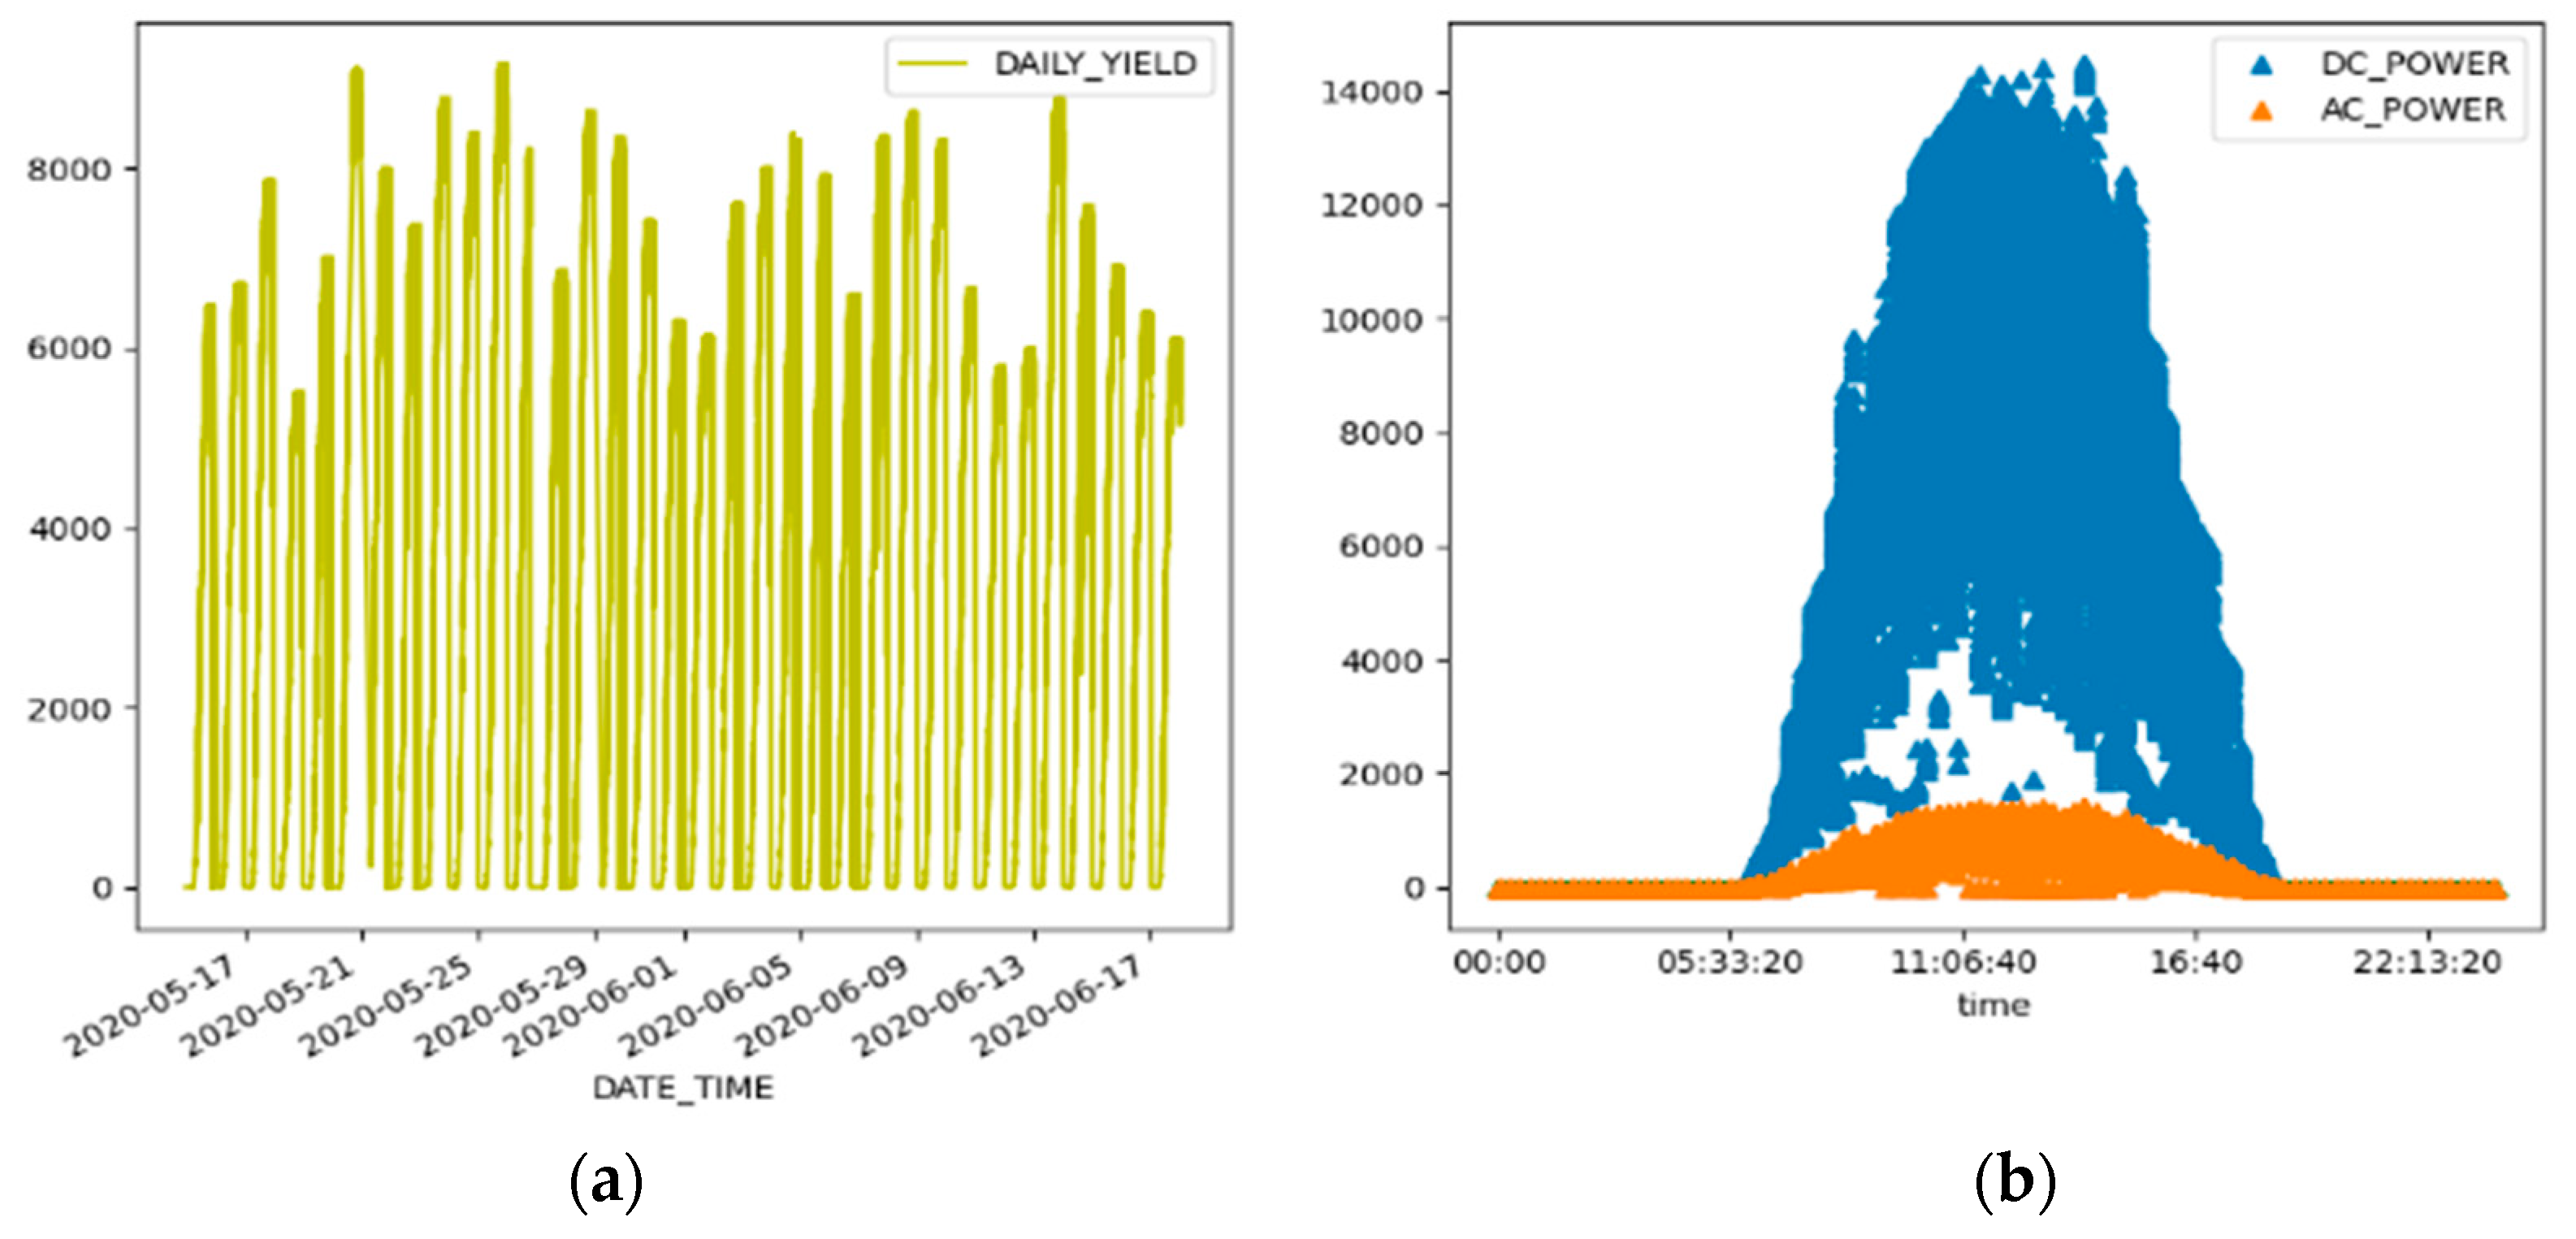
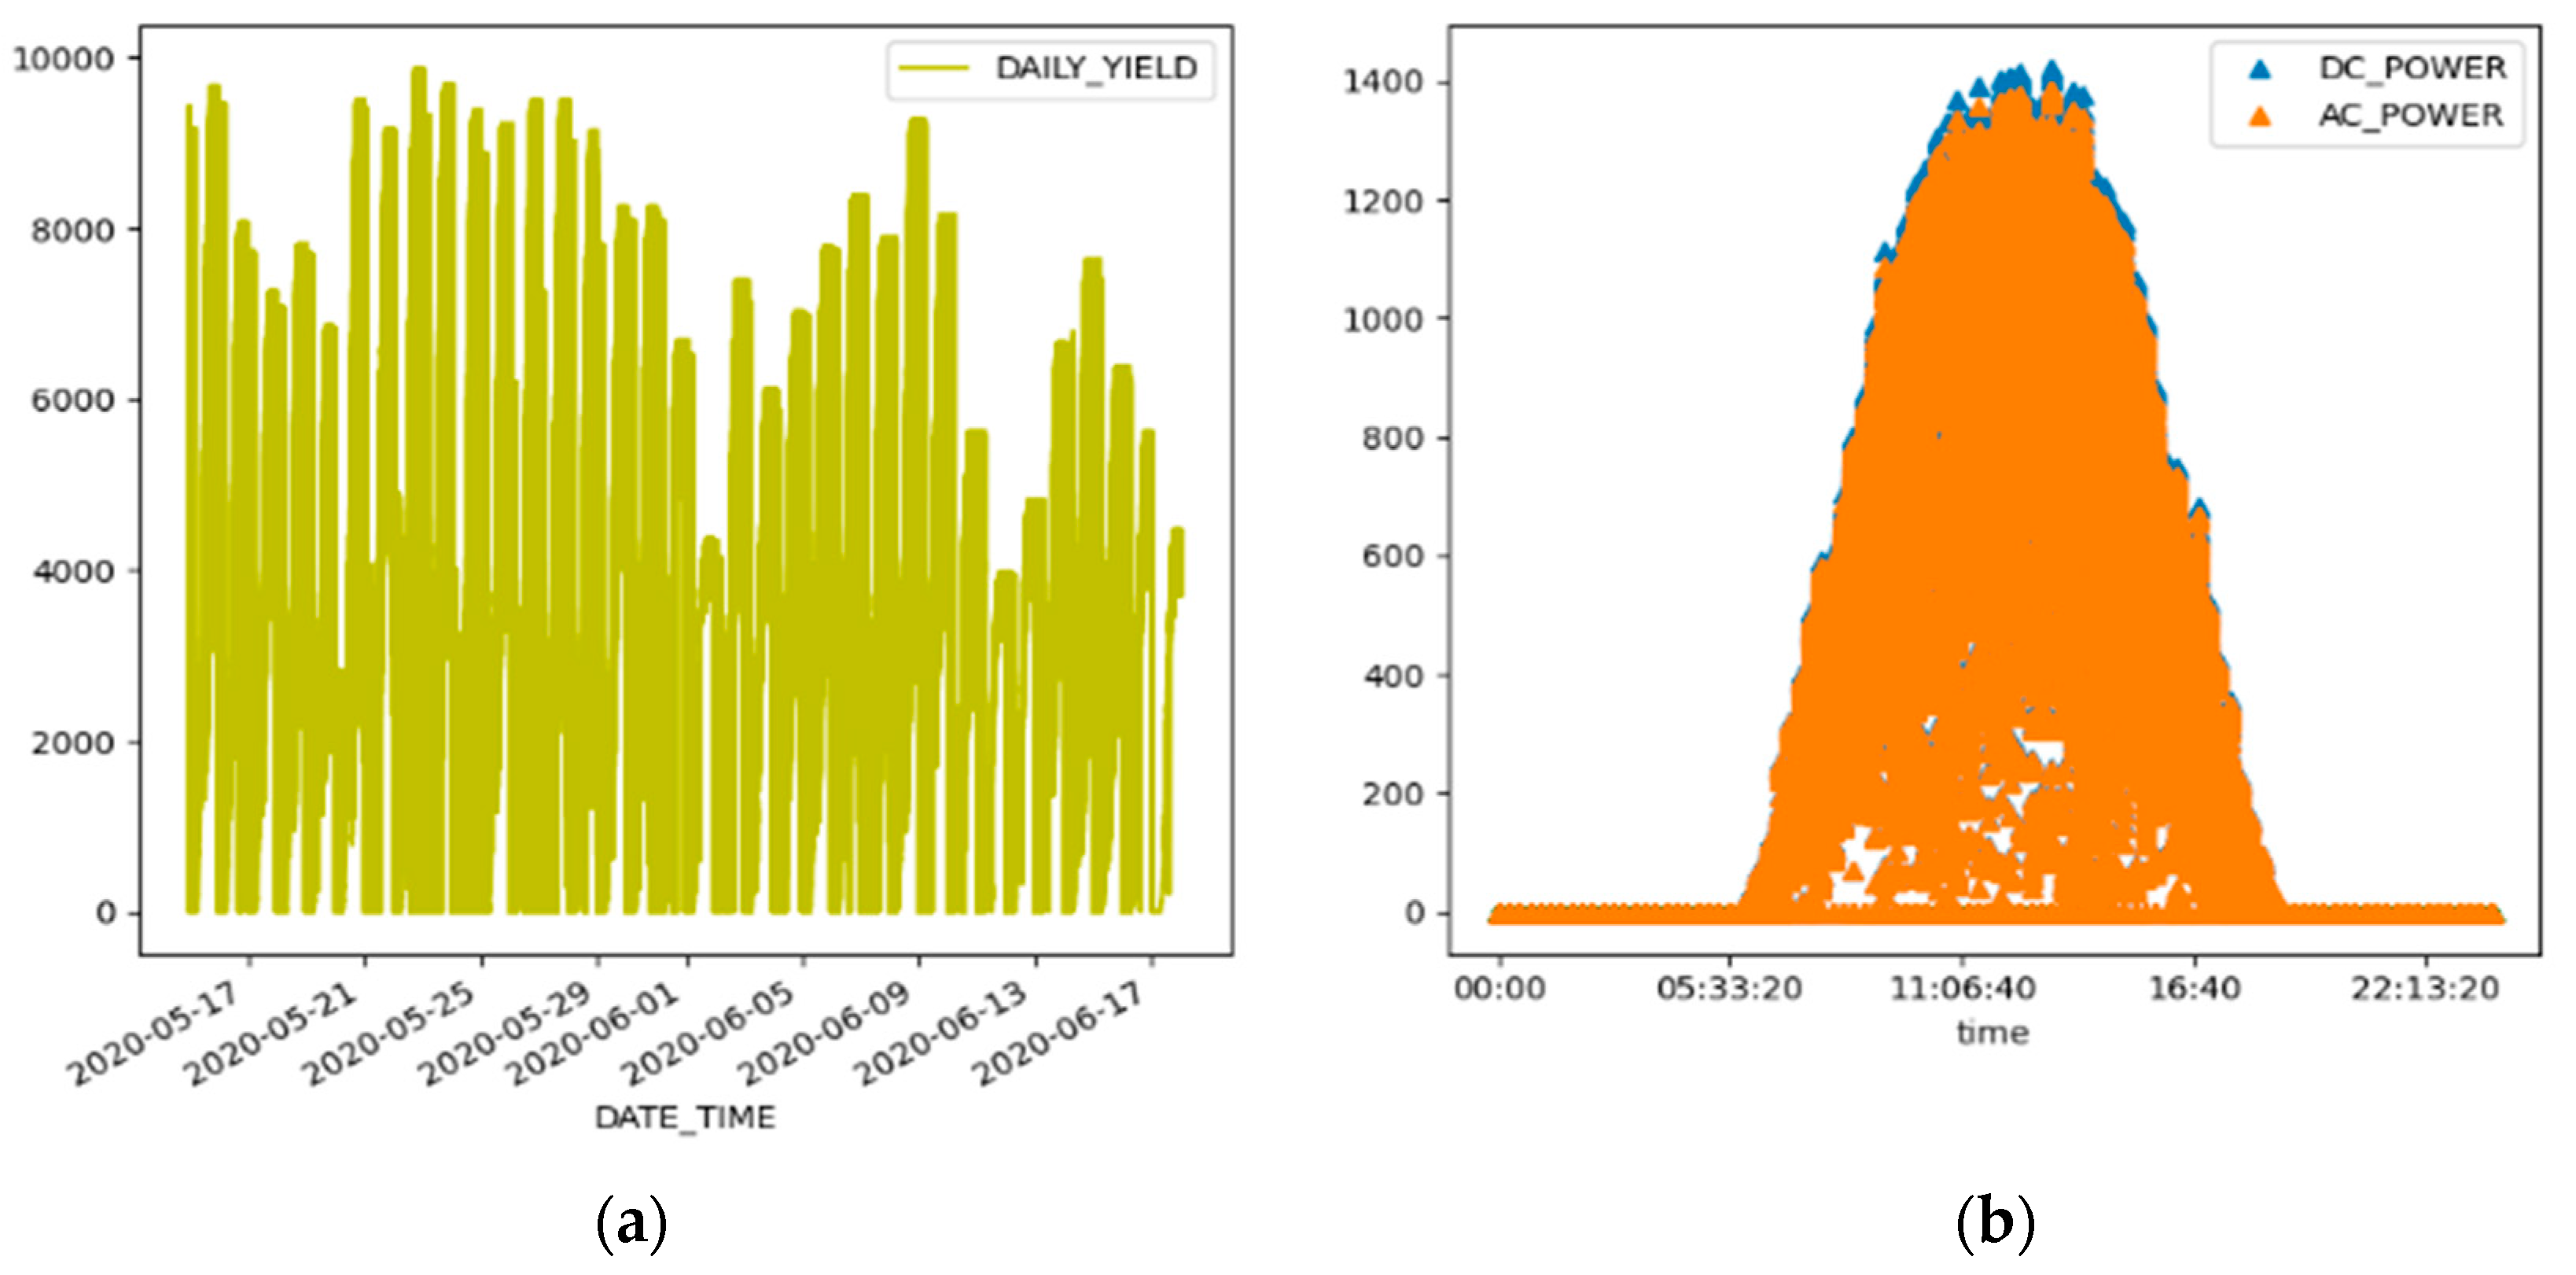
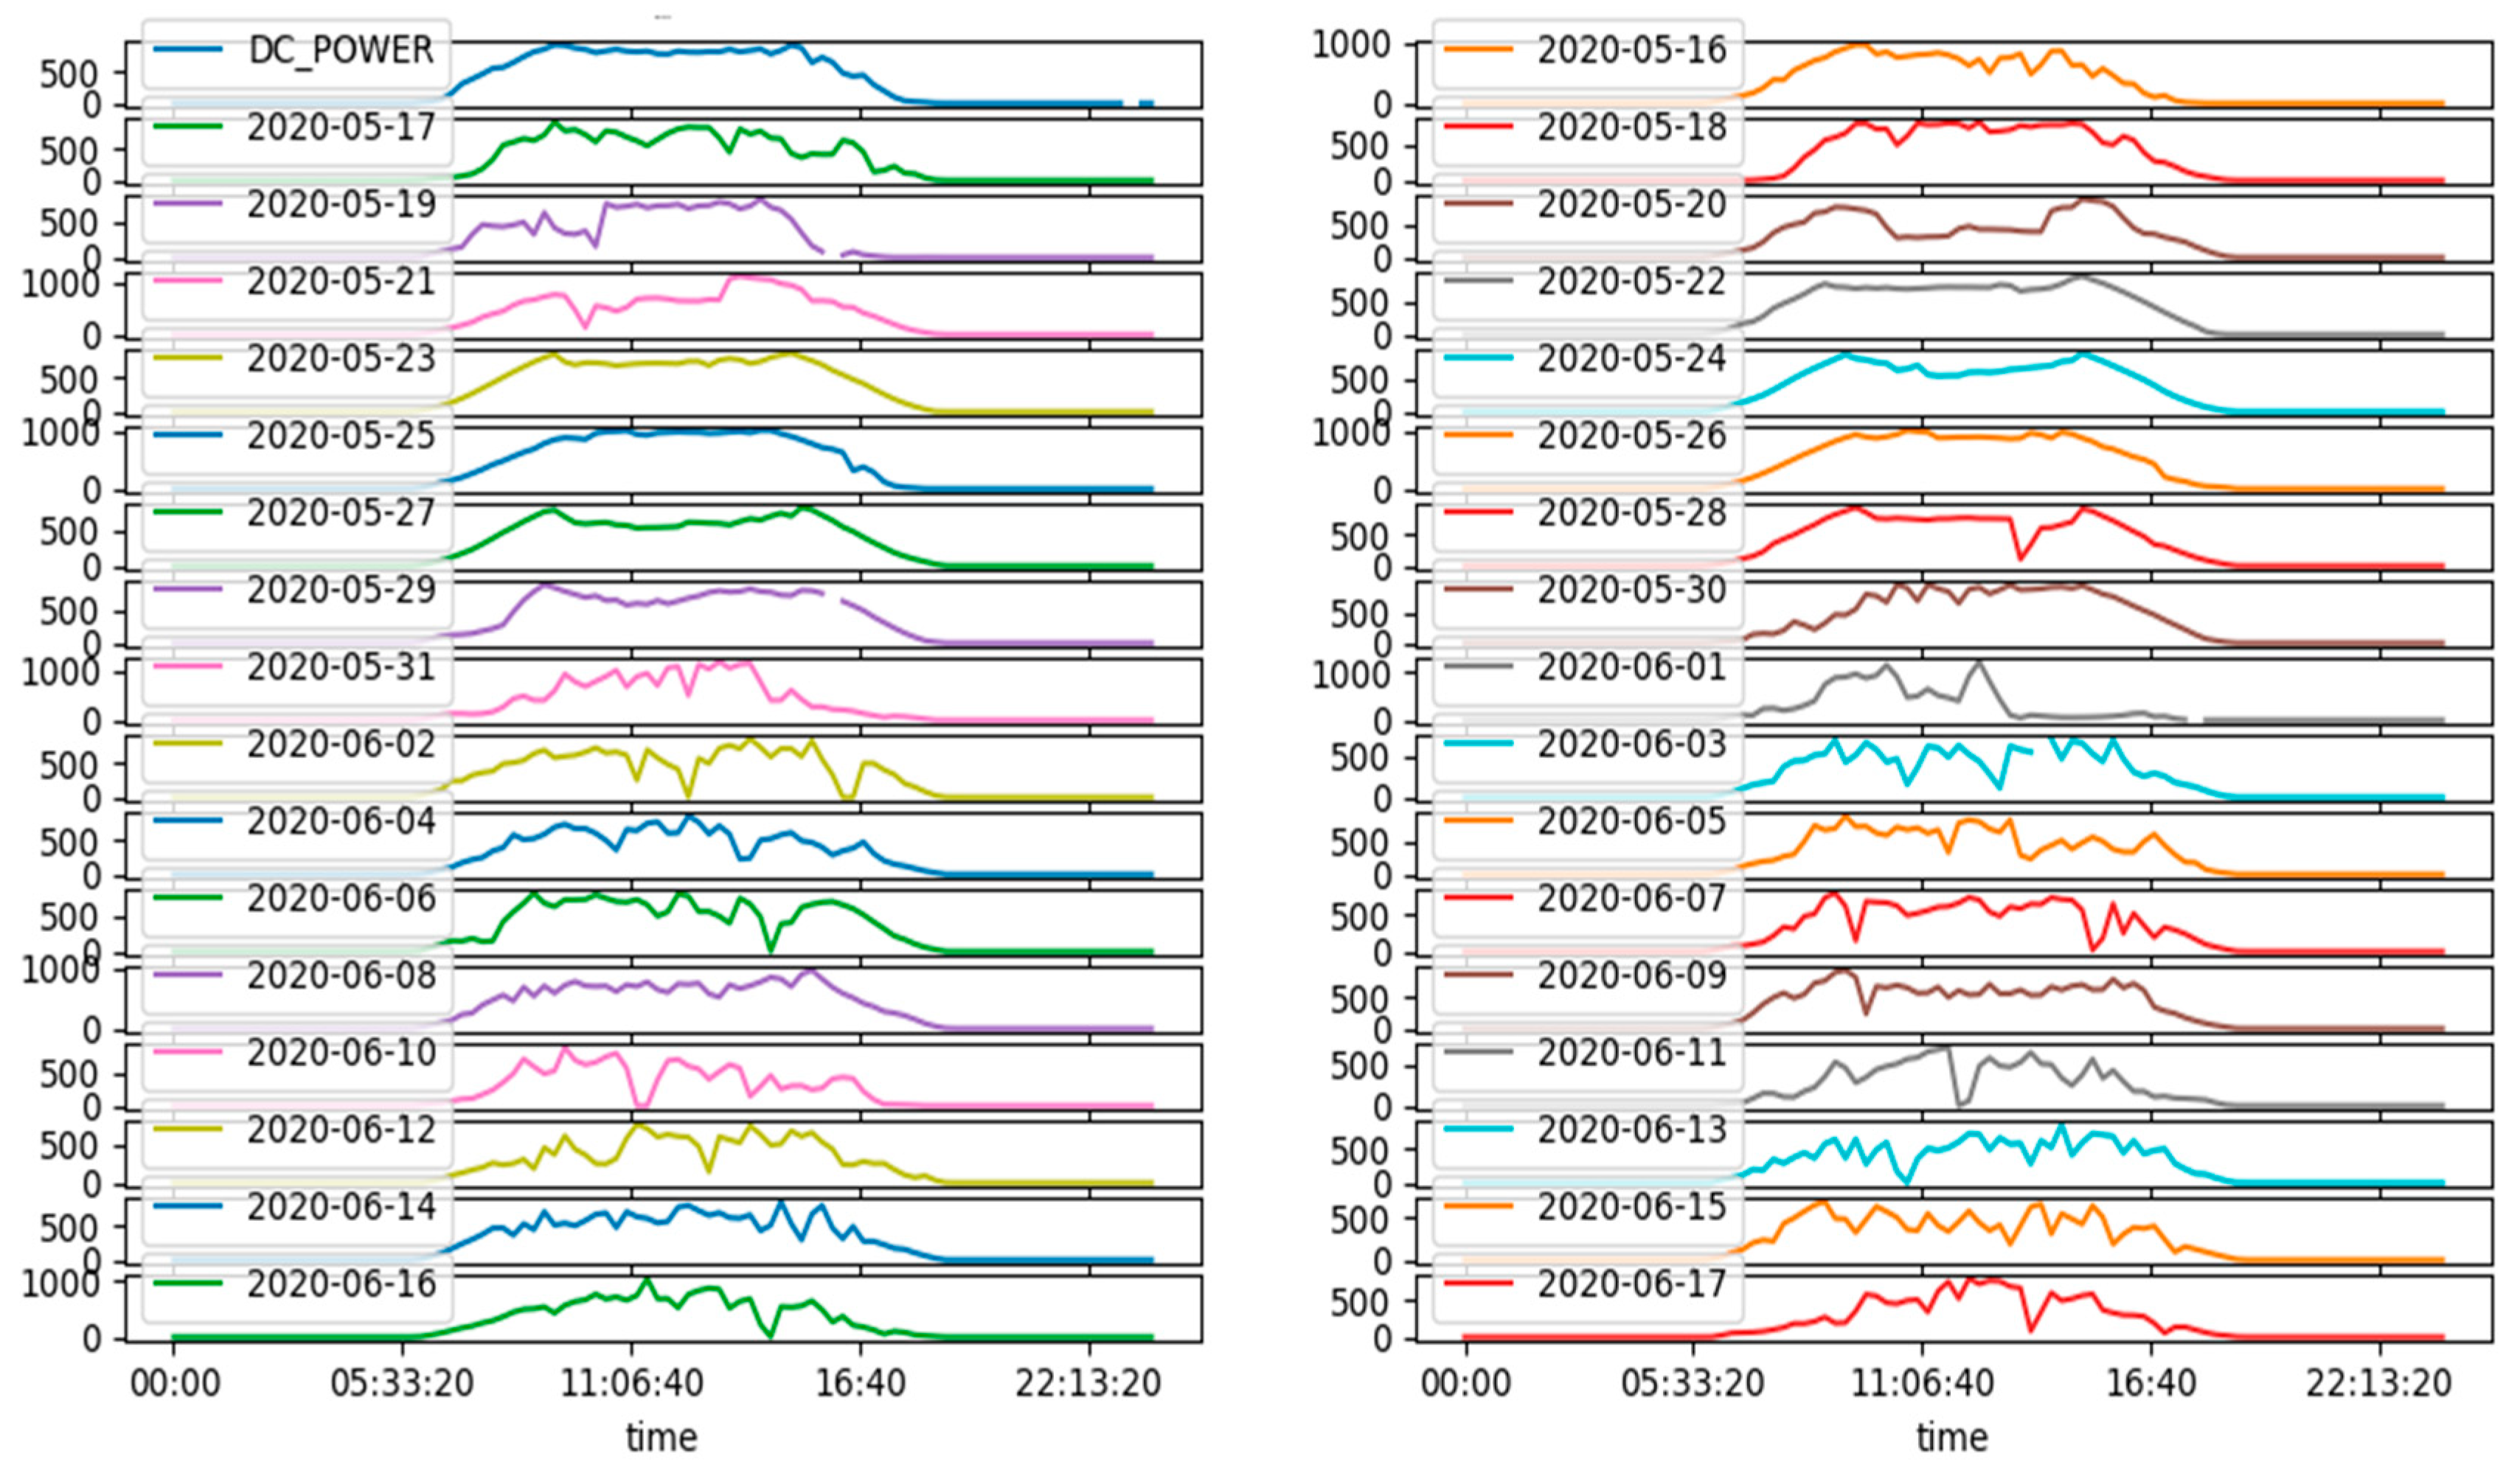
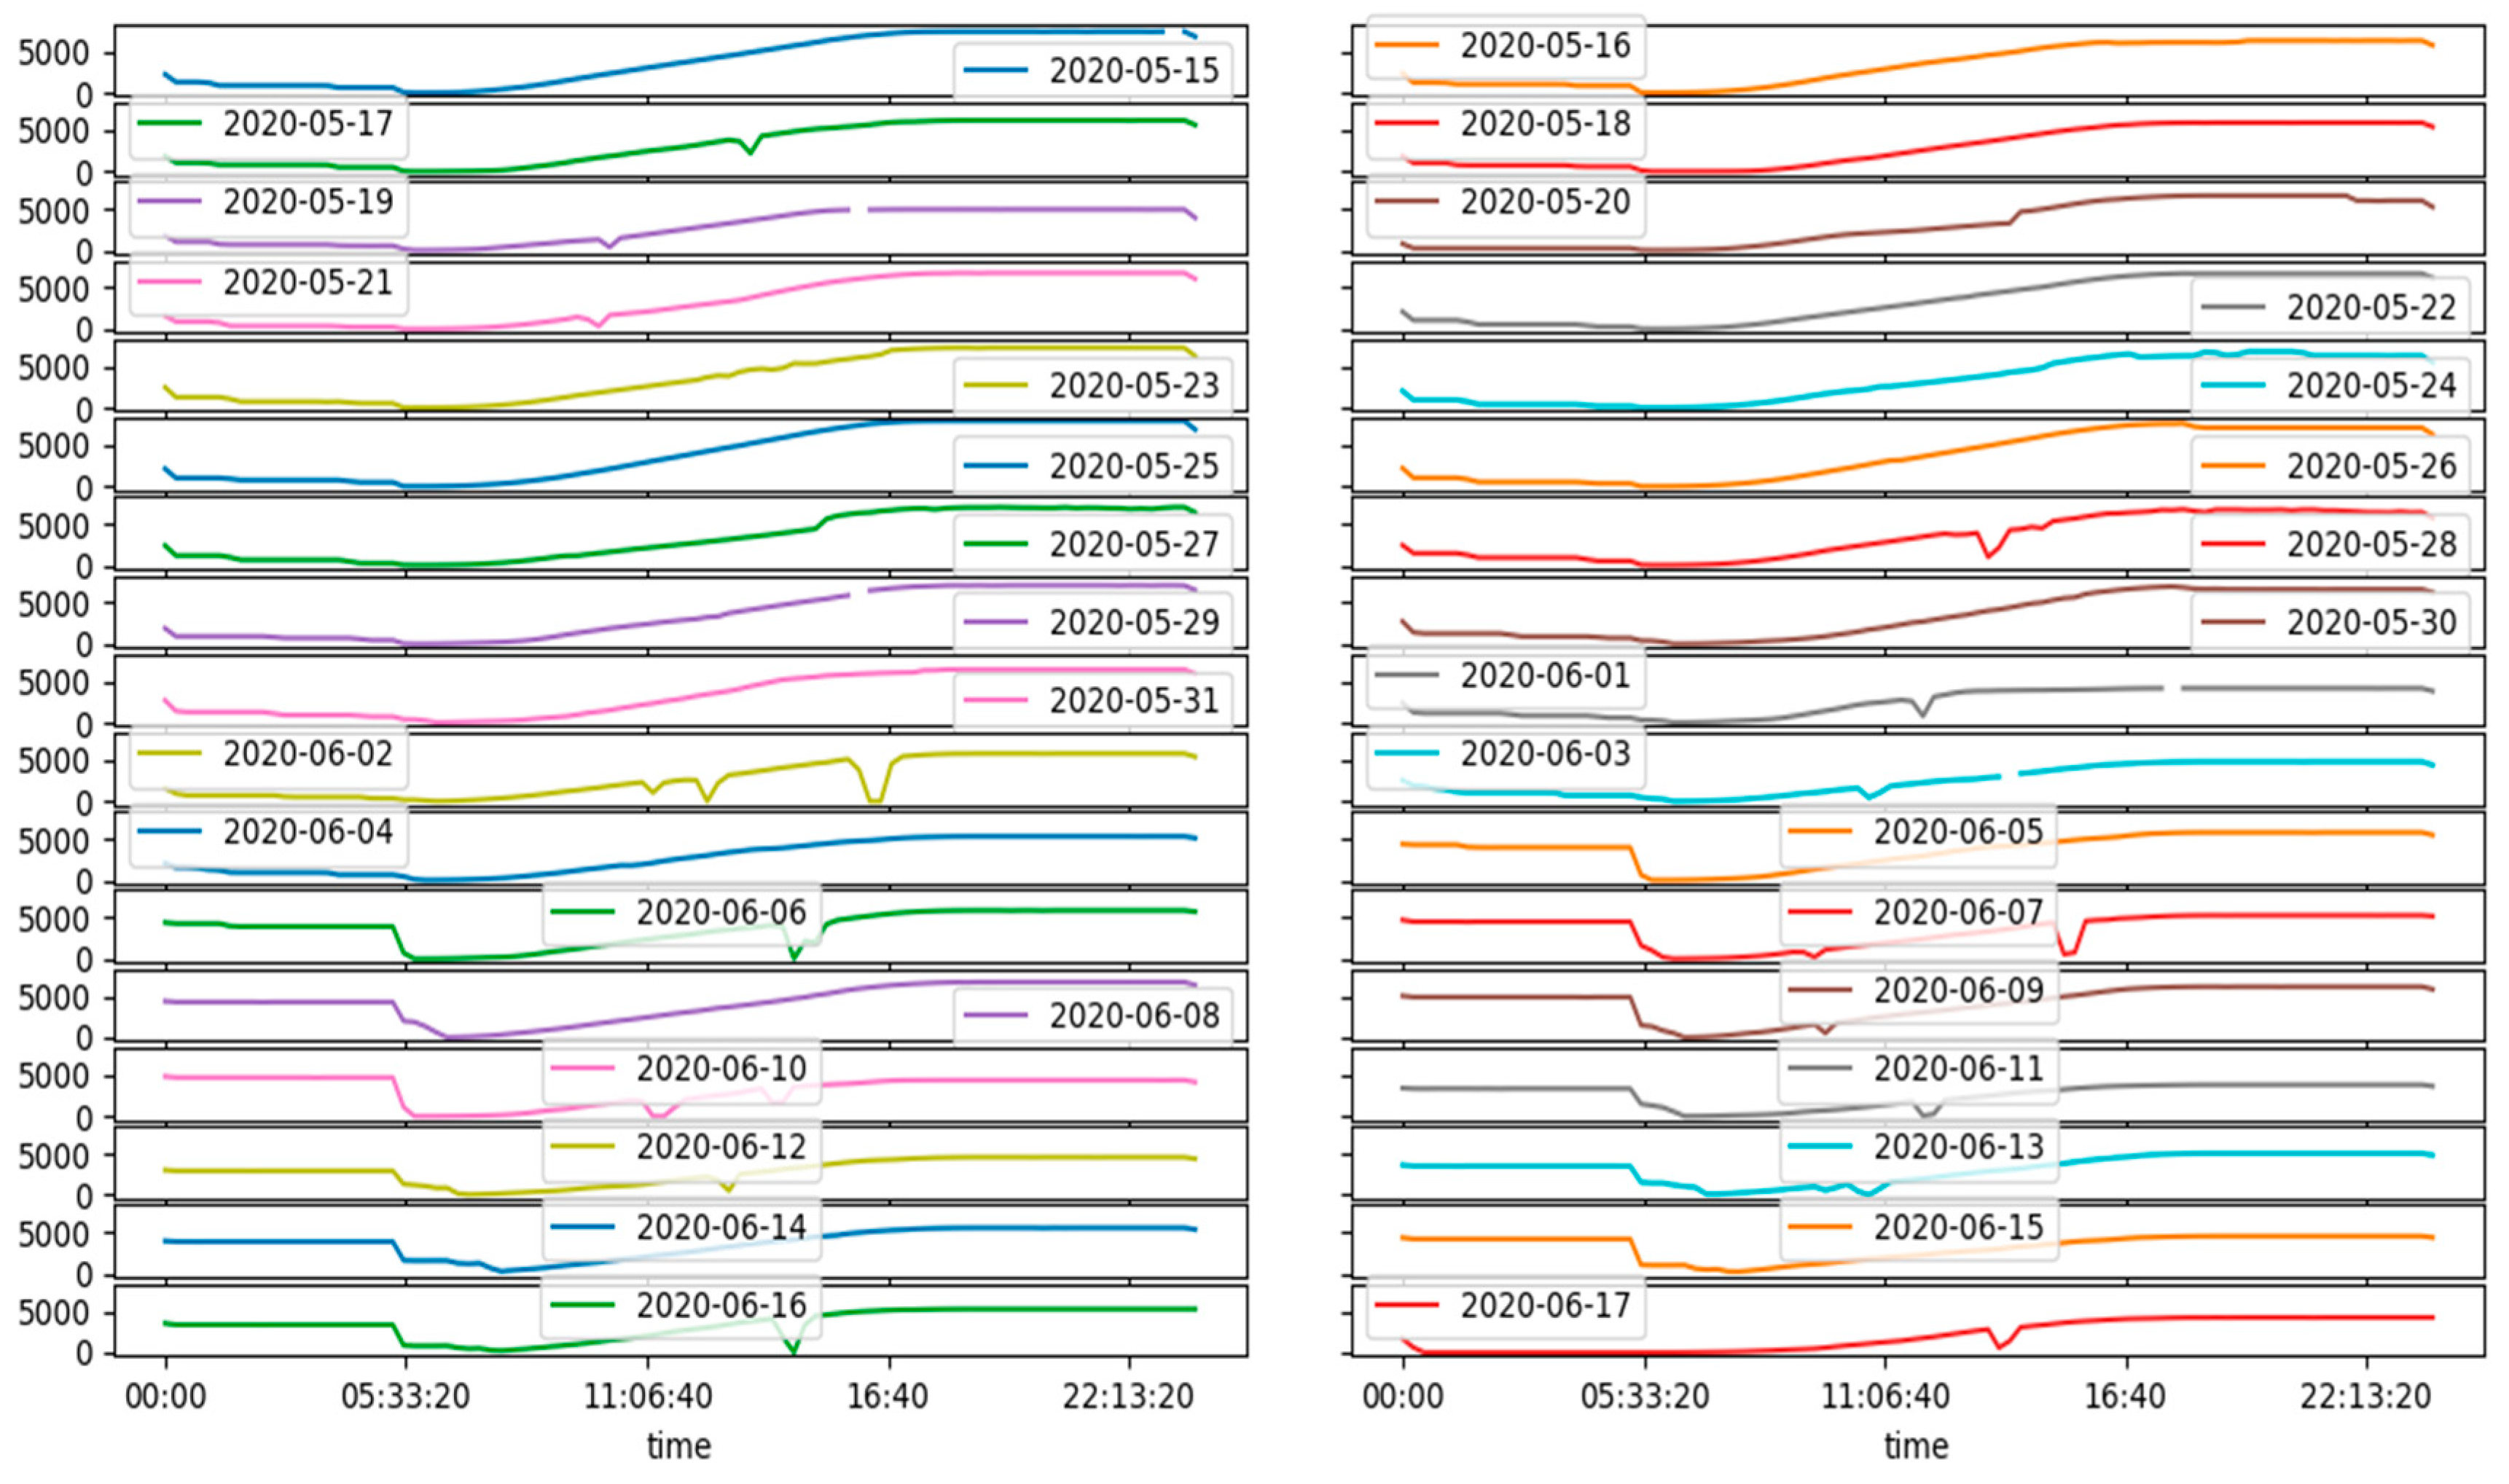
4. Result and Analysis

4.1. Mean Values

As shown in Table 1 and Table 2, the mean value of DC power in solar power generation for Plants 1 and 2 over the 34-day periods is found to be 3147.426211 kW and 246.701961 kW, respectively. Furthermore, the mean value of AC power for Plants 1 and 2 is also 307.802752 kW and 241.277825 kW, respectively. This shows that Plant 1 has higher mean values of DC power and AC power; however, the mean value of the total yield of Plant 2 has 6.589448 × 10⁸ kWh/day and Plant 1 has 6.978712 × 10⁶ kWh/day, which indicates that Plant 2 has a significantly higher mean total yield compared to Plant 1. By comparing these values, Plant 2’s total yield is approximately 94 times larger than that of Plant 1. As a result, it reveals that in terms of performance, Plant 2 appears to be significantly more productive or efficient in generating solar power compared to Plant 1. This might be due to Plant 2 using more advanced or efficient solar panels and inverters, resulting in higher total yield even with lower mean DC and AC power values.
The mean value of daily yield for Plant 1 and Plant 2 is 3295.968737 kWh and 3294.890295 kWh, respectively as shown in Table 1 and Table 2. This is another insight into the performance of Plant 1 and Plant 2. Despite the slightly higher mean daily yield of Plant 1 compared to Plant 2, it is significant to consider this in conjunction with total yield and other factors such as DC power and AC power. Even though Plant 1 generates slightly higher energy on average each day, Plant 2 still maintains a higher total yield. This implies that Plant 2 is capable of consistently generating a large amount of energy over time, even if its daily yield is slightly lower than Plant 1.

4.2. Correlation between Solar Module Temperature and Surrounding Temperature

Understanding the correlation between solar module temperature, surrounding temperature, and irradiation is significant for predicting and enhancing the performance of solar power installations. As shown in Figure 2, the correlation between the solar module temperature and surrounding temperature in Plant 1 and Plant 2 is found to be 0.85, and this suggests a strong positive correlation. This implies that as the surrounding temperature rises, the solar module temperature rises as well, and vice versa. This correlation is typically expected in solar power generation due to the heat absorbed from sunlight, which can lead to increased solar module temperatures. However, in some cases, a lower correlation might be preferable; therefore, it is significant to consider other factors such as the efficiency of the solar panels at different temperatures, the cooling mechanisms, and any potential impact on system performance.

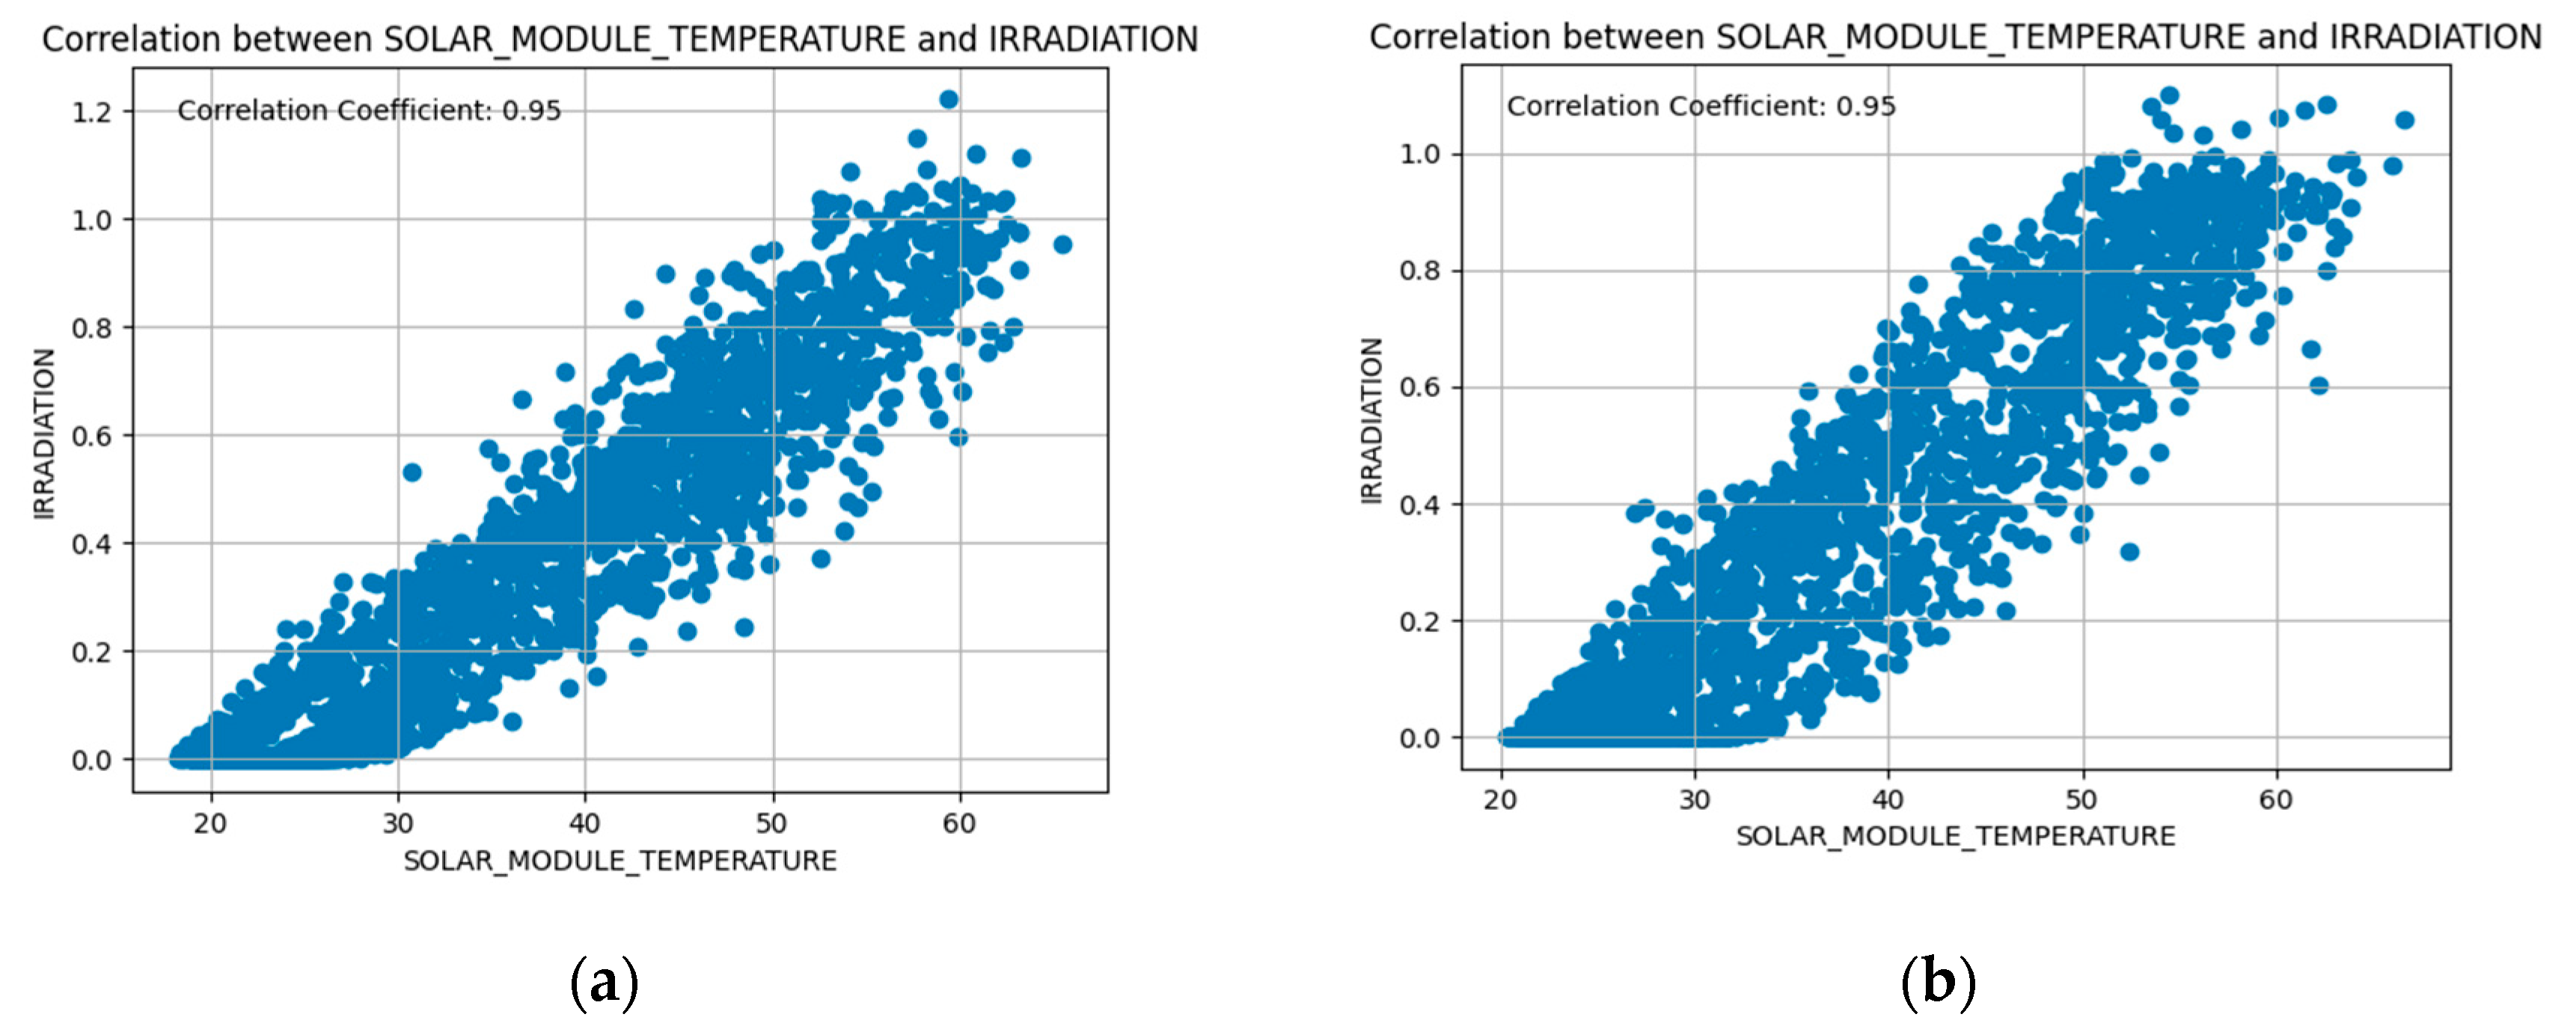
4.3. Correlation between Solar Module Temperature and Irradiation

As shown in Figure 3, the correlation between the solar module temperature and irradiation in Plant 1 and Plant 2 is found to be 0.95, and this suggests a very strong positive correlation. This implies that there is a highly predictable relation between the solar module temperature and irradiation. To be precise, changes in irradiation can be reliably associated with changes in solar module temperature and this can be an advantage for system modeling, control, and optimization. Furthermore, with a very strong positive correlation, it becomes easier to predict the impact of changes in irradiation on solar module temperature. This information is useful to optimize system efficiency by adjusting parameters such as cooling systems or tilt angles to mitigate temperature increases.

4.4. The Efficiency of DC to AC Conversion

We developed algorithms to detect the efficiency of different inverters at the same plant by analyzing sensor data. Since the conditions of the data in Plant 1 are similar for the power generation of different inverters (i.e., same total area and irradiance), plotting the power generation versus time gives us their relative efficiencies. As shown in Figure 4, the result revealed that in Plant 1, particular inverters with source keys ‘1BY6WEcLGh8j5v7′ and ‘bvBOhCH3iADSZry’ were found to be the least efficient, which show a need for repair/ replacement. Figure 5 also shows the inverter’s efficiency in Plant 2 and the result indicates the inverters with source key ‘4UPUqMRK7TRMgml’ and ‘Quc1TzYxW2pYoWX’ are the least efficient, indicating the requirement for repair/replacement.
Furthermore, Figure 6 and Figure 7 show the DC to AC conversion ratio in Plant 1 and Plant 2, respectively; this is an indicator of the efficiency of the inverters without losses. Plant 2 has a much higher conversion ratio than Plant 1, typically indicating more efficient inverters, and a larger percentage of the input DC power is being successfully converted into output AC power in Plant 2. The result suggests Plant 1 has huge losses in power generation.

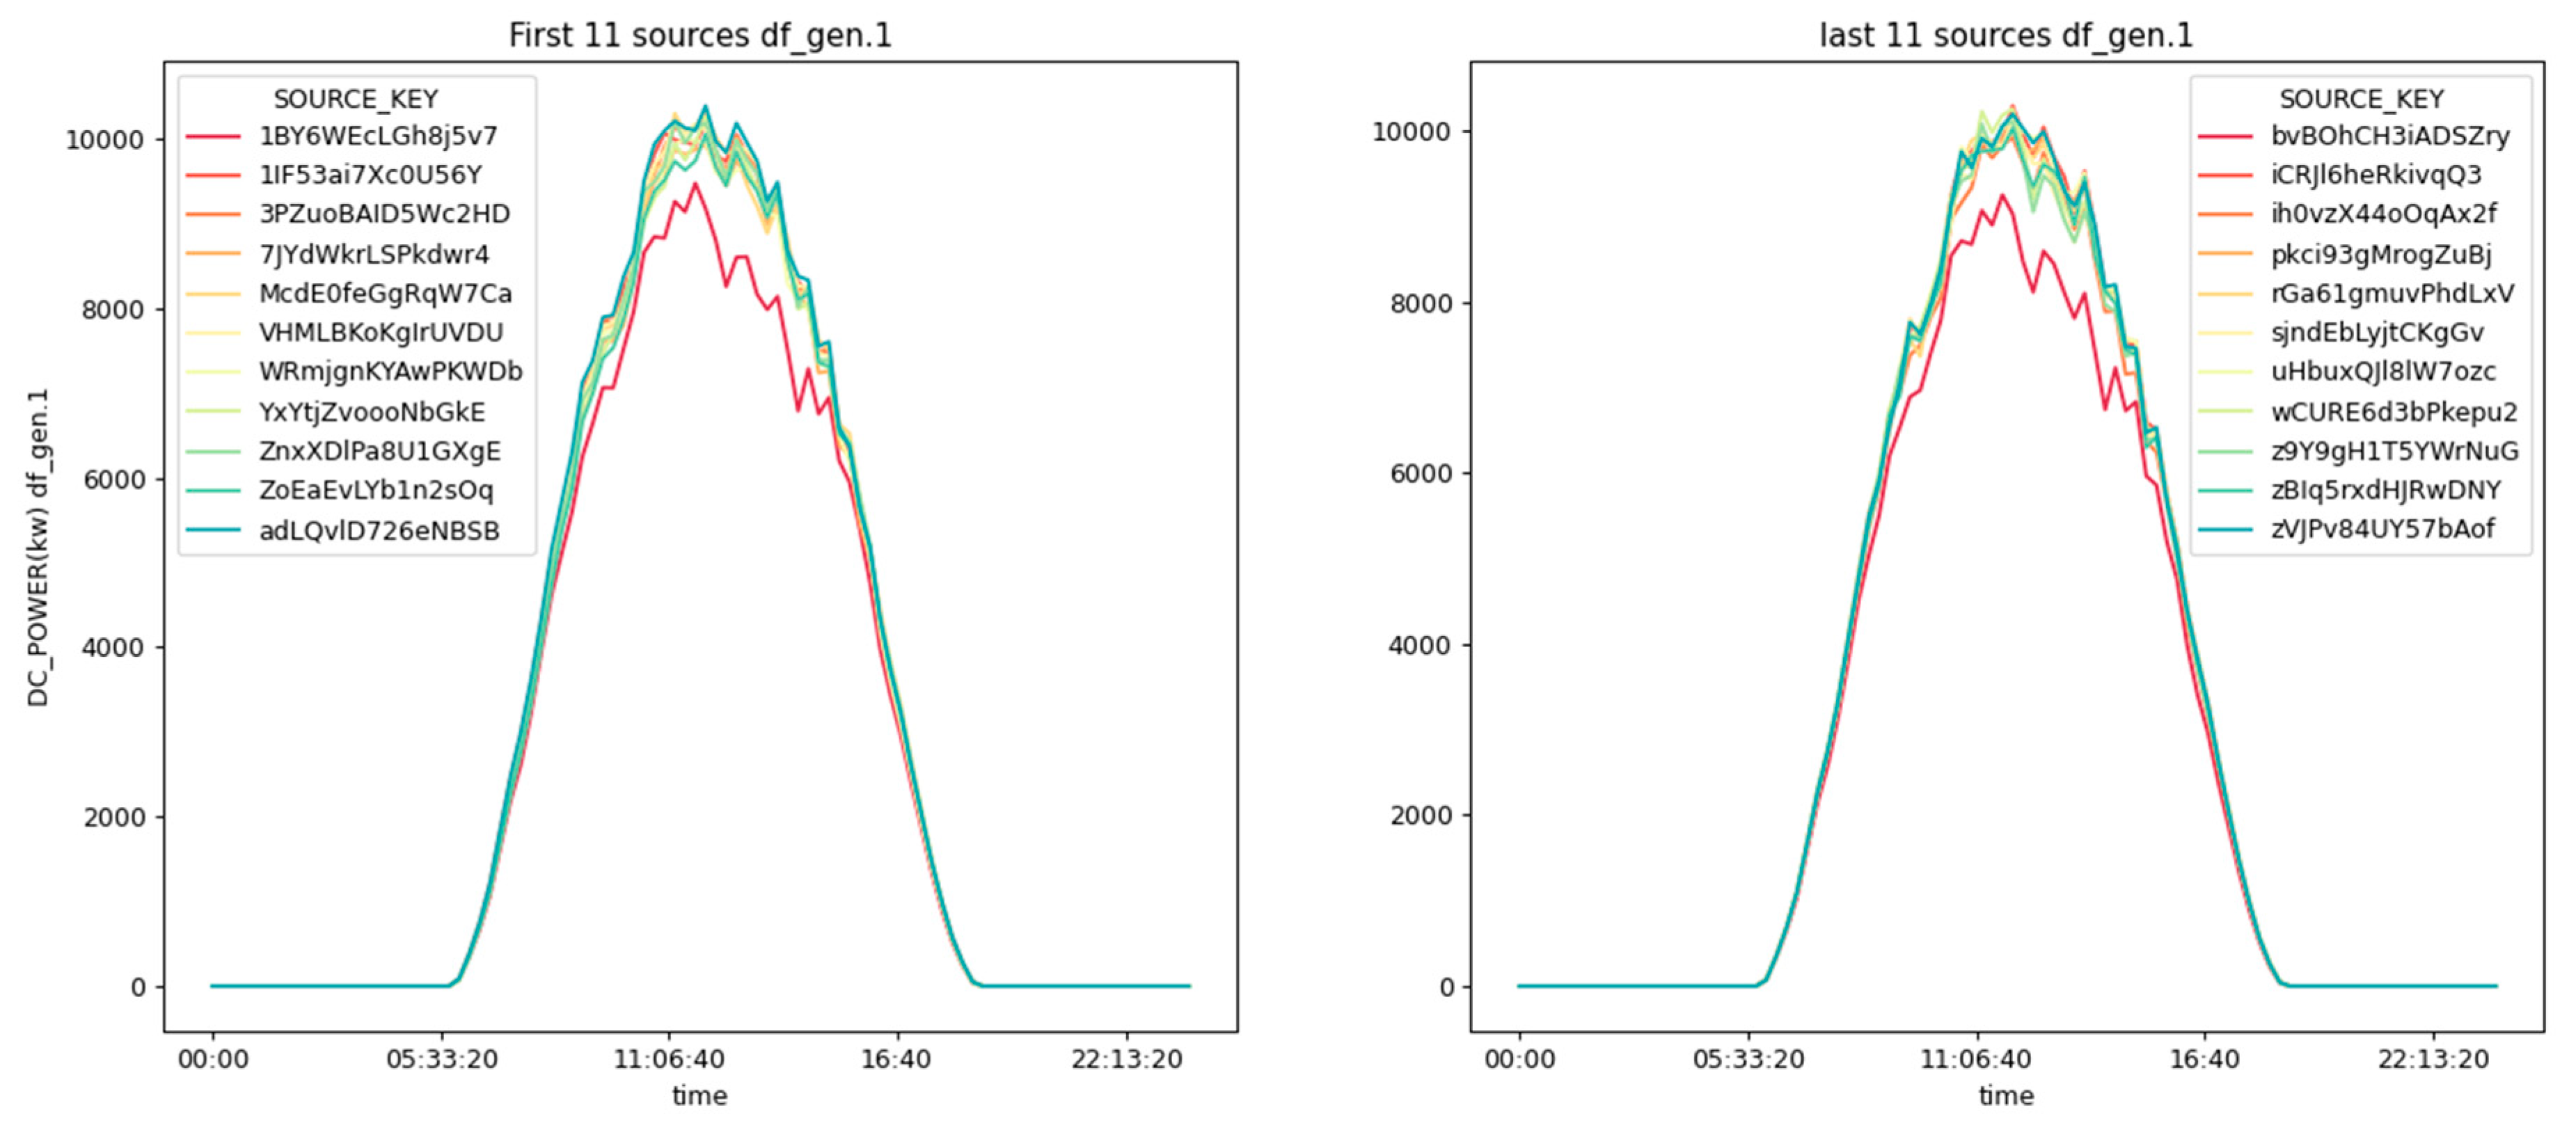
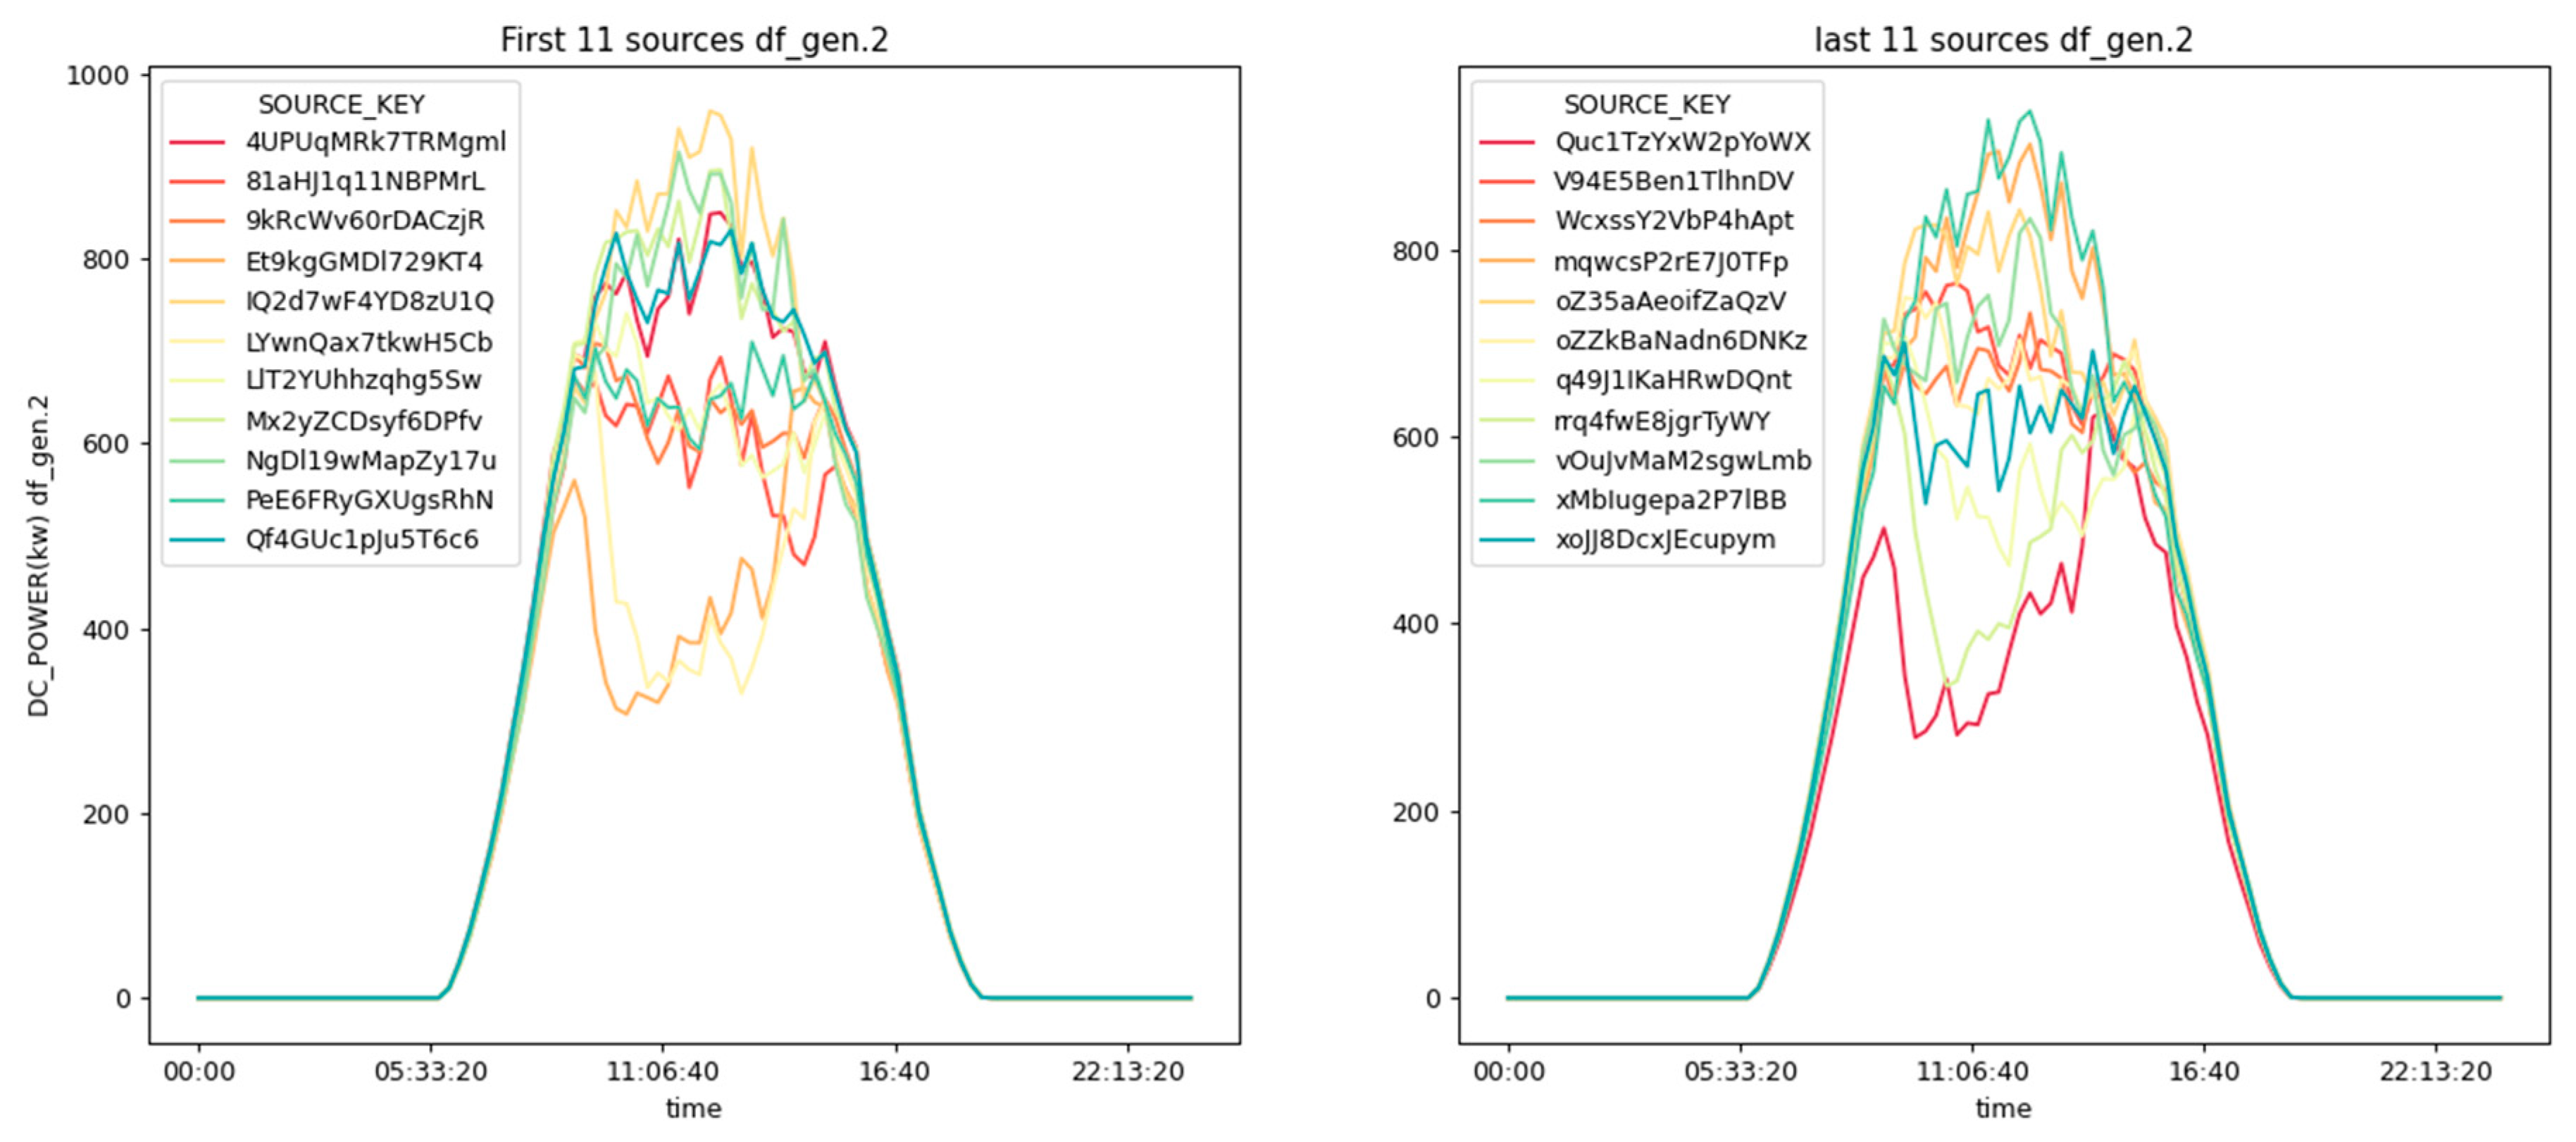
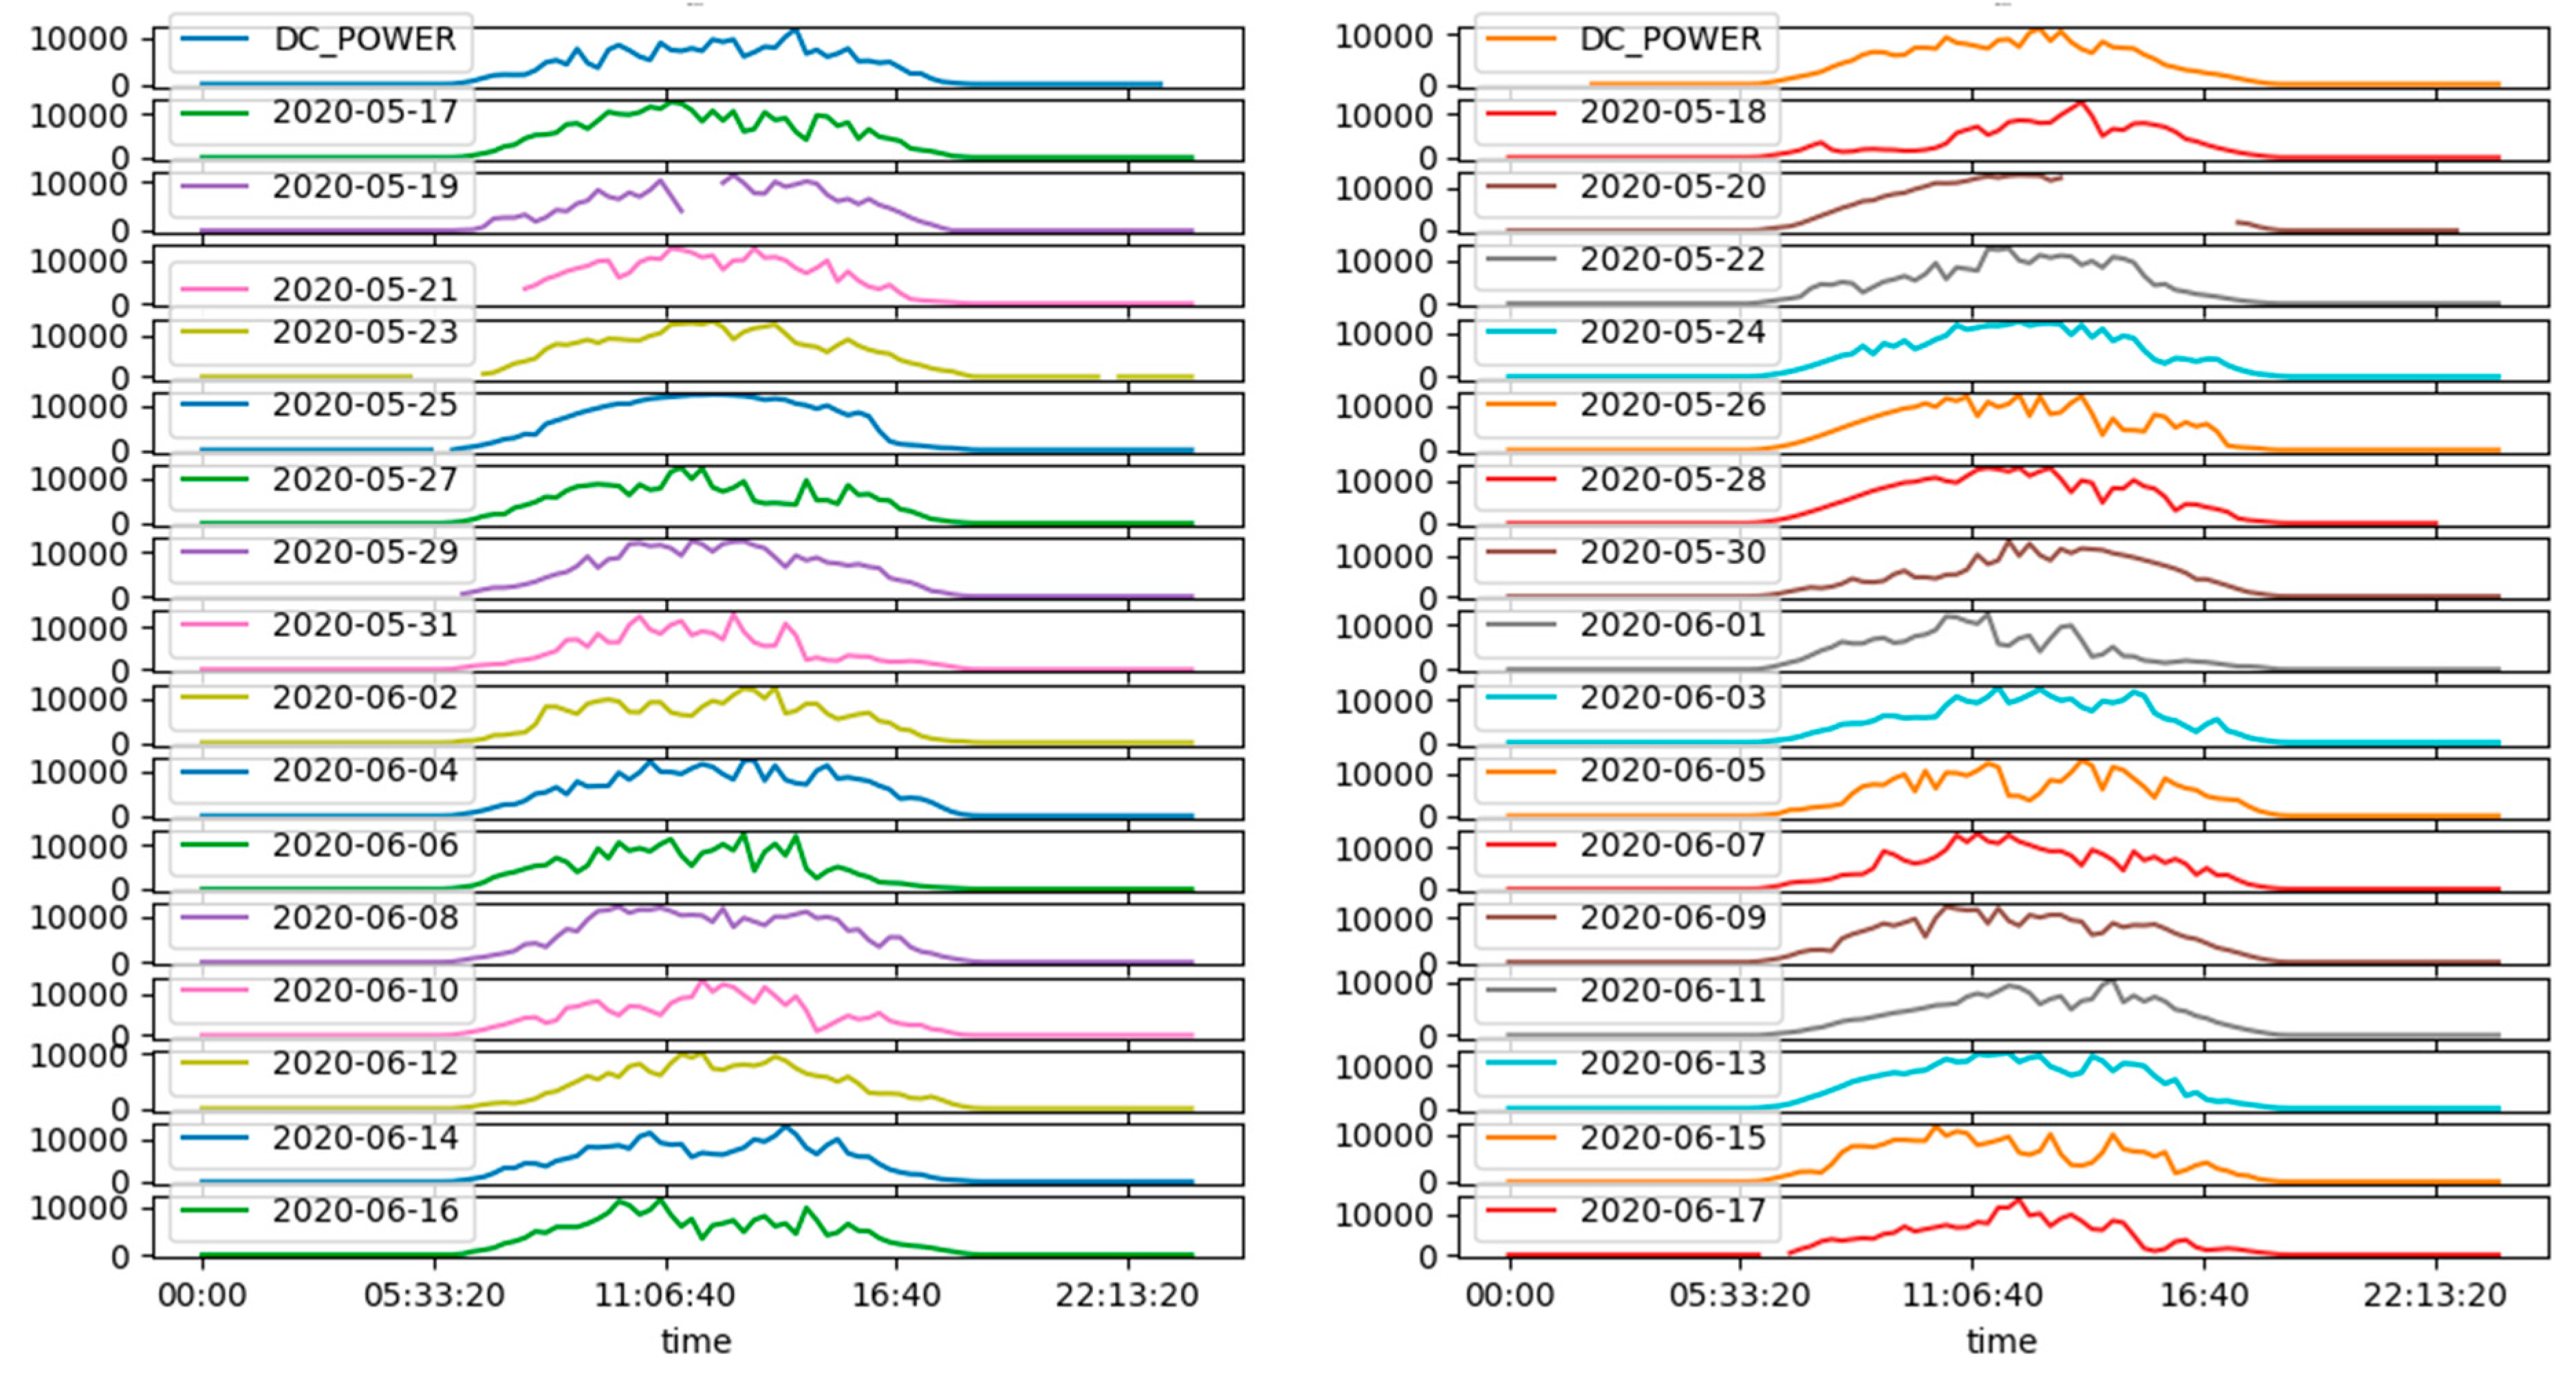
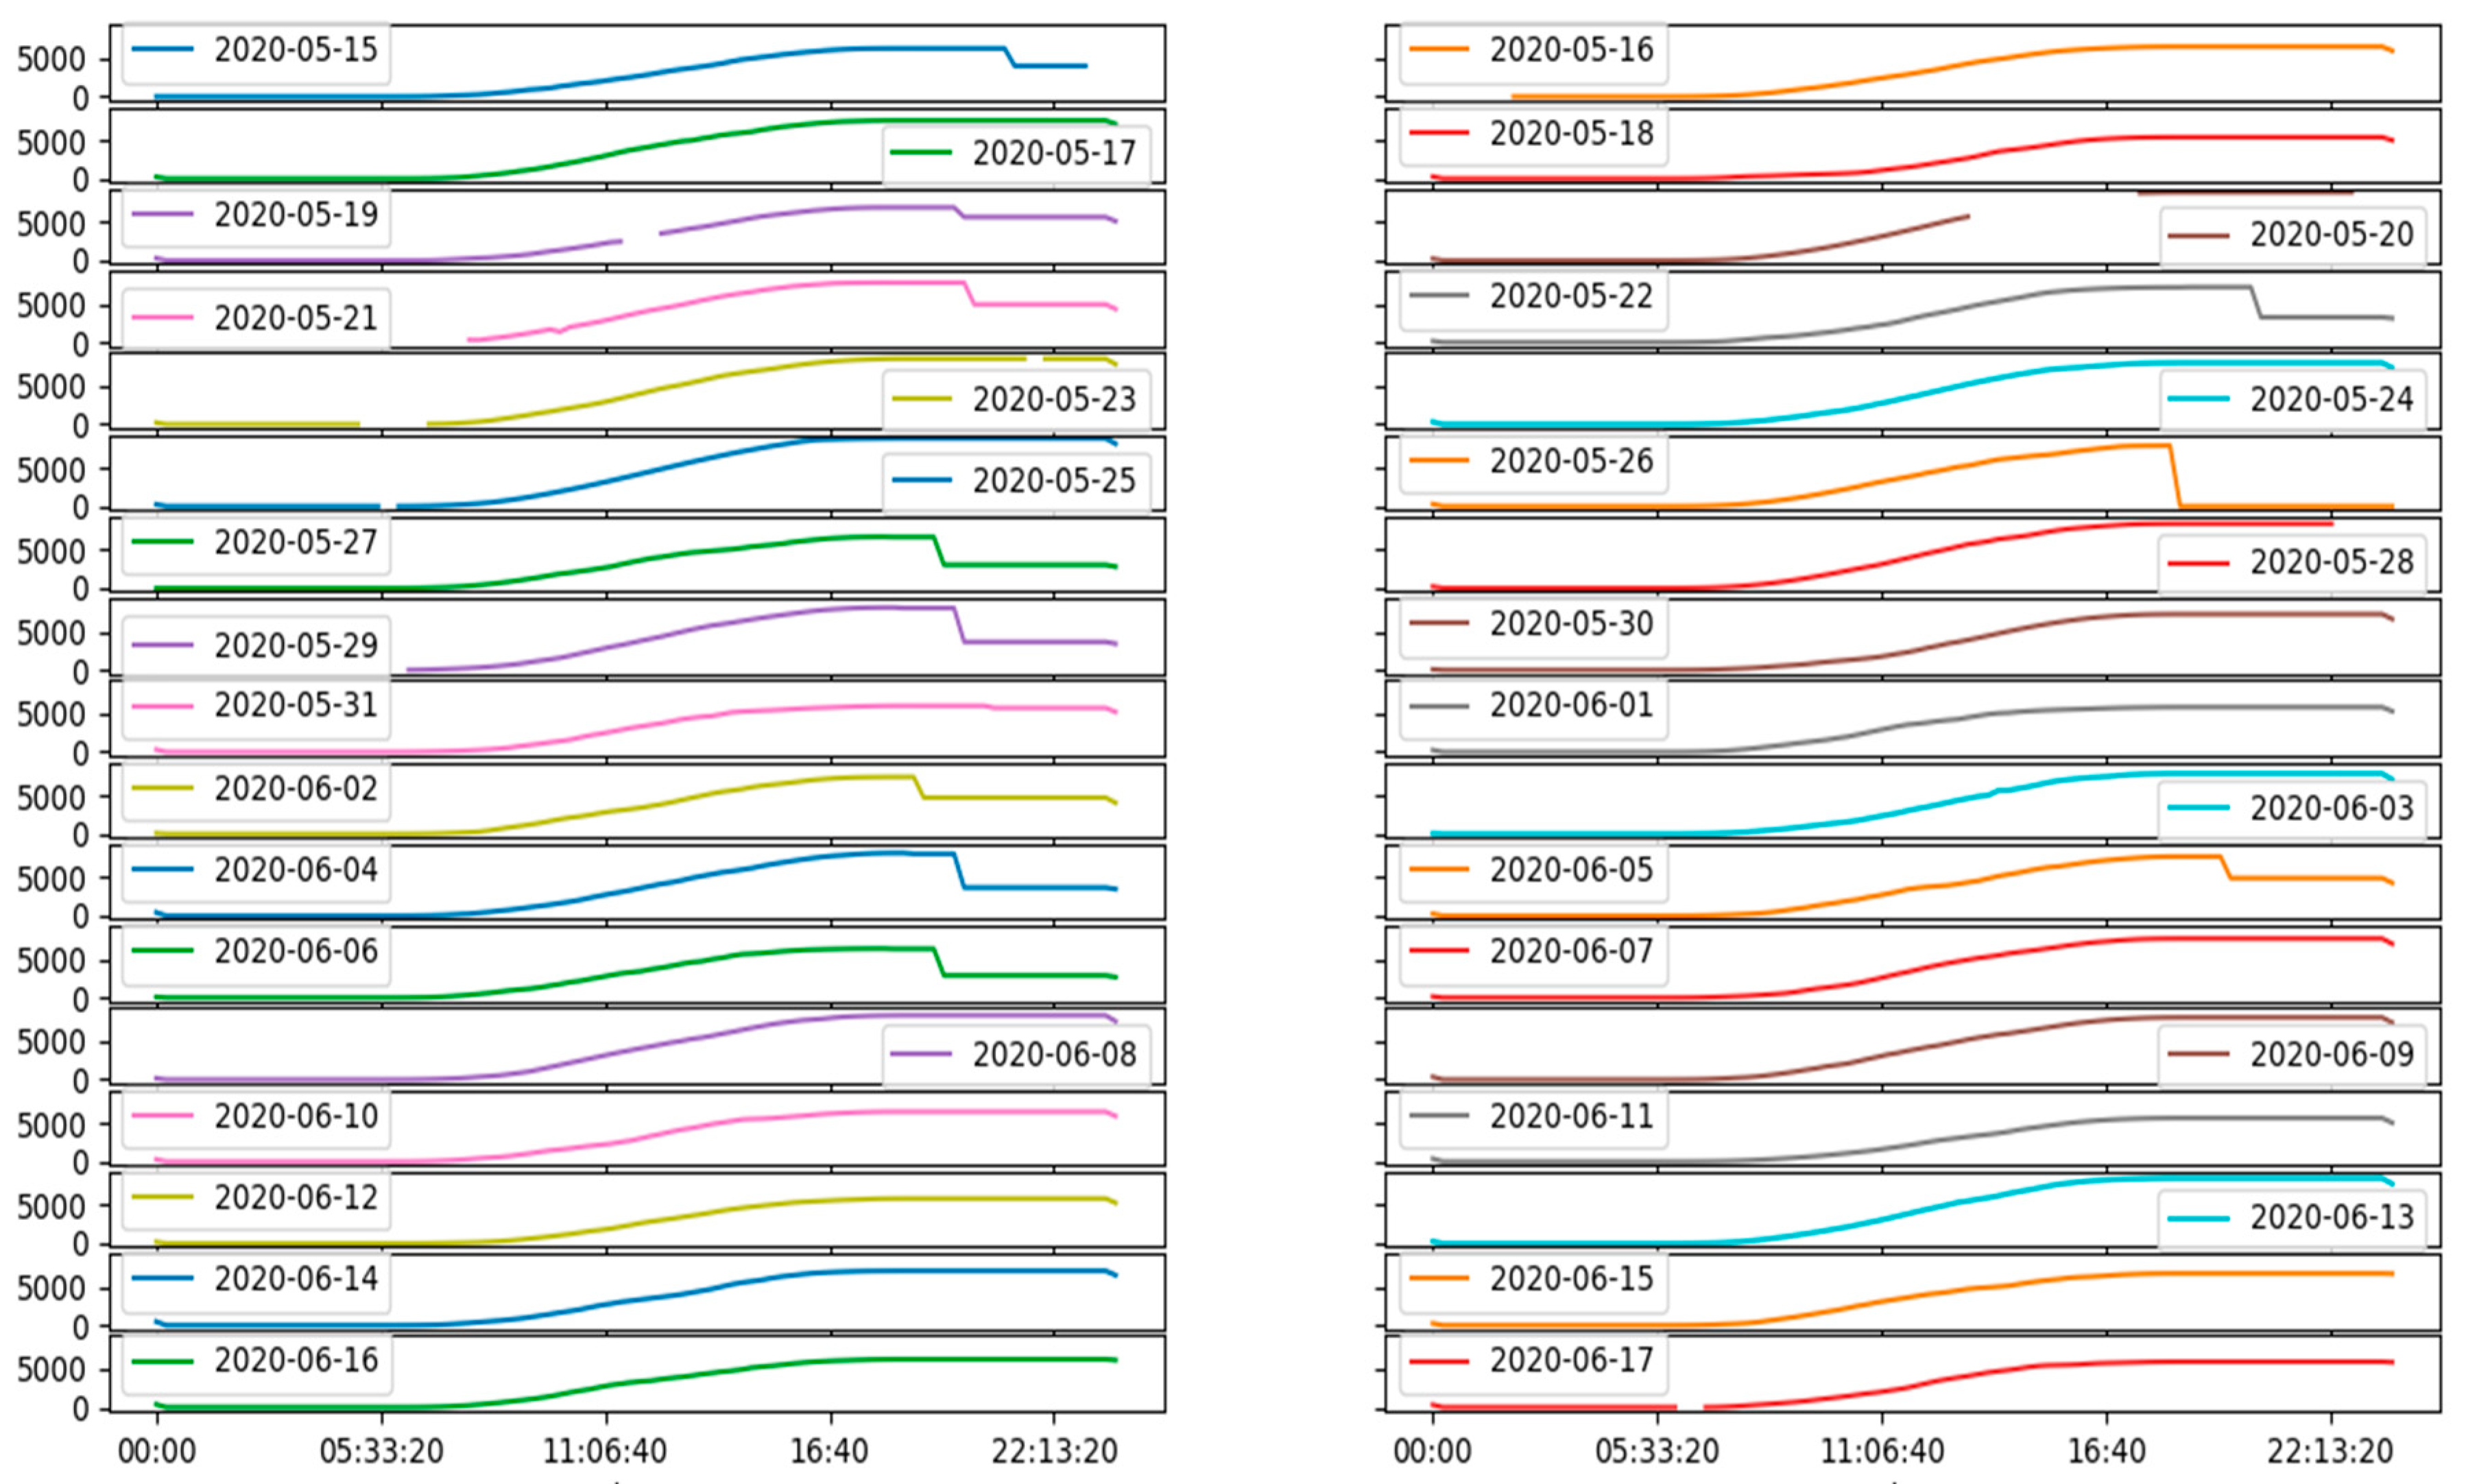
4.5. Solved Maintenance Schedules Using Real-Time Data

To assess the efficiency and effectiveness of Plant 1 and Plant 2 over a 34-day time, we analyzed the DC power and daily yield for each day. This analysis typically falls under the realm of performance monitoring, and it involves performance evaluation and predictive maintenance.
For Plant 1, plotting the DC power and daily yield, as shown in Figure 8 and Figure 9, we can observe that power generation falls during specific intervals on the 19th, 20th, 21st, and 23rd of May. This may be due to the occurrence of maintenance, because of which the grid might be disconnected.
We also plotted the DC power and daily yield for Plant 2. However, the gap when power generation falls is very narrow compared with Plant 1. As shown in Figure 10 and Figure 11, we can observe that power generation falls during specific intervals on the 19th and 29th of May and the 1st of June. This may be due to the occurrence of maintenance, because of which the grid might be disconnected.

5. Conclusions

This paper presents a unified approach that integrates demand response (DR) with the model predictive control (MPC) method to improve the scheduling of maintenance and replacement of real-time, suboptimally performing solar power generation. We propose a combination of the DR mechanism with the MPC algorithm that effectively addresses the critical correlations between solar module temperature and irradiations which are essential for predicting and optimizing the performance of solar energy installation. The overall solar power generation model considers various components, the DC–AC conversion ratio to gauge the efficiency of inverters, and their complex interactions. Integrating this relationship into the mathematical model of solar power generation and demand response with model predictive control enables proactive decisions for repair, maintenance, or replacement of equipment. The combination of the DR mechanism with the MPC algorithm presents a promising strategy for enhancing the reliability and efficiency of solar energy systems by leveraging the mathematical model of solar power production and real-time data. Our exploratory data analysis using Python confirms the effectiveness and benefits of the proposed approach, highlighting its potential in finding the relationship between the factors that affect solar power generation and in improving the consistency and efficiency of solar energy production.
Future work could focus on designing a model that leverages machine learning and artificial intelligence (AI) to enhance prediction accuracy and adaptability to changing situations. These models could consider more detailed weather forecasts, grid conditions, and energy consumption patterns.

Author Contributions

Conceptualization and design study: S.B.F.; Manuscript preparation and review of the relevant literature: S.B.F.; Data analysis: S.B.F.; development of the model predictive control (MPC) algorithm: S.B.F.; integration of demand response strategies and scheduling framework for maintenance and suboptimal equipment performance: S.B.F.; supervision: B.L.; review and approval of the final manuscript: B.L.; funding and acquisition: B.L.; approval of the final manuscript: S.C. and Y.Z. All authors have read and agreed to the published version of the manuscript.

Funding

This research was funded by Science and Technology Projects from the State Grid Corporation (5400-202316228A-1-1-ZN).

Data Availability Statement

The dataset used in this research was obtained from Kaggle.com, this platform is for data science and machine learning competitions. The specific datasets are Plant_1_Generation_Data, Plant_1_Weather_Sensor_Data, Plant_2_Generation_Data, Plant_2_Weather_Sensor_Data, which can be accessed since 18 Augst 2020 at: https://www.kaggle.com/datasets/anikannal/solar-power-generation-data.

Conflicts of Interest

Authors Songsong Chen and Ying Zhou were employed by the China Electric Power Research Institute Co., Ltd. In conducting this research, the authors declare that there are no conflicts of interest. All funding sources are acknowledged, and the authors have no financial, personal, or professional affiliations that could be perceived to bias the work presented in this paper.

References

  1. Jha, K.; Shaik, A.G. A comprehensive review of power quality mitigation in the scenario of solar PV integration into utility grid. e-Prime—Adv. Electr. Eng. Electron. Energy 2023, 3, 100103. [Google Scholar] [CrossRef]
  2. Almaita, E.; Abdelsalam, E.; Almomani, F.; Nawafah, H.; Kassem, F.; Alshkoor, S.; Shloul, M. Impact study of integrating solar double chimney power plant into electrical grid. Energy 2023, 265, 126350. [Google Scholar] [CrossRef]
  3. Zhu, J.; Nutakki, T.U.K.; Singh, P.K.; Abdullaeva, B.S.; Zhou, X.; Fouad, Y.; Alzubaidi, L.H. Sustainable off-grid residential heating and desalination: Integration of biomass boiler and solar energy with environmental impact analysis. J. Build. Eng. 2024, 87, 109035. [Google Scholar] [CrossRef]
  4. Chakraborty, N.; Choudhury, N.B.D.; Tiwari, P.K. Profit Maximization of Retailers with Intermittent Renewable Sources and Energy Storage Systems in Deregulated Electricity Market with Modern Optimization Techniques: A Review. Renew. Energy Focus 2023, 47, 100492. [Google Scholar] [CrossRef]
  5. Salam, I.U.; Yousif, M.; Numan, M.; Billah, M. Addressing the Challenge of Climate Change: The Role of Microgrids in Fostering a Sustainable Future—A Comprehensive Review. Renew. Energy Focus 2024, 48, 100538. [Google Scholar] [CrossRef]
  6. Dalapati, G.K.; Ghosh, S.; Sherin, P.A.T.; Ramasubramanian, B.; Samanta, A.; Rathour, A.; Wong, T.K.S.; Chakrabortty, S.; Ramakrishna, S.; Kumar, A. Maximizing solar energy production in ASEAN region: Opportunity and challenges. Results Eng. 2023, 20, 101525. [Google Scholar] [CrossRef]
  7. Wanyama, J.; Soddo, P.; Nakawuka, P.; Tumutegyereize, P.; Bwambale, E.; Oluk, I.; Mutumba, W.; Komakech, A.J. Development of a solar powered smart irrigation control system Kit. Smart Agric. Technol. 2023, 5, 100273. [Google Scholar] [CrossRef]
  8. Kaluthanthrige, R.; Rajapakse, A.D. Demand response integrated day-ahead energy management strategy for remote off-grid hybrid renewable energy systems. Int. J. Electr. Power Energy Syst. 2021, 129, 106731. [Google Scholar] [CrossRef]
  9. Sharda, S.; Sharma, K.; Singh, M. A real-time automated scheduling algorithm with PV integration for smart home prosumers. J. Build. Eng. 2021, 44, 102828. [Google Scholar] [CrossRef]
  10. Falope, T.; Lao, L.; Hanak, D.; Huo, D. Hybrid energy system integration and management for solar energy: A review. Energy Convers. Manag. X 2024, 21, 100527. [Google Scholar] [CrossRef]
  11. Institute of Electrical and Electronics Engineers. 2019 IEEE Canadian Conference of Electrical and Computer Engineering (CCECE); IEEE: Edmonton, AB, Canada, 2019. [Google Scholar]
  12. Wang, W.; Guo, Y.; Yang, D.; Zhang, Z.; Kleissl, J.; van der Meer, D.; Yang, G.; Hong, T.; Liu, B.; Huang, N.; et al. Economics of physics-based solar forecasting in power system day-ahead scheduling. Renew. Sustain. Energy Rev. 2024, 199, 114448. [Google Scholar] [CrossRef]
  13. Ullah, Z.; Qazi, H.S.; Rehman, A.U.; Hasanien, H.M.; Wang, S.; Elkadeem, M.R.; Badshah, F. Efficient energy management of domestic loads with electric vehicles by optimal scheduling of solar-powered battery energy storage system. Electr. Power Syst. Res. 2024, 234, 110570. [Google Scholar] [CrossRef]
  14. Raj, R.P.; Kowli, A. Handling forecast uncertainty and variability in solar generation to mitigate schedule deviation penalties. Sol. Energy 2024, 271, 112401. [Google Scholar] [CrossRef]
  15. Basu, M.; Das, S. Short-term pumped storage hydrothermal generation scheduling considering uncertainty of load demand and renewable energy sources. J. Energy Storage 2023, 70, 107933. [Google Scholar] [CrossRef]
  16. Almutairi, A.; Albagami, N.; Almesned, S.; Alrumayh, O.; Malik, H. A novel optimal framework for scheduling rooftop solar home appliances considering electricity, real pricing and user comfort. Sol. Energy 2023, 262, 111876. [Google Scholar] [CrossRef]
  17. Amjad, K.; Javeed, M.R.; Umar, M.; Khalid, M.S.; Gelani, H.E.; Dastgeer, F. ANN based optimization of price-based demand response management for solar powered nanogrids. In Proceedings of the Proceedings—2020 23rd IEEE International Multi-Topic Conference, INMIC 2020, Bahawalpur, Pakistan, 5–7 November 2020; Institute of Electrical and Electronics Engineers Inc.: Piscataway, NJ, USA, 2020. [Google Scholar] [CrossRef]
  18. Pourramezan, A.; Samadi, M. The Role of Demand Response to Improve Reliability in the Long-Term Incorporating High Penetration of Solar Photovoltaic. In Proceedings of the 2021 11th Smart Grid Conference, SGC 2021, Tabriz, Iran, 7–9 December 2021; Institute of Electrical and Electronics Engineers Inc.: Piscataway, NJ, USA, 2021. [Google Scholar] [CrossRef]
  19. Fang, Q.; Liang, N.; Liu, Z.; Miao, M. Optimization Scheduling of Virtual Power Plant with Concentrated Solar Power Plant Considering Carbon Trading and Demand Response. In Proceedings of the 2023 IEEE International Conference on Power Science and Technology, ICPST 2023, Kunming, China, 5–7 May 2023; Institute of Electrical and Electronics Engineers Inc.: Piscataway, NJ, USA, 2023; pp. 717–722. [Google Scholar] [CrossRef]
  20. Sulaiman, M.H.; Mustaffa, Z. Forecasting Solar Power Generation Using Evolutionary Mating Algorithm-Deep Neural Networks. Energy AI 2024, 16, 100371. [Google Scholar] [CrossRef]
  21. Chen, X.; Tao, S.; Sun, Y.; Wang, H.; Wang, Y.; Xing, J.; Liu, Z.; Xiang, H.; Liu, Y. Research on optimal scheduling method of solar assisted heat pump drying system based on demand response. Appl. Therm. Eng. 2024, 243, 122414. [Google Scholar] [CrossRef]
  22. Zhao, Z.; Wang, C.; Wang, B. Adaptive model predictive control of a heat pump-assisted solar water heating system. Energy Build 2023, 300, 113682. [Google Scholar] [CrossRef]
  23. Han, X.; Zhou, Y.; Wang, D.; Zhang, Y.; Si, L. Dynamic modeling and response characteristics of a solar-driven fuel cell hybrid system based on supercritical CO2 Brayton cycle. Appl. Therm. Eng. 2024, 252, 123558. [Google Scholar] [CrossRef]
  24. Tahir, M.F.; Yousaf, M.Z.; Tzes, A.; El Moursi, M.S.; El-Fouly, T.H.M. Enhanced solar photovoltaic power prediction using diverse machine learning algorithms with hyperparameter optimization. Renew. Sustain. Energy Rev. 2024, 200, 114581. [Google Scholar] [CrossRef]
  25. Fan, G.; Peng, C.; Wang, X.; Wu, P.; Yang, Y.; Sun, H. Optimal scheduling of integrated energy system considering renewable energy uncertainties based on distributionally robust adaptive MPC. Renew. Energy 2024, 226, 120457. [Google Scholar] [CrossRef]
Figure 1. System schematic.
Energies 17 03212 g001
Figure 2. Correlation between solar module temperature and surrounding temperature; (a) shows the correlation between solar module temperature and surrounding temperature in plant 1; (b) shows the correlation between solar module temperature and surrounding temperature in plant 2.
Energies 17 03212 g002
Figure 3. Correlation between solar module temperature and irradiation; (a) shows the correlation between solar module temperature and irradiation in plant 1; (b) shows the correlation between solar module temperature and irradiation in Plant 2.
Energies 17 03212 g003
Figure 4. Efficiency of DC to AC conversion in Plant 1.
Energies 17 03212 g004
Figure 5. Efficiency of DC to AC conversion in Plant 2.
Energies 17 03212 g005
Figure 6. DC to AC conversion ratio in Plant 1: (a) shows the daily yield of the entire period; (b) shows the relationship between the DC and AC power at a particular point in time.
Energies 17 03212 g006
Figure 7. DC to AC conversion ratio in Plant 2: (a) shows the daily yield of the entire period; (b) shows the relationship between the DC and AC power at a particular point in time.
Energies 17 03212 g007
Figure 8. DC power for each of the different days in Plant 1.
Energies 17 03212 g008
Figure 9. Daily yield for each of the different days in Plant 1.
Energies 17 03212 g009
Figure 10. DC power for each of the different days in Plant 2.
Energies 17 03212 g010
Figure 11. Daily yield for each of the different days in Plant 2.
Energies 17 03212 g011
Table 1. Power and yield statistics in Plant 1.
DC Power (kW)AC Power (kW)Daily Yield (kWh)Total Yield (kWh/day)
Mean3147.426211307.8027523295.9687376.978712 × 106
Table 2. Power and yield statistics in Plant 2.
DC Power (kW)AC Power (kW)Daily Yield (kWh)Total Yield (kWh/day)
Mean246.701961241.2778253294.8902956.589448 × 108
Disclaimer/Publisher’s Note: The statements, opinions and data contained in all publications are solely those of the individual author(s) and contributor(s) and not of MDPI and/or the editor(s). MDPI and/or the editor(s) disclaim responsibility for any injury to people or property resulting from any ideas, methods, instructions or products referred to in the content.

