Article

Can Economic, Geopolitical and Energy Uncertainty Indices Predict Bitcoin Energy Consumption? New Evidence from a Machine Learning Approach

1
Laboratoire de Recherche en Economie et Finance Appliquées, Carthage High Commercial Studies Institute, University of Carthage, Carthage 2085, Tunisia
2
Management Information Systems Department, Applied College, University of Ha’il, Hail City P.O. Box 2440, Saudi Arabia
3
Department of Computer Science, Applied College, University of Ha’il, Hail City P.O. Box 2440, Saudi Arabia
4
Economic Development Laboratory, University of Sfax, Route de l’Aéroport Km 0.5 BP 1169, Sfax 3029, Tunisia
*
Author to whom correspondence should be addressed.
Energies 2024, 17(13), 3245; https://doi.org/10.3390/en17133245
Submission received: 10 May 2024 / Revised: 15 June 2024 / Accepted: 27 June 2024 / Published: 2 July 2024
(This article belongs to the Special Issue Energy Efficiency and Economic Uncertainty in Energy Market)

Abstract

:
This paper explores the predictive power of economic and energy policy uncertainty indices and geopolitical risks for bitcoin’s energy consumption. Three machine learning tools, SVR (scikit-learn 1.5.0),CatBoost 1.2.5 and XGboost 2.1.0, are used to evaluate the complex relationship between uncertainty indices and bitcoin’s energy consumption. Results reveal that the XGboost model outperforms both SVR and CatBoost in terms of accuracy and convergence. Furthermore, the feature importance analysis performed by the Shapley additive explanation (SHAP) method indicates that all uncertainty indices exhibit a significant capacity to predict bitcoin’s future energy consumption. Moreover, SHAP values suggest that economic policy uncertainty captures valuable predictive information from the energy uncertainty indices and geopolitical risks that affect bitcoin’s energy consumption.

1. Introduction

The cryptocurrency market, or crypto-active, has grown enormously in recent years. Today, there are more than two thousand cryptocurrencies, with a total capitalization approaching 841 billion as of January 2024. Bitcoin alone accounts for more than 50% of the overall capitalization of cryptocurrencies. Since its creation in 2008 by Satoshi Nakamoto, its value has not stopped increasing, approaching USD 65,000 in November 2021 to then plummet in the space of a few months to around USD 36,270 in January 2022. The volatility of bitcoin’s value is at least as much talked about as its energy consumption. However, the mining process, also called proof-of-work, requires significant energy consumption since it is a race for the one who will calculate the fastest. In practice, a block is validated every 10 min. The more people try to validate transactions, the more difficult the validation process becomes, and the greater the energy consumed. If we also take into account the geographic location of miners, most of whom are in countries with high levels of carbonaceous energy mixes, we can easily see that in addition to being energy-consuming, bitcoin has a very bad carbon footprint.
When compared to other digital payment systems, the bitcoin network uses a disproportionately large amount of power. This is so because the cost of bitcoin in US dollars is exactly equal to the quantity of power required to run a business. Miners are purchasing ever-more powerful computers as the price of bitcoin climbs in order to create new coins and pay transaction fees.
Frequently controversial, many experts are often critical of themselves to underline the high energy-consuming nature of bitcoin. For instance, Vranken [1] examined the relationship between bitcoin mining and electricity consumption. The author indicates that the proof-of-work scheme is compute-intensive and therefore consumes more energy. Likewise, Giungato et al. [2] and Kugler [3] show that bitcoin’s working system need greater computational power and therefore energy consumption to be mined in future. Zade et al. [4] presented a scenario model that estimates the future demand of mining power. Findings indicate that until 2025, the hardware improvements will have a limited impact on the total power demand. Küfeoğlu and Özkuran [5] studied the computational power demand during the proof-of-work scheme by using different hardware models. Their findings indicate that the energy consumption of bitcoin mining has reached unprecedented levels, with a peak demand comparable to the installed capacities of entire countries. Such consumption has been shown to have a significant impact on energy company performance, particularly during periods of high bitcoin price volatility (Corbet et al. [6] and Huynh et al. [7]). Bejan et al. [8] supports this hypothesis by establishing a strong correlation between the evolution of the bitcoin price and energy consumption, suggesting that the latter can influence the former. Likewise, by using the quantile and Markov regime switching regression, Das and Dutta [9] investigate the impact of bitcoin mining revenue on bitcoin energy consumption. Results show that the low and volatile mining revenue of bitcoin negatively impacts bitcoin energy consumption.
The mining process is often driven by the growing demand for bitcoin. However, bitcoin’s appeal lies in its autonomy and resilience, since it is not controlled by any monetary authority. This is attractive to those seeking financial sovereignty outside traditional banking systems. Furthermore, bitcoin’s scarcity is a major factor in its appeal, with supply capped at 21 million coins. This combination of scarcity and growing demand has the potential to drive up the price. Indeed, there are a range of drivers that determine the price of bitcoin. Goczek and Skliarov [10] highlight popularity as a key factor, while Kristoufek [11] goes on to say that the bitcoin price is influenced by a combination of fundamental, speculative and technical factors, with the Chinese market potentially playing an important role. Ciaian et al. [12] back up these findings, pointing to the impact of market forces and bitcoin’s appeal to investors and users alike.
Furthermore, investigation into the relationship between bitcoin price and trading volume has yielded some key findings. Gemici and Polat [13] and El Alaoui et al. [14] found evidence for a causal and cointegrated relationship between bitcoin price and volume. El Alaoui et al. [14] also highlighted the occurrence of multifractality and nonlinearity in this relationship. Jain et al. [15] further enhanced this by demonstrating the importance of common factors in bitcoin trading, including the influence of trading patterns on volume. Furthermore, Alexander and Heck [16] emphasized the role of high-frequency trading and futures markets in bitcoin price formation, particularly during periods of high trading volumes. However, by examining the relationship between bitcoin’s energy consumption and its market performance, Li et al. [17] found that bitcoin’s energy consumption is related to its returns and trading volumes in the long run.
In the same vein, several studies systematically show a positive relationship between bitcoin trading volume and energy consumption (Schinckus et al. [18]; Huynh et al. [7]). This is due to the resource-intensive mining process, which requires high computing power and significantly increases energy consumption (Mishra et al. [19]). Increased cryptocurrency transactions have led to a substantial rise in electricity consumption, with total carbon output likely to exceed that of every developed country (Corbet et al. [20]).
In addition to this, [21], for example, employed multivariate and partial wave methods to reveal the predictability of uncertainty indicators for bitcoin prices. Their results lay the foundation for further research by highlighting the complex links between uncertainty and cryptocurrency markets. Furthermore, the impact of trading volume on bitcoin’s energy use and carbon footprint has been examined by the authors of [22]. Their study highlighted the sustainability concerns of cryptocurrency mining by examining the relationships between transaction activity, energy use and environmental impact. In a similar research, the authors of [23] investigate how bitcoin prices are asymmetrically impacted by the price of energy and uncertainty about climate policy. Their study emphasizes the complex interactions that exist between policy uncertainty, environmental variables and cryptocurrency markets, showing the need for comprehensive analyses to fully understand these complex linkages.
According to the studies cited above, bitcoin’s price is a determining factor in its transaction volume. However, as bitcoin’s transaction volume increases, so does its energy consumption through the energy-intensive mining process. Moreover, while bitcoin is attractive to investors because of its independence and scarcity, it is also a safe haven in times of economic crises. Debate over whether bitcoin can be considered a safe-haven asset is ongoing. Kang et al. [24] argue that bitcoin can serve as a safe haven by mitigating downside risks and reinforcing diversification benefits. Smales [25] argues that bitcoin is not a viable safe-haven asset due to its volatility, illiquidity and high transaction costs. However, Umar et al. [26] suggests that bitcoin exhibits safe-haven properties during periods of uncertainty, although this relationship may change over time. Likewise, Kalyvas et al. [27] suggest that economic uncertainty and behavioral factors also play a role.
Investigations into the relationship between uncertainty and bitcoin trading volume have produced mixed results. Wüstenfeld and Geldner [28] noted that local and global economic shocks can have an impact on bitcoin trading, with the cryptocurrency potentially serving as a hedge or safe-haven asset. However, Chen et al. [29] hinted that fear sentiment, particularly during the COVID-19 pandemic, can exacerbate market volatility and lead to negative bitcoin returns. Panagiotidis et al. [30] emphasized the significant interaction between bitcoin and traditional stock markets, as well as the declining impact of Asian markets on bitcoin trading volume. Particularly, some studies have demonstrated that economic policy uncertainty (EPU) can significantly impact the cryptocurrency market, with China’s EPU index being a notably strong predictor of bitcoin returns Cheng and Yen [31]. This association is also supported by the finding that changes in China’s EPU index are negatively linked to the future volatility of bitcoin and Litecoin Yen and Cheng [32]. The EPU’s impact on the cryptocurrency market was also obvious during the COVID-19 pandemic, with the EPU index serving as a powerful predictor of bitcoin returns and volatility Kyriazis [33]. Furthermore, the dynamic links between the EPU, energy and sustainable cryptocurrencies have been explored, disclosing that energy cryptocurrencies are more likely to receive volatility spillovers during periods of turbulence Haq et al. [34]. Furthermore, the link between the EPU and bitcoin energy usage was investigated by the authors of [35], providing insights into how changes in the uncertainty of economic policy may affect the energy-intensive mining operations associated with bitcoin.
However, investigation into the impact of geopolitical risk on the cryptocurrency market has produced mixed results. Colon et al. [36] suggest that the market can serve as a hedge against geopolitical risks, but not against economic policy uncertainty. Mamun (2020) and Kyriazis [33] both point to the significant impact of geopolitical risk and economic policy uncertainty on bitcoin’s structure, volatility and risk premium, especially when economic circumstances are adverse. Shaikh [37] additionally emphasizes the negative effect of political uncertainty, especially in the US, China and Japan, on bitcoin returns. Additionally, ref. [38] highlighted the intricate interactions between these variables by using a causality test to study the effect of economic and geopolitical uncertainty on bitcoin energy usage. The results showed a significant impact of geopolitical risk and global economic policy uncertainty on bitcoin energy consumption. Additionally, ref. [35] conducted a wavelet coherence analysis to explore the connection between geopolitical risk and bitcoin’s energy consumption, providing a deeper understanding of the underlying mechanisms driving energy consumption dynamics. All these studies suggest that while the cryptocurrency market can act as a hedge against certain types of uncertainty, it is not immune to the effects of geopolitical risk.
Using cutting-edge approaches and filling up important gaps in the literature, this work contributes in two ways. Firstly, this analysis is the first that we are aware of that looks at how geopolitical, energy policy and economic uncertainty all work together to affect bitcoin’s energy usage. Our research integrates these three variables to give a comprehensive understanding of their combined influence on bitcoin’s energy dynamics, whereas previous research frequently focuses on separate factors, such as financial implications or energy concerns. We want to obtain a deeper understanding of how the energy-intensive processes involved in bitcoin mining are influenced by larger economic and geopolitical contexts by examining the interactions between these variables. This method gives policymakers and industry stakeholders useful implications for managing the sustainability difficulties posed by cryptocurrencies, in addition to enhancing academic conversation. Second, our research uses effective machine learning approaches to forecast bitcoin energy use, in contrast to typical empirical studies that depend on traditional regression methods. We specifically use the Extreme Gradient Boosting (XGBoost), CatBoost, and Support Vector Machine Regression (SVR) models. These machine learning algorithms are selected because, in comparison to conventional statistical methods, they enhance forecast accuracy and can identify complex, nonlinear relationships within data. By utilizing these models, we can improve the accuracy of our energy consumption predictions and offer useful instruments for comprehending and controlling the environmental effects of bitcoin mining activities. The models’ comparison analysis adds value to the technique by demonstrating how well each model predicts changes in energy consumption under different geopolitical and economic circumstances. Overall, by investigating new aspects of uncertainty’s influence on bitcoin energy usage, our work not only increases theoretical understanding but also pushes methodological limits by utilizing cutting-edge machine learning approaches. Our goal is to produce useful results that guide sustainable practices and policy choices in the bitcoin industry by fusing theoretical insights with extensive data analytics. This dual contribution emphasizes the study’s importance in furthering both academic knowledge and practical applications in the changing world of digital currency and energy sustainability.
This paper is organized as follows. Following an introduction, Section 2 presents the data and the methodology used. The empirical results and their interpretation are presented in Section 3, followed by a conclusion in the fourth.

2. Data and Methodology

2.1. Data

In this paper, we investigate the effect of economic, geopolitical and energy uncertainty indices on bitcoin energy consumption. The study period spanned from 1 July 2010 to 1 December 2022, while the frequency of the observations performed was quarterly. All variables were normalized using the Z-Score method ( x = x x ¯ σ x ) (x represents each variable vector of the estimated model) and expressed in natural logarithm, which can reduce both the heteroscedasticity intensity and volatility excess. Furthermore, all outliers have been eliminated (Figure 1). The abovementioned variables are crucial for several key reasons. For the economic uncertainty, demand for bitcoin rises during difficult economic times because it is sometimes seen as a hedge against the volatility of traditional financial markets. Our objective is to reflect the dynamic demand dynamics of bitcoin that affects its energy consumption by adding economic uncertainty indices. An increase in demand usually results from raised mining operation activity, and thus increases energy consumption levels. The geopolitical risk index has a big impact on the cryptocurrency markets. During times of political unrest, these variables may have an impact on investor confidence and capital flows into bitcoin as investors look for alternative assets. By using geopolitical uncertainty indices, we can assess the impact of external factors on the energy use of bitcoin. Geopolitical considerations also affect energy regulations and resource access, which directly influence how mining bitcoin impacts the environment. The operational costs of bitcoin and its environmental sustainability are both affected by energy-related issues. These concerns include fluctuating prices, energy-efficient equipment updates, and the mining industry’s shift to renewable energy sources. Using energy uncertainty indices, we analyze how changes in the energy market dynamics impact the patterns of bitcoin’s energy use over time. It is essential to investigate the implications of bitcoin mining on the environment and the issues it raises for sustainable development.
Three machine learning models—XGboost, CatBoost and Support Vector Machine—were compared in this study. The distinctive features of our dataset and their special capacity are the main reasons for our study’s selection of Support Vector Machine Regression (SVR), CatBoost, and Extreme Gradient Boosting (XGBoost). SVR was chosen based on its ability to manage nonlinear interactions and high-dimensional areas well. When properly tested, SVR is resilient against excessive fitting, even if there may be a larger computation need. This makes it appropriate for our research, in which we explore complex correlations between uncertainty variables and bitcoin energy use. CatBoost offers great protection against overfitting and performs exceptionally well with categorical variables. Model performance is improved, and preparation work is reduced because of its autonomous management for missing data and classified attributes. CatBoost is well suited to capture the nuances of geopolitical fears and uncertainty in the economy, as our dataset includes categorical aspects pertinent to these topics. Our analysis of the numerous economic and geopolitical elements impacting bitcoin’s energy consumption is pertinent to this model because of its ability to maximize efficacy and handle intricate relationships. XGBoost plays a crucial role in achieving our study’s objectives because of its adaptability, consistency and acceleration. It seamlessly handles large datasets and identifies complex relationships between variables. This model’s ability to improve efficiency, manage complex interconnections and effectively and flexibly handle large datasets makes it suitable for our examination of the various economic and geopolitical factors that influence bitcoin’s energy use. Because of these factors, our dataset size is ideal for these models, considering their individual advantages and our strict model validation processes. Taken together, SVR, CatBoost and XGBoost enable us to successfully control the complexity of our study’s problem as they offer an understanding of the complex dynamics impacting bitcoin’s energy use at different uncertainty levels. The combined use of these models produces an extensive analysis which strengthens our understanding of the cryptocurrency market’s behavior in relation to greater economic trends and geopolitical events.
A total of 80% of the dataset was designated as the training dataset and the remaining 20% was assigned as the test dataset, all at random. Table 1 displays the descriptive statistics, whereas Table 2 offers details on the variables and data.
Figure 2 shows a weak correlation between the economic policy uncertainty and the geopolitical risk, and virtually no correlation is seen between the other variables.

2.2. Methodology

2.2.1. Support Vector Machine Regression

The core idea behind SVR is to use nonlinear mapping to transfer the input space onto a high-dimensional feature space and then solve nonlinear problems linearly (Smola and Schölkopf [39]). The vector in input space in this study is x = (lepu, lgpui, leui1), assuming that the nonlinear model is
f ( x ) = w Ψ ( x i ) + b
Considering that all training samples can be fitted with no error using a linear function, the relaxation factor is introduced to deal with data that cannot be predicted by the function at a defined accuracy threshold. (w) and (b) can be achieved in Equation (1) by solving the following optimization problem:
minimize w , b , ξ , ξ * 1 2 w T w + C [ i = 1 ] n ( ξ i + ξ i * )
subject to
y i w T Ψ ( x i ) b ε + ξ i w T Ψ ( x i ) + b y i ε + ξ i * ξ i , ξ i * 0
where ξ i , ξ i * R are the slack variables and C is the penalty coefficient. To solve this optimization problem, the Lagrange multiplier is implemented and the regression function has the following form:
f ( x ) = [ i = 1 ] n s v ( α i α i ) k ( x i , x i ) + b
subject to
0 α i C , 0 α i C
where α i , α i is the Lagrange multiplier, n s v is the number of Support Vector, and k( x i , x i ) is the kernel function. To compute (b), the Karush–Kuhn–Tucker (KKT) criteria are employed (Kuhn and Tucker [40]; Smola et al. [41]).

2.2.2. CatBoost

CatBoost is a variation on the gradient-enhanced decision tree algorithm. It has strong capacities for dealing with complex nonlinear data (Prokhorenkova et al. [42]). This ML technique permutes the sample randomly and computes the dataset. For instance, the average value of the label in the same category is placed in the permutation ahead of the supplied one. Furthermore, it has fewer parameters and requires less training time. The following is a description of the predicted function:
h t = argmin 1 N f X k , Y k h X k 2
where h(X) is the decision tree function and f ( X k , Y k ) is the gradient’s condition distribution.
CatBoost, unlike the standard structured boosting technique, offers an alternative approach to modifying the gradient estimation system. This method will correct the prediction variation caused by gradient bias. This overcomes the problem of gradient bias-induced prediction change. It also improves the generalization of the model.

2.2.3. Extreme Gradient Boost Regression (XGboost)

XGBoost is a machine learning algorithm developed by Biecek and Burzykowski [43] that can be used for regression and classification problems. This approach has been used in a variety of fields, including energy consumption (Tissaoui et al. [44] and Zaghdoudi et al. [45]) and in the metal market (Jabeur et al. [46], Tissaoui et al. [47,48]).
The loss function’s gradient direction is utilized to build a weak learner at each step and accumulate it in the overall model. An objective function is normalized to avoid overfitting and to accelerate the learning process. This gives the following model’s output function.
Y i T ^ = [ k = 1 ] T f k ( x i ) = Y i T 1 ^ + f T ( x i )
where Y i T 1 ^ represents the generated tree, f T ( x i ) is the newly created tree model, and T is the total number of tree models. The objective function is minimized as follows:
L ( ϕ ) = i l y i , y ^ i + k Ω f k
L stands for the loss function. To avoid excessive model complexity, the penalty term Ω is included as follows:
Ω f k = γ T + 1 2 λ w 2
where γ and λ are parameters that determine the penalty for the number of leaves N and the magnitude of leaf weights w, respectively. The purpose of Ω ( f T ) is to avoid overfitting and oversimplification of the models produced by this technique.
Furthermore, Ma et al. [49] stated that the XGBoost is robust when it comes to modeling the nonlinear relationship between variables. It has a tremendous categorization ability. In line with this, many researchers indicate that machine learning (ML) is a powerful technique to forecast time series data. It does not, however, produce an inference as interpretable as that of traditional econometrics. Lundberg and Lee [50] proposed a Shapley additive explanation approach (SHAP) to interpret prediction for ML techniques based on the game theory pioneered by Shapley et al. [51] in 1953 to improve the performance of XGBoost. By computing the individual impact of each feature on the prediction, the SHAP procedure allows us to interpret the prediction of a specific input (X). SHAP’s core premise is to compute Shapley values for each characteristic of the sample to be interpreted, where each Shapley value quantifies the impact of the linked feature on the prediction. Furthermore, ML models typically involve a large number of features, each of which is a discrete or continuous variable, making the calculation of Shapley values for each instance of each feature significantly more complicated, and the SHAP method is better suited to our research problem. The following is how the estimated Shapley value is calculated:
ϕ ^ j = 1 K k = 1 K g ^ x + j m g ^ x j m
where ϕ ^ j is the prediction for x, but with a random number of feature values.

2.2.4. The Performance Metrics

Five measures are used to assess forecast performance: the root mean square error (RMSE), the mean squared error (MSE), the mean absolute error (MAE), the explained variance score (EVS) and R 2 . We use the following formulas to calculate these measures:
MSE = 1 N v t = 1 N v y t y t ^
R M S E = 1 N V t = 1 N V y t y ^ t 2
M A E = 1 N v [ t = 1 ] N v y t y t ^ E V S = 1 v a r ( y y ¯ ) v a r ( y ) R 2 = 1 i = 1 n y i y ^ i 2 i = 1 n y i y ¯ 2
where y t ^ represents the predicted bitcoin energy consumption, y t is the tth actual bitcoin energy consumption, y ¯ is the mean of bitcoin energy consumption, and N v is the number of observations used in the validation phase of prediction.

3. Empirical Findings

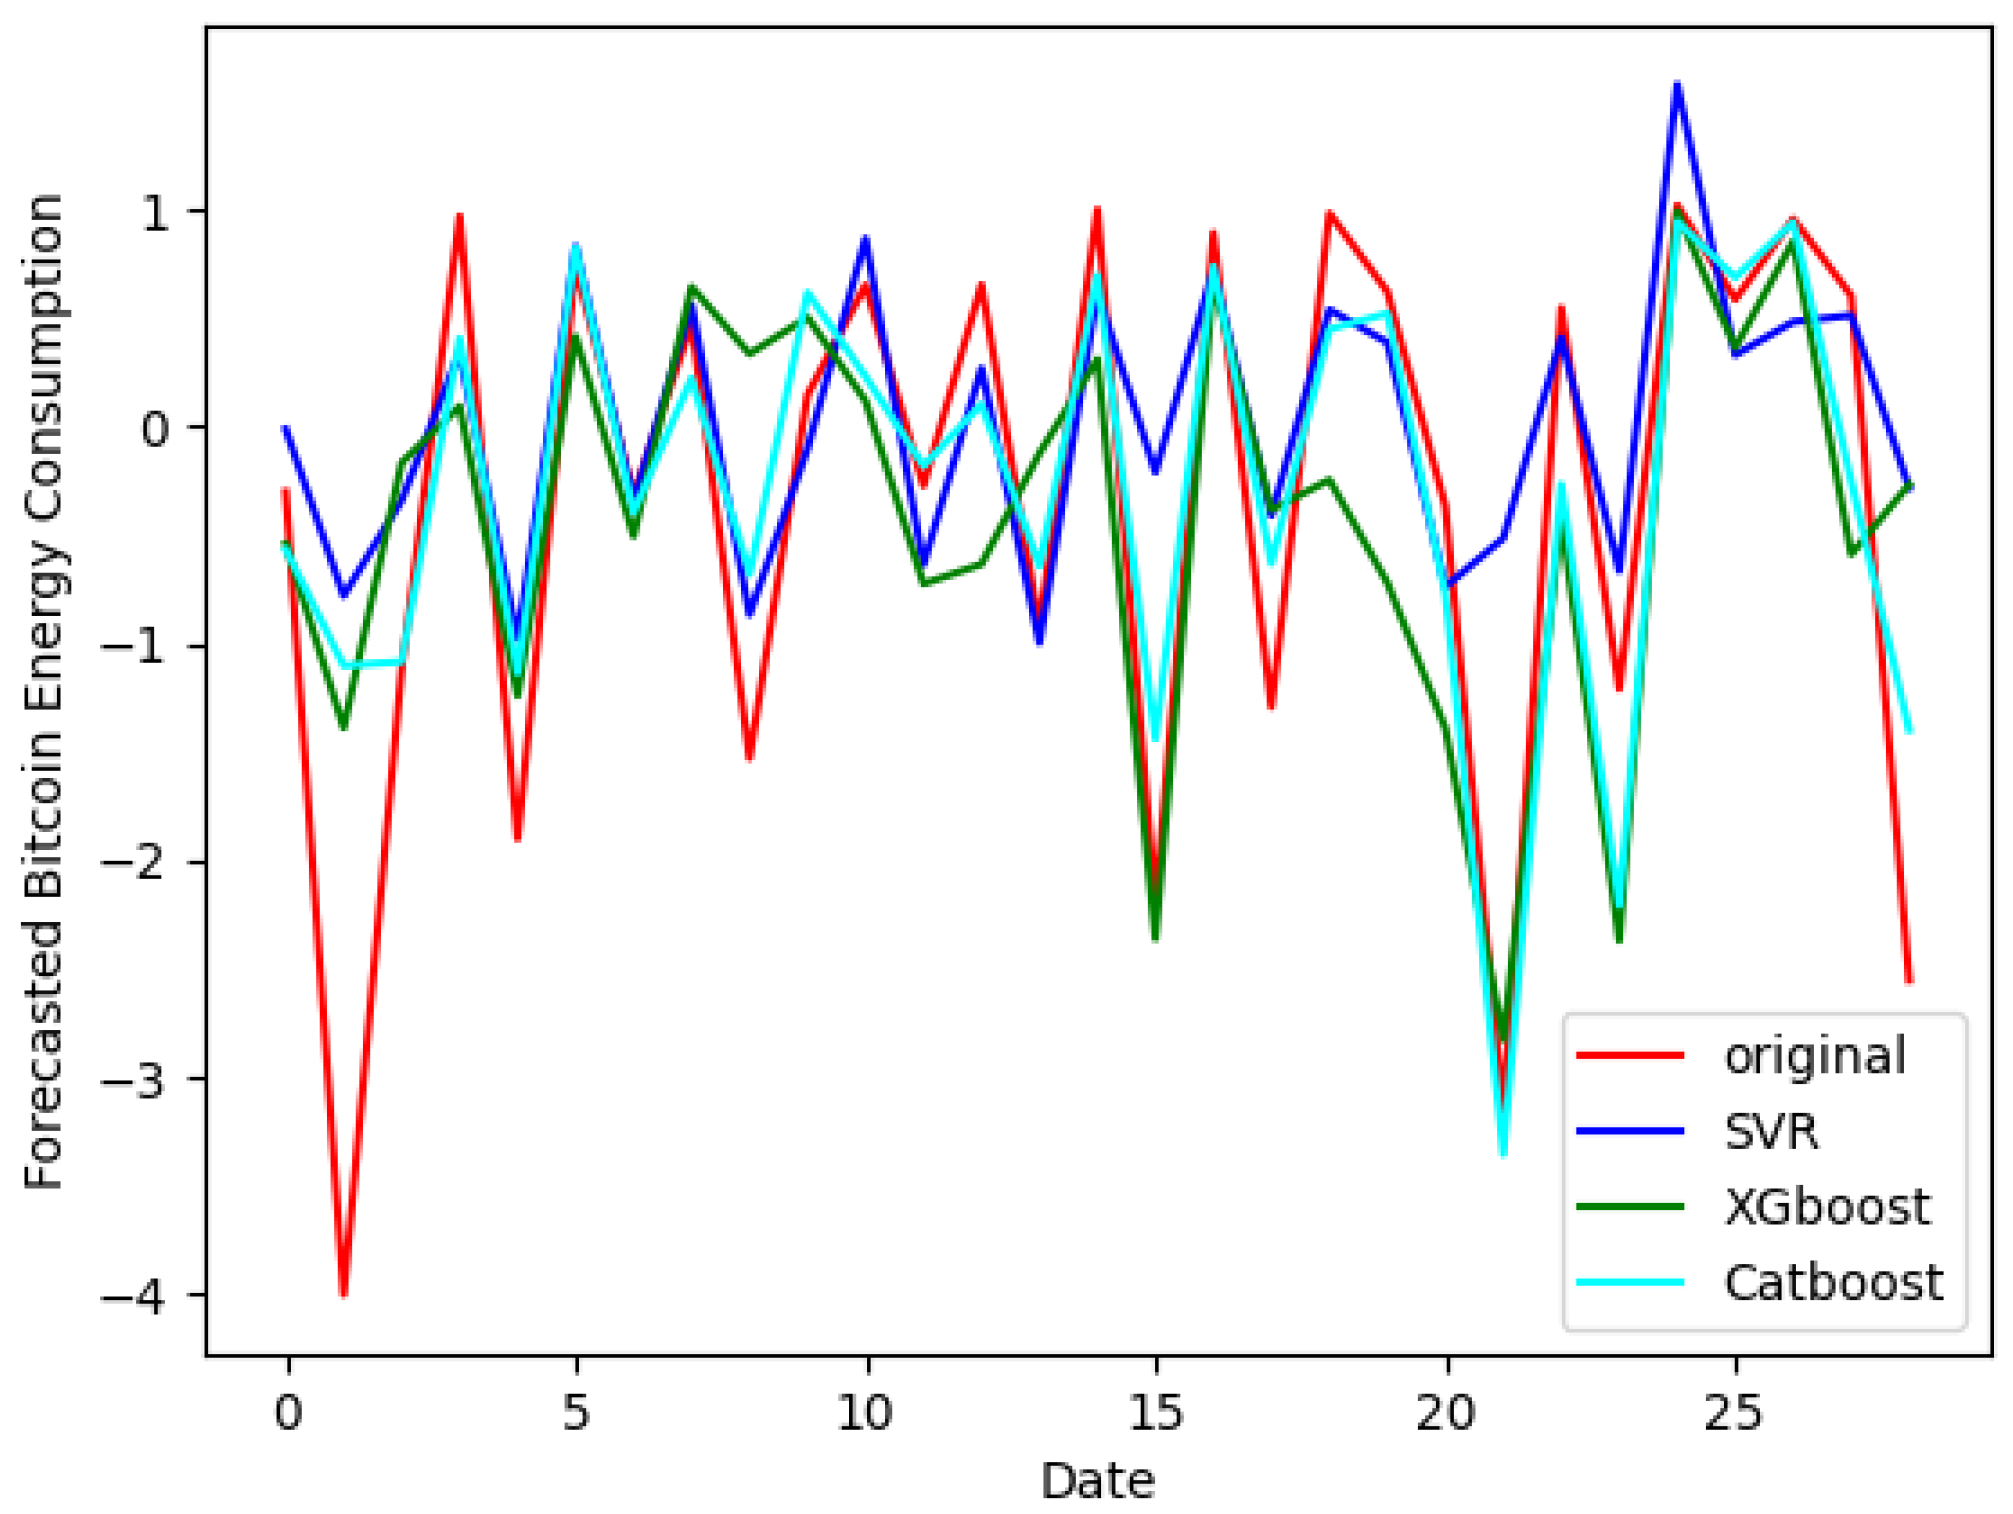
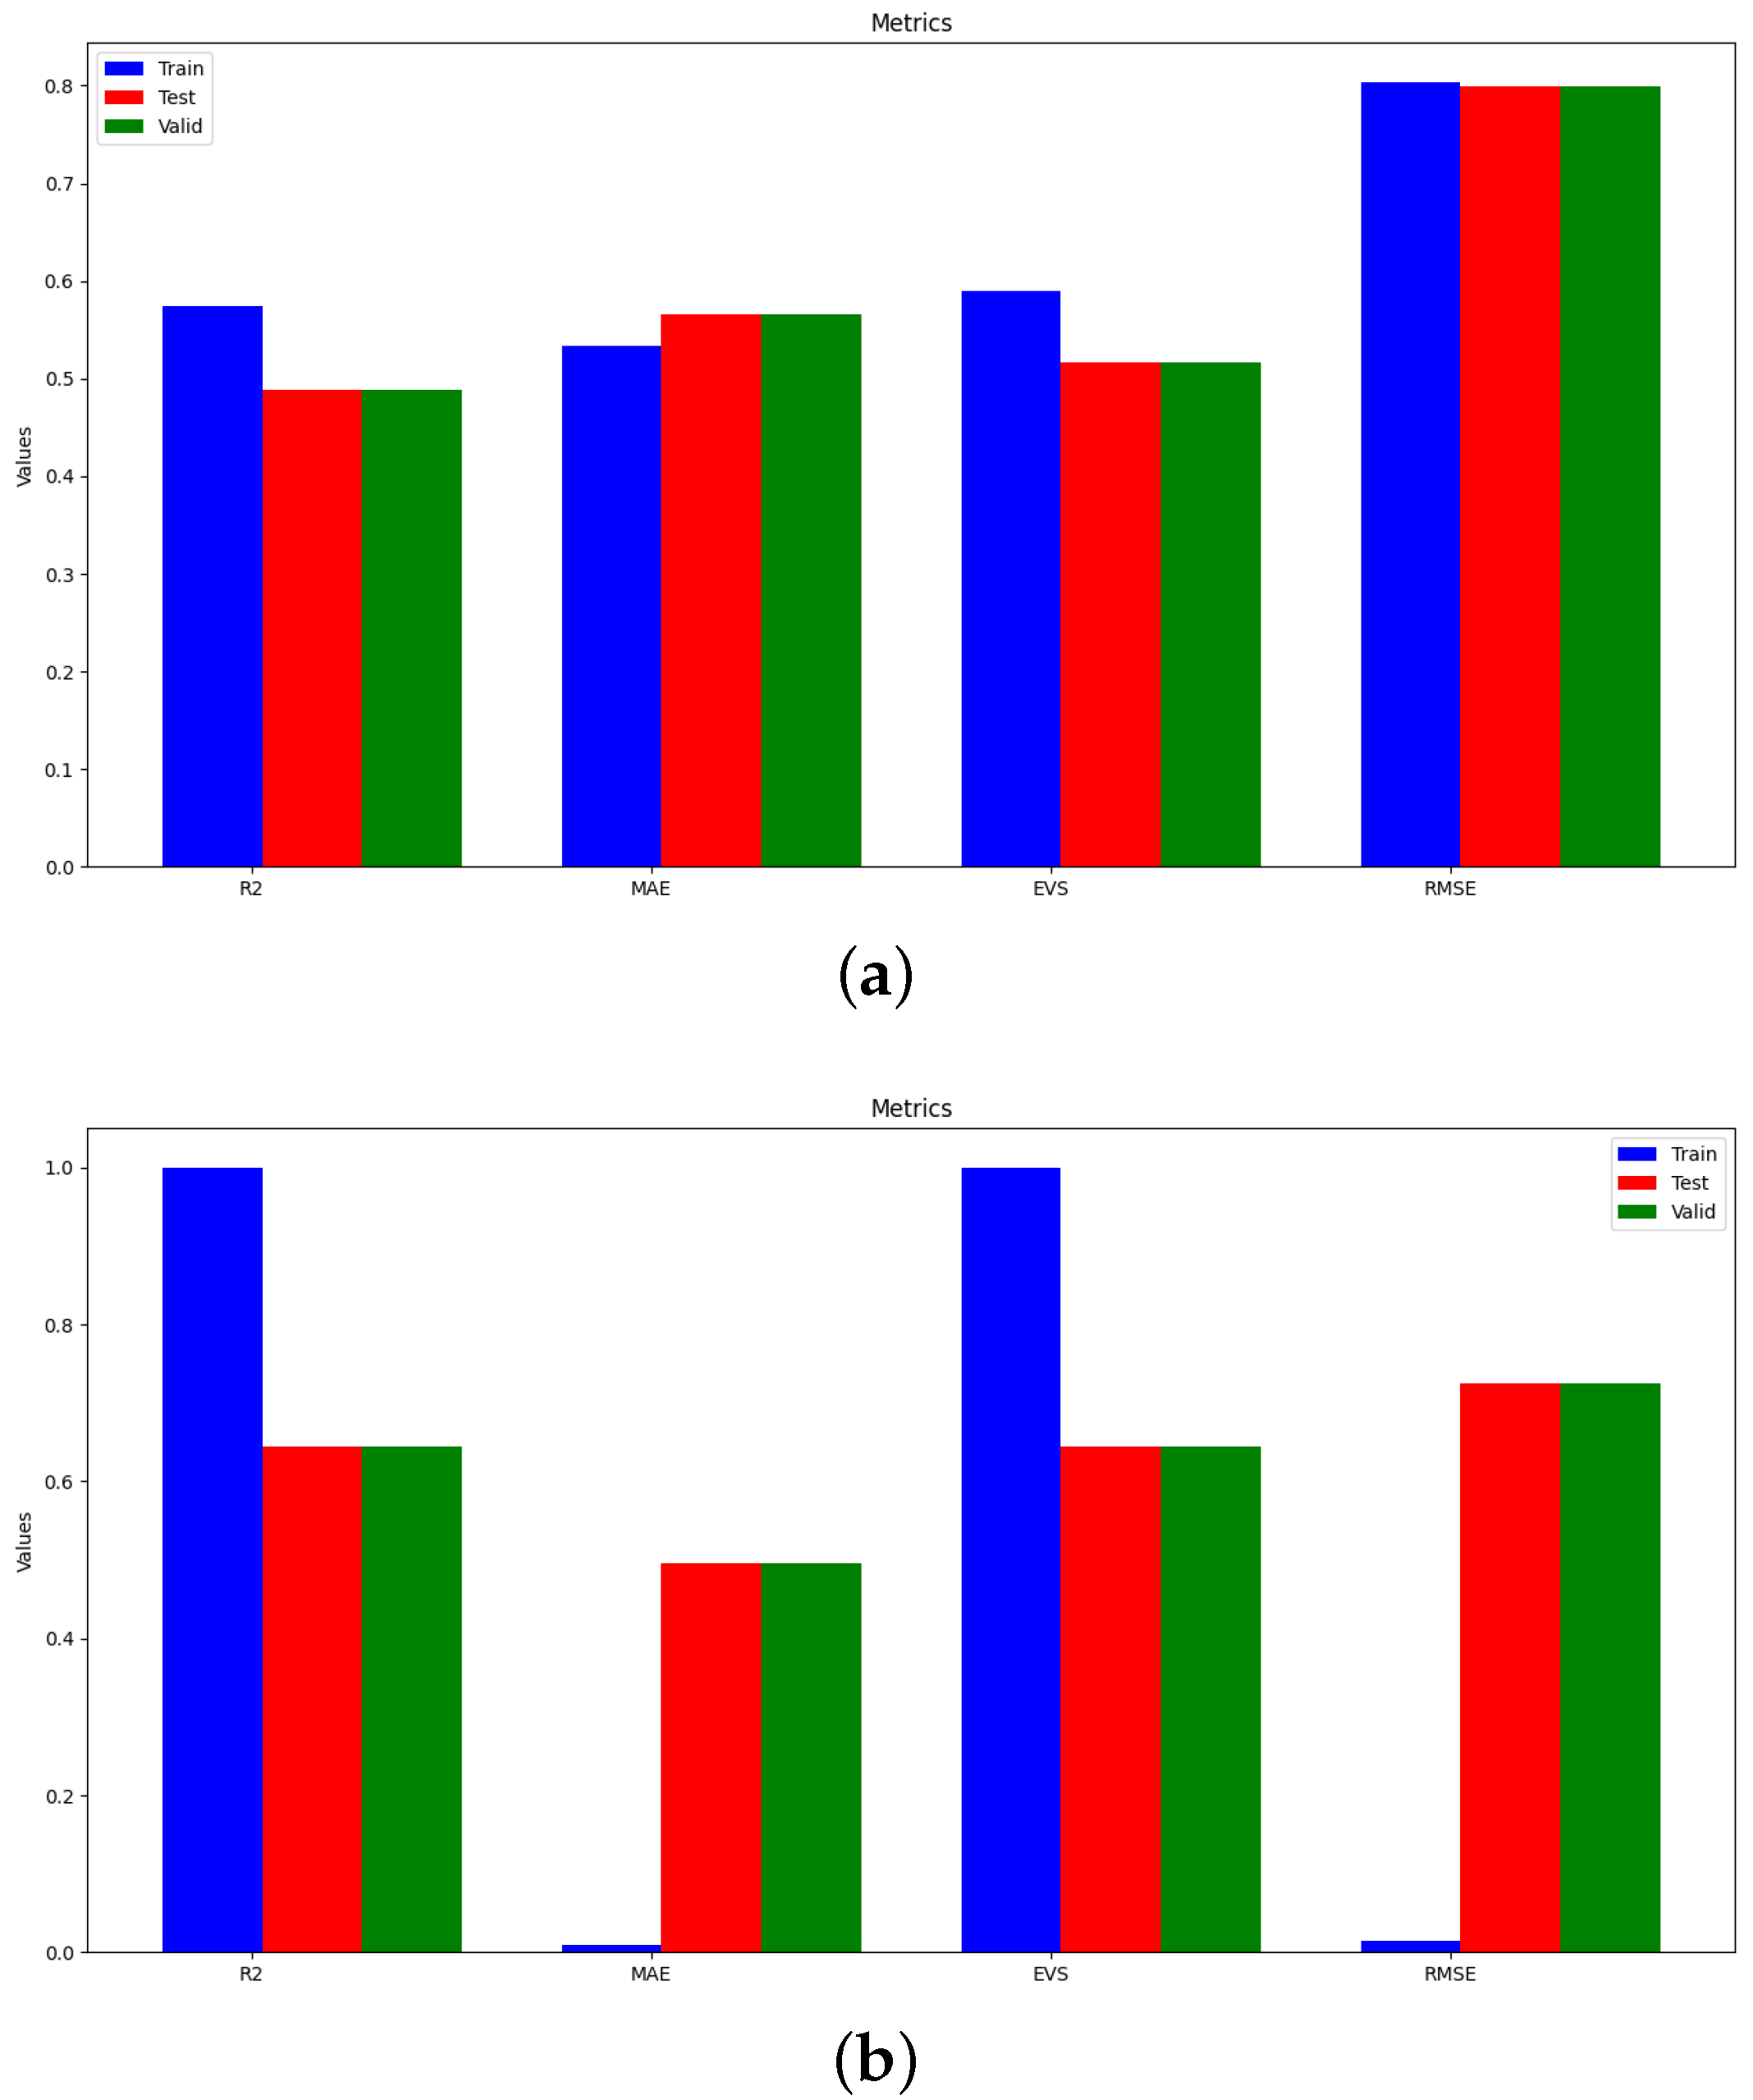
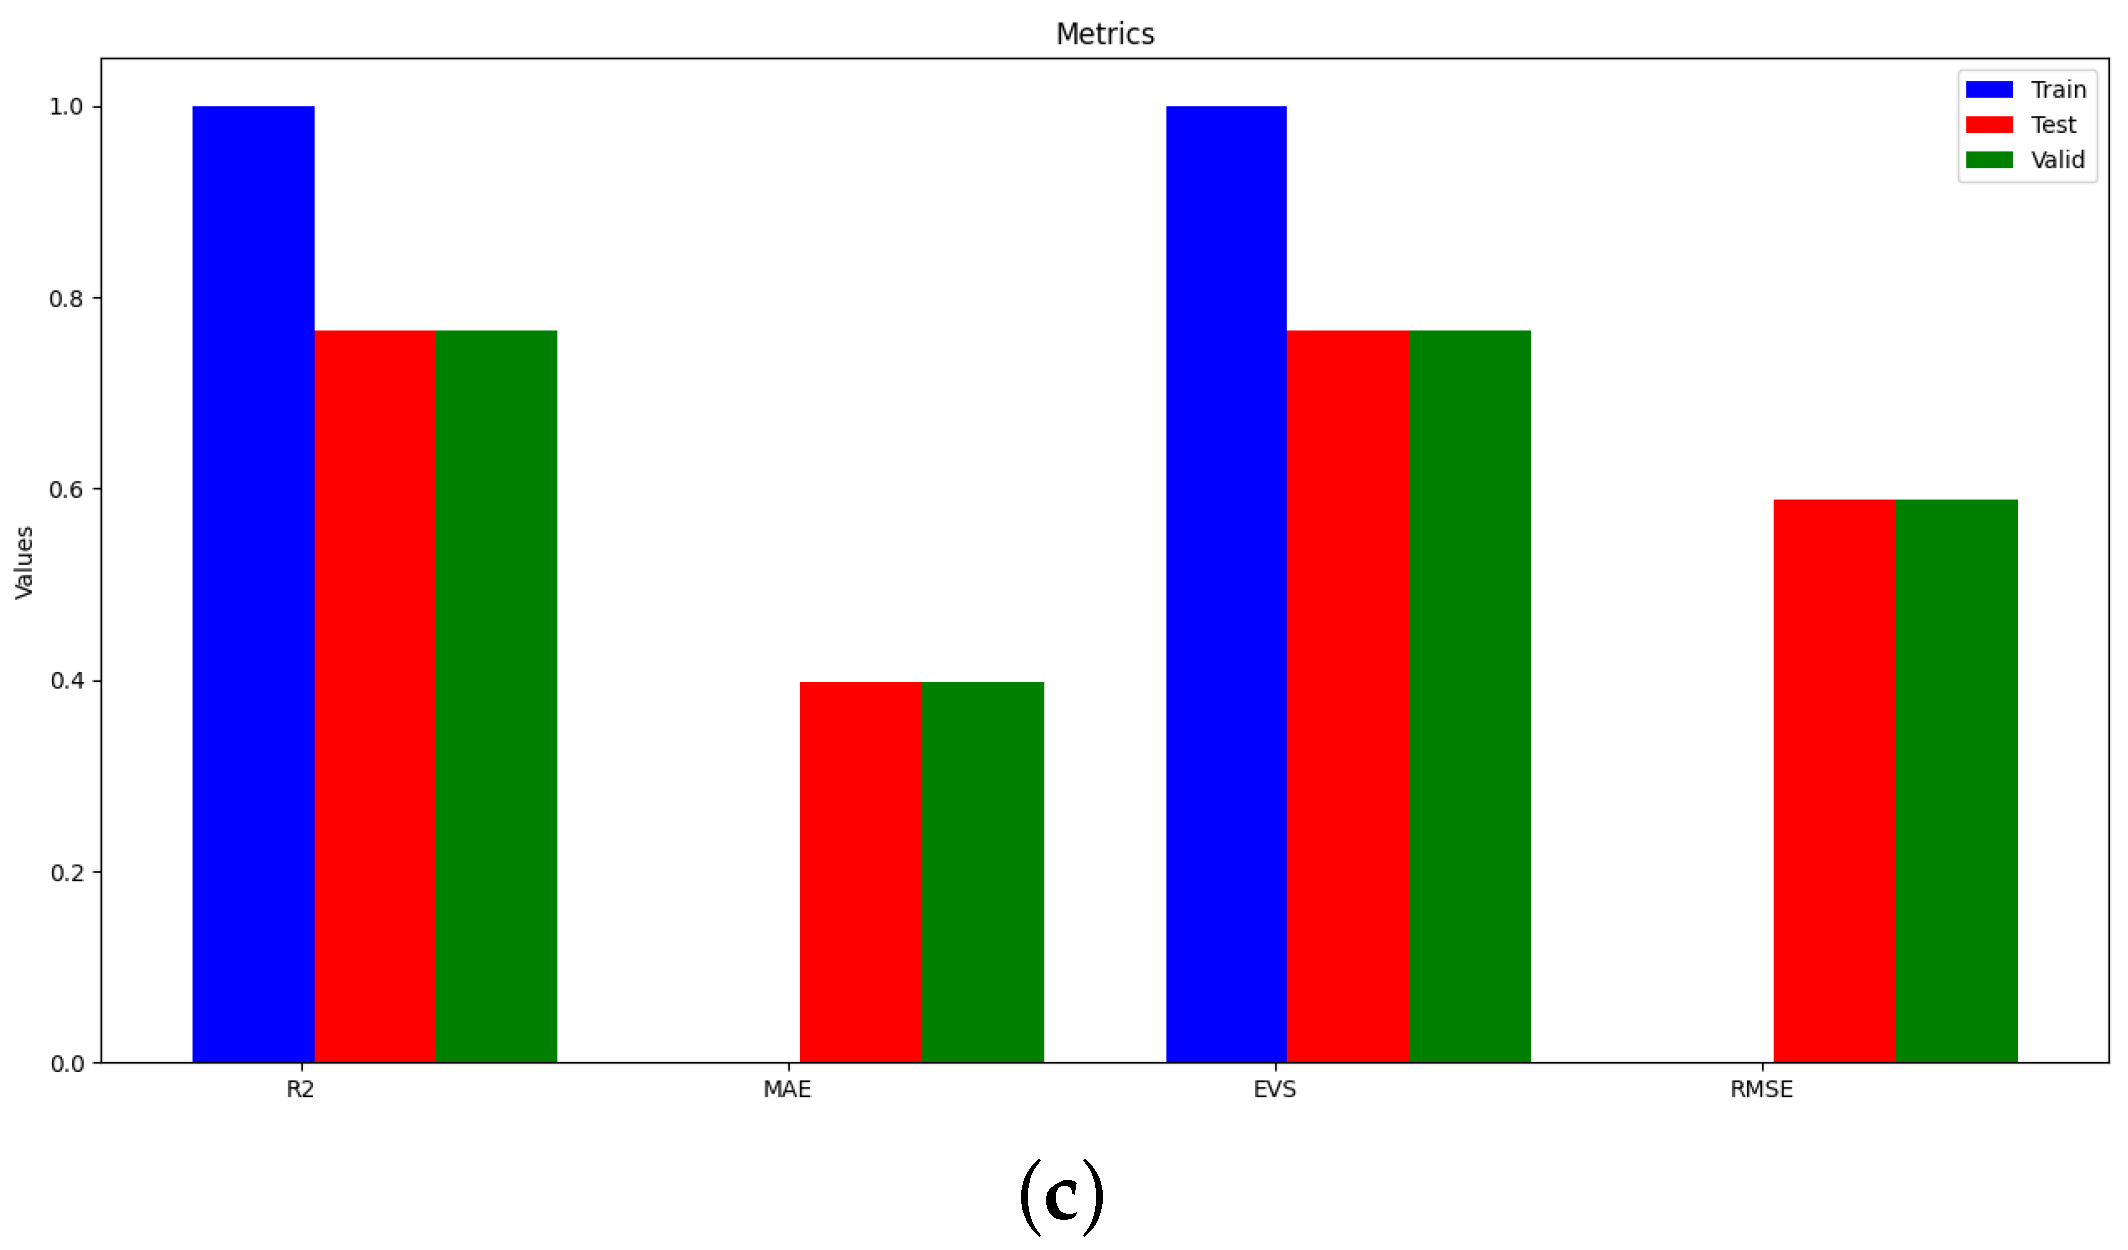
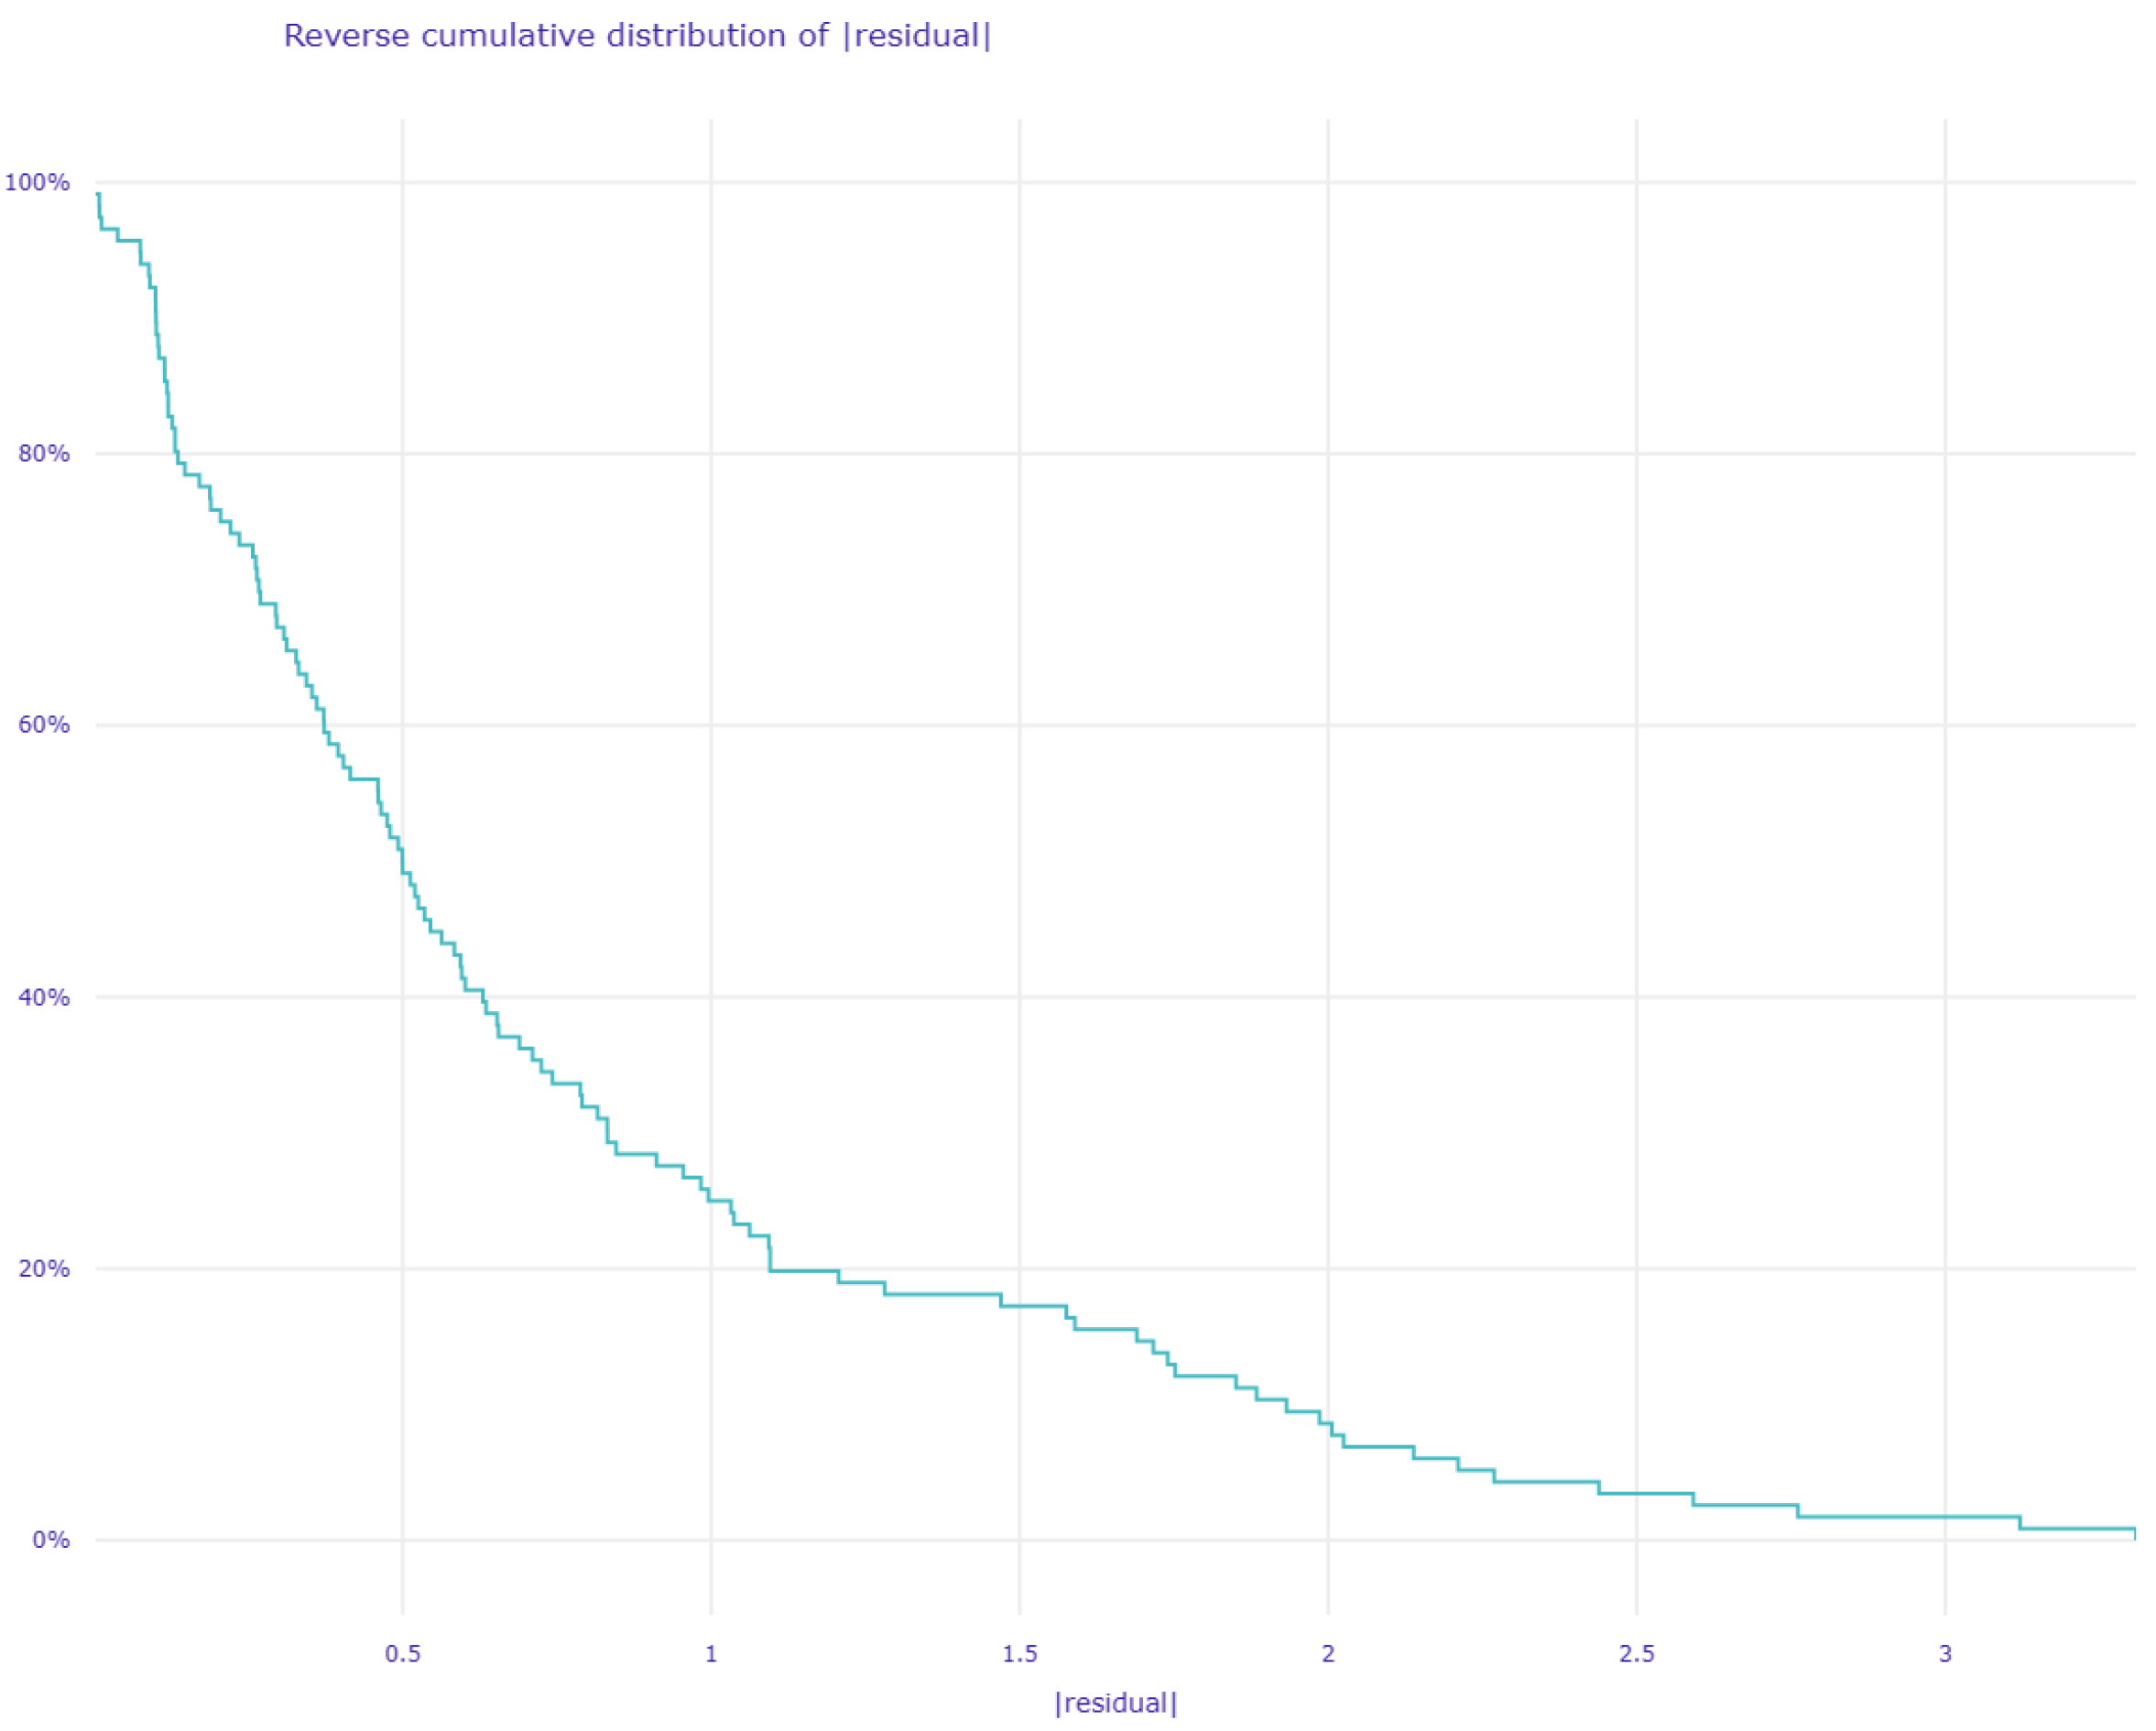
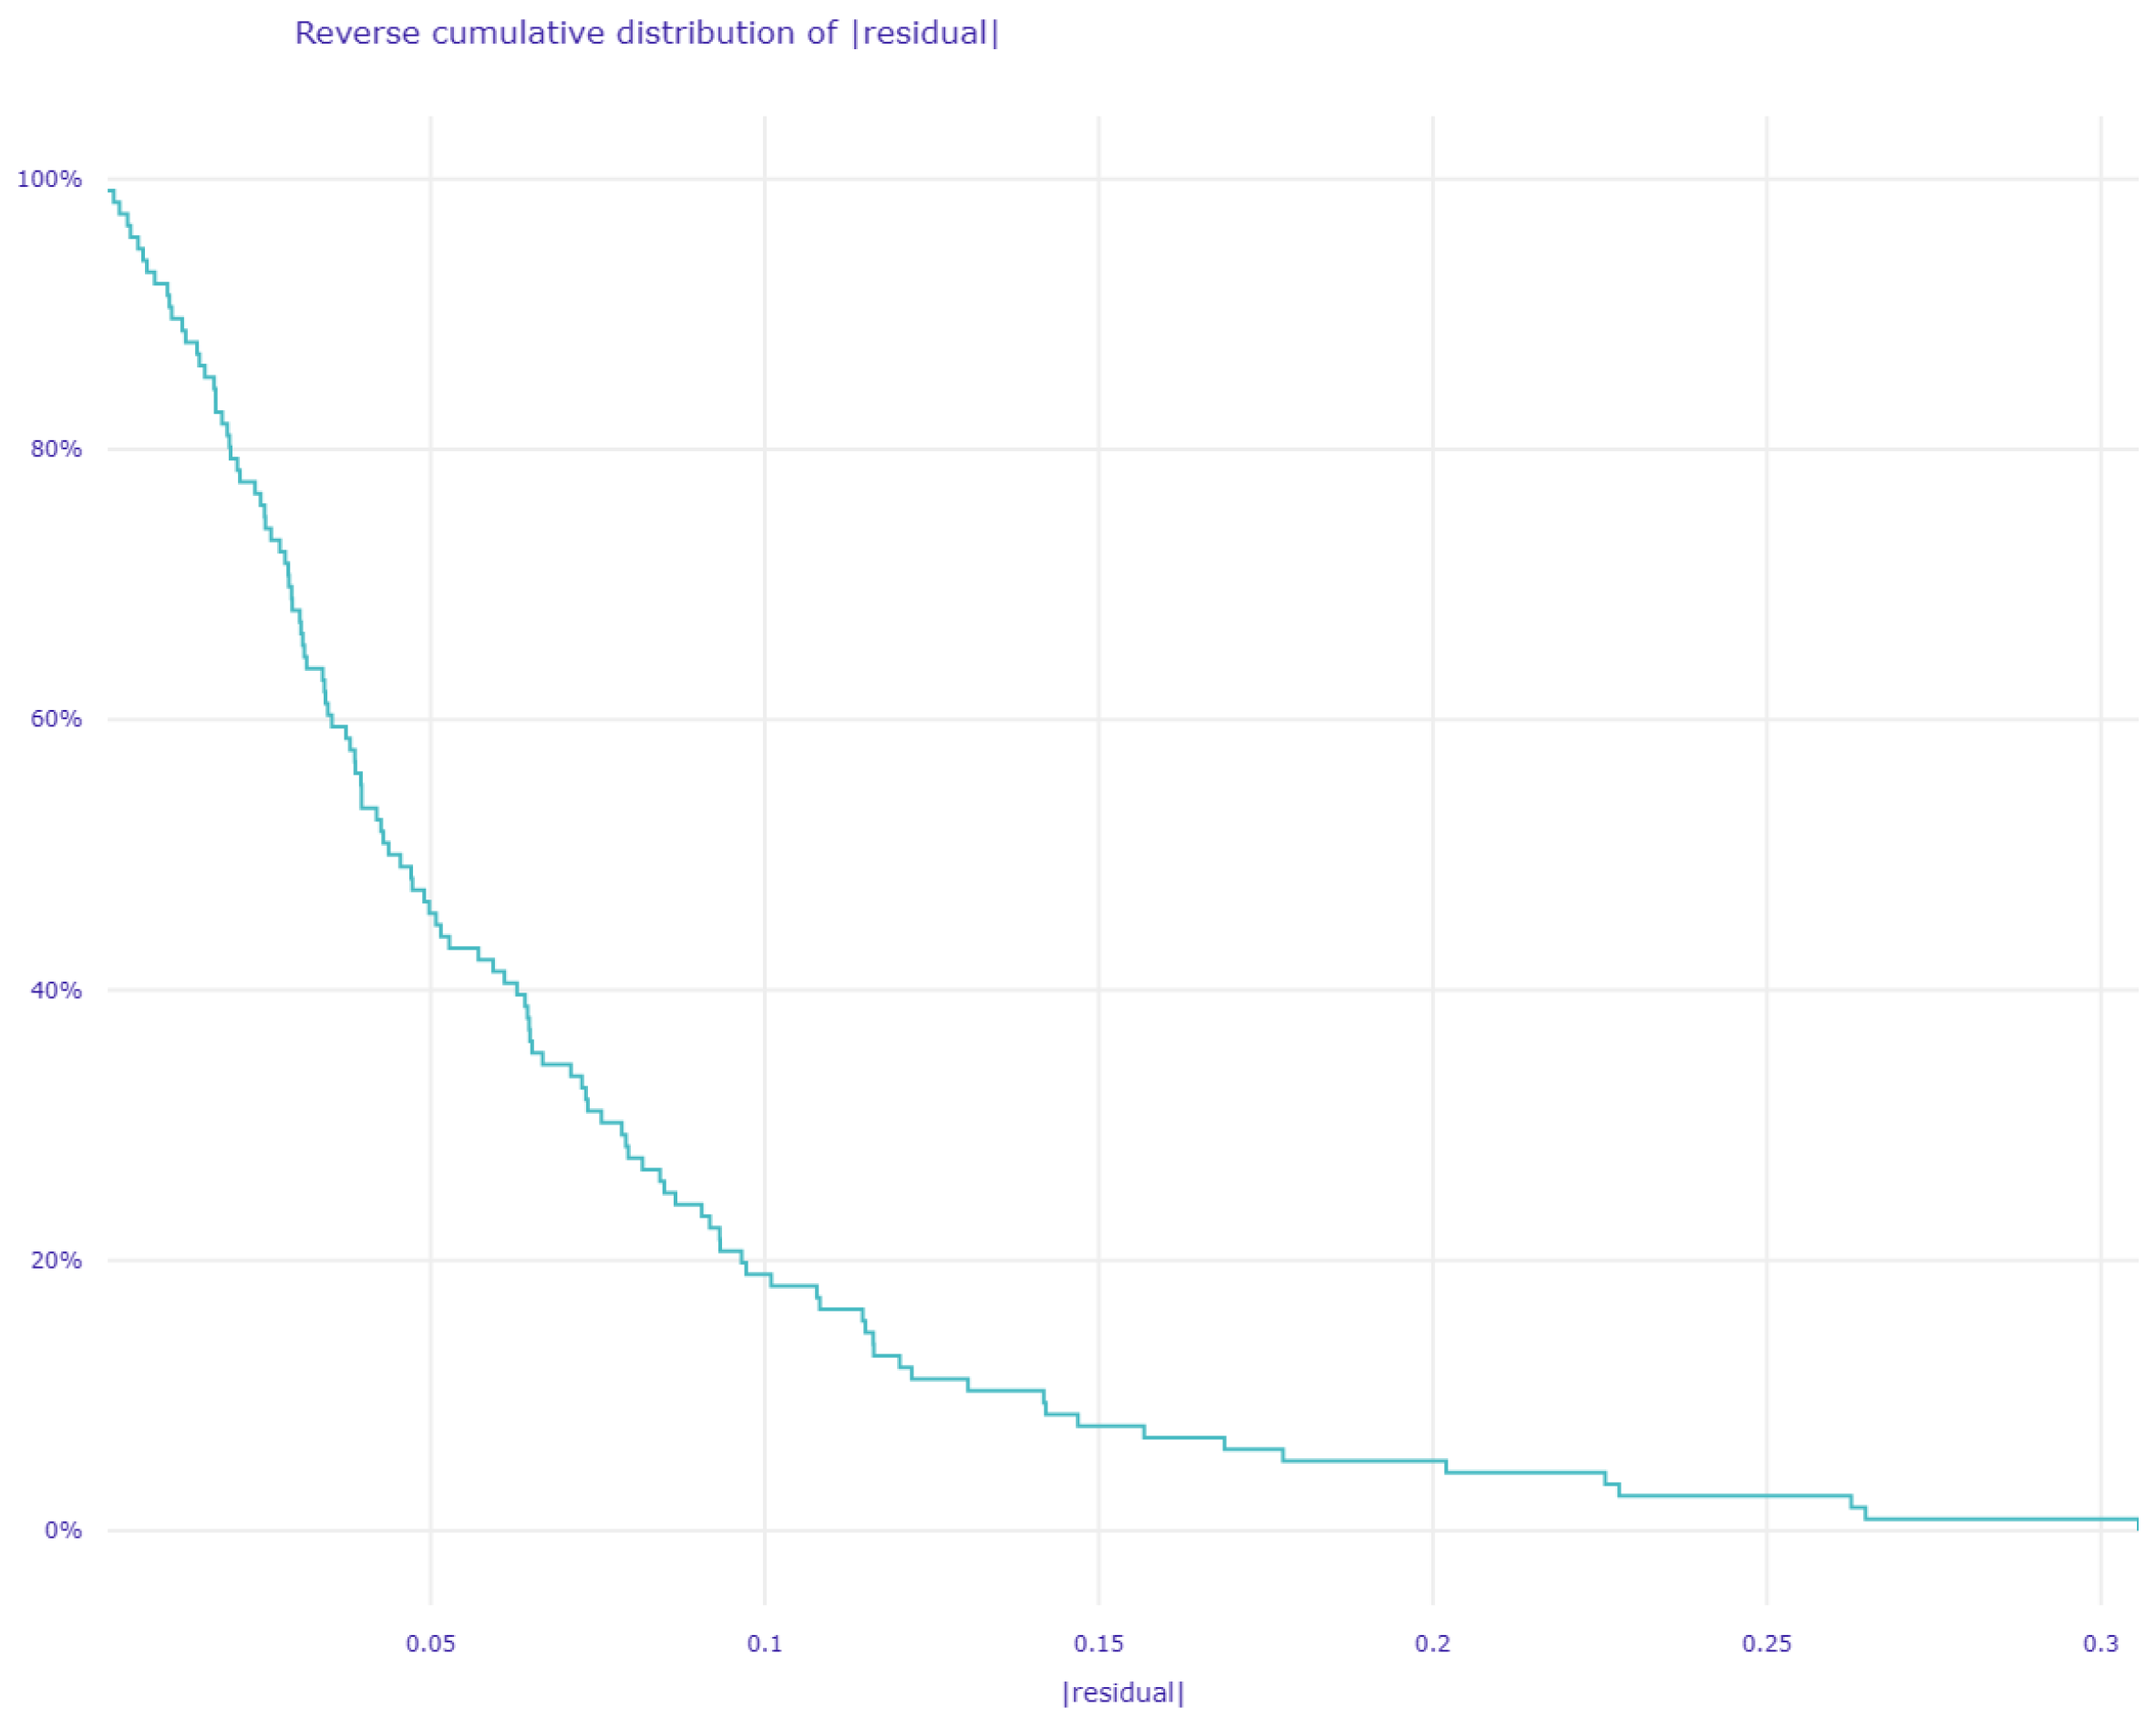
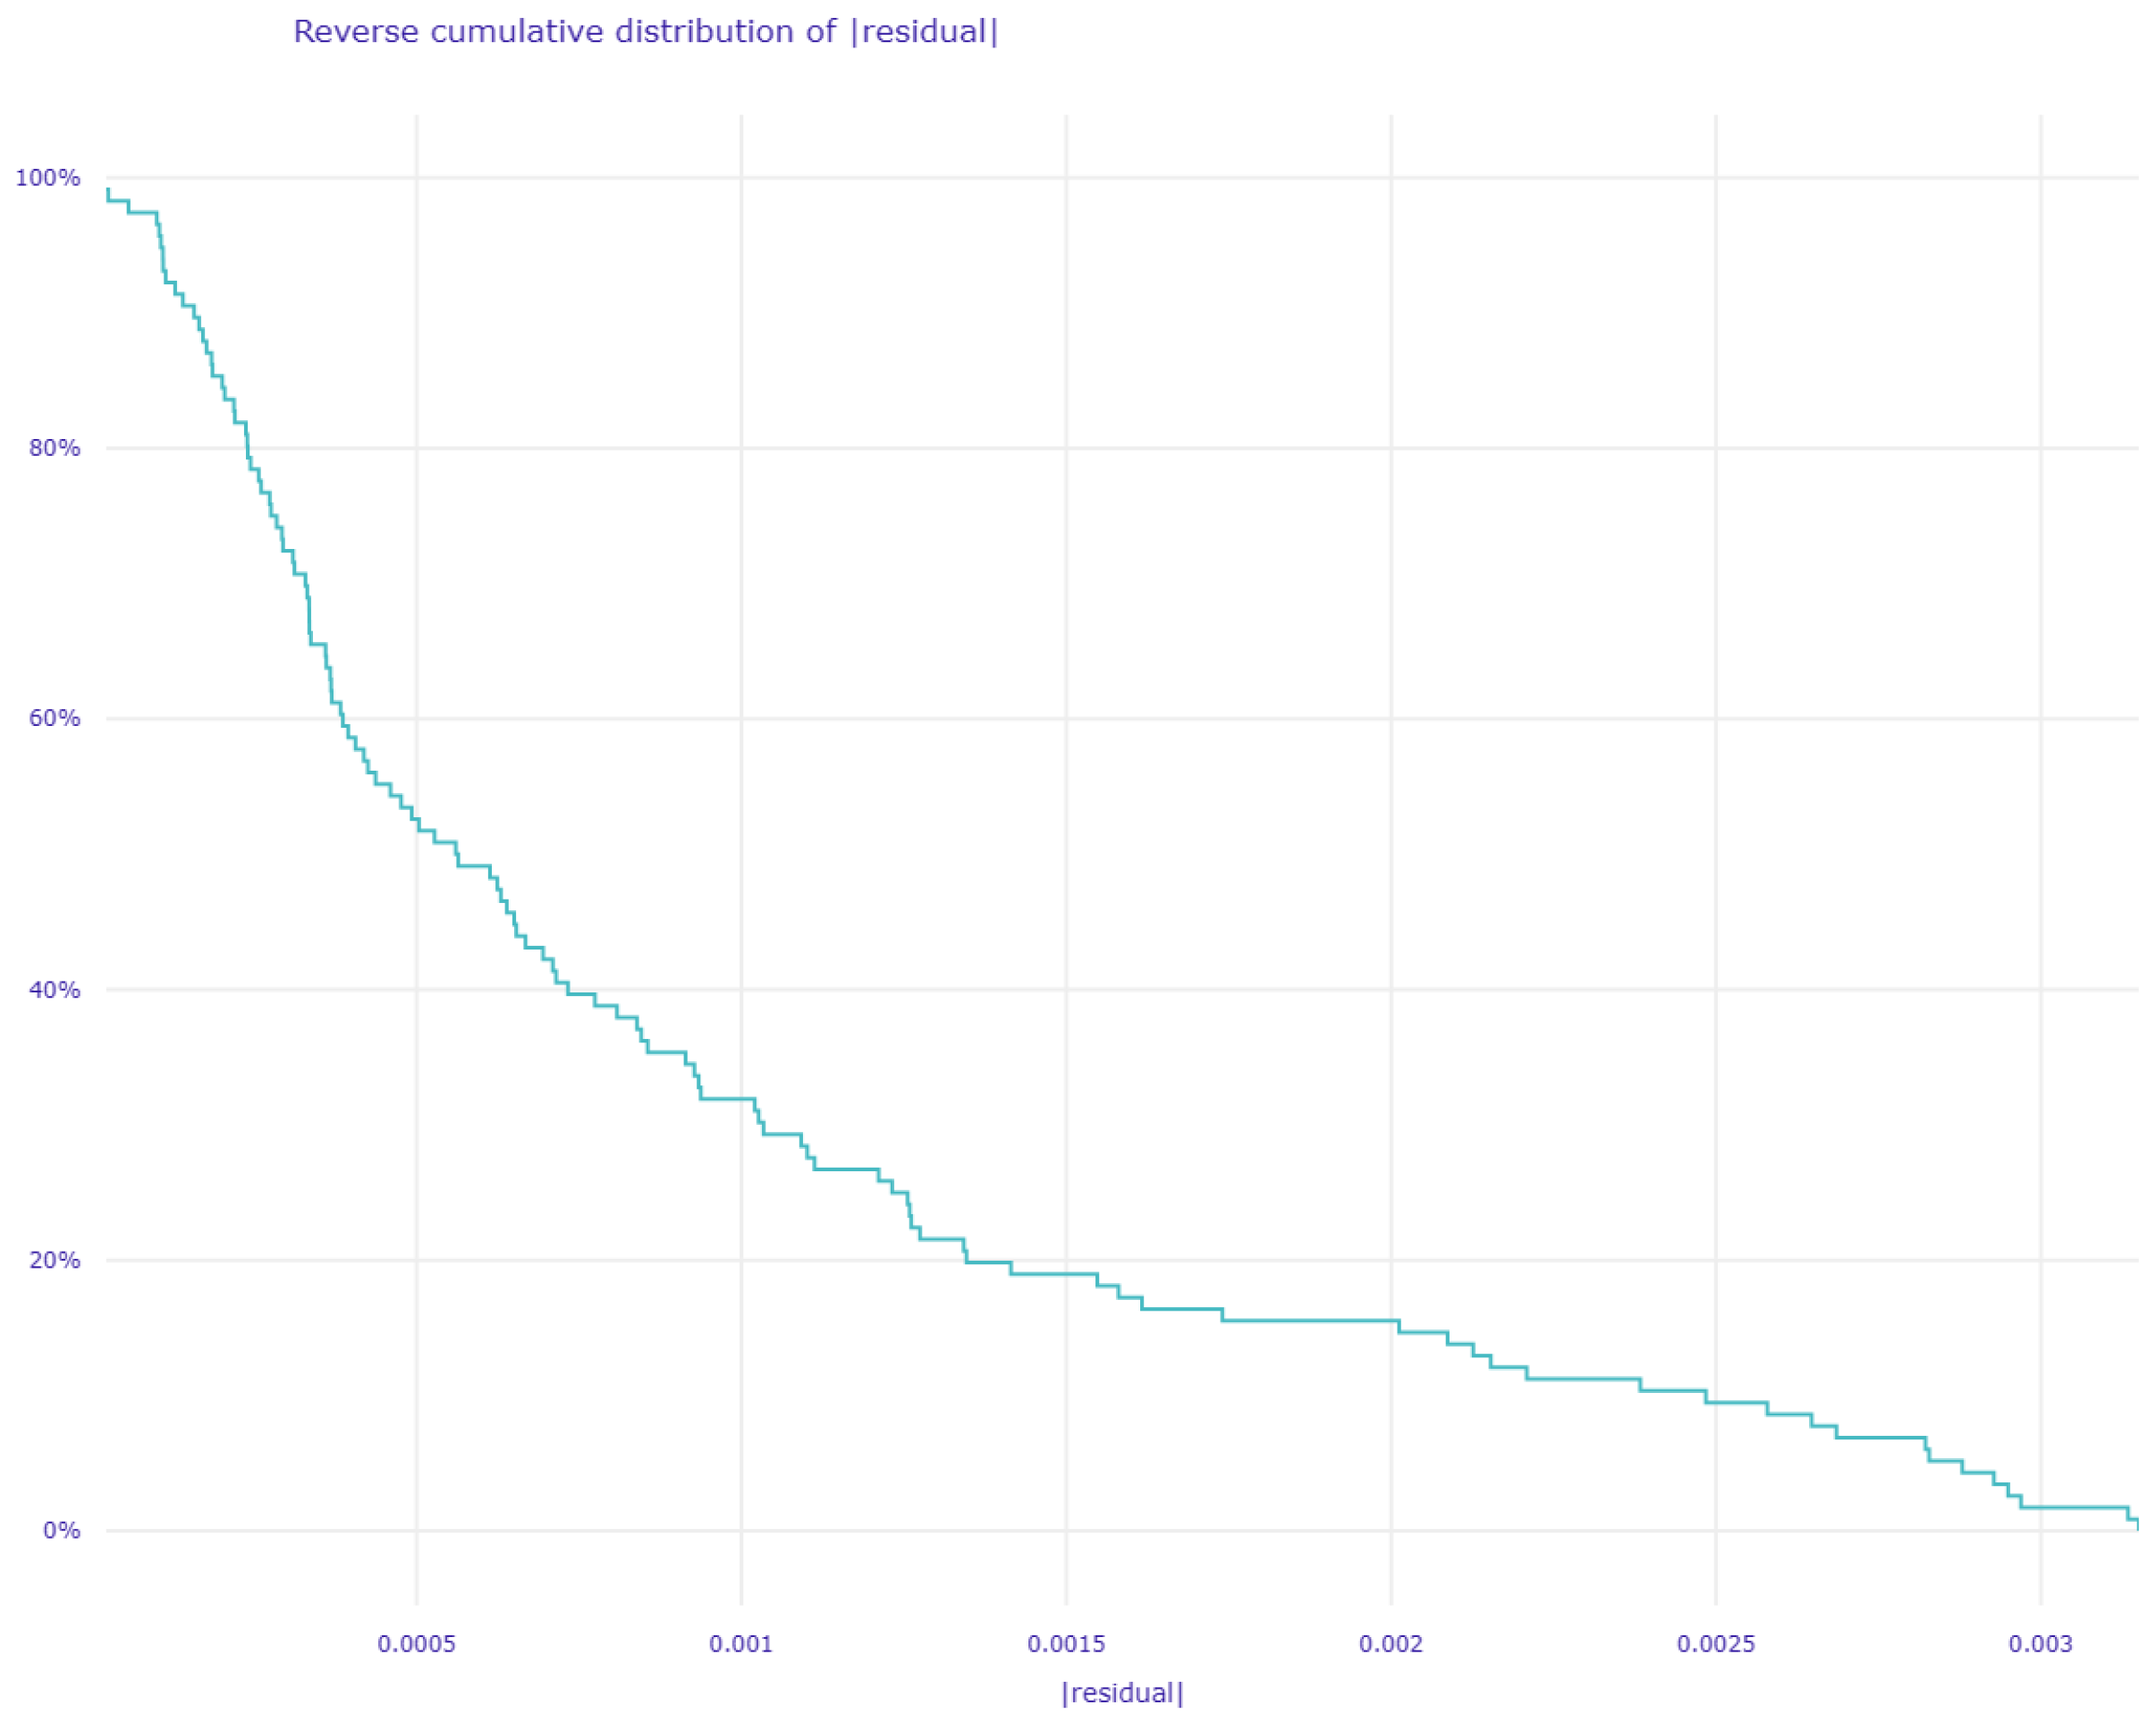
3.1. Performance Analysis

This section investigates the empirical data resulting from the foregoing models, which have been used to study the simultaneous impact of uncertainty indices on bitcoin energy consumption. Figure 3 reports the predicted and current series of bitcoin energy consumption, where we compare the ML models SVR, CatBoost and XGboost, respectively. As shown in Figure 3, the curves of the predicted values from the XGBoost and CatBoost models have the same behavior as the curve of the original values for the bitcoin energy consumption. To select the best-fit model among competing ML tools, we use the performance measures (RMSE, MSE, MAE, EVS and R 2 ) shown in Table 3. As the best-fit model, the forecasting model with the lowest RMSE, MSE and MAE values is chosen. The results of the performance measures show that the XGboost model outperforms the SVR and CatBoost models in predicting bitcoin energy use. Empirical evidence demonstrates that the XGboost model’s performance metrics (RMSE = 0.001229; MSE = 0.000002; MAE = 0.000891; EVS = 0.9998528; and R 2 = 0.999852) have the lowest values when compared to the SVR and CatBoost models. Figure 4 also shows the different performance measures of the training, test and validation data for each model. The performance measures displayed consolidate the superiority of the XGboost model.

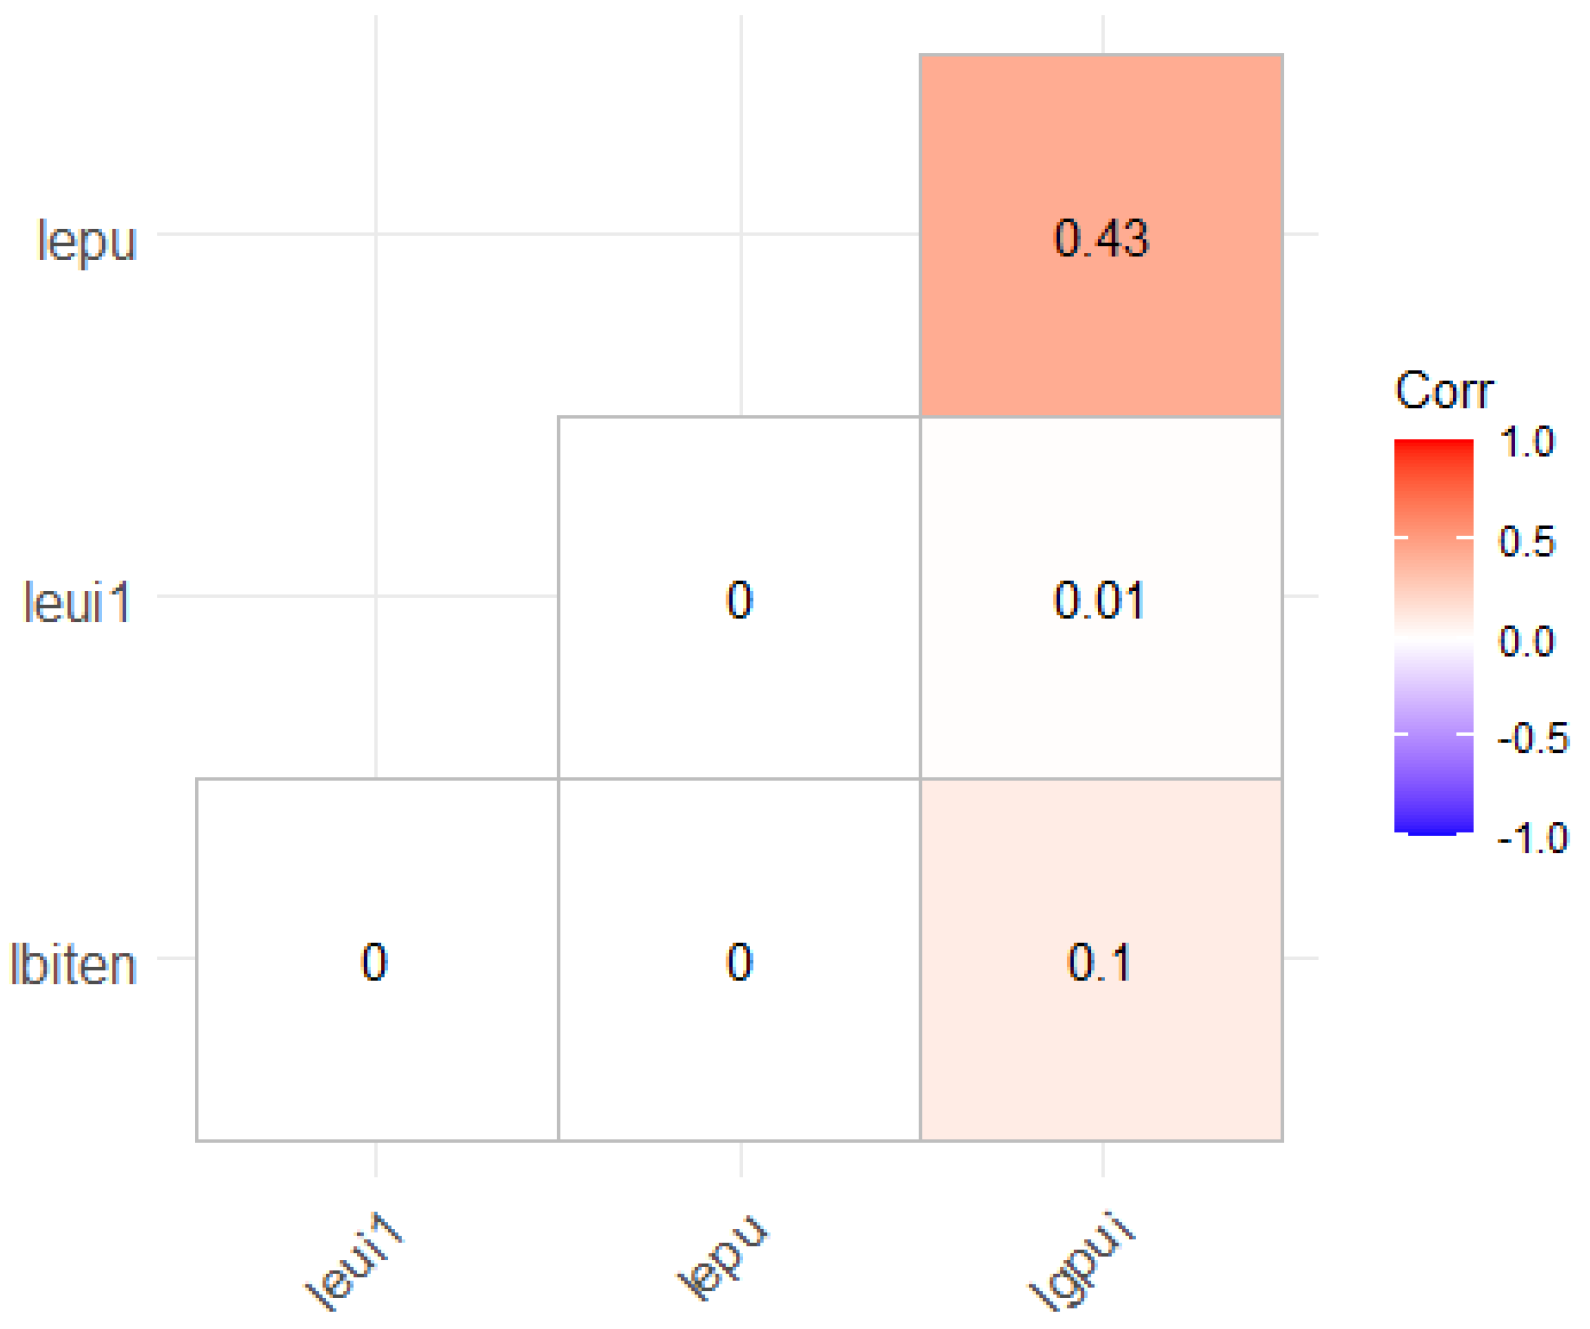
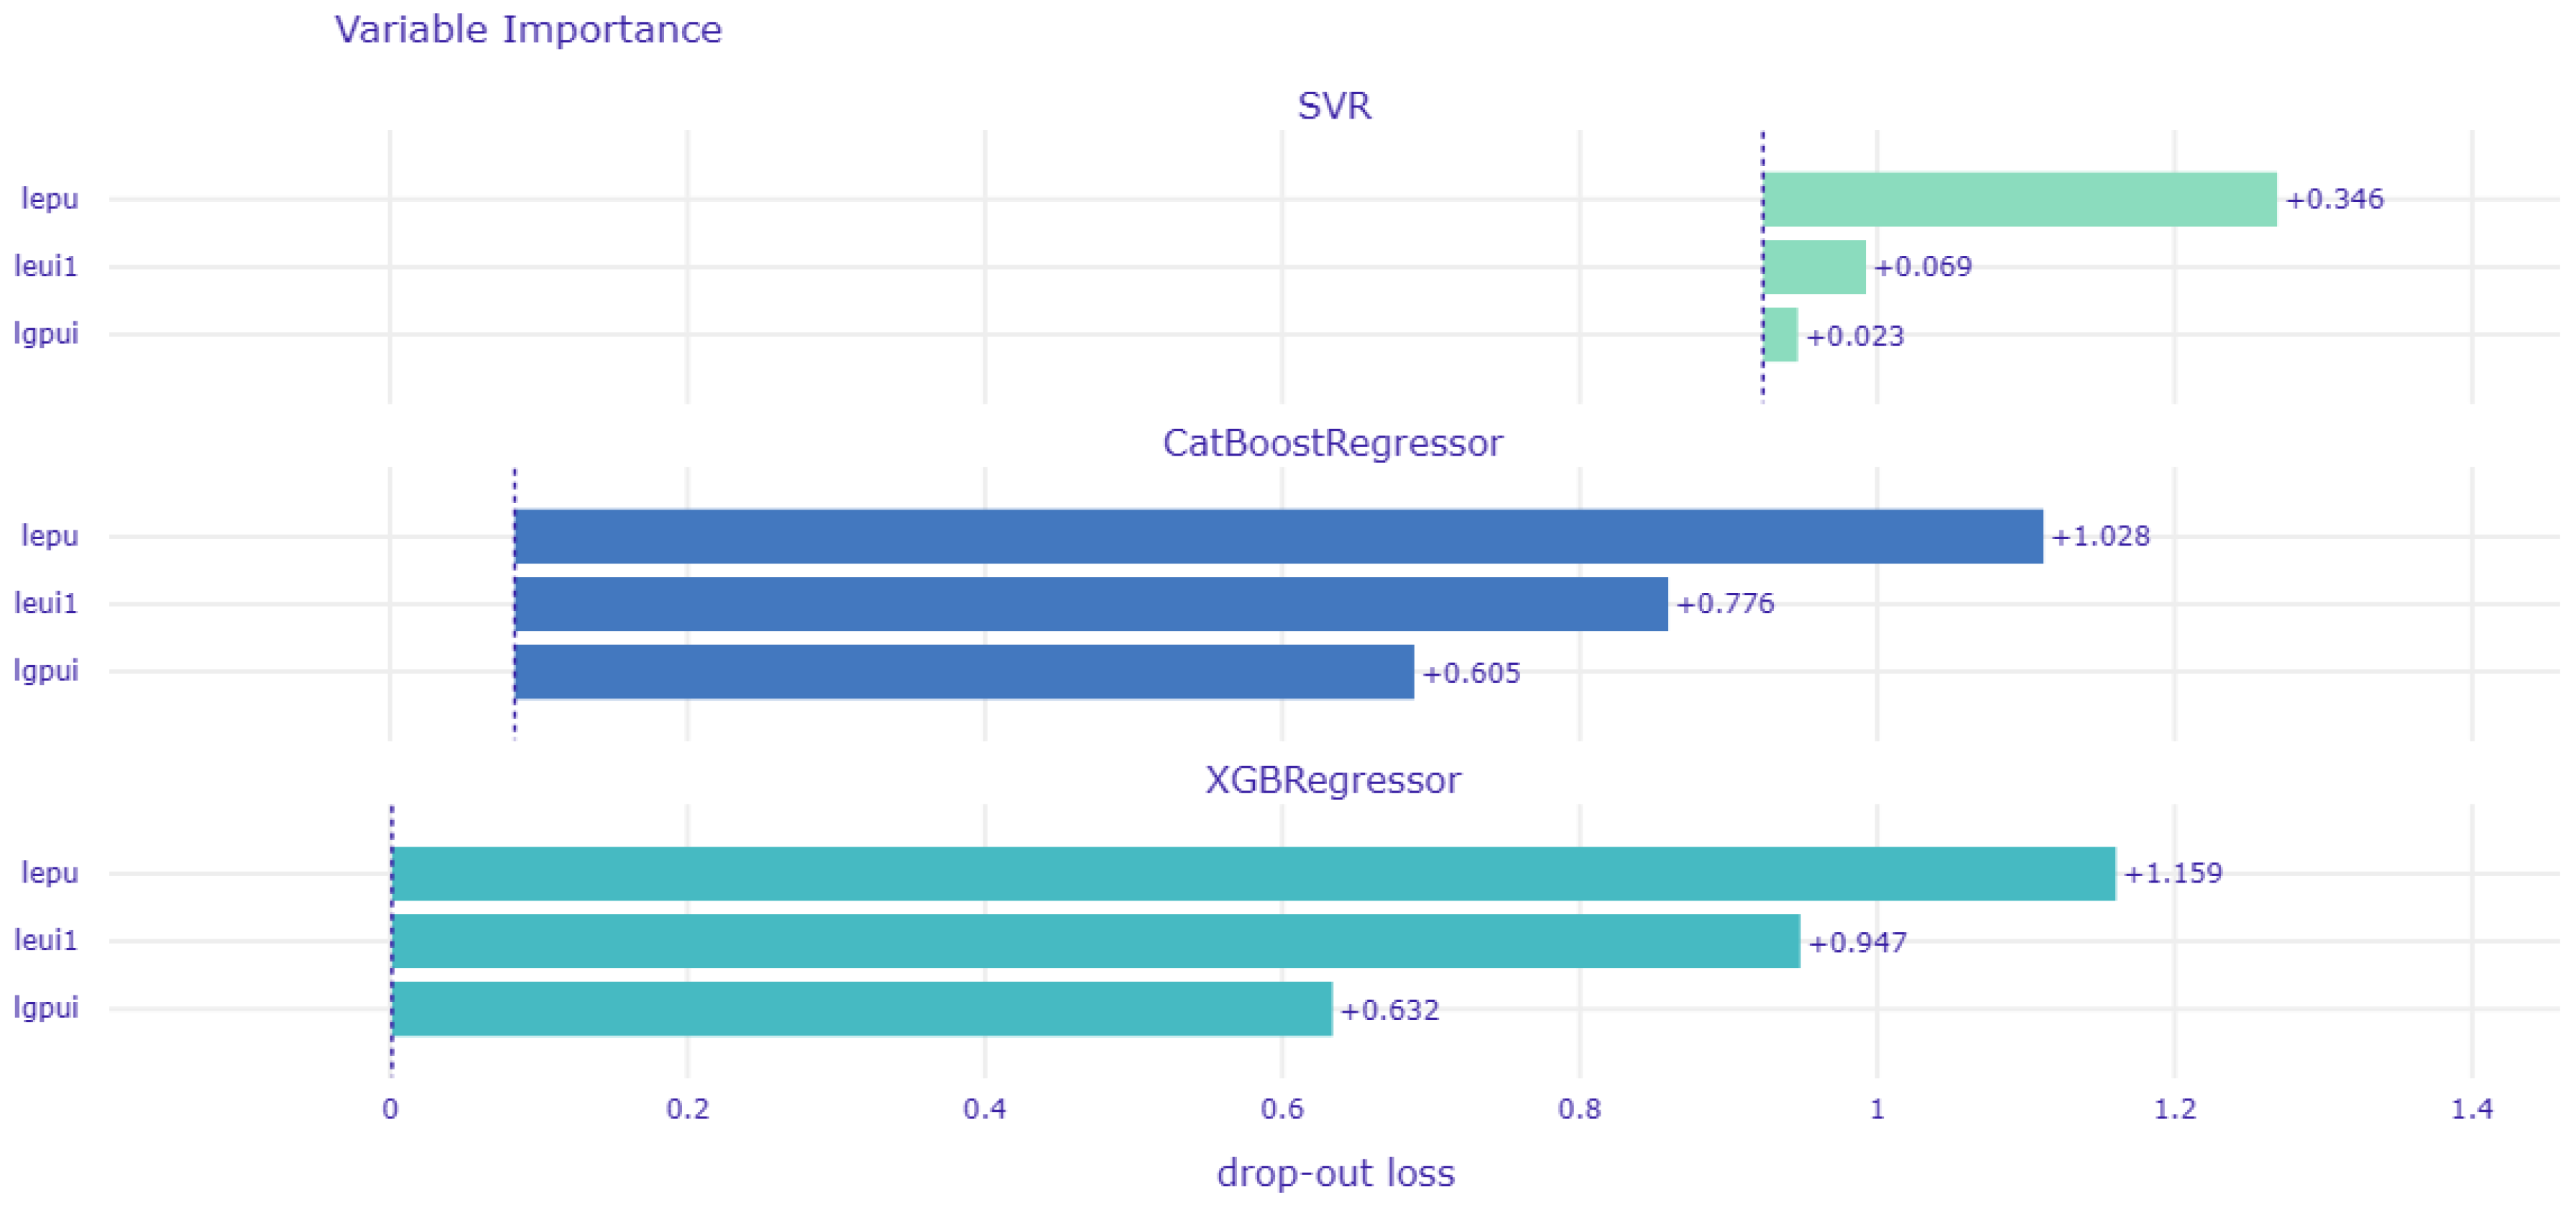
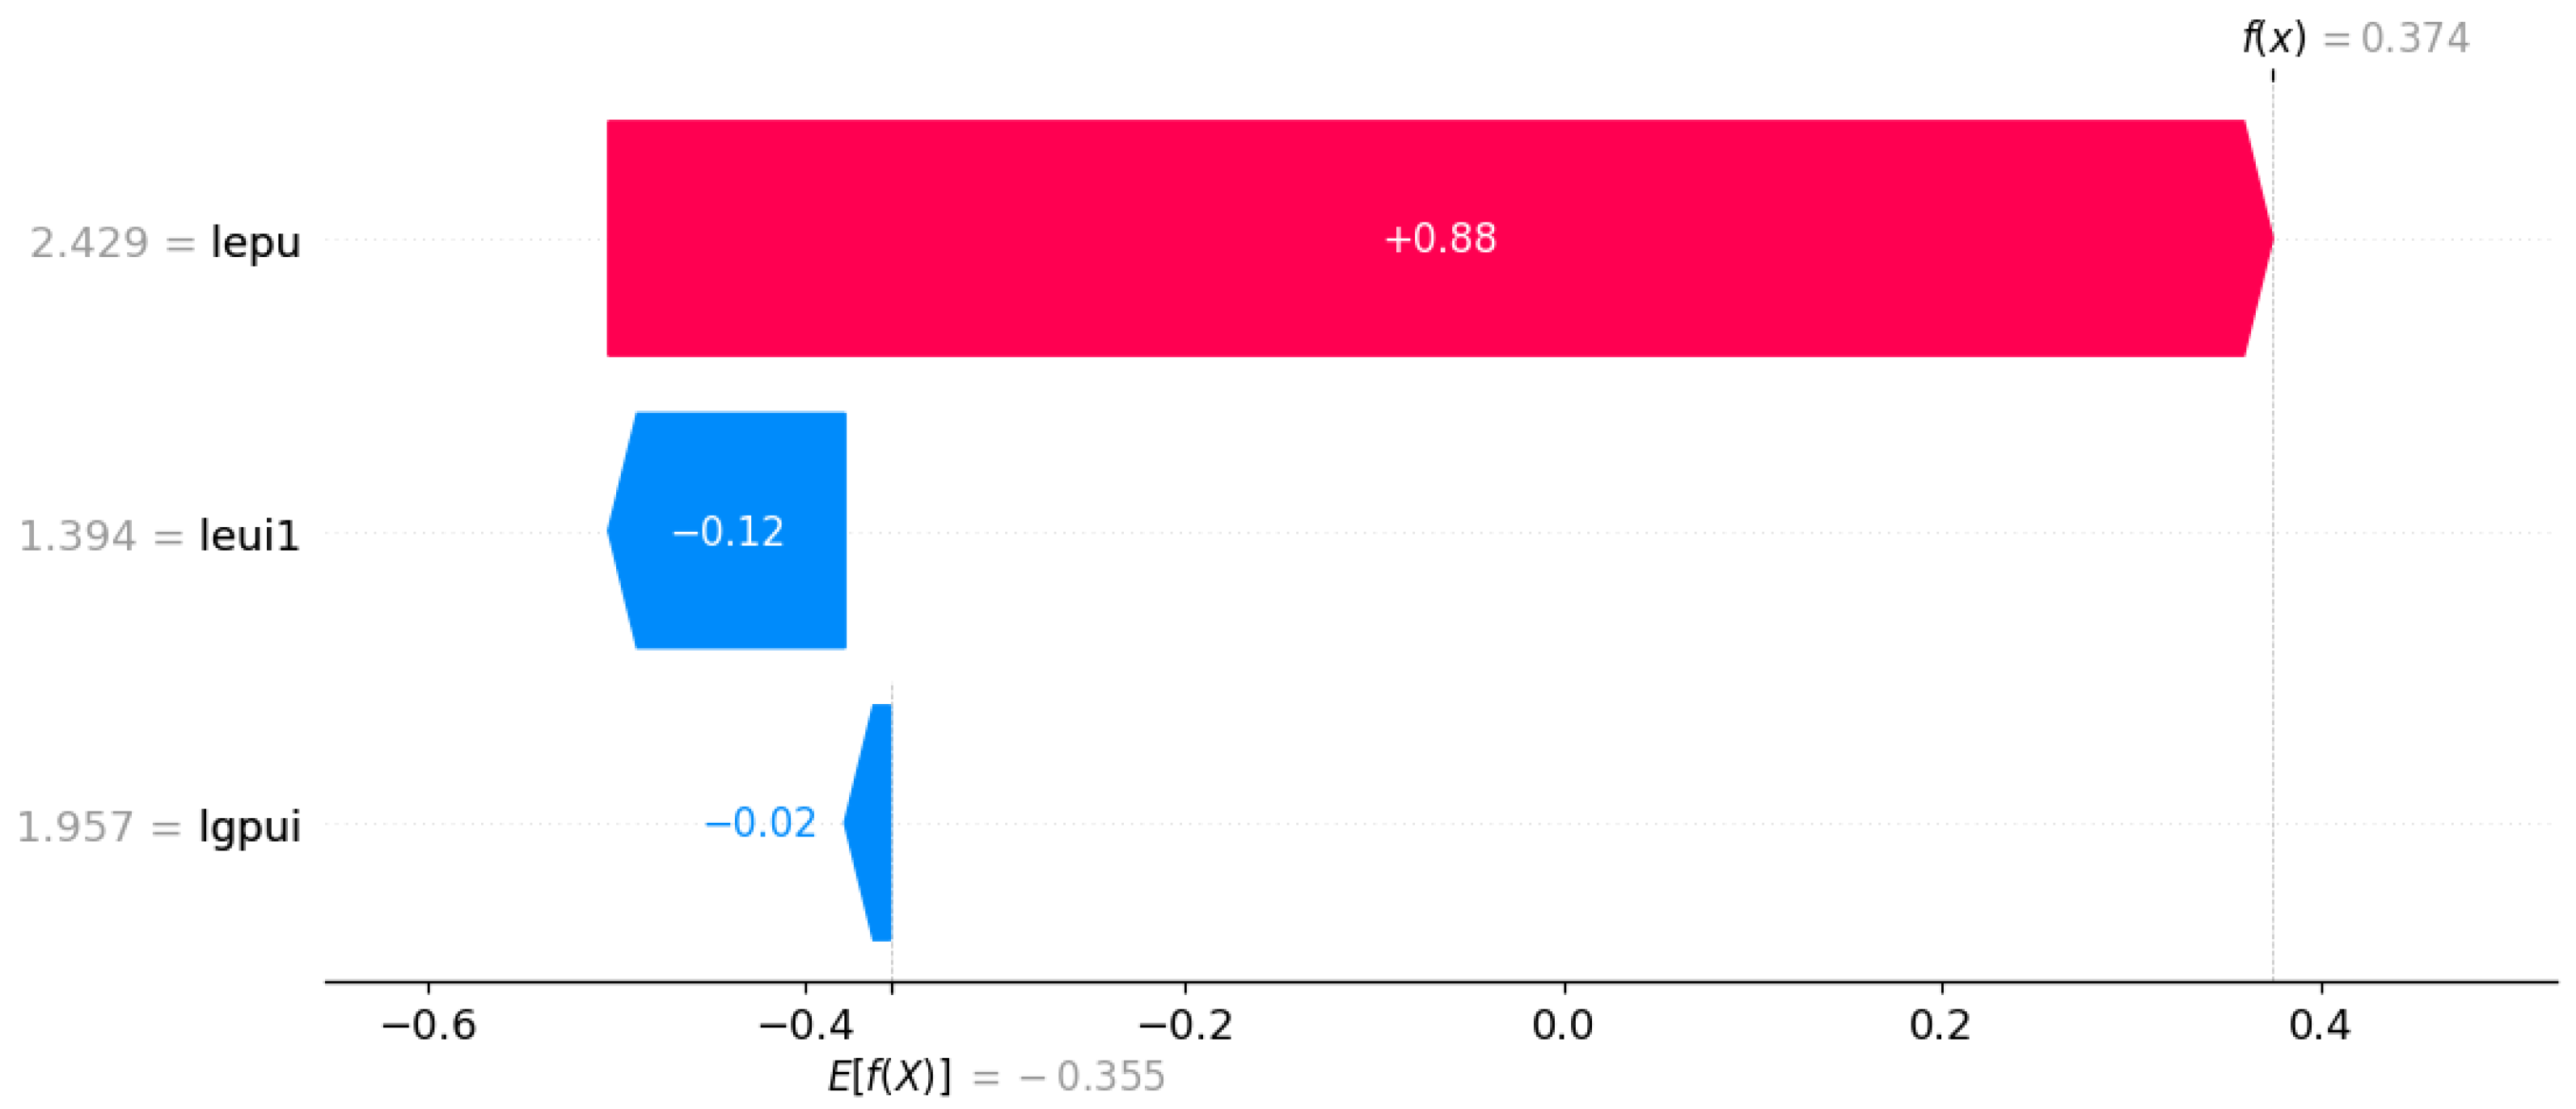
3.2. Feature Analysis

This section focuses on the forecasting machine learning technologies (SVR, CatBoost and XGboost). Furthermore, the Shapley additive explanation (SHAP) method is used to explain the effect of the energy, economic policy uncertainty indices and geopolitical risk variables on bitcoin energy consumption. Jabeur et al. [46,52] and (Zaghdoudi et al. [45]) concluded that the Shapley additive explanation approach can be utilized by policymakers and investors to understand complex ML outcomes. However, in this study, we use the DALEX Python package proposed by Biecek and Burzykowski [43] to explain the SVR, XGboost and CatBoost models. With DALEX, we analyzed model performance based on the distribution of residuals by comparing the differences between observed and predicted probabilities as residuals. The reverse cumulative residual plots displayed in Figure 5, Figure 6 and Figure 7 show that residual distribution from XGBoost appear to be the lowest compared to SVR and CatBoost models. Therefore, the XGboost model is the most efficient to forecast the bitcoin energy consumption.
However, it is important to understand which predictors have the greatest influence on the outcome variable when using machine learning models. Figure 8 reports the importance values of variables for the ML models. The width of the interval bands corresponds to variable importance. Overall, the XGboost model seems to have the lowest RMSE, whereas the SVR model has the highest RMSE. Our findings also indicate that economic policy uncertainty and energy uncertainty are the most influential variables on bitcoin energy consumption.
The SHAP values for the effective ML tool XGboost are shown in Figure 4. This is accomplished by ordering the features based on the sum of the SHAP amplitudes over all samples. The SHAP values are then utilized to indicate the distribution of each feature’s impacts on model output. Each color informs us about the effect of the input variable on the output, either positive in red or negative in blue. However, in terms of predicting, variables are ordered based on their value in influencing bitcoin energy consumption. Each row depicts a feature. A redder shape indicates a higher value, whereas a bluer shape indicates a lower value. The SHAP values are plotted on the abscissa. Furthermore, a positive SHAP value reflects a positive input–output effect, while a negative SHAP value indicates a negative input–output effect. As observed in Figure 9, lepu is the most important feature which leads to a positive forecast of bitcoin energy consumption. This means that an increase in the economic policy uncertainty stimulates bitcoin energy consumption. Significant economic policy uncertainty could prompt investors to seek alternative assets such as bitcoin as a hedge against traditional financial markets or currencies perceived as risky in times of turmoil. Furthermore, economic policy uncertainty can affect global economic patterns, impacting the valuation of bitcoin, which is often considered a global asset independent of a specific country’s policies. In addition, more consideration for bitcoin means an increase in the number of transactions and validations, and consequently more energy consumption. Oterwise, energy uncertainty (leui1) appears in the second position, which negatively impacts the bitcoin energy consumption. An increase in energy uncertainty decreases bitcoin energy consumption. Thus, the number of transaction validations retracts as energy uncertainty increases. That is, bitcoin becomes less attractive when there is uncertainty about the availability of fossil fuels such as oil, natural gas or coal due to the depletion of reserves or geopolitical tensions affecting supply routes. However, results indicate that the geopolitical risk has a negative weak feature importance in forecasting bitcoin energy consumption.

4. Conclusions

This study attempts to compare three ML models in order to determine which is best able to predict bitcoin’s energy consumption. The findings indicate that XGboost outperforms the SVR and CatBoost models. Moreover, the SHAP values indicate that the informational content in the economic policy uncertainty dominates that in the energy uncertainty and geopolitical risk to forecast bitcoin energy consumption.
Our findings assert that any increase in uncertainty in economic policy increases bitcoin energy consumption. Thus, uncertainty surrounding economic policy can adversely influence different aspects of the economy, such as investment and consumption. High uncertainty can lead investors to investigate alternative assets such as bitcoin, which is considered a hedge against traditional market volatility. However, increased bitcoin demand may lead to a rise in mining activity, which in turn requires more energy.
The findings of this study add to the existing literature and address important policy concerns. Indeed, uncertainty regarding bitcoin’s energy use may drive governments to enact or change regulations targeted at reducing its environmental effect. Such laws might try to encourage the use of renewable energy in mining operations, implement environmental taxes on mining activities, or improve the efficiency of mining equipment. Furthermore, because uncertainty about the future of bitcoin energy consumption is likely to persist, policymakers and authorities may be able to redirect their support from traditional bitcoin mining operations to sustainable bitcoin mining operations, which may result in a lower carbon footprint related to bitcoin energy consumption. In addition, miners need to explore more ways of making their operations more environmentally friendly. These include using renewable energy sources such as solar, wind or hydroelectric power for mining operations. As a result of the high uncertainty, efforts by governments and decision-makers to restrict bitcoin’s energy use might impact cryptocurrency investors’ decisions. Consequently, it will become necessary for investors to employ more potent risk hedging strategies, such as portfolio diversification and defensive asset acquisition. Thus, caution should be exercised before considering bitcoin as a safe haven due to its high energy consumption.

Author Contributions

Conceptualization, T.Z., Y.B. and N.K.; Data curation, M.H.M.; Formal analysis, K.T. and N.K.; Funding acquisition, K.T.; Investigation, T.Z. and Y.B.; Methodology, T.Z. and M.H.M.; Project administration, K.T.; Software, T.Z.; Supervision, M.H.M.; Validation, K.T.; Visualization, M.H.M.; Writing—original draft, T.Z. and N.K.; Writing—review and editing, K.T. and M.H.M. All authors have read and agreed to the published version of the manuscript.

Funding

This research has been funded by Scientific Research Deanship at the University of Ha’il, Saudi Arabia, through project number RG-21 138.

Data Availability Statement

The raw data supporting the conclusions of this article will be made available by the authors on request.

Conflicts of Interest

The authors declare no conflicts of interest.

References

  1. Vranken, H. Sustainability of bitcoin and blockchains. Curr. Opin. Environ. Sustain. 2017, 28, 1–9. [Google Scholar] [CrossRef]
  2. Giungato, P.; Rana, R.; Tarabella, A.; Tricase, C. Current Trends in Sustainability of Bitcoins and Related Blockchain Technology. Sustainability 2017, 9, 2214. [Google Scholar] [CrossRef]
  3. Kugler, L. Why cryptocurrencies use so much energy. Commun. ACM 2018, 61, 15–17. [Google Scholar] [CrossRef]
  4. Zade, M.; Myklebost, J.; Tzscheutschler, P.; Wagner, U. Is Bitcoin the Only Problem? A Scenario Model for the Power Demand of Blockchains. Front. Energy Res. 2019, 7, 21. [Google Scholar] [CrossRef]
  5. Küfeoğlu, S.; Özkuran, M. Bitcoin mining: A global review of energy and power demand. Energy Res. Soc. Sci. 2019, 58, 101273. [Google Scholar] [CrossRef]
  6. Corbet, S.; Lucey, B.M.; Yarovaya, L. The financial market effects of cryptocurrency energy usage. SSRN Electron. J. 2019. [Google Scholar] [CrossRef]
  7. Huynh, A.N.Q.; Duong, D.; Burggraf, T.; Luong, H.T.T.; Bui, N.H. Energy consumption and Bitcoin market. Asia-Pac. Financ. Mark. 2022, 29, 79–93. [Google Scholar] [CrossRef]
  8. Bejan, C.A.; Bucerzan, D.; Crăciun, M.D. Bitcoin price evolution versus energy consumption; trend analysis. Appl. Econ. 2023, 55, 1497–1511. [Google Scholar] [CrossRef]
  9. Das, D.; Dutta, A. Bitcoin’s energy consumption: Is it the Achilles heel to miner’s revenue? Econ. Lett. 2020, 186, 108530. [Google Scholar] [CrossRef]
  10. Goczek, Ł.; Skliarov, I. What drives the Bitcoin price? A factor augmented error correction mechanism investigation. Appl. Econ. 2019, 51, 6393–6410. [Google Scholar] [CrossRef]
  11. Kristoufek, L. What are the main drivers of the Bitcoin price? Evidence from wavelet coherence analysis. PLoS ONE 2015, 10, e0123923. [Google Scholar] [CrossRef]
  12. Ciaian, P.; Rajcaniova, M.; Kancs, D. The economics of BitCoin price formation. Appl. Econ. 2016, 48, 1799–1815. [Google Scholar] [CrossRef]
  13. Gemici, E.; Polat, M. Relationship between price and volume in the Bitcoin market. J. Risk Financ. 2019, 20, 435–444. [Google Scholar] [CrossRef]
  14. El Alaoui, M.; Bouri, E.; Roubaud, D. Bitcoin price–volume: A multifractal cross-correlation approach. Financ. Res. Lett. 2019, 31. [Google Scholar] [CrossRef]
  15. Jain, P.K.; McInish, T.H.; Miller, J.L. Insights from bitcoin trading. Financ. Manag. 2019, 48, 1031–1048. [Google Scholar] [CrossRef]
  16. Alexander, C.; Heck, D.F. Price discovery, high-frequency trading and jumps in bitcoin markets. J. Financ. Stab. 2020, 50, 100776. [Google Scholar] [CrossRef]
  17. Li, J.; Li, N.; Peng, J.; Cui, H.; Wu, Z. Energy consumption of cryptocurrency mining: A study of electricity consumption in mining cryptocurrencies. Energy 2019, 168, 160–168. [Google Scholar] [CrossRef]
  18. Schinckus, C.; Canh, N.P.; Ling, C.H. Crypto-currencies trading and energy consumption. Int. J. Energy Econ. Policy 2020, 10, 355–364. [Google Scholar] [CrossRef]
  19. Mishra, S.P.; Jacob, V.; Radhakrishnan, S. Energy consumption–bitcoin’s achilles heel. SSRN 2017. [Google Scholar] [CrossRef]
  20. Corbet, S.; Lucey, B.; Yarovaya, L. Bitcoin-energy markets interrelationships-New evidence. Resour. Policy 2021, 70, 101916. [Google Scholar] [CrossRef]
  21. Al-Yahyaee, K.H.; Rehman, M.U.; Mensi, W.; Al-Jarrah, I.M.W. Can uncertainty indices predict Bitcoin prices? A revisited analysis using partial and multivariate wavelet approaches. N. Am. J. Econ. Financ. 2019, 49, 47–56. [Google Scholar] [CrossRef]
  22. Sarkodie, S.A.; Ahmed, M.Y.; Leirvik, T. Trade volume affects bitcoin energy consumption and carbon footprint. Financ. Res. Lett. 2022, 48, 102977. [Google Scholar] [CrossRef]
  23. Sarker, P.K.; Lau, C.K.M.; Pradhan, A.K. Asymmetric effects of climate policy uncertainty and energy prices on bitcoin prices. Innov. Green Dev. 2023, 2, 100048. [Google Scholar] [CrossRef]
  24. Kang, S.H.; Yoon, S.M.; Bekiros, S.; Uddin, G.S. Bitcoin as hedge or safe haven: Evidence from stock, currency, bond and derivatives markets. Comput. Econ. 2020, 56, 529–545. [Google Scholar] [CrossRef]
  25. Smales, L.A. Bitcoin as a safe haven: Is it even worth considering? Financ. Res. Lett. 2019, 30, 385–393. [Google Scholar] [CrossRef]
  26. Umar, M.; Su, C.W.; Rizvi, S.K.A.; Shao, X.F. Bitcoin: A safe haven asset and a winner amid political and economic uncertainties in the US? Technol. Forecast. Soc. Chang. 2021, 167, 120680. [Google Scholar] [CrossRef]
  27. Kalyvas, A.; Papakyriakou, P.; Sakkas, A.; Urquhart, A. What drives Bitcoin’s price crash risk? Econ. Lett. 2020, 191, 108777. [Google Scholar] [CrossRef]
  28. Wüstenfeld, J.; Geldner, T. Economic uncertainty and national bitcoin trading activity. N. Am. J. Econ. Financ. 2022, 59, 101625. [Google Scholar] [CrossRef]
  29. Chen, C.; Liu, L.; Zhao, N. Fear sentiment, uncertainty, and bitcoin price dynamics: The case of COVID-19. Emerg. Mark. Financ. Trade 2020, 56, 2298–2309. [Google Scholar] [CrossRef]
  30. Panagiotidis, T.; Stengos, T.; Vravosinos, O. The effects of markets, uncertainty and search intensity on bitcoin returns. Int. Rev. Financ. Anal. 2019, 63, 220–242. [Google Scholar] [CrossRef]
  31. Cheng, H.P.; Yen, K.C. The relationship between the economic policy uncertainty and the cryptocurrency market. Financ. Res. Lett. 2020, 35, 101308. [Google Scholar] [CrossRef]
  32. Yen, K.C.; Cheng, H.P. Economic policy uncertainty and cryptocurrency volatility. Financ. Res. Lett. 2021, 38, 101428. [Google Scholar] [CrossRef]
  33. Kyriazis, N.A. The effects of gold, stock markets and geopolitical uncertainty on Bitcoin prices and volatility. Glob. Econ. J. 2020, 20, 2050020. [Google Scholar] [CrossRef]
  34. Haq, I.U.; Ferreira, P.; Quintino, D.D.; Huynh, N.; Samantreeporn, S. Economic Policy Uncertainty, Energy and Sustainable Cryptocurrencies: Investigating Dynamic Connectedness during the COVID-19 Pandemic. Economies 2023, 11, 76. [Google Scholar] [CrossRef]
  35. Li, Z.Z.; Su, C.W.; Moldovan, N.C.; Umar, M. Energy consumption within policy uncertainty: Considering the climate and economic factors. Renew. Energy 2023, 208, 567–576. [Google Scholar] [CrossRef]
  36. Colon, F.; Kim, C.; Kim, H.; Kim, W. The effect of political and economic uncertainty on the cryptocurrency market. Financ. Res. Lett. 2021, 39, 101621. [Google Scholar] [CrossRef]
  37. Shaikh, I. Policy uncertainty and Bitcoin returns. Borsa Istanb. Rev. 2020, 20, 257–268. [Google Scholar] [CrossRef]
  38. Kevser, M. Bitcoin as an Alternative Financial Asset Class: Relations between Geopolitical Risk, Global Economic Political Uncertainty, and Energy Consumption. Pamukkale Eurasian Socioecon. Stud. 2023, 9, 117–131. [Google Scholar] [CrossRef]
  39. Smola, A.J.; Schölkopf, B. A tutorial on support vector regression. Stat. Comput. 2004, 14, 199–222. [Google Scholar] [CrossRef]
  40. Kuhn, H.; Tucker, A. Nonlinear programming. In Proceeding of the Second Berkeley Symposium on Mathematical Statistics and Probability; Neyman, J., Ed.; University of California Press: Berkeley, CA, USA, 1951. [Google Scholar]
  41. Smola, A.J.; Schölkopf, B.; Müller, K.R. The connection between regularization operators and support vector kernels. Neural Netw. 1998, 11, 637–649. [Google Scholar] [CrossRef]
  42. Prokhorenkova, L.; Gusev, G.; Vorobev, A.; Dorogush, A.V.; Gulin, A. CatBoost: Unbiased boosting with categorical features. In Proceedings of the Advances in Neural Information Processing Systems 31 (NeurIPS 2018), Montreal, QC, Canada, 3–8 December 2018; Volume 31. [Google Scholar]
  43. Biecek, P.; Burzykowski, T. Explanatory Model Analysis: Explore, Explain, and Examine Predictive Models; CRC Press: Boca Raton, FL, USA, 2021. [Google Scholar]
  44. Tissaoui, K.; Zaghdoudi, T.; Hakimi, A.; Nsaibi, M. Do gas price and uncertainty indices forecast crude oil prices? Fresh evidence through XGBoost modeling. Comput. Econ. 2023, 62, 663–687. [Google Scholar] [CrossRef] [PubMed]
  45. Zaghdoudi, T.; Tissaoui, K.; Hakimi, A.; Ben Amor, L. Dirty versus renewable energy consumption in China: A comparative analysis between conventional and non-conventional approaches. Ann. Oper. Res. 2024, 334, 601–622. [Google Scholar] [CrossRef] [PubMed]
  46. Jabeur, S.B.; Mefteh-Wali, S.; Viviani, J.L. Forecasting gold price with the XGBoost algorithm and SHAP interaction values. Ann. Oper. Res. 2024, 334, 679–699. [Google Scholar] [CrossRef]
  47. Tissaoui, K.; Abidi, I.; Azibi, N.; Nsaibi, M. Spillover Effects between Crude Oil Returns and Uncertainty: New Evidence from Time-Frequency Domain Approaches. Energies 2024, 17, 340. [Google Scholar] [CrossRef]
  48. Tissaoui, K.; Zaghdoudi, T.; Boubaker, S.; Hkiri, B.; Talbi, M. Testing the Nonlinear Long-and Short-Run Distributional Asymmetries Effects of Bitcoin Prices on Bitcoin Energy Consumption: New Insights through the QNARDL Model and XGBoost Machine-Learning Tool. Energies 2024, 17, 2810. [Google Scholar] [CrossRef]
  49. Ma, J.; Cheng, J.C.; Xu, Z.; Chen, K.; Lin, C.; Jiang, F. Identification of the most influential areas for air pollution control using XGBoost and Grid Importance Rank. J. Clean. Prod. 2020, 274, 122835. [Google Scholar] [CrossRef]
  50. Lundberg, S.M.; Lee, S.I. A unified approach to interpreting model predictions. In Proceedings of the Advances in Neural Information Processing Systems 30 (NIPS 2017), Long Beach, CA, USA, 4–9 December 2017; Volume 30. [Google Scholar]
  51. Shapley, L.S. A value for n-person games. In Contributions to the Theory of Games II; Kuhn, H., Tucker, A., Eds.; Princeton University Press: Princeton, NJ, USA, 1953. [Google Scholar]
  52. Jabeur, S.B.; Gharib, C.; Mefteh-Wali, S.; Arfi, W.B. CatBoost model and artificial intelligence techniques for corporate failure prediction. Technol. Forecast. Soc. Chang. 2021, 166, 120658. [Google Scholar] [CrossRef]
Figure 1. Outliers.
Figure 1. Outliers.
Energies 17 03245 g001
Figure 2. Correlation matrix.
Energies 17 03245 g002
Figure 3. Plot of bitcoin energy consumption forecast.
Energies 17 03245 g003
Figure 4. Performance metrics: (a) SVR; (b) CatBoost; (c) XGboost.
Energies 17 03245 g004aEnergies 17 03245 g004b
Figure 5. SVR reverse-cumulative distribution of residual.
Energies 17 03245 g005
Figure 6. CatBoost reverse-cumulative distribution of residual.
Energies 17 03245 g006
Figure 7. XGboost-reverse cumulative distribution of residual.
Energies 17 03245 g007
Figure 8. Variable importance.
Energies 17 03245 g008
Figure 9. Impact on model output.
Energies 17 03245 g009
Table 1. Descriptive statistics.
LbitenLepuLgpuiLeui1
Mean−0.3505012.2386421.9744251.337927
Median−0.2672852.2237251.9571651.347119
Maximum1.0281772.6337462.5108481.636055
Minimum−41.9360061.7824841.084911
Std.Dev−0.8589970.1619230.1079200.119716
Skewness1.2144020.2208731.4063690.013209
Kurtosis2.8591182.1097136.8685202.568617
Jarque–Berra17.95191 ***5.967659 *138.2148 ***1.128519
Observations145145145145
Notes: (***), and (*) show significance levels of 1%, and 10%, respectively.
Table 2. Data and variables.
TargetDefinition TimeSources
lbitenCambridge Bitcoin ElectricityMonthlyhttps://ccaf.io/cbnsi/cbeci
Consumption Index(accessed on 26 June 2024)
Regressors
lepuEconomic PolicyMonthlyhttps://www.policyuncertainty.com/
Uncertainty Index
lgpuiGeopolitical Risk IndexMonthlyhttps://www.policyuncertainty.com/
leui1Energy Uncertainty IndexMonthlyhttps://www.policyuncertainty.com/
Table 3. Candidate model prediction evaluation.
MSERMSEMAEEVS R 2
SVR1.0902151.0441340.7464760.589110.57428
CatBoost Regressor0.0076180.0872810.0645970.7660710.76588
XGB Regressor0.0000020.0012290.0008910.99985280.999852
Disclaimer/Publisher’s Note: The statements, opinions and data contained in all publications are solely those of the individual author(s) and contributor(s) and not of MDPI and/or the editor(s). MDPI and/or the editor(s) disclaim responsibility for any injury to people or property resulting from any ideas, methods, instructions or products referred to in the content.

