Article

Fluid-Solid-Thermal Coupled Freezing Modeling Test of Soil under the Low-Temperature Condition of LNG Storage Tank

1
Department of Geotechnical Engineering, College of Civil Engineering, Tongji University, Shanghai 200092, China
2
China Shipbuilding NDRI Engineering Co., Ltd., Shanghai 200090, China
3
CNOOC Gas and Power Group, Beijing 100010, China
*
Author to whom correspondence should be addressed.
Energies 2024, 17(13), 3246; https://doi.org/10.3390/en17133246 (registering DOI)
Submission received: 6 June 2024 / Revised: 23 June 2024 / Accepted: 27 June 2024 / Published: 2 July 2024
(This article belongs to the Special Issue Advanced Energy Storage Technologies and Applications (AESAs))

Abstract

:
Due to the extensive utilization of liquid nature gas (abbreviated as LNG) resources and a multitude of considerations, LNG storage tanks are gradually transitioning towards smaller footprints and heightened safety standards. Consequently, underground LNG storage tanks are being designed and constructed. However, underground LNG storage tanks release a considerable quantity of cold into the ground under both accidental and normal conditions. The influence of cold results in the ground freezing, which further compromises the safety of the structure. Existing research has neglected to consider the effects of this. This oversight could potentially lead to serious safety accidents. In this work, a complete set of experiments using a novel LNG underground storage tank fluid-solid-thermal coupled cryogenic leakage scale model were conducted for the first time to simulate the effect of the tank on the soil temperature field, stress field, and displacement field and to analyze the development of the three fields and the results of the effect. This research helps the related personnel to better design, construct, and evaluate the LNG underground storage tanks to avoid the catastrophic engineering risks associated with cryogenic leakage and helps to improve the design process of LNG underground storage tanks.

1. Introduction

The world is striving to reduce the use of fossil fuels and increase the use of clean energy to achieve carbon neutrality or even zero carbon emissions as soon as possible. Liquefied natural gas (LNG) is a flammable and explosive fuel that is a very versatile and clean energy source. The temperature at which liquefaction of natural gas occurs is approximately −160 °C at standard room temperature. Liquefaction reduces the volume of natural gas by a factor of approximately 600, thereby rendering it more economical to ship and transport [1]. It possesses not only energy properties but also significant chemical potential, with a wide range of applications. This has attracted considerable interest from various countries and has become a key factor in the transformation of the global energy structure, with the potential to reduce carbon dioxide emissions and pollution [2]. The International Energy Agency (IEA) projects in the World Energy Outlook 2018 that LNG will supplant coal as the second-largest energy source in the global energy mix between 2030 and 2035. The share of natural gas in the global energy mix is anticipated to reach 25% by 2035 [3], while global demand for LNG is expected to continue to expand [4]. Also in the IEA 2023 report, we can see an unprecedented surge in LNG projects from 2025 onwards. Projects that have already started construction or received final investment by the IEA. CC BY 4.0. Executive Summary 21 decision include an additional 250 billion cubic meters of liquefaction capacity to be added annually by 2030, equivalent to nearly half of the current global LNG supply [5]. East Asian countries, especially China, need to import a large amount of LNG every year. LNG storage tanks, as an important structural facility for LNG storage and an important facility for LNG receiving terminals, will continue to be constructed and used in large quantities for some time to come to cope with the growing demand for LNG.
To facilitate the storage of imported LNG, the majority of LNG storage tanks are constructed along rivers, coastal areas, and on the surface [6]. However, only a select few countries, including Japan, have constructed a significant number of underground storage tanks [7,8,9,10]. In the context of the contemporary international landscape and the intensifying military conflict, LNG storage tanks, as strategic energy storage facilities, are highly susceptible to becoming targets of attack. Some scholars have collated data and attempted to mitigate the risk of catastrophic accidents by testing the tanks’ resilience to missile strikes [11,12] or the strength of aircraft impact [13]. Strengthening ground storage tanks is an inadequate response to the aforementioned issues. Although some scholars have attempted to store LNG liquids in caverns, with limited success [14,15], they also face the challenge of low-temperature leakage [15,16,17]. Consequently, there is a compelling rationale for shifting LNG storage tanks from aboveground to underground locations, to ensure the safety of energy facilities. In comparison to aboveground storage tanks, the advantages of LNG underground storage tanks are primarily manifested in the following ways: Firstly, they facilitate the conservation of land space, which is a significant advantage in the context of limited land availability. Secondly, they alleviate the challenge of siting road-type LNG receiving stations, which are often constrained by their limited scale. Thirdly, they offer enhanced resistance to explosion, impact, and vibration, which can mitigate the impact on the surrounding environment and enhance the safety of storage tanks.
Due to its safety and special application characteristics, there are high requirements for the design, construction, and installation of LNG storage tanks, which are mainly divided into single-capacity tanks, double-capacity tanks, membrane tanks, and full-capacity tanks according to the mechanical method of the supporting liquid and vapor confinement systems [11]. At present, large LNG storage tanks are mainly constructed as concrete full-capacity tanks. They mainly contain two mechanical supporting layers, and the structure is divided into three layers from the inside to the outside, with most of the inner tanks made of 9% nickel alloy steel, which is used to store low-temperature LNG liquids [18]. The middle layer is made of expanded perlite insulation to isolate the very low temperatures from propagating outward. The outer layer is a pre-stressed reinforced concrete structure that serves primarily to support the internal structure, maintain a vapor barrier, and protect the entire structure from the external environment. Together, the three layers form an integral, full-capacity tank structure. Although the overall structure is relatively intact, catastrophic accidents can still occur, such as the overfilling of LNG liquids [19], earthquakes causing LNG liquids to gush out of the inner tank [20], damage to the outer tank [21], and cryogenic liquids penetrating the internal nickel alloy steel, which can result in cryogenic leakage and the subsequent release of cold. If this occurs in underground storage tanks, it will result in the transfer of cryogenic temperatures to the soil and excessive cold input into the soil, which will lead to freezing and expansion of the soil, resulting in the destruction of individual tanks and jeopardize the safety of other structures in the tank complex.
The primary research focus for the low-temperature leakage problem of liquefied natural gas storage tanks is the investigation of the effects of leakage on the tank itself and on the external structure of the tank. This is essentially a problem of solving the coupled differential equations of multi-physical fields. However, due to the complexity of the geometry and boundary conditions, it is difficult to derive an analytical solution to the equations when the assumptions are difficult to determine. Consequently, the solution of such problems typically depends on numerical simulations and model tests.
Current research on the numerical simulation of LNG leakage conditions predominantly focuses on aboveground storage tanks. In the domain of temperature field research, Ye et al. [22] utilized a thermo-solid coupled numerical simulation model, established using FLUENT software, to analyze the leakage conditions of aboveground LNG storage tanks. In 2006, Yang et al. [23] employed LUSAS finite element software to construct a 200,000 m3 full-capacity LNG tank model, examining the effects of static force, wind load, modal analysis, seismic activity, temperature, leakage, and pre-stress on the tank structure. In 2010, Gorla [24] used the finite element code ALGOR to couple heat distribution with structural design and performed a stress assessment on critical tank structures to optimize design and maximize economic benefits. In 2012, Li et al. [25] used full-capacity tanks from a Chinese LNG receiving terminal to analyze the structure and heat transfer processes of the tank bottoms, walls, and tops. They calculated the temperature field distribution using ANSYS software. In 2018, Zhang et al. [26] employed ANSYS finite element simulation software to numerically simulate the temperature field of the top, wall, and bottom of a large-scale full-capacity LNG storage tank. The results indicated that the tank bottom had the poorest thermal insulation performance, necessitating design optimization of the bottom cooling layer. They also conducted a comparative analysis of the impact of different ambient temperatures and wind speeds on heat leakage from various tank parts, finding that changes in ambient temperature significantly affected wall heat leakage. In 2021, Chen et al. [27] concluded that the new 7% Ni steel met the technical specifications for LNG tanks and offered significant economic benefits, although the specific application in terms of cold preservation performance was not considered. These studies provide valuable insights into the processing of tank parameters and boundary conditions in 3D modeling of LNG storage tanks. However, they primarily address aboveground LNG storage tanks and do not reveal the temperature distribution in underground LNG storage tanks.
Regarding the temperature and seepage fields, literature on the influence of groundwater seepage on the temperature distribution of LNG tanks is sparse. Nevertheless, there are relevant studies on similar issues, such as those involving underground works constructed by the freezing method, where groundwater seepage impacts the temperature field and the formation of a frozen intersection circle. For instance, Marwan A. [28] addressed problems related to large seepage potentially prolonging freezing times or preventing the formation of a closed permafrost body. They proposed a thermo-hydraulic coupled finite element model combined with AOC technology to optimize tunnel freezing. Gao et al. [29] also used COMSOL software to analyze freezing and expansion temperature fields, illustrating the impact of external pressure on frozen wall cracking. There is limited research on the heat-fluid-solid coupling of underground LNG storage tanks, with studies primarily focusing on LNG liquid storage in caverns [30]. This area remains underexplored. Comparable projects offer some guidance; for example, Lai [31] proposed a coupled hydrothermal three-field model based on permafrost mechanics, heat transfer, and seepage theory, using finite element methods to analyze temperature field problems. Zimmerman et al. [32] investigated stress, temperature changes, and rock permeability during geothermal resource extraction, while Wilson et al. [33] studied flow, solidity, and heat in hard rock for nuclear waste storage. These studies indicate that the theoretical analysis of the heat-fluid-solid coupling between LNG underground tanks and the surrounding soil is highly complex, primarily relying on finite element software for simulation. There is a notable lack of research on modeling tests.
The overall structure of LNG storage tanks, with the exception of the dome structure, is situated underground. This implies that the overall structure is in contact with the soil and interacts with it. This interaction has a greater impact on structural safety due to the influence of geological hazards, including low-temperature earthquakes, and so on. LNG storage tanks are constructed in coastal and riverine areas with high groundwater levels, where the groundwater level fluctuates considerably due to the influence of tidal action and the tendency for seepage in various directions. This has implications for the structural safety of the tanks. The paramount concern in the design and construction of LNG underground storage tanks is safety. In light of the aforementioned challenges encountered during the design and construction of LNG underground storage tanks, it can be argued that this plays a negative role in the advancement of LNG underground storage tanks.
Consequently, the project takes the LNG underground storage tank and the surrounding soil environment as its research object. The project primarily focuses on the state and development law of the temperature field, stress field, displacement field, and seepage field of the soil in the stratum of the LNG underground storage tank under the joint action of the very low-temperature cold source and the seepage of the soil and the groundwater (moisture migration). Furthermore, the project aims to elucidate the freezing law of the soil in the vicinity of the tank, including the freezing range, the time required to form a stable freezing circle, and other pertinent laws. Based on the test results, patterns of freezing and expansion of the surrounding soil of LNG underground storage tanks are preliminarily revealed, which provides a reliable reference for the structural design and value selection of LNG underground storage tanks.
In Section 2, a project under construction is described, and a 1:500 scale-down is modeled by scaling the project to simulate the three-field variability characteristics of the soil mass. The exact steps of the experiment are fully described. In Section 3, the results of the experimental simulations are summarized. In Section 4, the results of the experiment are discussed. In Section 5, the full work is concluded, and future work is proposed.

2. Experimental Simulation

2.1. Model Test Design

The test adopts a freezing model chamber device, which mainly consists of five parts: freezing test chamber, freezing tank, freezing equipment, infiltration control system, and data acquisition system. The distribution law of infiltration, temperature, and displacement fields of the soil is analyzed with regard to the freezing equipment and the temperature effect of the storage tank.

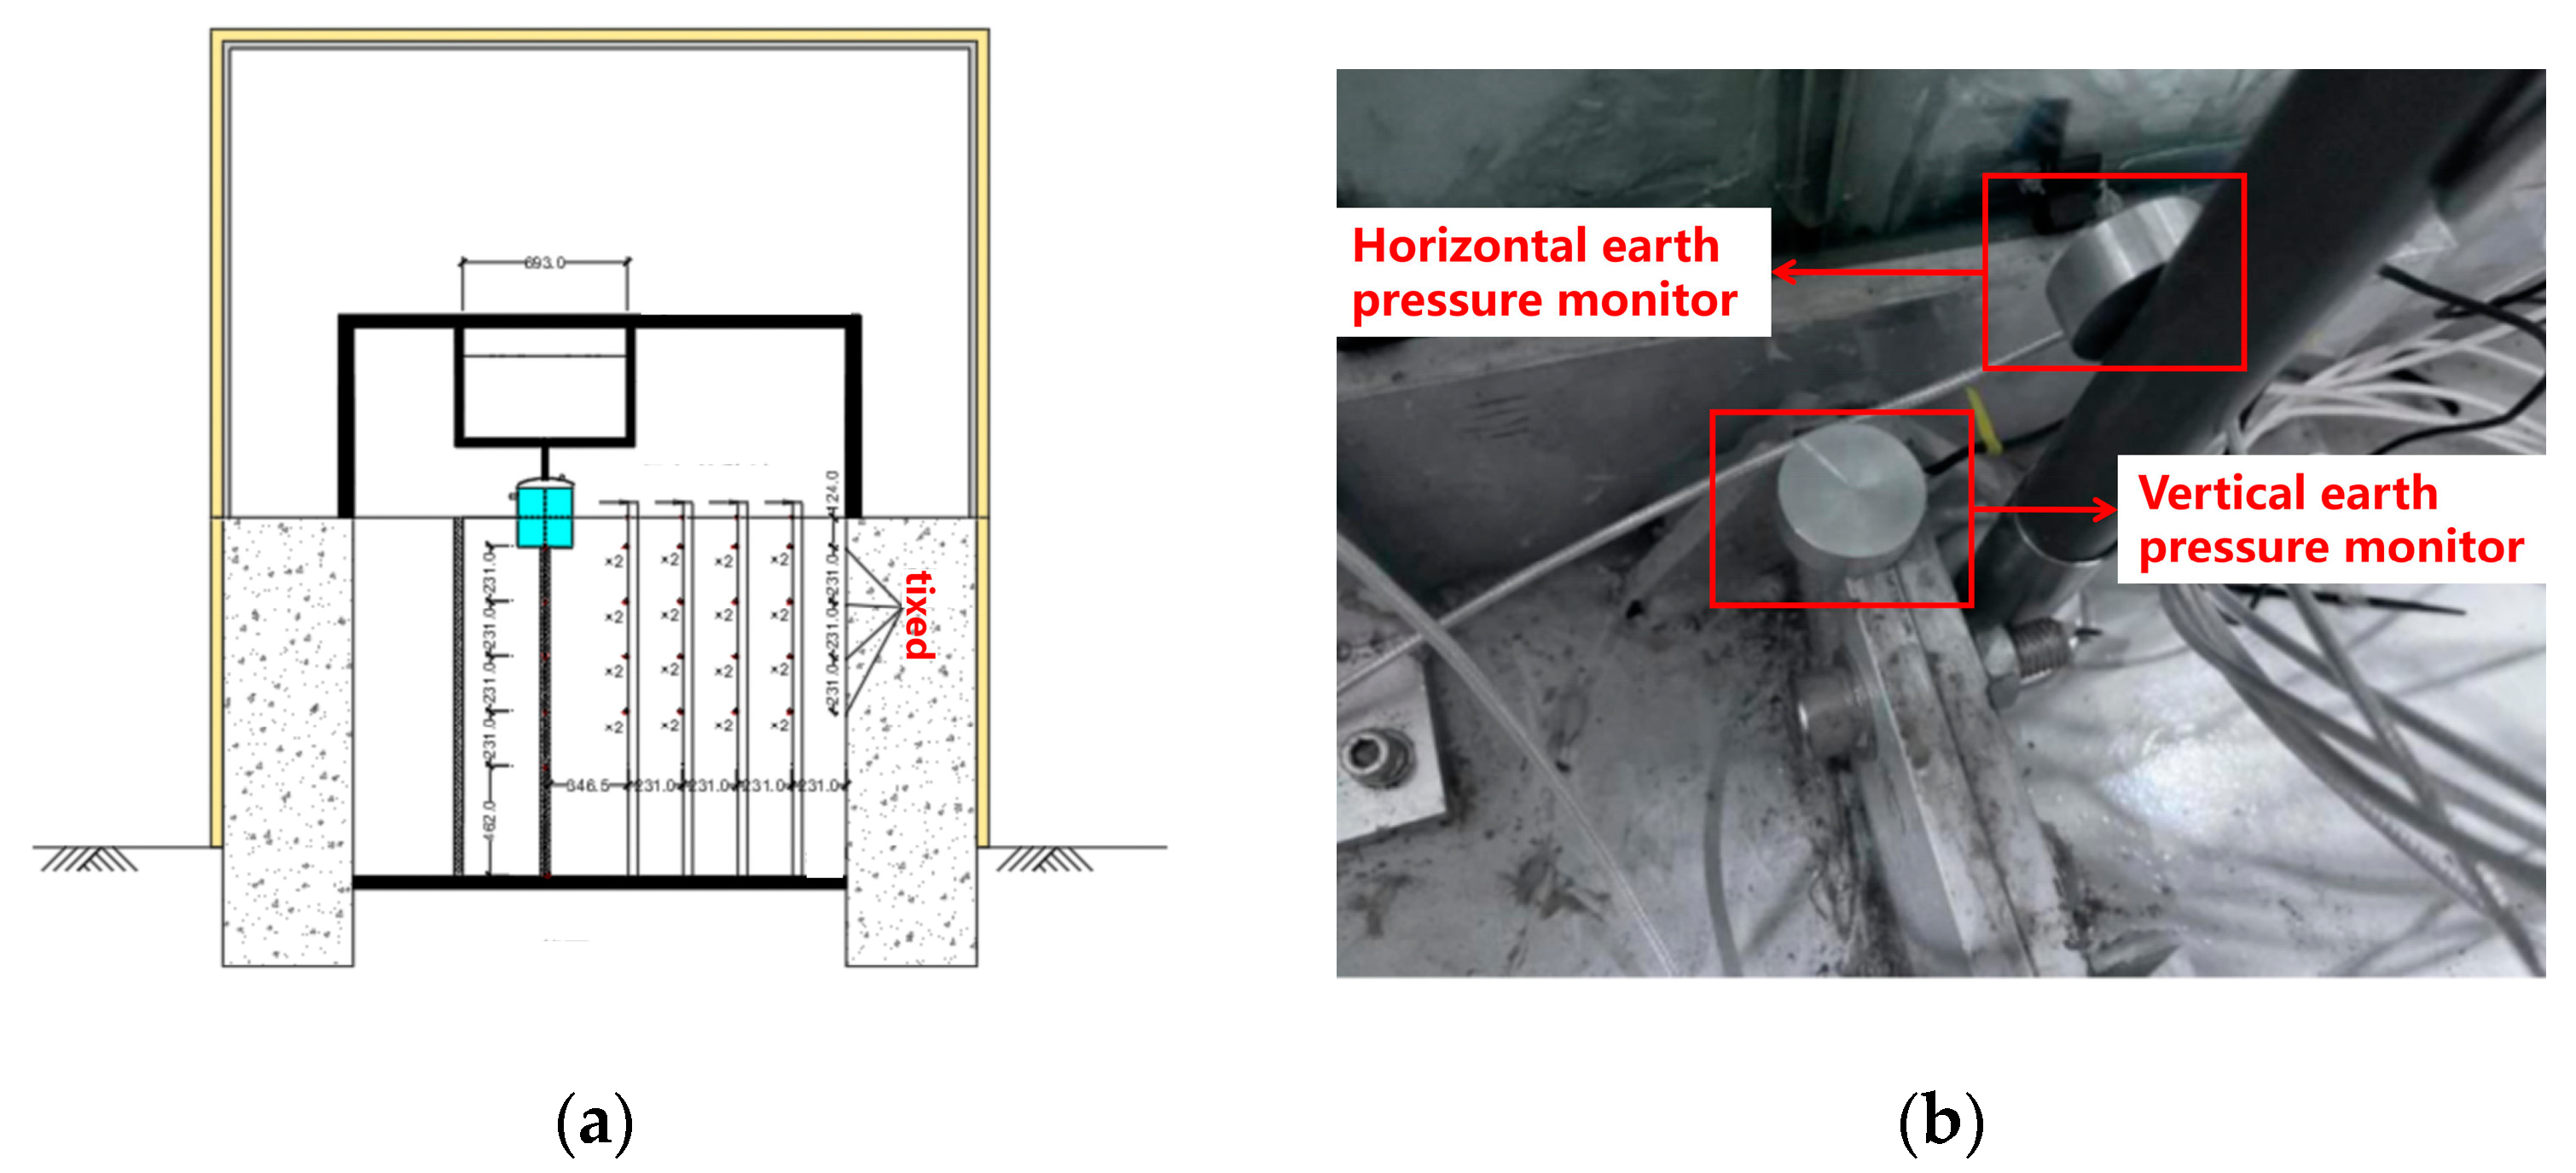
2.1.1. Overall Model of the Test Chamber

Combining the results of numerical simulation calculations, the size of the site, and economic benefits, the design of the subject model was scaled down to a scale of 1:500. The internal dimensions of the model test chamber are 3100.0 mm long × 2079.0 mm wide × 1386.0 mm high. The external dimensions are 4200.0 mm long × 3179.0 mm wide × 3886.0 mm high.
The design of the model chamber is shown in Figure 1, and the test chamber is divided into five layers from inside to the outside.
The first layer is the LNG tank layout area (white). The tank, with a diameter of 231 mm, provides a stable cold source; it is fixed above the test area by suspension, in close contact with the soil, to reduce the impact of the tank due to the freezing of the overturning skew.
The second layer is the soil setup area (yellow), which is also the main area of the test simulation and is divided into two parts: the upper half of the area is the same diameter of the tank to simulate the development of the temperature-stress-displacement field of the soil body as well as the deformation of the tank and the damage of the tank under the finite boundary conditions, while the lower half of the soil body is 5 times the diameter of the tank to simulate the infinite boundary conditions, which is contrasted with the upper half of the area. The two test areas are separated in the middle by a double-layer hollow high-strength glass plate to avoid mutual interference in the test areas.
The third layer is the water tank (green) area, which is connected to the soil as shown in Figure 1a. Four pipes (white holes in the water tank) are built in, and gauze is wrapped around the outside to prevent the soil from entering the pipes; by injecting water into the pipes, different liquid level heights are formed in the water tanks on both sides to create the phenomenon of water seepage in the soil and to simulate the relative stability of seepage flow field.
The fourth layer is a 550 mm thick concrete layer, which is used to isolate the external environment, inhibit heat conduction, radiation, and convection, and reduce energy loss and the influence of the external environment on the internal temperature. It also acts as an extension of the temperature field, increasing the range of the temperature field and reducing the effect of temperature boundary conditions due to possible undersizing.
The fifth layer is the thermal insulation material (yellow), comprising thermal insulation cotton and thermal insulation board; the experimental chamber is completely wrapped in the interior to further isolate the external environment, reduce the impact of air convection, and ensure the development of a stable internal temperature field. In addition, the test chamber has, along the periphery, 2.5 m high insulation board, allowing formation of the internal working environment, including control of the internal environment temperature and air pressure. The overall appearance of the test chamber is shown in Figure 1b.

2.1.2. Storage Tank Model

The actual structural parameters of the LNG storage tank are 92.4 m diameter of the outer tank, 49.6 m height of the outer tank, 1 m thickness of the outer tank, 1.0 m thickness of the cold-keeping layer, 88.4 m diameter of the inner tank, 45.7 m height of the inner tank, 4 m height of the dome edge, and 14.4 m height of the dome. This test was scaled down by the ratio of 1:500. To meet the test requirements, better simulate the freezing effect of the underground tank, ensure the stability of the liquid temperature, and avoid the fast transfer of cold, we used a test height that was twice the size of the actual height of the tank; dimensions are shown in Table 1.
The reservoirs share one inlet and four outlets: the inlet is located in the dome and is used to add coolant. There is a water outlet at 1/4 and 1/2 tank height, and the level can be adjusted by controlling the outlet switch at different heights to simulate the effect of different liquid levels in the tank. The reservoir model is shown in Figure 2.

2.1.3. Freezing Equipment

A cryostat reaction bath, also called a cryostat stirring reaction bath, as shown in Figure 3, can replace dry ice and liquid nitrogen to create cryogenic reactions or provide low-temperature conditions for related test equipment. The internal circulating pump can achieve the effect of a DLSB multi-purpose low-temperature coolant circulating pump. Industrial alcohol of 99% is used as the circulating fluid in this test, through the low-temperature thermostatic reaction bath cooled down to −40 °C, then transported to the LNG underground storage tank model. The tank liquid is transported back to the bath to form a cycle of the tank within the stable −40 °C temperature load. As shown in the figure, the magnetic stirrer is added at the bottom inside the cryostat reaction bath, and when the magnetic stirrer works, it allows the medium solution to flow inside the cryostat reaction bath, which in turn makes the temperature of the subject solution more uniform and the reaction more appropriate.

2.1.4. Seepage Control System

Water pipes are provided on both sides of the test chamber for water storage. Small, uniform holes in the water pipes allow the liquid in the tank to flow slowly into the chamber. Gauze is attached to the outside of the water pipe to prevent soil from entering the water tank and blocking the outlet or interfering with the level measurement. By setting different water level heights on either side of the chamber body, a water level differential is created to ensure a stable infiltration flow. The water tank uses a pressurized circulation pump as the seepage circulation device, and by fixing the pump port at the standard liquid level height, the liquid above the set level at the low water level is pumped out and circulated to the high water level input to ensure a stable liquid level difference. As shown in Figure 4 and Figure 5, the set liquid level difference for this test is 100 mm.

2.1.5. Data Acquisition System

To monitor the temperature, stress, and displacement of the soil, as well as changes in the level of the water tank, several measuring elements were used to measure different data. The data were read by a homemade integrated data acquisition instrument.
Several 20 mm diameter PVC tubes were buried at intervals in the chamber to secure the instrument and measure soil displacement, as shown in Figure 6. One end of the PVC tube was attached to the test chamber or the ground, while the other end was left free to form a cantilever-like structure. Due to the small diameter and low stiffness, the relative effect on the soil displacement disturbance is negligible.
To monitor the soil temperature, the test used a PT100 platinum resistance sensor as the temperature measurement element. The PT100 platinum resistance sensor length was about 40 mm, the largest diameter was about 12 mm, and the temperature range was −200 °C to 200 °C, with a tolerance of 0.1 °C. The temperature sensor measuring part was the platinum metal; we used platinum resistance temperature resistance characteristics (that is, the resistance value is the platinum’s resistance with the increase in temperature), through the measurement of resistance value changes in the deduction of the internal temperature of the soil body. The temperature sensor specific layout location is shown in the figure, along with the flexible PVC pipe equally spaced distribution arrangement. PT100 platinum resistance sensors are buried for measurement, to prevent soil freezing and expansion displacement resulting in temperature sensor movement. Rolling tape is used to tie in the PVC tube, as shown in Figure 7, to control the sensor tip position spacing.
To monitor the soil stress, a micro-strain earth pressure monitor was used as the measuring element. The outer part of the earth pressure monitor has a diameter of 28 mm, and a thickness of 10 mm, with a range of 0–10 MPa and an error of 50 kPa. The specific arrangement of the earth pressure monitor is shown in Figure 8b. As the earth pressure monitor is made of metal material, the stiffness is not the same as that of the medium, which is prone to the earth arching effect and stress concentration phenomenon, resulting in the deviation of the test data from the actual situation; thus, the earth pressure monitor is calibrated manually. The specific arrangement position of the monitor is shown in the figure; it is arranged at equal spacing along the distribution of flexible PVC pipes. Considering that the monitor needs a force surface, it was fixed to the PVC pipes inside the experimental tank. To reflect the multiplicative relationship between the freezing range and the diameter of the tank, the spacing was set to the design diameter of the tank, 231 mm. The horizontal earth pressure monitor was bonded directly to the PVC hose, and the vertical earth pressure monitor was bonded above the horizontal earth pressure monitor to form an earth pressure test set. To avoid inaccurate measurements due to uneven stresses on the surface of the earth pressure monitor, it was necessary to spread fine sand evenly over the surface of the earth pressure monitor before filling.
To monitor soil displacement, the test used a displacement meter as the measuring element. The range of the displacement meter was 0–100 mm. The displacement meter was placed outside the soil and connected to the PVC hose by a 4 mm diameter nylon rope. By measuring the displacement of the PVC hose, the total soil displacement was deduced. Due to the characteristics of the nylon rope, only the tensile displacement could be measured; it was necessary to judge the direction of the general displacement of the soil and to ensure that the nylon rope was taut, to avoid the relaxation of the nylon rope and, circumstances under which the displacement could not be measured. The installation diagram of the displacement meter is shown in Figure 6.
To monitor the liquid level height, the test used a magnetic levitation level gauge as the measuring instrument. The design range of the magnetic levitation level meter is 0–2000 mm, and the error is 0.5 mm. By laying vertical pipelines on both sides of the experimental tank, the pipelines are left with several small holes, which are connected with the external liquid level, while the outside of the pipelines are wrapped with fine gauze to prevent soil from entering the pipelines to interfere with the measurement of the liquid level. A magnetic level meter is set inside the pipeline, i.e., the level of the pipeline derived from both sides of the soil tank can be measured. As shown in Figure 4 and Figure 5, the liquid level changes on both sides are measured during a certain period, and the seepage volume and average seepage velocity during the period can be calculated by dividing the liquid level difference by the time.

2.2. Test Materials and Methods

2.2.1. Test Materials

The soil used in this test was yellow sand from Shanghai, China, taken from river sand; the raw soil was yellow, and the sieved sand was taken as the test material after sieving with a 0.6 mm aperture. The specific gravity of the soil particles is 2.67, the maximum dry density is 1.756 kg/m3, the diameter of the soil particles is less than 0.6 mm, and the test water is ordinary tap water.
The low-temperature cold source for this test is industrial alcohol with a density of 0.789 g/cm3, a freezing point of −114.1 °C, and a boiling point of 78.4 °C; it can better meet the low-temperature requirement, has good mobility, and can circulate well inside and outside the storage tank to provide a stable cold source.

2.2.2. Test Methods

As the soil boundary has an inhibiting effect on soil freezing and expansion, reducing soil displacement and increasing soil stress, two boundary conditions are considered when setting up the model chamber in this test:
Case 1, infinite boundary (5 times the theoretical boundary is used).
Case 2, finite boundary (1 time the theoretical boundary is used).
By analyzing the results of the two conditions, the influence of the boundary conditions on the development of the freezing temperature field of LNG storage tanks is compared.

2.3. Experimental Step

This test is aimed at the research content and research characteristics of LNG underground storage tanks under the action of fluid-solid-thermal coupling. The soil around the LNG underground storage tanks is taken as the main research object, and the stability fields of the soil are tested. To improve the reliability of the experiment, it is necessary to set up the soil body and the sensor monitoring instruments in the chamber according to a certain process, as shown below:
  • The natural sandy soil in Shanghai was chosen as the research material for this project, which was taken from the sandy soil extracted from a construction site in Shanghai. We took some small samples to determine the main physical parameters, as in Section 2.2.1 of this paper. The rest of the sandy soil was spread out in the sun on the ground to dry for 3 days; after obtaining dry sand, the sand was retained for backup.
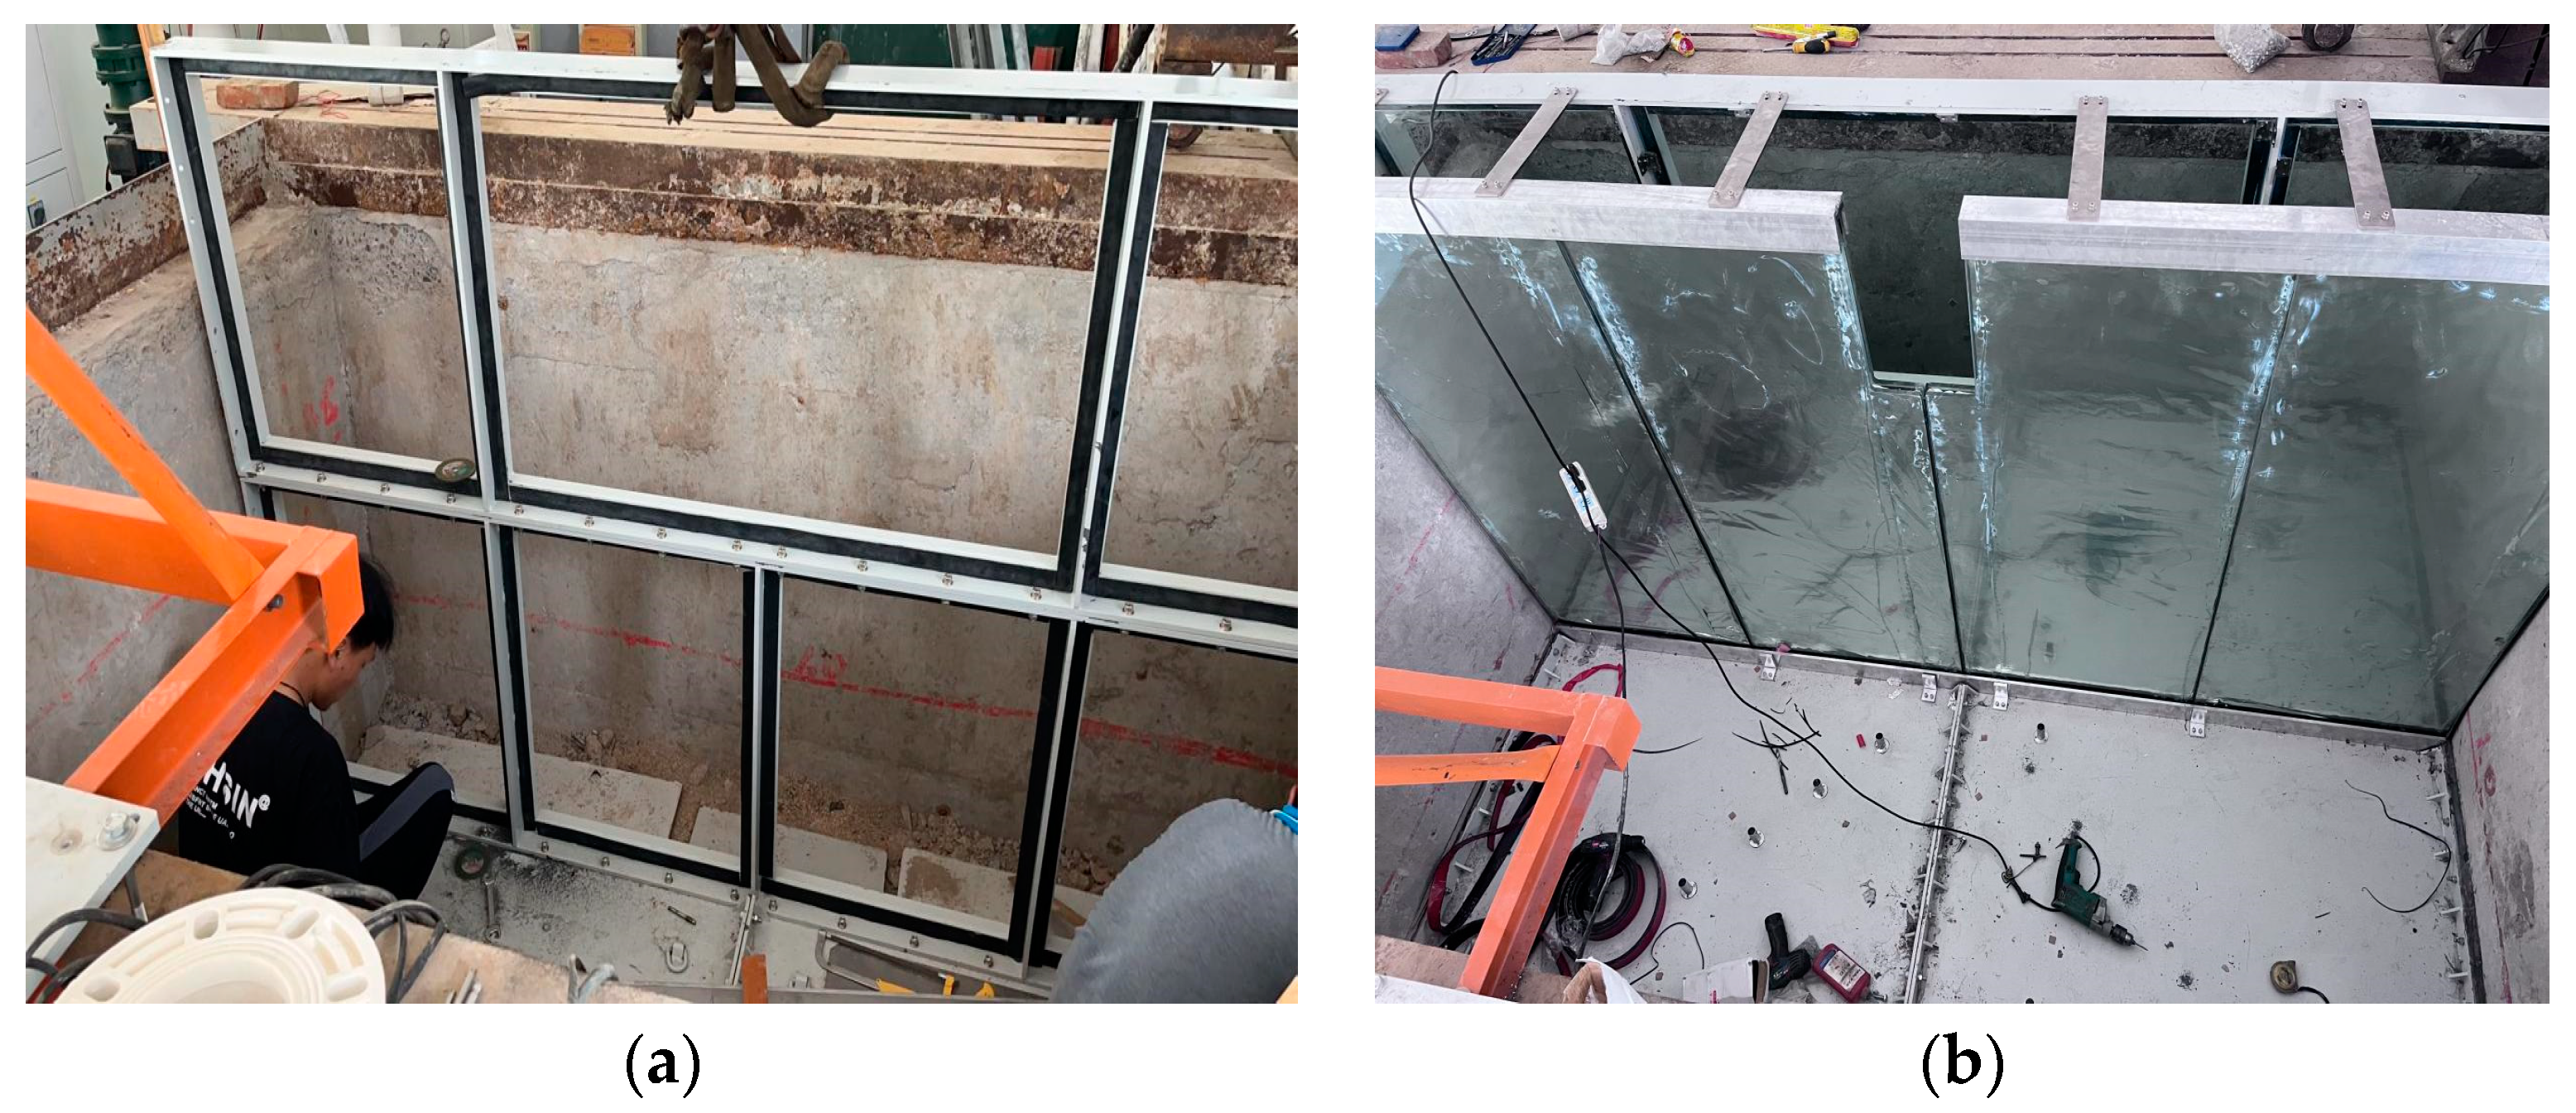
  • The main structure of the test chamber was built. The test chamber is shown in Figure 9.
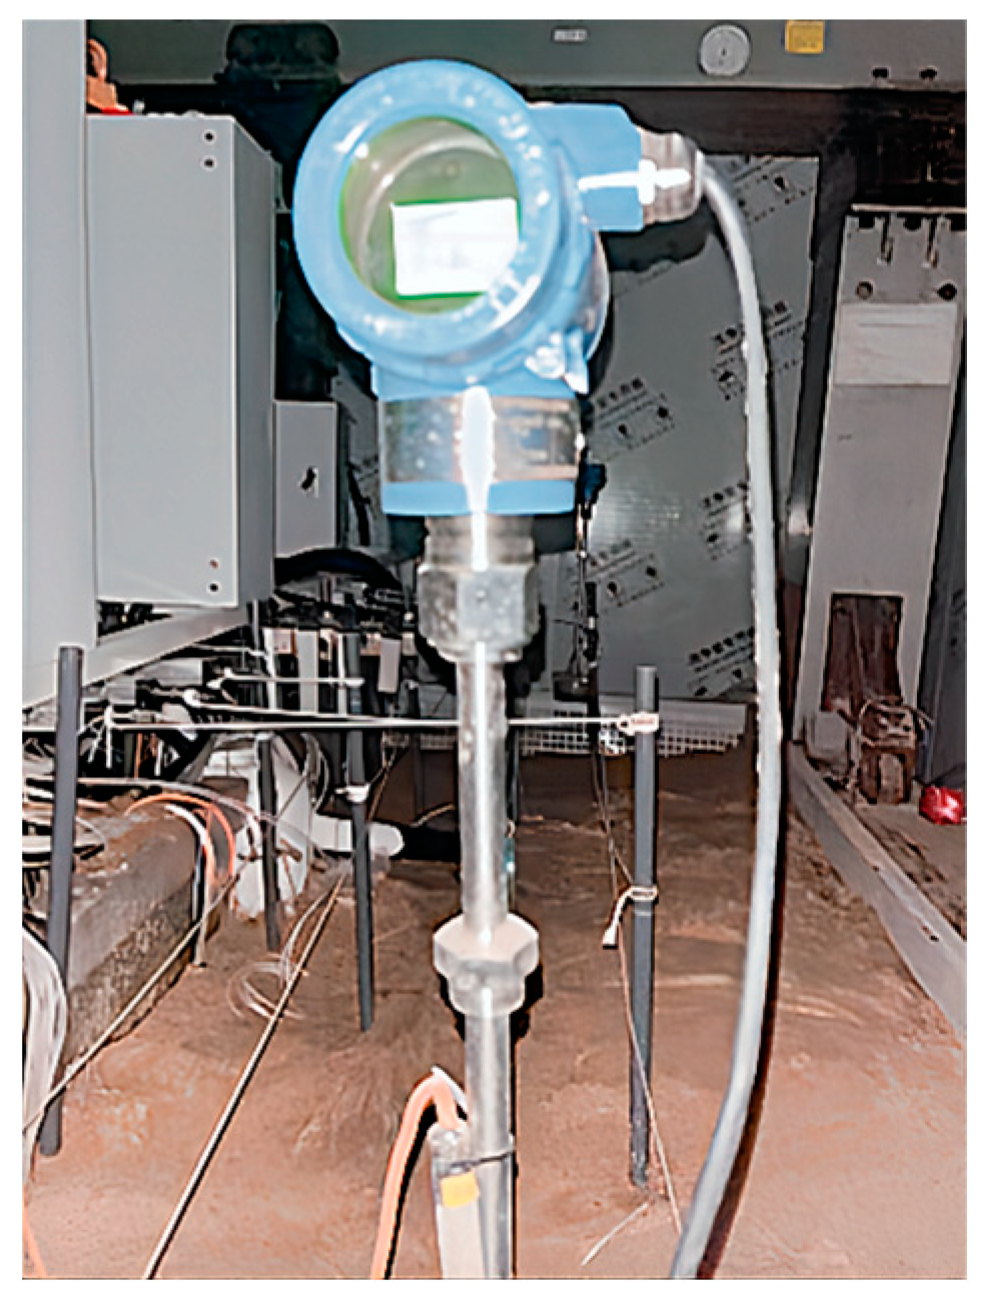
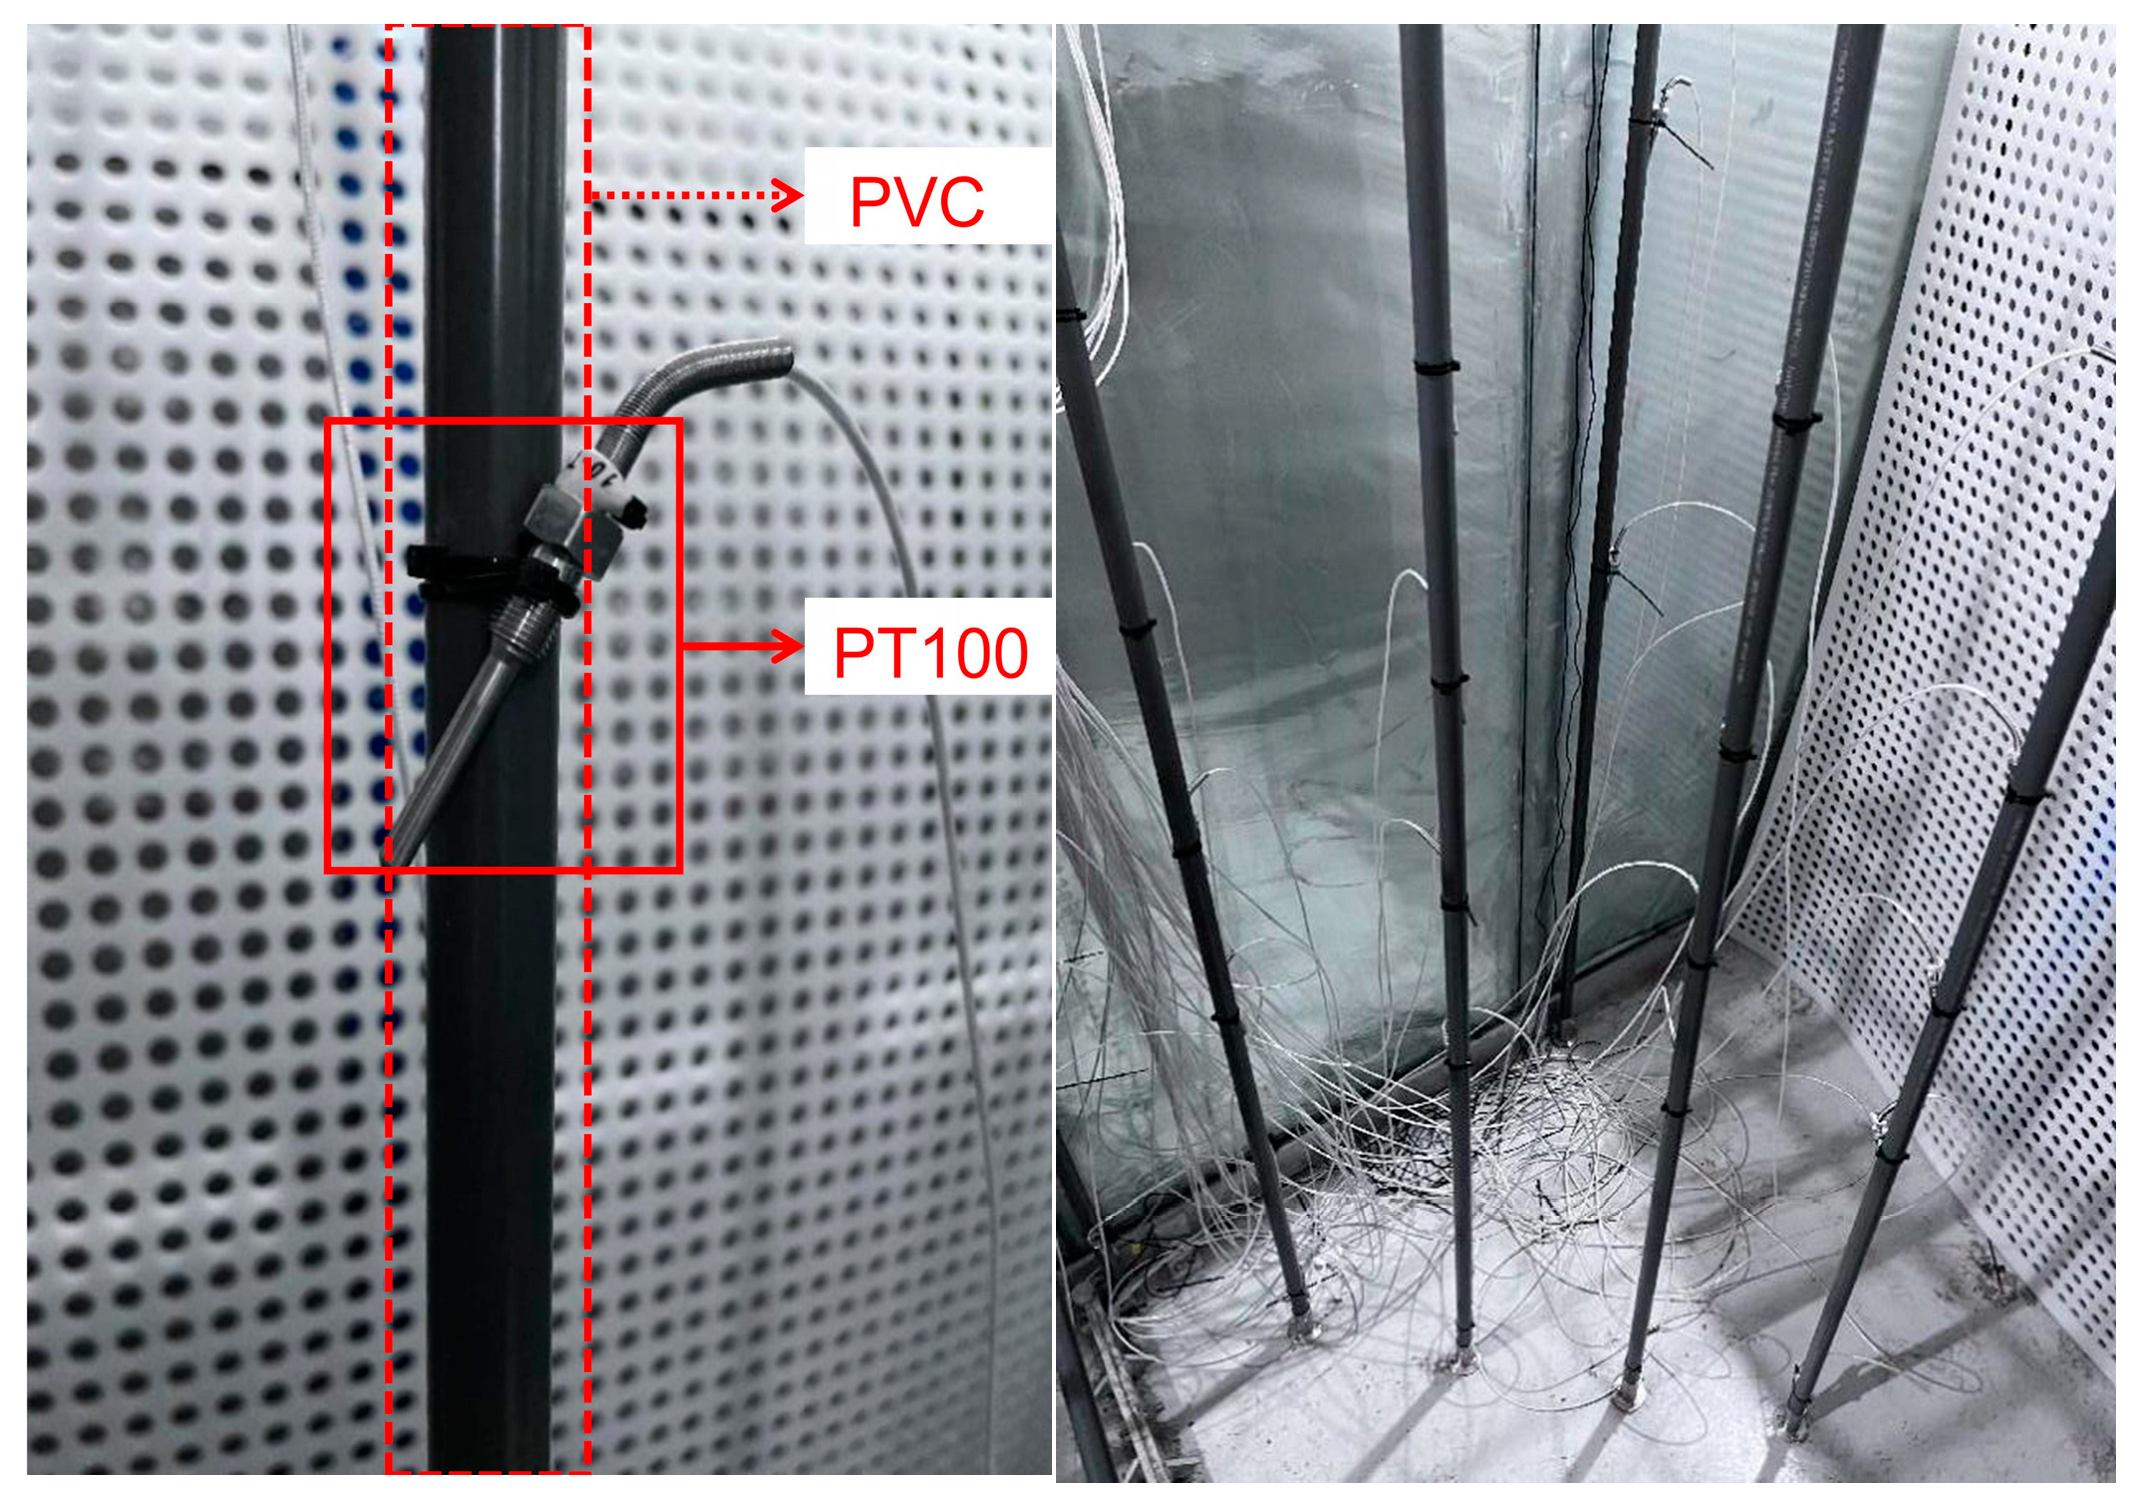
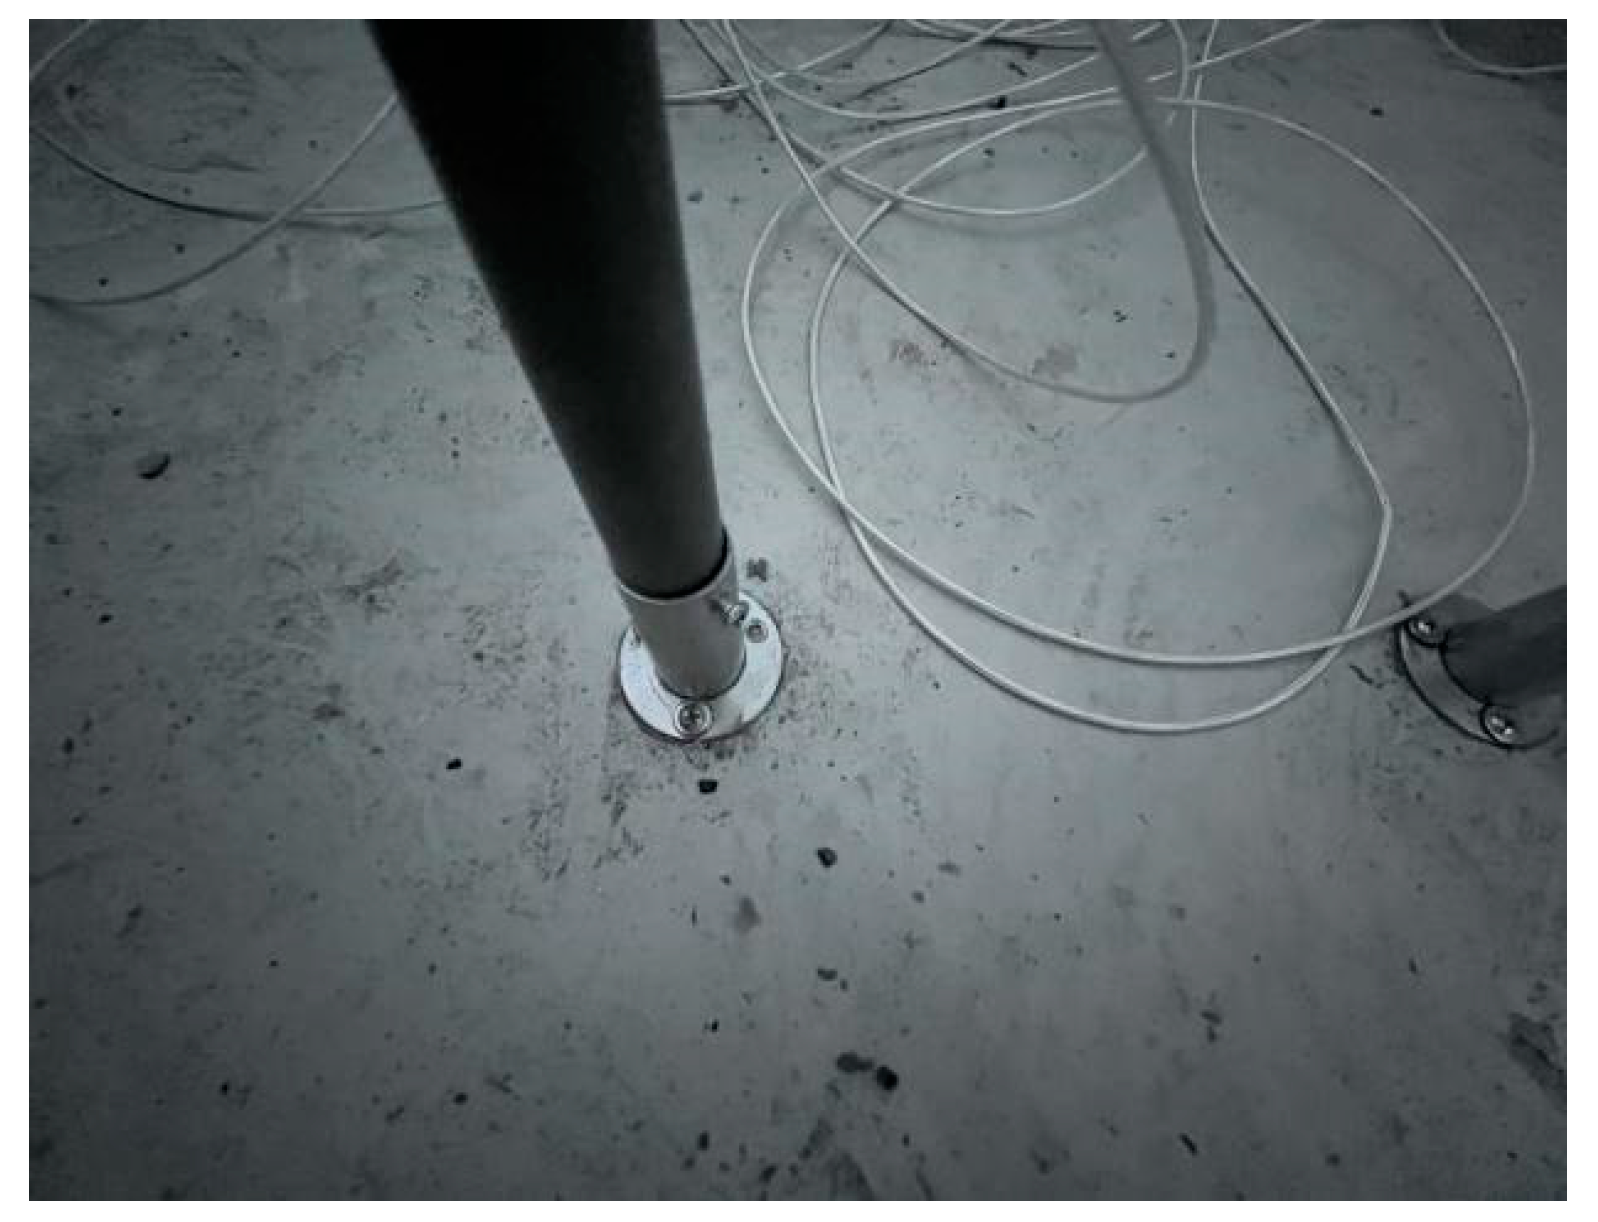
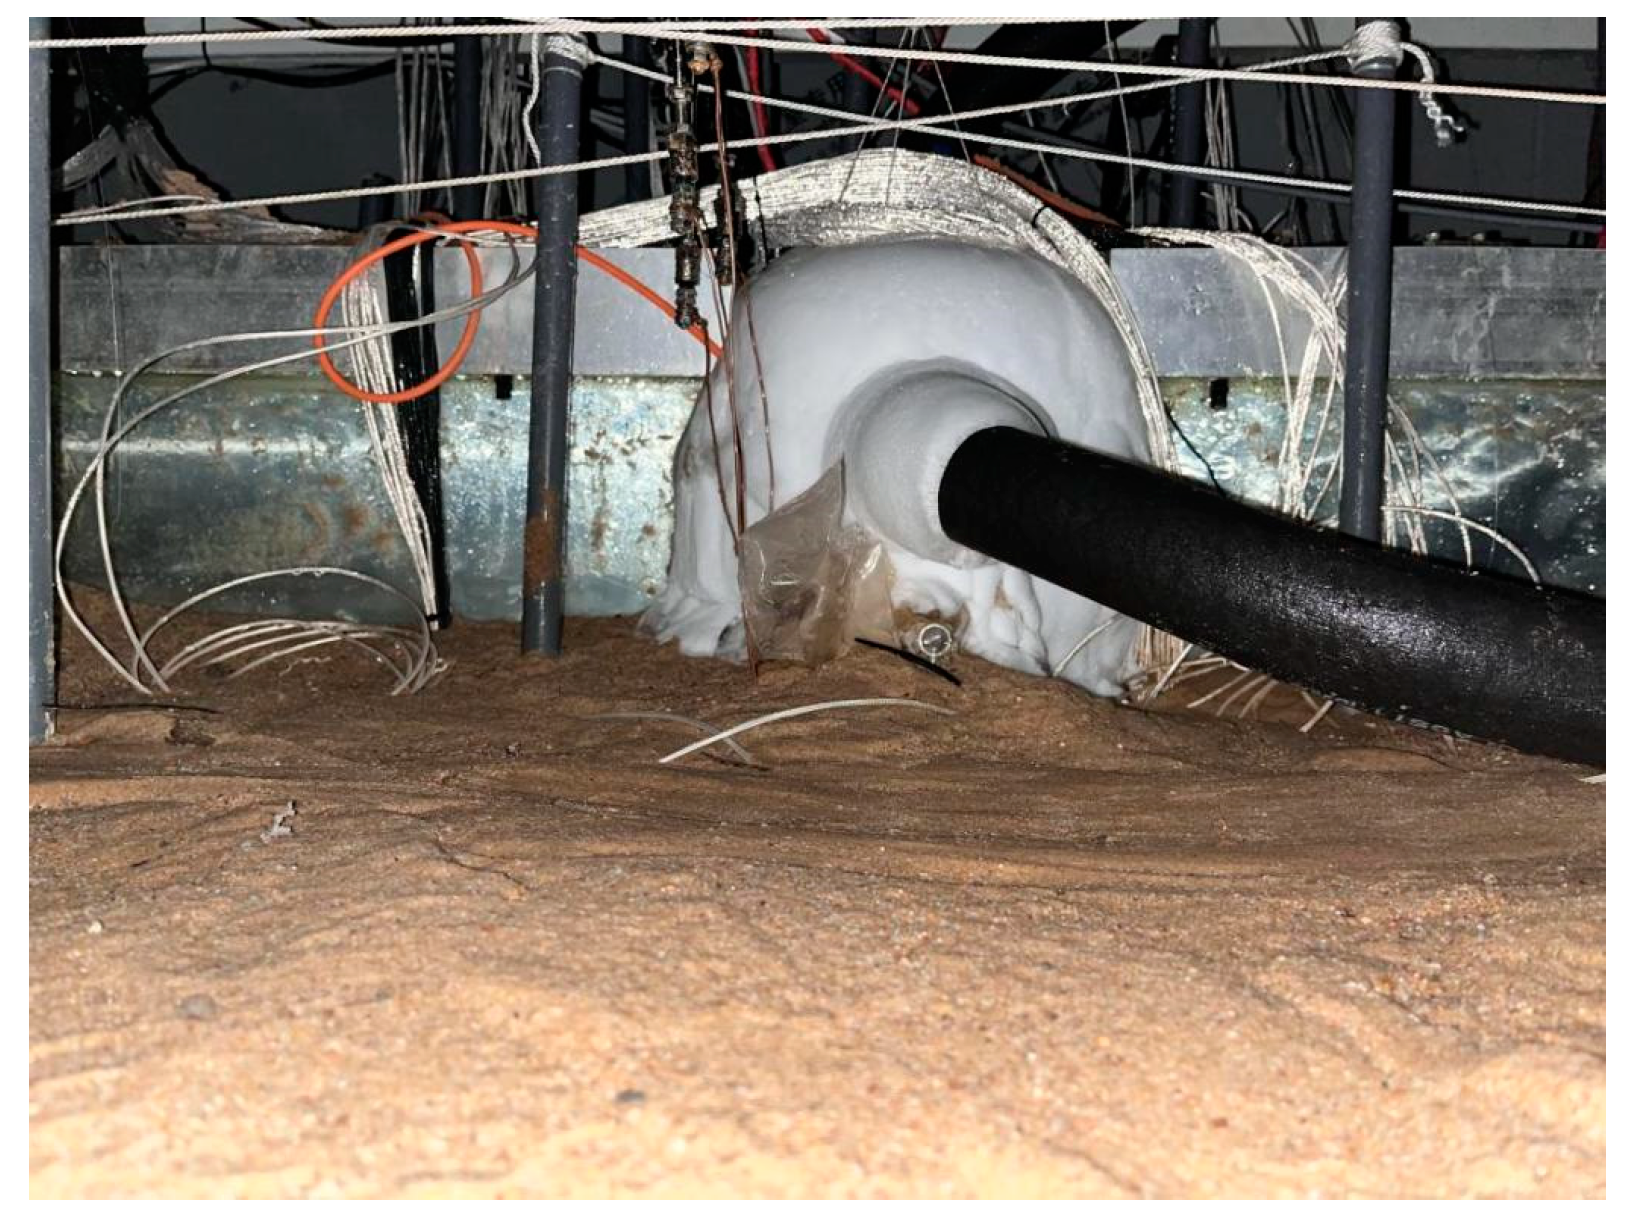
  • PVC hose was laid, with a magnetic level gauging the setup of the piping. The PVC hose was connected using anchors to the bottom of the test chamber, as shown in Figure 10. We used a porous plastic sheet to separate the tank area from the main experimental area. Fine gauze was used on the mouth of the pipe, to avoid sand loading in the pipeline interfering with the determination of liquid level height. In the middle of the experimental chamber body was double-layer glass plate and hollow space (such as Figure 9b) with suspended LNG tanks, such as shown in Figure 7. Rolling tape was used in the PVC tube for the PT100 platinum resistance temperature sensor. We used the lowest ground pressure sensor. The displacement sensor was fixed to the chamber in advance, using copper wire to connect the displacement sensor with 4 horizontal PVC hoses in the chamber for zero displacement of the sensor.
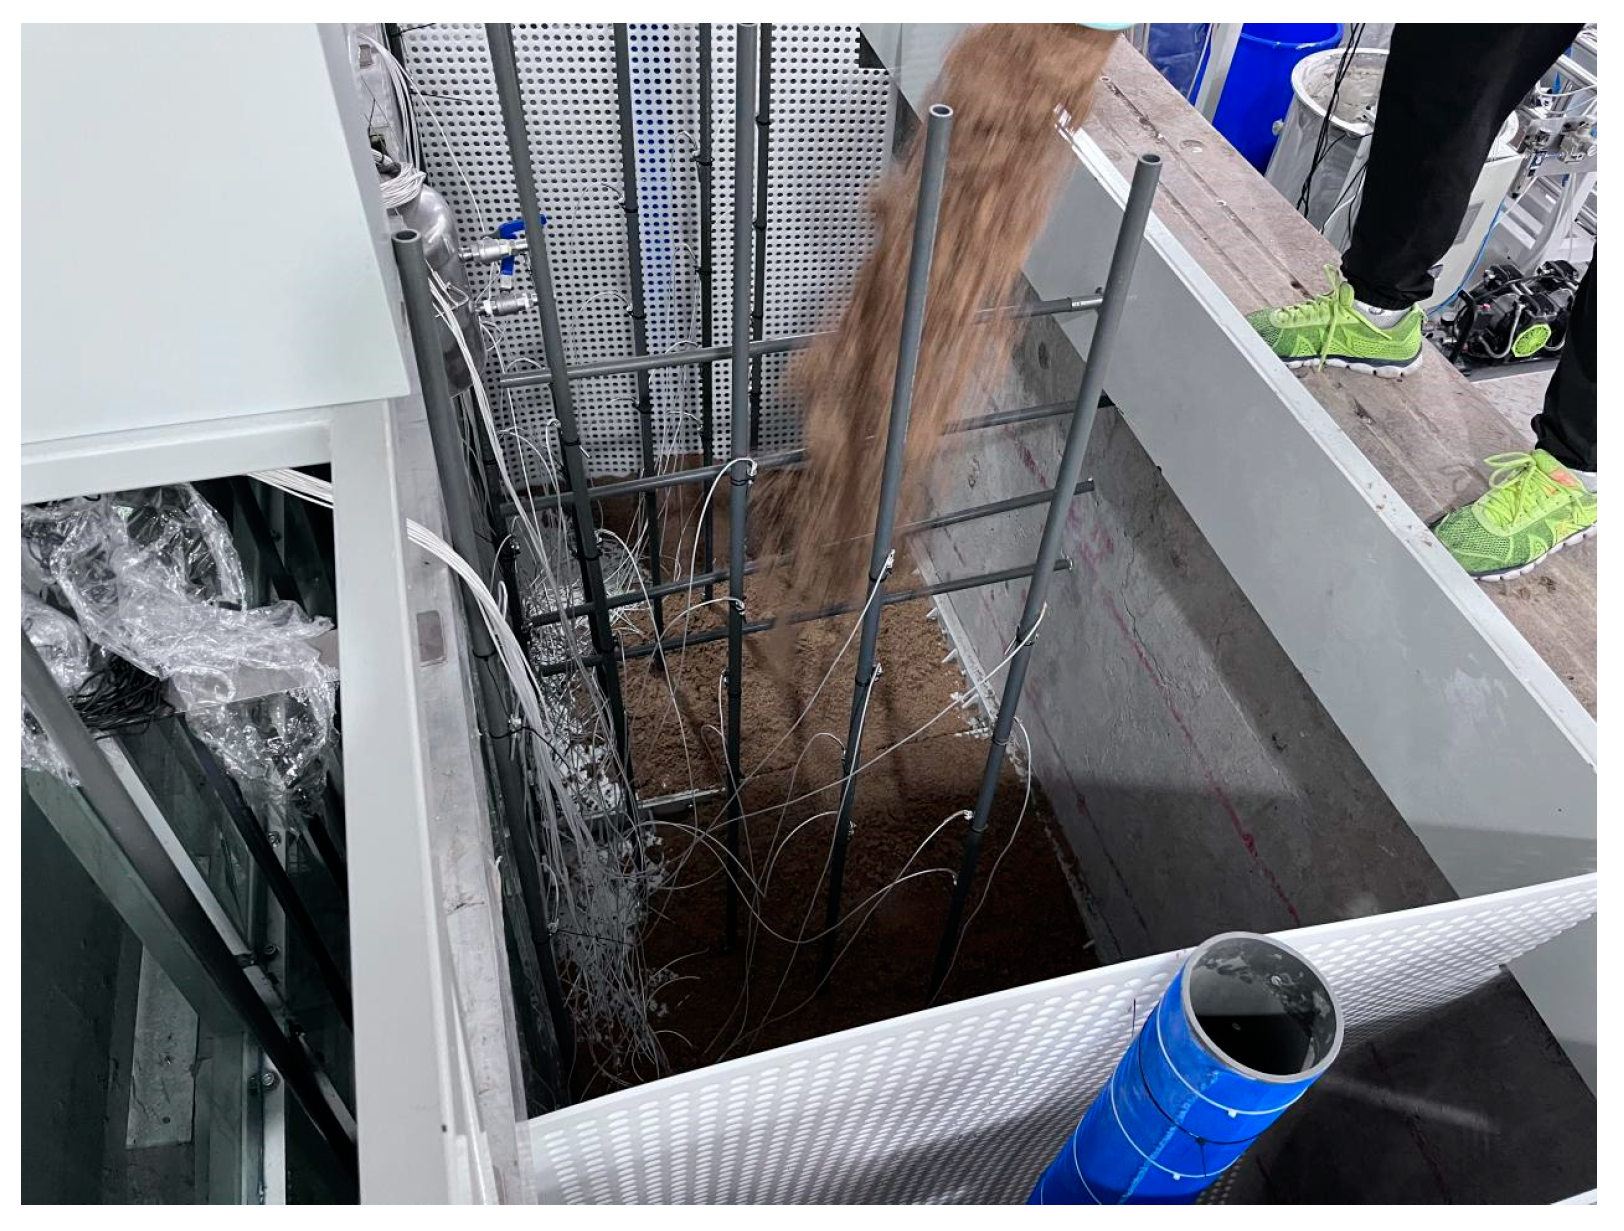
  • At the same time, for the soil loading (Figure 11) and earth pressure sensor layout, the loading soil height was equal to the height of the earth pressure sensor layout, in order to bury the earth pressure sensor as shown in Figure 12 We used AB adhesive to lay the earth pressure sensor on the PVC hose to ensure that the location of the measurement point was stable. Then, we finished filling the main part of the chamber. A low-temperature thermostatic reaction bath instrument and LNG storage tank with a rubber water pipe connected to the outer insulation layer were loaded with a tap water testing instrument; the storage tank was used to complete the cycle, cleaning up the circulating water, after the low-temperature thermostatic reaction drying treatment.
  • After the completion of soil filling and the use of nylon rope to connect the remaining displacement gauge and PVC hose, the length of the nylon rope was adjusted to ensure that the rope was in horizontally taut and could not immediately be pulled to disrupt the displacement gauge state. The displacement gauge and magnetic level gauge were set to zero, and the ambient temperature and humidity sensor was tied over the displacement gauge and tank. The ambient air pressure thermometer was attached.
  • Water was added to the tank once, through the magnetic levitation level meter pipeline, and the level meter readings were observed to ensure that about half the height of the chamber was filled with soil before stopping adding of the water. After the water was completely infiltrated into the chamber, pile loading was performed on the top layer of soil, using large cement blocks; the top layer of soil was completely covered to completely compact the soil. The displacement meter was observed, and when the value of the displacement meter of the PVC hose buried in the soil body did not change anymore, the pile load was removed.
  • The booster circulating water pump was assembled, and the connecting hoses on both sides were inserted into the magnetic level gauge setting tubes on both sides of the chamber to test the pump’s circulation function.
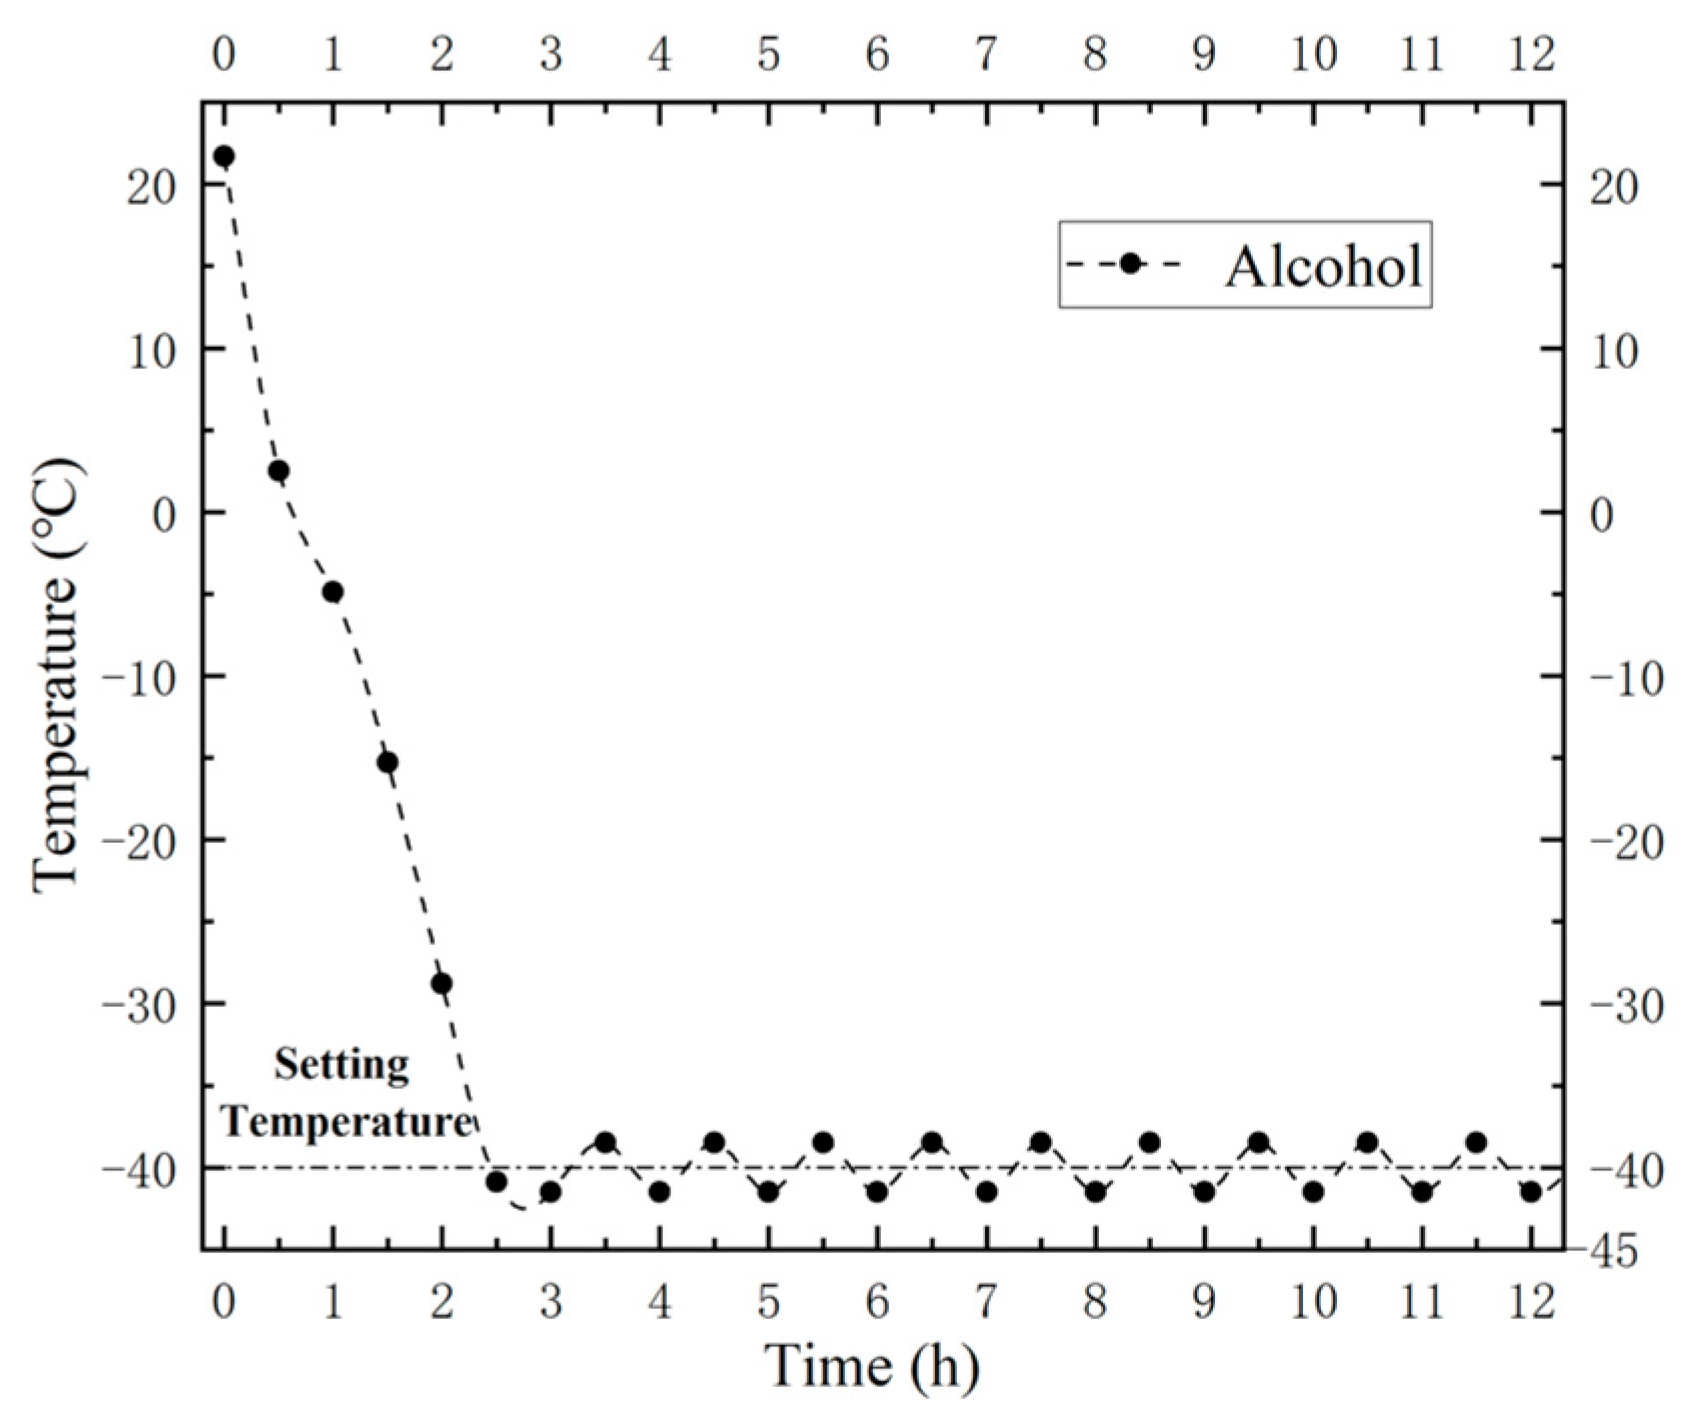
  • Then, 99% concentration of industrial alcohol was loaded into the low-temperature constant temperature reaction bath to test circulation performance, and the following tasks were completed: leveling the sand, cleaning the site of static test chamber, and closing the site. After all instruments in the test site have stabilized, the quiescent phase ends, and the test preparation phase is complete.
  • The tank level was set at 1/2 the tank height, i.e., open the valve at 1/2 the tank height and close the other valves. The freezing temperature was set to −40 °C, and the freezing time to 15 days.

3. Experimental Results

During the freezing process, this test observes the temperature field, displacement field, percolation field, and stress field of the soil body, while taking into account the temperature boundary conditions and environmental conditions. The results of the test are described below.

3.1. LNG Tank Temperature Boundary Conditions

The role of the cryostat stirring reaction bath in this test is to cool the alcohol liquid to −40 °C through the low-temperature constant temperature reaction bath; through the pressurized circulation device, the low-temperature alcohol liquid is conveyed into the LNG storage tank, and the relatively high-temperature liquid is output back to the low-temperature constant temperature reaction bath after circulation. The temperature of the transported liquid is controlled by predefined parameters set on the cryostat reaction bath control panel. The cryostat reaction bath is equipped with a temperature monitoring system that stops cooling when the temperature of the alcohol liquid reaches the set temperature and restarts cooling when the temperature of the alcohol liquid is higher than the set temperature, thus creating a cycle. To minimize the effect of this cycle on the test temperature boundary conditions, the addition of as much alcohol as possible increases the cold storage and reduces temperature fluctuations. It is also necessary in this mode to determine the temperature of the test circulating fluid and the cycle time of the cryostat reaction bath. Combined with the instrument’s temperature detection system and electronic thermometer, this test results in the following:
  • Cryostat reaction and cooling the liquid to low temperature needs a certain time, about 2.5 h;
  • The output temperature of circulating liquid is −39 °C to −41.5 °C, and the input temperature of circulating liquid is −37.5 °C to −39 °C;
  • The cycle of the circulating liquid is approximately 1 h, the test chamber will additionally cool the liquid to approximately −41.5 °C, and the instrument will operate again at approximately −38.5 °C.
As shown in Figure 13, this can be used to plot the temperature cycling curve during the freezing process.
In addition, this test pays special attention to the cryogenic liquid flow rate control, by controlling the circulating alcohol liquid tap switch size to control the liquid flow rate. To ensure the liquid in the LNG tank fully absorbs the cold and output, this test uses a measuring cup to measure the amount of circulating alcohol in 10 s to measure the exact circulating flow rate, and the flow rate is controlled to about 3 L/min. This setup can avoid excessive energy consumption while ensuring that the temperature boundary conditions remain stable. By effectively controlling the flow rate, the cooling process of the liquid in the LNG tank is more uniform and efficient, thus optimizing the efficiency of energy use. At the same time, the stable temperature boundary conditions provide more accurate and reliable data for our test, making the test results more meaningful.

3.2. Test Seepage Field Conditions

The test creates the percolation field by controlling the height difference of the liquid level. Specifically, the water distribution and pressure difference in the sandy soil is adjusted by changing the height of the liquid level of the water tanks on both sides of the test chamber, which in turn controls the infiltration process in the sandy soil; the test is designed to have a liquid level height difference of 100 mm.
During the test, a data acquisition instrument is used to automatically record the height of the liquid level in the magnetic level gauge every minute. On the first day, the infiltration rate of the infiltration field is calculated by infiltration under natural, unconstrained conditions, and from the next day, the water level difference between the two sides is stabilized by increasing the booster pump to form a stable infiltration field. The first day’s level measurements are shown in Table 2.
From the above table, it can be found that after about 16 h, the liquid level on both sides tends to stabilize, i.e., it is considered that the above seepage is completed in 16 h. The flow rate calculation formula is as follows:
V = a b Δ h
S = b h
v = V S
where a , b , Δ h are, respectively, the test chamber body length, width, and height; V is the liquid flow; S is the test chamber cross-sectional area; v is the seepage field flow rate. The seepage field can be calculated within the test chamber. The average rise of the low water level in the infinite boundary field is 52.77 mm, while in the limited boundary field, it is 24.49 mm. The water flow rate can be calculated within 16 hours using the chamber body length and width and the final liquid level rise height: the water flow rate in the infinite boundary field is 0.02078   m 3 , and in the limited boundary field, it is 0.02623   m 3 , that is 8.89 × 10 3   m / h The infinite boundary field water seepage velocity is calculated for the limited boundary field; the seepage speed is 4.13 × 10 3   m / h .
After the first day, there was a 100 mm difference between the high and low water level controls. Specifically, maglev level gauges 1 and 3 stabilized at around 1200 mm, while maglev level gauges 2 and 4 stabilized at around 1100 mm. The pumping cycle began on the second day using a booster pump, and the submersible seepage rate during the cycle was considered to be the same as the average flow rate on the first day.

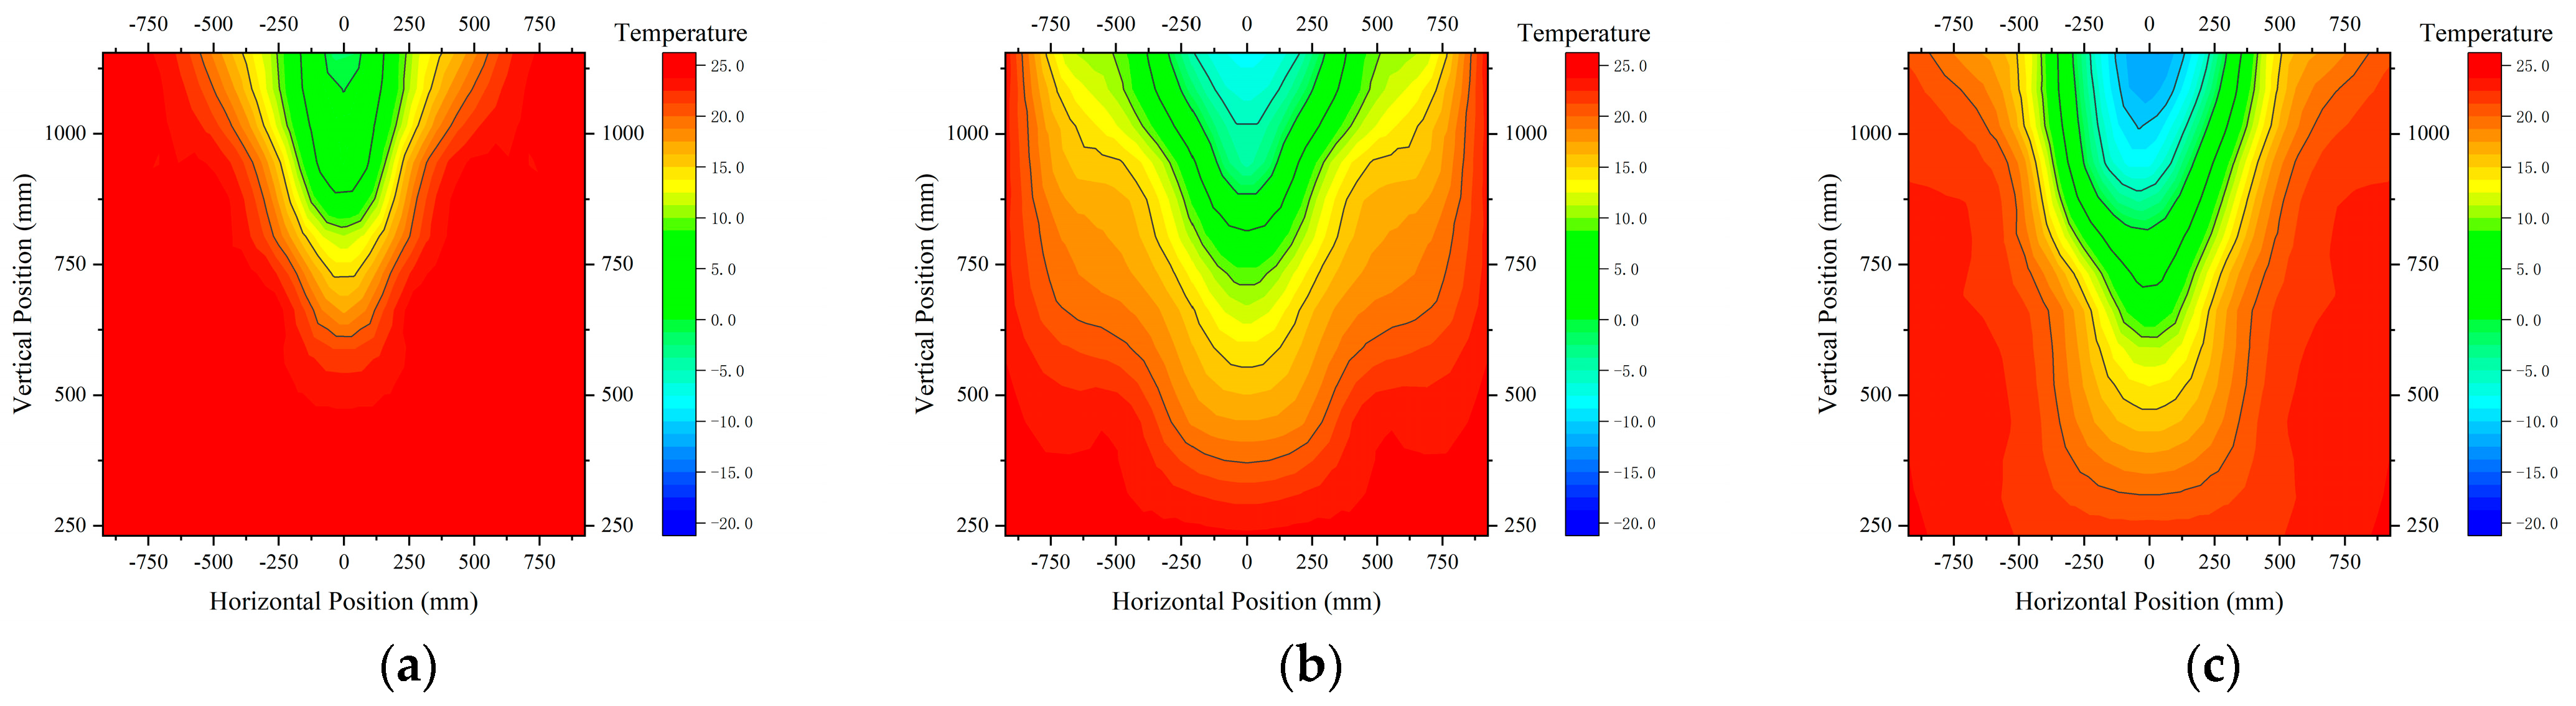
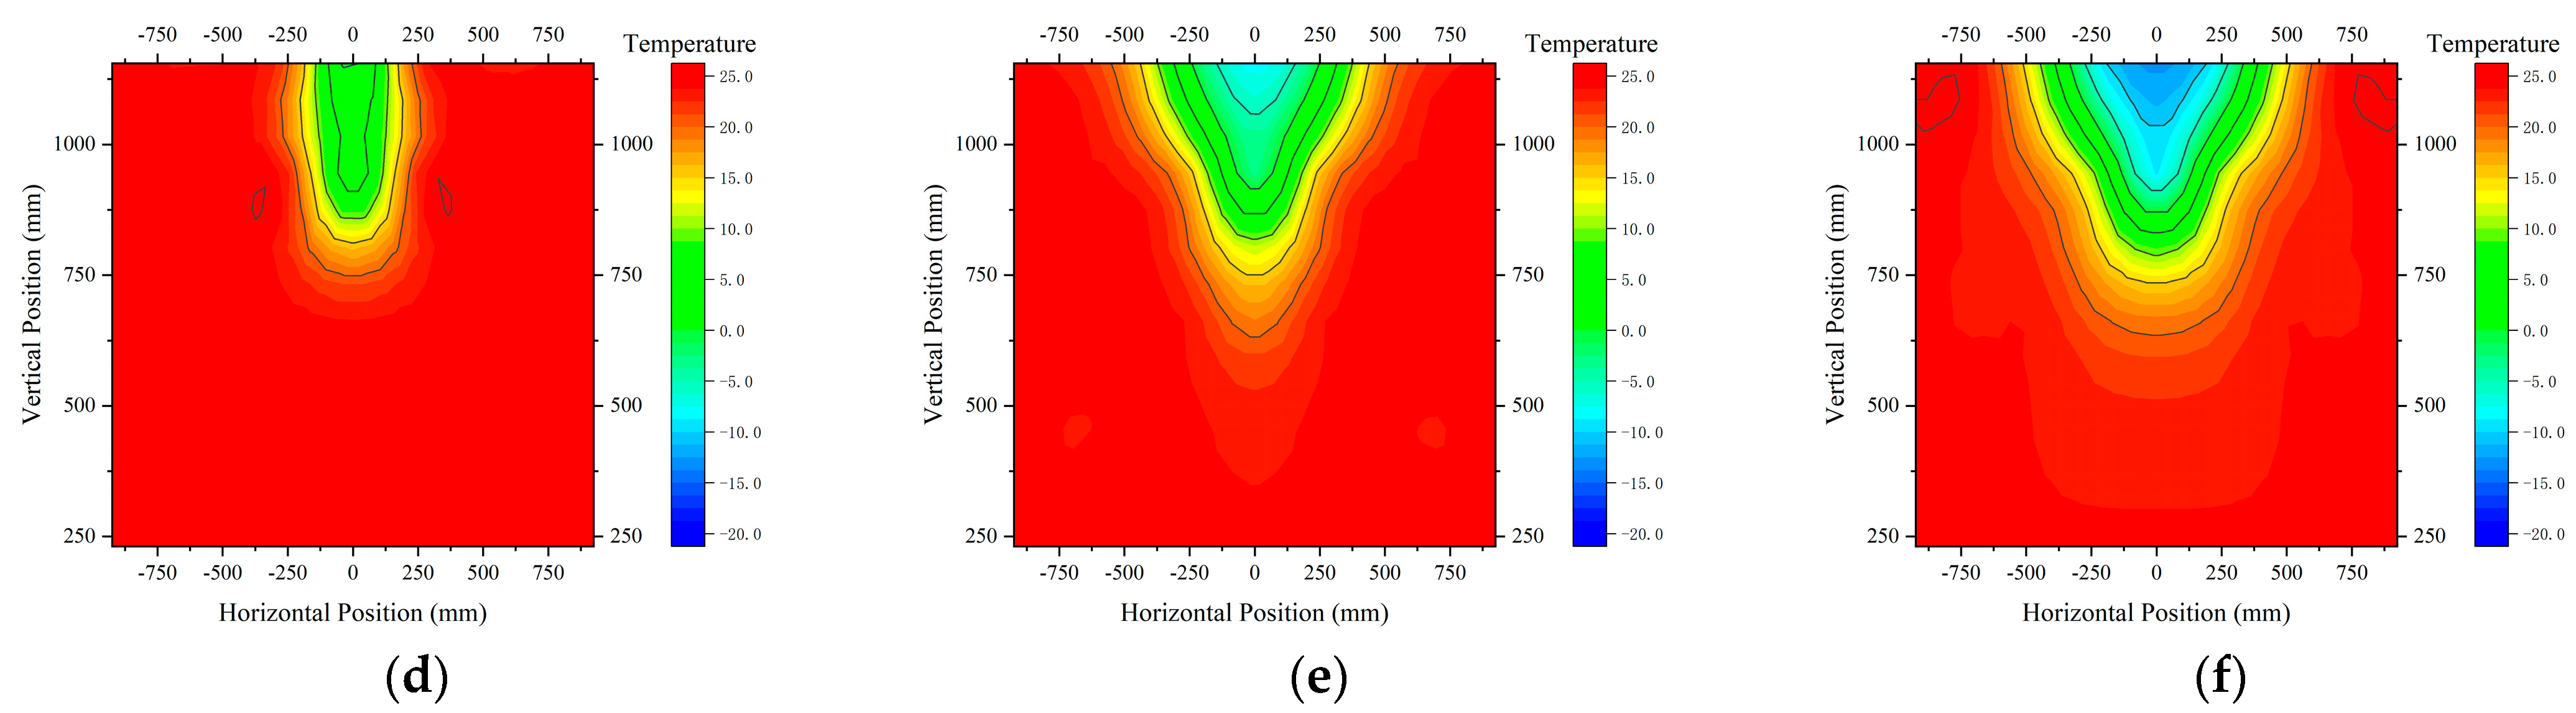
3.3. Temperature Field of the Soil

Temperature changes during soil freezing are caused by heat transfer. Heat transfer occurs when the soil body is in an unstable thermal equilibrium, causing heat to flow from the high-temperature zone to the low-temperature zone. In the process of soil freezing, heat is mainly transferred through three methods: thermal conductivity, convection, and radiation. During the process of soil freezing, radiation plays a minor role in heat transfer compared to thermal conductivity and convection. A PT100 platinum resistance temperature sensor was used to measure soil temperature in real time. The environment around the storage tank was completely frozen during the freezing process due to high ambient humidity, as shown in Figure 14.
The temperature cloud variation was plotted in Figure 15 by unfolding the PT100 thermometers arranged along a 45° angle to the horizontal plane.
The higher level is on the right side of the temperature field cloud, while the lower level is on the left side. The results indicate that the freezing field occurs mainly between the boundary of 1–2 times the diameter of the outer extension of the tank model. The temperature field is distributed along the seepage direction. The temperature drop is slower in the areas with high water levels than in the areas with low water levels. The temperature field in the freezing area stabilized on the 12th day, while the temperature field in the influence area was still trending. The lowest temperature recorded was −12.8 °C.

3.4. Soil Stress Field

Freeze-up of soil is the phenomenon of soil expansion due to moisture freezing during freeze–thaw, which results in the expansion of the soil body and generates a freezing and expansion force. It is important to note that this expansion is due to moisture migration and freezing. This occurs when moisture in the soil freezes and forms ice crystals, which are larger than water. As a result, the soil volume increases, causing deformation and damage. To prevent damage, it is necessary to take measures to prevent moisture from freezing in the soil.
This force can be influenced by various factors, including the composition of soil particles, the water content, the water table, and external environmental conditions. In laboratory environments, the freezing expansion force of fine-grained soils is generally believed to range from 0.1 to 0.5 MPa, while that of coarse-grained soils is likely to be smaller.
Freezing expansion of the soil in the upper half of the liquid level was measured using an earth pressure monitor buried in the soil. Horizontal and vertical frost heave of the soil was measured in both directions. Sandy soils generate horizontal and vertical stress fields due to their gravity. The earth pressure monitor is buried in the soil in a certain way so that the earth pressure monitor has an initial reading. In this test, the change in earth pressure is calculated in increments only, and the effect of the initial value is ignored. As shown in Figure 16, stress clouds were plotted for horizontal and vertical permafrost pressures.
After analyzing the data above, it can be concluded that the vertical freezing pressure of the soil is greater than the horizontal freezing pressure. The maximum vertical freezing pressure occurs within a range of 1 to 2.5 times the diameter of the storage tank, with a maximum value of 468.80 kPa. The pressure diffuses from the inside of the tank to its surroundings. During the freezing process, the horizontal maximum pressure in the tank extends outwards to a distance of three to four times the tank diameter, with a maximum value of 138.81 kPa. The pressure spreads outwards from the tank in all directions, causing the soil pressure concentration area to develop uniformly and continuously.
The maximum freezing pressure in the horizontal direction differs from that in the vertical direction. The analysis showed that the horizontal direction was constrained by concrete and a double glass partition throughout the freezing process, resulting in greater stress concentration near the wall. The upper surface was unrestrained, allowing the soil to freely develop vertically during frost heave. The maximum frost heave pressure was related to the frost heave temperature and soil displacement, resulting in varying locations of maximum frost heave pressures in both horizontal and vertical directions.

3.5. Soil Placement Field

If the stress field in the soil remains constant, freezing of water and the subsequent expansion of ice crystals during soil freezing will cause the soil to expand, resulting in soil displacement. This displacement is typically observed as horizontal movement, where the soil body moves in one direction. The magnitude of displacement caused by frost heave is influenced by various factors, including soil type, moisture content, and external conditions. Fine-grained soils are more susceptible to frost heave and displacement. If external conditions allow water to freeze freely, the displacement due to frost heave will increase. The placement of soil is shown in Figure 17.
Based on the results, it can be concluded that the soil body is affected by frost heave and experiences displacement within a range of one to two times the diameter of the storage tank. Outside this range, there is almost no displacement, indicating the absence of freezing and soil displacement. Furthermore, the freeze-up displacement is affected by the hysteresis effect of the horizontal seepage field, with the freeze-up effect being delayed at higher water levels compared to lower water levels. Additionally, the soil displacement in the vertical direction is more pronounced due to burial and compaction processes, resulting in higher initial readings on the soil displacement meter, which may affect the accuracy of the results. Soil displacements in the vertical direction were greater in areas with shallower burial depths and smaller in areas with deeper burial depths.

4. Discussion

The research objective of this project is to study the development of temperature, stress, and displacement fields in LNG underground storage tanks under the influence of seepage fields and low-temperature fluid-solid-thermal three-field coupling. The study investigates the design and testing methodology of the thermal-fluid-solid coupling scaling model for LNG underground storage tanks. It also examines the development of temperature, stress, and displacement fields resulting from fluid-solid-thermal coupling. The following are the specific conclusions:
This project analyzes the results of the LNG underground storage tank fluid-solid-thermal coupling test and draws the following conclusions:
  • The test sand seepage flow velocity field measurement results: for the infinite boundary field water seepage velocity, 8.89 × 10 3   m / h , and the finite boundary field seepage velocity, 4.13 × 10 3   m / h .
  • The temperature field distribution of the test sand soil body is developed with the storage tank as the core, and the outward freezing field mainly occurs in the range of one to two times the diameter of the storage tank extended outside the boundary of the storage tank model, which is consistent with the numerical simulation results. The temperature field is distributed in the direction of seepage. The decrease in temperature is slower in areas with high water levels compared to those with low water levels. The temperature field has a downward protrusion and an elliptical overall shape.
  • The stress field distribution of the test sand soil body: the horizontal maximum freezing pressure, and the vertical maximum freezing pressure appeared in different locations. It is analyzed that this is due to the boundary conditions of the test chamber. The freezing pressure exerted on the soil vertically is greater than the horizontal pressure. The maximum vertical freezing pressure occurs within a range of 1 to 2.5 times the diameter of the storage tank, with a maximum value of 468.80 kPa. The pressure direction is from the inside of the storage tank towards the surrounding area. During the freezing process, the horizontal maximum pressure in the tank extends outwards to a distance of three to four times the tank diameter, with a maximum value of 138.81 kPa. The pressure spreads outwards from the tank in all directions, causing the soil pressure concentration area to develop uniformly and continuously.
  • The distribution test of sand and soil displacement in the field: the storage tank boundary extends outward from one to two times the diameter range of the soil body. There is more obvious displacement within the diameter range of the soil body, while almost no displacement is observed within the two-fold diameter range of the soil body. Therefore, there is no obvious freezing and soil displacement phenomenon. Furthermore, the horizontal seepage field exhibits a hysteresis effect on freezing and expansion displacement, with the effect occurring later at higher water levels than at lower water levels. Soil displacement was greater in areas with shallower vertical burial depths, while areas with deeper burial depths experienced smaller soil displacement.

5. Conclusions

The research objective of this project is to study the development of temperature, stress, and displacement fields in LNG underground storage tanks under the influence of the seepage field and the coupled low-temperature fluid-solid-thermal triple field. The present study conducted a scale-down model test for the fluid-solid-thermal coupling of LNG underground storage tanks, in accordance with similarity theory. A design scheme for the scale-down model of LNG underground storage tanks was proposed, comparing the infinite boundary and the finite boundary, to provide a reference for subsequent related research. Furthermore, this article proposes various monitoring methods and control measures for the seepage, temperature, and stress fields. These measures can serve as a reference for monitoring the three fields of LNG underground storage tanks in real-world projects. Finally, the research summarizes the development laws of the temperature field, stress field, and displacement field.
At the same time, there are several unexplored problems in this test, which require further research. These include the following:
  • The earth pressure test only set up horizontal and vertical earth pressure monitors on the higher side of the liquid level, failing to form a comparison with the lower side of the liquid level. Therefore, further study is needed to conduct a relevant model comparison test.
  • The test soil is only selected from the natural fine sand in Shanghai, and the study fails to analyze the sand according to its proportions. A similar model of sand under the freezing temperature field needs to be further researched.

Author Contributions

This paper is a collaborative work by all the authors. Conceptualization, G.J. and P.L.; Data curation, G.J.; Funding acquisition, X.X.; Investigation, M.Z. (Meitao Zou); Methodology, G.J., X.X. and P.L.; Project administration, H.L.; Resources, X.X. and M.Z. (Mingrui Zhao); Supervision, X.X. and P.L.; Validation, M.Z. (Meitao Zou); Visualization, M.Z. (Meitao Zou); Writing—original draft, M.Z. (Meitao Zou); Writing—review & editing, G.J., X.X. and P.L. All authors have read and agreed to the published version of the manuscript.

Funding

This work was supported by the National Key R&D Program of China (grant Nos. 2023YFC3806701, 2023YFC3806702, 2023YFC3806705), the National Natural Science Foundation of China (grant Nos. 52038008; 52378408), the Science and Technology Innovation Plan of Shanghai Science and Technology Commission (grant No. 22dz1203004), and the State Grid Shanghai Municipal Electric Power Company (grant No. 52090W23000B).

Data Availability Statement

The original contributions presented in the study are included in the article; further inquiries can be directed to the corresponding authors.

Conflicts of Interest

Authors Guolong Jin and Hongqiao Li were employed by China Shipbuilding NDRI Engineering Co. Author Mingrui Zhao was employed by CNOOC Gas and Power Group, Beijing, China. The remaining authors declare that there are no business or financial relationships that could be perceived as potential conflicts of interest in this study.

References

  1. Sotoodeh, K. Chapter Two—LNG technology. In Cryogenic Valves for Liquefied Natural Gas Plants; Gulf Professional Publishing: Houston, TX, USA, 2022. [Google Scholar]
  2. Chen, H.; Yang, G.; Wu, J. A multi-zone thermodynamic model for predicting LNG ageing in Large cryogenic tanks. Energy 2023, 283, 128503. [Google Scholar] [CrossRef]
  3. Zheng, N. Natural gas will enter a golden age of development. Refin. Technol. Eng. 2015, 45, 41. (In Chinese) [Google Scholar]
  4. He, T.; Chong, Z.R.; Zheng, J.; Ju, Y.; Linga, P. LNG cold energy utilization: Prospects and challenges. Energy 2019, 170, 557–568. [Google Scholar] [CrossRef]
  5. IEA. World Energy Outlook 2023; IEA: Paris, France, 2023; Available online: https://www.iea.org/reports/world-energy-outlook-2023 (accessed on 27 October 2023).
  6. The LNG Industry Giignl ANNUAL Report. 2019. Available online: https://giignl.org/publications (accessed on 27 May 2019).
  7. Goto, S.; Nakano, M. Development and construction of the world’s first buried LNG underground tank. Concr. Eng. 1997, 15, 17–35. (In Japanese) [Google Scholar]
  8. Ibashiri, M. Concrete at cryogenic temperatures. Concr. Eng. 1979, 17, 20–23. [Google Scholar]
  9. Miyamoto, K. Study on rationalisation of design of reinforced concrete structures for LNG underground tanks. Proc. JSCE 1997, 4, 79–89. (In Japanese) [Google Scholar]
  10. Sato, Y.; Kobayashi, K.; Takagi, H.; Atsuhiro, F. Study on level 2 earthquake resistance of LNG underground tanks. Proc. JCI 2007, 29, 1009–1101. (In Japanese) [Google Scholar]
  11. Zou, D.L.; Sun, J.G.; Wu, H.; Hao, Y.F.; Wang, Z.; Cui, L.F. Experimental and numerical studies on the impact resistance of large-scale liquefied natural gas (LNG) storage outer tank against the accidental missile. Thin Wall Struct. 2021, 158, 107189. [Google Scholar] [CrossRef]
  12. Zou, D.L.; Hao, Y.F.; Wu, H.; Sun, J.G.; Xu, L.; Li, J.G. Safety assessment of large-scale all steel LNG storage tanks under wind-borne missile impact. Thin Wall Struct. 2022, 174, 109078. [Google Scholar] [CrossRef]
  13. Peng, Q.; Wu, H.; Zhang, R.F.; Fang, Q. Numerical simulations of base-isolated LNG storage tanks subjected to large commercial aircraft crash. Thin Wall Struct. 2021, 163, 107660. [Google Scholar] [CrossRef]
  14. Park, E.; Jung, Y.; Song, W.; Lee, D.; Chung, S. Pilot study on the underground lined rock cavern for LNG storage. Eng. Geol. 2010, 116, 44–52. [Google Scholar] [CrossRef]
  15. Lee, H.S.; Lee, D.H.; Kim, H.Y.; Choi, Y.T. Design criteria for thermo-mechanical stability of rock mass around lined rock cavern for underground LNG storage. Tunn. Undergr. Space Technol. 2006, 21, 337. [Google Scholar] [CrossRef]
  16. Cha, S.; Lee, K.; Bae, G.; Lee, D.; Gatelier, N. Analysis of rock drainage and cooling experiments for underground cryogenic LNG storage. Eng. Geol. 2007, 93, 117–129. [Google Scholar] [CrossRef]
  17. Jung, Y.; Park, E.; Chung, S.; Kim, H. Coupled hydro-thermal modeling of ice ring formation around a pilot LNG cavern in rock. Eng. Geol. 2011, 118, 122–133. [Google Scholar] [CrossRef]
  18. Kim, J.H.; Lee, M.; Jang, W.; Lee, J. Strain behavior of very new high manganese steel for 200,000 m3 LNG cryogenic storage tank. Energy 2023, 271, 126889. [Google Scholar] [CrossRef]
  19. Duan, Z.; Xue, H.; Gong, X.; Tang, W. A thermal non-equilibrium model for predicting LNG boil-off in storage tanks incorporating the natural convection effect. Energy 2021, 233, 121162. [Google Scholar] [CrossRef]
  20. Zhang, Y.; Du, Z. Seismic Response Analysis of LNG Storage Tank under Fluid Structure Coupling Condition. Henan Technol. 2022, 40, 875–885. (In Chinese) [Google Scholar]
  21. Trainor, M. Celebrating the centenary of the health and safety laboratory: Enabling a better working Britain. Process Saf. Environ. Prot. 2011, 89, 353–359. [Google Scholar]
  22. Ye, Z.; Zhang, Z.; Jing, H. Technology on Leakage Monitoring and Analysis of LNG Storage Tank. Energy 2021, 233, 121162. [Google Scholar] [CrossRef]
  23. Yang, Y.M.; Kim, J.H.; Seo, H.S.; Lee, K.; Yoon, I. Development of the World’s Largest Above-Ground Full Containment Lng Storage Tank. In Proceedings of the 23rd World Gas Conference, Amsteradam, The Netherlands, 5 June 2006. [Google Scholar]
  24. Rama Subba Reddy Gorla. Probabilistic analysis of a liquefied natural gas storage tank. Appl. Therm. Eng. 2010, 30, 2763–2769. [Google Scholar] [CrossRef]
  25. Li, H.; Xu, J.; Li, Z. Calculation and analysis of temperature field of full-capacity LNG storage tank. Nat. Gas Pet. 2012, 30, 15–19+97–98. (In Chinese) [Google Scholar]
  26. Zhang, L.; Fang, J.; Ke, S. Analysis of heat leakage from large full-capacity LNG storage tank. Cryog. Supercond. 2018, 46, 21–27. (In Chinese) [Google Scholar] [CrossRef]
  27. Chen, K.L.; Xi, L.Y.; Xie, Z.L.; Wu, J.P.; Fang, W. Development of new 7%Ni steel for LNG storage tanks. Oil Gas Storage Transp. 2021, 40, 1181–1186+1200. (In Chinese) [Google Scholar]
  28. Marwan, A.; Zhou, M.M.; Abdelrehim, M.Z.; Meschke, G. Optimization of artificial tunneling in the presence of seepage flow. Comput. Geotech. 2016, 75, 112–125. [Google Scholar] [CrossRef]
  29. Gao, J.; Feng, M.; Gao, Q. Analysis of heat-fluid-solid (THM) coupling for freezing construction of metro contact channel. Glacial Permafr. 2013, 35, 904–912. (In Chinese) [Google Scholar]
  30. Khaledi, K.; Mahmoudi, E.; Datcheva, M.; Schanz, T. Stability and serviceability of underground energy storage caverns in rock salt subjected to mechanical cyclic loading. Int. J. Rock Mech. Min. 2016, 86, 115–131. [Google Scholar] [CrossRef]
  31. Lai, Y.; Wu, Z.; Zhu, Y.; Zhu, L. Nonlinear analysis of temperature field, seepage field and stress field bogey problem in cold tunnel. J. Geotech. Eng. 1999, 21, 529–533. (In Chinese) [Google Scholar]
  32. Zimmerman, R.W. Coupling in Poroelasticity and Thermoelasticity. Int. J. Rock Mech. Min. Sci. 2000, 37, 79–87. [Google Scholar] [CrossRef]
  33. Wilson, C.R.; Witherspeon, P.A. Steady State Flow in Rigid Networks of Fractures. Water Resour. Res. 1974, 10, 328–335. [Google Scholar] [CrossRef]
Figure 1. Test chamber: (a) design of the chamber; (b) photo of the chamber.
Energies 17 03246 g001
Figure 2. Storage tank model.
Energies 17 03246 g002
Figure 3. Freezing equipment (cryostat reaction bath. And the Chinese characters in the picture show the equipment number and the company that made the equipment).
Energies 17 03246 g003
Figure 4. Pipe of magnetic levitation level gauge.
Energies 17 03246 g004
Figure 5. Magnetic levitation level gauge.
Energies 17 03246 g005
Figure 6. PVC hose layout: (a) horizontal PVC hose layout design; (b) vertical PVC hose layout design; (c) photo of the PVC hose.
Energies 17 03246 g006
Figure 7. Buried PT100 platinum resistance sensor temperature sensor.
Energies 17 03246 g007
Figure 8. Earth pressure monitor installation schematic. (a) is the design of the earth pressure sensor burial. “×2” indicates a pair of earth pressure sensors. They are used to monitor the horizontal and vertical earth pressure. (b) is a photograph of the actual earth pressure burial.
Energies 17 03246 g008
Figure 9. Test chamber assembly: (a) main frame of the test chamber; (b) effect of the test chamber bottle completion.
Energies 17 03246 g009
Figure 10. PVC pipe fixing.
Energies 17 03246 g010
Figure 11. Loading soil in the test chamber.
Energies 17 03246 g011
Figure 12. Schematic diagram of earth pressure: transducer burial.
Energies 17 03246 g012
Figure 13. Liquid temperature in Cryostat dunring the freezing process.
Energies 17 03246 g013
Figure 14. Front view of environmental changes during the freezing process (day 3 of the freeze).
Energies 17 03246 g014
Figure 15. Cloud map of freezing temperature field: (ac) temperature fields on the third, seventh, and fifteenth day of freezing, under infinite boundary conditions; (df) temperature fields on the third, seventh, and fifteenth day of freezing, under finite boundary conditions.
Energies 17 03246 g015aEnergies 17 03246 g015b
Figure 16. Cloud map of freezing pressure: (ac) horizontal freezing pressure on the third, seventh, and fifteenth day of freezing, under infinite boundary conditions; (df) vertical freezing pressure on the third, seventh, and fifteenth day of freezing, under finite boundary conditions.
Energies 17 03246 g016aEnergies 17 03246 g016b
Figure 17. Soil placement: (ac) soil displacement along the seepage direction, perpendicular to the seepage direction, and in the vertical direction.
Energies 17 03246 g017
Table 1. Size parameters of tank model.
Tank StructureSize
Height of outer tank248.0 mm
Outer tank diameter231.0 mm
Inner Tank Height221.1 mm
Inner Tank Diameter228.6 mm
Outer Tank Thickness2.5 mm
Dome Side Height10.0 mm
Dome Height36.0 mm
Table 2. Level measurement data on the first day of the test.
HoursMonitor 1
(mm)
Monitor 2
(mm)
Monitor 3
(mm)
Monitor 4
(mm)
11209.841102.651206.301110.69
21203.331102.941201.001115.33
31197.311103.761197.081117.37
51190.331110.371187.881120.72
61185.311117.891182.211121.44
71180.081118.331176.341123.37
81176.321123.471171.171123.42
91172.011127.371168.881124.40
101169.381129.331167.761125.30
111167.201134.371162.671125.42
121161.001137.711158.341127.34
131159.371139.081153.771128.88
141158.301144.021147.591129.32
151157.051153.011141.201130.94
161156.711154.421139.601130.70
171156.781154.471139.581130.70
181156.721154.431139.571130.71
191156.711154.471139.501130.73
201157.211154.511139.511130.83
211156.701154.521139.471130.87
221156.711154.571139.431130.80
231156.701154.531139.401130.79
241156.711154.691139.381130.81
Disclaimer/Publisher’s Note: The statements, opinions and data contained in all publications are solely those of the individual author(s) and contributor(s) and not of MDPI and/or the editor(s). MDPI and/or the editor(s) disclaim responsibility for any injury to people or property resulting from any ideas, methods, instructions or products referred to in the content.

