Article

The Contribution of Biogas to the Electricity Supply Chain: An Italian Life Cycle Assessment Database

1
ENEA, Division Resource Efficiency, Department for Sustainability, 00196 Rome, Italy
2
ENEA, Laboratory Analysis and Modelling of Critical Infrastructures and Essential Services, Division Tools and Services for Critical Infrastructures and Energy Communities, Department Energy Technologies and Renewable Sources, 00196 Rome, Italy
3
ENEA, Laboratory Techniques and Processes for Biorefineries, Division Bioenergy, Biorefinery and Green Chemistry, Department Energy Technologies and Renewable Sources, 00196 Rome, Italy
*
Authors to whom correspondence should be addressed.
Energies 2024, 17(13), 3264; https://doi.org/10.3390/en17133264
Submission received: 14 May 2024 / Revised: 28 June 2024 / Accepted: 1 July 2024 / Published: 3 July 2024
(This article belongs to the Special Issue Advanced Waste-to-Energy Technologies)

Abstract

:
The transition towards energy efficiency measures and green energy sources is strongly fostered by the European Union. Italy is among the EU countries that have heavily invested in renewable energy sources, more than doubling their share in gross final energy consumption. In particular, biogas has a pivotal role in the generation of electricity and can also be upgraded into biomethane, with a higher and more stable energy content. In this study, the sustainability of the supply chain of electricity from biogas in Italy has been thoroughly analyzed in the broader framework of the ARCADIA (Life Cycle Approach in Public Procurement and Italian LCA Database for Resource Efficiency) project. The environmental assessment, carried out by means of Life Cycle Assessment (LCA), provides a two-fold perspective. Firstly, it allows us to identify the main hotspots of the investigated system, such as the cultivation of dedicated crops, and to provide useful insights for improving environmental performance. Furthermore, a focus on the modeling of the dataset related to the production of electricity from biogas within the Italian electricity mix represents a step ahead in the LCA research, filling the lack of site-specific databases for reliable LCA results.

1. Introduction

1.1. Renewable Energy Sources: Biogas as Energy Carrier

The search for energy sources other than fossil fuels is driven by efforts to mitigate climate change and achieve energy stability. The 55% reduction in greenhouse gases (GHG) by 2030 and the other targets set by the European Union towards climate neutrality [1] can be reached only if energy systems radically change [2]. Indeed, in 2021, the energy sector has been responsible for 46% of the global increase in CO2 emissions due to the growth of energy demand and the increased use of fossil fuels to produce electricity and heat, with 10.5 Gt of CO2 deriving only from coal-fired power plants [3]. As a first step, the transition towards the 2030 targets requires boosting energy efficiency measures as well as green energy sources. In particular, the amending of the Renewable Energy Directive [4] sets an overall renewable energy target of at least 42.5% binding at the EU level by 2030 but aiming for 45%, with contributions varying from each Member State to accelerate the take-up of renewables in the EU.
If attention is focused on bioenergy, it may hold a 60% share of renewable energy sources (RES) within the EU, and a steady increase in biomass use for the production of energy (bioenergy) and fuels (biofuels) is foreseen until 2030. Biomass may be considered a stable energy source in the electricity, heat and transport sectors, thanks to the local availability of a plurality of feedstocks and reliable technologies. However, it is crucial to ensure a sustainable sourcing of biomass by relying on non-recyclable biomass waste and agricultural and forestry residues [5]. If dedicated crops (such as corn, grasses, beets, sunflowers, etc.) in past decades, which are defined as “energy crops”, were widely used for energy purposes [6], in recent years, for sustainability reasons, interest has shifted towards the use of wastes from agricultural industries that are unsuitable for animal feed, agribusiness wastes, processing wastes and expired food, destined to be not subsequently used in any other way. In particular, biogas, defined as “a gas consisting mainly of methane and carbon dioxide produced by the anaerobic digestion of biomass” [7], can be produced from (i) landfill gas, produced by waste digestion; (ii) sewage sludge gas, produced by anaerobic fermentation of sewage sludge and wastewater treatment; and (iii) anaerobic fermentation of agricultural waste, livestock manure, and residues from agri-food farms [8]. In doing so, biogas production by means of Anaerobic Digestion (AD) not only provides a valuable RES, but it also helps solve the problem of waste disposal, which currently threatens ecosystems and human health, by mitigating some of the environmental impacts generated from biowaste management [9].
Currently, the EU is the largest producer of biogas, with a share of more than two-thirds of the global biogas production, followed by North America, which has a share of about 15%. In the United States, biogas is produced mainly through landfill gas recovery, which accounts for nearly 90% of its biogas production, with a trend for increasing biogas production from agricultural waste. In China, biogas production increased due to policies supporting the installation of household-scale digesters in rural areas. The biogas market development in the EU depended on the various support schemes required for the low economic viability and competition with other energy sources. European biogas production has increased sixfold from 2005 to 2020, and, according to Eurobserver [10], the biogas sector in the EU employed (directly and indirectly) 49,000 employees in 2020, with an annual turnover steady at around EUD six billion from 2018 to 2020, of which almost EUD four billion in Germany. In particular, the EU has taken a leading role in electricity production and installed biogas electricity capacity, with almost 12 GW, in comparison to the 20 GW installed capacity worldwide [10].

1.2. The Contribution of Biogas to the Italian Electricity Mix

Italy is among the EU countries that have heavily invested in RES technologies and has more than doubled the share of RES in gross final energy consumption (from 7.5% in 2005 to 22% in 2021) [11], driven by dedicated policies and support schemes, as well as increased economic competitiveness. In 2023, Italy issued its updated 2030 National Energy and Climate Plan (NECP), setting a 40.5% RES target by 2030. The contribution of RES is expected to have the following distribution: 65% in the electricity sector, 36.7% in the thermal sector (heating and cooling) and 30.7% in the transport sector. Furthermore, according to Gestore dei Servizi Energetici [12], in Italy, bioenergy (from solid biomass, bioliquids and biogas) contributes to the generation of electricity with plants mainly characterized by an electrical power below 1 MW for a total capacity of 4106 MW. The electricity effectively produced from biomass in 2021 amounted to 19,071 GWh (42.6% from biogas, 35.9% from solid biomass and the remaining 21.5% from bioliquids), corresponding to 16.4% of the electricity production from RES and 7% of the overall electricity production. In line with the European trend, electricity generation from biogas grew from 1336 GWh in 2006 up to 8124 GWh in 2021, committing 2261 out of 2985 bioenergy plants, mainly located in northern Italian regions [12]. The main contribution (69%) comes from plants powered by biogas from agricultural and forestry activities (dedicated crops and agro-forestry waste), supplemented with 16% coming from animal manure and 15% from waste and sludge [12].
In Italy, biogas has a pivotal role in the bioelectricity generation sector. The evolution of the Italian biogas sector over the years (from 2007 to 2021) is highlighted in Figure 1 [12]. From 2008 to 2014, there was a rapid increase in the number of biogas plants (from 239 to 1796), installed power (from 365.6 MWel to 1406.1 MWel) and electricity production (from 1599.5 GWhel to 8198.5 GWhel). In 2021, the electricity generation from 2261 biogas plants (1455.1 MWel) amounted to 8124.2 GWhel, with 83% of electricity production concentrated in northern Italian regions, namely Lombardia, Veneto, Emilia Romagna and Piemonte. In the period from 2014 to 2021, the biogas plants have not undergone major changes.
The Italian biogas sector took off thanks to the Ministerial Decree of 18 December 2008 [13], which introduced an advantageous feed-in tariff (known as “All-Inclusive Feed-in Tariff”) to produce renewable electric energy. The incentive scheme introduced by the government differentiated the feed-in tariffs based on both raw material substrates and plant size. In particular, the biogas plants with a designed electric power of 1–999 kWel were eligible to receive EUD 0.18/kWh for landfill waste as a feedstock or EUD 0.28/kWh for biomass substrate as agricultural, livestock or forestry bio-products collected in an area of 70 km around the biogas unit. These feed-in tariffs favored the market penetration of cogeneration biogas plants of an internal combustion engine nameplate power lower than 999 kWel, easier to manage and organize [14]. From 2008 to 2012, the All-inclusive feed-in tariff rapidly increased the number of biogas plants and installed power. As a result, the average size of biogas plants in Italy is 0.7 MW, proving that biogas production mainly relies on farms located in rural areas or small agro-zootechnical industries.
With the Ministerial Decree of 6 July 2012 [15], the support scheme substantially changed with less favorable subsidies, which were extended from 15 to 20 years and related to the size of the plant and the feedstock. This new biogas support scheme was considered less profitable by the investors, leading to a stagnation in biogas production and derived electricity and heat. In 2016, a revision of the aforementioned incentive policy introduced a further reduction of feed-in tariff incentives, thus definitively interrupting the growth of the biogas sector. However, the European Biogas Association (EBA) reports that 2.47 billion cubic meters (bcm) of biogas were produced in Italy in 2021 (91% in 1800 biogas plants and 9% in 27 biomethane plants), corresponding to around 3.3% of gas supply [16]. Concurrently with the global energy crisis, the upgrading of biogas to biomethane has been encouraged within the REPowerEU plan [17], which establishes a EU target of 35 bcm of biomethane produced yearly until 2030. In August 2022, the European Commission approved an EUD 4.5-billion scheme to support biomethane production in Italy. It is anticipated that 4 bcm of biomethane per year can be produced by 2026 with the allocated funds. Therefore, Italy foresees that the total national production of both biogas for thermal and electrical purposes and biomethane for combustion and use in transport will amount to around 5.95 bcm in 2030.

1.3. The Arcadia Project and the Italian LCA Database

Biogas and biomethane are the fastest-growing types of bioenergy. The contribution of biomethane is, at the moment, restrained to the transport sector, whereas biogas strongly contributes to the Italian electricity mix. The supply chain of electricity from biogas in Italy has been thoroughly analyzed using the ARCADIA-Life Cycle Approach in Public Procurement and the Italian LCA Database for Resource Efficiency project [18]. The latter was developed between 2020 and 2023 by the Italian National Agency for New Technologies, Energy and Sustainable Economic Development (ENEA) and financed by the National Operational Programme on Governance and Institutional Capacity 2014–2020, funded by the European Structural and Investment Funds. The project aimed at creating an Italian Life Cycle Assessment (LCA) database [19] covering several national supply chains representative of national production. The IT-LCA database, which contains more than 180 datasets belonging to 23 national product chains, is free of charge, and it is continuously updated to support public administrations, trade associations, researchers, consultants, and companies in performing LCA studies. The creation of an Italian LCA database, with documented datasets developed according to the format of the International Life Cycle Data system [20], is strategic for addressing some of the sustainability challenges posed by the Green Deal and the European Action Plan for the Circular Economy. It also contributes toward filling the gap of missing datasets related to the Italian context within the existing LCA databases. Indeed, an Italian LCA database represents the ability to (i) facilitate the dissemination of the LCA methodology at the national level and promote impact mitigation initiatives; (ii) support the regulation of public policies; (iii) promote the acquisition of environmental labels, such as EPD (Environmental Product Declaration), PEF (Product Environmental Footprint), “Made Green in Italy”, that can be used in “green procurement” by different public operators and private entities; (iv) facilitate the development of Green Public Procurement criteria (mandatory in Italy), based on LCA, and the implementation of the Ecodesign for Sustainable Products Regulation (ESPR), once it will be approved by the European Commission [21]. In the framework of an Agreement between ENEA and the Ministry of the Environment (2024–2028), the IT-LCA database will be further implemented and updated, and the methodology will be improved to guarantee high transparency and data quality.
In the creation of the Italian LCA database, energy has been considered a priority dataset since the energy supply chain is a key factor in determining the environmental impacts generated by the investigated production sectors. In particular, within the Italian electricity mix, a focus has been placed on renewable sources since their supply strongly depends on context and local specificities. The reliance on an international database for this kind of data generates streamlined LCA results [22]. Indeed, the reliability of LCA is strongly influenced by the dependence, integrity, and specificity of the data, especially when they are collected from different countries or from different sources in different operational scenarios [23]. Therefore, detailed datasets have been developed based on local inventory data in order to avoid the risk of obtaining generalized and simplified LCA results. The importance of considering specific inventories in terms of inputs, outputs and emissions has often been highlighted in the scientific literature and has been related to geographic, temporal and technological aspects [24]. Since national LCA databases are important stepping stones to increase the reliability of LCA studies, many national databases are in progress in several countries (Europe, Asia, America, and Oceania). Some examples are reported in Table 1 [25].
Moreover, various initiatives have been developed worldwide with the aim of improving the interoperability of databases and harmonization of methodologies. In Europe, for instance, the Life Cycle Data Network (LCDN) has been launched by the European Commission to provide a globally usable infrastructure for publishing datasets for quality-assured LCA studies from different organizations (e.g., industry, national LCA projects, research groups and consultants). Similarly, the UNEP SETAC Life Cycle Initiative—Data and Database Management [26] aimed to increase the interoperability of databases and the availability and quality of local data, i.e., relating data to a specific geographical area. Other analogous initiatives include the LCA database Helpdesk [27], sponsored by the United Nations within the One Planet project [27], or Glad-Global LCA Data Access network [28], promoted by Life Cycle Initiative and officially launched in 2020, to search, convert and download datasets from different LCA dataset providers.
In this context, the main aim of this paper is to detail the modeling of the dataset related to the production of electricity from biogas within the Italian electricity mix of the ARCADIA database, shedding light on the challenges addressed in the development of the dataset. This represents a first attempt to diversify the LCA database, which is available for modeling the Italian supply chain of electricity from biogas from the streamlined international databases, thus contextualizing the LCA results within the Italian territorial specificities. At the same time, the environmental sustainability of biogas production for energy purposes has already been evaluated by means of LCA [29,30], even though only studies at the farm gate or at the local scale are available at the Italian level [31,32]. Therefore, the LCA of the investigated national supply chain is also presented, paying special attention to the Life Cycle Inventory (LCI) phase. In fact, the selection of data to be used in the database was found to be critical: primary data on organic matrices as well as on plant technologies specifically used in Italy have been accurately selected, and values have been averaged on the whole Italian territory. In so doing, the LCI can be considered representative of the national context and overcome the lack of an Italian database with quality, transparency, accessibility, and comparability features.

2. Data and Method

2.1. The Investigated Case Study

In this study, the electricity supply chain has been analyzed, identifying both the main sources of electricity production and the prevailing technologies, focusing on biogas. The main challenge has been the selection of data to be representative of the Italian context. To this aim, a thorough analysis of TERNA national statistical data on electricity production, consumption, import and export in Italy has been conducted. Furthermore, GSE annual reports on electricity production from renewable sources and greenhouse gas emission inventories produced annually by the Italian Institute for Environmental Protection and Research (ISPRA) have been used as a reference.
Regarding the origin of biomass used as feedstock for biogas production, the dataset referred to the production of 1 kWh of electricity from biogas, in Italy, which was modeled according to the GSE report and to the relative contributions of different biomass categories reported therein [33]. Specifically, the largest contribution to electricity generation has been attributed to biomass of agricultural and forestry origin (67%), whereas animal manure, waste and sludge contribute 15%, 17%, and 1%, respectively.
Furthermore, from the survey of the Italian biogas plants, it has been found that the plants generally operate in co-digestion, i.e., simultaneously employing biomass of different nature. For example, livestock manure is often used in combination with agricultural biomass to increase the yield of the digestive mix. Therefore, in the developed dataset, two biomass categories have been highlighted: (i) biomass of agricultural and forestry origin has been merged with animal manure, for a total contribution of 82% to the Italian electricity production from biogas and (ii) waste and sludge have been gathered together in a single biomass category for the remaining contribution of 18%. For the former category, a further distinction has been made based on the nominal power ranges of the plants, namely 1–700 kW and 701–1700 kW. Further details are provided in Section 2.1.1. Summarizing, three unit processes have been developed to represent the dataset for the production of 1 kWh of electricity from biogas in Italy, as follows:
-
Class 1 (CL1): Energy production from biogas derived from biomass of agricultural and forestry origin and animal manure in plants with a nominal power in the range of 1–700 kW (this class contributes to electricity production from biogas, in Italy, for 22%);
-
Class 2 (CL2): Energy production from biogas derived from biomass of agricultural and forestry origin and animal manure in plants with a nominal power in the range 701–1700 kW (this class contributes to electricity production from biogas, in Italy, for 60%);
-
Class 3 (CL3): Energy production from biogas derived from waste and sludge (this class contributes to electricity production from biogas in Italy, for 18%).
Therefore, each of the three unit processes (CL1, CL2 and CL3) has been built as a comprehensive system for the production of energy (electric and thermal) from certain types and quantities of biomass through anaerobic digestion and subsequent cogeneration. In fact, the characteristics of biomass strongly affect the volume and composition of the biogas to be converted and, therefore, the amount of energy produced. It should be highlighted that, in this study, the energy efficiencies of Italian treatment plants, as well as the composition of used biomass feedstocks, have been considered and averaged to represent the Italian context in the reference year.

2.1.1. Modeling of Unit Processes CL1 and CL2

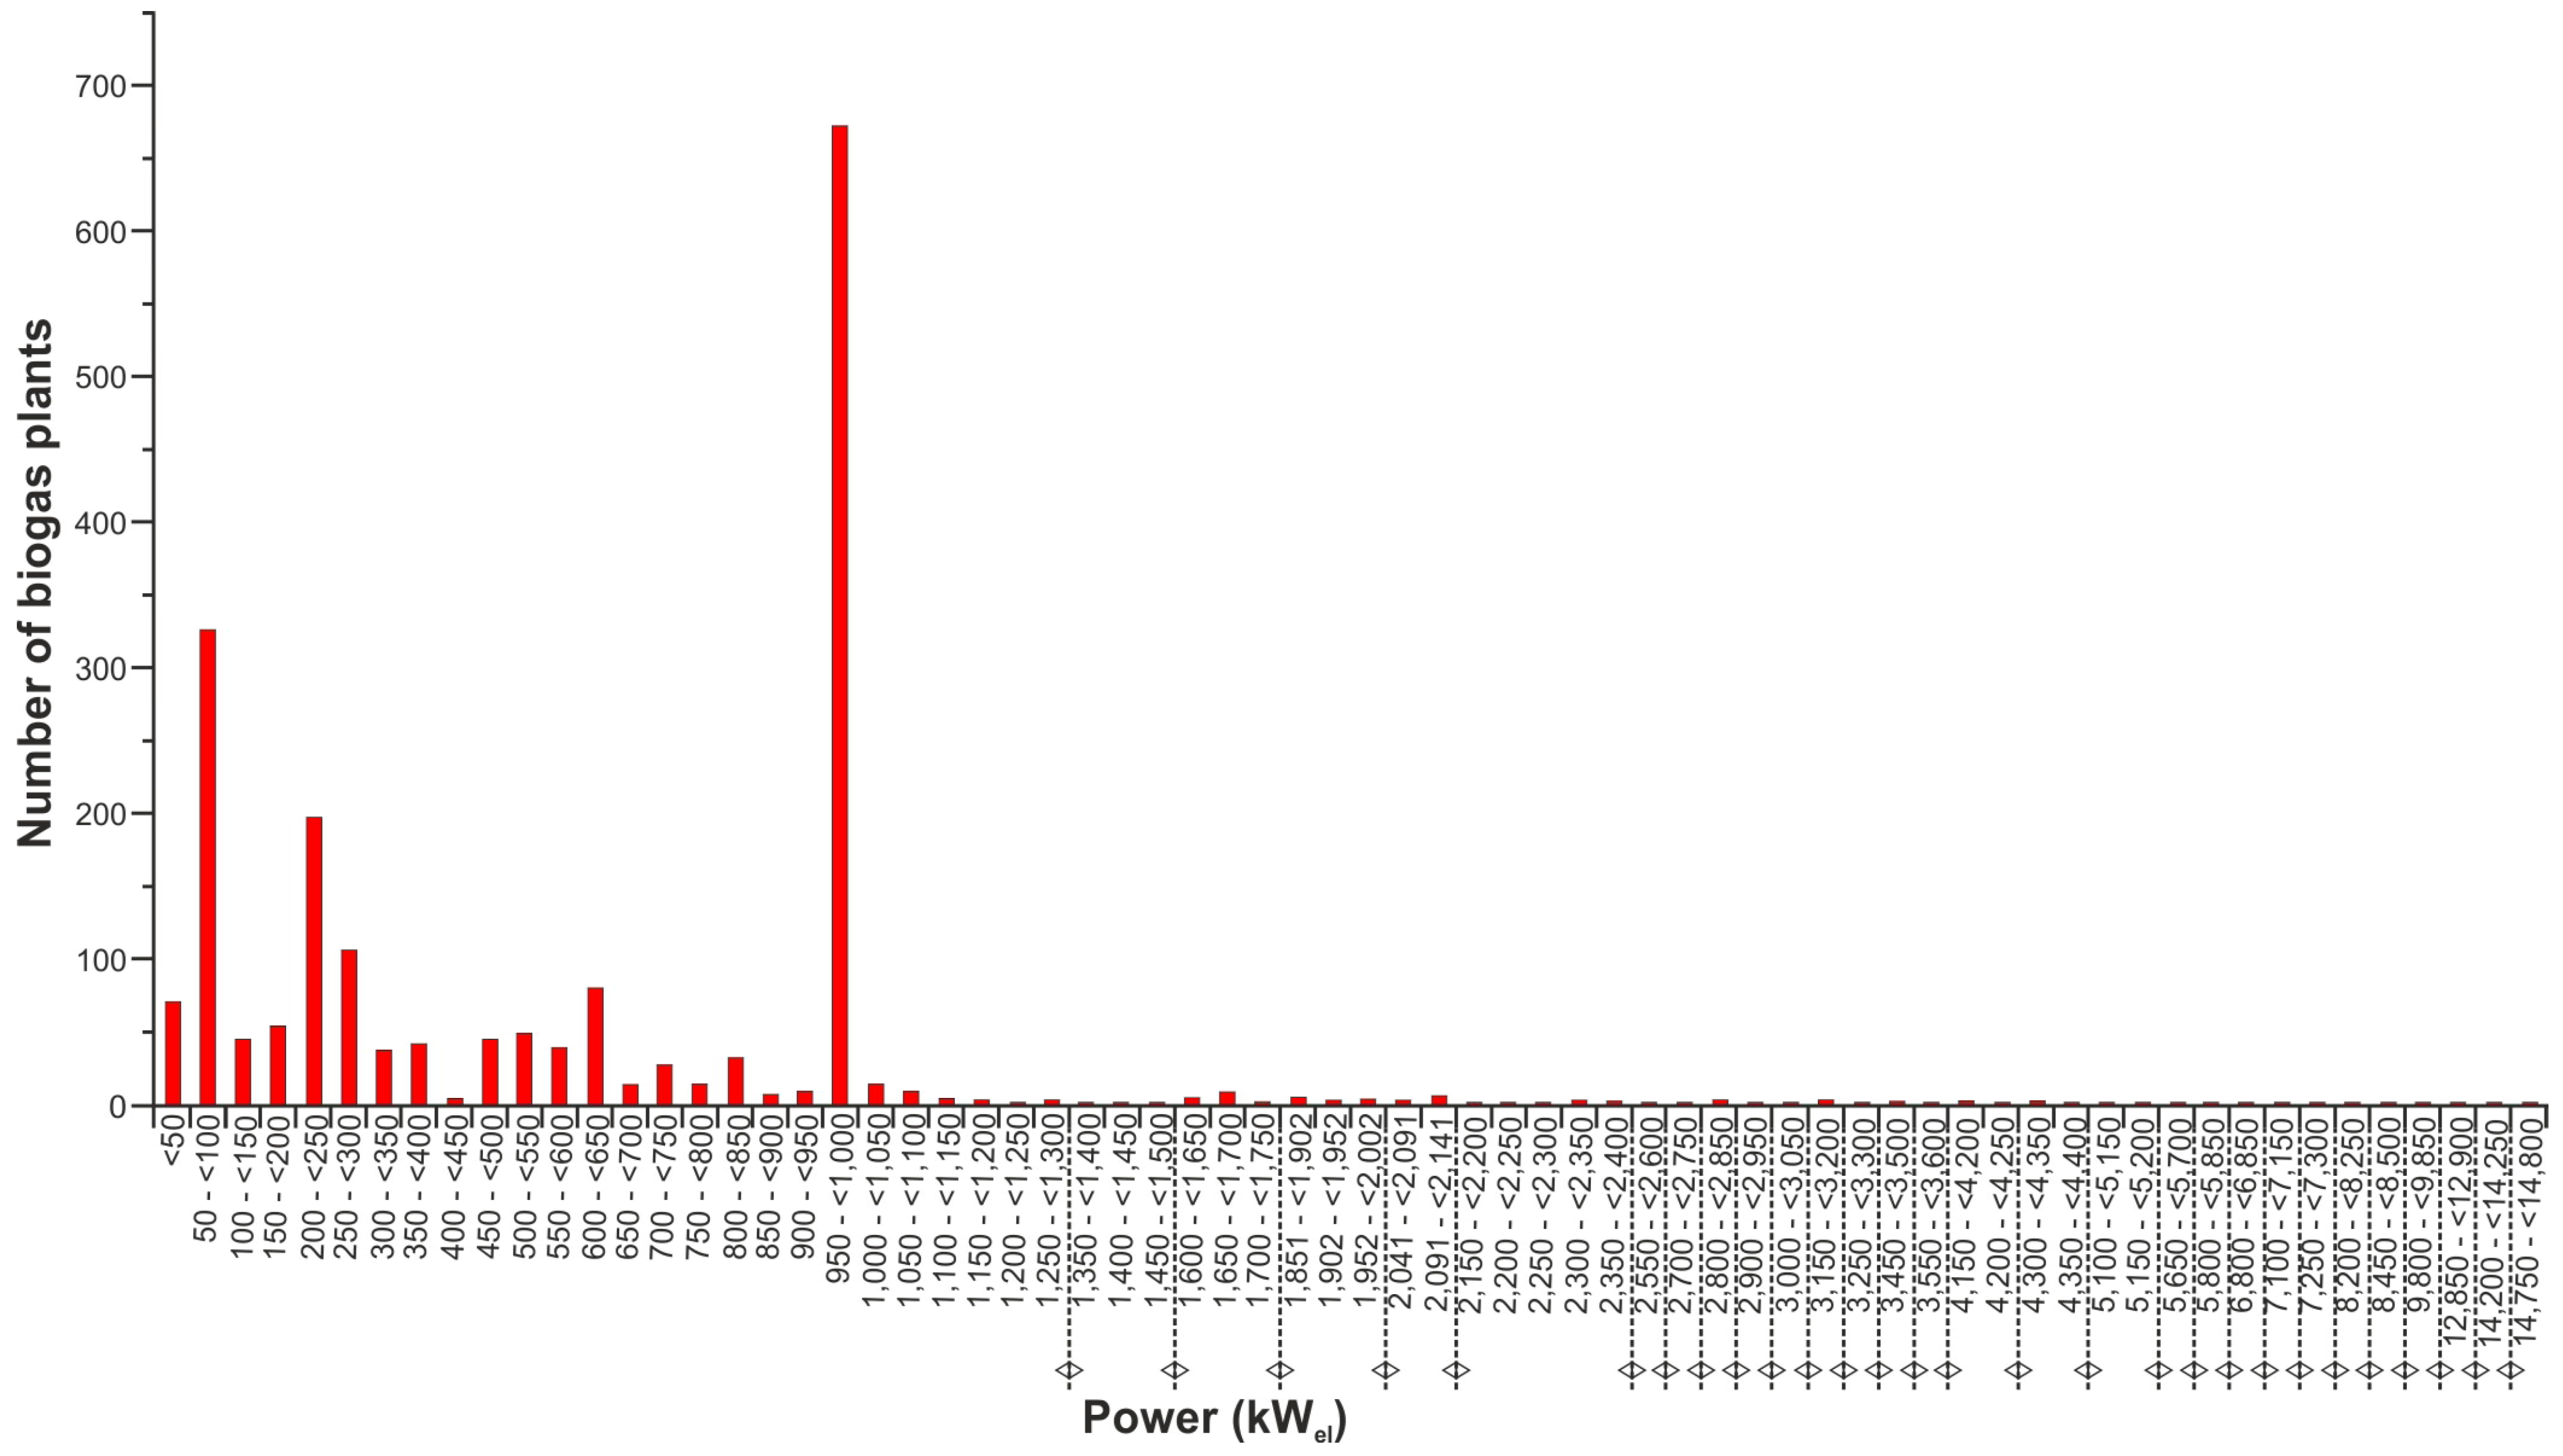
In terms of electricity production, the most representative nominal power ranges of biogas plants have been defined by a thorough survey of biogas plants for 2020, the most recent available year for data collection when the analysis has been carried out [34]. The analysis, representing the first essential step for the collection of local-specific data, has revealed that 40% of the 1983 biogas plants operating in Italy in 2020 had a nominal electrical power (NPel) ≤ 300 kWel, 54% fell in the range 301–1050 kWel and the remaining 6% had a PNel > 1000 kWel (Figure 2).
Based on the frequency distribution and the electricity production, the two most representative nominal power ranges of biogas plants have been defined as follows:
  • CL1: 1 ≤ PNel ≤ 700 kWel, including 1109 plants, with an overall nominal power of 287,067 kWel and an estimated value of electricity production (1803 GWh), equal to approximately 22% of total electricity production from biogas plants in Italy (8379 GWh, data estimated for the year 2020);
  • CL2: 701 ≤ PNel ≤ 1700 kWel, including 810 plants, with an overall nominal power of 803,042 kWel and an estimated value of electricity production (5044 GWh), equal to approximately 60% of total electricity production from biogas plants in Italy (8379 GWh, data estimated for the year 2020).
Overall, the two classes CL1 and CL2 include 1919 biogas plants (97% of plants operating in 2020) with a PNel equal to 1,090,108 kWel and a total electricity production equal to 6847 GWh (82% of the estimated national production of electricity for the year 2020). In deeper detail, the national production of electricity for the year 2020 (not available at the moment of the analysis) has been estimated by multiplying the average number of full load hours, retrieved from previous years, by the total nominal power of operating biogas plants (1983 plants according to Atlaimpianti). Calculating the contribution of CL1, CL2 and CL3 to the total production of electricity from biogas in Italy according to the operating biogas plants, as well as gathering primary data as described in Section 2.2.2 has allowed us to have a real snapshot of the production of energy from biogas in the Italian fabric.

2.2. The LCA Methodology

LCA is an analytical methodology defined by the ISO standards and the ILCD Handbook guidelines [35,36,37]. It represents a common framework for quantifying the environmental impacts associated with a product or service throughout its life cycle by considering the entire technological system related to the product or service, from the extraction of raw materials, their processing and transportation up to production, distribution, use and maintenance, and end-of-life.
Because of its holistic approach, in recent years, this methodology has been increasingly used for rigorous estimates of the environmental sustainability impacts in decision-making processes and in government policies globally, especially for choosing between different options to promote the use of renewable energy [38,39].
According to standard procedures [36,37], LCA consists of several interrelated phases: (1) goal and scope definition; (2) LCI analysis; (3) impact assessment; and (4) interpretation of results. In detail, the objectives of the goal and scope definition are to (i) establish the purpose and boundaries of the investigated system, including data quality, methodological issues, and value choices; (ii) describe the product or process being analyzed; (iii) set the context for the assessment; and (iv) identify the functional unit (the reference for normalizing all data in the system) and system boundaries (defining physical, geographical, and time-related limits).
The second stage of LCA, namely the LCI, involves quantifying all data (with specified units) for each phase within the selected system boundary. This includes inputs (e.g., energy, water, and material used), outputs (e.g., products and byproducts), and environmental releases (e.g., air emissions, solid waste, and wastewater discharges). The third phase, Life Cycle Impact Assessment (LCIA), is the technical process of evaluating the potential human and ecological impacts of energy, water, and material usage, as well as environmental releases. Finally, the interpretation identifies bottlenecks and determines which input flows, processes, and stages most significantly affect a particular impact category or the overall environmental performance, leading to conclusions and recommendations.

2.2.1. Goal and Scope Definition

The goal of this study is to provide an assessment, in accordance with the ISO standards 14040-44 (2006) [36,37], of the potential environmental impacts of the electricity production supply chain from biogas in Italy. A comprehensive attributional LCA of electricity production from biogas in Italy is presented, including the various stages of biogas production from organic matrices and identifying the critical points that generate the greatest environmental impacts. The analysis is based on the identification and quantification of all input and output flows associated with the biomass supply phase, the conversion phase of biomass to biogas through anaerobic digestion, and the subsequent conversion of biogas to electricity through a cogeneration plant. In detail, as shown in Figure 3, the stages of electricity production from biogas included in this study are:
  • Biomass production, including collection and transportation to the treatment site;
  • Anaerobic digestion process, which converts biomass into biogas and digestate;
  • Generation of heat and electricity through a CHP plant. The development of the Combined Heat and Power (CHP) units emerged as a need to increase the economic viability of biogas plants through the use of heat.
The functional unit (FU) chosen in this assessment is the total production of electricity from biogas in Italy in 2021, namely 8124 GWh [12]. Figure 4 schematizes the boundaries of the system under investigation: the feedstock for biogas production includes two different types of biomass, namely dedicated energy crops and residual biomass (livestock manure, agricultural and agro-industrial residues, organic fraction of municipal solid waste, and sewage sludge). For the former, all the flows, from biomass production up to the feeding of electricity into the national grid, including the agricultural stages of biomass production, the transportation of biomass to anaerobic digestion plants and the subsequent cogeneration process for electricity and heat production, are accounted for in the assessment, by applying a “cradle to gate” approach. Conversely, the activities responsible for the generation of residual biomass are not included in the system boundaries, as, according to the zero burden assumption [40], residual biomass is intended to be fully free of upstream environmental impacts, thus focusing the analysis on transportation and conversion processes.

2.2.2. LCI

In the modeling of the dataset related to the production of electricity from biogas, the LCI phase deserves particular attention. Generally speaking, the development of an LCA study requires the use of accurate data to build the inventory: detailed information regarding the amount of energy and materials consumed, as well as emissions produced and released into the environment, are required for all activities associated with the system, from the materials extraction to the end of the life cycle and all intermediate stages [41,42]. Data should preferably be primary data, namely high-reliability data collected in the field, and must be integrated with data from pre-existing databases, the quality of which influences the results of the analysis [24]. If data are not available or incomplete, proxy data or estimates can be used, although leading to margins of uncertainty in the assessment results.
In this study, data have been obtained from a variety of Italian data sources (updated GSE technical reports, interviews, ad hoc questionnaires, company reports, and environmental declarations of Italian biogas plants, considered representative of the national context on the basis of the initial survey). Primary specific data have been used for biomass amounts, transportation, biogas production, electric and thermal power generation, and emissions. In contrast, conversion processes, namely anaerobic digestion and cogeneration, have been modeled from the EcoInvent v.3.7.1 database, one of Europe’s most complete and recognized LCA databases, generically used for background processes.
The inventories related to the production of biogas from biomass of agricultural and forestry origin and from animal manure have been built based on data reported in the monitoring sheets of the ENAMA (Ente Nazionale per la Meccanizzazione Agricola) project, gathered from farms located in different regions of Italy, whose plants fall within the selected nominal power ranges (1–700 kW and 701–1700 kW). In particular, 14 plants have been selected for CL1 and 15 plants for CL2, all equipped with a cogeneration engine to convert biogas into electricity and heat. Annual datasets have been used, or when available, multiannual datasets have been averaged. For the inventory of CL3, two Italian plants fed with the organic fraction of municipal solid waste have been selected to represent the national context, and their data have been averaged [43,44].
The main assumptions made in this study are summarized as follows. Input flows of water and chemicals have been assumed to be negligible since they are used several times within the system, and losses are not significant. Moreover, according to GSE (averaged values for the years 2014–2019), a self-consumption of 10% and 15% has been assumed for electricity and heat production processes, respectively. Regarding the emissions, methane has been considered the only significant emission from the anaerobic digestion plant, and its amount has been calculated considering that CH4 represents 55% of the biogas produced [43,45], 1% being dispersed into the atmosphere [46]. Instead, local emissions from the CHP plant have been estimated according to the EF combustion 2019 worksheet, made available by ISPRA [47], and subsequent additions provided for emissions related to the anaerobic digestion plants [48,49]. The transport distance from the biomass production site to the conversion plant has been assumed to be equal to 70 km, in accordance with the short supply chain regulations for biomass for energy purposes [50]. Digestate, co-produced from the anaerobic digestion process, has not been accounted for either as waste or as an avoided product. Indeed, the digestate requires a composting process to be utilized as fertilizer in agricultural fields, but this is out of the scope of the presented analysis.
Hence, the LCA inventory of this study, reported in Table 2 and referred to as 1 kWh of electricity from biogas in Italy can be considered a reliable picture of the production of electricity from biogas in the defined geographical, temporal, and technological framework.
In addition, it is noteworthy to highlight that the analyzed supply chain generates electricity as the main product and heat as a co-product. Therefore, an allocation procedure has been applied, and the exergetic content of the two co-products has been chosen to allow a fair comparison of their environmental performance. In fact, for the same kWh, electricity has a greater capacity to do work than heat. Exergy, defined as the amount of work that a resource can provide when it is brought into thermodynamic equilibrium with its surrounding environment [53], has been considered a suitable metric to shed light on such a difference. Therefore, the environmental impacts have been allocated proportionally to the exergetic content of the co-products, as shown in Table 3.
In detail, to convert electric and thermal energy into exergy and to define the percentages of allocation for electricity and heat out of the total exergy value, the following equation has been applied:
Total Exergy (kWhex) = Electricity (kWhel) + σth × Heat (kWhth)
where σth is the Carnot factor, and it has been assumed to be equal to 0.17, according to Jungbluth et al. [52].

2.2.3. LCIA

The collected data have been analyzed using the SimaPro v.9.2.0.1 professional software (Pré-Consultants). Cut-off datasets from the EcoInvent database (v. 3.7.1) have been selected for background data on agricultural processes and conversion plants, and the impact assessment has been carried out by means of the EF 3.0 midpoint method [54], developed by the European Commission to be used in the context of the Environmental Footprint (EF) initiative. The impact categories included in the impact assessment method and investigated in this study are listed in Table 4.
Furthermore, a sensitivity check has also been performed to verify, first of all, the dependence of LCA results on methodological choices, in particular on the allocation procedure. Allocation is usually not recommended [35], and in pertinent scientific literature, heat is often not considered a co-product since it is not recovered but rather dissipated into the environment. Therefore, LCA results achieved with and without allocation of impacts between electricity and heat, co-produced in the CHP plant, have been compared for sensitivity purposes. Furthermore, since the composition of biomass used for biogas production may vary and affect the energetic and environmental performance of the investigated supply chain, other sensitivity checks have been carried out to verify (i) the appropriateness of proxies used to represent different biomass inputs and (ii) the effects of changing the percentage contribution of CL2 (consisting of biomass of agricultural and forestry origin and animal manure), and CL3 (consisting of waste and sludge) on final results.

3. Results and Interpretation

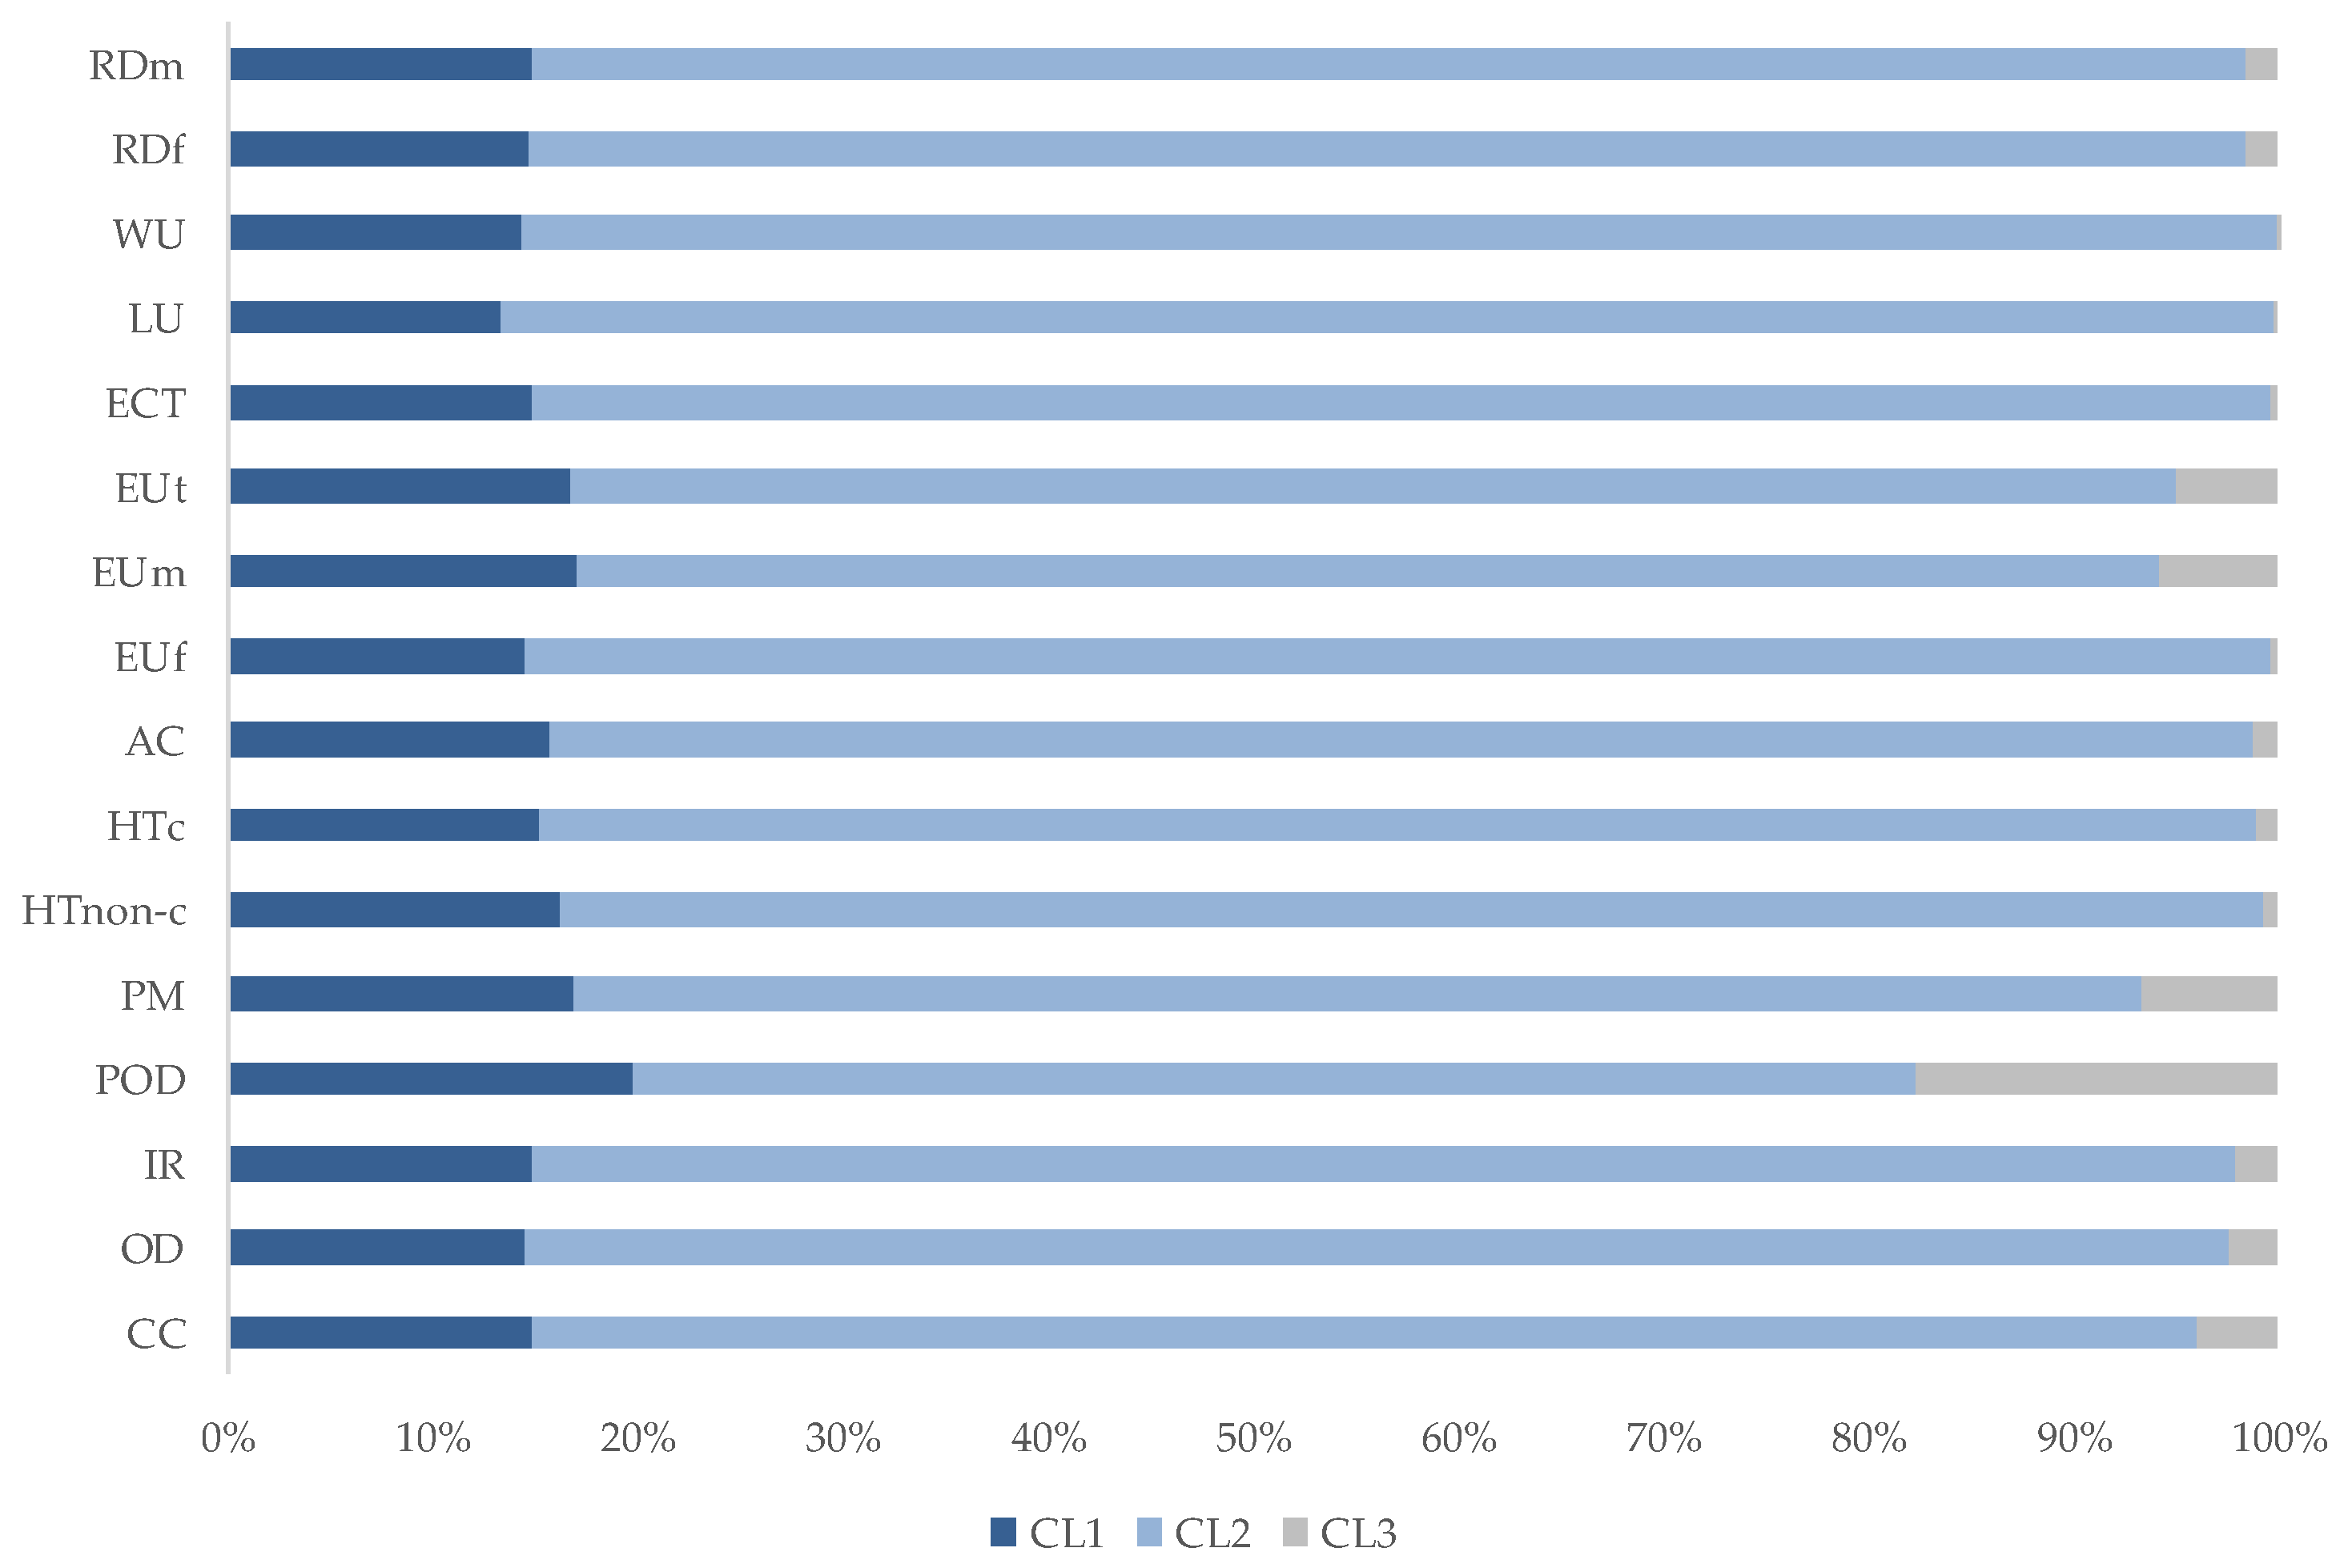
The characterized impacts related to the total production of electricity from biogas in Italy in 2021 are presented as absolute values in Table 5 and as percentage contributions from the CL1, CL2, and CL3 classes in Figure 5. From the overall assessment, it clearly appears that, in all the investigated impact categories, the highest impacts are generated by the CL2 class (701–1700 kW), which averagely contributes more than 80% to the impacts of the production of electricity from biogas. This is in line with the high contribution of 701–1700 kW plants in the overall production of electricity from biogas in Italy. The contribution from the CL1 class varies between 13% in LU and 20% in POD (16% as average value), while for CL3, the contribution is limited to 3% on average, reaching 18% only in POD.
A thorough examination of the three classes separately allows us to identify the input and output flows and production steps that generate the main environmental loads, thus calling for improvements.
Regarding the CL1 class, the breakdown of characterized impacts, shown in Figure 6, highlights that the biomass supply is the most impactful step, with contributions ranging from 69% in EUm up to 100% in LU and WU (the average value is 85% across all investigated categories). The only exception is represented by the POD impact category, in which local emissions from transformation processes bear the main burden (81%). Local emissions contribute significantly (more than 30%) also to PM and EUm impact categories. Impacts generated from the plants as well as from the transport can be considered negligible.
An analogous trend is also observed for the CL2 class (Figure 6), with the biomass supply resulting as the main responsible for the generated environmental impacts (90% as the average value of contribution across all investigated impact categories), followed by local emissions that provide significant impacts, especially on POD (66%), PM (19%) and EUm (18%). An in-depth analysis has demonstrated that, out of the different types of biomasses included in this assessment (namely maize, sweet sorghum, rye, barley, and wheat), the production of maize represents a hotspot for both CL1 and CL2, essentially due to the greater amounts of maize used in comparison with the other types of biomasses. The impacts attributed to CL3, instead, cannot be associated with the biomass used as feedstock since a zero-burden approach has been adopted for waste biomass and sludge. Therefore, in the case of CL3, local emissions predominantly affect the largest number of impact categories, especially POD and EUm, with contributions of 99%, whereas the impacts from transport are particularly relevant for OD and RDf. The CHP plant is more impactful than the anaerobic digestor, with an average contribution of 26% versus 7% across all the investigated impact categories.
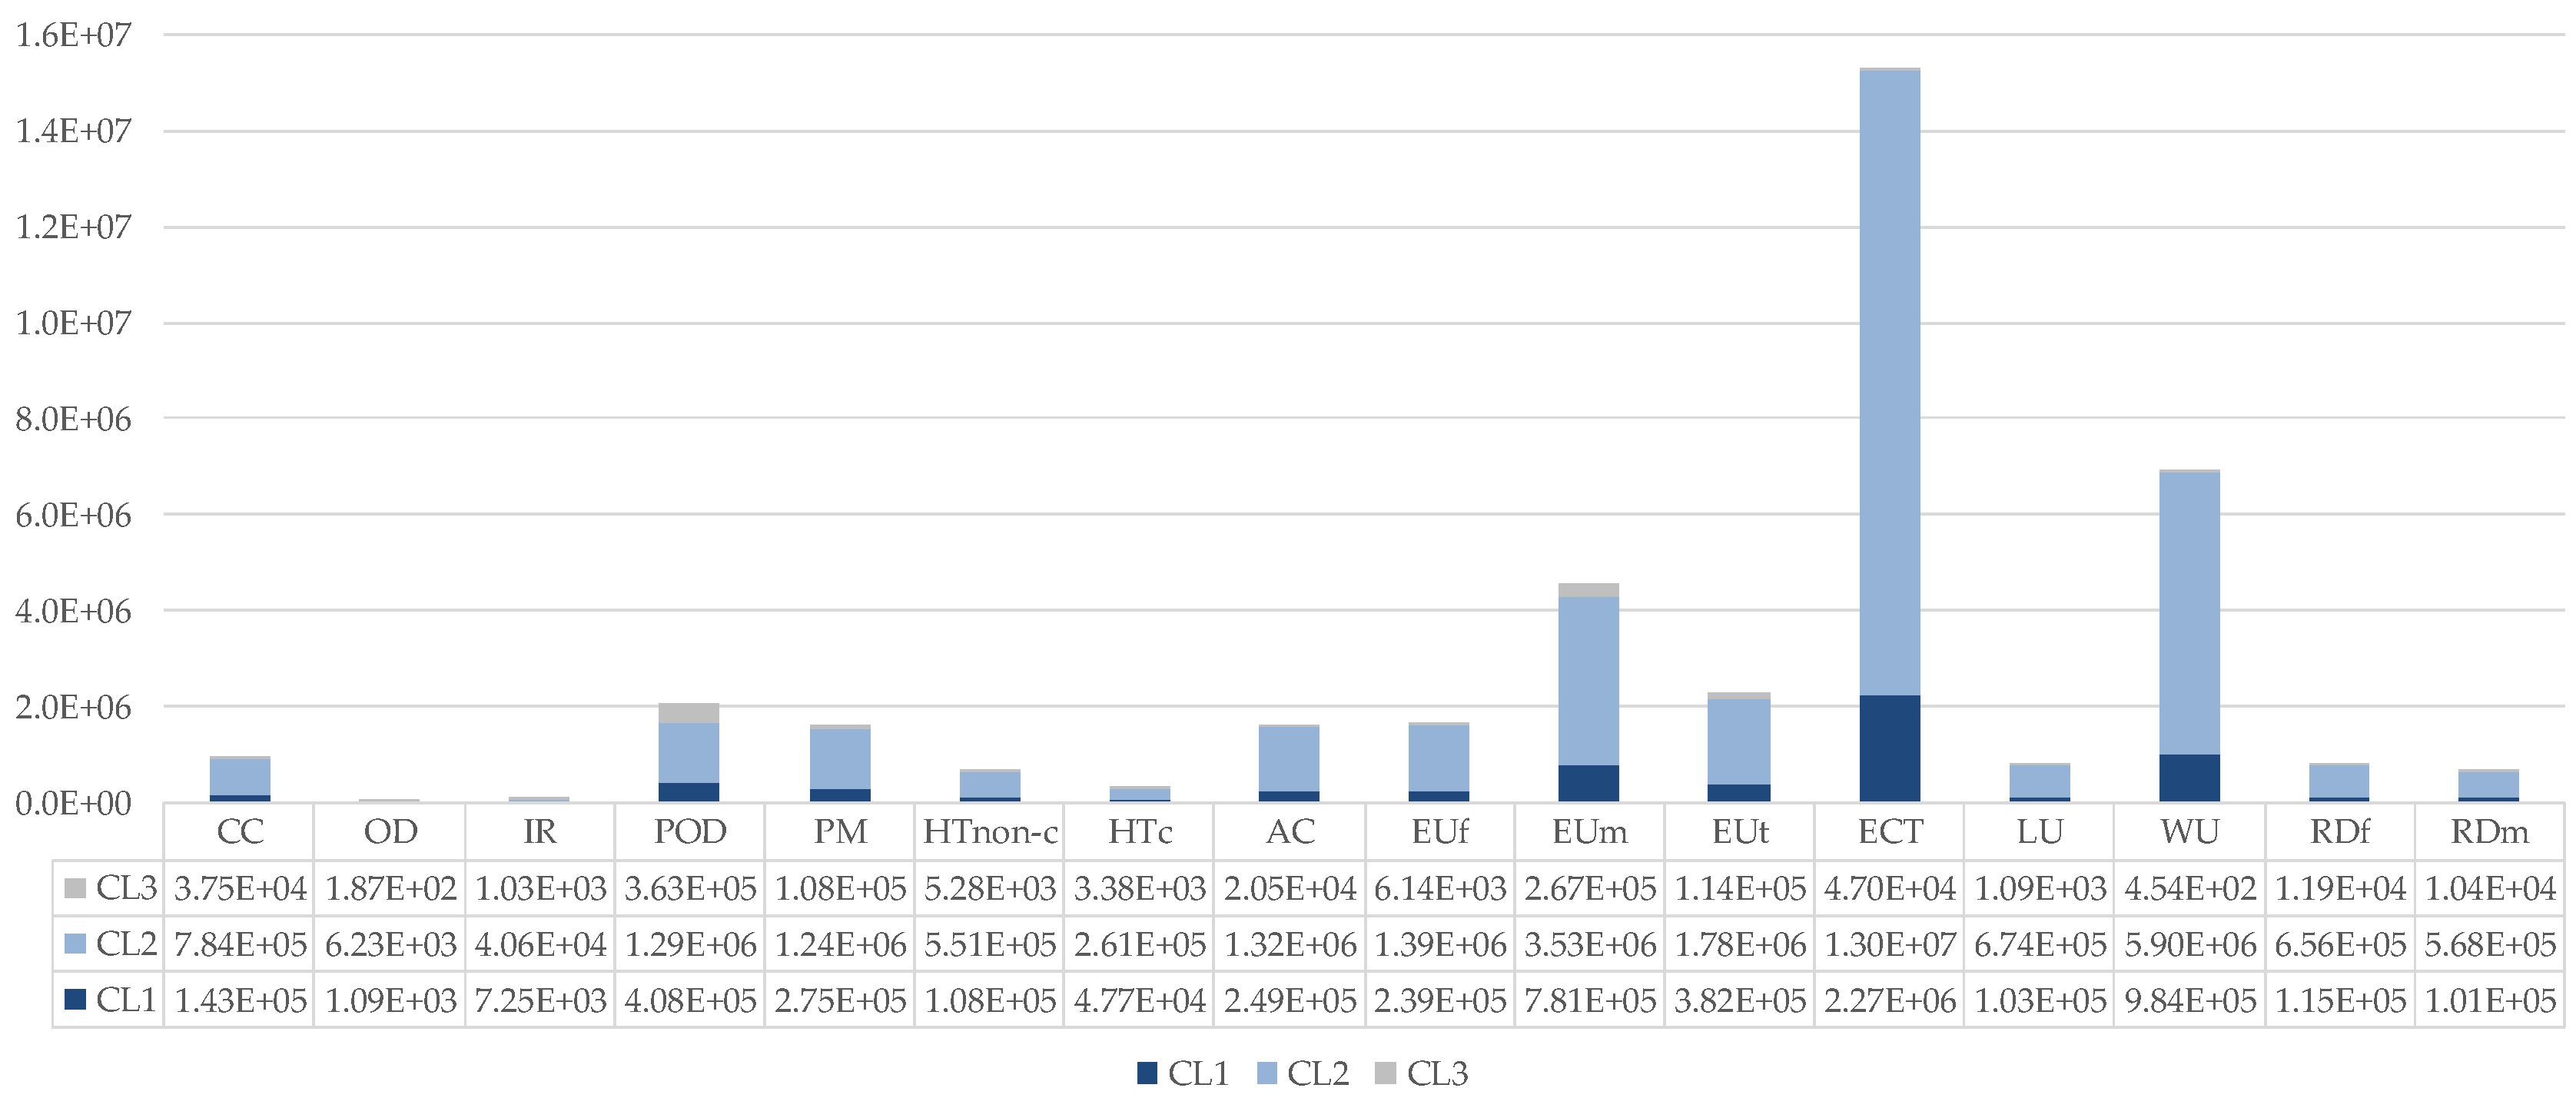
The LCA has highlighted that the production of dedicated biomass is the main hotspot of the investigated system, contributing to the generated impacts to a greater extent than other flows. This result has also been confirmed by the normalized impacts. In fact, Figure 7 shows that ecotoxicity, freshwater (ECT), water use (WU) and Eutrophication, marine (EUm) result in the most relevant impact categories, whose impacts are mainly generated by the production of dedicated crops (use of fertilizers and irrigation).
Although several specific LCA-focused studies on biogas energy production exist, direct comparisons of the potential environmental impacts remain challenging due to the differing factors, such as selected functional units, system boundaries, and life cycle impact assessment methods. Moreover, there is a wide variability by region of process inputs, such as feedstock biomass materials, depending on local availability, as well as conversion technologies and plant features (efficiency and power). Since methodological consistency across different studies is a compelling prerequisite for comparing LCA results, direct comparisons have not been possible in the present case. However, the overall findings are in line with previous studies that highlighted the environmental benefits of biogas energy systems compared to energy supply from fossil fuels. For instance, a LCA study conducted in Germany [55] demonstrated that energy production from biogas, even generated from dedicated crops, results in a reduction of GHG emissions compared to the use of fossil fuels. Similar results have been achieved in a Swedish case study [56], emphasizing that, through an appropriate choice of cultivated biomass, GHG emissions can be further reduced. Furthermore, the need to reduce the reliance on dedicated crops has been previously highlighted to guarantee an even more sustainable production of bioenergy [5,57].
In light of these results, policymakers are recommended to envisage economic incentives and financial support for more sustainable energy production from waste and residual biomass rather than from dedicated crops, with the aim of fostering the integration of the biogas sector into the current energy system.

The Sensitivity Analysis

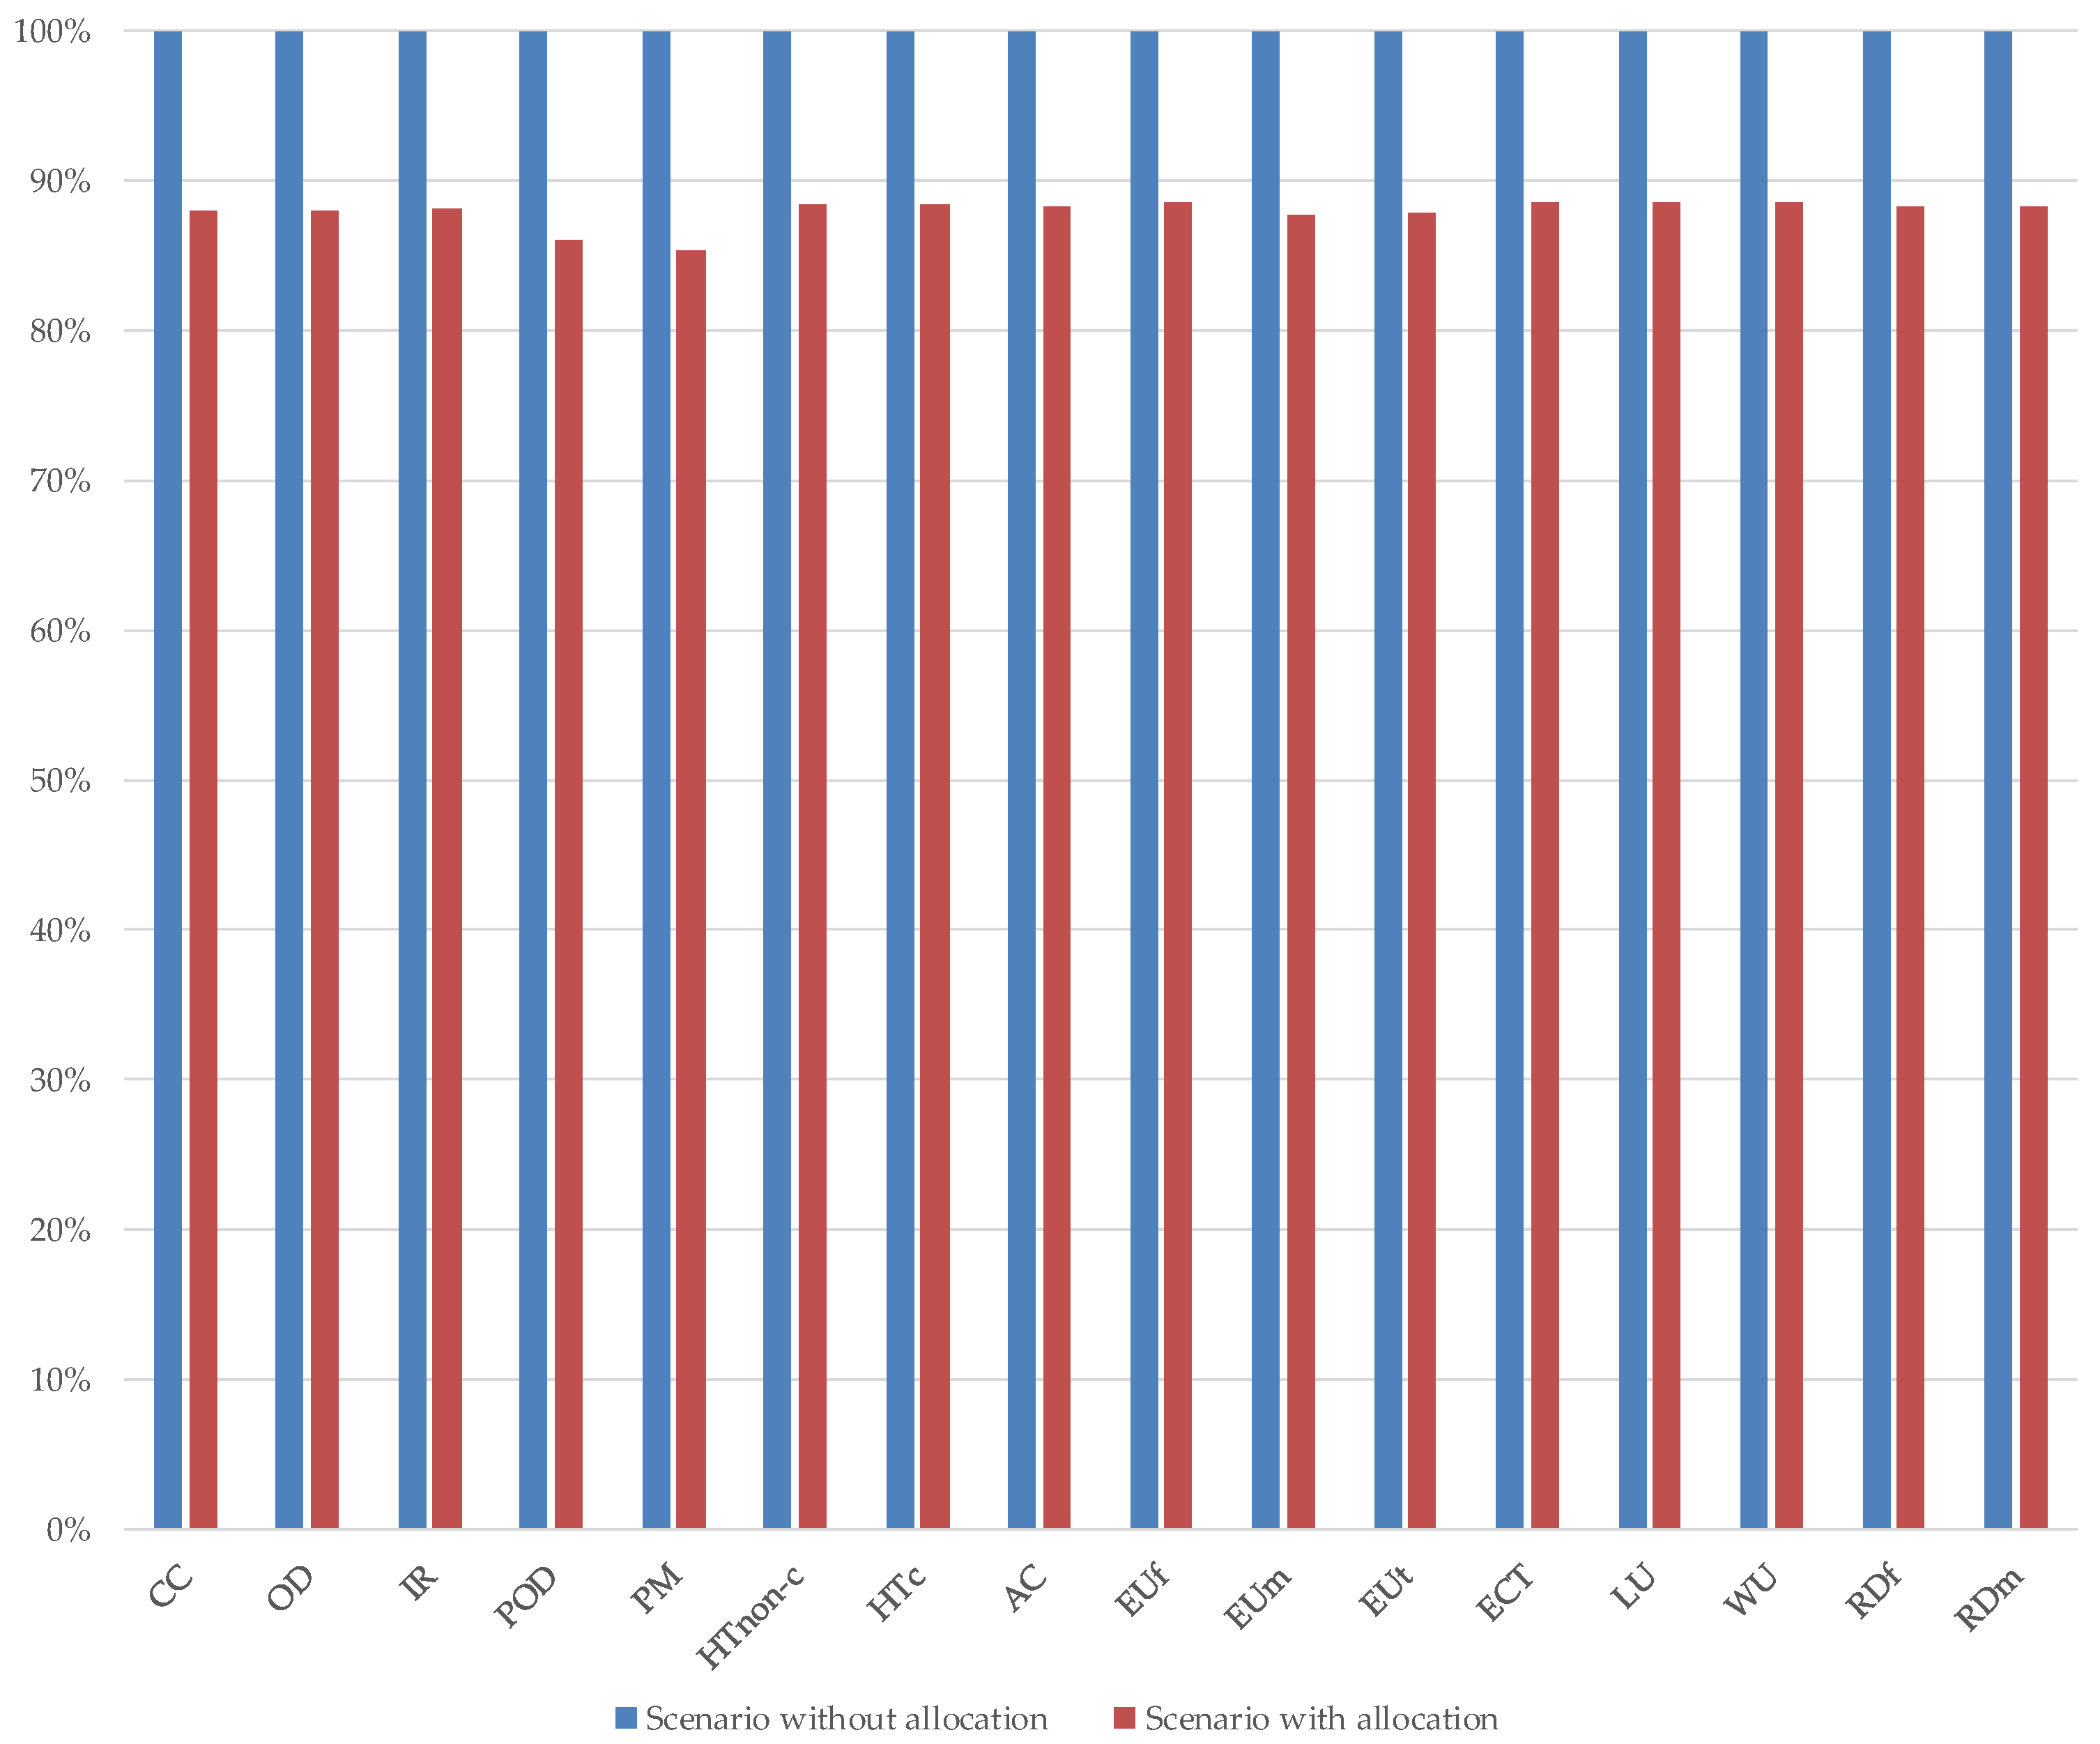
In the present study, the sensitivity analysis has been aimed, first of all, at validating the methodological choices—in particular, the allocation procedure applied to electricity and heat, co-produced by means of CHP. Given that the heat generated in the cogeneration process and not self-consumed is not usually considered a co-product, as it is assumed to be dissipated, the basic scenario in which the impacts are allocated between heat and electricity (scenario with allocation) has been compared to an alternative scenario in which no allocation is applied (Figure 8). In the latter scenario (without allocation), the electricity sold to the national grid is the only product accounted for.
The choice to apply an allocation procedure stems from the willingness to characterize heat as a co-product rather than as a waste, thus pinpointing the importance of its recovery. In case allocation is not applied, all the environmental impacts are loaded on electricity, and as expected, in all the investigated impact categories, the impacts are approximately 22% higher than in the scenario in which impacts are allocated between electricity and heat. Even though the difference is acceptably limited, confirming the reliability of the methodological choice, the sensitivity check highlights the environmental advantages of recovering heat in line with the efficient use of resources.
Furthermore, the effects of the variability of biomass composition on LCA results have been evaluated in two steps. For the most impacting class (CL2), the EcoInvent processes selected to model the biomass inputs in the original scenario have been varied, substituting the selected proxies (namely maize silage production, maize grain production, wheat grain production and ryegrass silage) with alternative flows (respectively barley grain production, wheat grain production, maize grain production and sweet sorghum production). The final results achieved in the sensitivity scenario and their variation in comparison with the original scenario are shown in Table 6.
Since the percentage variation is very limited for all the investigated impact categories (ranging from −0.45% in EUm to 2.14% in EUf), the sensitivity check has highlighted that the overall impacts barely depend on the selection of dedicated biomass flows. They rather depend on the use of dedicated biomass versus waste biomass, as shown in Table 7. Table 7 refers to a further sensitivity analysis done inverting the percentage contribution (60%) of the most impactful class CL2, consisting of biomass of agricultural and forestry origin and animal manure, with that (18%) of CL3, consisting of waste and sludge. The impact reduction (average value of around 50%) has confirmed that the hotspot of the investigated system is represented by the dedicated biomass, thus calling for the shift of electricity production from dedicated biomass to waste and sludge to produce biogas and achieve an effective improvement of the environmental performance of biogas supply chain.

4. Discussion

The LCA investigation of the production of electricity from biogas in Italy, which was carried out in the framework of the ARCADIA project, can be discussed in two ways. On the one hand, the development of a specialized database tailored to a specific site aims at gaining further insight into the environmental aspects of the Italian bioenergy system. The advantages deriving from a national database are presented in Section 4.1. On the other hand, the LCA results are intended to provide suitable recommendations in the decision-making process in order to enhance the sustainability of energy systems. Therefore, in light of the hotspots identified by means of LCA, some further considerations about the sustainability of renewable energy sources can be derived. In particular, biogas plays a significant role in achieving the goals outlined in the RePowerEU plan, which focuses on broadening the gas supply and lessening the European Union’s reliance on fossil fuels [58]. In a broader perspective, biogas serves multiple energy purposes, encompassing electricity and heat generation, as well as acting as a viable transport fuel, as a feedstock for industrial processes, and as biomethane injected into the natural gas grid, if technically and economically feasible. Indeed, biogas production is increasingly raising interest, especially because biogas can be upgraded into biomethane, with higher and more stable energy content, thus providing many advantages such as (i) offering a concrete possibility to contribute to the decarbonization of the energy sector; (ii) paving the way for diversifying gas supply; (iii) reducing the EU’s dependence on fossil fuels and on fluctuating natural gas price and (iv) tackling the climate crisis [29]. In such a context, Section 4.2 presents some projections about renewable energy sources, with a special focus on the upgrading of biogas to biomethane.

4.1. Added Value of Environmental Assessments Based on Site-Specific Database

The development of an Italian LCA database has required a severe survey of value chains to be investigated. An insight into energy supply is undoubtedly compelling due to the strong influence that energy requirements generally have on LCA results. In this paper, in particular, the contribution of electricity from biogas to the Italian electricity mix has been investigated in terms of environmental impacts, with the aim of identifying the environmental benefits and drawbacks of the biogas supply chain. In fact, even though renewable energy sources are generally labeled as green, their environmental performance cannot be taken for granted, and a careful evaluation from a life cycle perspective is always recommended to avoid misleading remarks [57]. According to the scientific literature, the main hotspot of the biogas supply chain is represented by the cultivation of dedicated biomass, hence the need to divert from them and focus on waste and residual biomasses following the circular economy principles [59,60,61]. Indeed, the small contribution of CL3 to the overall generated impacts reflects how the composition of biomass feedstock used for biogas production affects the environmental performance of the supply chain. If waste biomass is utilized in the zero-burden approach, no environmental burdens are loaded on biomass production, and the impacts are very limited. Conversely, the cultivation of dedicated crops generates higher impacts, mainly due to the use of fertilizers, as for CL1 and CL2. Therefore, the discriminating factor for making the investigated supply chain environmentally sustainable is the use of residual biomass. Local specificities in biomass supply should not be disregarded in an LCA study since the composition of biomass used for biogas production may widely vary, thus affecting the generation of electricity and the related impacts. However, the datasets related to electricity country mix, in most commercially available LCA databases, rely on flows that are not always specific to the selected country. For instance, the biogas dataset, included in the electricity Italian mix of the EcoInvent database, is referred to all countries in the rest of the world, except Switzerland. This may lead to a generalization that threatens the reliability of LCA in effectively modeling the investigated system, as highlighted by Gradin and Björklund [62]. Therefore, in order to ensure high-quality datasets in the ARCADIA project, data specific to the Italian context have been retrieved for the development of all datasets.
In particular, as displayed in Figure 9, four different datasets related to biogas have been developed, and value has been given to bioenergy sources in the national electricity mix, with the aim of achieving representative results and overcoming the limits of streamlined assessments. Indeed, two main steps of the biogas value chain, namely the production of biomass and the transformation technologies used, have been carefully contextualized. The former is strictly linked to the geography of the investigated territory: climatic conditions, water availability, density of land use and soil type deeply influence production conditions. At the same time, transportation activities depend on local features. Transformation technologies are also strongly affected by location and timeframe: technologies develop over time, influencing the efficiency of production methods, and must adapt to changing regulatory frameworks. A dataset that accounts for locally produced biomasses and considers transformation technologies specific to the national context guarantees LCA reliable results is able to identify the real hotspots and suggests robust improvements towards sustainability.

4.2. Future Perspective on Upgrading Biogas to Biomethane

In spite of the stagnation of the biogas market after 2016, the upgrading of biogas to produce biomethane is fast growing as a consequence of European energy policies. In fact, biogas/biomethane production has been included in the EU Net-Zero Industry Act [63] and recognized as strategic for future EU clean technology development and energy security. The REPowerEU plan [64] has set new ambitious biomethane production targets (35 bcm, by 2030), including the establishment of the Biomethane Industrial Partnership (BIP) [65], which promotes participatory multi-stakeholder engagement among the Commission, EU countries, industry representatives, feedstock producers, academia, and NGOs.
Today, the EU is the largest producer of biomethane worldwide, with a production of 3 bcm and 880 biomethane plants in 2020 in 21 European countries. However, the production of biomethane is still low (32 TWh or 3 bcm) compared to the overall biogas supply (18 bcm). In order to reach the REPowerEU target for biomethane production, it is of fundamental importance to ramp up its production in the short-term scenario, both installing new plants and retrofitting existing CHP-based biogas plants. The potential biogas and biomethane production, firstly estimated between 35 and 42 bcm for 2030 [66], is projected to reach 167 bcm by 2050, covering 62% of gas demand [16]. Other estimates of the biomethane production potential indicate a potential of 91 bcm from biogas and 60 bcm from gasification for 2050 [64], while the International Energy Agency (IEA) calculates Europe’s overall biomethane potential of 125 bcm for 2040 [66]. RePowerEU can boost the manufacturing capacity and related industries producing materials, machinery, and components, making sure that this part of the value chain stays in Europe. EBA estimates that to reach the RePowerEU targets, around 5000 additional biogas plants with biomethane upgrading are needed in Europe (with an EUD 83 billion investment) [67].
Current manufacturing capabilities in the EU cover the demand for major biomethane plant components. The need to reach the ambitious 2030 targets requires high annual deployment rates of biomethane plants and equipment supply and a significant annual increase in biomethane production. The main obstacle to biomethane development relies on high capital and operation costs, particularly for the biogas production step. In addition, investment costs are needed for upgrading and grid injection (compressors, pipeline to the grid, etc.). At the moment, biogas and biomethane facilities are on a small to medium scale due to the limited availability of feedstock, leading to high costs of biomethane compared to natural gas. The deployment of biogas and biomethane production depends, in the first place, on low-cost and abundant feedstocks, such as residual biomass, close to the plant. The trend to move away from dedicated crops (such as silage maize) to wastes limits the amount of available feedstock but, at the same time, ensures an environmentally and economically sustainable production. Also, grid injection is not always possible, as biogas and biomethane plants are built where feedstock is available, while the gas grid is not well developed in all regions of the EU [68]. According to EBA [69], the biomethane production cost in the EU ranges from EUD 55/MWh to EUD 100/MWh, depending on plant size, location, feedstock and setup of the plant, which puts it at a disadvantage when compared to natural gas. As most operators are farmers or small companies and the investment costs are quite high (in general, between EUD one and two million to upgrade) compared to the average benefits, they depend on a stable business case, which currently requires incentives [70].
The implementing rules of the so-called Ter Biomethane Decree were issued and entered into force in January 2023 [71]. The tariffs differ according to the net production of biomethane: up to 100 standard m3/h, the tariff is EUD 130.14/MWh, whereas, above this size, the tariff is EUD 124.48/MWh, including incentives. Considering the total available budget of EUD 1.7 billion, the upgrading of biogas to biomethane in the near future will allow a step forward in the global sustainability goals of the energy supply chain.

5. Conclusions

This paper represents the first attempt to evaluate the environmental sustainability of the contribution of energy from biogas into the Italian electricity mix. The LCA methodology has demonstrated its suitability in identifying the challenges of the investigated system. The achieved results have indicated that the reliance on dedicated biomass is the main hotspot of the investigated process, highlighting the necessity to shift the production of biogas towards waste and/or residual feedstocks for decreased impacts. The improvement of the environmental performance of the biogas supply chain is an essential requirement for achieving the European and Italian targets on the decarbonization of the energy sector. In fact, biomethane, retrieved from the upgrading of biogas, is proposed as a key product to reach sustainable energy goals. Moreover, the creation of a national LCA database is an operative progress in LCA research, filling the gap of the need for site-specific data to avoid misleading and streamlined LCA results. Indeed, this assessment has been carried out in the broader framework of the ARCADIA project, focusing on priority supply chains of the Italian production system. Due to the agreement between ENEA and the Italian Ministry of the Environment that will last for the next five years, efforts are being made to enhance the methodology and structure of the ARCADIA database, aiming to optimize its accessibility by seamlessly integrating it into commonly utilized LCA software packages. The ARCADIA database is free and represents a valuable Italian initiative in the international context, recognizing the importance of a national database to improve the robustness of LCA studies.

Author Contributions

G.F. contributed to the formal analysis, writing—original draft preparation; A.Z., G.A. and G.F. formal analysis, writing—review and editing; A.C., A.G., V.M., A.Z., G.A. and G.F. investigation, data curation, validation; C.R. and S.S. conceptualization, project administration. All authors have read and agreed to the published version of the manuscript.

Funding

This research was done in the framework of the ARCADIA Project (September 2019–October 2023), which was financed by the “National Operational Programme on Governance and Institutional Capacity 2014–2020”, Axis 3–Specific Objective 3.1–Action 3.1.1. This programme is a 2014–2020 cohesion policy tool funded by the European Union under the European Structural and Investment Funds—ESI Funds.

Data Availability Statement

Data are contained within the article, and for each dataset, the correct reference is reported.

Acknowledgments

The authors would like to acknowledge all the researchers, associations, public authorities, and academics engaged in the ARCADIA project for the valuable discussions and feedback. Many thanks to Riccardo De Lauretis and Eleonora Di Cristofaro from Istituto Superiore per la Protezione e la Ricerca Ambientale (ISPRA).

Conflicts of Interest

The authors declare no conflict of interest. The funders had no role in the design of the study; in the collection, analyses, or interpretation of data; in the writing of the manuscript; or in the decision to publish the results.

References

  1. Communication from the Commission to the European Parliament, the Council, the European Economic and Social Committee and the Committee of the Regions. ‘Fit for 55’: Delivering the EU’s 2030 Climate Target on the Way to Climate Neutrality. Available online: https://eur-lex.europa.eu/legal-content/EN/TXT/?uri=CELEX:52021DC0550 (accessed on 3 April 2024).
  2. Pavičić, J.; Novak Mavar, K.; Brkić, V.; Simon, K. Biogas and Biomethane Production and Usage: Technology Development, Advantages and Challenges in Europe. Energies 2022, 15, 2940. [Google Scholar] [CrossRef]
  3. IEA—International Energy Agency. Global Energy Review: CO2 Emissions in 2021. Global Emissions Rebound Sharply to Highest ever Level. 2022. Available online: https://www.iea.org/reports/global-energy-review-co2-emissions-in-2021-2 (accessed on 21 March 2023).
  4. Directive (EU) 2023/2413 of the European Parliament and of the Council of 18 October 2023 Amending Directive (EU) 2018/2001, Regulation (EU) 2018/1999 and Directive 98/70/EC as Regards the Promotion of Energy from Renewable Sources, and Repealing Council Directive (EU) 2015/652. Available online: https://eur-lex.europa.eu/eli/dir/2023/2413/oj (accessed on 24 February 2024).
  5. Zucaro, A.; Fiorentino, G.; Ulgiati, S. Constraints, impacts and benefits of lignocellulose conversion pathways to liquid biofuels and biochemicals. In Lignocellulosic Biomass to Liquid Biofuels; Yousuf, A., Pirozzi, D., Sannino, F., Eds.; Academic Press: London, UK, 2019; pp. 249–282. ISBN 9780128159361. [Google Scholar]
  6. Bedoić, R.; Jurić, F.; Ćosić, B.; Pukšec, T.; Čuček, L.; Duić, N. Beyond energy crops and subsidised electricity—A study on sustainable biogas production and utilisation in advanced energy markets. Energy 2020, 201, 117651. [Google Scholar] [CrossRef]
  7. Commission Regulation (EU) No 147/2013 of 13 February 2013 Amending Regulation (EC) No 1099/2008 of the European Parliament and of the Council on Energy Statistics, as Regards the Implementation of Updates for the Monthly and Annual Energy Statistics. Available online: https://eur-lex.europa.eu/legal-content/EN/TXT/PDF/?uri=CELEX:32013R0147 (accessed on 3 April 2024).
  8. Szyba, M.; Mikulik, J. Energy Production from Biodegradable Waste as an Example of the Circular Economy. Energies 2022, 15, 1269. [Google Scholar] [CrossRef]
  9. Battini, F.; Agostini, A.; Boulamanti, K.; Giuntoli, J.; Amaducci, S. Mitigating the environmental impacts of milk production via anaerobic digestion of manure: Case study of a dairy farm in the Po Valley. Sci. Total Environ. 2014, 481, 196–208. [Google Scholar] [CrossRef] [PubMed]
  10. EurObserv’ER. Employment & Turnover 2020–2022. Available online: https://www.eurobserv-er.org/online-database/ (accessed on 25 June 2023).
  11. Eurostat. Share of Renewable Energy in Gross Final Energy Consumption. Available online: https://ec.europa.eu/eurostat/web/products-eurostat-news/w/DDN-20230119-1 (accessed on 24 May 2024).
  12. GSE—Gestore dei Servizi Energetici, S.p.A. Martino dal Verme, Duilio Lipari, Gabriele Lucido, Vincenzo Maio, Vincenzo Surace e Paolo Liberatore. Rapporto Statistico 2021 Energia da Fonti Rinnovabili in Italia. 2023. Available online: https://www.gse.it/documenti_site/Documenti%20GSE/Rapporti%20statistici/Rapporto%20Statistico%20GSE%20-%20FER%202021.pdf (accessed on 22 June 2023).
  13. Ministerial Decree of 18 December 2008. Recent Regulatory Developments in Italian Gas and Electricity Sectors. Available online: https://www.gop.it/doc_pubblicazioni/13_4doy3q1fg4_eng.pdf (accessed on 1 April 2024).
  14. Carlini, M.; Mosconi, E.M.; Castellucci, S.; Villarini, M.; Colantoni, A. An Economical Evaluation of Anaerobic Digestion Plants Fed with Organic Agro-Industrial Waste. Energies 2017, 10, 1165. [Google Scholar] [CrossRef]
  15. Decreto Ministeriale 6 Luglio 2012—Incentivi per Energia da Fonti Rinnovabili Elettriche non Fotovoltaiche. Available online: https://www.mimit.gov.it/images/stories/normativa/DM_6_luglio_2012_sf.pdf (accessed on 29 November 2021).
  16. EBA—European Biogas Association. Statistical Report 2023. Available online: https://www.europeanbiogas.eu/eba-statistical-report-2023/ (accessed on 26 March 2023).
  17. Communication from the Commission to the European Parliament, the European Council, the Council, the European Economic and Social Committee and the Committee of the Regions. REPowerEU Plan. Available online: https://eur-lex.europa.eu/legal-content/EN/TXT/?uri=COM%3A2022%3A230%3AFIN (accessed on 19 December 2023).
  18. Arcadia. Available online: www.arcadia.enea.it (accessed on 25 February 2023).
  19. Banca Dati Italiana LCA. Available online: https://bancadatiitalianalca.enea.it/Node/ (accessed on 27 February 2023).
  20. ILCD International Life Cycle Data System. Available online: https://eplca.jrc.ec.europa.eu/ilcd.html (accessed on 30 March 2022).
  21. Insola, F.; Bonoli, A.; Buttol, P.; Scalbi, S. Banca dati Italiana LCA: Creazione di dataset sul mix elettrico nazionale. In Proceedings of the Atti del XIV Convegno Della Rete Italiana LCA-IX Convegno Dell’associazione Rete Italiana LCA, Cortina d’Ampezzo, Italy, 9–11 December 2020; ISBN 978-88-8286-416-3. [Google Scholar]
  22. Ripa, M.; Fiorentino, G.; Vacca, V.; Ulgiati, S. The relevance of site-specific data in Life Cycle Assessment (LCA). The case of the municipal solid waste management in the metropolitan city of Naples (Italy). J. Clean. Prod. 2017, 142, 445–460. [Google Scholar] [CrossRef]
  23. Ning, S.-K.; Chang, N.-B.; Hung, M.-C. Comparative streamlined life cycle assessment for two types of municipal solid waste incinerator. J. Clean. Prod. 2013, 53, 56–66. [Google Scholar] [CrossRef]
  24. Notarnicola, B.; Tassielli, G.; Renzulli, P.A.; Di Capua, R.; Saija, G.; Salomone, R.; Primerano, P.; Petti, L.; Raggi, A.; Casolani, N.; et al. Life cycle inventory data for the Italian agri-food sector: Background, sources and methodological aspects. Int. J. Life Cycle Assess. 2022. [Google Scholar] [CrossRef]
  25. Scalbi, S.; Buttol, P.; Rinaldi, C. La banca dati italiana LCA BDI-LCA. In Proceedings of the Atti del XV Convegno della rete Italiana LCA- IX Convegno Dell’associazione Rete Italiana LCA, Università Mediterranea di Reggio Calabria, Reggio Calabria, Italy, 22–24 September 2021; ISBN 979122004564. [Google Scholar]
  26. Flagship 2a. Available online: https://www.lifecycleinitiative.org/activities/phase-iii/data-and-database-management/ (accessed on 8 May 2024).
  27. Technical Helpdesk for National LCA Databases. Available online: https://www.oneplanetnetwork.org/knowledge-centre/projects/technical-helpdesk-national-lca-databases (accessed on 8 May 2024).
  28. Global LCA Data Access Network. Available online: https://www.globallcadataaccess.org/ (accessed on 8 May 2024).
  29. Florio, C.; Fiorentino, G.; Corcelli, F.; Ulgiati, S. A Life Cycle Assessment of Biomethane Production from Waste Feedstock Through Different Upgrading Technologies. Energies 2019, 12, 718. [Google Scholar] [CrossRef]
  30. Ncube, A.; Cocker, J.; Ellis, D.; Fiorentino, G. Biogas from source separated organic waste within a circular and life cycle perspective. A case study in Ontario, Canada. Environ. Sustain. Indic. 2021, 11, 100134. [Google Scholar] [CrossRef]
  31. Pirelli, T.; Chiumenti, A.; Morese, M.M.; Bonati, G.; Fabiani, S.; Pulighe, G. Environmental sustainability of the biogas pathway in Italy through the methodology of the Global Bioenergy Partnership. J. Clean. Prod. 2021, 318, 128483. [Google Scholar] [CrossRef]
  32. Sica, D.; Esposito, B.; Supino, S.; Malandrino, O.; Sessa, M.R. Biogas-based systems: An opportunity towards a post-fossil and circular economy perspective in Italy. Energy Policy 2023, 182, 113719. [Google Scholar] [CrossRef]
  33. GSE—Gestore dei Servizi Energetici, S.p.A. Alessio Agrillo, Martino dal Verme, Paolo Liberatore, Duilio Lipari, Gabriele Lucido, Vincenzo Maio, Vincenzo Surace. Rapporto Statistico 2019 Fonti Rinnovabili. 2021. Available online: https://www.gse.it/documenti_site/Documenti%20GSE/Rapporti%20statistici/Rapporto%20Statistico%20GSE%20-%20FER%202019.pdf (accessed on 25 March 2023).
  34. Gestore Servizi Energetici (GSE)—Atlaimpianti 2020. Available online: https://www.gse.it/dati-e-scenarios/atlaimpianti) (accessed on 25 November 2023).
  35. ILCD Handbook, European Commission, Joint Research Centre and Institute for Environment and Sustainability, “International Reference Life Cycle Data System (ILCD) Handbook—General Guide for Life Cycle Assessment—Detailed Guidance”, First Edition March 2010. Available online: https://eplca.jrc.ec.europa.eu/uploads/ILCD-Handbook-General-guide-for-LCA-DETAILED-GUIDANCE-12March2010-ISBN-fin-v1.0-EN.pdf (accessed on 2 July 2024).
  36. ISO 14040; Environmental Management—Life Cycle Assessment—Principles and Framework. ISO (International Organization for Standardization): Geneva, Switzerland, 2006. Available online: https://www.iso.org/standard/37456.html (accessed on 20 December 2023).
  37. ISO 14044; Environmental Management—Life Cycle Assessment—Requirements and Guidelines. ISO (International Organization for Standardization): Geneva, Switzerland, 2006. Available online: https://www.iso.org/standard/38498.html (accessed on 20 December 2023).
  38. Roos, A.; Ahlgren, S. Consequential life cycle assessment of bioenergy systems—A literature review. J. Clean. Prod. 2018, 189, 358–373. [Google Scholar] [CrossRef]
  39. Alcaraz, M.L.; Noshadravan, A.; Zgola, M.; Kirchain, R.E.; Olivetti, E.A. Streamlined life cycle assessment: A case study on tablets and integrated circuits. J. Clean. Prod. 2018, 200, 819–826. [Google Scholar] [CrossRef]
  40. Ekvall, T.; Assefa, G.; Björklund, A.; Eriksson, O.; Finnveden, G. What life-cycle assessment does and does not do in assessments of waste management. Waste Manag. 2007, 27, 989–996. [Google Scholar] [CrossRef] [PubMed]
  41. Finnveden, G.; Hauschild, M.Z.; Ekvall, T.; Guinée, J.; Heijungs, R.; Hellweg, S.; Koehler, A.; Pennington, D.; Suh, S. Recent developments in life cycle assessment. J. Environ Manag. 2009, 91, 1–21. [Google Scholar] [CrossRef]
  42. Aziz, N.I.H.A.; Hanafiah, M.M.; Gheewala, S.H.; Ismail, H. Bioenergy for a Cleaner Future: A Case Study of Sustainable Biogas Supply Chain in the Malaysian Energy Sector. Sustainability 2020, 12, 3213. [Google Scholar] [CrossRef]
  43. Reichhalter, H.; Bozzo, A.; Dal Savio, S.; Guerra, T. Analisi Energetica, Ambientale ed Economica di Impianti a Biogas in Provincia di Bolzano–Relazione Conclusiva. 2011. Available online: http://www.provincia.bz.it/agricoltura/download/Bilancio_ecologico_di_impianti_a_biogas.pdf (accessed on 20 December 2021).
  44. Herambiente, T. Dichiarazione Ambientale 2020 Relativa al Complesso Impiantistico Via Traversagno 30, Località Voltana, Lugo (RA). 2020. Available online: https://ha.gruppohera.it/binary/hera_herambiente_r15/dichiarazioni_ambientali/Dichiarazione_Ambientale_Via_Traversagno_Voltana.1597749927.pdf (accessed on 20 December 2021).
  45. Busato, J. Analisi LCA del Biogas Prodotto da un Mix Agrozootecnico in un’azienda del Settore Agricolo Considerando Diversi Utilizzi Finali. Master’s Thesis, University of Padova, Padua, Italy, 2020. [Google Scholar]
  46. Lijó, L.; González-García, S.; Bacenetti, J.; Fiala, M.; Feijoo, G.; Lema, J.M.; Moreira, M.T. Life Cycle Assessment of electricity production in Italy from anaerobic co-digestion of pig slurry and energy crops. Renew. Energy 2014, 68, 625–635. [Google Scholar] [CrossRef]
  47. ISPRA (Istituto Superiore per la Protezione e la Ricerca Ambientale, Rome, Italy). Personal communication, 2019.
  48. National Inventory Report (NIR) 2021. Available online: https://unfccc.int/documents/271491. (accessed on 6 July 2022).
  49. Informative Inventory Report (IIR) 2021. Available online: https://www.isprambiente.gov.it/files2021/pubblicazioni/rapporti/rapp-342-2021.pdf (accessed on 8 July 2022).
  50. Decreto Ministeriale 2 Marzo 2010—Attuazione Della Legge 27 Dicembre 2006, n. 296, Sulla Tracciabilità Delle Biomasse per la Produzione di Energia Elettrica. Available online: https://www.politicheagricole.it/flex/cm/pages/ServeBLOB.php/L/IT/IDPagina/13563 (accessed on 23 October 2022).
  51. Progetto Biomasse. ENAMA (Ente Nazionale per la Meccanizzazione Agricola). Available online: https://www.progettobiomasse.it (accessed on 4 September 2021).
  52. Jungbluth, N.; Chudacoff, M.; Dauriat, A.; Dinkel, F.; Doka, G.; Faist Emmenegger, M.; Gnansounou, E.; Kljun, N.; Schleiss, K.; Spielmann, M.; et al. Life Cycle Inventories of Bioenergy; coinvent report No.17; Swiss Centre for Life Cycle Inventories: Dübendorf, Switzerland, 2007. [Google Scholar]
  53. Bejan, A. Exergy analysis of thermal, chemical and metallurgical processes. Int J Heat Fluid Flow 1989, 10, 87–88. [Google Scholar] [CrossRef]
  54. Zampori, L.; Pant, R. Suggestions for Updating the Product Environmental Footprint (PEF) Method; EUR 29682 EN; Publications Office of the European Union: Luxembourg, 2019; ISBN 978-92-76-00654-1. JRC115959. [Google Scholar] [CrossRef]
  55. Claus, S.; Taube, F.; Wienforth, B.; Svoboda, N.; Sieling, K.; Kage, H.; Senbayram, M.; Dittert, K.; Gericke, D.; Pacholski, A.; et al. Life-cycle assessment of biogas production under the environmental conditions of northern Germany: Greenhouse gas balance. J. Agric. Sci. 2014, 152 (Suppl. S1), 172–181. [Google Scholar] [CrossRef]
  56. Björnsson, L.; Prade, T. Introduction of grass-clover crops as biogas feedstock in cereal-dominated crop rotations. Part II: Effects on greenhouse gas emissions. In Proceedings of the 9th International Conference on Life Cycle Assessment in the Agri-Food Sector (LCA Food 2014), San Francisco, CA, USA, 8–10 October 2014; pp. 8–10, ISBN 978-0-9882145-7-6. [Google Scholar]
  57. Forte, A.; Zucaro, A.; Faugno, S.; Basosi, R.; Fierro, A. Carbon footprint and fossil energy consumption of bio-ethanol fuel production from Arundo donax L. crops on marginal lands of Southern Italy. Energy 2018, 150, 222–235. [Google Scholar] [CrossRef]
  58. Meisterl, K.; Sastre, S.; Puig-Ventosa, I.; Chifari, R.; Martínez Sánchez, L.; Chochois, L.; Fiorentino, G.; Zucaro, A. Circular Bioeconomy in the Metropolitan Area of Barcelona: Policy Recommendations to Optimize Biowaste Management. Sustainability 2024, 16, 1208. [Google Scholar] [CrossRef]
  59. Duval-Dachary, S.; Beauchet, S.; Lorne, D.; Salou, T.; Helias, A.; Pastor, A. Life cycle assessment of bioenergy with carbon capture and storage systems: Critical review of life cycle inventories. Renew. Sustain. Energy Rev. 2023, 183, 113415. [Google Scholar] [CrossRef]
  60. Kozuch, A.; Cywicka, D.; Adamowicz, K.; Wieruszewski, M.; Wysocka-Fijorek, E.; Kiełbasa, P. The Use of Forest Biomass for Energy Purposes in Selected European Countries. Energies 2023, 16, 5776. [Google Scholar] [CrossRef]
  61. Forfora, N.; Azuaje, I.; Vivas, K.A.; Vera, R.E.; Brito, A.; Venditti, R.; Kelley, S.; Tu, Q.; Woodley, A.; Gonzale, R. Evaluating biomass sustainability: Why below-ground carbon sequestration matters. J. Clean Prod. 2024, 439, 140677. [Google Scholar] [CrossRef]
  62. Gradin, K.T.; Björklund, A. The common understanding of simplification approaches in published LCA studies—A review and mapping. Int. J. Life Cycle Assess 2021, 26, 50–63. [Google Scholar] [CrossRef]
  63. Net-Zero Industry Act. Available online: https://european-union.europa.eu/index_en (accessed on 24 April 2023).
  64. REPowerEU: Affordable, Secure and Sustainable Energy for Europe. Available online: https://www.europeanbiogas.eu/the-repowereu-puts-forward-a-biomethane-action-plan-to-scale-up-the-sector-by-2030/ (accessed on 7 April 2024).
  65. Biomethane Industrial Partnership. Available online: https://bip-europe.eu/ (accessed on 8 April 2024).
  66. European Biogas Association (EBA). EBA Statistical Report 2021. Available online: https://www.europeanbiogas.eu/eba-statistical-report-2021/ (accessed on 8 April 2024).
  67. Alberici, S.; Grimme, W.; Toop, G. Biomethane Production Potentials in the EU—Feasibility of REPowerEU 2030 Targets, Production Potentials in the Member Biomethane Production Potentials in the EU. A Gas for Climate Report 2022. Available online: https://www.europeanbiogas.eu/wp-content/uploads/2022/07/GfC_national-biomethane-potentials_070722.pdf (accessed on 21 September 2023).
  68. Motola, V.; Scarlat, N.; Hurtig, O.; Buffi, M.; Georgakaki, A.; Letout, S.; Mountraki, A.; Joanny Ordonez, G. Clean Energy Technology Observatory: Bioenergy in the European Union—2022 Status Report on Technology Development, Trends, Value Chains and Markets. Publications Office of the European Union: Luxembourg, 2022. [CrossRef]
  69. European Biogas Association (EBA). Statistical Report 2022 Tracking Biogas and Biomethane 2022. Available online: https://www.europeanbiogas.eu/__trashed-3/ (accessed on 9 May 2024).
  70. Ardolino, F.; Cardamone, G.F.; Parrillo, F.; Arena, U. Biogas-to-biomethane upgrading: A comparative review and assessment in a life cycle perspective. Renew. Sustain. Energy Rev. 2021, 139, 110588. [Google Scholar] [CrossRef]
  71. Ministry of Environment and Energy Security. Directorial Decree n 23, 13 January 2023 “Approval of the Application Regulations of Ministerial Decree no 340 of 15 September 2022 Containing Provisions to Encourage the Introduction of Biomethane into the Natural Gas Network”. Available online: https://www.mase.gov.it/bandi/decreto-direttoriale-n-23-del-13-gennaio-2023-di-approvazione-delle-regole-applicative-del (accessed on 14 May 2021).
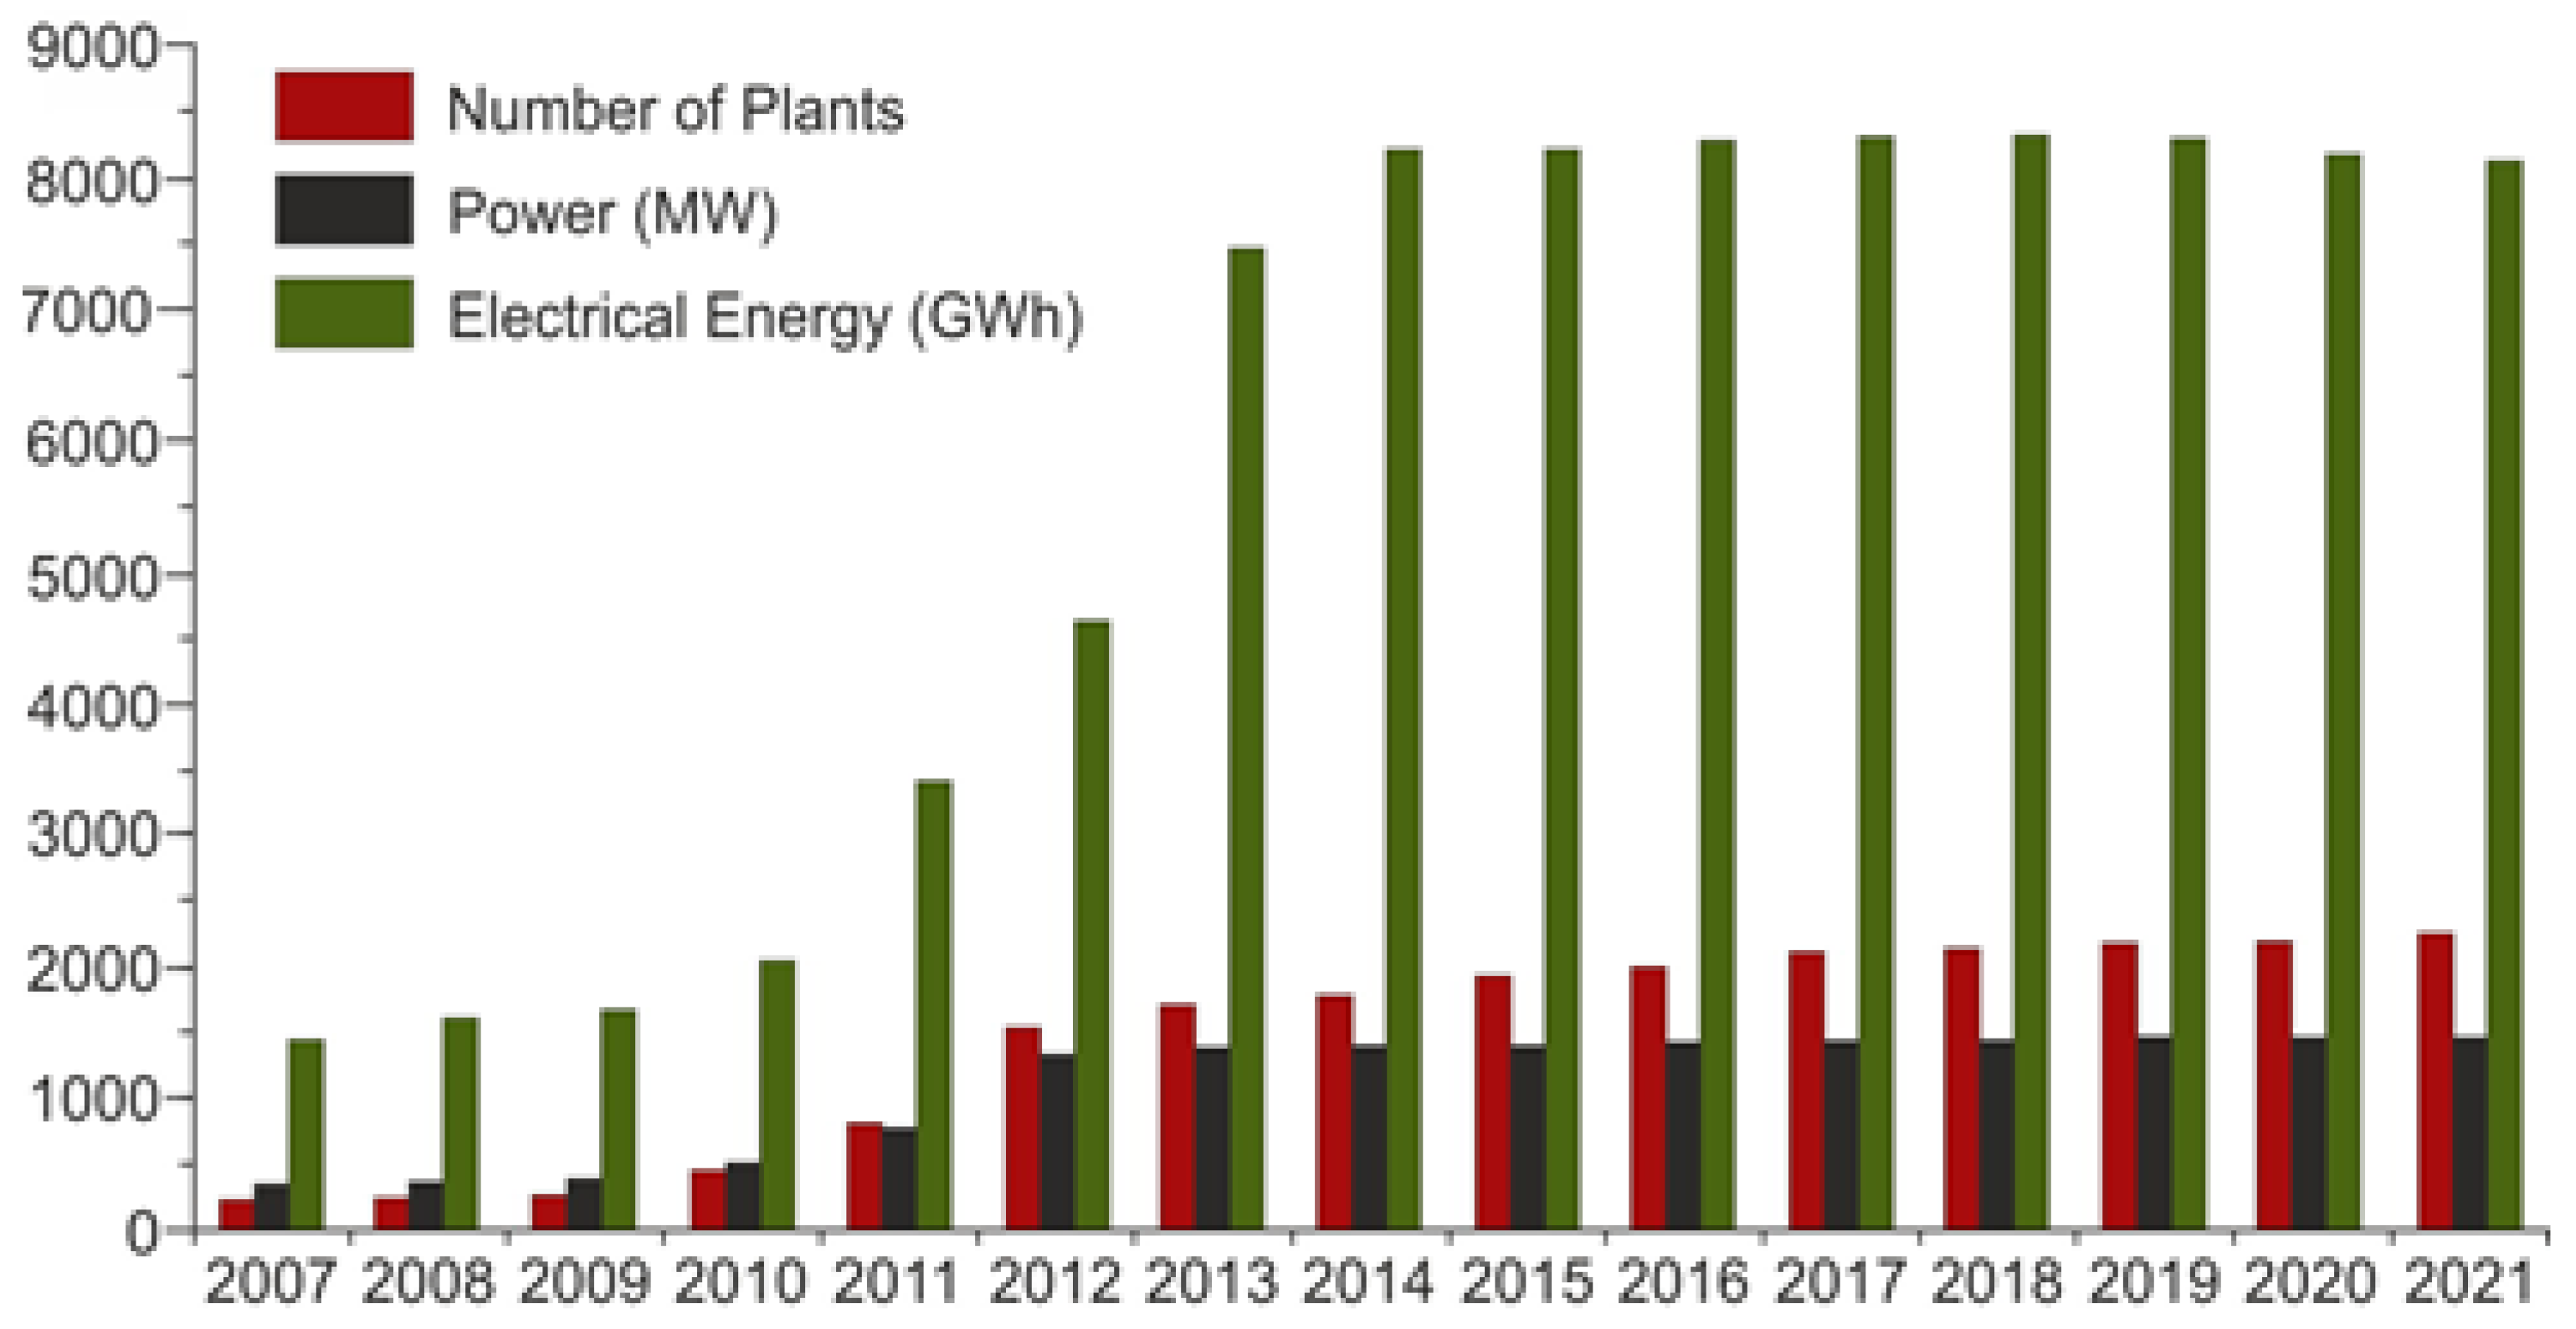
Figure 1. A trend of the Italian biogas installations in terms of number of plants, nominal power, and electricity production (period 2007–2021).
Energies 17 03264 g001
Figure 2. Distribution of the number of biogas plants by power installed.
Energies 17 03264 g002
Figure 3. Supply chain of energy production from biogas.
Energies 17 03264 g003
Figure 4. System boundaries of the system under investigation.
Energies 17 03264 g004
Figure 5. Percentage contribution to the total impacts of electricity production from biogas in Italy in 2021, coming from CL1 (biogas from agricultural and forestry biomass and animal manure in plants with a nominal power 1–700 kW), CL2 (biogas from agricultural and forestry biomass and animal manure, in plants with a nominal power 701–1700 kW), and CL3 (biogas from waste and sludge).
Energies 17 03264 g005
Figure 6. Breakdown of characterized impacts for the main flows of CL1 (biogas from agricultural and forestry biomass and animal manure, in plants with a nominal power 1–700 kW), CL2 (biogas from agricultural and forestry biomass and animal manure, in plants with a nominal power 701–1700 kW), and CL3 (biogas from waste and sludge), referred to the production of electricity from biogas, in Italy in 2021.
Energies 17 03264 g006
Figure 7. Contributions (in absolute values) to normalized impacts of electricity production from biogas in Italy in 2021, coming from CL1 (biogas from agricultural and forestry biomass and animal manure, in plants with a nominal power 1–700 kW), CL2 (biogas from agricultural and forestry biomass and animal manure, in plants with a nominal power 701–1700 kW) and CL3 (biogas from waste and sludge).
Energies 17 03264 g007
Figure 8. Sensitivity checks for the allocation procedure.
Energies 17 03264 g008
Figure 9. Some of the datasets were developed within the ARCADIA LCA database.
Energies 17 03264 g009
Table 1. Examples of national LCA databases.
ContinentCountryNameWebsite
EuropeFranceBase-Cabonehttp://www.bilans-ges.ademe.fr/en (accessed on 1 April 2024)
GermanyOKOBAUDAT-Sustainable Construction Information Portalhttps://www.oekobaudat.de/en.html (accessed on 1 April 2024)
AsiaChinaCLCD-Chinese Life Cycle Databasehttp://www.ike-global.com/products-2/chinese-lca-database-clcd (accessed on 1 April 2024)
ThailandThai National LCIhttps://www.nstda-tiis.or.th/en/lci-database/ (accessed on 1 April 2024)
JapanIDEA v.2http://idea-lca.com/features/?lang=en/#japanese-database (accessed on 1 April 2024)
IndiaLCA data collection for textiles and agriculture (2017–2018)Included in EcoInvent DB
AmericaU.S.A.U.S. Life Cycle Inventory (LCI)https://www.nrel.gov/lci/ (accessed on 1 April 2024)
CanadaCanadian Raw Material Databasehttps://uwaterloo.ca/canadian-raw-materials-database/ (accessed on 1 April 2024)
BrasilSICV-Banco Nacional de Inventários do Ciclo de Vidahttps://www.gov.br/ibict/pt-br/central-de-conteudos/noticias/2023/maio/sicv-brasil-amplia-sua-base-de-inventarios-do-ciclo-de-vida (accessed on 1 April 2024)
PeruPeru LCA databasehttp://perulca.com/registro/ (accessed on 1 April 2024)
OceaniaAustraliaAusLCI–Australian National LCI Databasehttp://www.auslci.com.au/ (accessed on 1 April 2024)
Table 2. LCI referred to 1 kWh of electricity from biogas in Italy.
Input/Output FlowsUnitCL1CL2CL3
Inputs
Biomass  a
Maize (grain + silage)ton1.46 × 10−32.31 × 10⁻³
Rye grainton1.87 × 10−43.40 × 10⁻⁴
Sweet sorghum (grain + stem)ton9.13 × 10−54.62 × 10⁻⁴
Wheat grainton-8.90 × 10⁻⁵
Barley grainton-7.97 × 10⁻⁶
Sugar beetton-7.86 × 10⁻⁶
Grass silage, organicton-1.28 × 10⁻⁴
Straw, stand-aloneton-9.60 × 10⁻⁷
Livestock manureton3.62 × 10−31.34 × 10⁻³-
Agro-industrial wasteton6.74 × 10−43.12 × 10⁻³-
Water (vegetable, industrial, washing)ton2.13 × 10−44.14 × 10⁻⁴-
Biomass from waste and sludgeton--5.08 × 10⁻³
Anaerobic digestion plant bp2.29 × 10−83.22 × 10−86.70 × 10−8
Cogeneration plant  c
CHP, electricity production unitkWh1.111.111.33
CHP, heat production unitMJ4.013.226.99
Lubricant oil dkg4.02 × 10−49.33 × 10−48.40 × 10−3
Transport  e
Transport, freight, lorry > 32 metric ton, euro6tkm4.24 × 10−29.99 × 10−23.56 × 10−1
Outputs
Energy production
ElectricitykWh111
HeatMJ3.412.736.31
Emissions to air  f
Carbon dioxide, biogenickg4.31 × 10−13.89 × 10−15.95 × 10−1
Methane, biogenickg2.17 × 10−31.10 × 10−31.80 × 10−3
Dinitrogen monoxidekg2.39 × 10−52.16 × 10−53.53 × 10−5
Nitrogen oxideskg7.98 × 10−37.21 × 10−31.18 × 10−2
Carbon monoxide, biogenickg2.39 × 10−32.16 × 10−33.53 × 10−3
NMVOC, non-methane volatile organic compoundskg7.09 × 10−46.41 × 10−41.05 × 10−3
Particulates < 10 umkg7.98 × 10−57.21 × 10−51.18 × 10−4
Particulate < 2.5 umkg7.98 × 10−57.21 × 10−51.18 × 10−4
Carbon blackkg3.20 × 10−62.89 × 10−64.71 × 10−6
Methane, biogenic gkg1.22 × 10−35.02 × 10−34.53 × 10−4
a Date related to biomass amounts derived from monitoring sheets of the ENAMA project [51] for CL1 and CL2, and from environmental declarations [43,44] for CL3. b The process describes the anaerobic digestor, modeled from the EcoInvent v.3.7.1 database, considering an average life of the plant equal to 20 years, and using annual biogas production data from ENAMA project [51] for CL1 and CL2, and environmental declarations [43,44], for CL3. c The processes of electricity and heat production have been modeled from the EcoInvent v.3.7.1 database, excluding biogas inputs and emissions. d The quantity of lubricant for the cogenerator has been calculated considering an input lubricant amount equal to 0.03 g for each MJ of incoming biogas, according to Jungbluth [52]. e The transport has been defined according to the quantity of biomass transported and the distance traveled (assumed to be 70 km, in accordance with the Ministerial Decree 02/03/2010). f Emissions from the cogenerator have been obtained from the ISPRA EF combustion 2019 document [47], “non-industrial” worksheet. g Emissions from the anaerobic digestor have been calculated considering that the quantity of methane released is equal to approximately 1% of the total biogas produced [46], and the average methane content in the biogas is equal to 55% [43,45].
Table 3. Percentages of exergetic allocation for electricity and heat in CL1, CL2 and CL3.
OutputsCL1CL2CL3
Electricity86%89%77%
Heat14%11%23%
Table 4. Impact categories examined in this study.
Impact CategoryUnitAbbreviation
Climate changekg CO2 eqCC
Ozone depletionkg CFC11 eqOD
Ionizing radiationkBq U-235 eqIR
Photochemical ozone formationkg NMVOC eqPOD
Particulate matterdisease inc.PM
Human toxicity, non-cancerCTUhHTnon-c
Human toxicity, cancerCTUhHTc
Acidificationmol H+ eqAC
Eutrophication, freshwaterkg P eqEUf
Eutrophication, marinekg N eqEUm
Eutrophication, terrestrialmol N eqEUt
Ecotoxicity, freshwaterCTUeECT
Land usePtLU
Water usem3 depriv.WU
Resource use, fossilsMJRDf
Resource use, minerals and metalskg Sb eqRDm
Table 5. Characterized impacts calculated for the total production of electricity from biogas, in Italy in 2021. Absolute values of total impacts and of impacts from CL1 (biogas from agricultural and forestry biomass and animal manure, in plants with a nominal power 1–700 kW), CL2 (biogas from agricultural and forestry biomass and animal manure, in plants with a nominal power 701–1700 kW) and CL3 (biogas from waste and sludge).
Impact CategoryUnitTotalCL1CL2CL3
CCkg CO2 eq7.81 × 1091.16 × 1096.35 × 1093.03 × 108
ODkg CFC11 eq4.03 × 1025.86 × 1013.34 × 1021.00 × 101
IRkBq U-235 eq2.06 × 1083.06 × 1071.71 × 1084.34 × 106
PODkg NMVOC eq8.35 × 1071.66 × 1075.22 × 1071.47 × 107
PMdisease inc.9.67 × 1021.64 × 1027.39 × 1026.44 × 101
HTnon-cCTUh1.53 × 1022.48 × 1011.27 × 1021.21
HTcCTUh5.288.05 × 10−14.425.71 × 10−2
ACmol H+ eq8.84 × 1071.38 × 1077.34 × 1071.14 × 106
EUfkg P eq2.63 × 1063.84 × 1052.23 × 1069.87 × 103
EUmkg N eq8.95 × 1071.53 × 1076.90 × 1075.21 × 106
EUtmol N eq4.03 × 1086.75 × 1073.15 × 1082.02 × 107
ECTCTUe6.53 × 10119.69 × 10105.54 × 10112.01 × 109
LUPt6.38 × 10118.48 × 10105.52 × 10118.92 × 108
WUm3 depriv.7.89 × 10101.13 × 10106.76 × 10105.21 × 106
RDfMJ5.09 × 10107.47 × 1094.26 × 10107.71 × 108
RDmkg Sb eq4.33 × 1046.46 × 1033.61 × 1046.63 × 102
Table 6. Comparison between impacts generated from CL2 per kWh in the original scenario and in the sensitivity scenario (with different proxies for modeling the biomass inputs).
Impact CategoryUnitCL2 Original ScenarioCL2 Sensitivity Scenario% Variation
CCkg CO2 eq6.34 × 1096.34 × 1090.08%
ODkg CFC11 eq3.34 × 1023.34 × 1020.12%
IRkBq U-235 eq1.71 × 1081.71 × 108−0.07%
PODkg NMVOC eq5.22 × 1075.22 × 1070.04%
PMdisease inc.7.38 × 1027.38 × 1020.00%
HTnon-cCTUh1.27 × 1021.25 × 1021.27%
HTcCTUh4.414.341.72%
ACmol H+ eq7.33 × 1077.31 × 1070.29%
EUfkg P eq2.23 × 1062.18 × 1062.14%
EUmkg N eq6.90 × 1076.93 × 107−0.45%
EUtmol N eq3.15 × 1083.14 × 1080.45%
ECTCTUe5.54 × 10115.53 × 10110.22%
LUPt5.52 × 10115.43 × 10111.58%
WUm3 depriv.6.75 × 10106.76 × 1010−0.08%
RDfMJ4.26 × 10104.27 × 1010−0.26%
RDmkg Sb eq3.61 × 1043.59 × 1040.48%
Table 7. Comparison between the impacts generated from the original scenario of electricity production from biogas (contribution of CL2 equal to 60% and of CL3 equal to 18%) and the sensitivity scenario (contribution of CL2 equal to 18% and of CL3 equal to 60%).
Impact CategoryUnitElectricity from Biogas-Original ScenarioElectricity from Biogas-Sensitivity Scenario% Variation
CCkg CO2 eq5.02 × 10−19.61 × 10⁻¹−47.80%
ODkg CFC11 eq2.37 × 10−84.96 × 10⁻⁸−52.26%
IRkBq U-235 eq1.19 × 10−22.54 × 10⁻²−53.23%
PODkg NMVOC eq1.00 × 10−21.03 × 10⁻²−2.69%
PMdisease inc.7.38 × 10−81.19 × 10⁻⁷−37.96%
HTnon-cCTUh8.22 × 10−91.88 × 10⁻⁸−56.21%
HTcCTUh2.85 × 10−106.49 × 10⁻¹⁰−56.02%
ACmol H+ eq4.88 × 10−31.09 × 10⁻²−55.11%
EUfkg P eq1.34 × 10−43.23 × 10⁻⁴−58.61%
EUmkg N eq6.56 × 10−31.10 × 10⁻²−40.42%
EUtmol N eq2.82 × 10−24.96 × 10⁻²−43.09%
ECTCTUe3.32 × 1018.03 × 101−58.67%
LUPt3.12 × 1017.85 × 101−60.26%
WUm3 depriv.3.899.70−59.95%
RDfMJ2.816.26−55.11%
RDmkg Sb eq2.40 × 10−65.32 × 10⁻⁶−54.89%
Disclaimer/Publisher’s Note: The statements, opinions and data contained in all publications are solely those of the individual author(s) and contributor(s) and not of MDPI and/or the editor(s). MDPI and/or the editor(s) disclaim responsibility for any injury to people or property resulting from any ideas, methods, instructions or products referred to in the content.