1. Introduction
The role of clean cooking in energy transitions is reflected in Target 7.1.2 of Sustainable Development Goal 7 (access to clean fuels for cooking). The inclusion of access to clean cooking in the SDGs reflects the cross-cutting nature of the impacts of cooking with traditional, polluting fuels. Nearly 4 million deaths each year are linked to household air pollution [
1], mostly from cooking, which predominantly affects women and children. Furthermore, climate-forcing emissions from biomass fuels are estimated to contribute 2% of global emissions [
2]. The combined indirect costs of these impacts on health, gender, and climate are estimated at 2.4 trillion USD per year [
3]. A recently published policy brief predicts that the most recent figure of 2.3 billion people lacking access to clean cooking will fall to only 1.9 billion by 2030 unless fundamentally new approaches are adopted [
4]. Figures highlight stark geographical differences; progress over the last decade has been achieved mostly by countries in Asia, notably India, China, and Indonesia, whereas almost all countries with the lowest access rates are to be found in Africa.
Much of the early work on clean cooking focused on improved biomass cookstoves, driving improvements in combustion efficiency as a means to reducing household energy burdens. However, more recent work on modern cooking highlighted a lack of literature on what and how people actually cook [
5]. It was only in 2008 that Cowan studied the energy used to cook a range of foods using different fuels [
6].
In the absence of data, conventional wisdom suggested that cooking with electricity was not a feasible option for a number of reasons, mostly that it is too expensive, but also because of the quality of the power supply and grid issues [
7]. However, electric cooking (e-Cook) is becoming increasingly viable as an option because of impressive increases in electrification rates over recent years coupled with the advent of high-efficiency electric cooking devices and escalating prices of traditional fuels. There is also growing interest from mini-grid developers who have trialed the use of electric cooking as a means of increasing loads in off-grid communities [
8]. Furthermore, data show that cooking with electricity can be cost competitive with traditional fuels in many countries and, in some instances, can be considerably cheaper. One of the more authoritative studies is ESMAP’s 2020 paper [
9], which uses five case studies to compare not only fuel costs but also the cost of cooking appliances and uses a discounted cash flow analysis to compare levelized costs of cooking with different technologies.
The contribution that cooking with biomass fuels makes to global greenhouse gas emissions is now recognized as substantial, accounting for approximately 2% of global emissions [
2]. Accordingly, policymakers are increasingly concerned about the amounts of energy used by traditional cooking fuels and devices and how that compares to the energy used by modern cooking fuels and devices. This interest is driven by the need to characterize the greenhouse gas emission impacts of transitions in cooking within national plans for decarbonization (and hence their nationally determined contributions (NDCs)) and also for calculations that are required to claim carbon credits and other impact benefits.
When comparing different fuels, most models are based on a “useful energy” requirement to cook food and use measured thermal conversion efficiency figures for different devices to estimate the amount (and cost) of fuels required. The paper fills a gap in the literature by providing new statistical analysis of empirical evidence from multiple countries of ‘real world’ cooking energy requirements using a range of technologies and fuels and a number of electric cooking technologies in particular. This provides policymakers and carbon financiers with more reliable and accurate data with which to make estimates of fuel comparisons. The data are drawn from studies carried out by a range of organizations and companies in a number of countries across Africa and Southeast Asia. The paper, therefore, makes an important contribution by providing a more robust analysis based on a wider dataset and using statistical methods to reflect the diversity of cooking contexts. The paper then develops the novel concept of an energy ratio, representing the energy used by a traditional fuel divided by that needed by a modern device. In order to compare the energy needed to cook using two different fuels, the energy ratio is calculated as the median specific energy consumption when using a traditional fuel divided by the specific energy consumption when using a modern fuel. The paper goes on to consider factors behind the energy ratios and how they differ from conventional approaches, as well as implications of the energy ratios approach on the cost of cooking and carbon finance methods.
2. Background
In order to make progress on Target 7.1.2 of Sustainable Development Goal 7 (“Proportion of population with primary reliance on clean fuels and technology”), households will need to transition from polluting to clean cooking fuels. Many studies have explored factors linked to this transition. Factors highlighted in a number of example studies suggest a number of categories [
10,
11,
12]:
Demographics: income; level of education; gender of household head; urban/rural; lack of awareness.
Household structure: household size; number of meals cooked; type of food cooked; owned or rented; type of dwelling.
Fuels and technologies: fuel prices; price of stove; availability of fuel and stoves; fuel price fluctuations.
Of these, income is consistently identified as a key factor that is linked to the adoption of cleaner cooking fuels. It is not surprising, therefore, to find that many studies generally support the idea of the energy ladder as a model for understanding household decision making, which asserts that as people become better off, they transition from cheaper, inefficient, and polluting technologies toward more costly and efficient technologies [
13].
One characteristic of these types of studies is that they tend to be based on an analysis of data from living standards surveys, so they focus on household demographics. Other studies consider the affordability of fuel and technology combinations and take into account a broader view of more detailed factors. Gill-Wiehl et al. [
14] provide a comprehensive overview of different approaches to assessing affordability, including the following:
The balance between the cost of cooking and overall household expenditure.
Expressing the cost of cooking as a proportion of monthly expenditure.
Considering both the cost of fuel and the capital cost of the stove, along with the implications of each on household finances.
The impact of liquidity constraints on fuel and stove purchasing behaviors.
The ESMAP study [
9] makes the point that some households may well be spending more on cooking fuels than might be regarded as “affordable”, in which case it is of more value to compare the cost of cooking with different fuels in order to identify lower-cost alternatives. Studies that compare the cost of cooking consider not only the cost of the fuel but also the upfront cost of the stove and any associated equipment. Studies on the levelized cost of cooking show that, for all fuels, the daily cost of fuel is the dominant component [
15], but capital cost can nevertheless be a significant addition, and the upfront cost can present a substantial barrier. Capital costs are higher for modern energy appliances, but a mix of technology and business models is beginning to enable manufacturers to address affordability through pay-as-you-go solutions, which are being applied to a range of modern fuels such as LPG, ethanol, biomass, and electric devices [
16].
Cost comparison studies comprise two constituents: the energy needed to cook using different stoves and fuels and the price of each fuel. Any assumptions or study data are of limited applicability because both of these aspects are subject to large variations. Energy consumption varies hugely between dishes; some dishes, such as beans, are energy intensive whilst others, such as ramen, are not. A quick look at some of the MECS cookbooks shows differences in the energy needed to cook different dishes [
17]. This study is concerned with energy consumed in the household kitchen, so it does not take into account the energy used in the food supply chain (e.g., processing and transport). Ramen and pasta are good examples of foods where energy is used in processing so that less fuel is required in the kitchen [
18]. Fuel prices depend on location, e.g., charcoal prices are higher in the city than in the countryside where the charcoal is produced; electricity tariffs charged in some countries (e.g., Ethiopia, Zimbabwe) are an order of magnitude lower than in others (e.g., Kenya and Rwanda) [
19]. A recent study from Kenya illustrates how the relative cost of cooking a meal for a family of four using a range of stoves and fuels has changed over a four-and-a-half-year period. The cost trends show the impact of changes in tax, subsidies, and electricity tariffs [
20]. Fuel prices tend to be lower when fuel is purchased in larger quantities. Fuel prices may be volatile but will inevitably rise in the long term; prices of modern fuels (electricity, LPG, kerosene) are generally set periodically by regulators and will remain stable between price reviews. Unregulated or poorly regulated fuels such as charcoal and firewood tend to exhibit greater price volatility.
Early studies comparing the cost of cooking with different fuels often assert that modern fuels, and electricity in particular, tend to be more expensive than traditional fuels. Nerini et al. concluded that in Kenya, cooking with wood in an improved cookstove (ICS) was the cheapest option and that higher-tier stoves were the most costly [
21]. Jeuland and Pattanayak proposed that the most attractive fuel transition options were from wood-burning stoves to kerosene or LPG and from traditional charcoal stoves to charcoal ICSs [
22]. Toman and Bluff take Jeuland and Pattanayak’s findings and point out that better thermal performance (efficiency) means that LPG and kerosene can be cheaper than biomass fuels [
23]. The paper also provides a useful description of a range of practical considerations that compete with fuel and technology costs when households make cooking fuel choices, such as the collection of fuelwood, cooking time, impacts on health, and access to cash.
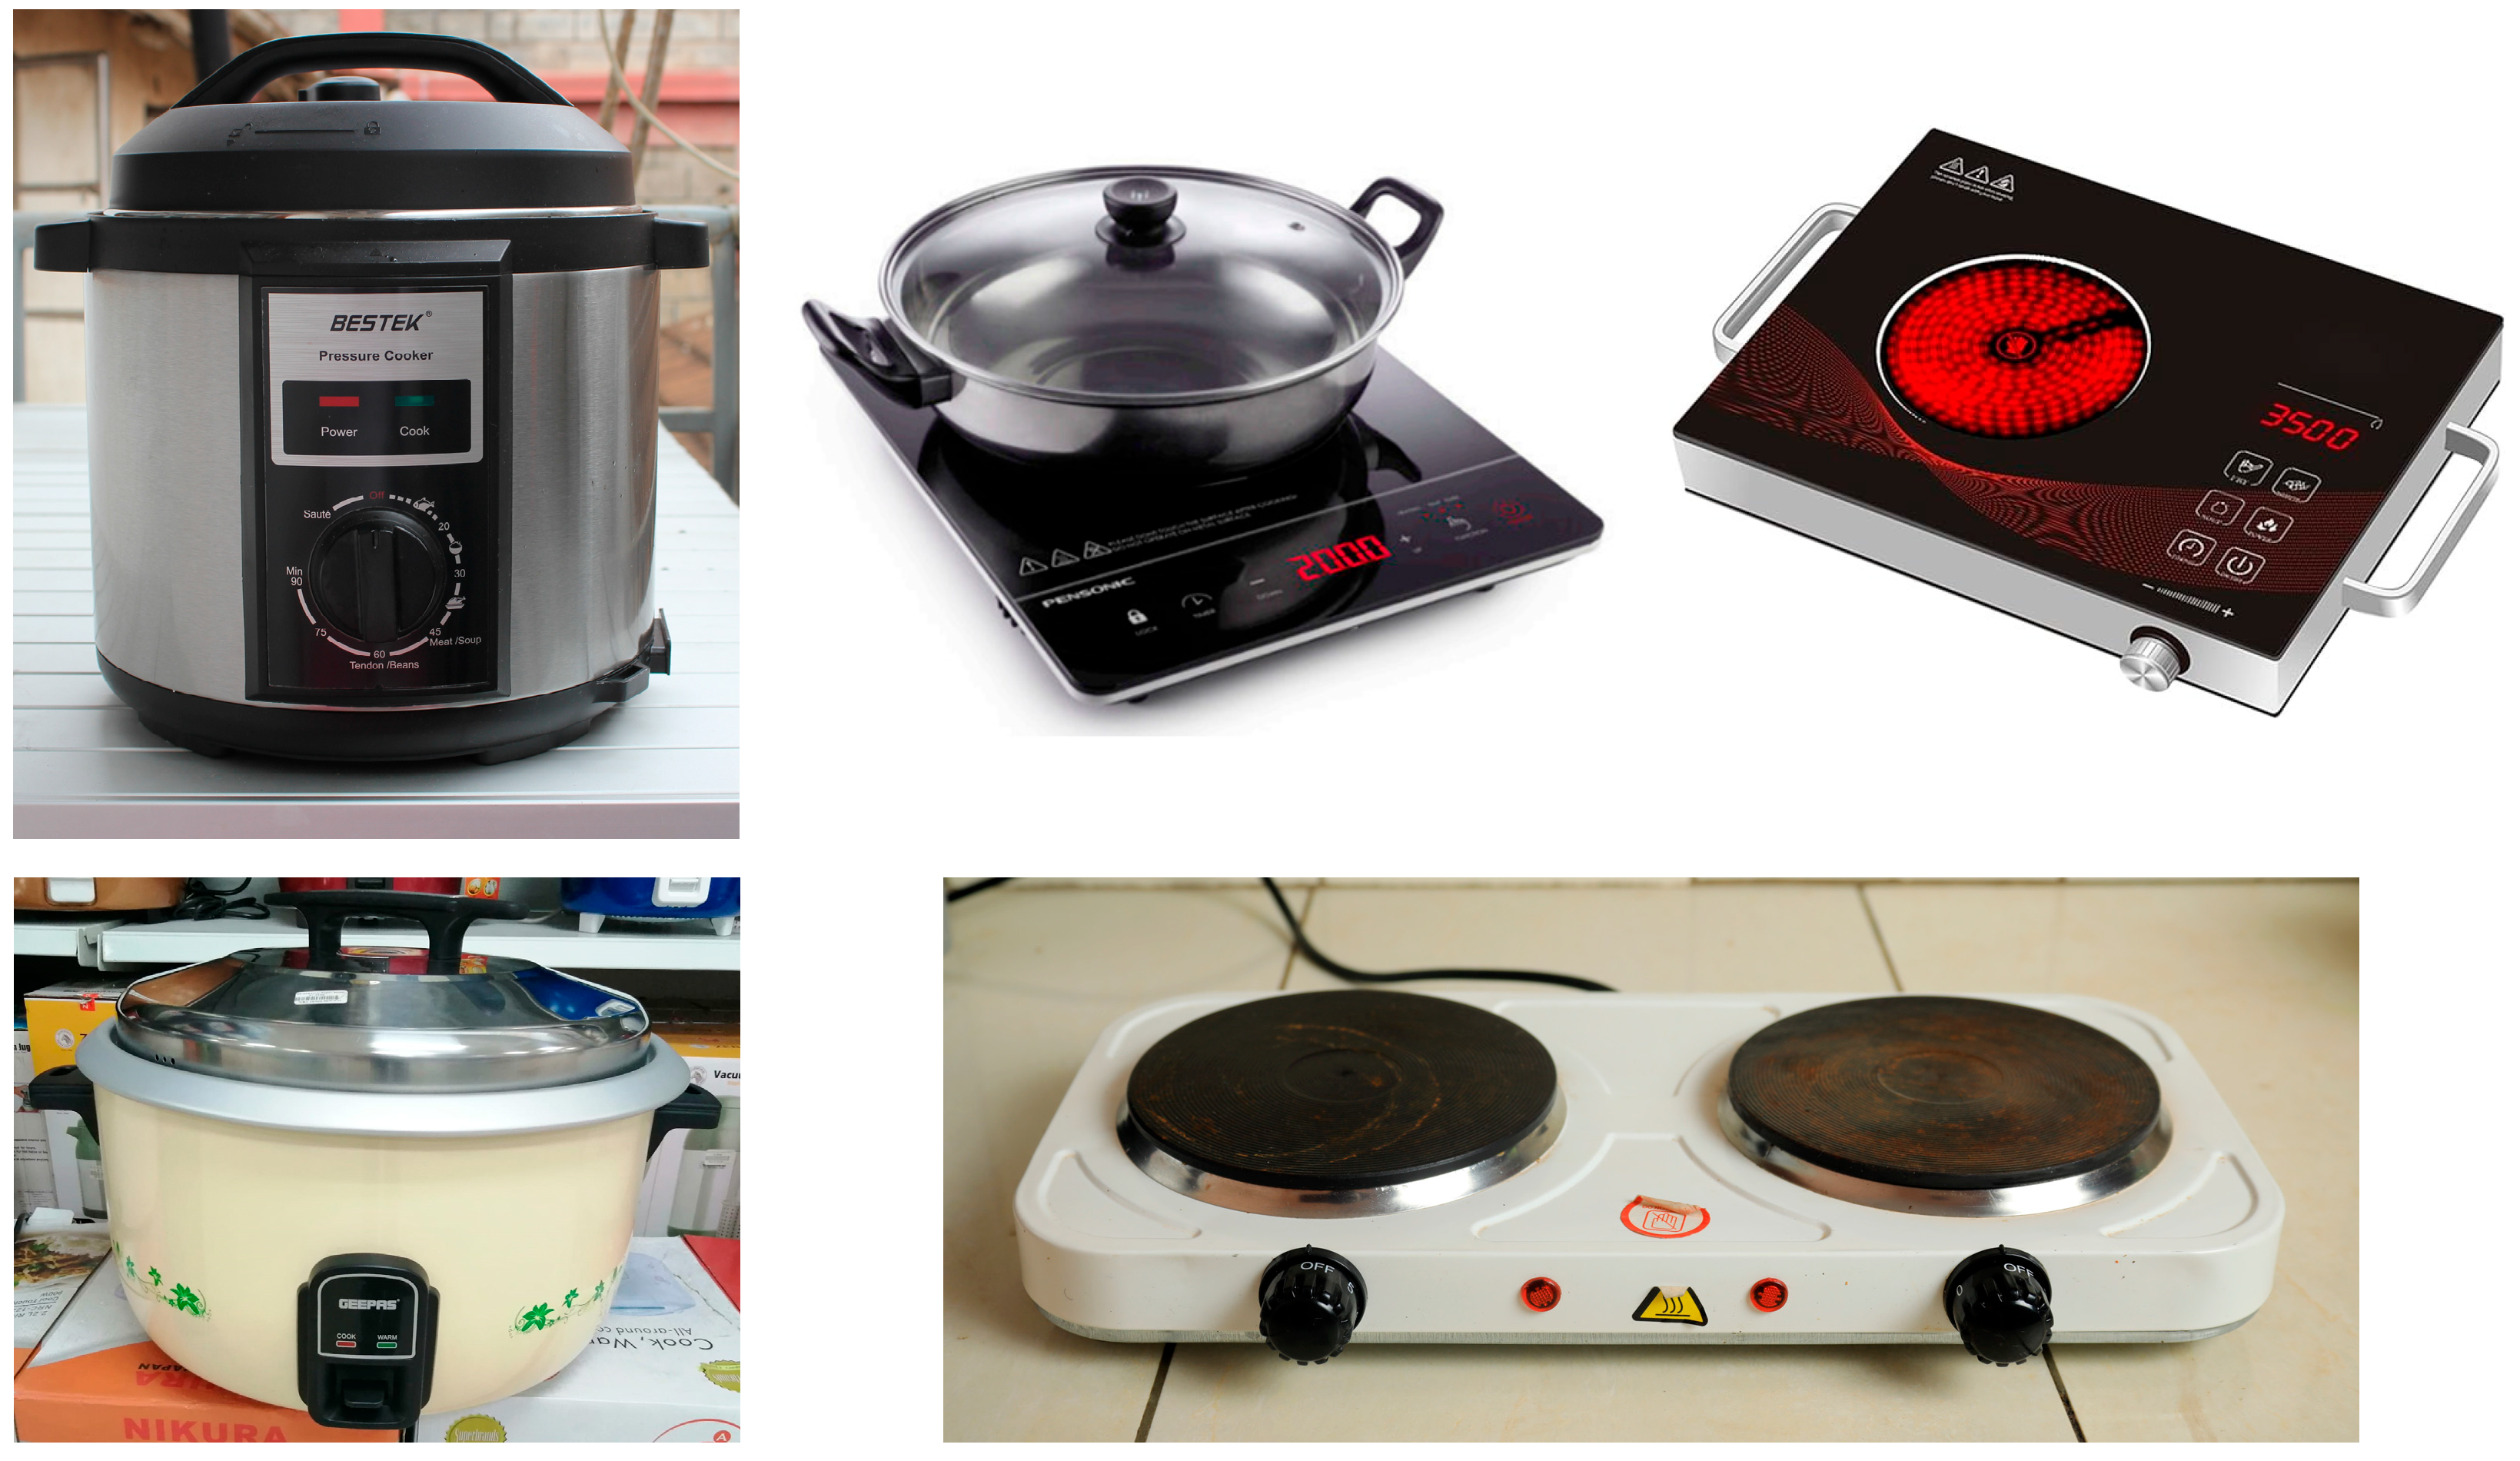
Given the difficulties and potential expense of measuring real-world cooking energy consumption, these studies tend to be based on modeling. Electric cooking tends to be modeled using assumptions of efficiency based on inefficient resistive coil hotplates. Furthermore, many models are based on the principle of conservation of ‘useful energy’ into the pot. For example, Nerini et al. assert: “the value of final energy per meal is independent from the used stove-fuel combination” [
21]. These assumptions inherent in earlier modeling need to be revisited in light of the advent of modern, energy-efficient electric cooking devices, such as induction hobs, air fryers, and electric pressure cookers (EPCs) (
Figure 1). EPCs, for example, minimize cooking energy consumption due to three factors—insulation, automation, and pressurization [
9]. These devices are discussed further in this paper.
However, data on the energy required to cook local meals are beginning to emerge in the literature. For example, a study from Zambia, a country with relatively low electricity tariffs, showed that a range of electric cooking devices were all cheaper than other fuels for cooking a range of local meals [
15]. A Cooking Diaries type of study on electric cooking in Cameroon found that EPCs consumed the least energy of the electric cooking appliances trialled [
24]. Modeling of urban, grid-connected households paying high prices for charcoal shows that the monthly costs of a clean fuel stack of electricity and LPG can be half that of cooking with charcoal [
9]. Note that this is not a criticism of earlier studies, given that these types of devices have only recently reached mainstream markets. Both the EPC and air fryer were launched less than 15 years ago (the EPC in 2009 [
25] and the air fryer in 2010), and they only really arrived in developed country markets less than 10 years ago (the EPC in 2015) and air fryers in 2017 [
26]. Therefore, it is only recently that they have begun to appear in developing country markets [
27]. However, this diversity in cooking contexts and limited existing analysis represents a significant gap in knowledge that this paper is directed at.
3. Methods
The study explores data on the energy used by a range of cooking devices to cook a range of dishes. In order to address the gap in data on modern, energy-efficient electric cooking devices, much of the data presented here pertains to such devices. Energy ratios are presented as a means of comparing the energy used when cooking using two different fuels. The value of this approach is that findings are based on empirical data. Furthermore, they reflect both technical and behavior-related issues that are not taken into account when simply comparing thermal conversion efficiencies.
Over the past five years, the MECS program has provided funding to independent research organizations and companies to carry out different types of studies that have generated data on both energy consumption and costs of cooking associated with a range of fuels and devices. To date, the data have been presented in individual, country-specific reports. In this paper, we pool together as much field data as possible from such studies to create a more robust (larger) dataset and explore what can be learned about the relative energy consumption required for cooking using different fuels.
The collated dataset contains 700 data points for foods cooked using a range of electrical appliances and over 180 data points for foods cooked using traditional fuels (wood, charcoal, and LPG). The paper estimates energy ratios by comparing the most common electric cooking devices with traditional fuels commonly used in the country studies. The approach could equally well be used to compare the performance of any alternative technologies and fuels, such as biogas, ethanol, or even solar cookers.
Most studies have generated data from households with different numbers of people, and some of the controlled cooking studies have used different portion sizes (e.g., meals for 4 or 6). Therefore, the analysis here is based on specific energy consumption (SEC) figures measured in terms of MJ/person/event.
Distinguishing between meals and dishes cooked can be tricky. The paper refers to cooking or heating ‘events’ rather than meals because, in most studies, a heating event can cover either a meal (breakfast, lunch, dinner) or another heating purpose, such as heating water for bathing. A single heating event record could cover multiple purposes, e.g., food could be prepared for both breakfast and lunch (two purposes). Then, a single heating event for a single purpose, such as preparing a dinner, could include several dishes and/or heating water as part of that meal. Of the 600 electric cooking data points involving a single device only, 97% involve cooking only a single dish, as do 72% of the data points for traditional fuels.
Data have been gathered from the following types of studies across a range of countries (see
Table 1).
Cooking Diaries—these studies were conducted by a mix of local universities, NGOs working in energy, and public and private research groups, often working in consortia. A small number of cooks (e.g., 20) were typically asked to cook as normal using a mix of traditional fuels for a couple of weeks (baseline phase) and then swap to electric cooking appliances to cook as much of their menu as possible during a transition phase, typically lasting 2 to 4 weeks. During the study, cooks recorded all of the dishes cooked, along with measurements of the energy used. Participating households were provided with digital scales to measure biomass and LPG use (high-resolution scales were used to measure small reductions in LPG cylinder weight) and plug-in monitors and smart meters to measure electricity use. Enumerators visited participants regularly to transcribe data from paper forms to digital devices and to ensure the forms were filled in correctly. A more detailed description can be found in the Cooking Diaries 3.0 Protocols document in [
28]. Cooking Diaries studies have been conducted as part of a number of MECS-funded research activities from 2017 to 2023, each with slightly different objectives:
- (a)
Understanding consumer behavior carried out by collaborating partners;
- (b)
The Electric Cooking Outreach (ECO) Challenge Fund—one of the challenge fund themes was to investigate whether efficient electric cooking appliances fit the cooking culture and electricity supply context of a given country. Many of the projects commissioned included some kind of Cooking Diaries exercise.
- (c)
All electric cooking studies—a series of studies was commissioned to explore the viability of cooking an entire menu with a range of electric cooking devices.
Controlled Cooking Tests—these studies were carried out by local NGOs and private research groups; cooking was done by staff under laboratory conditions or local cooks under close supervision. A small number of typical dishes were cooked by the same cook but using different fuels and appliances. Tests were repeated multiple times for each dish. Biomass and LPG were measured using digital scales, and electricity was measured using plug-in monitors. The MECS cookbooks, published from 2019 to 2022, present energy, cost, and time data drawn from controlled cooking tests.
Both the Controlled Cooking test and Cooking Diaries methodologies are designed to generate data that is closer to ‘real world’ cooking practices than laboratory testing of devices, such as the water boiling test [
29]. The Controlled Cooking Test described above is a recognized methodology [
30] in which testers define the cooking process for a typical, commonly cooked dish, measuring the energy required to prepare the dish using different technologies and fuels. The focus is on repeatability. However, the methodology acknowledges that different results will be obtained when cooking different dishes. The Kitchen Performance Test (KPT) methodology [
31] employs local people cooking in their own kitchens as part of their daily routines and measures fuel consumption under typical conditions. Daily records of the number of people cooked for and fuel measurements are taken over a short period of at least three days. The methodology acknowledges that it is difficult to control sources of errors and that intervention stoves may be stacked with traditional stoves. The Cooking Diaries methodology takes the household cooking approach one step further by recording the number of people cooked for and fuel consumption at the meal level, as well as recording individual dishes prepared. There are advantages and disadvantages to each of these approaches.
For the purposes of comparing devices, this study has focused on median values of energy as a closer measure of ‘typical’ cooking practice. This is because mean values can be influenced by outliers, such as poorly tended stoves and the lady who cooked 30 chickens for a church gathering. Having said that, the paper highlights the influence of energy-intensive meals that are cooked regularly, if not frequently.
5. Discussion
5.1. The Physics of Cooking
How does the efficiency of an electric pressure cooker compare with that of a simple hotplate? This is a question that is often asked, which is not surprising because most assessments of energy savings are based on comparing thermal conversion efficiencies of improved and traditional stoves.
The US Department of Energy test procedures for conventional cooking products [
32] give a range of measured efficiency values for electric resistance coil hotplates, which were over 70%. However, a study of a cheap single spiral coil hotplate, typical of those commonly used in Ethiopia, concluded that it would boil water at an efficiency of approximately 50% [
33]. If we assume a more conservative efficiency of 60% for a more advanced hotplate, the conservation of useful energy approach based on the energy ratios achieved across Asian dishes prepared indicates that the efficiency of the EPC would be over 110%. This is clearly nonsense.
This exercise illustrates the impact of cooking in a different way. EPCs are a good example, but there are others, such as microwaves. If cooking is done in a pot with a lid (at atmospheric pressure), then a given dish will require a fixed amount of energy to cook, irrespective of how that energy is sourced—the ‘useful’ energy that needs to be transferred into the pot to cook its contents appropriately remains constant. By contrast, when food is cooked at pressure in an EPC, it requires less energy input to the pot to cook.
A pressure cooker is effectively an insulated pot and lid in which the rate of steam escape is minimized/controlled. If steam is not allowed to escape, then the pressure inside the pot increases. The change from a liquid phase to a gaseous phase occurs when the vapor pressure of the liquid is equal to the ambient pressure exerted on the liquid. So as pressure increases in the pot, water molecules in the fluids in the pot need additional heat to gain the speed necessary to evaporate, i.e., the temperature of the pot’s contents continues to increase until the water has sufficient energy to evaporate at a boiling point that is higher than 100 °C. An electric pressure cooker might operate at around 1 atmosphere (100 kPa) pressure above ambient, which leads to a boiling point of around 112 °C. Sensors detect when operating pressure has been reached and then switch off (or modulate down) the heat input, maintaining the contents just at the boiling point. A key feature is that when the lid is sealed and the release valve is closed, steam generation is negligible.
Cooking involves raising the temperature of food until chemical reactions take place; those reactions usually happen faster at higher temperatures, and the higher temperatures also allow the heat to penetrate throughout the food more quickly. Therefore, the higher pressure in an EPC means the food cooks at a higher temperature and, therefore, more quickly. This translates to the EPC delivering a different ‘cooking service’: the same food but cooked in a shorter time with less energy.
Compared with conventional cooking, additional heat is needed to raise the pot and its contents to a higher temperature. Additionally, once at the operating pressure (and hence at the elevated boiling point), the heat loss from the device will be higher than if it were operating at 100 °C, as loss is proportional to temperature difference. However, the rate of heat loss is reduced by much more than this by the low thermal transmittance (U-value) of the appliance construction due to the insulating effect of the air gap around the pot. Furthermore, if the food cooks, for example, in half the time, then the heat loss itself is further reduced, as losses are sustained over a shorter time.
The water boiling test is commonly used as a means of assessing the thermal conversion efficiency of cooking appliances. This measures the energy required to bring a pot of water to a boil and then simmer for 45 min. The efficiency is calculated by comparing the measured energy used with the ‘useful’ energy needed to raise the pot and water to boiling point (calculated from the physics of its mass and density) plus the energy needed to evaporate the water that is lost during the test (calculated from the physics of that evaporation). This methodology is particularly inappropriate to reflect the performance of a pressurized cooking device because EPC cooking times are shorter than for unpressurized devices, yet the WBT specifies a standard simmering duration (45 min); this long test results in an unrealistically high electricity use for the EPC, artificially reducing the measured efficiency. Furthermore, the WBT protocol includes the latent energy of water evaporated as part of the stove ‘output’, but an EPC has very low water evaporation by design, so this also suggests that the WBT does not reflect the operation of an EPC.
As noted, the EPC delivers a different cooking service to traditional stoves, and thus, it is not appropriate to seek to compare efficiencies. Therefore, asking about the efficiency of an EPC, if using standard efficiency measurements, is the wrong question. We should be asking about the specific energy required to cook a specified dish (or meal) when using different fuels and devices. This is what the energy ratios presented in
Table 10 are based on, and it is argued that because they are based on real cooking studies, they are a more meaningful way of estimating energy savings from transitioning from traditional to modern cooking technologies and fuels.
5.2. Energy Ratios and Real-World Cooking
Most modeling is based on a conservation of energy approach, in which the ‘useful’ energy,
Eu, can be calculated as:
where
is thermal conversion efficiency, and
is gross fuel energy input. When comparing the energy input required by two cooking devices to deliver the same amount of useful energy, the energy ratio can be expressed as:
where
E1 and
are the gross fuel energy input and conversion efficiency of device 1, and
E2 and
are the gross fuel energy input and conversion efficiency of a second device. In this way, energy ratios can be estimated from efficiency figures. There is a wide body of literature on the efficiency of stoves, particularly improved biomass stoves. However, for the purposes of this comparison, generic efficiency values for traditional charcoal stoves have been drawn from the UNFCCC Clean Development Mechanism Default values for common parameters [
34], and values for gas and electric devices have been drawn from the US Department of Energy test procedures for conventional cooking products [
32]:
Default value for a pre-project device using charcoal—25%;
Mean efficiency for gas stove—44%;
Mean efficiency for electric coil hotplate—72%;
Mean efficiency for electric induction stove—73%.
Note that under test conditions, there is little difference between electric coil and induction stoves. This was also found by Sweeney et al. [
35], who pointed out that the efficiency of a hotplate is highly dependent on the fraction of the heating surface that is covered by the pot. Note also that this approach cannot be used with EPCs because the ‘useful’ energy required by an EPC is less than that required by conventional cooking devices, as discussed above.
Energy ratios calculated from the dataset are considerably higher than those estimated from these reference efficiencies (
Table 11). This reflects the differences between test protocols and real-world cooking in domestic kitchens, as described earlier. Hager and Morawicki [
36] give a concise summary of ways in which the behavior of the cook can affect energy consumption:
“Patient” vs. “hurried” cooks—hurried cooks who do not bother to control the stove use twice as much energy.
Simmering vs. boiling—controlling heat input to achieve a simmer can save over 70%.
Putting a lid on the pot reduces latent heat of evaporation losses.
How much of the pot capacity is used—a pot filled to 20% capacity uses twice as much energy as a full pot.
Passive cooking—partly cooking a dish, then allowing cooking to complete as it cools down.
Flat pots—using pots that have not been damaged can save over 40%.
Soaking dried foods, e.g., beans—can save up to 20%.
All of these factors cause actual stove performance to deviate from controlled testing. Higher than expected energy ratios do not mean that, when used in a kitchen, thermal conversion efficiencies of stoves deviate substantially from test conditions, but rather that the amount of energy delivered varies from stove to stove and depends on the behavior of the cook. This cannot be referred to as ‘useful’ energy because a good deal of it will be ‘wasted’ in the ways described in the list of behaviors above, i.e., the conservation of useful energy assumption does not hold. The features of the EPC mean that wastage is minimized, e.g., automated control ensures optimum power input, automated control stops cooking when the food is ready, and the sealed lid minimizes evaporation losses.
Differences between energy ratios from the dataset and reference values are highest for charcoal comparisons. This suggests that the discrepancy between the energy actually delivered and the ‘useful’ energy needed to cook the food is greatest for charcoal. Intuitively, this makes sense because charcoal delivers wasted energy when heating up and cooling down, and the rate of heat release cannot be precisely controlled. This is in contrast to LPG and electric stoves, which can be controlled at the turn of a knob. Indeed, the LPG and electric ratios from the dataset are much closer to those derived from reference efficiencies.
5.3. Energy Ratios and the Cost of Cooking
The energy ratios presented here will be of value to anybody working to promote clean cooking and modelers in particular. It is asserted that these energy ratios provide a more reliable and accurate means of comparing the energy consumption (and cost) when cooking using different fuels than commonly used approaches that rely on device thermal conversion efficiencies. Approaches to transitioning to modern cooking fuels typically start with an assessment of baseline fuel use, which can be measured. The amount of ‘useful energy’ delivered to the pot is calculated using a thermal conversion efficiency, typically derived through a water boiling test. The equivalent amount of modern fuel required is then calculated by applying the thermal conversion efficiency of the modern fuel device to the useful energy. Energy ratios provide an alternative approach to estimating the equivalent amount of modern fuel required by simply dividing the traditional fuel consumption by the energy ratio corresponding to the fuels to be switched.
The results imply that charcoal use is higher than might be expected, which is probably due to the range of control and behavioral factors described above. This means that the cost to the household of transitioning from charcoal to electric cooking will be lower than predicted using traditional approaches.
Ascertaining the cost of cooking with traditional fuels is notoriously difficult because everybody pays a different price depending on location, season, quantities of fuel, etc. Data from the MECS studies show large variations in electricity tariffs between countries as well as access rates; tariffs in eight of the study countries varied by a factor of over 6 (see
Table 12). On the other hand, retail prices of LPG were relatively consistent. The relative costs of cooking with modern fuels will, therefore, depend on the combination of local fuel prices. Relative costs of cooking have been estimated using data from the controlled cooking tests and show that, overall, the cost of cooking with an EPC is 27% of the cost of using LPG and 20% of the cost of using charcoal (
Table 13). However, EPCs are the most expensive of the electric cooking devices, retailing at around 60–100 USD. Induction and infrared single hobs typically cost less than half of this, simple rice cookers approximately one quarter, and single burner hotplates can be found for 15 USD.
A detailed analysis of the cost of cooking is outside the scope of this paper; [
9] provides analysis for different fuels and e-Cook appliances for a set of case study countries and cooking contexts. It is emphasized that this paper considers only household costs in fuel transitions; a description of revenue and costs to the utility of meeting additional loads from cooking is also beyond the scope of this paper, and evidence has yet to appear in the literature. However, current thinking appears to suggest that the impact (and, therefore, the costs) will be minimal. For example, a recent study on the Zambian power sector concluded that the impact on additional energy would be less than 1% of total demand, although the additional demand could be higher [
38].
5.4. Data Needs for Carbon Credits
A significant source of the funding needed to scale clean cooking is expected to be via carbon and other impact markets, which are structured with results-based payments delivered upon achievement of emission savings [
39]. The methodologies used to calculate the payments are based on measurements of fuel use for cooking by a sample of households in the baseline followed by repeat measurements using the new stove, plus surveys of reported usage, with reductions in emissions related to efficiency improvement and/or fuel switch.
Some modern energy cooking solutions are already being deployed with Internet of Things (IoT) technology, allowing data collection for time and energy used. These are typically implemented to support pay-as-you-go business models. However, they can also deliver accurate data on the energy used for cooking, avoiding the uncertainties inherent in usage surveys. Gold Standard published a methodology to calculate carbon credits for modern energy cooking (MEC) devices based on metering or other measurement of actual energy use for cooking [
40]. The aim of the new methodology is to produce a more accurate measurement of emission reductions and thus create carbon credits with higher integrity, but also to make the carbon credit project process simpler and less expensive by reducing the amount of survey work required.
Electricity utilities in different countries have different fuel generation mixes. Among the countries listed in
Table 12, the proportion of electricity generated from non-fossil fuels ranges from 1.5% in Bangladesh to 100% in Nepal [
41]. Most of the African countries in the table are largely dependent on non-fossil fuels, with the exception of Tanzania, which makes extensive use of indigenous gas reserves. Carbon methodologies take account of carbon in the generating fuel mix when assessing the emissions reductions associated with a transition to cooking with electricity.
The first version of the new methodology was based on comparing the efficiencies of the baseline and project devices in delivering a certain amount of cooking. However, as this paper shows, simple efficiency values cannot represent the energy performance advantages of MEC devices. A revision of the methodology was developed to allow calculations based instead on the specific energy consumption of the baseline and project stoves, with the carbon emission savings thus dependent on the energy ratios developed earlier.
SEC values reported in an earlier working paper version of this research [
42] were adopted by Gold Standard as suggested default values for use in the methodology. High-quality data on energy use for cooking with different fuels are thus essential to support the expansion of this important element in scaling up to clean cooking.
6. Limitations of the Study
The assessment of energy ratios presented in the paper is based on a dish-level comparison. Potentially more meaningful results could be obtained by calculating energy ratios for the preparation of entire meals or even daily energy consumption when cooking with different fuels. However, this would require a still larger dataset.
To a certain extent, the differences between energy ratios derived from the dataset and reference efficiency values also illustrate the limitations of the existing dataset. For example, there are relatively few data points for cooking single dishes with charcoal because once a stove is lit, it tends to be used to cook multiple dishes within the meal. Dishes cooked with charcoal as part of a meal of two or more dishes would likely have a lower specific energy consumption, as the energy ‘wasted’ in heating up and cooling down would be spread across multiple dishes. Differences in the energy required to cook different foods have been well noted so energy consumption figures should, ideally, only be compared when the composition of dishes cooked is known to be similar, as in
Table 6. The existing dataset is not large enough to permit this kind of analysis.
These limitations are linked to the size of the dataset. While the paper tries to overcome the country-specific limitation of most previously published studies by aggregating data from multiple studies, the collated dataset remains limited. There is a need for actors in the clean cooking sector to generate and share more data from more countries.
The data used in the paper have been drawn from studies designed to reflect real-world cooking rather than laboratory conditions. One feature of these studies is that they are influenced by the behavior of participating cooks; different cooks will behave differently. It is possible that a cohort of cooks that are well trained in energy conservation techniques may be able to cook with multiple fuels at lower energy ratios (i.e., by achieving better performance when using traditional fuels). On the other hand, a cohort of cooks who have other priorities in the home and are not concentrating on energy use may yield higher energy ratios.
7. Conclusions
7.1. Performance Assessment and Energy Ratios
When cooking under pressure, EPCs require less ‘useful’ energy to cook (according to the standard definitions of that), so it is not meaningful to compare efficiency figures with other cooking appliances. Neither is it appropriate to use current standard tests to assess the relative efficiency of EPCs. While an ‘efficiency’ for each device is an attractive concept, it relies on having a clear definition of the useful energy that is provided: for the water boiling test, this is about the change in temperature and the change in the state of the water, which is physically easy to define and measure/calculate but is not appropriate for comparisons between some devices. However, a better definition of the useful energy to use in an efficiency test is not obvious. Specific energy use, and the energy ratios that come from comparing those for different fuel and stove types, may be a more realistic means of assessing relative performance. These energy ratios show that cooking with charcoal uses approximately 15 times as much energy as an EPC and approximately ten times the energy used by a hotplate (based on African countries).
7.2. Implications of Energy Ratios
These energy ratios are much higher than the conservation of useful energy approach using thermal conversion efficiencies would suggest. Variations in the behavior of cooks mean that much of the energy delivered by conventional devices is wasted, especially in stoves that are difficult to control. This means that the conservation of useful energy assumption used in most modeling does not hold.
Much of the academic work on clean cooking has been, and will continue to be, based on modeling. More and more countries are beginning to develop clean cooking strategies as clean cooking assumes greater political prominence. To date, almost all models use the conservation of useful energy approach to compare fuel consumption (and cost). Policy development and academic studies, and the models upon which they are based, need to be revised in light of the empirical data embodied in the energy ratios.
7.3. Modern Energy-Efficient Devices and the Energy Ladder
The costs of dishes cooked in controlled cooking studies show that it is commonly cheaper to cook with an EPC than any of the traditional fuels (firewood, charcoal, or LPG). Based on aggregated data from multiple countries and the range of fuel prices found in each country at the time of the studies, the cost of cooking with an EPC is 27% of the cost of using LPG and 20% of the cost of using charcoal. This demonstrates that highly efficient electric cooking devices can offer substantial cost savings.
The new generation of efficient electric cooking appliances, such as EPCs, uses much less energy than traditional electric appliances, such as hotplates. The analysis suggests three categories of electric cooking devices. Resistive element hotplates and infrared hobs both use electricity to provide a hot surface onto which a pot is placed and use similar amounts of energy. A second category of energy-efficient devices employs the direct transfer of electrical heat to a pot, which may be insulated, as with rice cookers. When compared with resistive element hotplates, these direct heating devices (induction, electric frying pan, and rice cooker) can save around 20%. EPCs are in a category of their own due to the combination of insulation, automation, and cooking under pressure, meaning they can save over 40% compared to a hotplate.
The energy and cost performance findings presented in the paper show how this new generation of energy-efficient electric cooking devices effectively violates the premise of the energy ladder theory. It shows that while higher-tier fuels, such as LPG and ethanol, may be more expensive than biomass fuels, this is no longer necessarily the case for cooking with electricity. On the contrary, in many instances, it is cheaper than cooking with traditional fuels at the household level.
7.4. For Further Investigation
Energy planners, policymakers, and utilities tend to think in terms of daily or even seasonal demand, so further analysis is needed to relate the individual dish-level data presented in this paper to daily demand. Again, this can be done using the Cooking Diaries studies, which generated data on the number of dishes prepared as part of a given meal and the number of meals prepared in a day.
The paper highlights how sensitive this kind of analysis is to the style and mix of dishes cooked on different devices. It draws out distinctions between dishes cooked in African and Asian countries; African dishes require more energy than Asian dishes. It highlights the impact of energy-intensive dishes, such as bean stews, which are more common in African diets. It recognizes that different devices are preferred for cooking certain dishes. All of these pose challenges for assessing the relative performance of devices. This more detailed level of analysis can only be conducted with larger datasets. There is a need for actors in the clean cooking sector to generate and share more data from more studies in more countries.


