Article

An Experimental Investigation of Surfactant-Stabilized CO2 Foam Flooding in Carbonate Cores in Reservoir Conditions

by
Madiyar Koyanbayev
1,*,
Randy Doyle Hazlett
1,
Lei Wang
2 and
Muhammad Rehan Hashmet
3
1
School of Mining and Geosciences, Nazarbayev University, Astana 010000, Kazakhstan
2
College of Energy, Chengdu University of Technology, Chengdu 610059, China
3
Chemical and Petroleum Engineering Department, United Arab Emirates University, Al Ain 15551, United Arab Emirates
*
Author to whom correspondence should be addressed.
Energies 2024, 17(13), 3353; https://doi.org/10.3390/en17133353
Submission received: 22 April 2024 / Revised: 20 May 2024 / Accepted: 3 June 2024 / Published: 8 July 2024
(This article belongs to the Topic Enhanced Oil Recovery Technologies, 3rd Volume)

Abstract

:
Carbon dioxide (CO2) injection for enhanced oil recovery (EOR) has attracted great attention due to its potential to increase ultimate recovery from mature oil reservoirs. Despite the reported efficiency of CO2 in enhancing oil recovery, the high mobility of CO2 in porous media is one of the major issues faced during CO2 EOR projects. Foam injection is a proven approach to overcome CO2 mobility problems such as early gas breakthrough and low sweep efficiency. In this experimental study, we investigated the foam performance of a commercial anionic surfactant, alpha olefin sulfonate (AOS), in carbonate core samples for gas mobility control and oil recovery. Bulk foam screening tests demonstrated that varying surfactant concentrations above a threshold value had an insignificant effect on foam volume and half-life. Moreover, foam stability and capacity decreased with increasing temperature, while variations in salinity over the tested range had a negligible influence on foam properties. The pressure drop across a brine-saturated core sample increased with an increasing concentration of surfactant in the injected brine during foam flooding experiments. Co-injection of CO2 and AOS solution at an optimum concentration and gas fractional flow enhanced oil recovery by 6–10% of the original oil in place (OOIP).

1. Introduction

Around two-thirds of oil reserves remain unrecovered after the application of primary and secondary oil extraction mechanisms [1]. Recovery of this significant amount of residual oil requires the implementation of enhanced oil recovery (EOR) techniques. CO2 injection has been extensively used for enhancing oil recovery in field-scale projects in both conventional and unconventional reservoirs for the last 40 years [2,3]. The ability of CO2 to become miscible with reservoir oil reservoir pressure makes it attractive for EOR [4,5]. Under miscible conditions, CO2 mixes with oil and results in higher incremental oil recovery compared to immiscible CO2 floods [6,7]. In the absence of miscibility, the mixing of CO2 with oil reduces oil viscosity, leads to oil swelling, and lowers IFT, which makes oil more mobile and enhances oil recovery [8]. On average, miscible CO2 floods can produce an extra 10–20% of the OOIP, while immiscible CO2 floods could recover 5–10% of the OOIP [7]. Despite the reported successes, a number of challenges limit the efficiency of CO2 EOR in petroleum reservoirs.
CO2 has a lower density and viscosity than most reservoir oil or brine, which causes various mobility and conformance problems [9,10]. The adverse mobility due to low gas viscosity leads to viscous fingering of CO2 that may result in early gas breakthrough and low CO2 utilization capacity. Moreover, the gravity override due to the migration of low-density CO2 to the upper part of the reservoir results in low sweep efficiency. The combination of reservoir heterogeneity with high mobility of CO2 may lead to severe gas channeling, since CO2 tends to flow through highly permeable streaks. Consequently, CO2 injection results in poor volumetric sweep efficiency and leaves the large parts of the reservoir unswept [11].
Several approaches to overcome CO2 mobility and conformance issues, both near-wellbore and in-depth, have been investigated and developed [7]. Among them, the most reported and practically applicable methods are water alternating gas injection (WAG), foam generation, and using thickeners and gels to increase gas viscosity [7,12,13]. However, along with advantages, distinct limitations are inherent in these methods; thus, the feasibility of them in a porous medium under specific reservoir conditions must be considered prior to implementation [7,14].
The application of foam for preventing early gas breakthroughs and improving sweep efficiency of CO2 flooding was first suggested in the 1950s [15]. Typically, foams are generated by the dispersion of gas in the aqueous phase and creating the continuous or discontinuous gas phases separated by liquid film, called lamellae [16]. Traditionally, surfactant-based stabilizers are used to improve foam’s long-term stability. The surfactant is added to the aqueous phase at a desirable concentration that is above the critical micellar concentration (CMC). The addition of surfactant leads to a reduction in the surface tension at the liquid–gas interface that enhances foam stability and generation [17,18].
The ability of foam to increase CO2 apparent viscosity and reduce its relative permeability is the main mechanism contributing to reducing CO2 mobility, thus improving its oil displacement efficiency [19]. Moreover, foam generation creates a resistance to flow in the high-permeability zones, thus diverting fluids into the region with low permeability, which has previously been unswept. This improves the volumetric sweep efficiency of CO2 flooding and enhances oil recovery as well. Successful application of surfactant-stabilized CO2 foam in improving sweep efficiency by generating stable foam has been demonstrated through numerous laboratory works and field pilots [20]. The application of CO2 foam injection in a heterogeneous sandstone field in Texas resulted in better sweep efficiency compared to the WAG injection scenario and recovered 31% of residual oil [21]. Another surfactant-based CO2 foam injection project implemented in Wall Creek sandstone reservoir, Wyoming, showed the efficiency of foam in providing CO2 conformance control that enhances oil production [22]. However, the performance of CO2 foam depends on the choice of surfactant, rock type, foam and oil interactions, brine salinity, temperature, and pressure conditions [17].
Alpha olefin sulfonate (AOS) is an anionic surfactant that is widely used in the oil and gas industry because of its ability to generate foam with excellent properties at low cost [17,23,24]. Moreover, the surfactant has low CMC, is highly compatible with brine, and exhibits good foaming properties with CO2, even in the presence of hydrocarbons [25]. These properties of AOS make it an excellent candidate for CO2 foam EOR, and several foam flooding studies and field projects have been implemented using AOS surfactant to enhance oil recovery [26,27]. Ocampo et al. [28] highlighted the success of using AOS surfactant in the SAG project implemented in the Cuisiana fields, where foam efficiently blocked and diverted gas in the near wellbore area.
Several lab-scale experimental studies have been conducted to assess the effect of AOS as CO2 foam stabilizers. Ahmed et al. [29] reported that AOS exhibited better foaming ability than other commercial surfactants used in the study at harsh reservoir conditions (1500 psi and 80 °C) as well as in the presence of oil. In a comparative study by Foyen et al. [30], the performance of the anionic water-soluble AOS surfactant and five non-ionic partially CO2-soluble surfactants to stabilize CO2 foam were analyzed. They highlighted that the AOS surfactant demonstrated superior performance compared to non-ionic surfactants in terms of mobility reduction, achieving a reduction in Mobility Reduction Factor (MRF) exceeding four orders of magnitude. In similar work, Bello et al. [31] conducted a series of screening tests to assess the efficiency of AOS, sodium dodecyl sulfate (SDS) and cetyltrimethylammonium bromide (CTAB) as CO2 foam stabilizers under varying temperature and salinity conditions. Their study revealed that AOS exhibited superior foamability and stability compared to SDS and CTAB under the examined conditions. Abdelaal et al. [32] conducted a series of core flooding experiments at 1800 psi and 90 °C, utilizing AOS surfactant to stabilize mixed CO2/N2 foam. Their study provided evidence supporting the capability of AOS surfactant to generate stable foam even under harsh reservoir conditions.
Previous studies have also demonstrated the generation of stable foam with AOS in carbonate core samples, which is not a favorable environment for an anionic surfactant because of surfactant adsorption on the carbonate core surface [33,34]. However, adsorption studies conducted using AOS and limestone core materials demonstrated reasonable levels of adsorption [35,36]. Thus, the use of AOS surfactant in carbonate reservoirs may be as effective as in sandstone reservoirs in terms of foam stability and oil recovery.
Carbonate reservoirs hold more than half of oil reserves and most of the giant oil fields in the world are carbonate [37]. However, the foam behavior concerning reservoir heterogeneity, wettability, and the presence of oil in carbonate reservoirs is still a subject of research [33,38,39]. For example, it is reported that foam may exhibit different or reduced foam properties in carbonate than in sandstone because of the variability in mineralogy, surface chemistry, and morphology [24]. For this reason, understanding CO2 foam behavior in carbonate reservoirs is important. In addition, systematic studies on CO2 foam performance stabilized by a surfactant under harsh reservoir conditions (high pressure, high temperature, and high salinity) have not been thoroughly investigated.
This paper investigates the efficiency of surfactant-stabilized CO2 foam in oil recovery in carbonate cores. First, the foam generation and stability were investigated in bulk tests at various temperatures, brine salinities and surfactant concentrations. Then, laboratory core flooding experiments were conducted using limestone outcrop core samples. The pressure and temperature were varied to compare the foam properties under various reservoir conditions. In addition, the presence of oil and the influence of CO2 states, namely gas and supercritical, on foam behavior were studied.

2. Methodology

2.1. Materials

Indiana limestone outcrop core samples from Kocurek Industries (Caldwell, TX, USA) were used in this study. The core length, diameter, and dry weight were measured. Core samples were first vacuumed and then saturated with brine under 1000 psi for 12 h. Following this, the pore volume and porosity of cores were calculated using the difference between the wet and dry weights as well as brine density. Next, saturated cores were covered with an Aflas rubber sleeve, which has an excellent resistance to high-pressure CO2, and then mounted into a core holder. The absolute brine permeability was calculated using Darcy’s law at different brine injection rates in the range of 1–5 cc/min. The physical properties of cores used in this study are listed in Table 1.
In this study, CO2, synthetic seawater (SSW), crude oil and surfactant were used. Industrial-grade CO2 (purity > 99.5%) was used for bulk foam tests and core flood experiments. Synthetic sea water (SSW) was prepared by adding specific salts to distilled water. The types and amounts of salts used for the brine preparation are given in Table 2. The final brine solution in this study mimics Caspian Sea water and has a salinity of approximately 13,000 ppm [40]. Each salt was added separately, and the mixture was stirred for 1 h.
Dead crude oil from an oil reservoir in West Kazakhstan was used in this study. The compositional analysis of crude oil was performed by NIPI Neftegas (Aktau, Kazakhstan) using a gas chromatograph. The composition of crude oil and density at various temperatures are presented in Figure 1. The minimum miscibility pressure between CO2 and the oil was estimated as 2000 psi at 80 °C using CMG WinProp 2020.10.
An anionic AOS surfactant for this study was received from Stepan Company (Northfield, IL, USA) in the form of a solution. The proportion of active material in the solution was 37.7%. Surfactant solutions were prepared by dissolving the surfactant at the desired concentration in SSW and stirring it at 300 rpm for 30 min in room conditions.

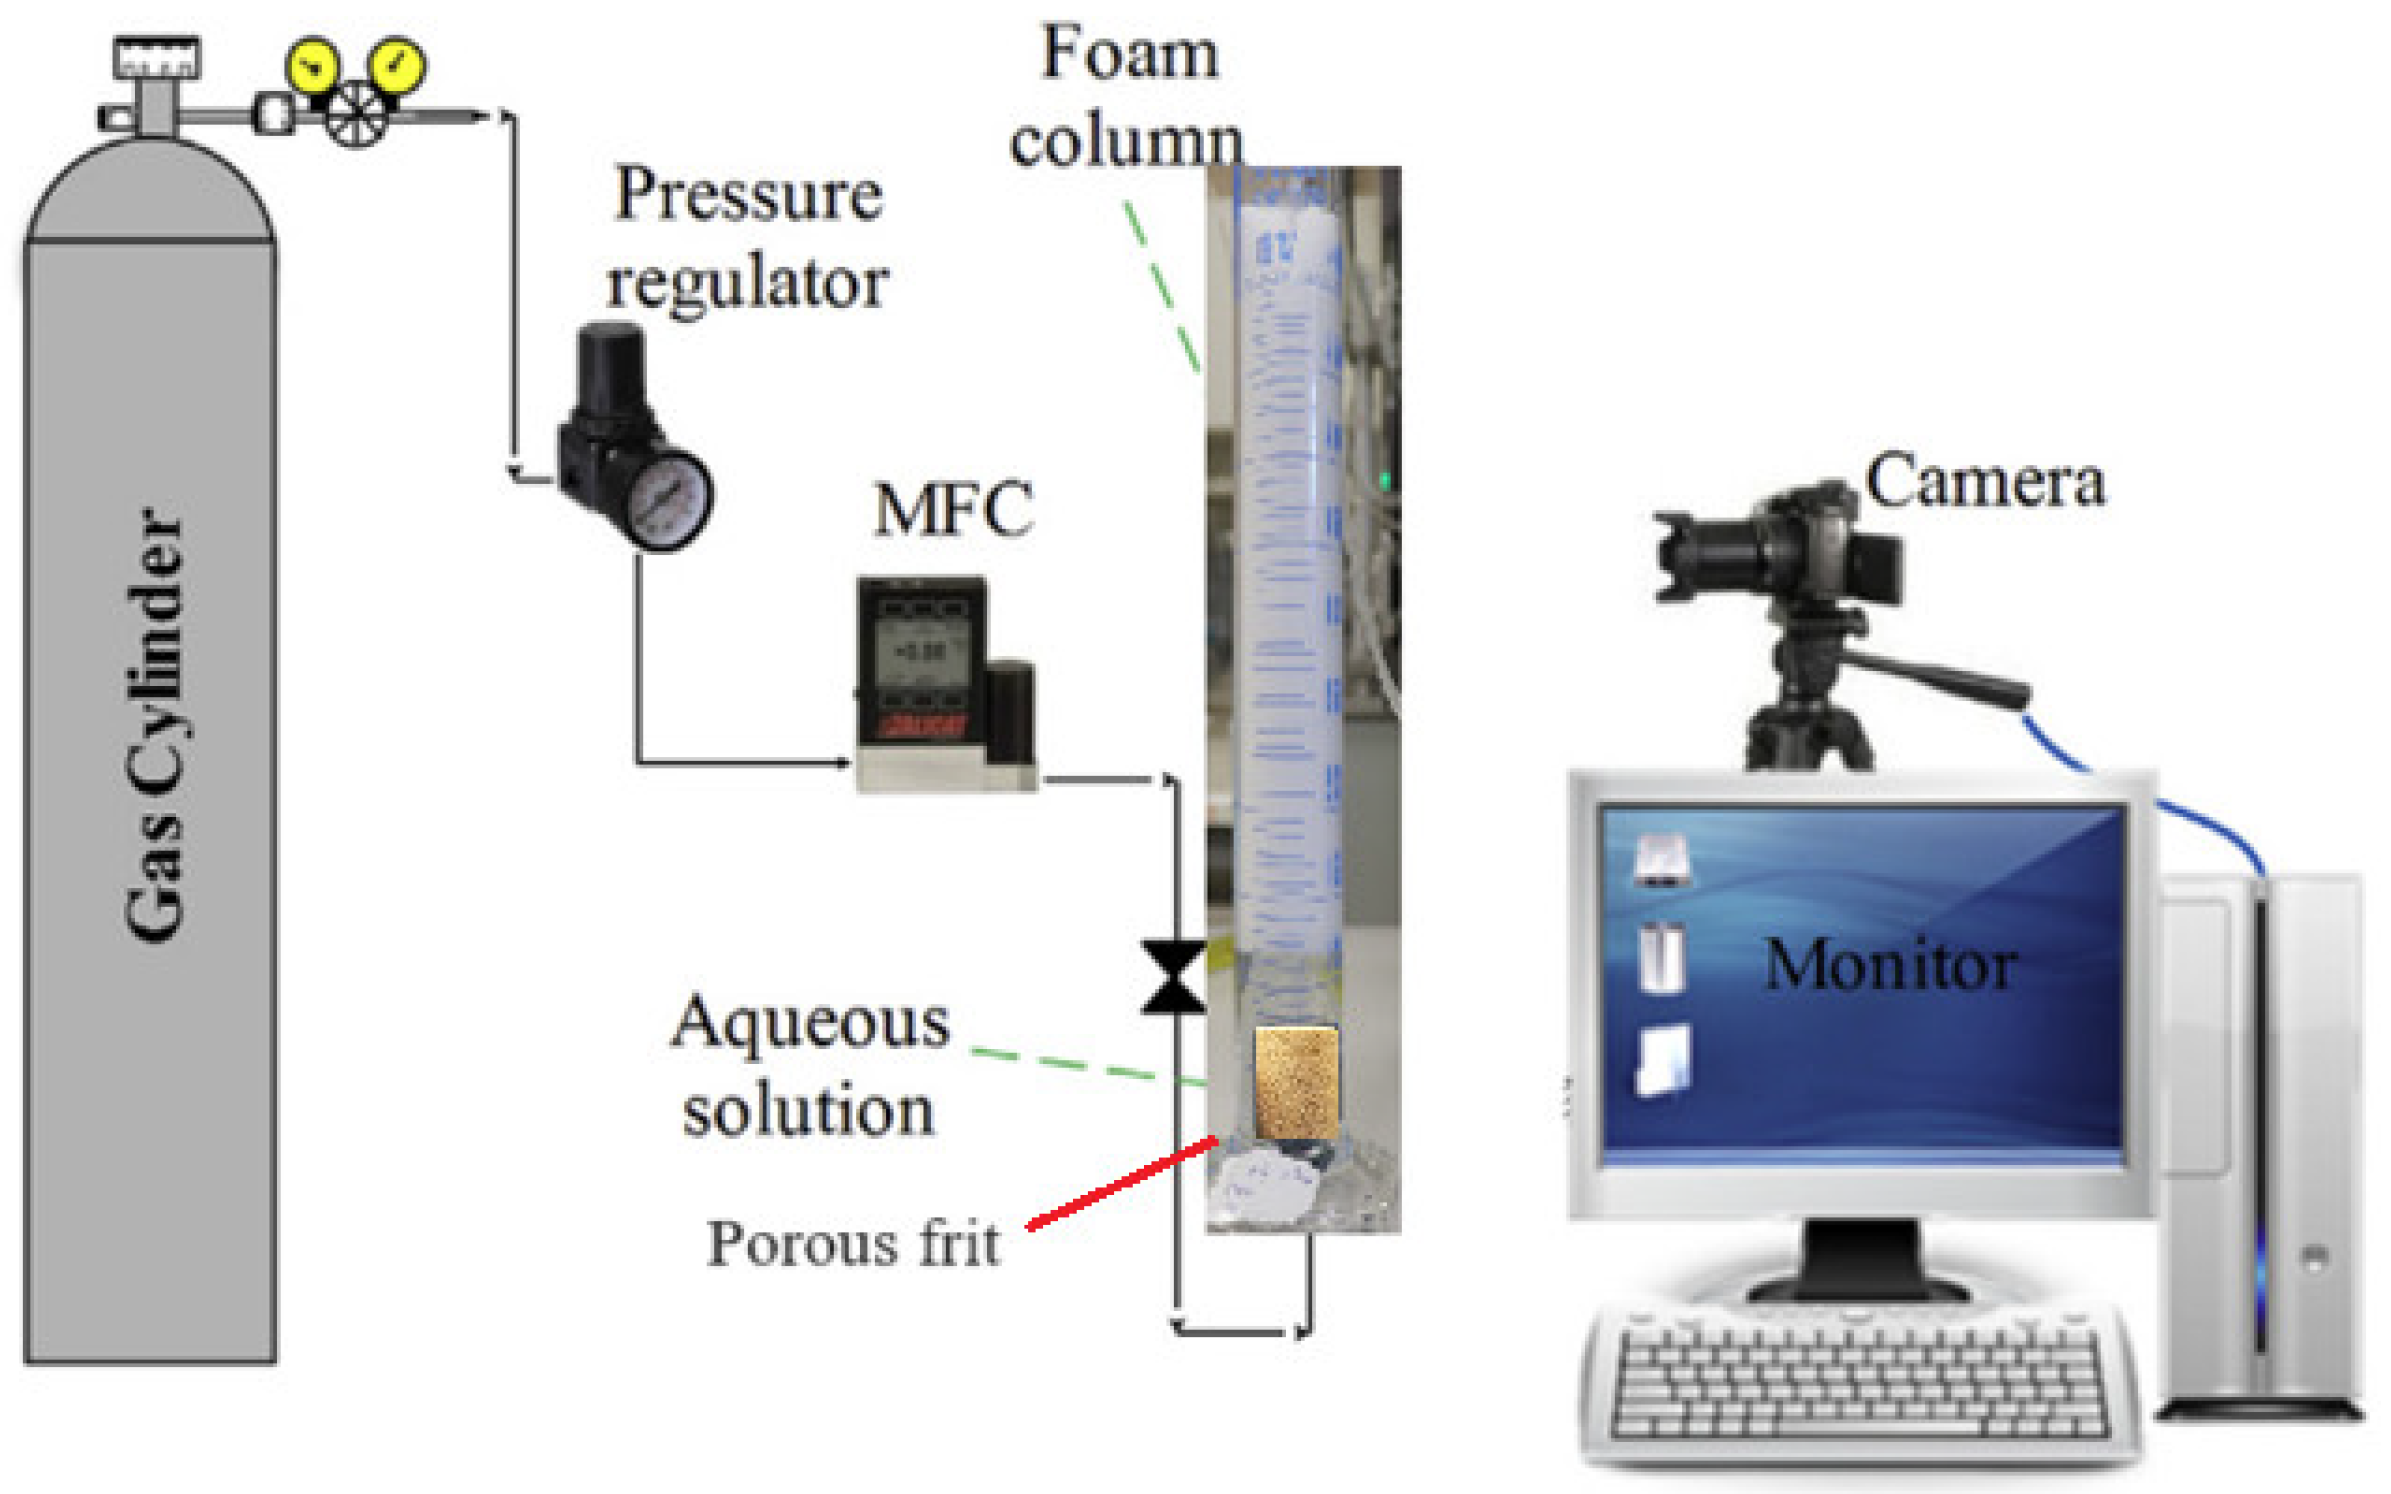
2.2. Bulk Foam Stability Tests

As a reliable method in foam study, bulk foam stability tests were carried out to examine the effect of the surfactant concentration, salinity, temperature, and presence of oil on the stability of the generated foam. The test was performed by adding 100 mL of the surfactant solution into a clean 500 mL graduated cylinder with a 4 cm diameter. A diffuser was placed at the bottom of the cylinder to represent porous media and connected to a gas bottle with a plastic tube. CO2 gas from a cylinder was injected at 50 cc/min (a rate controlled by the gas regulator) through the plastic tube. The gas was injected for 500 s to keep a constant gas–liquid ratio during all tests. Then, CO2 injection was stopped, and the stopwatch was started to measure the half-life, when the height of foam declined to half of its original height. The schematic of this apparatus is shown in Figure 2.
Seven samples of surfactant solution with various AOS concentrations (in the range of 0.1 to 1%) were prepared and used in bulk tests to identify the optimum concentration, which was used in further experiments. In order to understand the effect of temperature variation on foam generation and stability, the bulk tests at the identified optimum AOS concentration in the absence and presence of the oil were carried out at 20 °C, 50 °C, and 80 °C by placing the cylinder into the oven with a sight glass to monitor foam behavior.
In addition, the oil reservoir we were targeting has formation brine with salinity at around 13,000 ppm, which may lead to destabilization and a higher drainage rate of foam, lowering the ability of CO2 foam to divert flow. Therefore, understanding the effect of salinity on the capability of generated foam is a crucial consideration in the application of CO2 foam for enhancing oil recovery. To study the effect of salinity, synthetic seawater was diluted with distilled water to various salinity levels.

2.3. Foam Dynamic Tests

The ability of foam to reduce CO2 mobility and enhance oil recovery was investigated through a series of core flooding tests. The setup of equipment used in this study is shown in Figure 3. The confining pressure and backpressure were applied using two FloxLab (Nanterre, France) syringe pumps, which automatically kept the pressure at the desired value. Brine, surfactant solution, and CO2 were separately loaded into Hastelloy floating piston accumulators and injected using three syringe pumps. The foaming solution and CO2 were simultaneously co-injected through two separate lines, which were connected to the inlet of the core holder. The co-injection method leads to the mixing of CO2 and surfactant in the core and the generation of foam in situ. The brine-saturated core was loaded into a Hassler-type core holder that was mounted horizontally. Pressure drop across core samples was measured using three pressure transducers designed for various pressure ranges to provide accurate measurement. The whole system, except for the injection pumps, was placed into the constant-temperature oven. Effluent fluids were collected in measuring cylinders and dead volume was applied in the calculations of oil recovery.
In order to evaluate the ability of surfactant to generate and stabilize foam in porous media under elevated pressure and temperature conditions in the absence of oil, several types of foam tests were conducted, where a pressure build-up profile was used to assess the foam generation performance and foam strength.
Foam quality scan. Foam quality experiments were performed to determine the optimum fraction of CO2 and surfactant solution at which the maximum foam stability can be obtained. The total injection rate was 1 cc/min and kept constant during the experiment, while the gas fractional flow was varied from 40% to 90%. The experiment was carried out continuously by increasing the gas fractional flow, and when a steady state pressure drop was reached at a specific fraction, the injection rates of CO2 and surfactant were adjusted accordingly. Foam quality experiments were conducted at 1500 psi and 80 °C to mimic reservoir conditions.
Flow rate tests. In order to determine the effect of flow rate on foam generation and stability, CO2 and surfactant solution were co-injected at various flow rates from 0.5 to 2 cc/min, while the gas fractional flow was kept constant. The co-injection was continued until a steady-state pressure drop was achieved, and then the flow rates of CO2 and surfactant solution were changed accordingly. The gas fractional flow was determined during the previous foam quality experiments. The test was performed under reservoir conditions.
The ability of foaming solution with different surfactant concentrations to generate and stabilize foam was investigated. For this test, three solutions with AOS concentrations of 0.25%, 0.5% and 1% were used. All tests were conducted at reservoir conditions, and one pore volume (PV) of surfactant solution was injected as pre-flush to reduce the adsorption rate prior to subsequent co-injection of CO2 and surfactant.
A set of foam flooding experiments in the absence of oil was conducted at various pressure and temperature conditions to investigate the influence of CO2 phase behavior, namely gas and supercritical, on foam stability. During these tests, CO2 and surfactant solution were co-injected at a constant rate and gas fractional flow, selected according to the best foam performance in previous experiments.

2.4. Oil Recovery Experiments

The same experimental setup was used for oil recovery experiments. After measuring the absolute permeability of a core sample, the crude oil was injected at 1 cc/min until water production stopped. Then, injection rates were further increased to 3 and 5 cc/min to approach reaching connate brine saturation and initial oil saturation. Then, the core was left for 12 h at reservoir temperature and pressure. After that, more oil was injected into the core to recover any more mobile water. The effective permeability to oil was determined by injecting oil at 1 and 3 cc/min rates. Then, the core was flooded with SSW at various injection rates in the range of 1 to 3 cc/min. At least 5 PV of brine was injected to minimize the capillary end effect. After no oil production was reached during waterflooding, CO2 injection at 1 cc/min was initiated followed by CO2 foam injection in one experiment. In further experiments, co-injection of CO2 and brine was performed before CO2 foam injection.

3. Results

3.1. Foam Stability Tests

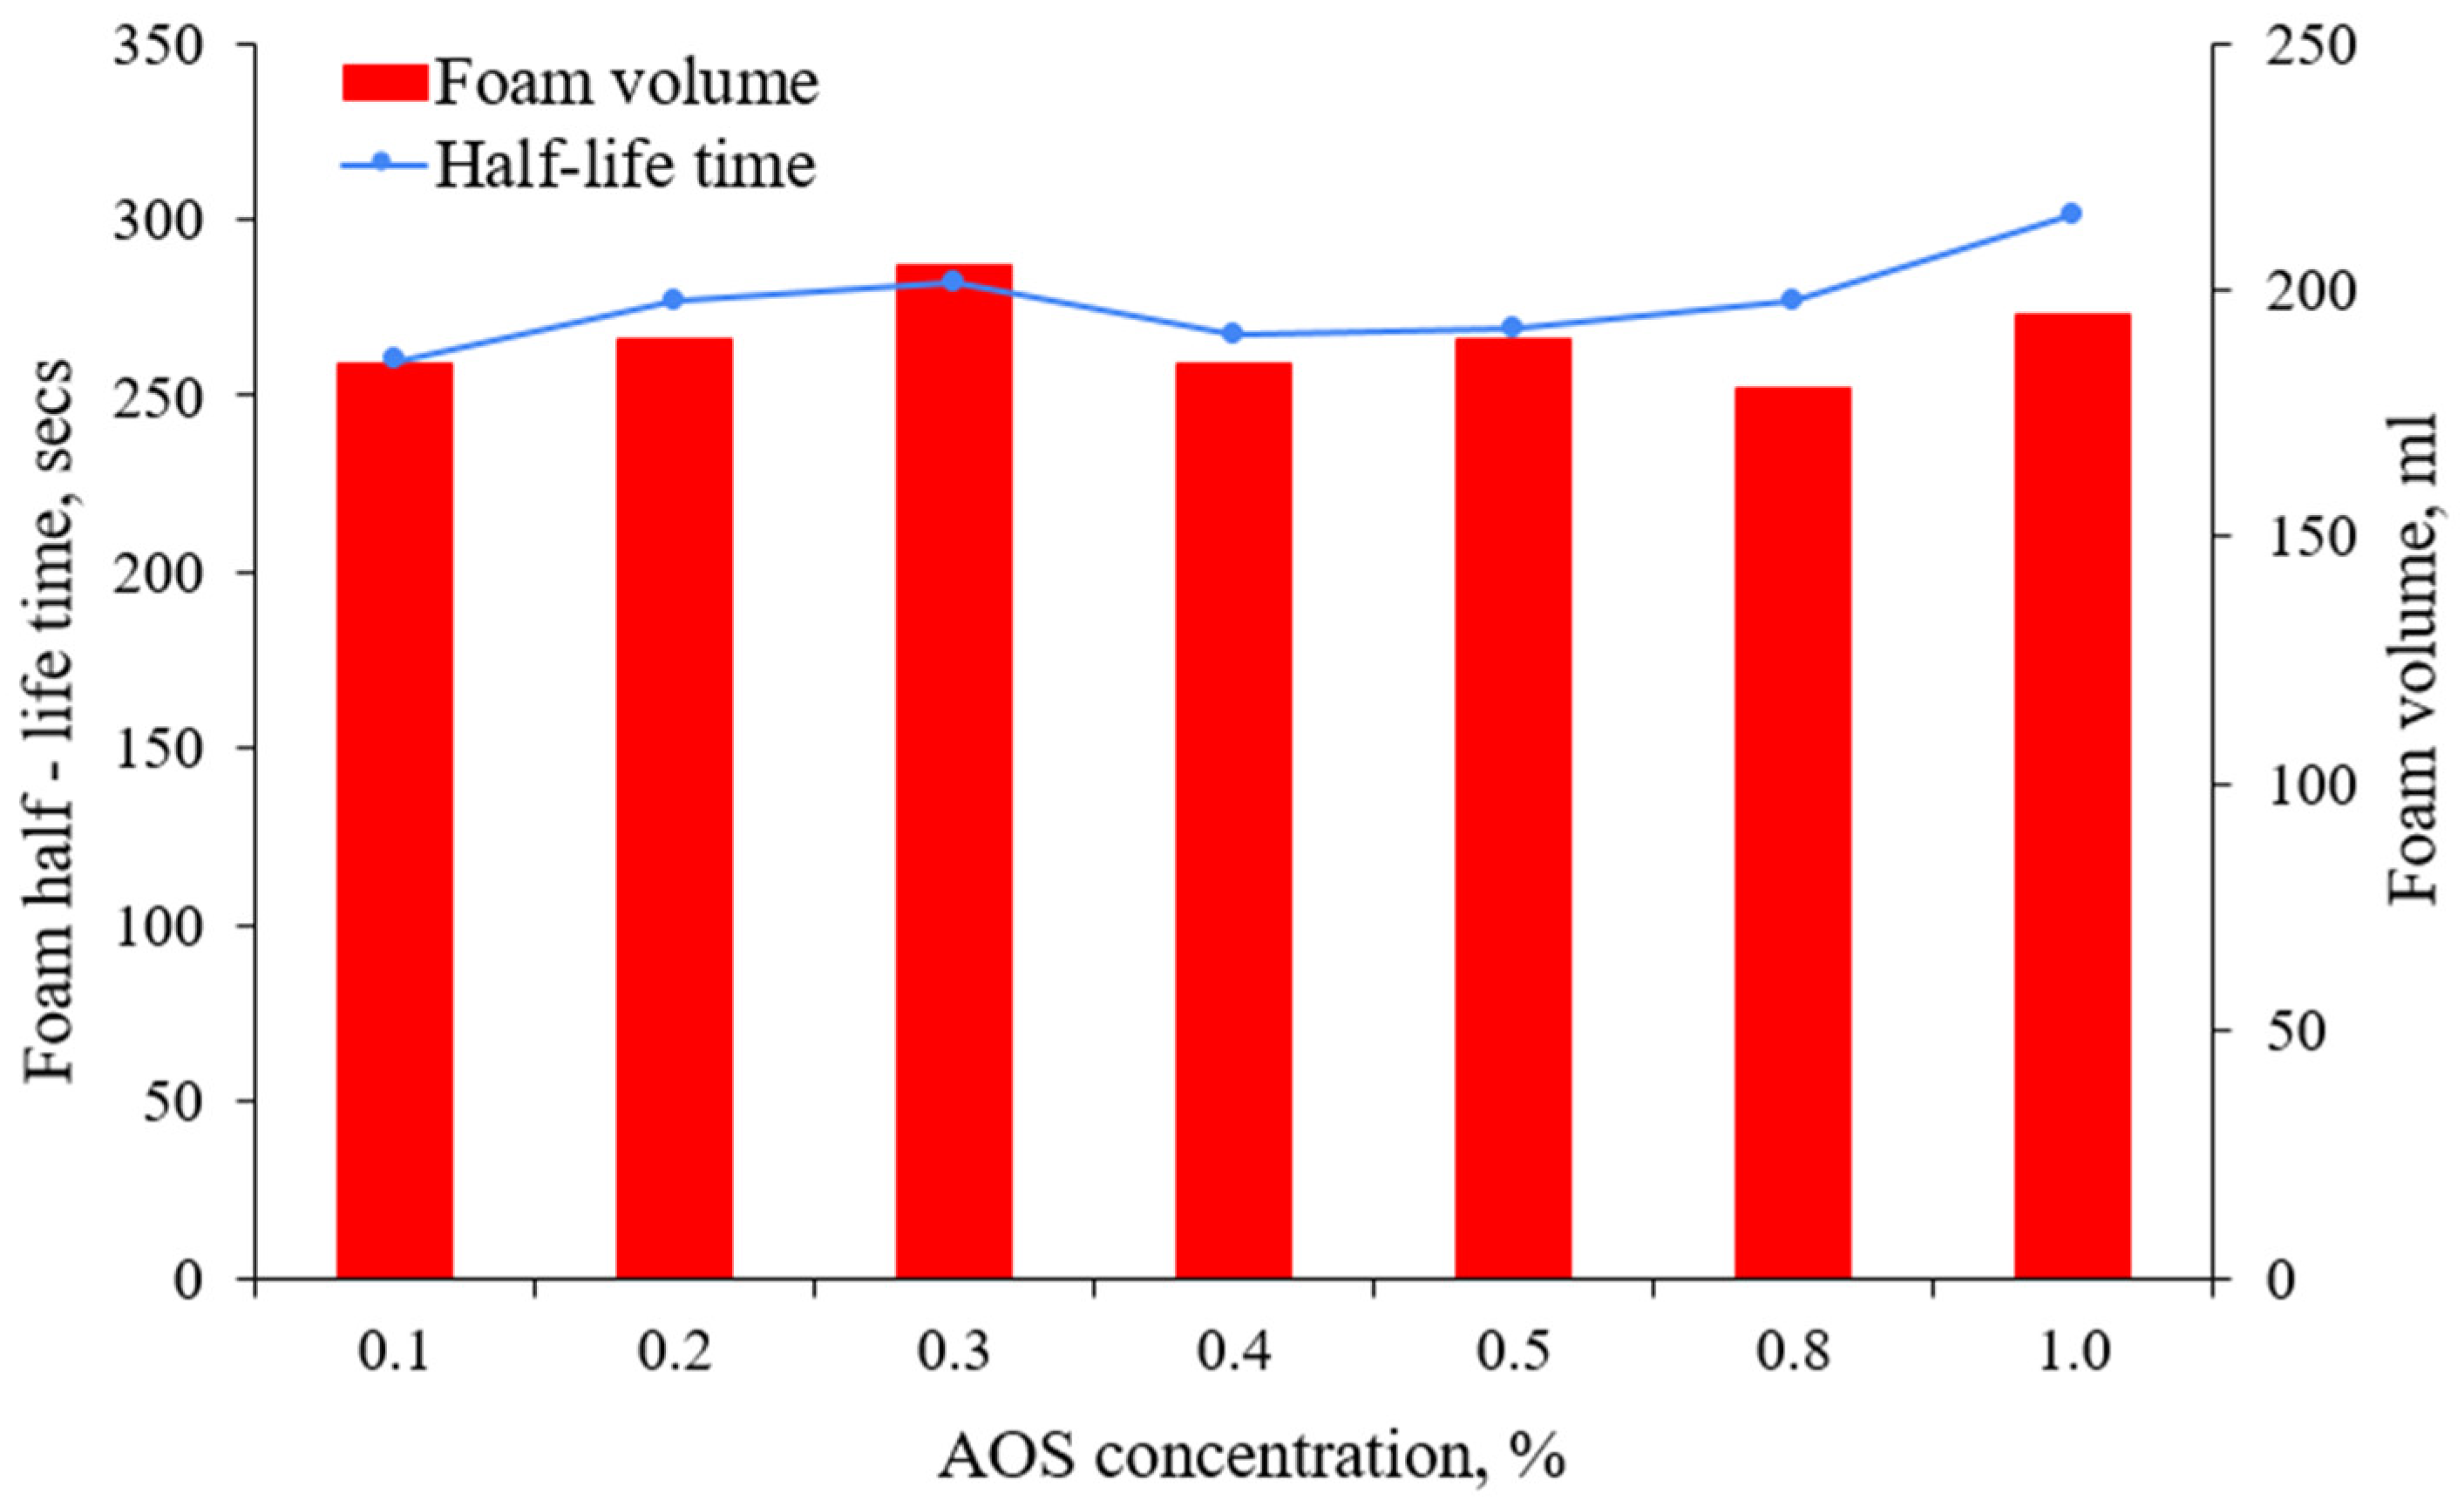
3.1.1. The Effect of Surfactant Concentration

A series of static foam tests for understanding the influence of AOS surfactant concentration on generated foam stability and volume were conducted in the absence of oil and at ambient conditions. All foaming solutions were prepared following the same procedure, and no precipitation was observed before CO2 injection. Figure 4 and Figure 5 illustrate the change in foam half-life and foam volume with an increase in the concentration of AOS. Above 0.1%, the surfactant concentration has an insignificant effect on the foam volume and its stability, which remain unchanged with the increasing surfactant concentration up to 1%.
The concentration of AOS surfactant in solutions used in the bulk tests was higher than the CMC value of AOS surfactant reported by previous researchers, which is around 0.01 wt% [41]. Typically, above the CMC value, the interfacial tension and surface activity remain unchanged despite an increasing surfactant proportion. After reaching CMC, the surfactant will form bi-layer and not enhance surface activity [42,43]. As a result, the generated foam stability, which depends on surface activity, stays unchanged with the addition of more surfactant. Of course, creating foam vastly increases the surface area of gas–water contact and many dynamic processes contribute. For further studies, 0.5 wt% AOS concentration was selected as an optimum concentration based on previous work [17].

3.1.2. The Effect of Temperature

The stability of CO2 foam is strongly influenced by temperature. CO2 foam tends to degrade with increasing temperature, thus decreasing its effectiveness in CO2 mobility control. To understand the temperature effect on CO2 foam stability generated with AOS surfactant, three bulk tests were performed at 20 °C, 50 °C, and 80 °C. The highest temperature represents the reservoir temperature of the oil field. Foaming solutions with two surfactant concentrations (0.25 wt% and 0.5 wt%) were used in this study. Figure 6 shows the foam volume and half-life of AOS surfactant at different temperatures for CO2 foam.
The results showed no appreciable difference in foam generation and stabilization between 20 °C and 50 °C. The foam half-life values at both temperatures were around 300 s, while the foam volumes reached approximately 250 cc. However, the generated foam capacity and stability decreased with a further increase in temperature to 80 °C. The high temperature significantly shortened the foam half-life, which decreased to approximately 100 s and 75 s for 0.25 wt% and 0.5 wt % AOS foaming solutions, respectively. In addition, increasing the temperature to 80⁰C slightly reduced the volume of foam generated with foaming solution at a high concentration, while the foam capacity at a low concentration decreased almost threefold. As seen in Figure 6, despite high temperature, stable foam was generated during bulk tests, which was stronger when the AOS concentration was high.

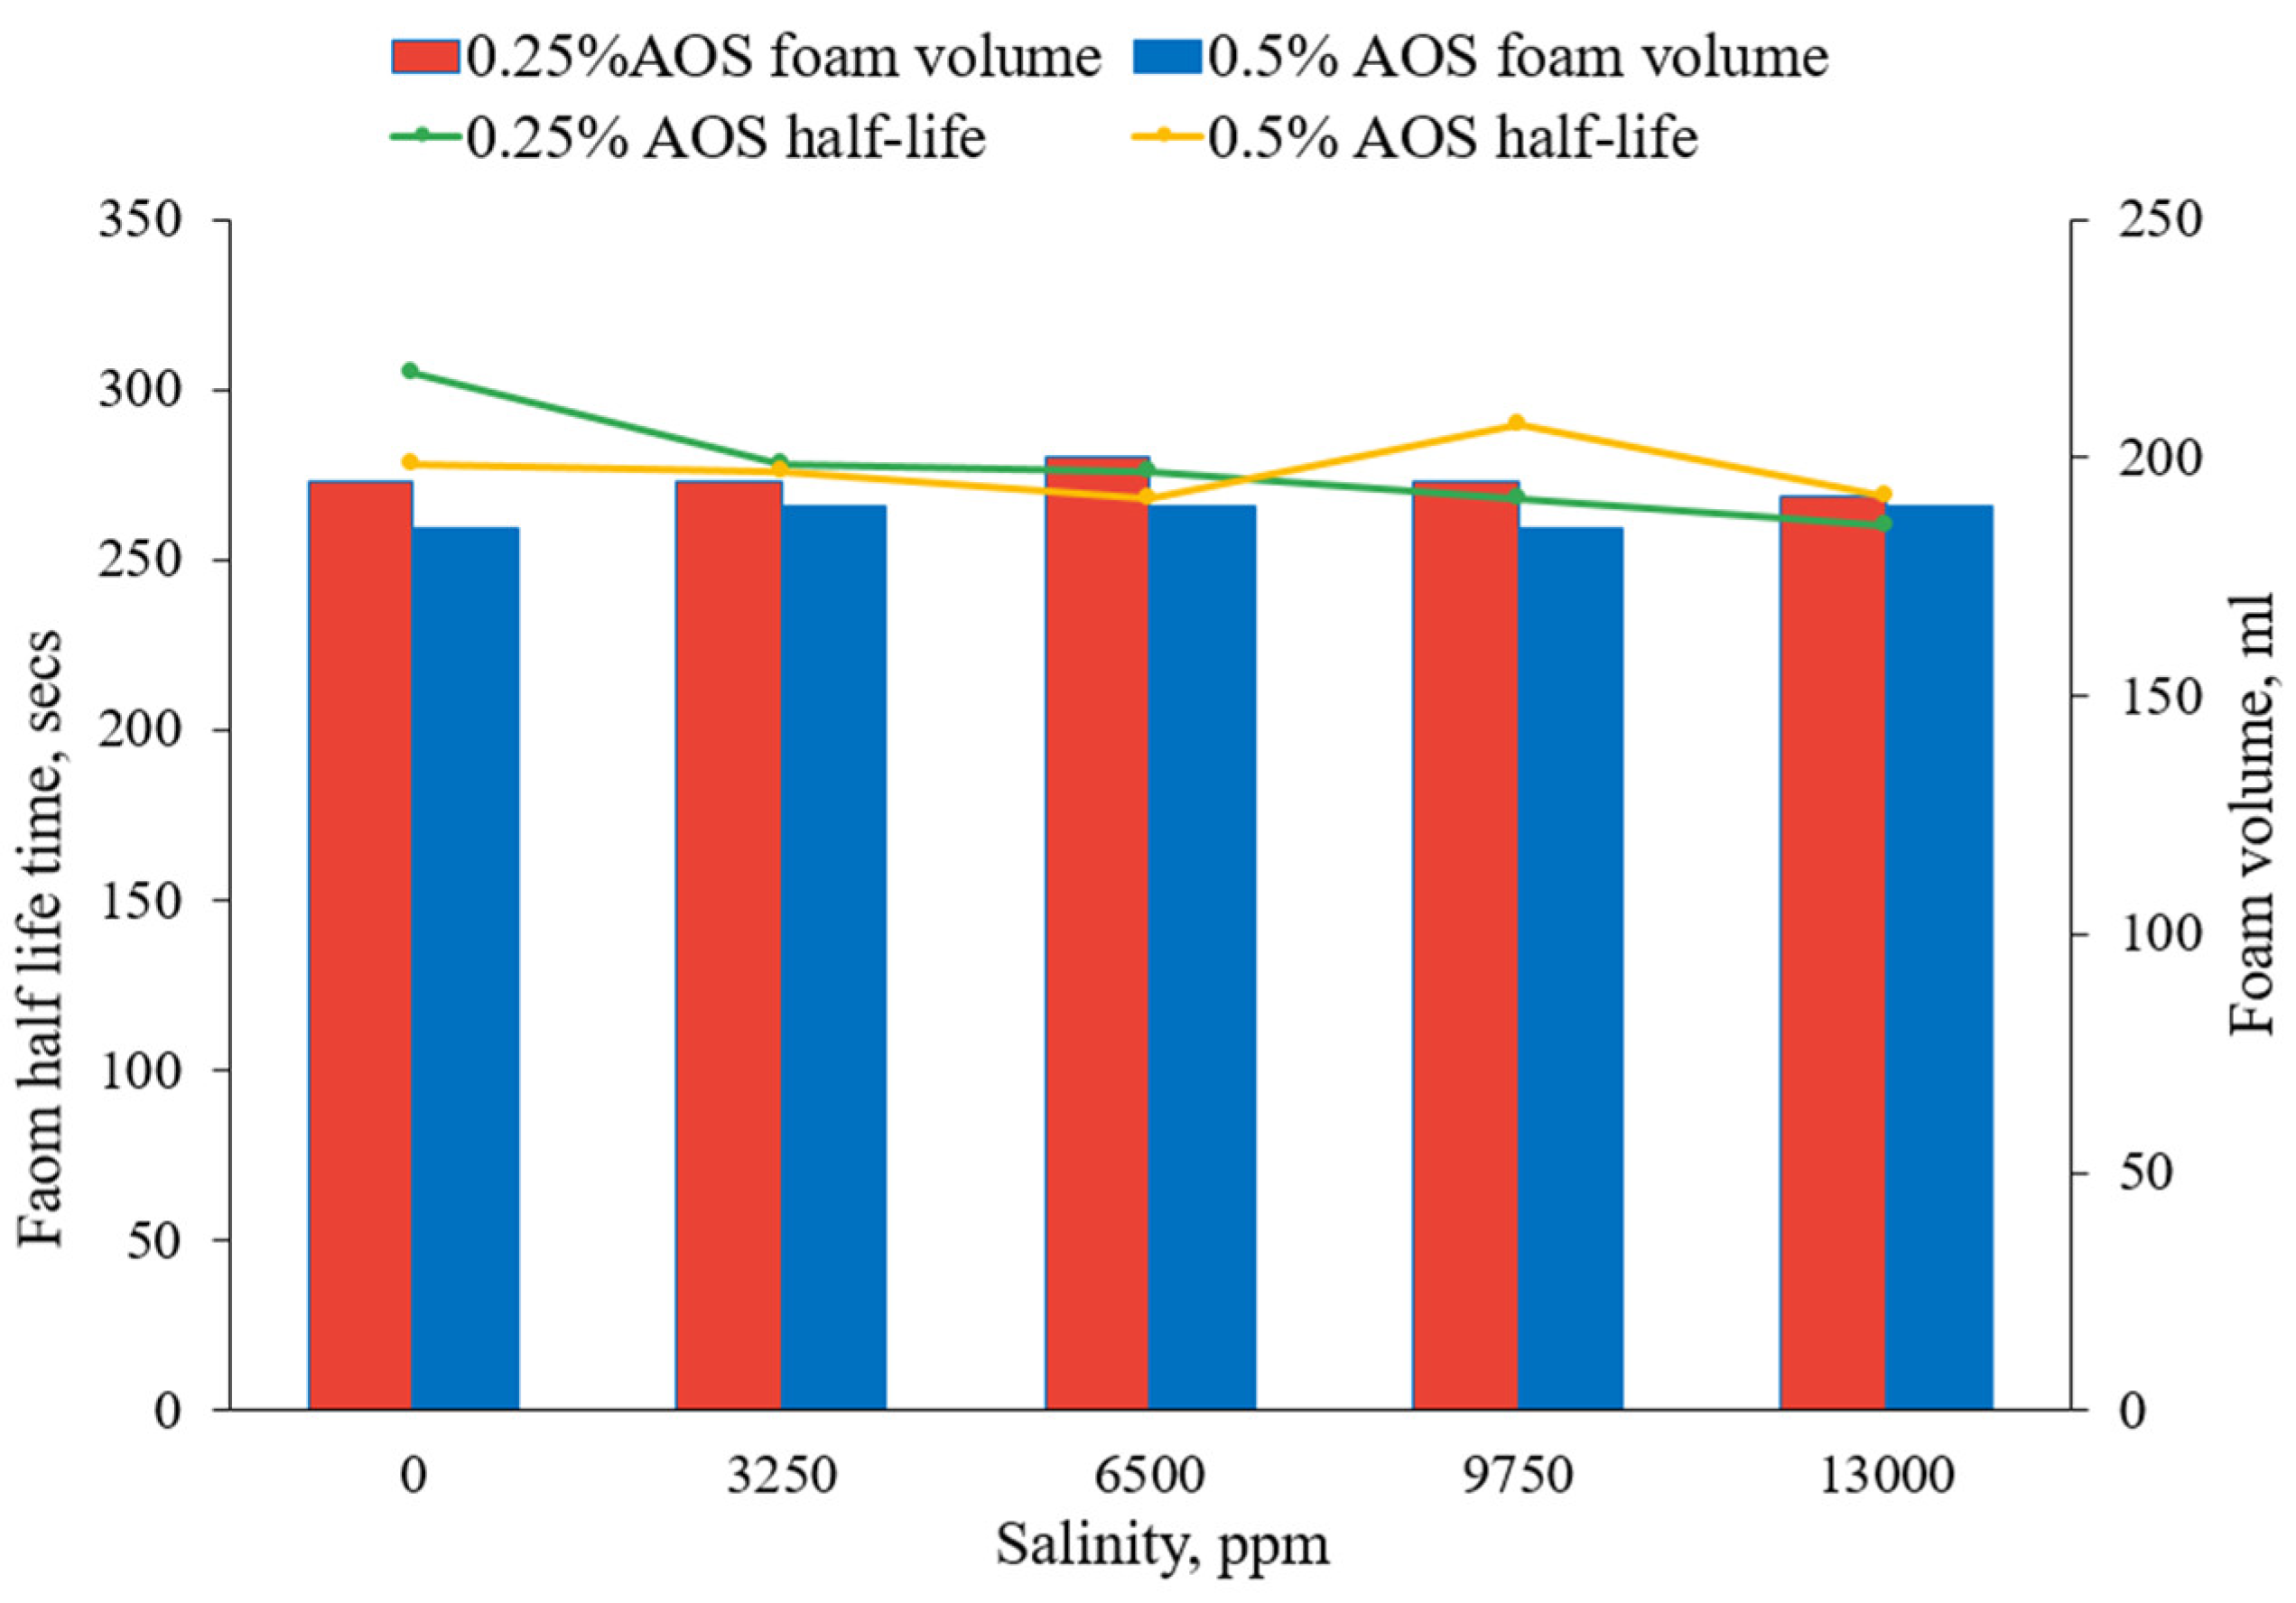
3.1.3. The Effect of Brine Salinity

For this test, the foaming solutions with two different AOS concentrations (0.25 wt% and 0.5 wt%) were prepared for comparison of their ability to stabilize foam at different salinity levels, namely 0 ppm, 3250 ppm, 6500 ppm, 9750 ppm, and 13,000 ppm. The foam volume and stability for both concentrations as a function of brine salinity are shown in Figure 7. Generally, the foam stability should increase with decreasing salinity; however, this was not observed. The differences in foam half-time and volume were minimal across the salinity concentrations tested, possibly because the maximum brine salinity used in this study was relatively low.

3.2. Foam Performance in Porous Media in the Absence of Oil

The apparent viscosity of foam resulting from the co-injection of gas and surfactant was considered to assess the foam strength in pores. The steady-state pressure drop values were used to calculate apparent viscosity using Darcy’s law:
μ a p p c P = k m D × A c m 2 × P p s i g 14,700 × Q t c c / s × L c m
where µapp is the apparent viscosity of foam, k is the effective permeability to gas, A is the sectional area of the core, ∆P is the pressure drop across the core, QT is the total flow rate of gas and surfactant solution, and L is the core length.

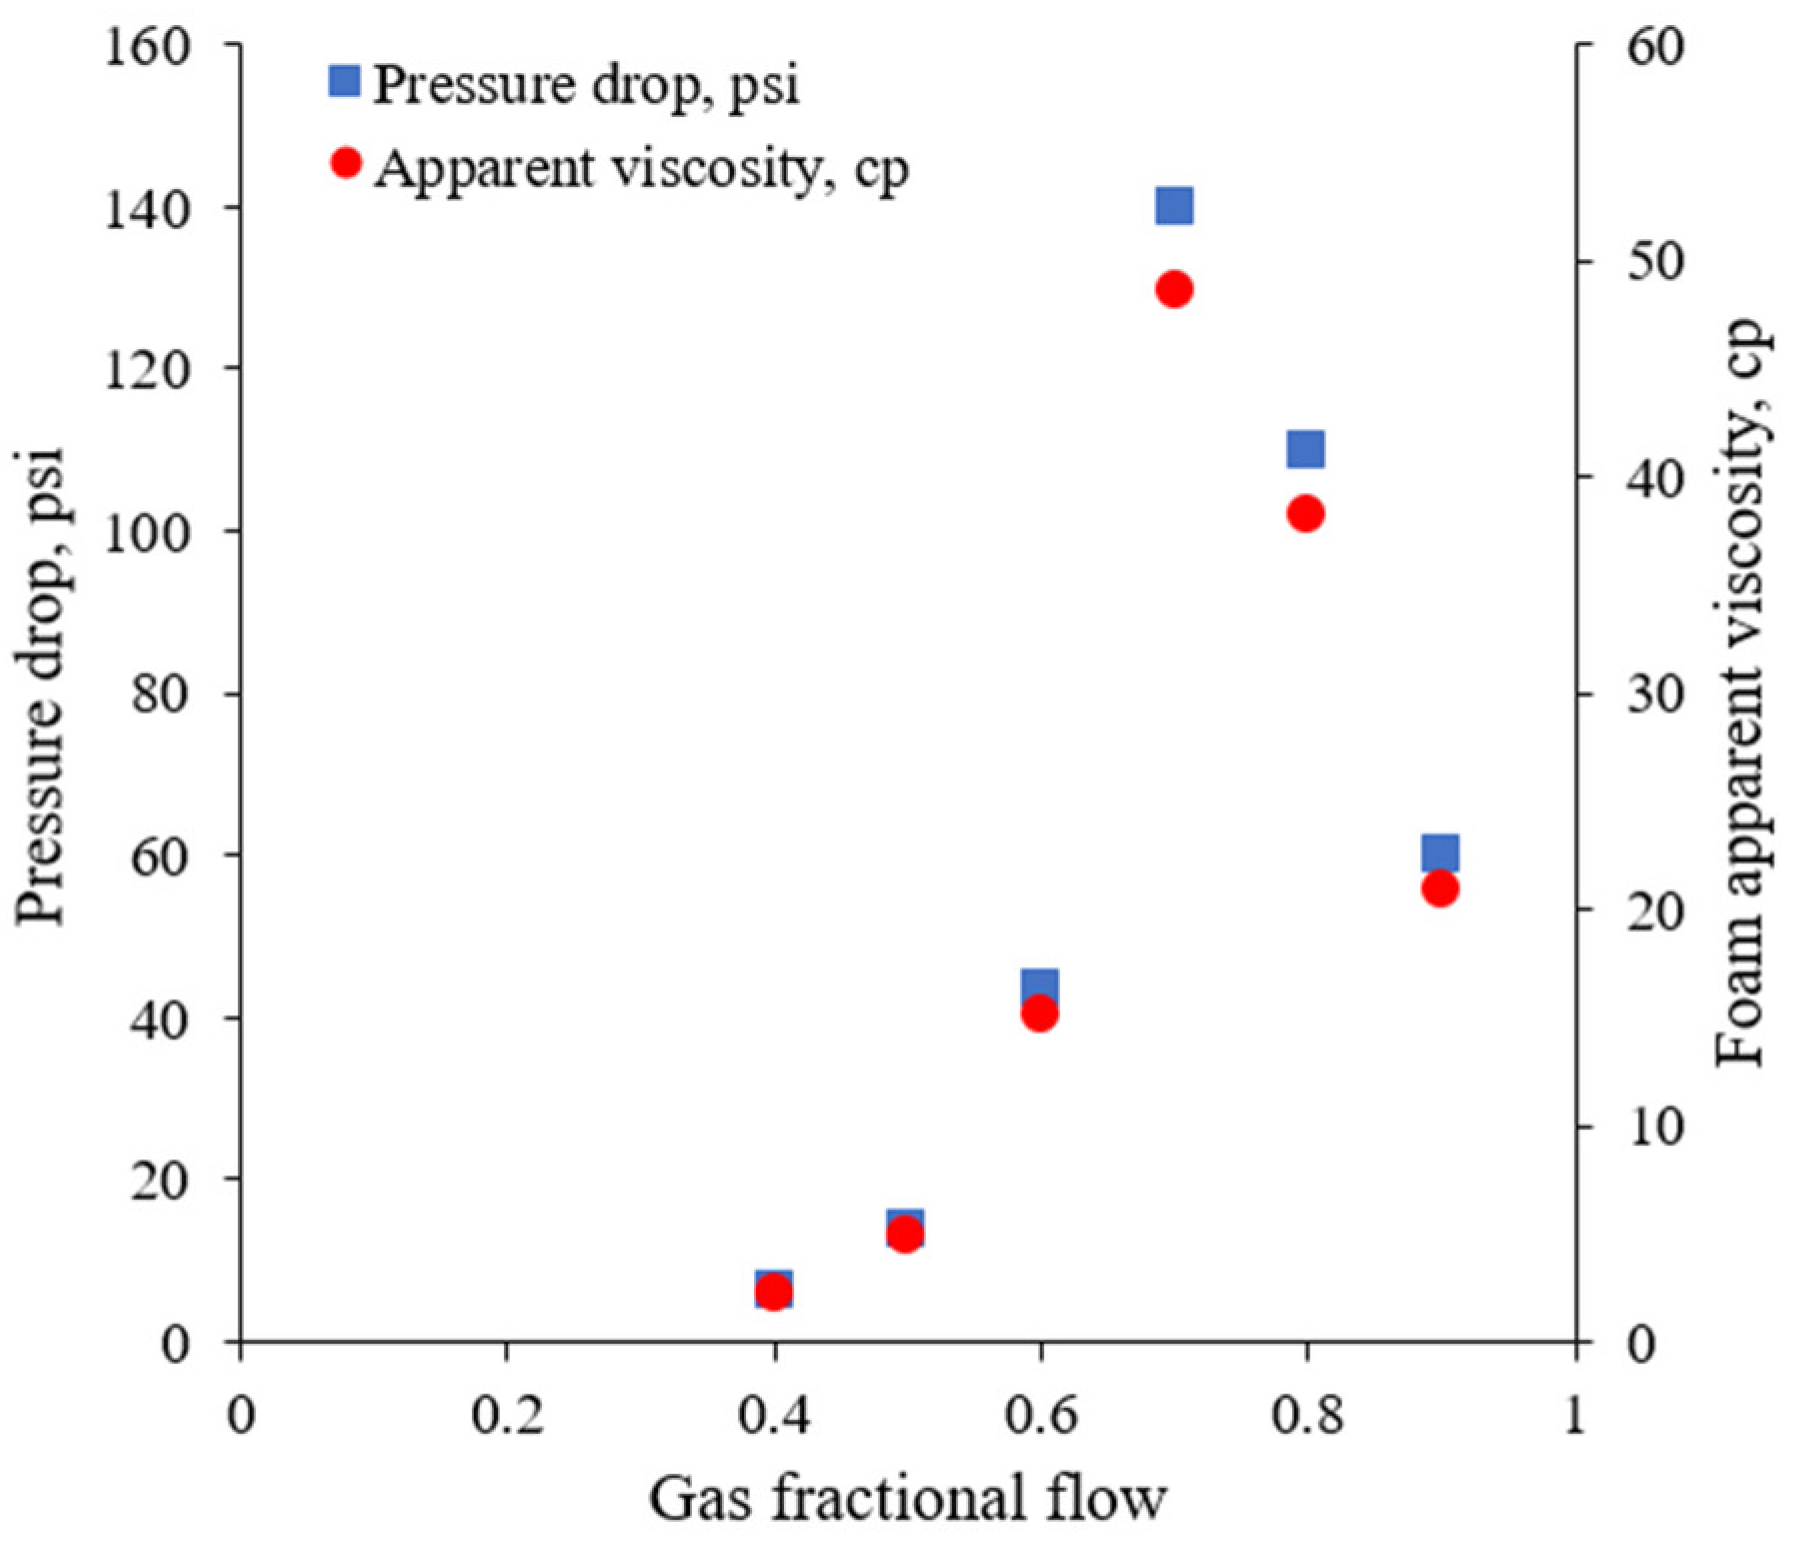
3.2.1. Foam Quality Scan

The steady-state pressure drop during the co-injection of CO2 and AOS surfactant solution through 120 md Indiana limestone core was measured at various foam qualities. The apparent foam viscosity was calculated, as shown in Figure 8. During the injection, the gas fractional flow was increased gradually from 0.4 to 0.7 by simultaneously adjusting the injection rates of CO2 and the foaming solution. As can be seen from the figure, the apparent viscosity increases with injected-gas fractional flow and a maximum viscosity of 49 cp was reached at 70%, which appeared to be a transition point. Afterwards, a further increase in gas fractional flow resulted in the reduction in the apparent viscosity.
From the figure, it can be observed that there are two distinctive foam quality regimes: low and high on the left and right sides of the transition point, respectively, which have been reported by previous authors [44,45]. At a low-foam quality, the dominant flow-resistant mechanism is bubbles trapped in intermediate-sized pores, while the remaining gas continues moving through the largest pores [19]. The foam flow resistance highly depends on the number of foam lamellae per unit of capillary length. A higher density of lamellae leads to greater flow resistance. With increasing gas fractional flow, the number of lamellae increases; thus, the foam flow resistance increases. At the same time, capillary pressure rises with gas fractional flow, and when it reaches a limiting pressure value, lamellae are unstable and collapse; thus, the number of lamellae decreases [46]. In the high-quality regime, the reduction in liquid volume results in decreasing lamellae density and bubble enlargement [47]. Therefore, the ability of foam to resist bulk gas flow becomes weaker with increasing gas fractional flow after the transition point.

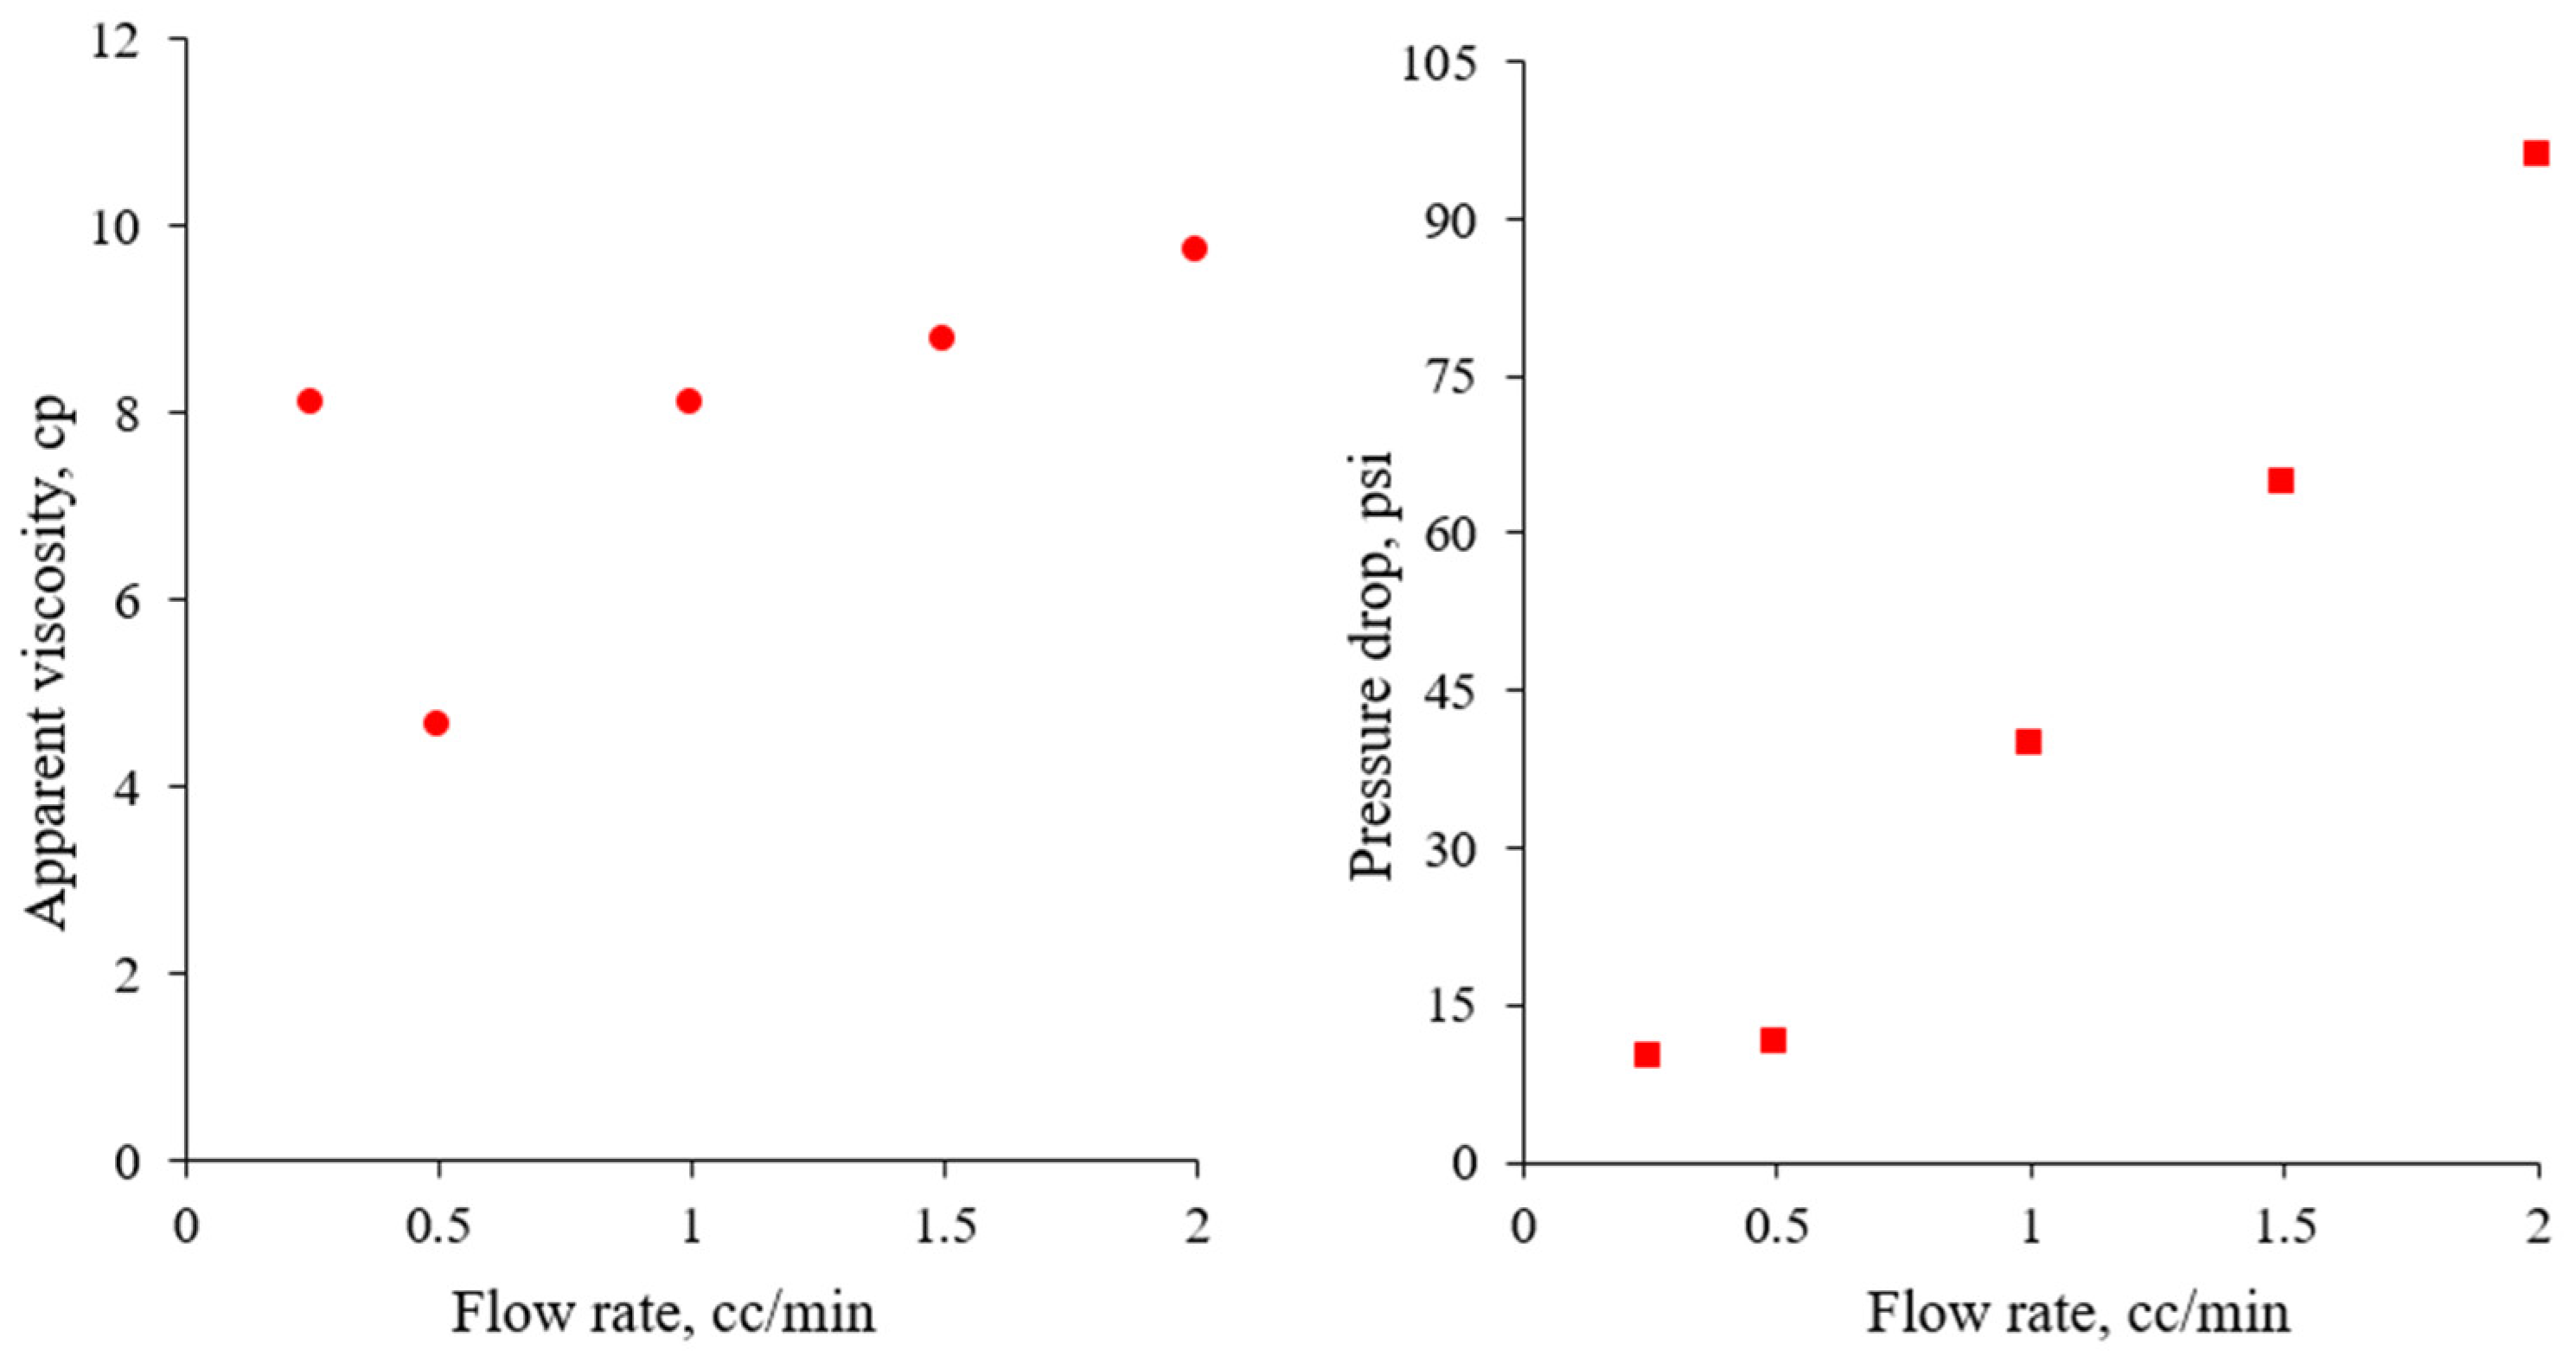
3.2.2. Flow Rate Tests

The propagation of generated foam from the near wellbore area deep into the reservoir depends on the injection pressure, which should be higher than the minimum gradient pressure required to mobilize foam [48]. The effect of the foam injection rate on foam transport behavior was examined in this experiment using a 66 md Indiana core. The change in steady-state pressure drop and foam apparent viscosity are given in Figure 9. The results show that, in the absence of oil, foam was generated in porous media at the low injection rate of 0.25 cc/min with a fixed gas fractional flow of 70%. However, the pressure drop was relatively small, which indicates that foam is classified as weak. A further increase in the injection rate led to a slightly higher-pressure drop, but the apparent viscosity decreased to 4.5 cp, compared to 8 cp at a 0.25 cc/min injection rate. Nevertheless, in subsequent steps, the pressure drop sharply increased with an increasing injection rate. This experiment shows that, when the injection rate was lower than 0.5 cc/min, the foam behavior was shear thinning, while shear thickening behavior was observed for injection rates higher than 0.5 cc/min, which is a critical injection velocity. It was found that at the critical injection velocity, coarse-textured foam was abruptly converted into strong foam with a fine texture and increased density. Thus, CO2 foam with a fixed gas fractional flow of 70% exhibited shear thickening behavior at a critical flow rate of 0.5 cc/min in Indiana limestone. These results are similar to observations by other investigators in the literature [49,50].

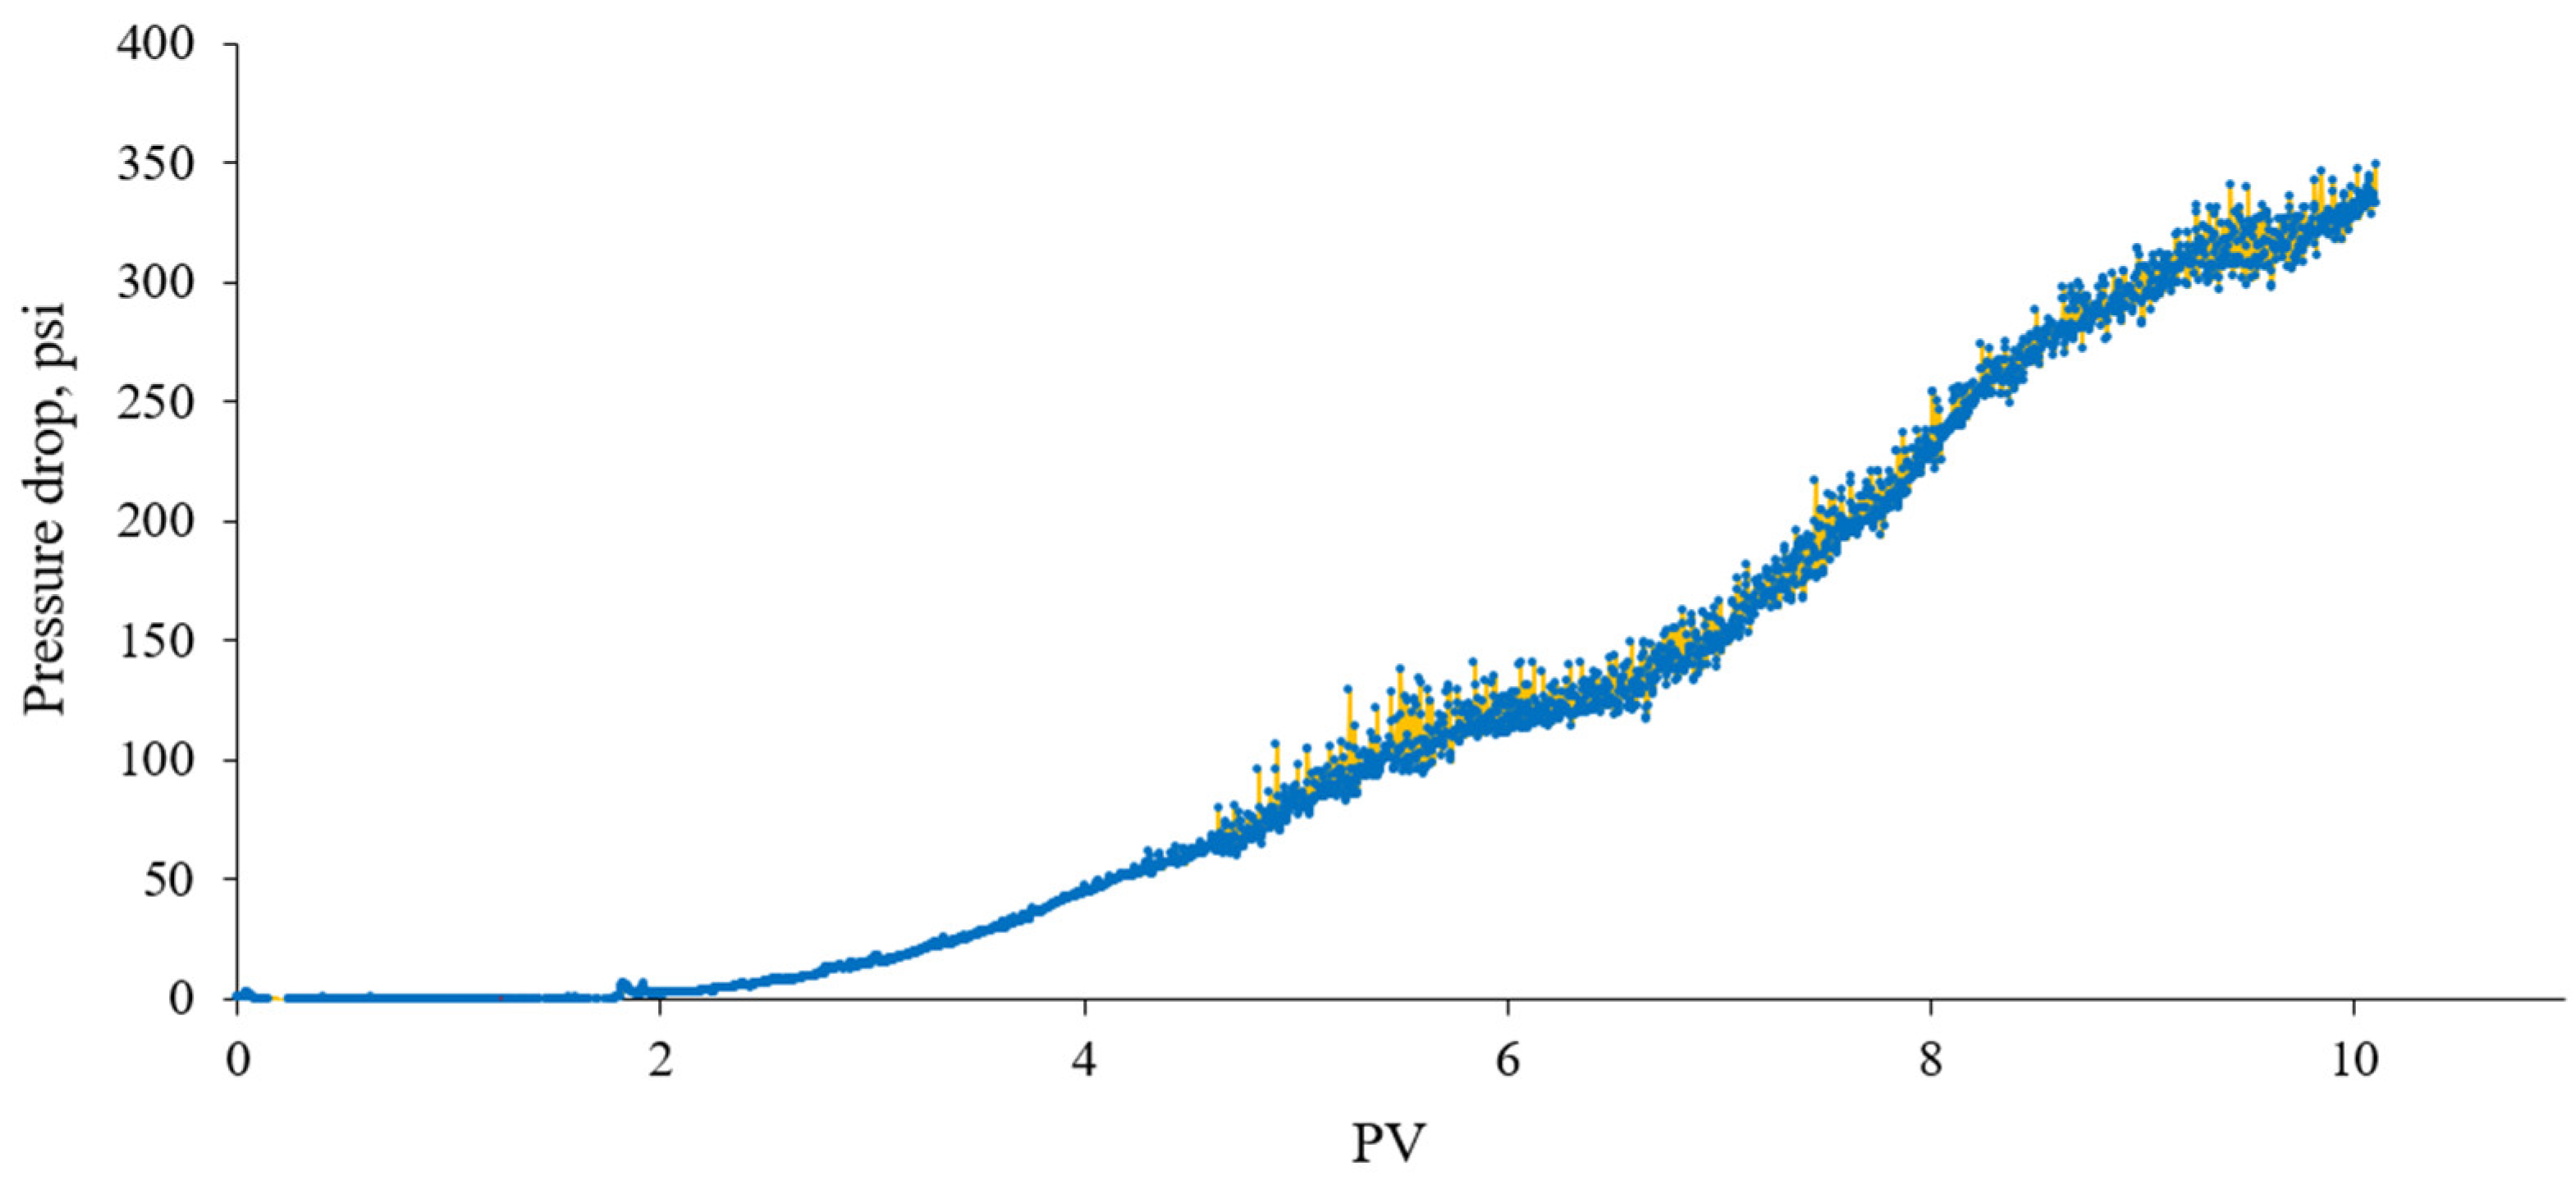
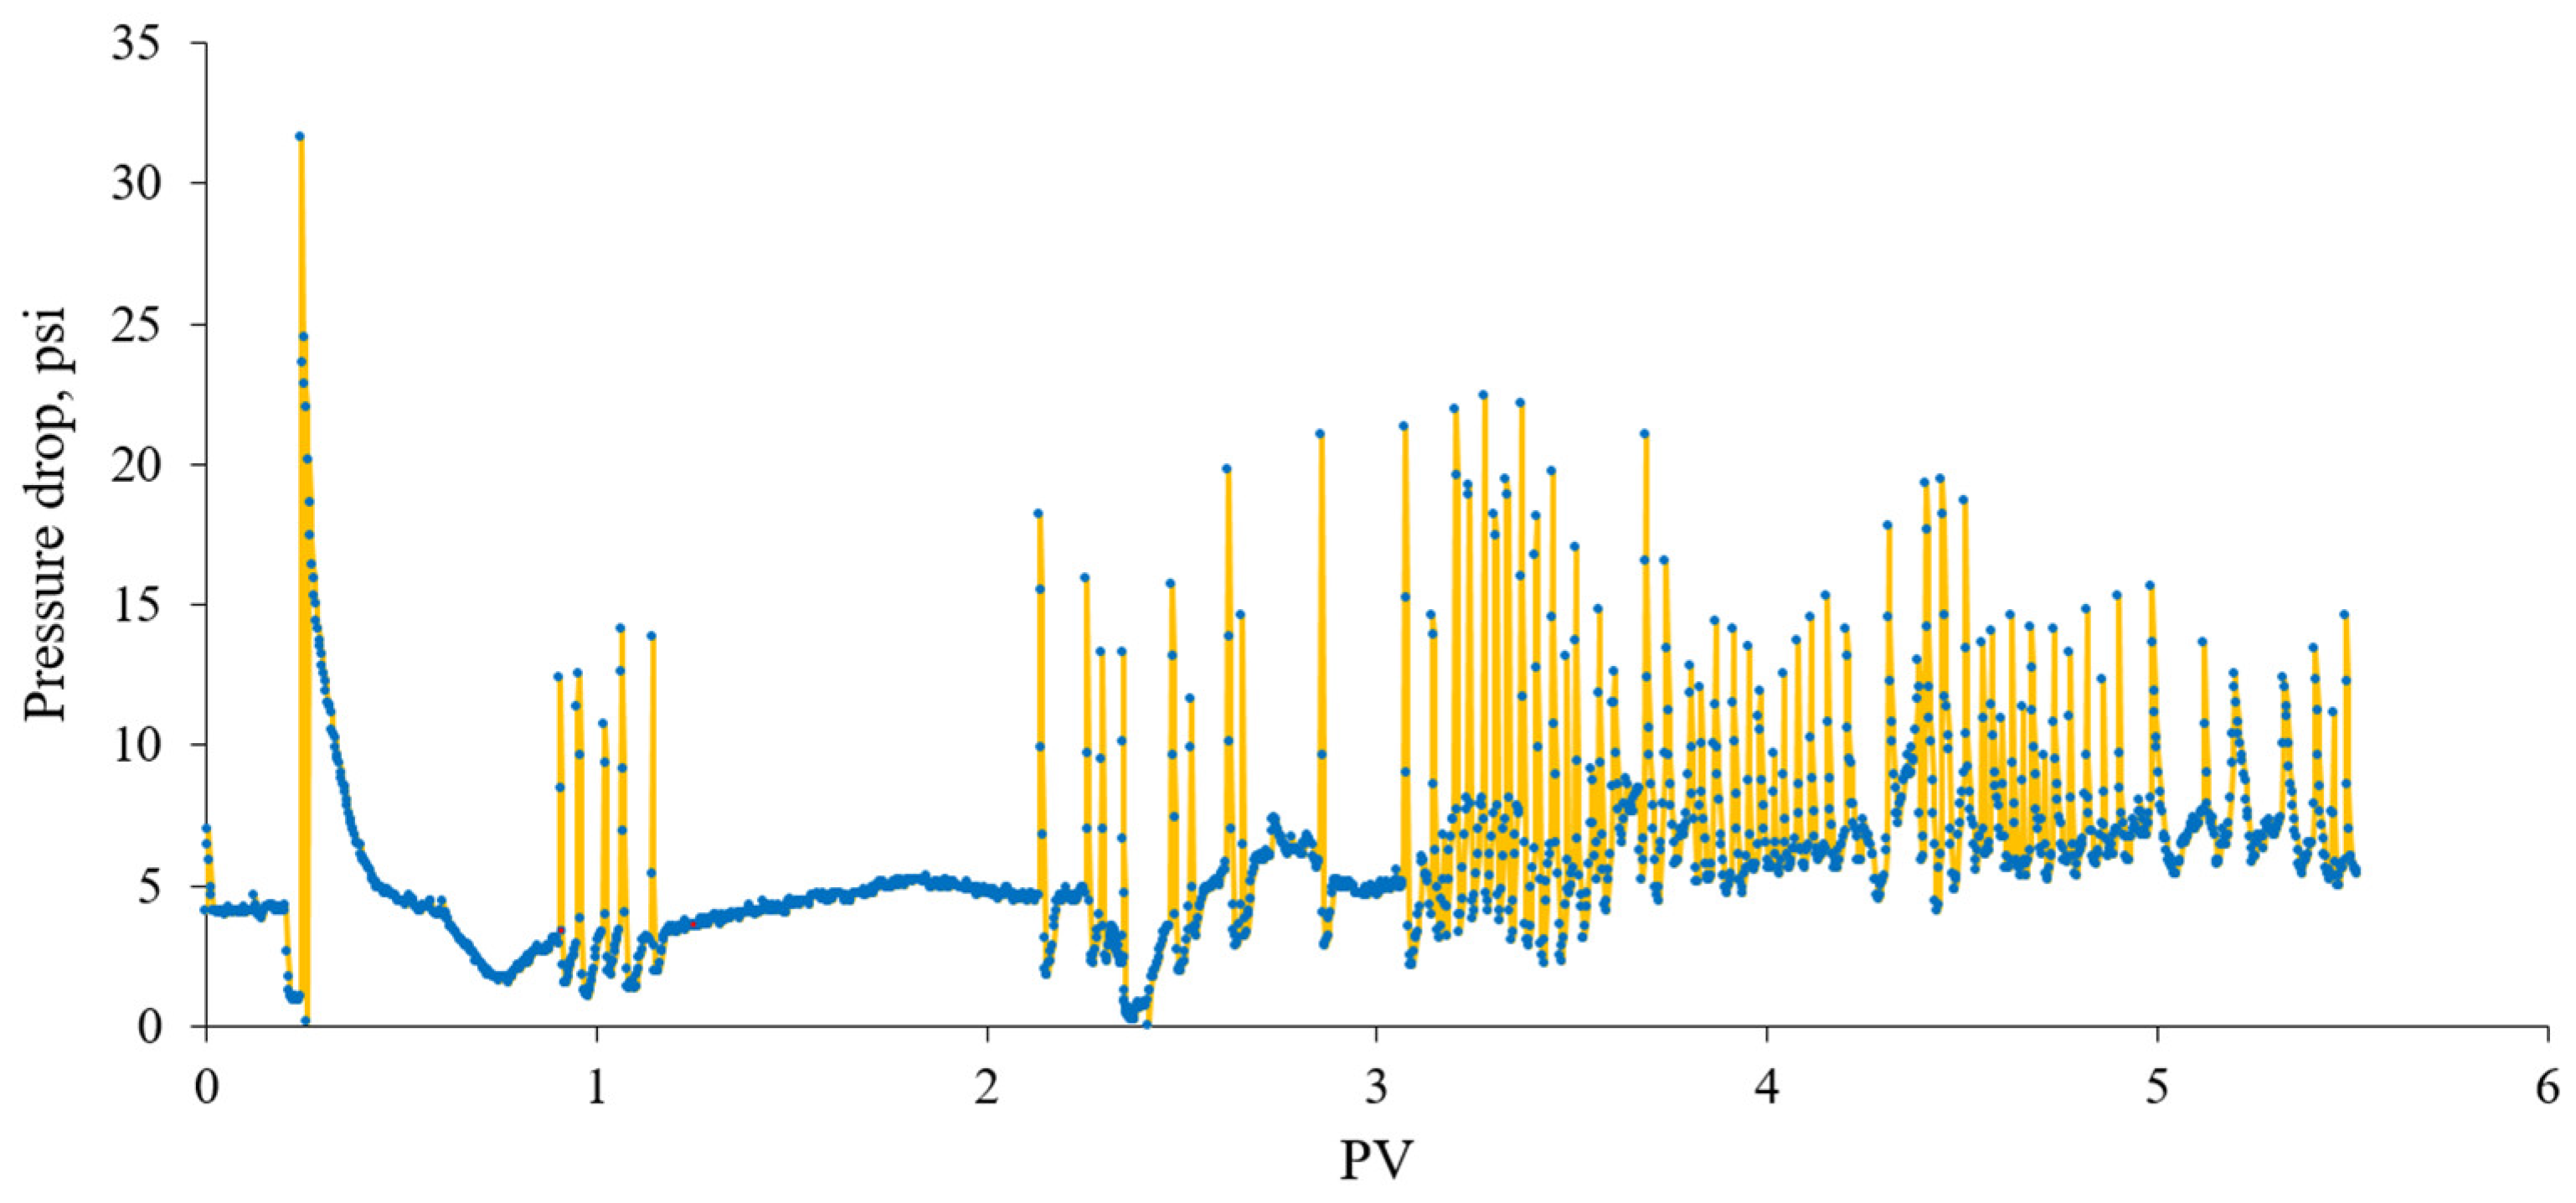
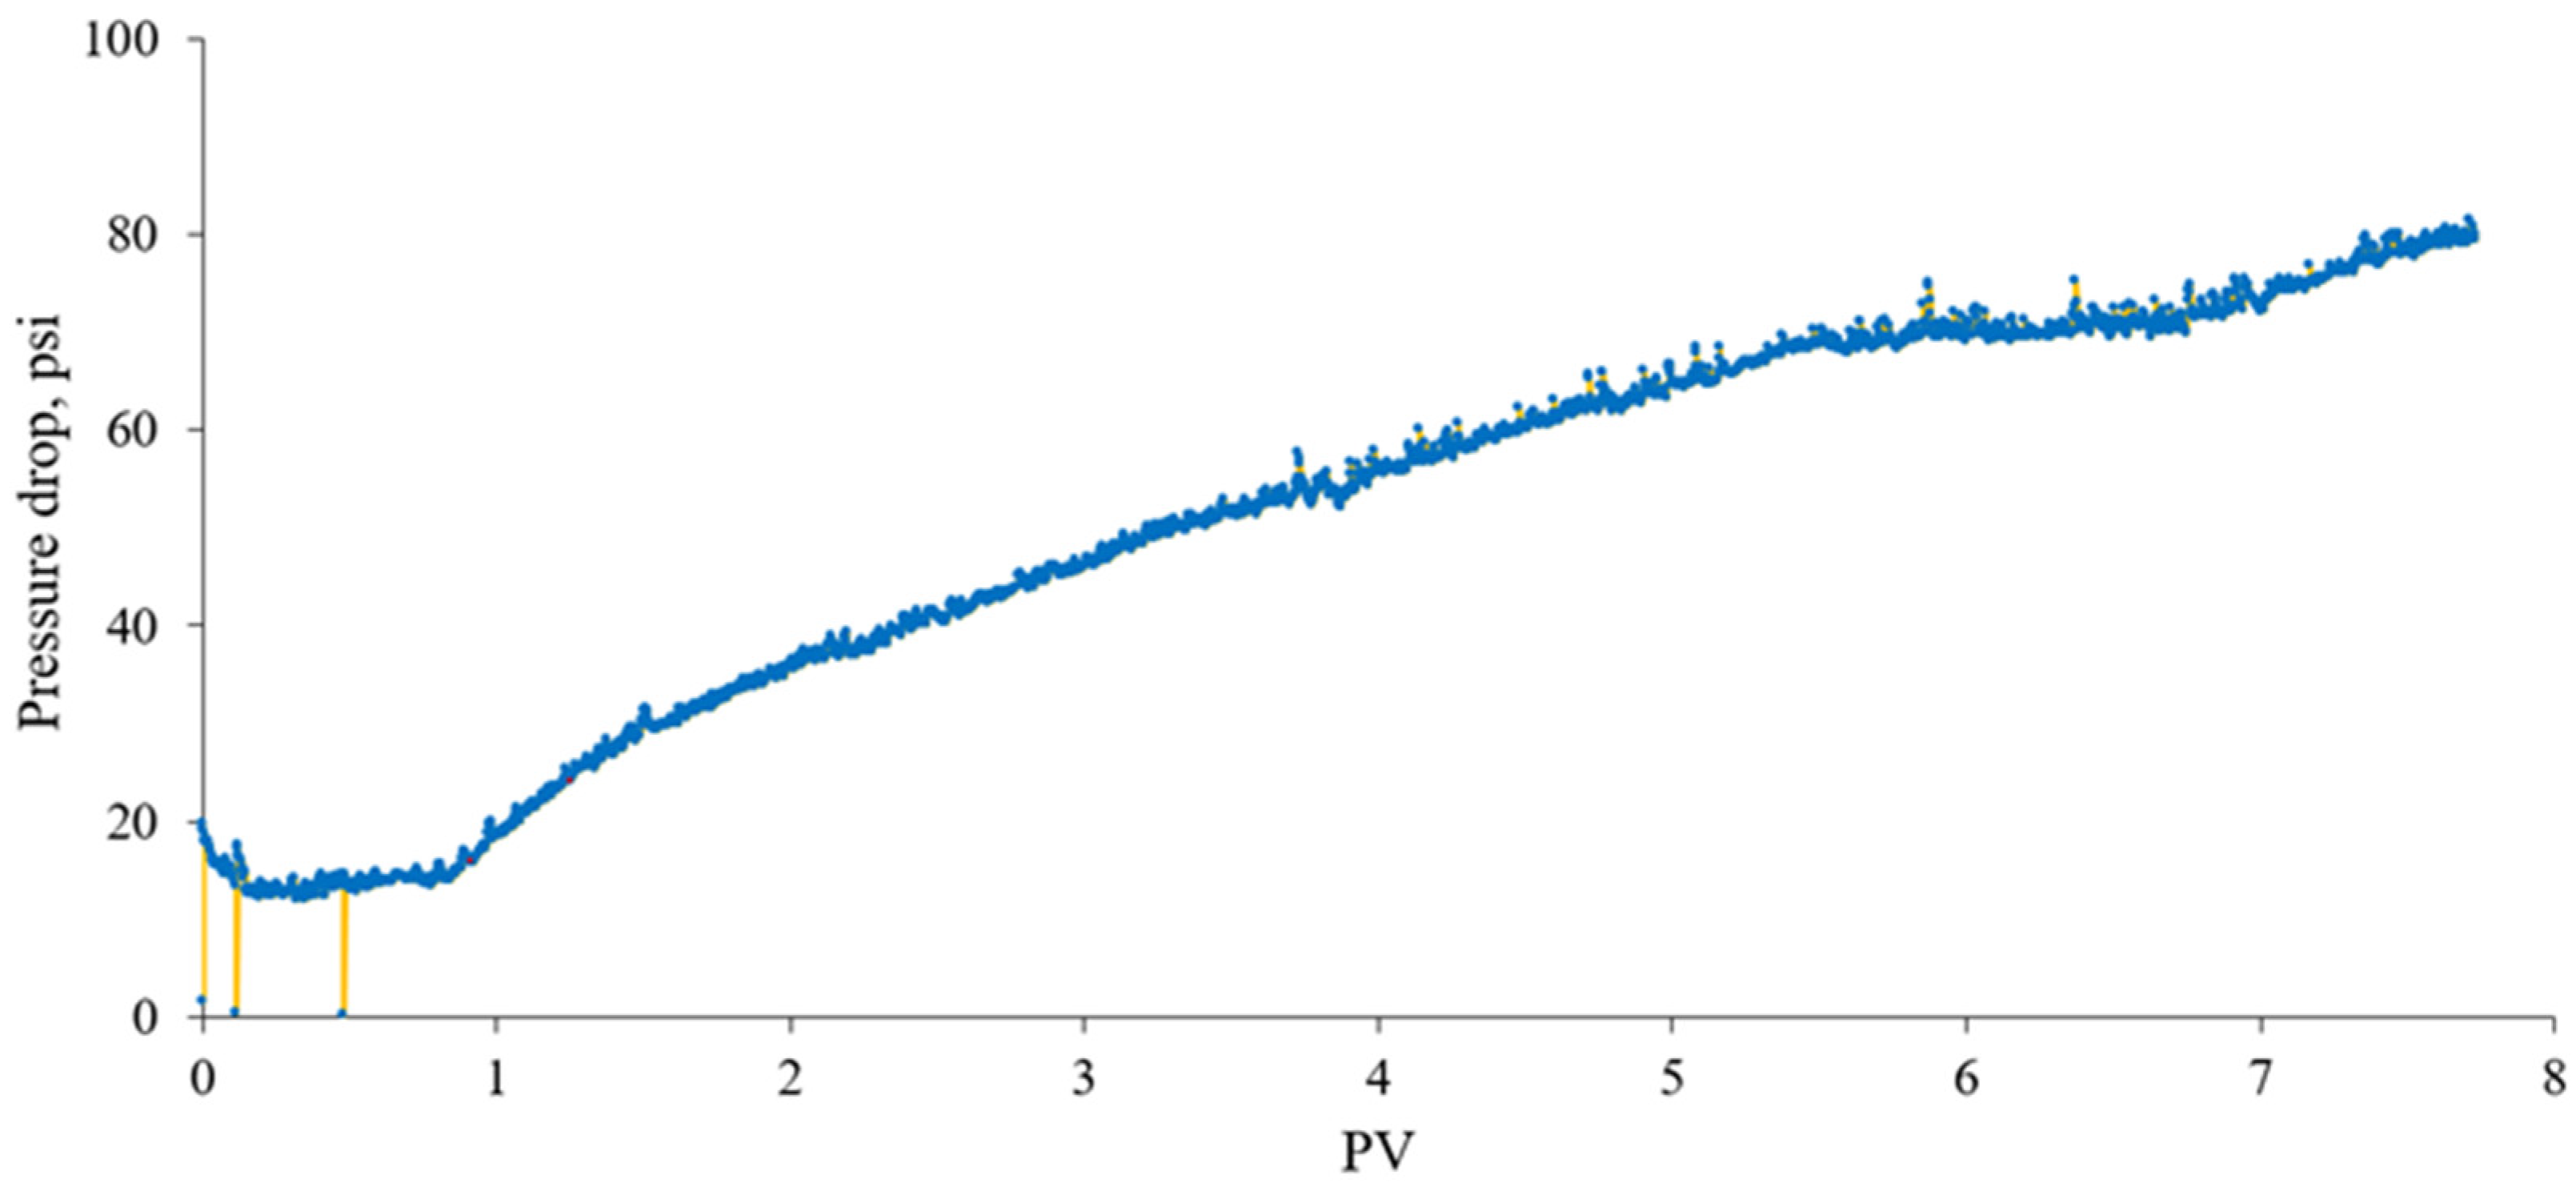
3.2.3. In Situ Foam Generation Test by Co-Injection

Foam flooding experiments were conducted using a brine-saturated 100 md Indiana core to understand foam generation in porous media in the absence of oil. The backpressure was set at 1500 psi and the whole core-flooding system, except the backpressure regulator, which was heated up to 80 °C to represent reservoir conditions. First, one PV of AOS solution was injected to avoid dynamic adsorption effects of surfactant on rock surfaces. The steady-state pressure drop was measured during the preflush and was found to be low (3 psi). After that, CO2 and the solution of 0.5 wt% AOS surfactant were simultaneously co-injected to generate foam at the total rate of 1 cc/min with a fixed gas fractional flow of 70%. The profile of differential pressure during foam flooding through the core is demonstrated in Figure 10. It can be seen from the figure that CO2 foam injection can be divided into three distinct periods. During the first period (0–1 PV), the injected gas and surfactant mixed in situ. The second period (1–2 PV) corresponded to the foam generation interval; thus, pressure built up before stabilizing. After that, further co-injection of gas and surfactant maintained the foam at steady state, where the pressure drop stabilized at 60 psi and the apparent viscosity reached 21 cp. This result indicates that strong foam was generated in the core under reservoir condition, which was able to reduce CO2 mobility.
After test completion, the core was cleaned by flushing at least 20 PVs of brine and 5 PV of isopropanol, which is a good non-polar solvent. During the cleaning process, the core was pressurized and depressurized several times to remove trapped gas and surfactant. Then, the absolute permeability was measured again by injecting the brine at various flow rates. If the estimated average permeability deviated from the original permeability, another flushing of at least 10 PVs of brine was carried out.
After core cleaning, the reservoir temperature was decreased to 40 °C, while the pressure and surfactant concentration were kept at 1500 psi and 0.5 wt%, respectively. The objective of this test was to assess the foam behavior at a lower temperature. In these conditions, CO2 was still in the supercritical state, as in the previous test. Figure 11 illustrates the pressure drop profile during foam injection. Compared to high-temperature conditions, the generated foam exhibited different behavior at low temperature as the pressure drop increased continuously even after 10 PV of foam injection, when the pressure drop reached 320 psi. Furthermore, there was a short plateau region between 5 and 7 PV of foam injection, which was followed by a further increase in pressure drop. The observation shows that the generated foam blocked large pores and diverted flow into medium and small pores; thus, the pressure started to increase again. Overall, foam generated with the co-injection of CO2 and surfactant at low temperature was stronger and considerably more stable than under high-temperature conditions.
In the next step, the co-injection of CO2 and brine without surfactant was conducted under the same test conditions. The objective of this test was to understand the increment impact of foam over WAG. The profile of pressure drop during the co-injection of CO2 and brine is shown in Figure 12. As the figure depicts, the average pressure drop at steady state was around 5–7 psi, which was significantly lower compared to the previous test when the foaming solution was used. Overall, this result shows that co-injection of water with CO2 is ineffective in overcoming CO2-related mobility control and conformance issues; thus, other methods are needed.
Another foam flooding experiment using the same core was conducted at 500 psi and 40 °C to understand foam generation when the injected CO2 was considered to be gas. Figure 13 illustrates the change in pressure drop during foam injection. As can be seen from the figure, foam generation under this condition followed a similar trend as in the first test, when the pressure was 1500 psi and the temperature was 80 °C. First, between 0 and 1 PV, the mixing of CO2 and foaming solution in porous media took place. Then, the pressure gradually increased during the second period (1–5.5 PV), which indicated foam generation and its stabilization. Compared to the first test, the second period at low pressure and temperature was longer because of stronger foam generation, which blocked pore throats and diverted the injected gas into less permeable zones. Thus, more time was required for foam to reach stabilization. In the third period, the steady-state pressure drop reached 70 psi, which was higher than during the first test, showing that stronger CO2 foam was generated at low pressure and temperature conditions, when CO2 was in its gaseous state.

3.2.4. Effect of Surfactant Concentration on Foam Strength in Porous Media

Surfactant concentration is another main factor that considerably affects the foam strength and foam propagation in porous media. This is particularly true as surfactant tends to disperse in liquid or adsorb on the rock surface in real reservoirs. For this reason, investigating the effect of surfactant concentration on foam behavior is an important step in a foam flooding project. Four types of flooding experiments with foaming solutions containing 0%, 0.25%, 0.5%, and 1% of AOS were conducted. CO2 and foaming solution were co-injected through a 66 md Indiana core, which was previously used for foam injection test at various flow rates. The experiments were carried out at a fixed 70% gas fractional flow and constant total injection rate of 1 cc/min. After each test, the core was cleaned following the same procedure, and it was ensured that the permeability variation was small compared to the original permeability (within 5%). A measure of 1 PV of foaming solution was injected before each experiment to minimize the loss of surfactant caused by adsorption on the rock surface.
Figure 14 illustrates the profile of differential pressure at various surfactant concentrations. In general, the co-injection of CO2 and brine without AOS surfactant resulted in the lowest steady-state pressure drop at around 6 psi, which proves the low efficiency of water to reduce CO2 mobility. During the injection of 0.25 wt% AOS, the surfactant pressure drop increased and stabilized at 25 psi, which was an indication of foam generation and formation in the porous media. Further increase in surfactant concentration up to 0.5 and 1% exhibited similar pressure behavior as at 0.25% until 3 PV of injection. With the injection of a higher volume of surfactant at higher concentrations (0.5 wt and 1 wt%), the pressure drop increased considerably, especially at 1 wt%. This indicates that the generated foam became stronger and more stable with increasing surfactant presence; thus, the foam was able to block large pores, and injected fluid went into less-permeable areas.

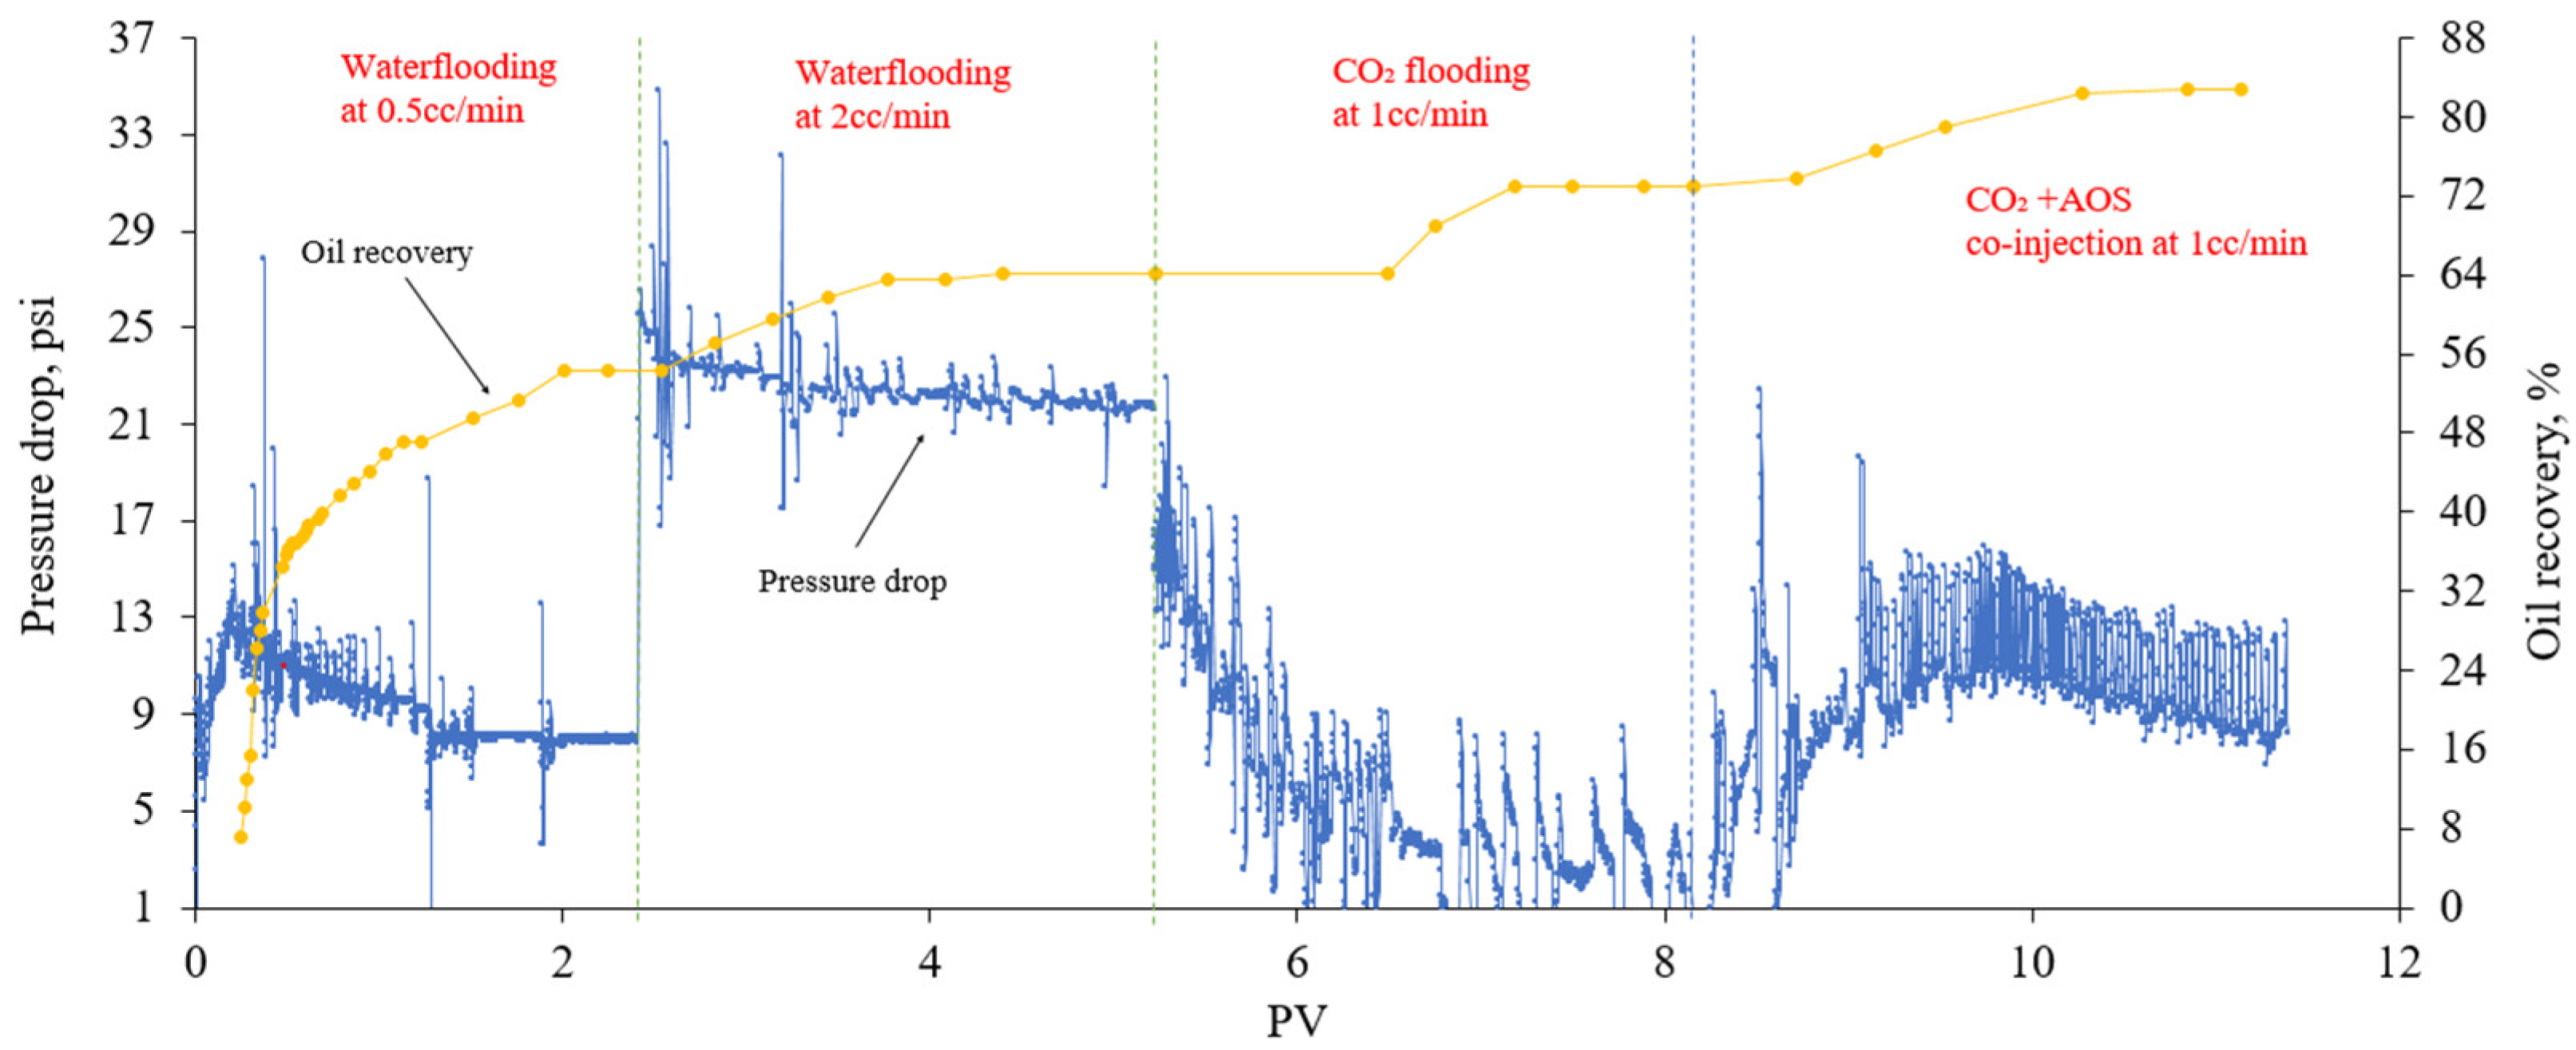
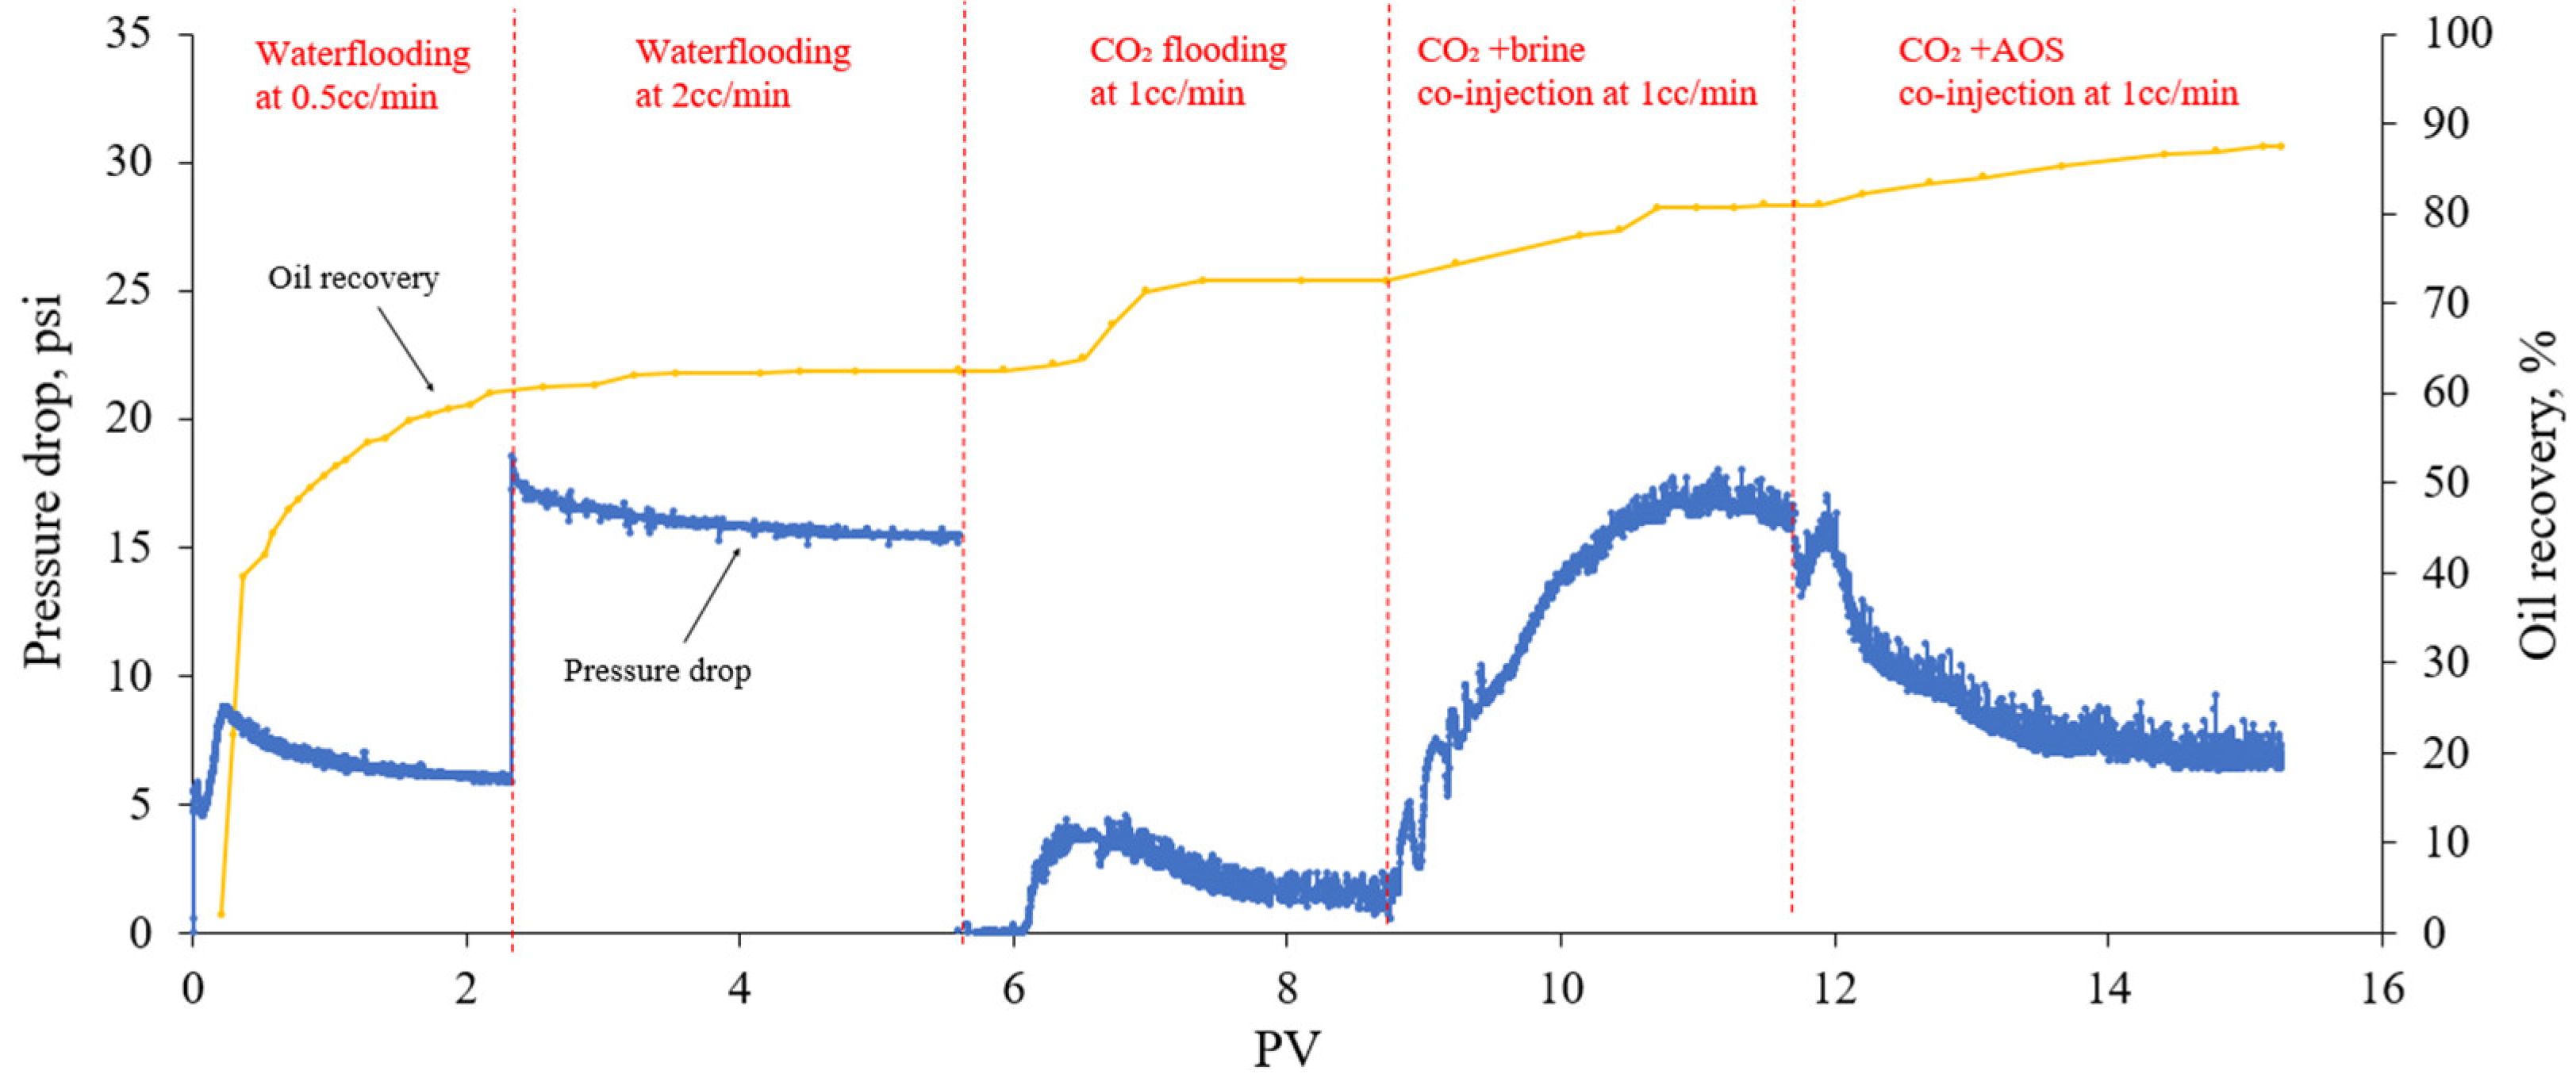
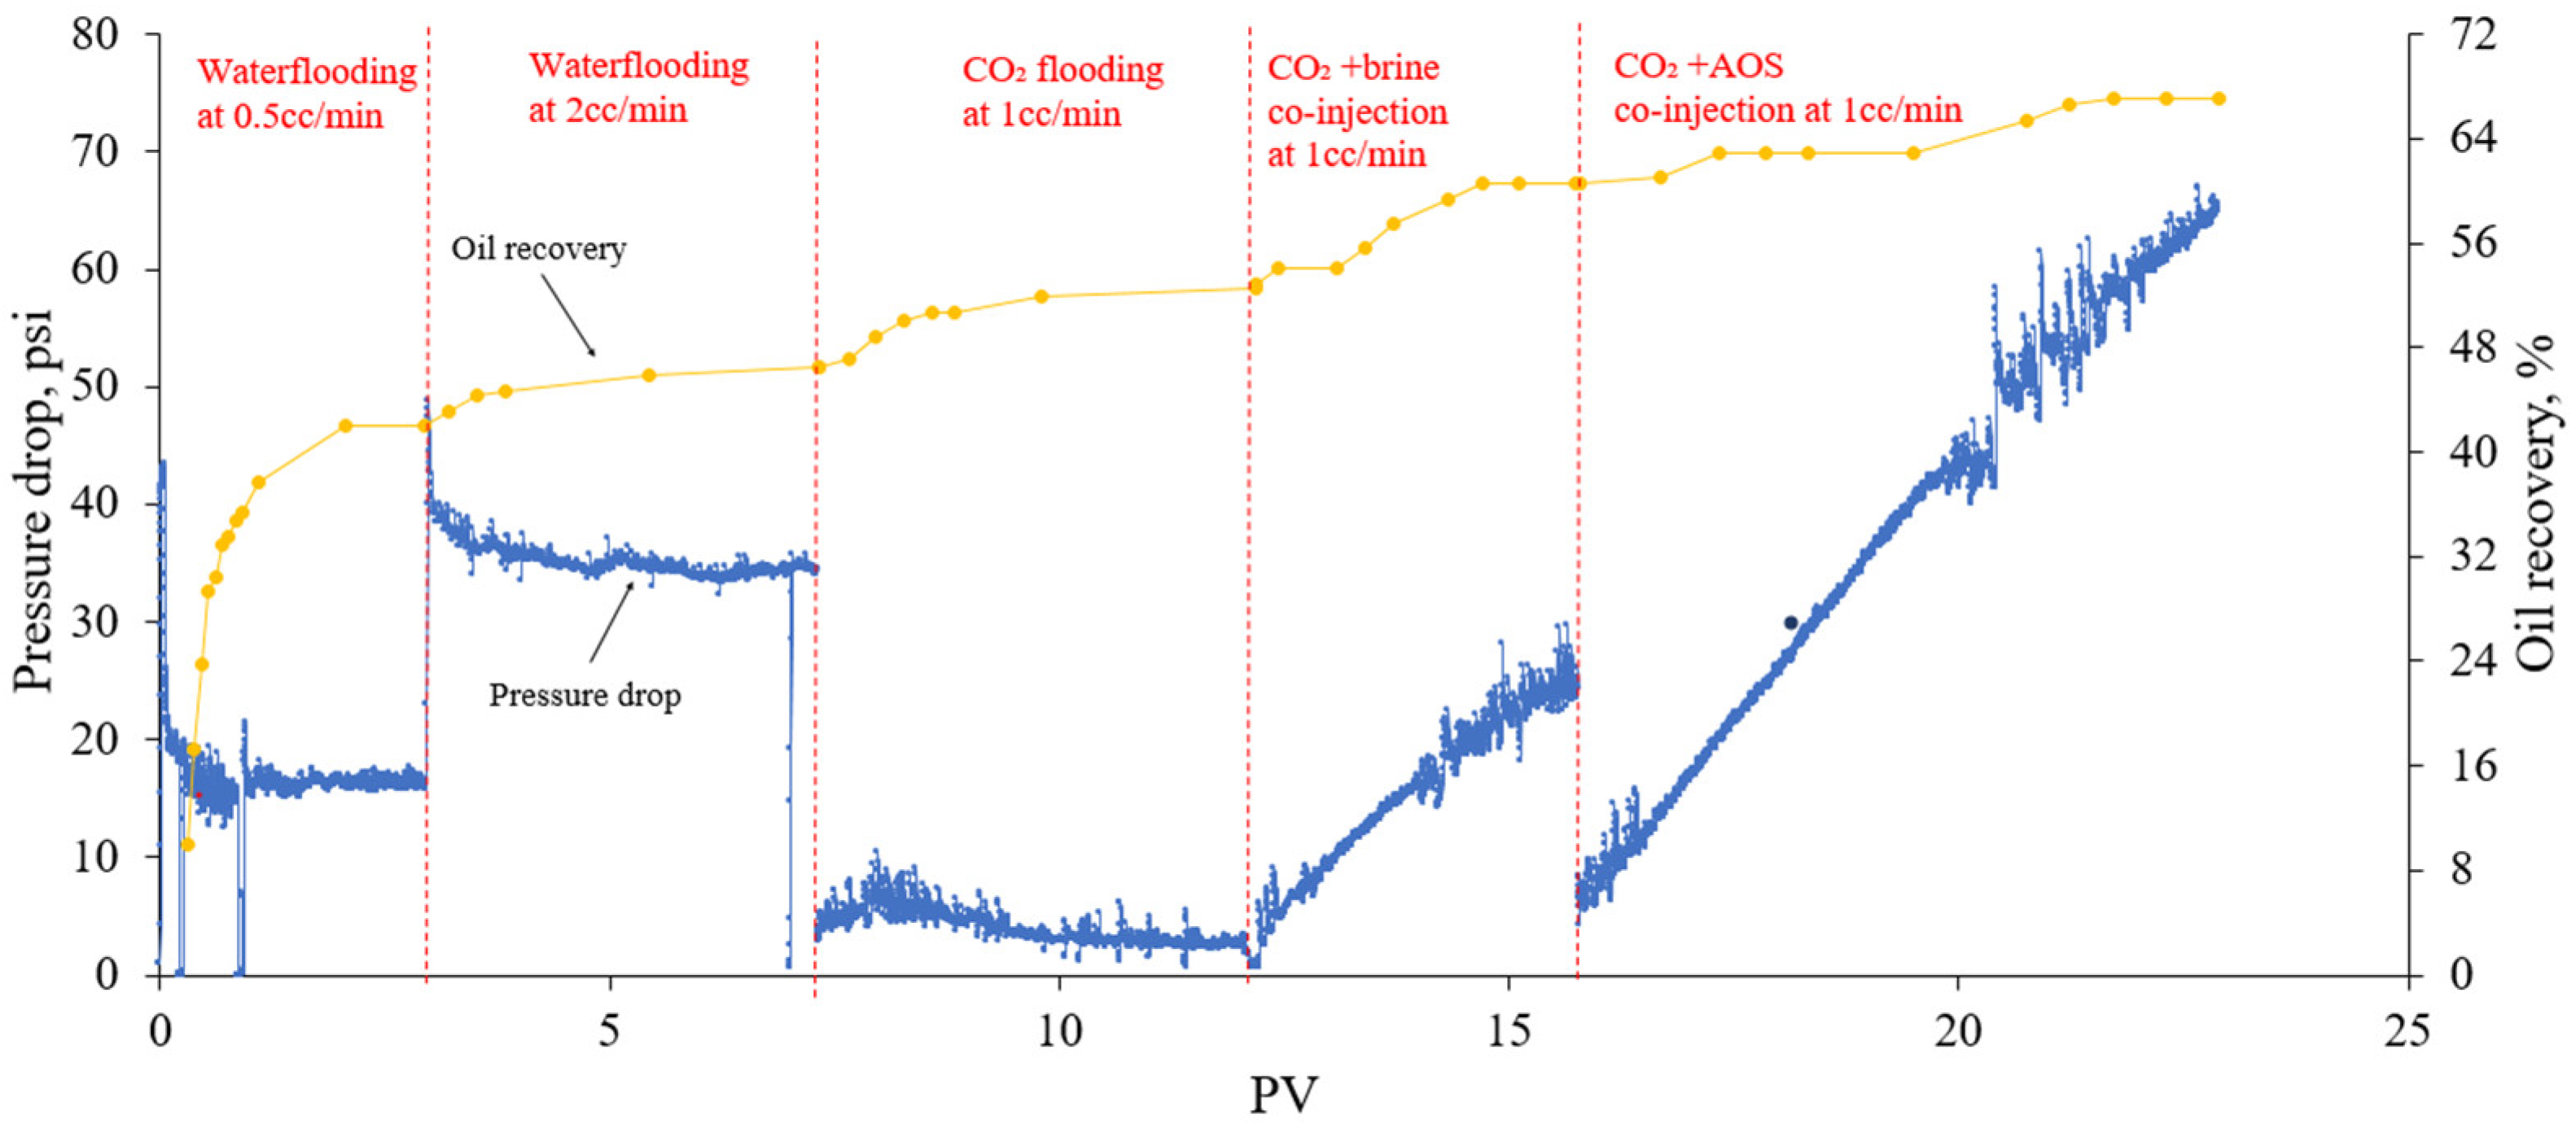
3.3. Oil Recovery Experiments

Three sets of core flooding experiments were conducted to assess the ability of foam generated by co-injection of CO2 and AOS surfactant into the carbonate core to enhance oil recovery.
Core flood 1 was carried out in a 45 md Indiana core with an initial oil saturation of 52%. The test pressure and temperature were 1500 psi and 80 °C. Figure 15 illustrates the injection scheme, cumulative oil production, and profile of the pressure drop across the core. First, waterflooding using synthetic brine was conducted at 0.5 cc/min. Slightly more than 2 PV of brine was injected until no oil was produced. Recovery from waterflooding was about 54.3% of the OOIP, and oil saturation was reduced to 23.8%. The pressure drop during this stage stabilized at around 8 psi. Then, the brine injection rate was increased up to 2 cc/min, and 3 PV of the brine was further injected to minimize the capillary end effect that may exist. The increasing injection rate of brine gave an additional 10% of oil recovery, and the total oil recovery following waterflooding reached 64.3%. The pressure drop increased to 14 psi due to an increase in the injection rate four times. The unfavorable viscosity ratio between oil and brine in this study was 6, which directly affects oil recovery efficiency of waterflooding in a homogeneous core.
Following water injection, supercritical CO2 was injected at 1 cc/min. The minimum miscible pressure between CO2 and crude oil was determined to be 2000 psi at 80 °C, and so oil displacement with CO2 was immiscible in this study. An additional 8.7% of the OOIP was recovered after 2.5 PV of CO2 injection. The pressure drop during CO2 injection stabilized at around 2–3 psi. Following CO2 flooding, co-injection of CO2 and 0.5 wt% AOS surfactant solution was started. The total injection rate was 1 cc/min and gas fractional flow was kept at 70%, which was determined as an optimum value from previous foam flooding experiments. An additional 9.9% of the OOIP was produced after 2 PV of CO2 foam injection; however, only a small amount of oil was recovered until the injection volume reached 3.5 PV. Overall, the co-injection of CO2 and surfactant solution brought the total oil recovery to 82.8% of the OOIP, and the final residual oil saturation was 8.9%. Initially, the average pressure drop gradually increased up to around 12 psi before decreasing slowly to 8.3 psi at the end of foam injection. This can be explained by the increasing gas relative permeability because of the reduction in oil saturation.
Core flood 2 was conducted in a 175 mD Indiana core sample at 500 psi, while the temperature was kept at 80 °C. The aim of this study was to evaluate the oil displacement efficiency of CO2 foam injection, when CO2 was in the gas phase. The injection scheme in this run was the same as in the previous experiment with oil, except that co-injection of CO2 and brine was added before foam flooding to assess the efficiency of the latter as a tertiary EOR method. The initial oil saturation in this experiment was 60.2%. The cumulative oil recovery and differential pressure profile are shown in Figure 16. Initially, 2 PV of brine was injected at 0.5 cc/min, which reduced the oil saturation to 24% and recovered around 60% of oil. Then, the core was flooded with 3 PV of brine at 2 cc/min to avoid the capillary end effect. During this stage, the volume of oil production was insignificant, and the total oil recovery following waterflooding was around 63% of the OOIP. The pressure drop was around 6 and 16 psi during the first and second stages of waterflooding, respectively.
Following this, gas CO2 flooding at 1 cc/min was started. CO2 flooding was able to produce approximately 10% of the OOIP, and the average pressure drop was about 9 psi. Next, the co-injection of CO2 and brine was conducted at 1 cc/min with a fixed gas fractional flow of 70%. An additional 8.5% of the OOIP was produced by co-injection of CO2 and brine. The average pressure drop continuously increased until stabilization at around 16 psi at the end of the injection stage. This means that the co-injection of brine with CO2 reduced the gas mobility and increased its apparent viscosity, thus improving the displacement efficiency, resulting in incremental oil recovery. Co-injection of CO2 and 0.5 wt% surfactant was then started at a 1 cc/min rate with a constant gas fractional flow of 70%. The injection was continued up to 4 PV of injection and recovered an additional 6.5% of the OOIP. Initially, the pressure drop was 14.3 psi and gradually decreased to 7 psi during foam injection. In situ generated foam displaced water; thus, the water saturation decreased and gas saturation increased, which resulted in a pressure reduction. Overall, the ultimate oil recovery after all stages was 87.5%, and the remaining oil saturation was 7.5%.
Core flood 3 was conducted in a 630 mD Indiana core sample at 500 psi and 22 °C. The aim of this test was to assess the oil recovery efficiency of CO2 foam at low temperature and pressure conditions, when CO2 was in the gas phase. The injection process was conducted following the same injection scheme as in the previous test. The cumulative oil recovery and differential pressure profile are shown in Figure 17. The initial oil saturation was 58.4%. Waterflooding was able to recover 46.5% of the OOIP and reduced oil saturation to 31.4%. Overall, 7 PV of brine was injected to overcome the capillary end effect, and the pressure drop was 17 psi at 1 cc/min, and doubled at 2 cc/min.
Following the waterflooding, CO2 was injected at 1 cc/min and produced an additional 6% of the OOIP. The pressure drop during this stage stabilized at around 2.5 psi. The subsequent co-injection of CO2 and brine at 1 cc/min with a 70% ratio significantly increased the pressure difference by 25 psi after 3 PV of injection, and another 8% of the OOIP was recovered. Then, the co-injection of CO2 and 0.5% AOS solution was initiated, and the pressure drop rose rapidly during this stage, reaching 65 psi at the end of the injection stage. In total, 7 PV of gas and surfactant solution was co-injected, which gave around 7% of the OOIP. The ultimate oil recovery reached 67.14%, and the residual oil saturation was 19.5%.
The experimental studies with oil-saturated cores show that the co-injection of CO2 and 0.5 wt% AOS surfactant enhanced oil recovery by 6–9% despite extensive secondary IOR, which indicates the ability of foam to increase even microscopic displacement efficiency by mitigating preferential flow paths and heterogeneity even at the core scale.

4. Conclusions

In this study, a series of bulk tests at various temperatures, salinities, surfactant concentrations, and oil presences in bulk fluids were conducted to investigate the AOS surfactant efficiency in the stability of CO2 foam. Dynamic core flooding tests in the absence and presence of oil were carried out to test foam generation, propagate potential in porous media, reduce CO2 mobility, and recover oil. Based on the results, the following conclusions can be drawn from this study:
  • Above a threshold value, increasing the AOS concentration had an insignificant effect in bulk foam screening tests at the measured foam volume and half-life at ambient pressure, suggesting an economic optimum surfactant concentration.
  • Foam stability decreased with increasing temperature during bulk foam tests at ambient pressure. This effect was stronger at a low surfactant concentration, showing the importance of screening at elevated temperatures.
  • Foam behavior was insensitive to salinity over the range of salinities tested with this surfactant.
  • In high-pressure CO2 core flood experiments in carbonate outcrop cores, the foam apparent viscosity became higher with increasing gas fractional flow until the transition point of 70%. Above the transition point, the apparent viscosity of the foam declined. This supports the concept of a critical capillary pressure for foam instability.
  • Temperature had a detrimental effect on the foam transport behavior in porous media in the absence of oil. The foam stability and strength decreased dramatically with increasing reservoir temperature beyond a threshold, limiting the effectiveness at or above 80 °C.
  • Foam flooding tests showed that the pressure drop across cores increased with increasing AOS concentration, which was more noticeable after the injection of a sufficient amount of the surfactant. This is important in the termination of the minimum chemical requirement.
  • The co-injection of CO2 and brine alone at a fixed gas fractional flow prior during two oil recovery experiments was able to produce around 10% of the OOIP, but this method still left significant unrecovered oil. This is a characteristic of the recovery efficiency of immiscible gas displacement processes.
  • Core floods in a limestone core with crude oil showed that the addition of a surfactant demonstrated to support transient CO2 foam stability was able to enhance oil recovery. The addition of a foam-forming surfactant as a tertiary CO2 flooding method following waterflooding, CO2 flooding, and the co-injection of CO2/brine improved oil recovery by about 6–10% of the OOIP. The ability to increase the microscopic displacement efficiency is attributed to mitigation of heterogeneity on the core scale and sweep improvement offered by foam.

Author Contributions

Conceptualization, methodology, investigation, writing—original draft preparation, M.K.; writing—review and editing, supervision, R.D.H., L.W. and M.R.H. All authors have read and agreed to the published version of the manuscript.

Funding

This research was funded by Nazarbayev University, grant number 080420FD1918.

Data Availability Statement

The original contributions presented in the study are included in the article, further inquiries can be directed to the corresponding author.

Acknowledgments

The authors would also like to thank Stepan Company for providing the chemical samples required for this research.

Conflicts of Interest

The authors declare no conflicts of interest.

References

  1. Hirasaki, G.J.; Miller, C.A.; Puerto, M. Recent advances in surfactant EOR. SPE J. 2011, 16, 889–907. [Google Scholar] [CrossRef]
  2. Worthen, A.J.; Bagaria, H.G.; Chen, Y.; Bryant, S.L.; Huh, C.; Johnston, K.P. Nanoparticle-stabilized carbon dioxide-in-water foams with fine texture. J. Colloid Interface Sci. 2013, 391, 142–151. [Google Scholar] [CrossRef] [PubMed]
  3. Wang, L.; Tian, Y.; Yu, X.; Wang, C.; Yao, B.; Wang, S.; Winterfeld, P.H.; Wang, X.; Yang, Z.; Wang, Y.; et al. Advances in improved/enhanced oil recovery technologies for tight and shale reservoirs. Fuel 2017, 210, 425–445. [Google Scholar] [CrossRef]
  4. Guo, F.; Aryana, S. An experimental investigation of nanoparticle-stabilized CO2 foam used in enhanced oil recovery. Fuel 2016, 186, 430–442. [Google Scholar] [CrossRef]
  5. Koyanbayev, M.; Wang, L.; Wang, Y.; Hashmet, M.R.; Hazlett, R.D. Impact of gas composition and reservoir heterogeneity on miscible sour gas flooding—A simulation study. Fuel 2023, 346, 128267. [Google Scholar] [CrossRef]
  6. Schramm, L.L.; Mannhardt, K. The effect of wettability on foam sensitivity to crude oil in porous media. J. Pet. Sci. Eng. 1996, 15, 101–113. [Google Scholar] [CrossRef]
  7. Enick, R.M.; Olsen, D.; Ammer, J.; Schuller, W. Mobility and conformance control for CO2 EOR via thickeners, foams, and gels-a literature review of 40 years of research and pilot tests. In Proceedings of the SPE Improved Oil Recovery Symposium, Tulsa, OK, USA, 12 April 2012. [Google Scholar]
  8. Talebian, S.H.; Masoudi, R.; Tan, I.M.; Zitha, P.L.J. Foam assisted CO2-EOR: A review of concept, challenges, and future prospects. J. Pet. Sci. Eng. 2014, 120, 202–215. [Google Scholar] [CrossRef]
  9. Worthen, A.; Taghavy, A.; Aroonsri, A.; Kim, I.; Johnston, K.; Huh, C.; Bryant, S.; DiCarlo, D. Multi-scale Evaluation of Nanoparticle-stabilized CO2-in-water Foams: From the Benchtop to the Field. In Proceedings of the SPE Annual Technical Conference and Exhibition, Houston, TX, USA, 28 September 2015. [Google Scholar]
  10. Aryana, S.A.; Kovscek, A.R. Experiments and analysis of drainage displacement processes relevant to carbon dioxide injection. Phys. Rev. E 2012, 86, 066310. [Google Scholar] [CrossRef]
  11. Sanders, A.W.; Nguyen, Q.P.; Nguyen, N.M.; Adkins, S.S.; Johnston, K.P. Twin-tailed surfactants for creating CO2-in-water macroemulsions for sweep enhancement in CO2-EOR. In Proceedings of the Abu Dhabi International Petroleum Exhibition and Conference, Abu Dhabi, United Arab Emirates, 1 November 2010. [Google Scholar]
  12. Chakravarthy, D.; Muralidharan, V.; Putra, E.; Schechter, D.S. Application of X-ray CT for investigation of CO2 and WAG injection in fractured reservoirs. In Proceedings of the Canadian International Petroleum Conference, Calgary, Alberta, 8 June 2004. [Google Scholar]
  13. Dalland, M.; Hanssen, J.E. Enhanced foams for efficient gas influx control. In Proceeding of the International Symposium on Oilfield Chemistry, Houston, TX, USA, 18 February 1997. [Google Scholar]
  14. Lake, L.W.; Johns, R.T.; Rossen, R.W.; Pope, G.A. Fundamentals of Enhanced Oil Recovery, 2nd ed.; Society of Petroleum Engineers: Richardson, TX, USA, 2014; pp. 150–186. [Google Scholar]
  15. Bond, D.C.; Holbrook, O.C. Gas Drive Oil Recovery Process. U.S. Patent 2,866,507, 30 December 1958. [Google Scholar]
  16. Zhao, J.; Torabi, F.; Yang, J. The synergistic role of silica nanoparticle and anionic surfactant on the static and dynamic CO2 foam stability for enhanced heavy oil recovery: An experimental study. Fuel 2021, 287, 119443. [Google Scholar] [CrossRef]
  17. Solbakken, J.S.; Aarra, M.G. CO2 mobility control improvement using N2-foam at high pressure and high temperature conditions. Int. J. Greenh. Gas Control 2021, 109, 103392. [Google Scholar] [CrossRef]
  18. Yu, J.; An, C.; Mo, D.; Liu, N.; Lee, R. Foam mobility control for nanoparticle-stabilized CO2 foam. In Proceedings of the SPE Improved Oil Recovery Symposium, Tulsa, OK, USA, 14 April 2012. [Google Scholar]
  19. Kovscek, A.R.; Radke, C.J. Fundamentals of Foam Transport in Porous Media. In Foams: Fundamentals and Application in the Petroleum Industry; American Chemical Society: Washington, DC, USA, 1994; pp. 115–163. [Google Scholar]
  20. Rognmo, A.U.; Heldal, S.; Fernø, M.A. Silica nanoparticles to stabilize CO2-foam for improved CO2 utilization: Enhanced CO2 storage and oil recovery from mature oil reservoirs. Fuel 2018, 216, 621–626. [Google Scholar] [CrossRef]
  21. Chou, S.I.; Vasicek, S.L.; Pisio, D.L.; Jasek, D.E.; Goodgame, J.A. CO2 foam field trial at north ward-estes. In Proceedings of the SPE Annual Technical Conference and Exhibition, Washington, DC, USA, 4 October 1992. [Google Scholar]
  22. Patil, P.D.; Knight, T.; Katiyar, A.; Vanderwal, P.; Scherlin, J.; Rozowski, P.; Nguyen, Q.P. CO2 foam field pilot test in sandstone reservoir: Complete analysis of foam pilot response. In Proceedings of the SPE Improved Oil Recovery Conference, Tulsa, OK, USA, 14 April 2018. [Google Scholar]
  23. Simjoo, M.; Dong, Y.; Andrianov, A.; Talanana, M.; Zitha, P.L. Novel insight into foam mobility control. SPE J. 2013, 18, 416–427. [Google Scholar] [CrossRef]
  24. Aarra, M.G.; Murad, A.M.; Solbakken, J.S.; Skauge, A. Foam dynamics in limestone carbonate cores. ACS Omega 2020, 5, 23604–23612. [Google Scholar] [CrossRef] [PubMed]
  25. Farajzadeh, R.; Krastev, R.; Zitha, P.L.J. Foam films stabilized with alpha olefin sulfonate (AOS). Colloids and Surfaces A: Physicochem. Eng. Asp. 2008, 324, 35–40. [Google Scholar] [CrossRef]
  26. Aarra, M.G.; Skauge, A.; Martinsen, H.A. FAWAG: A Breakthrough for EOR in the North Sea. In Proceedings of the SPE Annual Technical Conference and Exhibition, San Antonio, TX, USA, 29 September 2002. [Google Scholar]
  27. Blaker, T.; Aarra, M.G.; Skauge, A.; Rasmussen, L.; Celius, H.K.; Martinsen, H.A.; Vassenden, F. Foam for Gas Mobility Control in the Snorre Field: The FAWAG Project. SPE Reservoir Eval. Eng. 2002, 5, 317–323. [Google Scholar] [CrossRef]
  28. Ocampo, A.; Restrepo, A.; Cifuentes, H.; Hester, J.; Orozco, N.; Gil, C.; Gonzalez, C. Successful foam EOR pilot in a mature volatile oil reservoir under miscible gas injection. In Proceedings of the International Petroleum Technology Conference, Beijing, China, 26 March 2013. [Google Scholar]
  29. Ahmed, S.; Elraies, K.A.; Forooozesh, J.; Bt Mohd Shafian, S.R.; Hashmet, M.R.; Hsia, I.C.C.; Almansour, A. Experimental investigation of immiscible supercritical carbon dioxide foam rheology for improved oil recovery. J. Earth Sci. 2017, 28, 835–841. [Google Scholar] [CrossRef]
  30. Føyen, T.; Alcorn, Z.P.; Fernø, M.A.; Barrabino, A.; Holt, T. CO2 mobility reduction using foam stabilized by CO2-and water-soluble surfactants. J. Pet. Sci. Eng. 2021, 196, 107651. [Google Scholar] [CrossRef]
  31. Bello, A.; Ivanova, A.; Cheremisin, A. Enhancing N2 and CO2 foam stability by surfactants and nanoparticles at high temperature and various salinities. J. Pet. Sci. Eng. 2022, 215, 110720. [Google Scholar] [CrossRef]
  32. Abdelall, A.; Gajbhiye, R.; AlShehri, D.; Mahmoud, M.; Patil, S.; Zhou, X. Improvement of supercritical carbon dioxide foam performance for EOR in sandstone reservoirs: An experimental and optimization study. Gas Sci. Eng. 2023, 110, 204859. [Google Scholar] [CrossRef]
  33. Aarra, M.G.; Ormehaug, P.A.; Skauge, A.; Masalmeh, S.K. Experimental Study of CO2- and Methane-Foam Using Carbonate Core Material at Reservoir Conditions. In Proceedings of the SPE Middle East Oil and Gas Show and Conference, Manama, Bahrain, 25 September 2011. [Google Scholar]
  34. Skauge, A.; Solbakken, J.; Ormehaug, P.A.; Aarra, M.G. Foam generation, propagation and stability in porous medium. Transp. Porous Media 2020, 131, 5–21. [Google Scholar] [CrossRef]
  35. Mannhardt, K.; Schramm, L.L.; Novosad, J.J. Adsorption of anionic and amphoteric foam-forming surfactants on different rock types. Colloids Surf. 1992, 68, 37–53. [Google Scholar] [CrossRef]
  36. Ghosh, P.; Mohanty, K.K. Novel application of cationic surfactants for foams with wettability alteration in oil-wet low-permeability carbonate rocks. SPE J. 2018, 23, 2218–2231. [Google Scholar] [CrossRef]
  37. Shepherd, M. Carbonate Reservoirs. In Oil Field Production Geology, 1st ed.; American Association of Petroleum Geologists: Tulsa, OK, USA, 2009; pp. 301–309. [Google Scholar]
  38. Boeije, C.S.; Rossen, W.R. SAG foam flooding in carbonate rocks. J. Pet. Sci. Eng. 2017, 1, 1–18. [Google Scholar]
  39. Skauge, A.; Aarra, M.G.; Ormehaug, P.A.; Solbakken, J.S.; Mogensen, K.; Masalmeh, S. Preparations for Foam Gas Shut-off In Carbonate Reservoirs. In Proceedings of the Abu Dhabi International Petroleum Exhibition & Conference, Abu Dhabi, United Arab Emirates, 11 November 2019. [Google Scholar]
  40. Shakeel, M.; Samanova, A.; Pourafshary, P.; Hashmet, M.R. Experimental analysis of oil displacement by hybrid engineered water/chemical EOR approach in carbonates. J. Pet. Sci. Eng. 2021, 207, 109297. [Google Scholar] [CrossRef]
  41. Beheshti, E.; Riahi, S.; Riazi, M. Impacts of oil components on the stability of aqueous bulk CO2 foams: An experimental study. Colloids Surf. A: Physicochem. Eng. Asp. 2022, 648, 129328. [Google Scholar] [CrossRef]
  42. Sheng, J.J. Modern Chemical Enhanced Oil Recovery: Theory and Practice; Gulf Professional Publishing: Houston, TX, USA, 2011; pp. 79–100. [Google Scholar]
  43. Majeed, T.; Sølling, T.I.; Kamal, M.S. Foamstability: The interplay between salt-, surfactant-and critical micelle concentration. J. Pet. Sci. Eng. 2020, 187, 106871. [Google Scholar] [CrossRef]
  44. AlSumaiti, A.M.; Hashmet, M.R.; AlAmeri, W.S.; Anto-Darkwah, E. Laboratory study of CO2 foam flooding in high temperature, high salinity carbonate reservoirs using Co-injection Technique. Energy Fuels 2018, 32, 1416–1422. [Google Scholar] [CrossRef]
  45. Alvarez, J.M.; Rivas, H.J.; Rossen, W.R. Unified model for steady-state foam behavior at high and low foam qualities. SPE J. 2001, 6, 325–333. [Google Scholar] [CrossRef]
  46. Khatib, Z.I.; Hirasaki, G.J.; Falls, A.H. Effects of capillary pressure on coalescence and phase mobilities in foams flowing through porous media. SPE Reserv. Eng. 1988, 3, 919–926. [Google Scholar] [CrossRef]
  47. Li, B.F.; Zhang, M.Y.; Li, Z.M.; Kovscek, A.; Xin, Y.; Li, B.L. Flow characteristics and regime transition of aqueous foams in porous media over a wide range of quality, velocity, and surfactant concentration. Pet. Sci. 2023, 20, 1044–1052. [Google Scholar] [CrossRef]
  48. Rossen, W.R. Minimum pressure gradient for foam flow in porous media: Effect of interactions with stationary lamellae. J. Colloid Interface Sci. 1990, 139, 457–468. [Google Scholar] [CrossRef]
  49. Lotfollahi, M.; Kim, I.; Beygi, M.R.; Worthen, A.J.; Huh, C.; Johnston, K.P.; Wheeler, M.F.; DiCarlo, D.A. Foam Generation Hysteresis in Porous Media: Experiments and New Insights. Transp. Porous Media 2017, 116, 687–703. [Google Scholar] [CrossRef]
  50. Kahrobaei, S.; Bonnieu, S.V.; Farajzadeh, R. Experimental Study of Hysteresis Behavior of Foam in Porous Media. Sci. Rep. 2017, 2017, 1–11. [Google Scholar]
Figure 1. (a) Crude oil composition and (b) oil viscosity at various temperatures.
Energies 17 03353 g001
Figure 2. The schematic of apparatus for bulk test.
Energies 17 03353 g002
Figure 3. Experimental setup.
Energies 17 03353 g003
Figure 4. The effect of surfactant concentration on foam half-life time at 20 °C.
Energies 17 03353 g004
Figure 5. Visual observations during bulk tests at various surfactant concentrations after 500 s of CO2 injection.
Energies 17 03353 g005
Figure 6. The effect of temperature on foam half-life time.
Energies 17 03353 g006
Figure 7. The effect of brine salinity on foam half-life time at 20 °C.
Energies 17 03353 g007
Figure 8. Pressure drop and apparent viscosity for 120 md Indiana core.
Energies 17 03353 g008
Figure 9. Pressure drop and apparent viscosity for 66 md Indiana core.
Energies 17 03353 g009
Figure 10. Average pressure drop across the Indiana core, 0.5 wt% AOS + CO2, 80 °C and 1500 psi.
Energies 17 03353 g010
Figure 11. Average pressure drop across the Indiana core, 0.5 wt% AOS + CO2, 40 °C and 1500 psi.
Energies 17 03353 g011
Figure 12. Average pressure drop across the Indiana core, brine + CO2, 40 °C and 1500 psi.
Energies 17 03353 g012
Figure 13. Average pressure drop across the Indiana core, 0.5 wt% AOS + CO2, 40 °C and 500 psi.
Energies 17 03353 g013
Figure 14. Average pressure drop across the Indiana core, at various surfactant concentrations, 80 °C and 1500 psi.
Energies 17 03353 g014
Figure 15. Oil recovery following waterflooding, CO2 flooding and foam injection at 80⁰C and 1500 psi.
Energies 17 03353 g015
Figure 16. Oil recovery following waterflooding, CO2 flooding, CO2 + brine and foam injection, at 80 °C and 500 psi.
Energies 17 03353 g016
Figure 17. Oil recovery following waterflooding, CO2 flooding, CO2 + brine and foam injection, at 22 °C and 500 psi.
Energies 17 03353 g017
Table 1. The physical properties of Indiana core samples.
Diameter, mmLength, mmPorosity, %Kabs, mD
3815115.3120
3815115.9100
3814718.366
3815418.345
3814719.8175
3815018.9630
Table 2. The composition of SSW used in this study.
IonsNa+Ca2+Mg2+ClSO42−Total
SSW, ppm32403507405440301013,000
Disclaimer/Publisher’s Note: The statements, opinions and data contained in all publications are solely those of the individual author(s) and contributor(s) and not of MDPI and/or the editor(s). MDPI and/or the editor(s) disclaim responsibility for any injury to people or property resulting from any ideas, methods, instructions or products referred to in the content.

