Article

Influence of Performance Packages on Fuel Consumption and Exhaust Emissions of Passenger Cars and Commercial Vehicles under WLTP

by
Luca Marchitto
1,
Maria Antonietta Costagliola
1,* and
Alessandra Berra
2
1
Istituto di Scienze e Tecnologie per l’Energia e la Mobilità Sostenibili, National Research Council of Italy, Via G. Marconi, 4, 80125 Naples, Italy
2
Dorf Ketal B.V., Schimmelt 2-16, 5611 ZX Eindhoven, The Netherlands
*
Author to whom correspondence should be addressed.
Energies 2024, 17(14), 3356; https://doi.org/10.3390/en17143356
Submission received: 5 June 2024 / Revised: 28 June 2024 / Accepted: 2 July 2024 / Published: 9 July 2024

Abstract

:
The transportation sector is responsible for about 16% of worldwide greenhouse gas emissions. Despite efforts for a sensible reduction by means of new technologies’ development, the average age of a vehicle fleet is 12.3 years in the European Union. In light of this, actions aiming at improving the efficiency of circulating vehicles can prove effective in the short to mid-term. Introducing performance packages in standard fuels could allow a reduction in the CO2 emissions of whole vehicle fleets without any modification to powertrain. Such a kind of additive is generally used in premium fuels; deposit control additives can reduce or control the deposits at intake valves and at nozzle holes with benefits for the fuel efficiency and exhaust emissions. Further improvements in combustion phasing can be achieved with cetane/octane improver. This paper aims to assess the influence of two performance packages on the exhaust emissions and fuel consumption of five vehicles set to be as representative as possible of circulating Italian passenger cars and light commercial fleet vehicles (LCVs). Based on the literature datasets, three Euro 4 vehicles were selected with a mileage representative of each single vehicle class: two passenger cars (one spark ignition and one diesel) and an LCV. Further, two diesel Euro 6 vehicles, a passenger car and an LCV, were tested to investigate the effect of fuel additives on the combustion of vehicles compliant with current homologation regulation. Exhaust emissions and fuel consumption were experimentally estimated on a chassis dynamometer over a worldwide harmonized light vehicles test cycle (WLTC) in a climate-controlled laboratory. Each vehicle was preliminarily tested when running with base fuel, then a 3000 km clean-up stage was performed using the additive package. Finally, WLTC tests were repeated. Results demonstrated the efficiency of the performance packages with a reduction between 1.2% (diesel Euro 6 passenger car) and 8.1% (diesel Euro 4 passenger car) in fuel consumption. Similar trends were found for CO2 emissions. Further, a sensible reduction in THCs, CO and PM was found for each vehicle class.

1. Introduction

The transport sector causes negative impacts on the environment and human health, being responsible for about 25% of the total greenhouse gas (GHG) emissions in Europe [1]. GHG emissions by transport sector are strictly related to the transport demand; they, in fact, dropped substantially in 2020 because of reduced activity during the COVID-19 pandemic. In 2021, they started to increase by almost 8.6%, followed by further growth of 2.7% in 2022.
In future years, they are expected to increase due to the continuous increase in transport activity volume. In 2022, the number of EU-registered passenger cars reached almost 253 million, corresponding to an increase of 7.0% as compared with 2017. Moreover, passenger cars powered by electric battery and hydrogen (alternative fuels) only made up a small share of the new registration of passenger cars in the EU in 2022 [2]. This is in contrast with the EU’s aim to be climate neutral by 2050. The European Green Deal has recently recommended a 90% net greenhouse gas emissions reduction by 2040 compared to 1990 levels [3]. Indeed, a sustainable mobility system based on zero emission vehicles and a more rational use of transportation is strongly needed.
In the short term, the use of fuel with performance additives is a viable way to obtain a sudden reduction in fuel consumption and GHG emissions from in-use vehicles. Benefits coming from these additive fuels are expected to be more effective for old vehicles with significant mileage accumulation and scarce maintenance. According the European Automobile Manufacturers’ Association (ACEA) [4], in 2022, European circulating fleets of light-duty vehicles had an average age of 12.3 years; the age of passenger cars had a minimum of 7.9 years in Luxemburg and a maximum of 17.3 years in Greece. This age distribution implies a great share of pre-Euro 6 circulating vehicles. For example, in Italy where in 2022 cars were on average 12.5 years old, close to European statistics, two vehicles out of three were pre-Euro 6: Euro 6 vehicles accounted only for 32.6%, Euro 5 for 16.7% and Euro 4 for 23.3% [5].
Many fuel additives have been investigated with a view to reducing fuel consumption and exhaust emissions [6,7].
In general, performance packages are used to improve the function of the engine/vehicle; they differ from finished fuel additives, which are used to make the fuel compliant with legislative standard.
Performance additive packages generally contain DCAs (deposit control additives), corrosion inhibitors and demulsifiers. They might also include additional components such as friction modifiers, antifoams, etc.
DCAs (deposit control additives) allow control over the formation of deposits on the engine components: they are fuel systems for direct and indirect injection internal combustion engines (the most common are the injector-nozzle coking and fouling) and intake valves in the case of port fuel injection engines. The use of DCAs keeps elements of the fuel system clean, reducing emissions of carbon monoxide, unburned hydrocarbons and particulate matter and reducing fuel consumption [8]. Controversial results have been achieved regarding the influence of DCAs on deposits in the combustion chamber. The diffusion of GDI engines has brought attention to this issue: direct injection promotes the formation of deposits in the combustion chamber, partially offsetting the benefits achieved in terms of fuel efficiency and exhaust emissions. The use of DCAs contributes to reduce the formation of carbon deposits on the injector holes, ensuring proper long-term functioning. When the proper dosage is used, deposit control additives should also limit carbon deposits in the combustion chamber. However, an excessive concentration of DCAs can have the opposite effect, promoting deposits’ formation [9].
Fuel additive packages can additionally contain friction modifier to control friction and energy losses, hence improving fuel economy [10].
Frausher et al. investigated the effect of the friction modifiers as fuel additives instead of oil additives. In fact, the degradation of oil during the engine run banishes the effect of oil additives. They found that adding a friction modifier directly into the fuel can substitute depleted oil additives and improve friction and wear characteristics, even after engine oil degradation [10].
Some fuel additives can influence the ignition timing. In particular, the use of some additives which improve the autoignition process increases the cetane number of a diesel fuel, involving a reduction in ignition delay in a compression ignition engine. Reducing the ignition delay results in improved start ability, less noise and lower exhaust emissions, especially of NOx. The cetane improver additive category generally includes alkyl nitrates and peroxides [11].
Ashok et al. [12] used a multifunctional additive package including surfactant, de-emulsifier, friction modifier, dispersant, cetane improver, antioxidant and combustion catalyst to improve the fuel economy and exhaust emissions of a single cylinder diesel engine fueled with diesel and biodiesel. For both fuels, the use of additives resulted in a reduction in BSFC, which can be partially attributed to a lower ignition delay. Further, antioxidant and cetane improver limited the formation of NOx.
In an analogous way, the octane quality of a gasoline (resistance to the autoignition) can be improved using high-octane blend components (such as oxygenates or aromatic) or octane-improving additives. I.e., in the past, methylcyclopentadienyl manganese tricarbonyl (MMT) was used, though metalorganic octane boosters have now been phased out in most countries [11]. Components are blended with fuels in low volume percentages; therefore, they alter the properties of the fuel (density, heat value, etc.) in addition to the octane resistance. Additives are added to fuel in a few parts per million without influencing other physical–chemical characteristics of gasoline [13]. A high knock resistance can allow increasing engine compression ratios, with benefits for performance and efficiency. Therefore, considering the need for more efficient engines with the aim of reducing GHG emissions, a growing interest in the use of octane enhancer is expected [14].
Evaluating the efficacy of a performance additive in an internal combustion engine or a vehicle requires long-term tests as its action is mainly focused on the cleaning of deposits and friction reduction and the effect on engine performance and exhaust emissions is not immediate except for the cetane/octane improver. Even though a specific regulation defining a harmonized test procedure does not exist, the European automotive industry, brought together in CEC (Coordinating European Council for the development of performance tests for fuels, lubricants and other fluids), developed a series of protocols to estimate the performance of oils and fuels [15]. Engine and test procedures have been developed for each engine type (PFI spark ignition (SI), DISI and diesel) in order to produce comparable data regarding the influence of additives on defined parameters (deposits on intake valves, nozzle deposits, internal diesel injector deposits (IDID), etc.). These procedures take several engine running hours; i.e., the CEC-F-05-93 and CEC-F-20-98 methods for the evaluation of intake valve deposit formation in SI engines require 60 h tests.
Burke et al. [16] studied in depth the effects of injector-nozzle fouling in diesel engines, demonstrating a relationship with air and fuel pumping losses. Injector fouling tests were performed by means of a modified version of the CEC F-98-08 cycle to avoid issues related to engine power derating due to engine control unit protection algorithms, which could alter results. Further WLTC tests were carried out to analyze the effect of injection fouling during a transient cycle representative of on-road conditions.
CEC F-98-08 test procedure is specifically thought to quantify fouling effect, defining a relationship with the reduction in fuel rate, engine torque and power. Hence, steady-state conditions are established, keeping constant engine speed and accelerator position. In this way, it is easy to quantify the power loss related to fouling and the benefits of additives. On the other hand, data on fuel economy cannot be considered robust as a wider range of operative conditions and transient stages have to be taken into account to be representative of real driving conditions [17].
Few papers report information about the influence of deposit control additives on the performance and exhaust emissions of vehicles under real-world driving conditions.
In this paper, the results of a wide experimental campaign are discussed and carried out to analyze the effect of additive fuel on exhaust emissions and fuel consumption of 5 in-use vehicles: 3 passenger cars and 2 commercial vehicles. Vehicles are homologated with Euro 4 and Euro 6 stages and were chosen to be representative of circulating fleets in Italy. For this purpose, each vehicle was tested in chassis-dynamometer laboratory over WLTC driving cycle.

2. Materials and Methods

Performances of fuel additives were evaluated by comparing the exhaust emissions and specific consumption of same vehicle fueled with baseline and treated fuels (baseline fuels + additive). For this purpose, chassis-dynamometer WLTC tests were firstly carried out to measure vehicle emissions with baseline fuel and repeated to characterize vehicle emissions with treated fuels. The concentration of additives in the fuels is a few ppm, and the treated fuels comply with the European standards EN 228 (RON 95 gasoline) and EN 590 (automotive diesel fuel). Therefore, their use does not require any modifications to the powertrain architecture or the after-treatment system, nor is it necessary to optimize the engine control unit calibration. Tests relative to treated fuels were preceded by a mileage accumulation of 3000 km, which is necessary for engine cleaning and conditioning. This section describes the experimental set-up, tested vehicles and fuels.

2.1. Experimental Set-Up

Vehicle emissions were measured during experimental tests on the chassis-dynamometer bench (Schenk, 184 kW, maximum speed 200 km/h) that simulates the dynamic road load resistance during the execution of the driving cycle.
The exhaust gases are collected, diluted by a constant volume dilution system (CVS) and then sent to Horiba-Mexa 7200H gas analyzer for the continuous concentration measurement of carbon monoxide CO and carbon dioxide CO2 by means of a NDIR (non-dispersive infrared) sensor and total hydrocarbons (THCs) with a FID (flame ionization detector), while chemiluminescence method is applied for nitrogen oxides NOx (sum of NO and NO2). At the same time, for each single phase of WLTC cycle, a sample bag is filled during the test to estimate the average values. Fuel consumption is estimated by applying the carbon balance to the exhaust pollutants. Moreover, particulate matter (PM) was sampled on a high-efficiency filter (99.95% aerosol retention 0.3 μm DOP) and quantified throughout gravimetric analysis. For Euro 6 vehicles, particle number (PN) was sampled with a fine particle sampler (FPS, Dekati, Kangasala, Finland) and measured with an electric low pressure impactor (ELPI, Dekati) which counts the number of particles with aerodynamic diameter from 7 nm up to 10 mm. The ELPI analyzer measures the total PN and the particle size distribution into 12 dimensional stages.
In order to verify the effect of fuels in real driving conditions, all the vehicles were tested using worldwide harmonized light vehicles test cycles (WLTC); the certification driving cycle came into force in 2017 with the Euro 6d-temp phase. The WLTC cycle is, in fact, characterized by many transients (Figure 1), and includes four consecutive phases (WLTC low, WLTC medium, WLTC high and WLTC extra-high) with increasing average speed, representative of urban, rural and highway driving mode.
Cold-start WLTC (vehicle placed at 23 °C with the engine off for at least 6 h before starting the engine) and warm-start WLTC (vehicle with engine fluid temperature higher than 80 °C) were repeated three times with reference and additive fuel, respectively.
A statistical analysis was performed (F-test) for checking the significance of difference in fuel consumption and exhaust emissions between vehicle operations with and without additive, with a confidence threshold level of 95%, over each single stage of WLTC [18].

2.2. Vehicles

Vehicle technical characteristics are shown in Table 1.
Fleet is composed of a Euro 4 gasoline passenger car (G_PC_EU4), a Euro 4 and Euro 6 diesel passenger car (D_PC_EU4 and D_PC_EU6) and a Euro 4 and Euro 6 diesel light commercial vehicle (D_LCV_EU4 and D_LCV_EU6).
The power to mass ratio of all Euro 4 vehicles is comparable (between 43 and 45 W/kg); Euro 6 passenger car and light commercial vehicle have the highest and lowest power to mass ratio (almost 55 and 40 W/kg, respectively).
All the vehicles had a huge mileage, between 145,000 km for EU4 commercial vehicle and over 250,000 km for EU6 commercial vehicle. High mileage was needed to clearly assess the cleaning effect of additive fuels. Tested vehicles were chosen as representative of Italian circulating fleets. They are, in fact, equipped with internal combustion engines, which are, largely speaking, widespread in Italy. It was estimated that almost 10–12% of gasoline and diesel passenger cars and 20% of commercial vehicles circulating in Italy have the same engine technology as the tested vehicles. Moreover, as shown in Figure 2, Euro 4 and Euro 6 vehicles constitute a not-negligible share (almost 53% of passenger cars and 43% of light commercial vehicles) of vehicles circulating in Italy [5].
Mileage of vehicles is well above the durability threshold recommended by European legislation (100,000 km for Euro 4 vehicles and 160,000 for Euro 6 vehicles). In order to state the status of vehicle aging, Table 2 summarizes the deterioration factors (i.e., ratio between the aged emissions and the type approval limits) calculated for each vehicle over the homologation driving cycle (NEDC for Euro 4 and WLTC for Euro 6). The most critical ratios are relative to CO emissions for gasoline vehicles since deterioration factor is 2.1, higher than European factor of 1.2, and to the level of THCs + NOx emissions for diesel Euro 4 vehicles. For these vehicles, in fact, deterioration factor is almost double compared to European threshold of 1.

2.3. Fuels

The fuels, EN 228 gasoline and EN 590 diesel including 6 to 7% FAME, were supplied by a petroleum and distribution company and sampled from their daily production. An independent inspection company was commissioned to inject the performance package and certify the doping as well as the properties of the fuels before and after the injection of the additives. The fuel drums were sealed by the inspection company and the seal was removed only to refuel the vehicles. Main properties of tested fuels can be found in Table 3 and Table 4 for gasoline and diesel fuels, respectively. As aforementioned, additives concentration in the fuels is a few ppm, and treated fuels comply with the European standards EN 228 and EN 590.

3. Results

In this section, the experimental results of vehicle fuel consumption and pollutant exhaust emissions will be discussed.

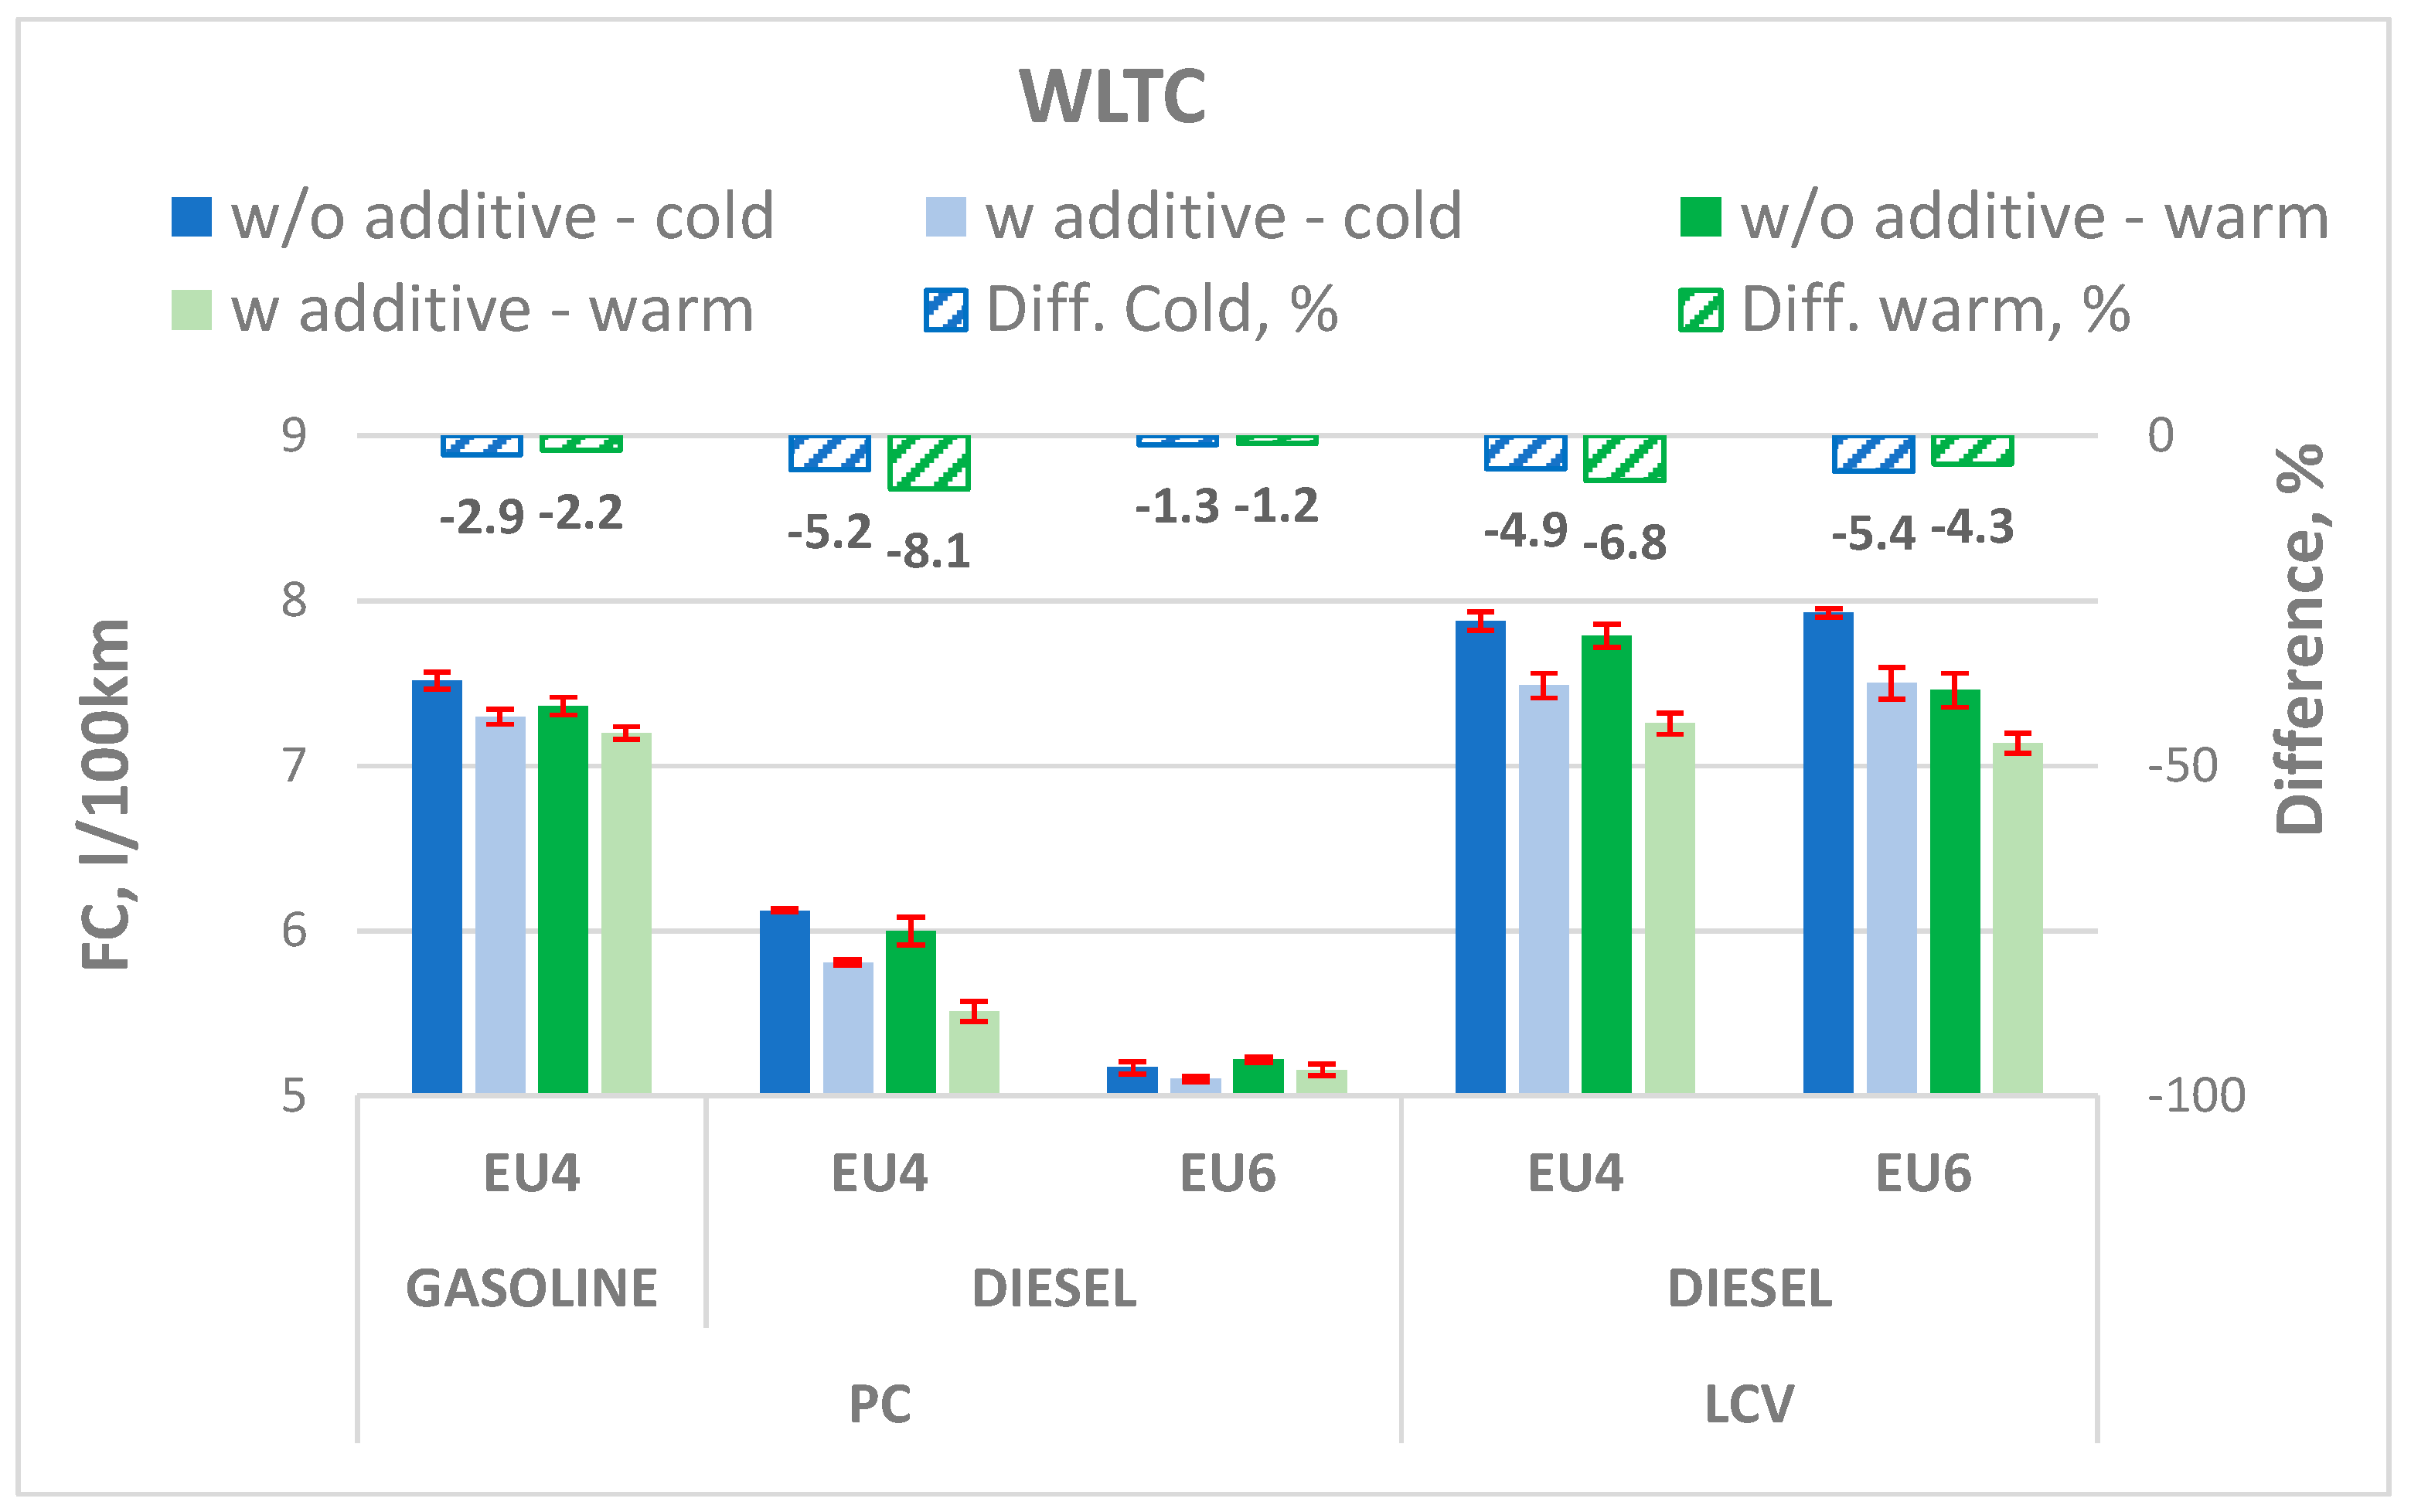
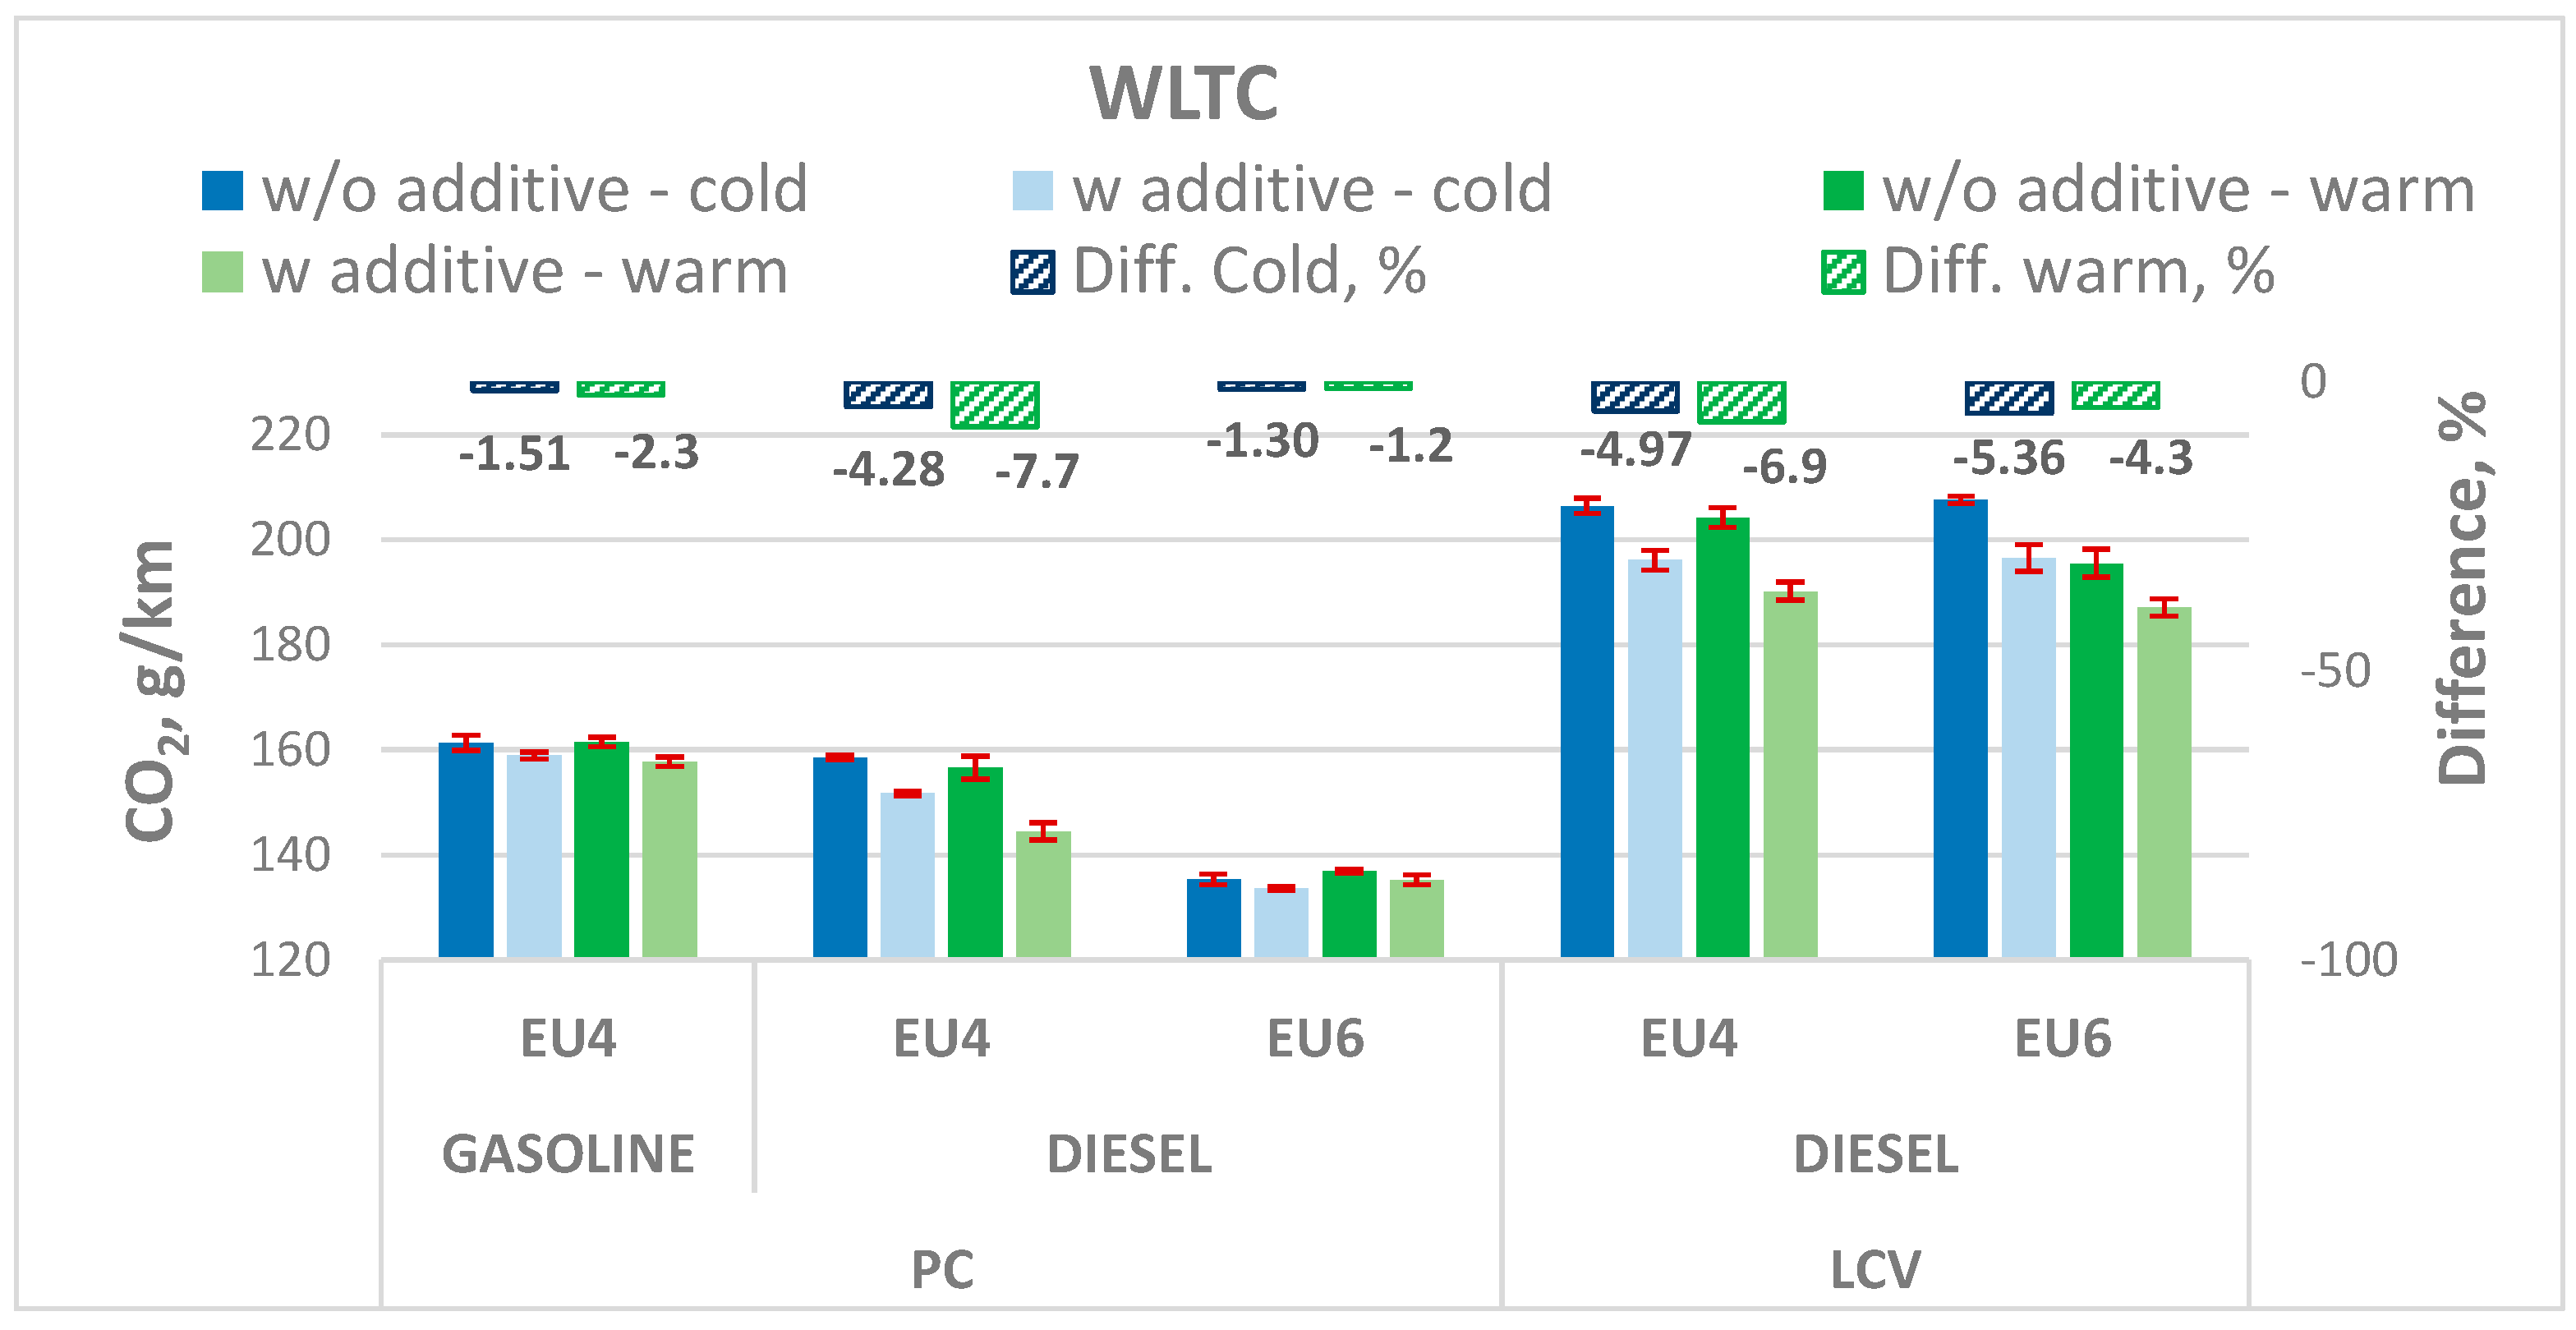
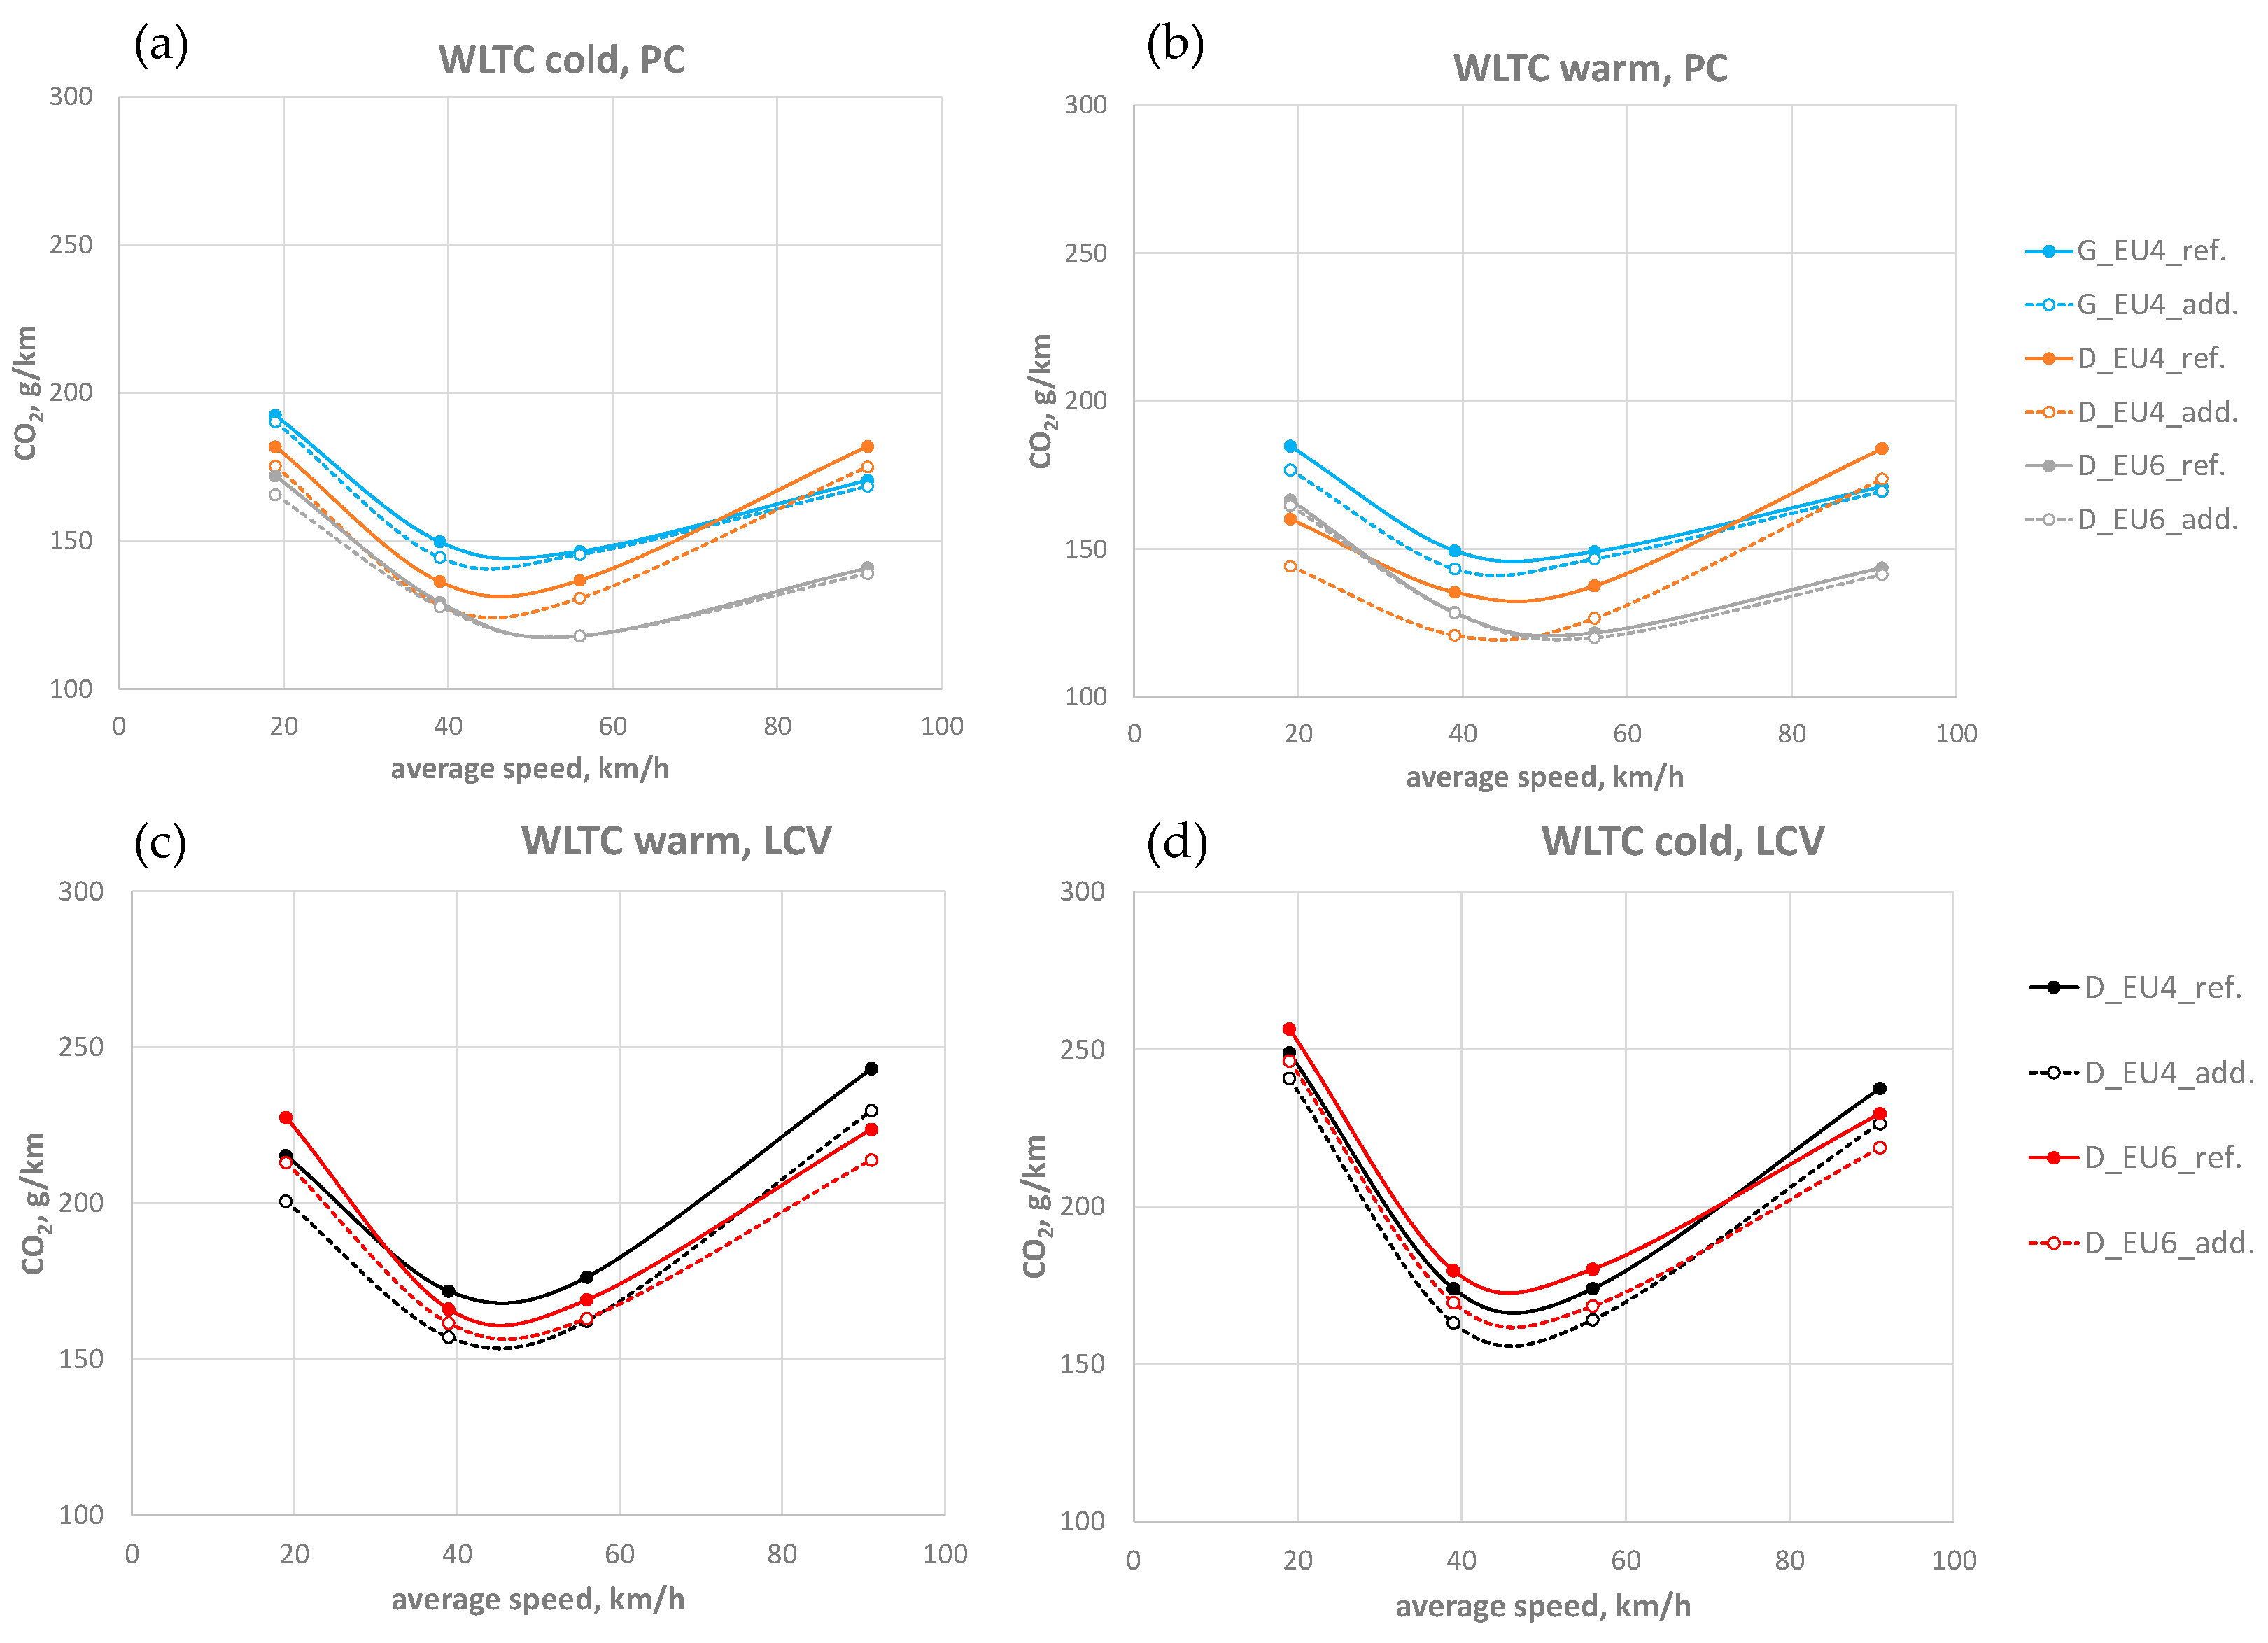
3.1. Influence of Additive Package on Fuel Consumption and CO2 Emissions

Fuel consumption, as liters per 100 km, for all tested vehicles is shown in Figure 3. The bar plot presents average fuel consumption, measured over cold and warm WLTC, for all the vehicles fueled with and without additive. Vehicles are grouped by category (passenger cars, PCs and light commercial vehicles, LCVs). Standard deviations of measurements are represented by red lines. Moreover, for each vehicle, the graph represents the percentage difference in fuel consumption due to the use of fuel with additives.
The fuel with additives provides a fuel saving in all the experimental tested configurations. The percentage of fuel consumption reduction ranges between 1.2% for diesel Euro 6 PCs over warm WLTC and 8.1% for diesel Euro 4 PCs over warm WLTC. Since the measurement repeatability is very high (the coefficient of variation is around 1%), the percentage differences are statistically significant, with 95% of confidence.
As expected, among the Euro 4 vehicles the lowest reduction was found in the case of the spark-ignition vehicle (−2.2% for warm WLTC). As mentioned in Section 2.1, the vehicle is equipped with a PFI system, therefore, the main advantage of using a deposit control additive is related to the removal of deposits from intake valves. Larger benefits were achieved with the diesel Euro 4 PC. In this case, the deposit control additive acts on nozzle coking, reducing the carbonaceous deposits inside the holes, which limit the fuel rate and increase combustion variability. As an effect of clean-up, an improvement in fuel economy of up to 8.1% (warm WLTC) is achieved.
The lowest reduction in fuel consumption was recorded for the Euro 6 passenger car. This result can be explained by the different ages of the two vehicles (Euro 4 PC registration 2003 and EU6 PC 2016) and the different maintenance records, despite the larger mileage accumulated by the Euro 6 PC. This hypothesis is confirmed by lower exhaust emissions and measurement variability, as apparent in the following section.
Further, the Euro 6 PC vehicle was used for covering long distance journeys, therefore, the mileage was accumulated mainly on highways; its driving, indeed, was characterized by high and constant driving speed and less time was spent in urban ambient areas, where the speed is lower and transient stages are frequent.
For both homologation classes of light commercial vehicles, a strong reduction in fuel consumption was found, ranging between 4.3% and 6.8%.
CO2 emissions follow the same trend as fuel consumption (Figure 4), being the main product of fuel combustion. The use of additive packages, indeed, involves a reduction in CO2 exhaust emissions, which is higher than 4% for all diesel vehicles with the exception of the Euro 6 passenger car. Its CO2 emission reductions, in fact, are much more similar to gasoline vehicle ones (lower than 2%).
For a deeper understanding of additive effect on CO2 emissions, it is interesting to analyze each single stage of the WLTC. With this aim, Figure 5 reports CO2 emissions as a function of the average speed. The points on the curves correspond to the four driving cycle phases.
CO2 emission curves are well fitted by a 2nd order polynomial function for all the tested vehicles. Minimum CO2 emissions are measured between 40 and 50 km/h. Figure 5a reports the trend for PCs during the cold WLTC. The action of additive fuels in terms of CO2 emissions and fuel consumption reduction is dependent on the homologation class and engine type. For the Euro 4 SI vehicle, the reduction mainly occurs during the low-medium speed driving cycle (CO2: −1.1% urban low speed phase and −3.5% rural medium speed phase and fuel consumption: −8.5% urban phase and −3.5% rural phase), in which the clean-up action carried out by the fuel with additives reduces the combustion instability linked to the high number of gear changes and low rotation speeds, and promotes a more complete combustion. Negligible differences were found in the main road high speed phase, where the engine operative conditions are close to its maximum efficiency (medium-high load and low-medium engine speed), while a reduction was recorded in the highway extra-high-speed phase, where consumption is higher due to an increase in the load and engine speed. As expected, the CO2 emissions follow the same trend as the fuel consumption, with the exception of the urban phase, where the CO emissions were one magnitude larger than in the other phases. Using additives resulted in a CO reduction of about 61% (−9 g/km) in this phase, which explains the difference between CO2 percentage difference and fuel consumption.
Similar to the Euro 4 SI PC, for the Euro 6 diesel PC, additives provided a reduction in CO2 mainly during the low-medium speed driving cycle, with a maximum improvement of 3.7%, corresponding to a reduction in fuel consumption of 3.8% in the urban phase.
A different behavior was found for the Euro 4 diesel PC: in this case, CO2 emissions and fuel consumption were reduced over the whole speed range by using additive fuels. However, it can be noted that the urban phase is often characterized by the strongest fuel saving. This behavior can be attributed to the removal of deposits on nozzle-holes since injector fouling impacts on vehicle drivability over the whole range of operative conditions, with rough idling, stalling and reduced power output [19].

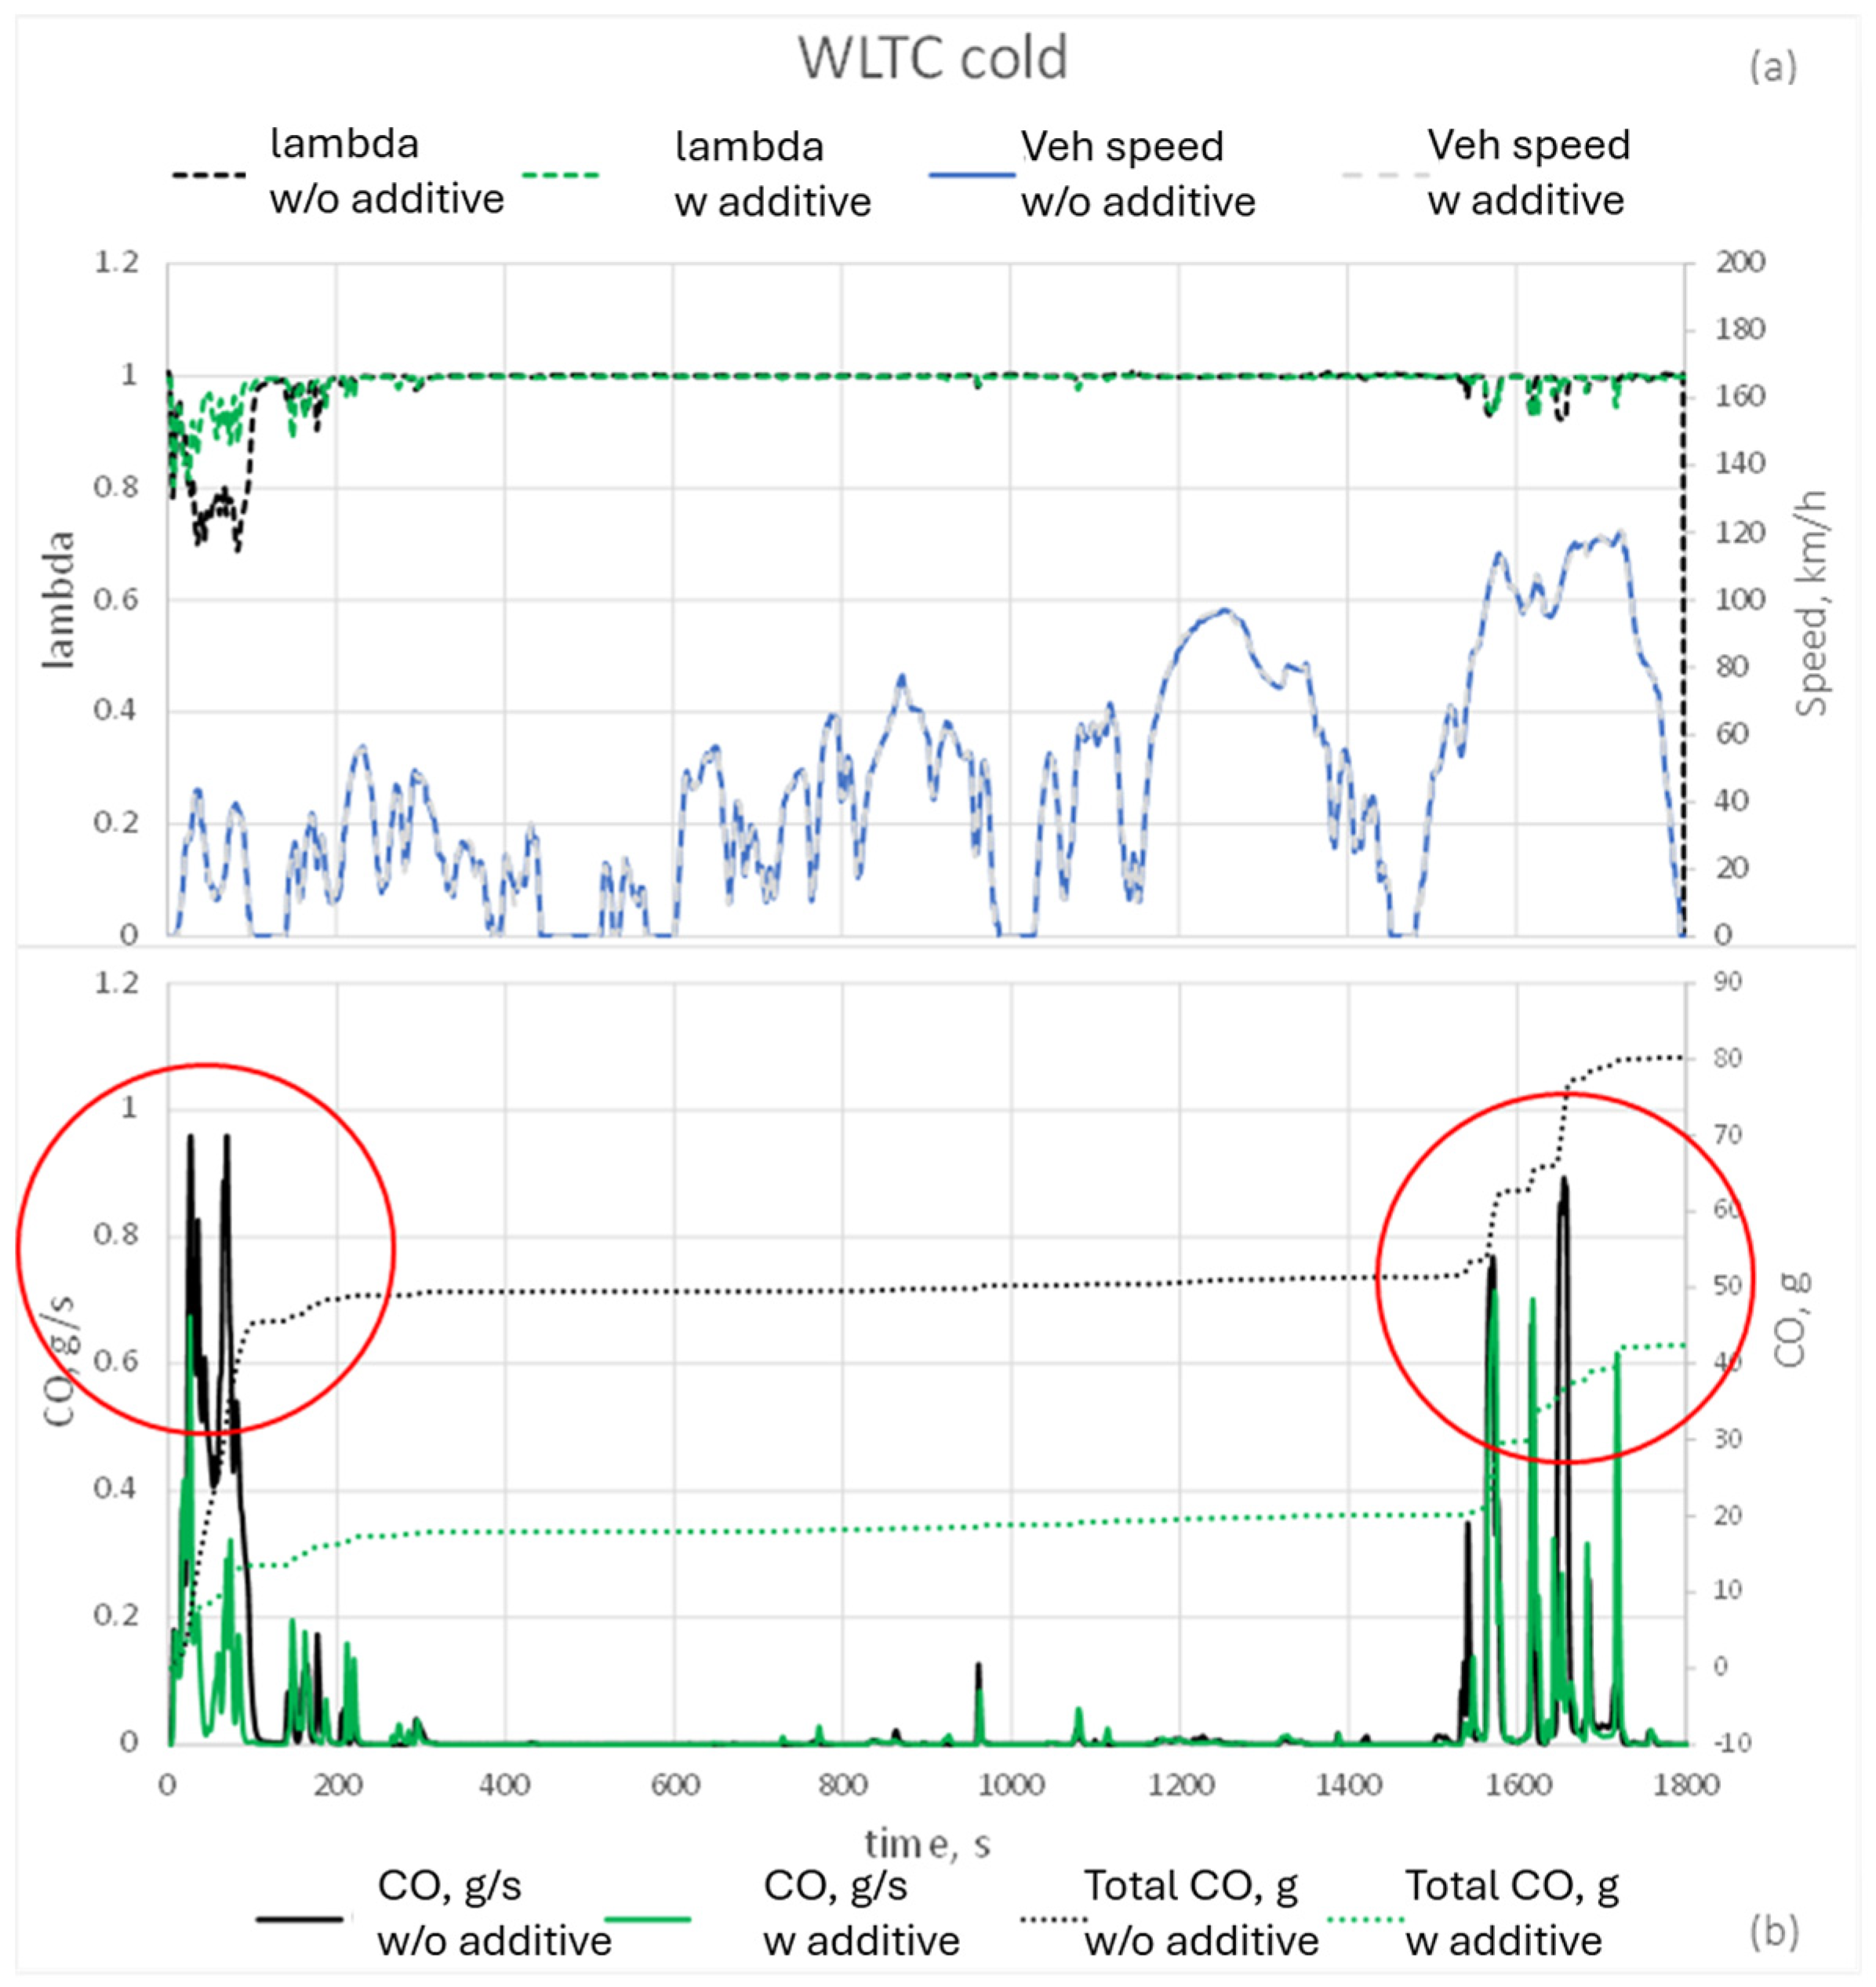
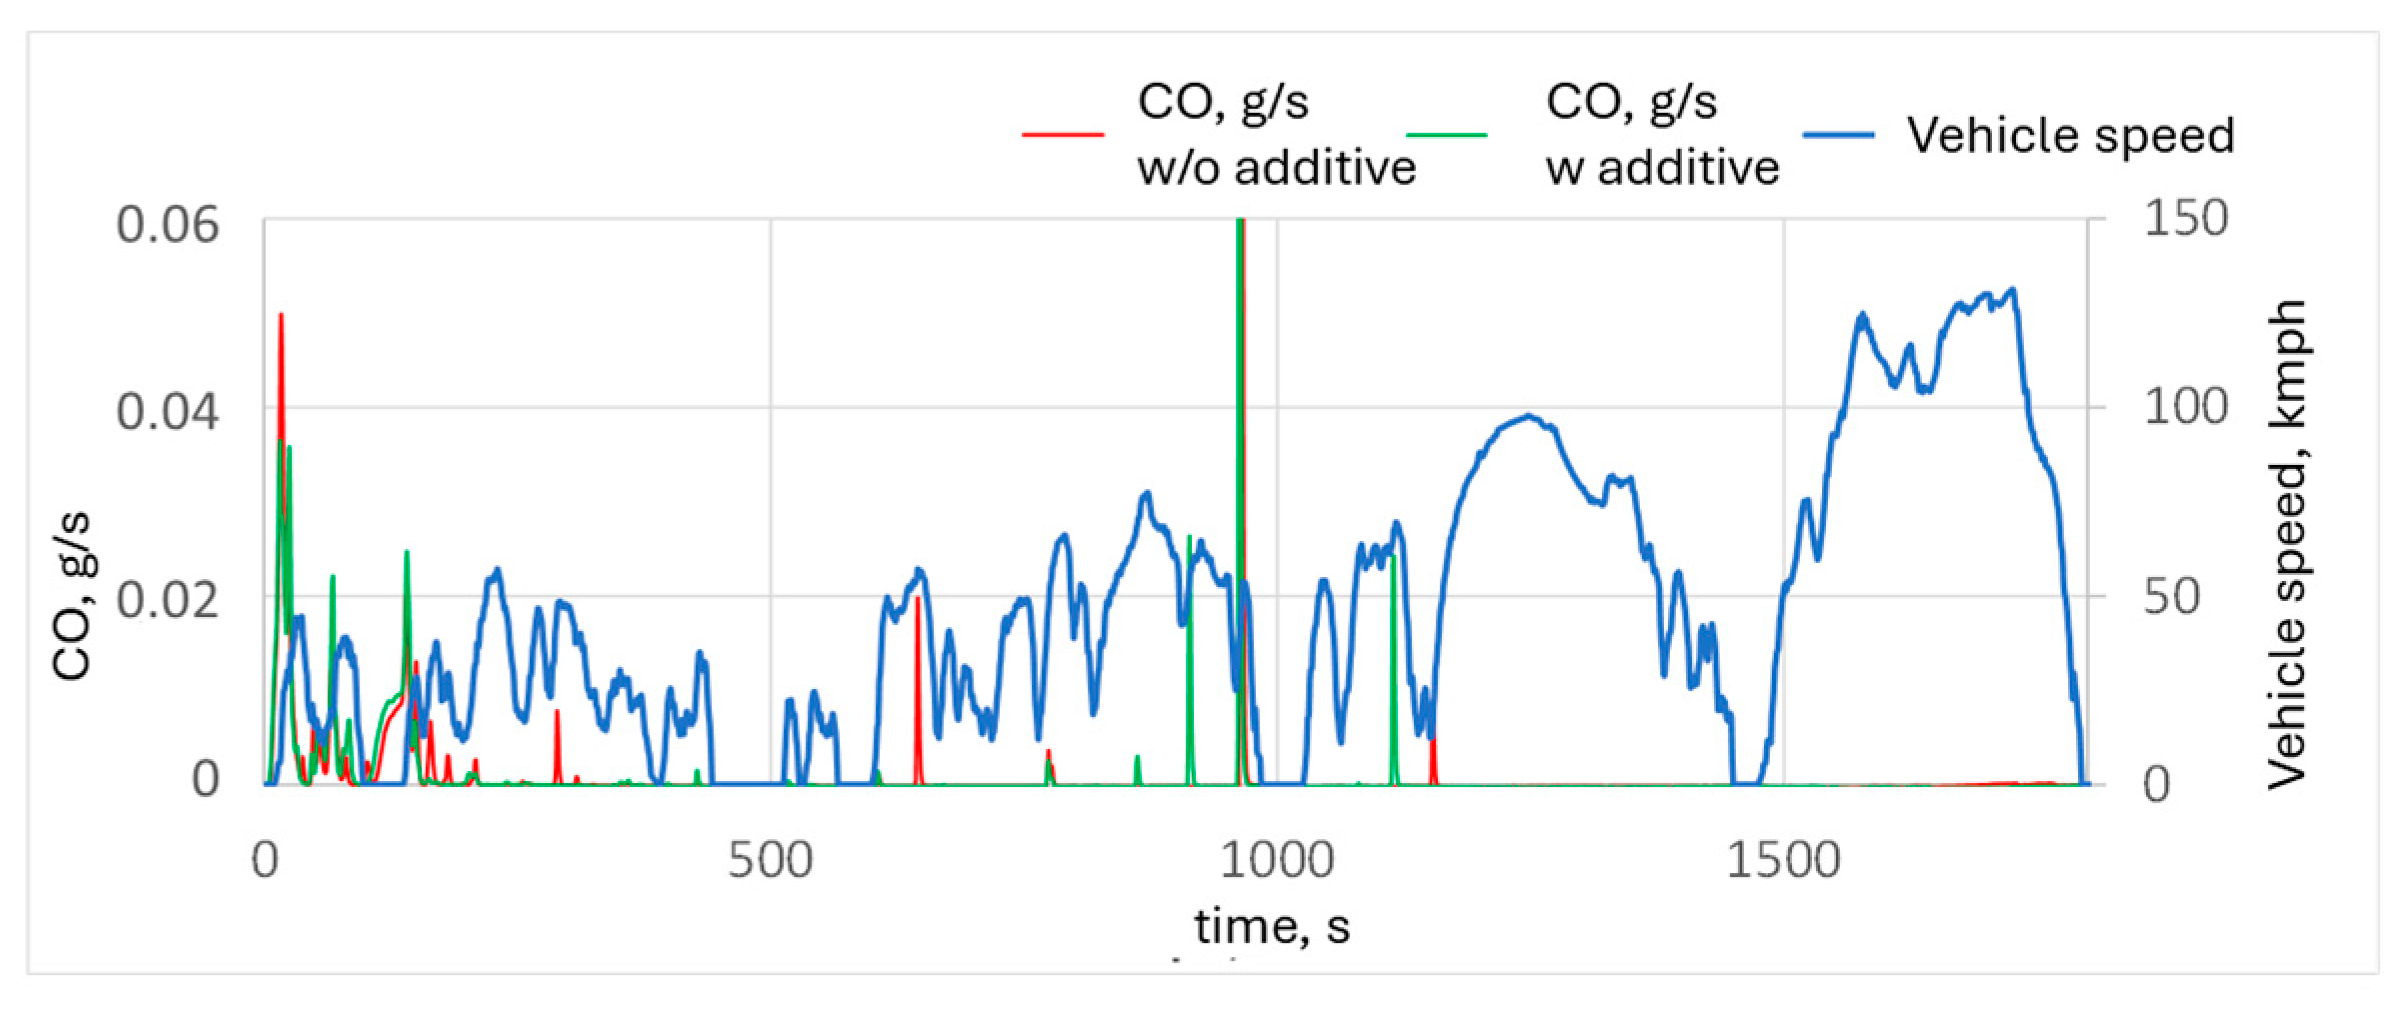
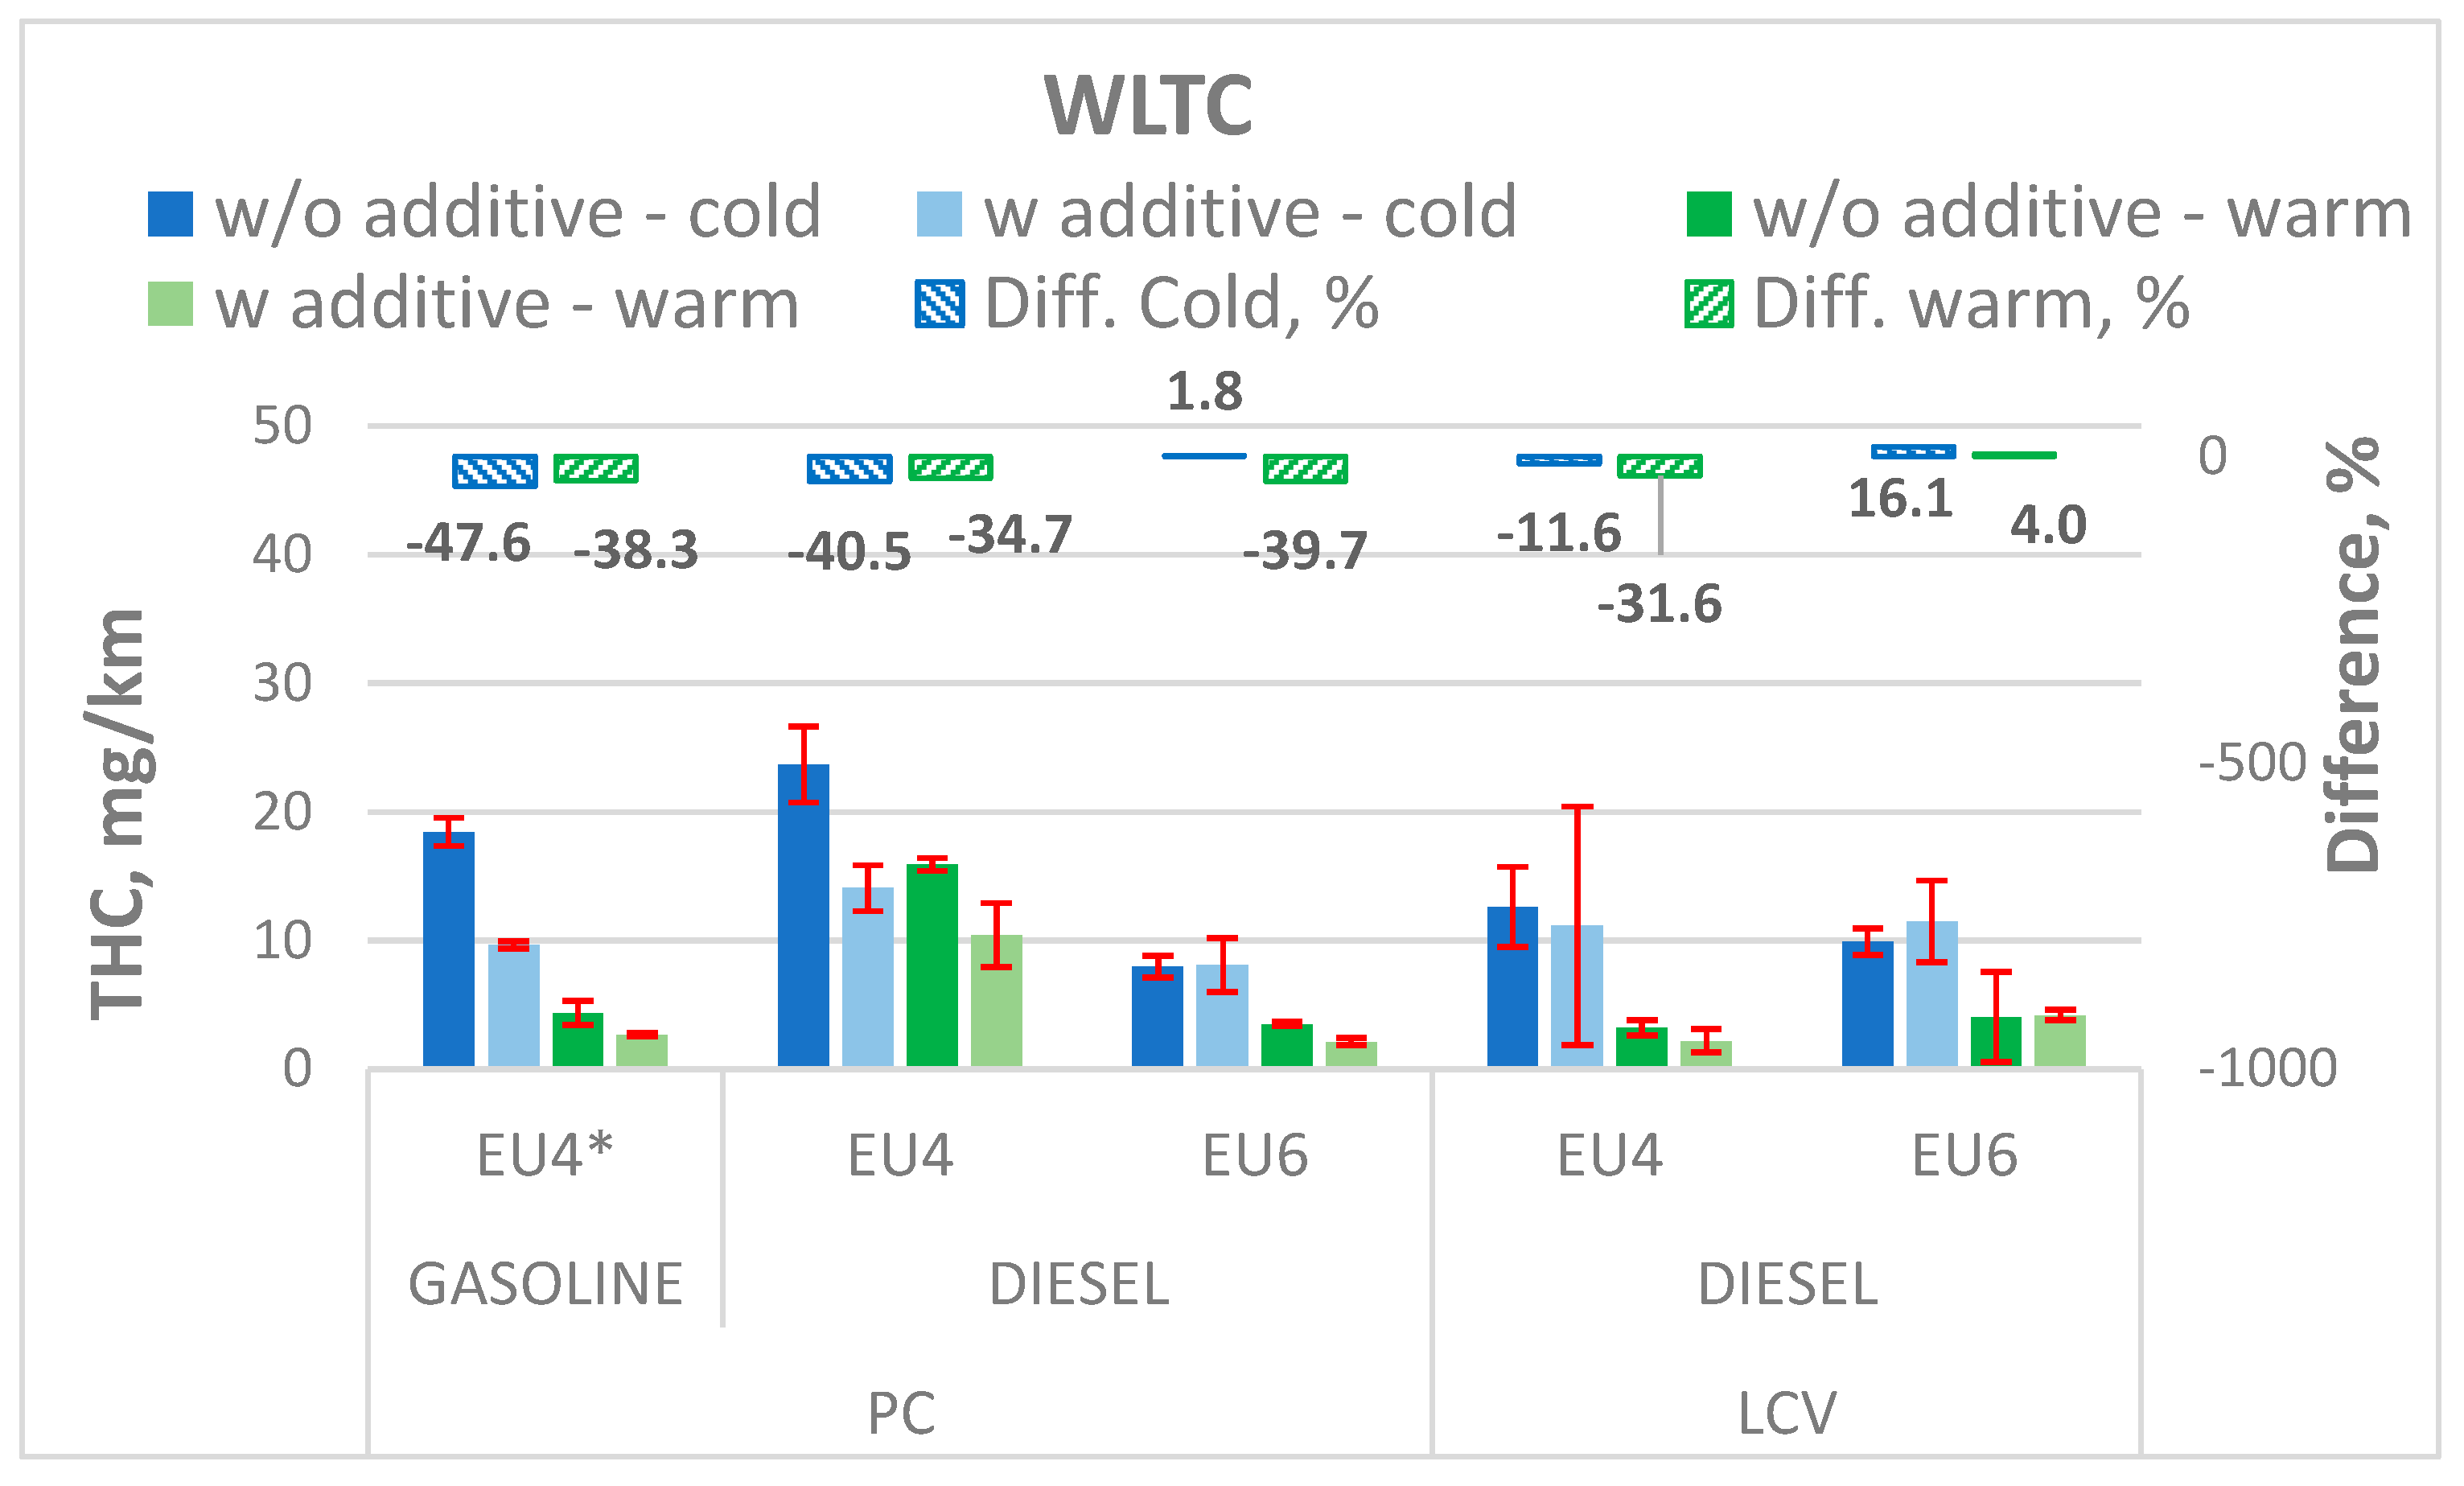
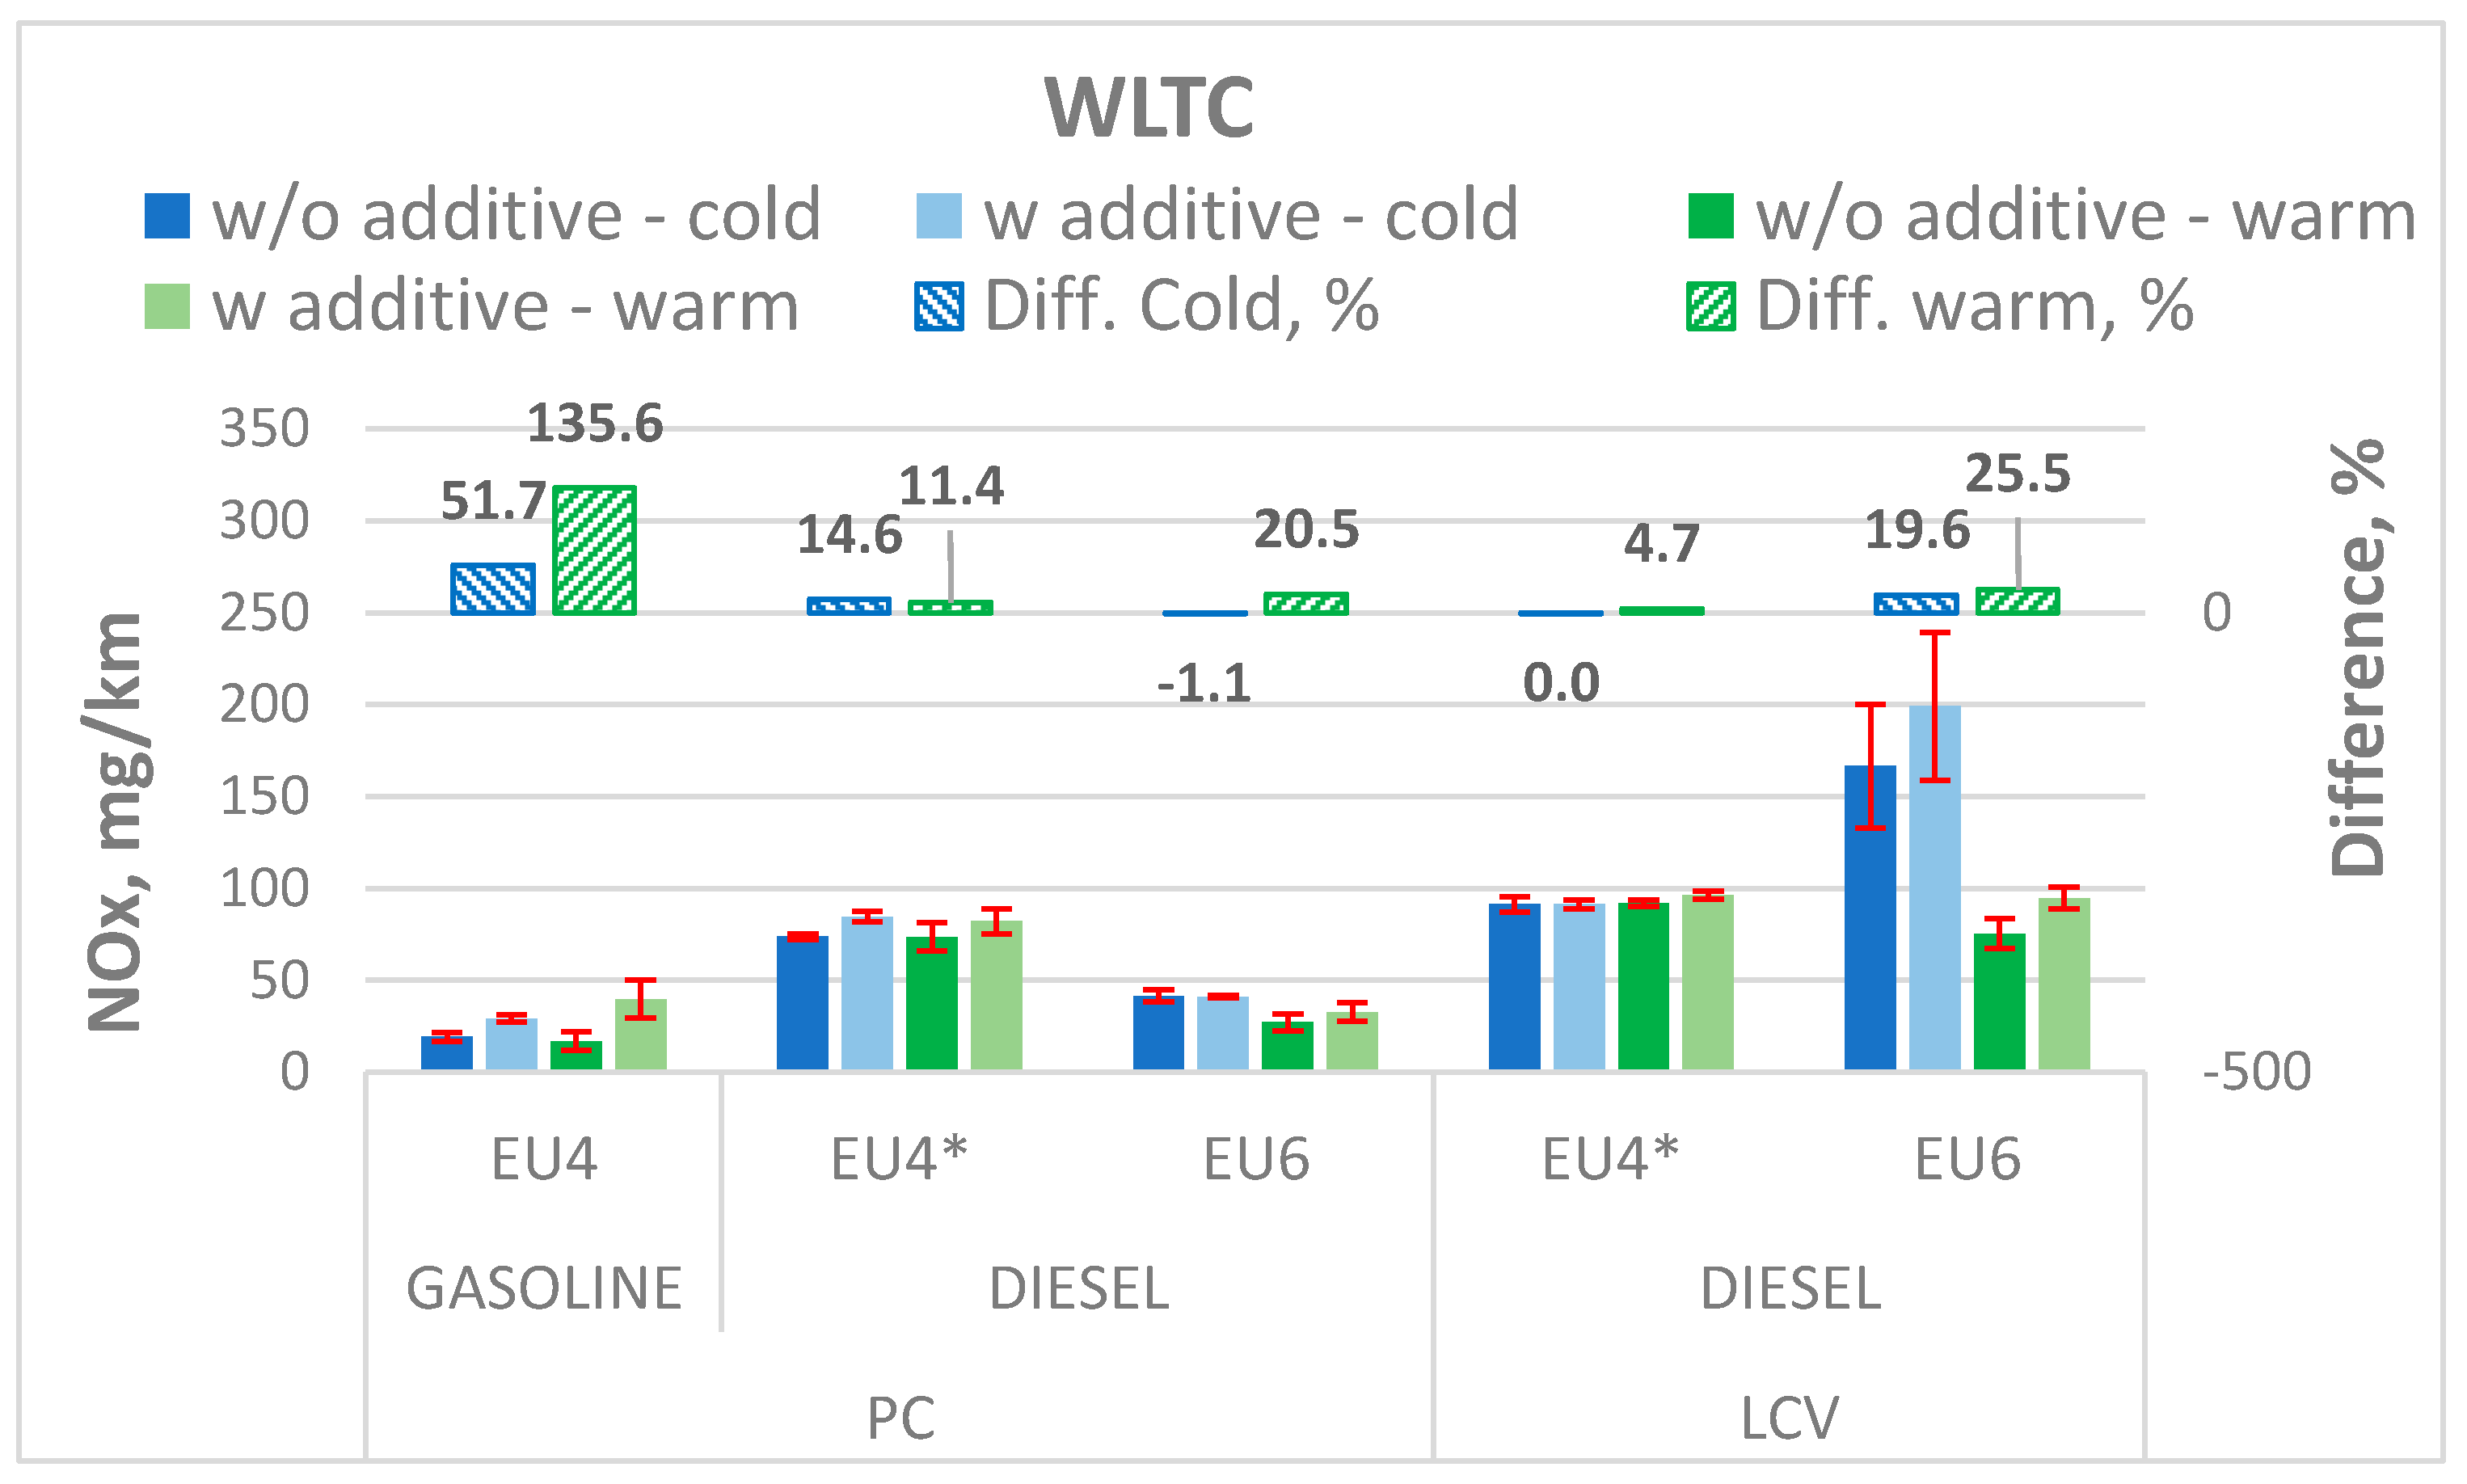
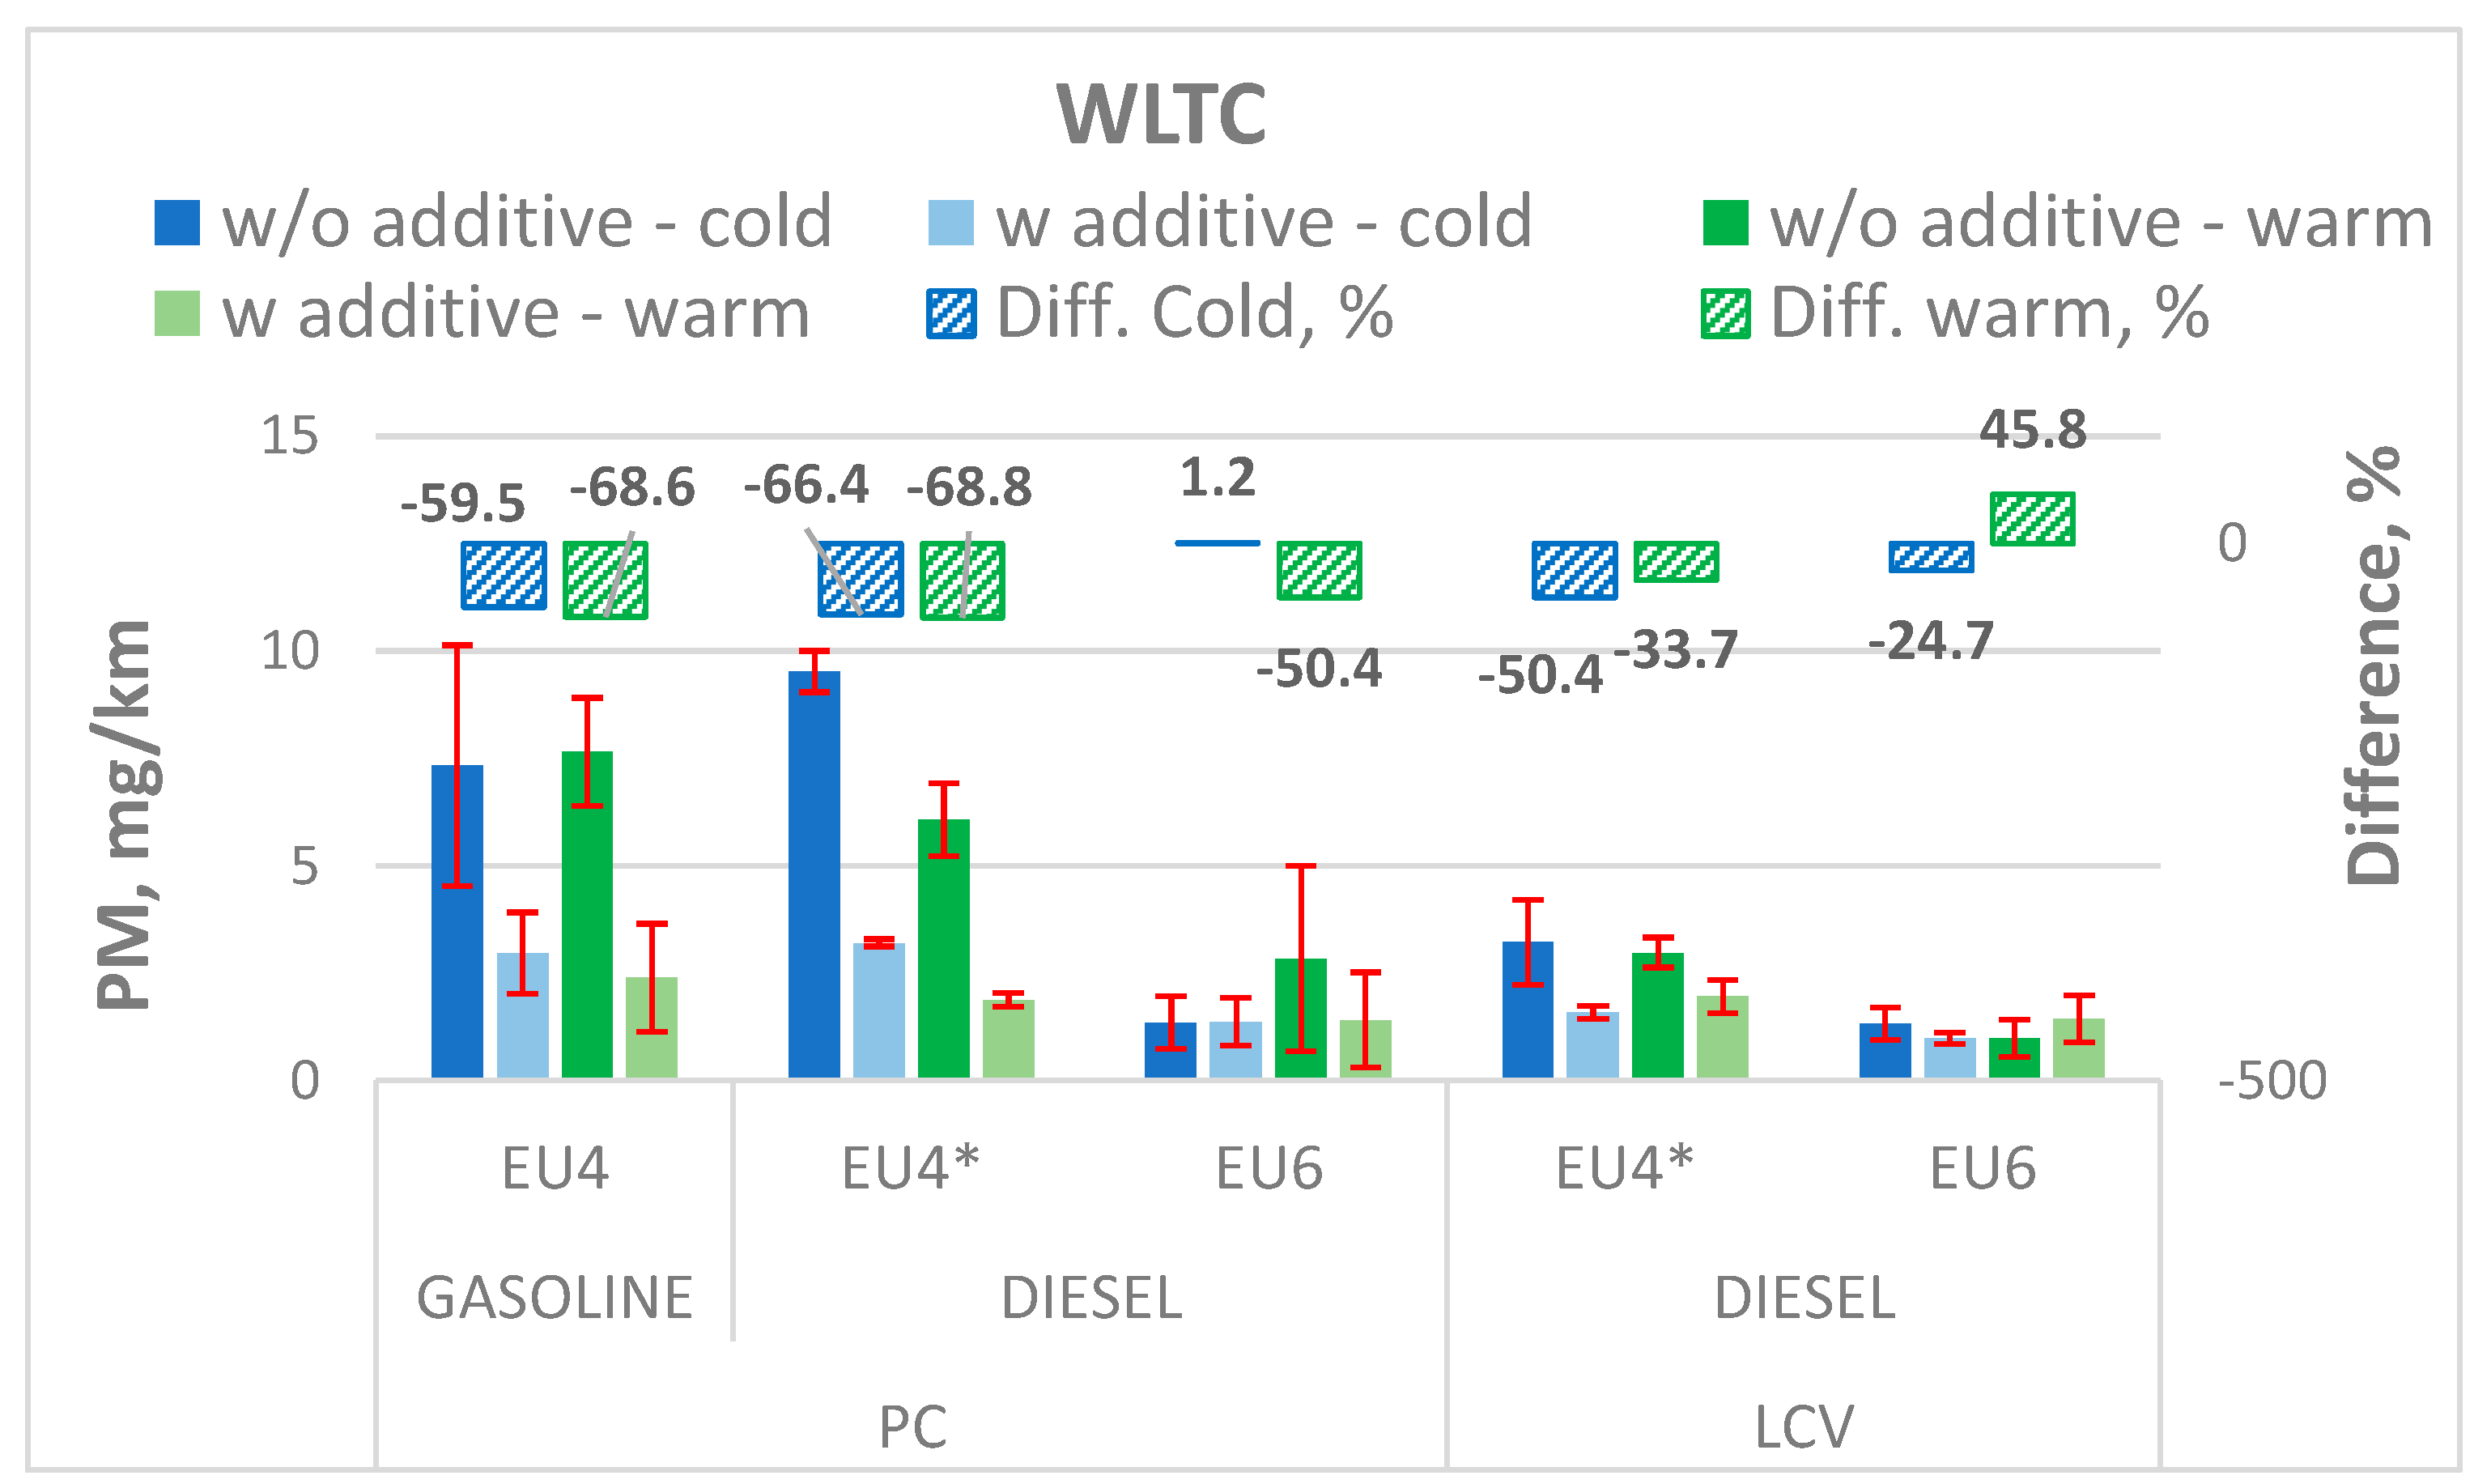
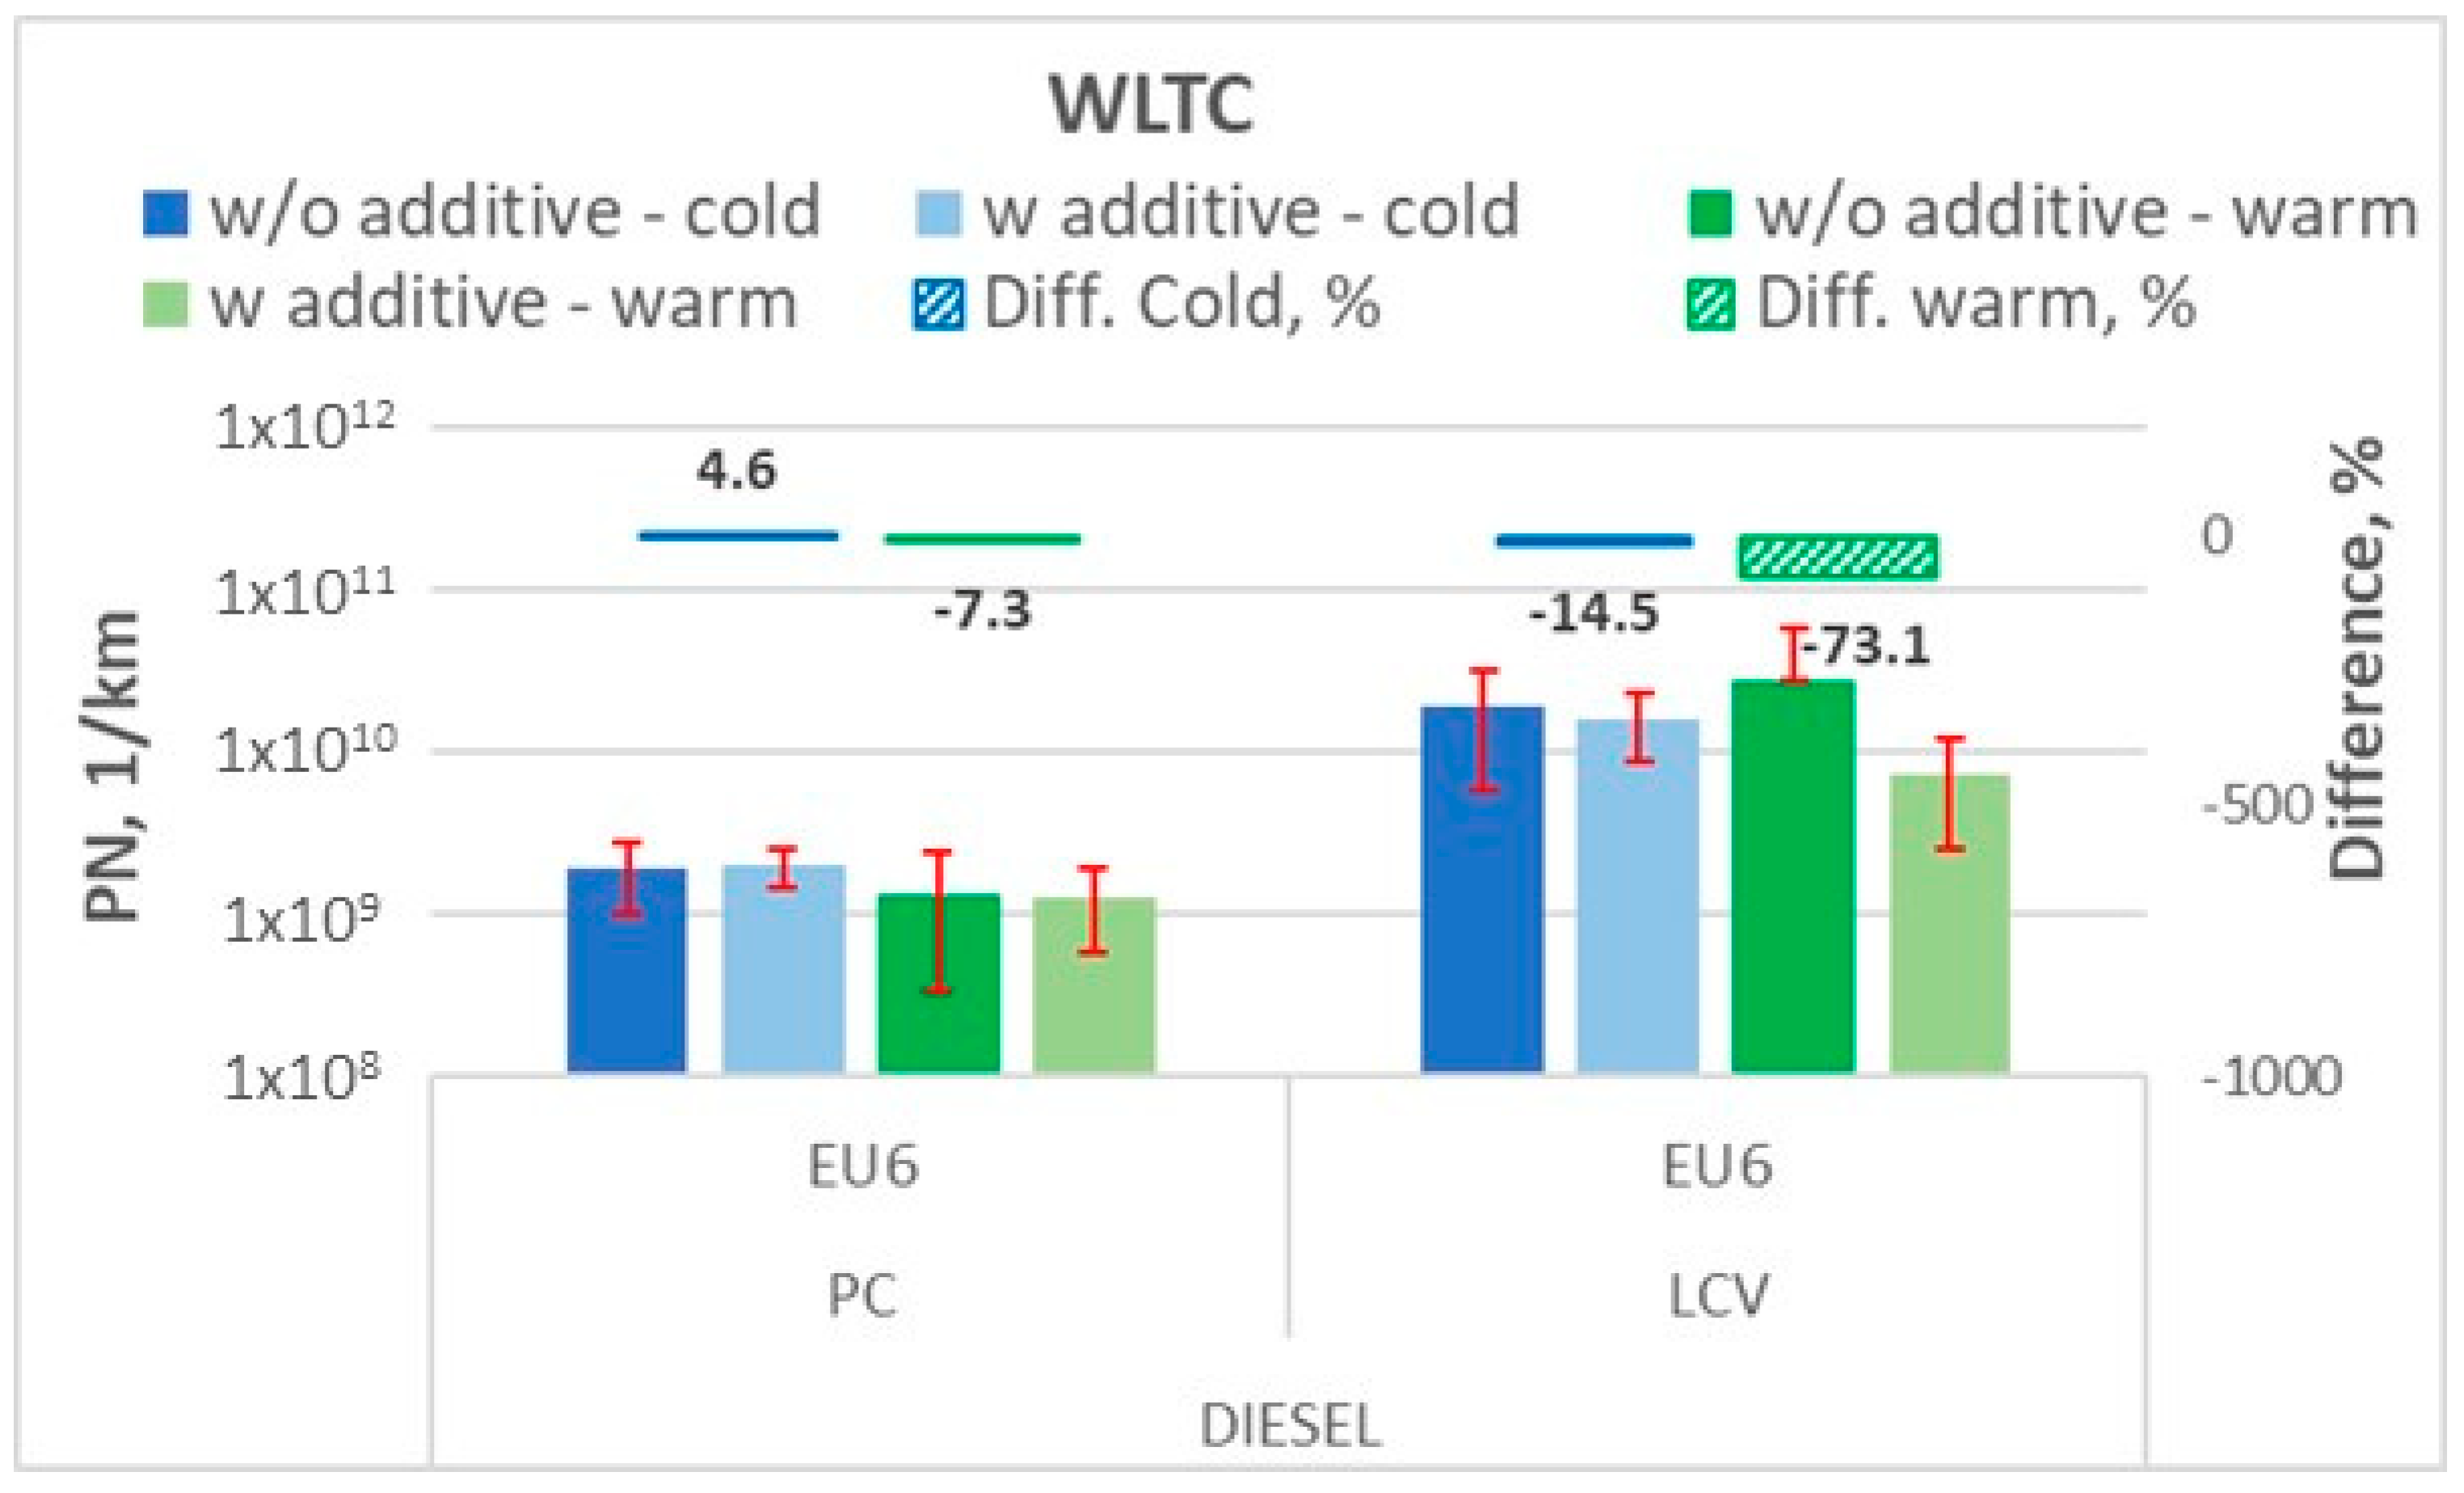
3.2. Influence of Additive Package on Exhaust Emissions

The CO emissions of all the tested vehicles are presented in Figure 6. The bar plot refers to average emissions, measured over cold and warm WLTCs, for all the vehicles fueled with reference and additive fuels.
In order to represent the average data of the whole fleet in the same plot, CO emissions of gasoline and diesel EU4 passenger cars were divided by 10.
As expected, the SI vehicle, fired with a rich-stoichiometric gasoline–air charge, produces carbon monoxide levels that are greater by an order of magnitude compared to diesel engines running with a diluted diesel–air charge. Switching from Euro 4 to Euro 6 PCs results in a further reduction of an order of magnitude. In the case of the warm WLTCs, Euro 6 PC emissions were close to zero for both fuels.
In general, additives provide a reduction in CO emissions, with a maximum benefit of −75.4% in the case of the Euro 4 diesel PC for the warm WLTC. An increase in CO was found in the case of the Euro 4 LCV even though the percentage differences were not statistically significant due to the low absolute CO emissions (lower than 83 mg/km), which were abundantly below the emission standards (500 mg/km for both Euro 4 and Euro 6).
The maximum CO emission was recorded in the case of the Euro 4 SI vehicle during the cold WLTC due to a different combustion mode compared to diesel. To better understand the effect of additives on CO emissions and, more generally, on combustion, in SI vehicles, it is useful to analyze the time trend air–fuel equivalence ratio λ. This trend is shown with the vehicle speed profile in Figure 7a. Figure 7b represents the instantaneous (solid line) and cumulative (dotted line) emissions of CO during the cold WLTC with and without additives.
As expected, in correspondence with the CO peaks, the air–gasoline mixture is enriched with values of λ up to approximately 0.7 in the case of fueling without additives. It is worth noting that the engine control strategy provides a stoichiometric mixture content (λ = 1) throughout the whole engine operating map with the exception of the maximum load conditions, corresponding to the highest speed WLTC section. Rich mixture strategies are typically adopted also in the urban phase during cold-start conditions. Furthermore, during this cold phase the three-way catalyst is at temperatures lower than the activation temperature; therefore, its efficiency is low for the oxidation of CO and THCs and the reduction in NOx.
As is evident in Figure 7a, while in the maximum speed phase, the trend of the air–fuel equivalence ratio is substantially independent of the fuel, while in the urban phase a strong enrichment of the mixture was achieved in the case without additives. This difference can be explained by the cleaning effect of the additives, which allow a better dynamic response of the engine to acceleration and gear changes and, consequently, a more complete combustion with a reduction in CO emissions (Figure 7b) and specific consumption.
Figure 8 represents the instantaneous emissions of CO and vehicle speed profiles over the cold WLTC with and without additives for the Euro 4 LCV.
As aforementioned, CO emissions are too low to appreciate statistically significant variations with the fuel switching. The main contribution to CO emissions comes from the urban phase of the WLTC, including the cold-start operation. In this stage, the oxidation catalyst has not yet reached the activation temperature (light-off).
The continuous profile of CO emissions shown in Figure 8 highlights that the light-off phase lasts for approximately 200 s from the start of the cycle. Once the catalyst has reached the activation temperature, CO emissions become zero except for the emission peaks observed during some rapid transient stages of the driving cycle, probably due to an enrichment of the air/fuel mixture in the internal combustion engine. These peaks are non-repeatable and independent of the type of fuel. It is worth noting a zero-emission profile during the highway phase.
The THC emissions of all tested vehicles are presented in Figure 9. The bar plot refers to average emissions, measured over cold and warm WLTCs for all the vehicles fueled with reference and additive fuels.
In order to represent the average data of the whole fleet in the same plot, THC emissions of gasoline EU4 passenger cars were divided by 10.
Using additives results in THC emission reductions for all the tested vehicles with the exception of the Euro 6 LVC. Nevertheless, the low emission level (less than 11 mg/km) combined with the high emission variability do not to allow us to appreciate statistically significant differences. As expected, the maximum level of THC emissions was achieved by the SI Euro 4 PC during the cold WLTC (187 mg/km). The maximum efficiency of the additives, with a reduction of 47.6% in THCs, was found under the same operative conditions: the THC emissions dropped to 98 mg/km, falling in the Euro 4 limit of 100 mg/km on the NEDC cycle (homologation standard for this vehicle), and in the Euro 5 limit of 100 mg/km on the WLTC cycle. The warm WLTC provided lower THC emissions compared to the cold WLTC: during the cold start in the first phase of the driving cycle, when exhaust temperature is too low to activate the three-way catalyst, a high number of transients and lower combustion stability occur, producing the maximum level of emissions. The activation of the catalyst in the warm WLTC cuts down the amount of THCs at the exhaust.
The NOx emissions of all tested vehicles are shown in Figure 10. In agreement with the increase in fuel efficiency and the reduction in CO and THCs, a slight increase in NOx was found when vehicles were fueled with fuel and additives. The bar plot refers to average emissions, measured over cold and warm WLTCs, for all the vehicles fueled with reference and additive fuels. The maximum increase was found for the SI Euro 4 vehicle due to the improvement in combustion efficiency, which, in turn, resulted in an increase in combustion temperature combined with a reduction in air–fuel mixture enrichment, contributing to the combustion temperature being raised. On the other hand, it is worth point out that NOx emissions remained below Euro 4 emissions limits.
Diesel vehicles provided larger NOx emissions compared to gasoline vehicles except for the Euro 6 diesel PC, which produces similar emission levels, abundantly below the Euro 6 diesel standard limit, thanks to the action of the selective catalytic reduction (SCR) system. In this case, using additives resulted in a slight decrease in NOx emissions for the cold WLTC and an increase of 20.5% for the warm WLTC. However, both differences were out of the 95% confidence level of statistical analysis.
The Euro 6 LCV provided larger NOx emissions compared to the Euro 6 PC, especially during the cold WLTC, double that recorded in the case of the warm WLTC, indicating the poor efficiency of SCR under cold-start conditions. However, these values are well below those of the Euro 4 LCV, which emitted NOx levels greater by an order of magnitude compared to the Euro 6 LCV.
Figure 11 reports PM emissions of all tested vehicles that are presented in Figure 6. The bar plot refers to average emissions, measured over cold and warm WLTCs, for all the vehicles fueled with reference and additive fuels. In agreement with the increase in NOx emissions, a reduction in PM was achieved when an additive was used. A maximum reduction in PM emissions of 68.8% (from 60.7 mg/km w/o additives to 18.9 mg/km with additive) was recorded for the Euro 4 diesel PC during the warm WLTC.
The Euro 4 diesel vehicles’ PM results were one magnitude larger than those for other vehicles: the difference, compared with other diesel vehicles, is due to the introduction of the diesel particulate filter (DPF) to meet Euro 5 and Euro 6 limits.
Euro 6 vehicles emitted PM levels strongly below the emission standard limits of 5 mg/km, with values ranging between 1.0 mg/km for LCVs, warm WLTC, w/o additives to 2.9 mg/km for PCs, warm WLTC, w/o additives. So, low values also implied high variability measurements and, hence, the variations induced by using additives were not significant.
As required by exhaust emissions standards, PN emissions were estimated for Euro 6 vehicles (Figure 12). In agreement with the PM results, PN emissions were abundantly below the Euro 6 limit of 6 × 10¹¹ particles/km: Euro 6 PC values were lower by two orders of magnitude compared to the limit, while LCV levels were lower by an order of magnitude. The average PN emissions were affected by a notable variability due to the low concentrations. Therefore, the differences induced by using additives were not statistically significant.

4. Conclusions

An experimental activity was conducted to assess the influence of two performance packages (diesel and gasoline) on the exhaust emissions and fuel consumption of five vehicles set to be as representative as possible of circulating Italian passenger cars and light commercial vehicles fleets. Based on the literature datasets, three Euro 4 vehicles were selected with a mileage representative of each single vehicle class: two passenger cars (one spark ignition and one diesel) and a light commercial vehicle. Further, two diesel Euro 6 vehicles, a passenger car and an LCV were tested to investigate the effect of fuel additives on the combustion of vehicles compliant with the current Euro 6 homologation regulation.
Exhaust emissions and fuel consumption were experimentally estimated on a chassis dynamometer over WLTCs in a climate-controlled laboratory. Each vehicle was preliminarily tested running with base fuel, then a 3000 km clean-up stage was performed using the additive package; finally, WLTC tests were repeated.
The main findings can be summarized as follows:
  • Performance packages provide a reduction in fuel consumption for all tested vehicles between 1.2% (diesel Euro 6 passenger car) and 8.1% (diesel Euro 4 passenger car). Diesel light commercial vehicles and Euro 4 passenger cars were more sensitive to the influence of additives. This behavior is attributed to the deposit removal effect of additives reducing injector-nozzle fouling. The benefits over Euro 6 diesel passenger cars were limited, indicating a good level of maintenance of engine parts, as confirmed by close-to-zero exhaust emissions of CO, THCs and PM.
  • A gasoline vehicle was equipped with a PFI system, therefore, the main advantage of using a performance additive is related to the removal of deposits from intake valves and a reduction in friction loss.
  • Using additives in Euro 4 passenger cars provided a strong reduction in CO, THCs and PM. In agreement with PM reduction, an increase in NOx was found.
  • When used in spark-ignition engines, additives promoted a more stable combustion during the transient stages, especially in cold-start conditions, as demonstrated by the reduction in fuel charge enrichment in the urban phase compared to the case without additives.
  • For Euro 6 vehicles, the exhaust emissions measurement showed a relatively high variability due to extremely low values recorded for all monitored species. CO and THC emissions are typically low for this class of engine, while NOx and PM/PN emissions were very low due to after-treatment systems installed on Euro 6 vehicles. An exception was found for Euro 6 LCVs under cold-start conditions due to the late activation of the SCR system, resulting in high levels of NOx emissions.

Author Contributions

Conceptualization, M.A.C., A.B. and L.M.; methodology, M.A.C., A.B. and L.M.; formal analysis, M.A.C. and L.M.; investigation, M.A.C. and L.M.; writing—original draft preparation, M.A.C., A.B. and L.M.; writing—review and editing, M.A.C., A.B. and L.M. All authors have read and agreed to the published version of the manuscript.

Funding

This research received no external funding.

Data Availability Statement

Data is contained within the article.

Acknowledgments

Authors would like to thank Rocco Giuzio and Alfredo Mazzei for their valuable support in the experimental activity.

Conflicts of Interest

Author Alessandra Berra, who provided technical advisor on the performance packages benefits and application, was employed by the company Dorf Ketal B.V. The remaining authors declare that the research was conducted in the absence of any commercial or financial relationships that could be construed as a potential conflict of interest.

References

  1. EEA—European Environment Agency. Transport and Environment Report 2022; EEA Report No. 07/2022; European Environment Agency: Copenhagen, Denmark, 2022.
  2. Eurostat. Passenger Cars in the EU; Eurostat: Luxembourg, 2023; ISSN 2443-8219. [Google Scholar]
  3. EC—European Commission, 2019. The European Green Deal. Brussels, 11.12.2019. COM(2019) 640 Final. Available online: https://eur-lex.europa.eu/legal-content/EN/TXT/PDF/?uri=CELEX:52019DC0640 (accessed on 1 March 2024).
  4. ACEA, 2024. Vehicles on European Roads. Available online: https://www.acea.auto/files/ACEA-Report-Vehicles-on-European-roads-.pdf (accessed on 1 March 2024).
  5. ACI, 2023. Autoritratto 2022. Available online: https://www.aci.it/laci/studi-e-ricerche/dati-e-statistiche/autoritratto/autoritratto-2022.html (accessed on 1 March 2024).
  6. Siddartha, G.; Ramakrishna, S.; Kujur, P.; Rao, A.; Dalela, N.; Yadav, A.; Sharma, A. Effect of fuel additives on internal combustion engine performance and emissions. Mater. Today 2022, 63, A9–A14. [Google Scholar]
  7. Zhu, Q.; Zong, Y.; Tan, Y.R.; Lyu, J.Y.; Pan, J.; Zhou, X.; Liu, H.; He, S.; Chen, W.; Yu, W.; et al. Comparative analysis of PODE3 and PODE4 fuel additives for emission reduction and soot characteristics in compression ignition engines. Energy 2024, 286, 129498. [Google Scholar] [CrossRef]
  8. Ershov, M.A.; Savelenko, V.D.; Makhova, U.A.; Kapustin, V.M.; Potanin, D.A.; Habibullin, I.F.; Lazarev, V.E.; Abdellatief, T.M.M.; Abdelkareem, M.A.; Olabi, A.G. New insights on introducing modern multifunctional additives into motor gasoline. Sci. Total Environ. 2022, 808, 152034. [Google Scholar] [CrossRef] [PubMed]
  9. Awad, O.; Xiao, M.; Kamil, M.; Zhou, B.; Ali, O.M.; Shuai, S. A Review of the E ects of Gasoline Detergent Additives on the Formation of Combustion Chamber Deposits of Gasoline Direct Injection Engines. SAE Int. J. Fuels Lubr. 2021, 14, 13–25. [Google Scholar] [CrossRef] [PubMed]
  10. Frauscher, M.; Agocs, A.; Wopelka, T.; Ristic, A.; Ronai, B.; Holub, F.; Payer, W. Improving sustainability by enhanced engine component lifetime through friction modifier additives in fuels. Fuel 2024, 358, 130102. [Google Scholar] [CrossRef]
  11. Bennett, J. Advanced fuel additives for modern internal combustion engines. In Alternative Fuels and Advanced Vehicle Technologies for Improved Environmental Performance: Towards Zero Carbon Transportation; Folkson, R., Ed.; Woodhead Publishing: Sawston, UK, 2014; pp. 165–194. [Google Scholar]
  12. Ashok, B.; Nanthagopal, K.; Chyuan, O.H.; Le, P.T.K.; Khanolkar, K.; Raje, N.; Raj, A.; Karthickeyan, V.; Tamilvanan, A. Multi-functional fuel additive as a combustion catalyst for diesel and biodiesel in CI engine characteristics. Fuel 2020, 278, 118250. [Google Scholar] [CrossRef]
  13. Di Girolamo, M.; Brianti, M.; Marchionna, M. Octane enhancers. In Handbook of Fuels: Energy Sources for Transportation; WILEY-VCH Verlag GmbH & Co. KgaA: Weinheim, Germany, 2021; pp. 403–430. [Google Scholar]
  14. Herreros, J.M.; Oliva, F.; Zeraati-Rezaei, S.; Tsolakis, A.; Delgado, J. Effects of high octane additivated gasoline fuel on Three Way Catalysts performance under an accelerated catalyst ageing procedure. Fuel 2022, 312, 122970. [Google Scholar] [CrossRef]
  15. Bennett, J. Additives for spark ignition and compression ignition engine fuels. Proc. Inst. Mech. Eng. Part D J. Automob. Eng. 2018, 232, 148–158. [Google Scholar] [CrossRef]
  16. Burke, R.D.; Madamedon, M.; Williams, R. Newly identified effects of injector nozzle fouling in diesel engines. Fuel 2020, 278, 118336. [Google Scholar] [CrossRef]
  17. Zare, A.; Bodisco, T.A.; Nabi, M.N.; Hossain, F.M.; Ristovski, Z.D.; Brown, R.J. A comparative investigation into cold-start and hot-start operation of diesel engine performance with oxygenated fuels during transient and steady-state operation. Fuel 2018, 228, 390–404. [Google Scholar] [CrossRef]
  18. Johnson, L.A. Analysis of variance of parameter estimates: F tests and t tests. Anal. Biochem. 1992, 206, 195–201. [Google Scholar] [CrossRef] [PubMed]
  19. Edney, M.K.; Barker, J.; Reid, J.; Scurr, D.J.; Snape, C.E. Recent advances in the analysis of GDI and diesel fuel injector deposits. Fuel 2020, 272, 117682. [Google Scholar] [CrossRef]
Figure 1. WLTC driving cycle.
Energies 17 03356 g001
Figure 2. Composition of circulating passenger cars and light commercial vehicles (LCVs) in Italy, 2022 [5].
Energies 17 03356 g002
Figure 3. Fuel consumption of vehicle fleet.
Energies 17 03356 g003
Figure 4. CO2 emissions of vehicle fleets.
Energies 17 03356 g004
Figure 5. CO2 exhaust emissions for different vehicle speeds, (a) PC over cold WLTC; (b) PC over warm WLTC; (c) LCV over cold WLTC and (d) LCV over warm WLTC.
Energies 17 03356 g005
Figure 6. CO exhaust emissions (* data divided by 10).
Energies 17 03356 g006
Figure 7. Instantaneous air–fuel equivalence ratio λ and vehicle speed (a) and instantaneous and cumulative CO emissions on the WLTC cold cycle with and without additives (b) for Euro 4 SI PC.
Energies 17 03356 g007
Figure 8. Instantaneous CO emissions and vehicle speed on the WLTC cold cycle with and without additives for Euro LCV.
Energies 17 03356 g008
Figure 9. THC exhaust emissions (* data divided by 10).
Energies 17 03356 g009
Figure 10. NOx exhaust emissions (* data divided by 10).
Energies 17 03356 g010
Figure 11. PM exhaust emissions (* data divided by 10).
Energies 17 03356 g011
Figure 12. PN exhaust emissions.
Energies 17 03356 g012
Table 1. Vehicle characteristics.
G_PC_EU4D_PC_EU4D_PC_EU6D_LCV_EU4D_LCV_EU6
Vehicle categoryM1M1M1N1N1
FuelgasolineDieselDieselDieselDiesel
Engine displacement, cm312421248159822872299
Maximum power, kW4455708881
Curb weight, kg10201235128019352046
EU directiveEuro 4
2001/100/CE-B
Euro 4
2003/76/CE-B
Euro 6
2016/646 ZD
Euro 4
2003/76/CE-B
Euro 6
2015/45/CE-B
Mileage, km175,000176,300220,771145,000258,365
Table 2. Deterioration factors.
VehicleDriving CycleCOHCNOxTHCs + NOxPMPN
G_PC_EU4NEDC2.11.10.7
D_PC_EU4NEDC0.8 2.82.51.5
D_PC_EU6WLTC0.2 0.60.30.40.0
D_LCV_EU4NEDC0.2 2.22.00.4
D_LCV_EU6WLTC0.1 1.30.80.30.0
Table 3. Gasoline fuel’s properties.
ParameterMethodUnitsLower/Upper LimitGasolineAdditive + Gasoline
Hydrocarbons contentEN ISO 22854
Aromatics % v/v-/35.028.128.1
Olefins % v/v-/18.01.01.0
Benzene % v/v-/1.000.760.76
SulphurEN ISO 20884mg/kg-/10.0<3.0<3.0
Oxygen compoundsEN ISO 22854
Methanol % v/v-/3.0<0.1<0.1
Ethanol % v/v-/5.0<0.1<0.1
Isopropyl alcohol % v/v <0.1<0.1
Isobutyl alcohol % v/v <0.1<0.1
Tert-butyl alcohol % v/v 0.10.1
Ethers % v/v 13.413.4
others % v/v <0.1<0.1
Oxygen content % m/m-/2.72.52.5
Corrosiveness to copperEN ISO 2160 Class 1Class 1Class 1
DistillationEN ISO 3405
Final Boiling Point °C-/210.0191.4192.0
Residue % v/v-/2.00.90.9
Evaporated @ 70 °C % v/v22.0/50.049.049.1
Evaporated @ 100 °C % v/v46.0/71.067.868.0
Evaporated @ 150 °C % v/v75.0/-89.889.9
Doctor testASTM D4952- NN
Gum contentEN ISO 6246mg/100 mL-/5.01.41.2
ManganeseEN 16135mg/L-/2.0<0.1<0.1
Density @ 15 °CUNI EN ISO 12185kg/L0.72/0.7750.73380.7340
Motor Octane NumberEN ISO 5163-85.0/-87.387.3
Research Octane NumberEN ISO 5164-95.0/-95.395.3
PbUNI EN 237mg/L-/5.0<2.5<2.5
Flash PointASTM D56°C-/21<21<21
Oxidation stabilityEN ISO 7536min360/->400>400
Vapour PressureEN 13016-1kPa60.0/90.063.062.8
Table 4. Diesel fuel’s properties.
ParameterMethodUnitsLower/Upper LimitDieselAdditive + Diesel
WaterEN ISO 12937mg/kg-/2009095
CFPPEN 116°C-/−10−15−15
Particulate contaminationEN 12662mg/kg-/24.017.015.0
FAMEEN14078% v/v-/7.06.76.7
SulphurEN ISO 20884mg/kg-/10.07.57.5
Copper corrosion (3 h @50 °C)EN ISO 2160 Class 1AClass 1A
DistillationT95EN ISO 3405°C-/360.0354.2354.5
@250 °C % v/v-/6538.438.4
@350 °C % v/v85.0/-93.994.0
I.B.P. °C 174.4180.5
F.B.P. °C 367.8368.5
PAHEN 12916% m/m-/8.04.44.4
ManganeseEN 16576mg/L-/2.0<0.02<0.02
Density@ 15 °CEN ISO 12185kg/m3820.0/845.0834.5834.5
Cetane numberISO 5165-51.0/-52.256.4
Cetane IndexEN ISO 4264-46.0/-52.853.0
Lubricity (wsd @ 60 °C)ISO 12156-1μm-/460336335
Flash PointEN ISO 2719°C>5568.067.5
Carbon ResidueISO 10370% m/m-/0.300<0.001<0.001
AshISO 6245% m/m-/0.0010.0010.002
Oxidation stabilityISO 12205g/m3-/25.02.51.4
Oxidation stabilityUNI EN 15751h >20>20
Viscosity @ 40 °CEN ISO 3104mm2/s2.000/4.5002.6802.691
Cloud PointASTM D7689°C −5.0−5.0
Disclaimer/Publisher’s Note: The statements, opinions and data contained in all publications are solely those of the individual author(s) and contributor(s) and not of MDPI and/or the editor(s). MDPI and/or the editor(s) disclaim responsibility for any injury to people or property resulting from any ideas, methods, instructions or products referred to in the content.

