Article

Finite Element Analysis of the Mechanical Response for Cylindrical Lithium-Ion Batteries with the Double-Layer Windings

Department of Mechanical and Design Engineering, Hongik University, Sejong-ro 2639, Jochiwon-eup, Sejong 339-701, Republic of Korea
Energies 2024, 17(14), 3357; https://doi.org/10.3390/en17143357 (registering DOI)
Submission received: 4 June 2024 / Revised: 6 July 2024 / Accepted: 8 July 2024 / Published: 9 July 2024
(This article belongs to the Special Issue Electrochemical Conversion and Energy Storage System)

Abstract

:
The plastic properties for the jellyroll of lithium-ion batteries showed different behavior in tension and compression, showing the yield strength in compression being several times higher than in tension. The crushable foam models were widely used to predict the mechanical responses to compressive loadings. However, since the compressive characteristic is dominant in this model, it is difficult to identify distributions of the yield strength in tension. In this study, a simplified jellyroll model consisting of double-layer windings was devised to reflect different plastic characteristics of a jellyroll, and the proposed model was applied to an 18650 cylindrical battery under compressive loading conditions. One winding adopted the crushable foam model for representing the compressive plastic behavior, and the other winding adopted the elastoplastic models for tracking the tensile plastic behavior. The material parameters in the crushable foam model were calibrated by comparing the simulated force–displacement curve with the experimental one for the case where the cell was crushed between two plates when the punch was displaced by 7 mm. A specific cut-off value (10 MPa) was assigned to a yield stress limit in the elastoplastic model. Further, the computational model was validated with two more loading cases, a cylindrical rod indentation and a spherical punch indentation, as the punch was displaced by 6.3 mm and 6.5 mm, respectively. For three loading cases, deformed configurations and plastic strain distributions were investigated by finite element analysis. It was found that the proposed model clearly provides the plastic behavior both in compression and tension. For the crush simulation, the maximum compressive stress approached 222 MPa in the middle of the jellyroll, and the maximum effective plastic strain approached 60% in the middle of the layered roll. For indentation with the cylindrical and the spherical punch, the maximum effective plastic strain approached 52% and 277% in the layered roll, respectively. The local crack or location of a short circuit could be predicted from the maximum effective plastic strain.

1. Introduction

A lithium-ion battery (LIB) consists of a jellyroll, in which a cathode, an anode, and two separators are wound, and its protective casing made of a pouch, steel, or aluminum. Both electrodes consist of copper foil with graphite and aluminum foil with active materials, respectively. The yield and fracture tensile strengths of the electrodes are relatively low and brittle [1,2,3]. On the contrary, the polypropylene separator in tension shows high resilience and a strong anisotropy [4,5,6,7]. Sahraei et al. measured the load–displacement curve of pouch cells through lateral compression tests [8], and other researchers performed quasi-static compressive mechanical testing for cylindrical LIBs to obtain load–displacement relations [9,10]. Both experimental results of the whole cells revealed that the jellyroll becomes significantly compacted during the compressive loading test, and it shows almost perfect compressibility. Active materials and graphite of both electrodes in compression transmit stresses effectively as porous materials soaked in electrolyte are squeezed, and the density rapidly increases. Therefore, the jellyroll generally exhibits distinct different yield strengths, with the compressive yield strength being several times higher than the tensile yield strength, and its tension and compression show contrasting hardening behavior.
To capture macroscopic material’s compressive plastic behavior of the jellyroll, a pressure-dependent yield model with non-associated flow has been adopted. The clay or crushable plastic foam models belong to it and enable to describe the plastic behavior of high compressibility [11,12,13,14,15,16]. The crushable foam model assumes that the yield surface is a Mises circle in the deviatoric stress plane and an ellipse in the meridional stress plane, whereas the clay model utilizes a yield function based on three stress invariants incorporating a strain hardening theory that alters the size of the yield surface based on the inelastic volumetric strain. Depending on the evolution of the yield surface, isotropic or volumetric hardening models are available in the crushable foam model, and both require uniaxial compression data. Wierzbicki and Sahraei introduced the concept of equivalent mechanical properties, which applied to a homogenized cell model in the isotropic crushable foam to find the material response of the cell under various mechanical loading conditions [17]. Recently, Ahn introduced the calibration procedures for the isotropic and volumetric crushable foam models and compared numerical results between them [18].
The crushable foam model showed good agreement with the experimental results under several compressive loading conditions. Although this model reflected the compressive properties of a jellyroll, it was difficult to track tensile and shear stress distributions since the magnitude in compression is several times higher than in tension. To overcome this difficulty, a simplified jellyroll model consisting of double-layer windings is proposed in this paper and is applied to an 18650 cylindrical battery under compressive loading conditions. One winding adopted the crushable foam model for representing the compressive plastic behavior, and the other winding adopted the elastoplastic models for tracking the tensile plastic behavior. The material parameters in the crushable foam model will be calibrated by using the experimental force–displacement relation for the crush test between two plates, and the proper tensile yield stress limit will be assigned as a cut-off value in the elastoplastic model. Further, the proposed model will be validated by cases for a cylindrical rod indentation and a spherical punch indentation. For three loading cases, deformed configuration and strain distributions will be investigated to track the plastic behavior for each component. By predicting the development of strain distributions and identifying locations occurring maximum compressive and tensile regions, the proposed computational model will provide us with useful analysis tools in cell development stages.

2. Materials and Methods

An 18650 cylindrical LIB under compressive loading cases was numerically solved with a three-dimensional geometry, as shown in Figure 1. There was a longitudinal plane of symmetry, so a half model was considered. Dimensions of each component are listed in Table 1. The cylindrical LIB consists of a shell casing, a homogenous jellyroll, and a homogenous thin-layered roll. Both rolls were modeled with a continuous winding section [19], while previous research assumed repeated circular sections to represent a jellyroll structure. The thin-layered roll was located around the jellyroll to track the plastic behavior due to tensile loading.

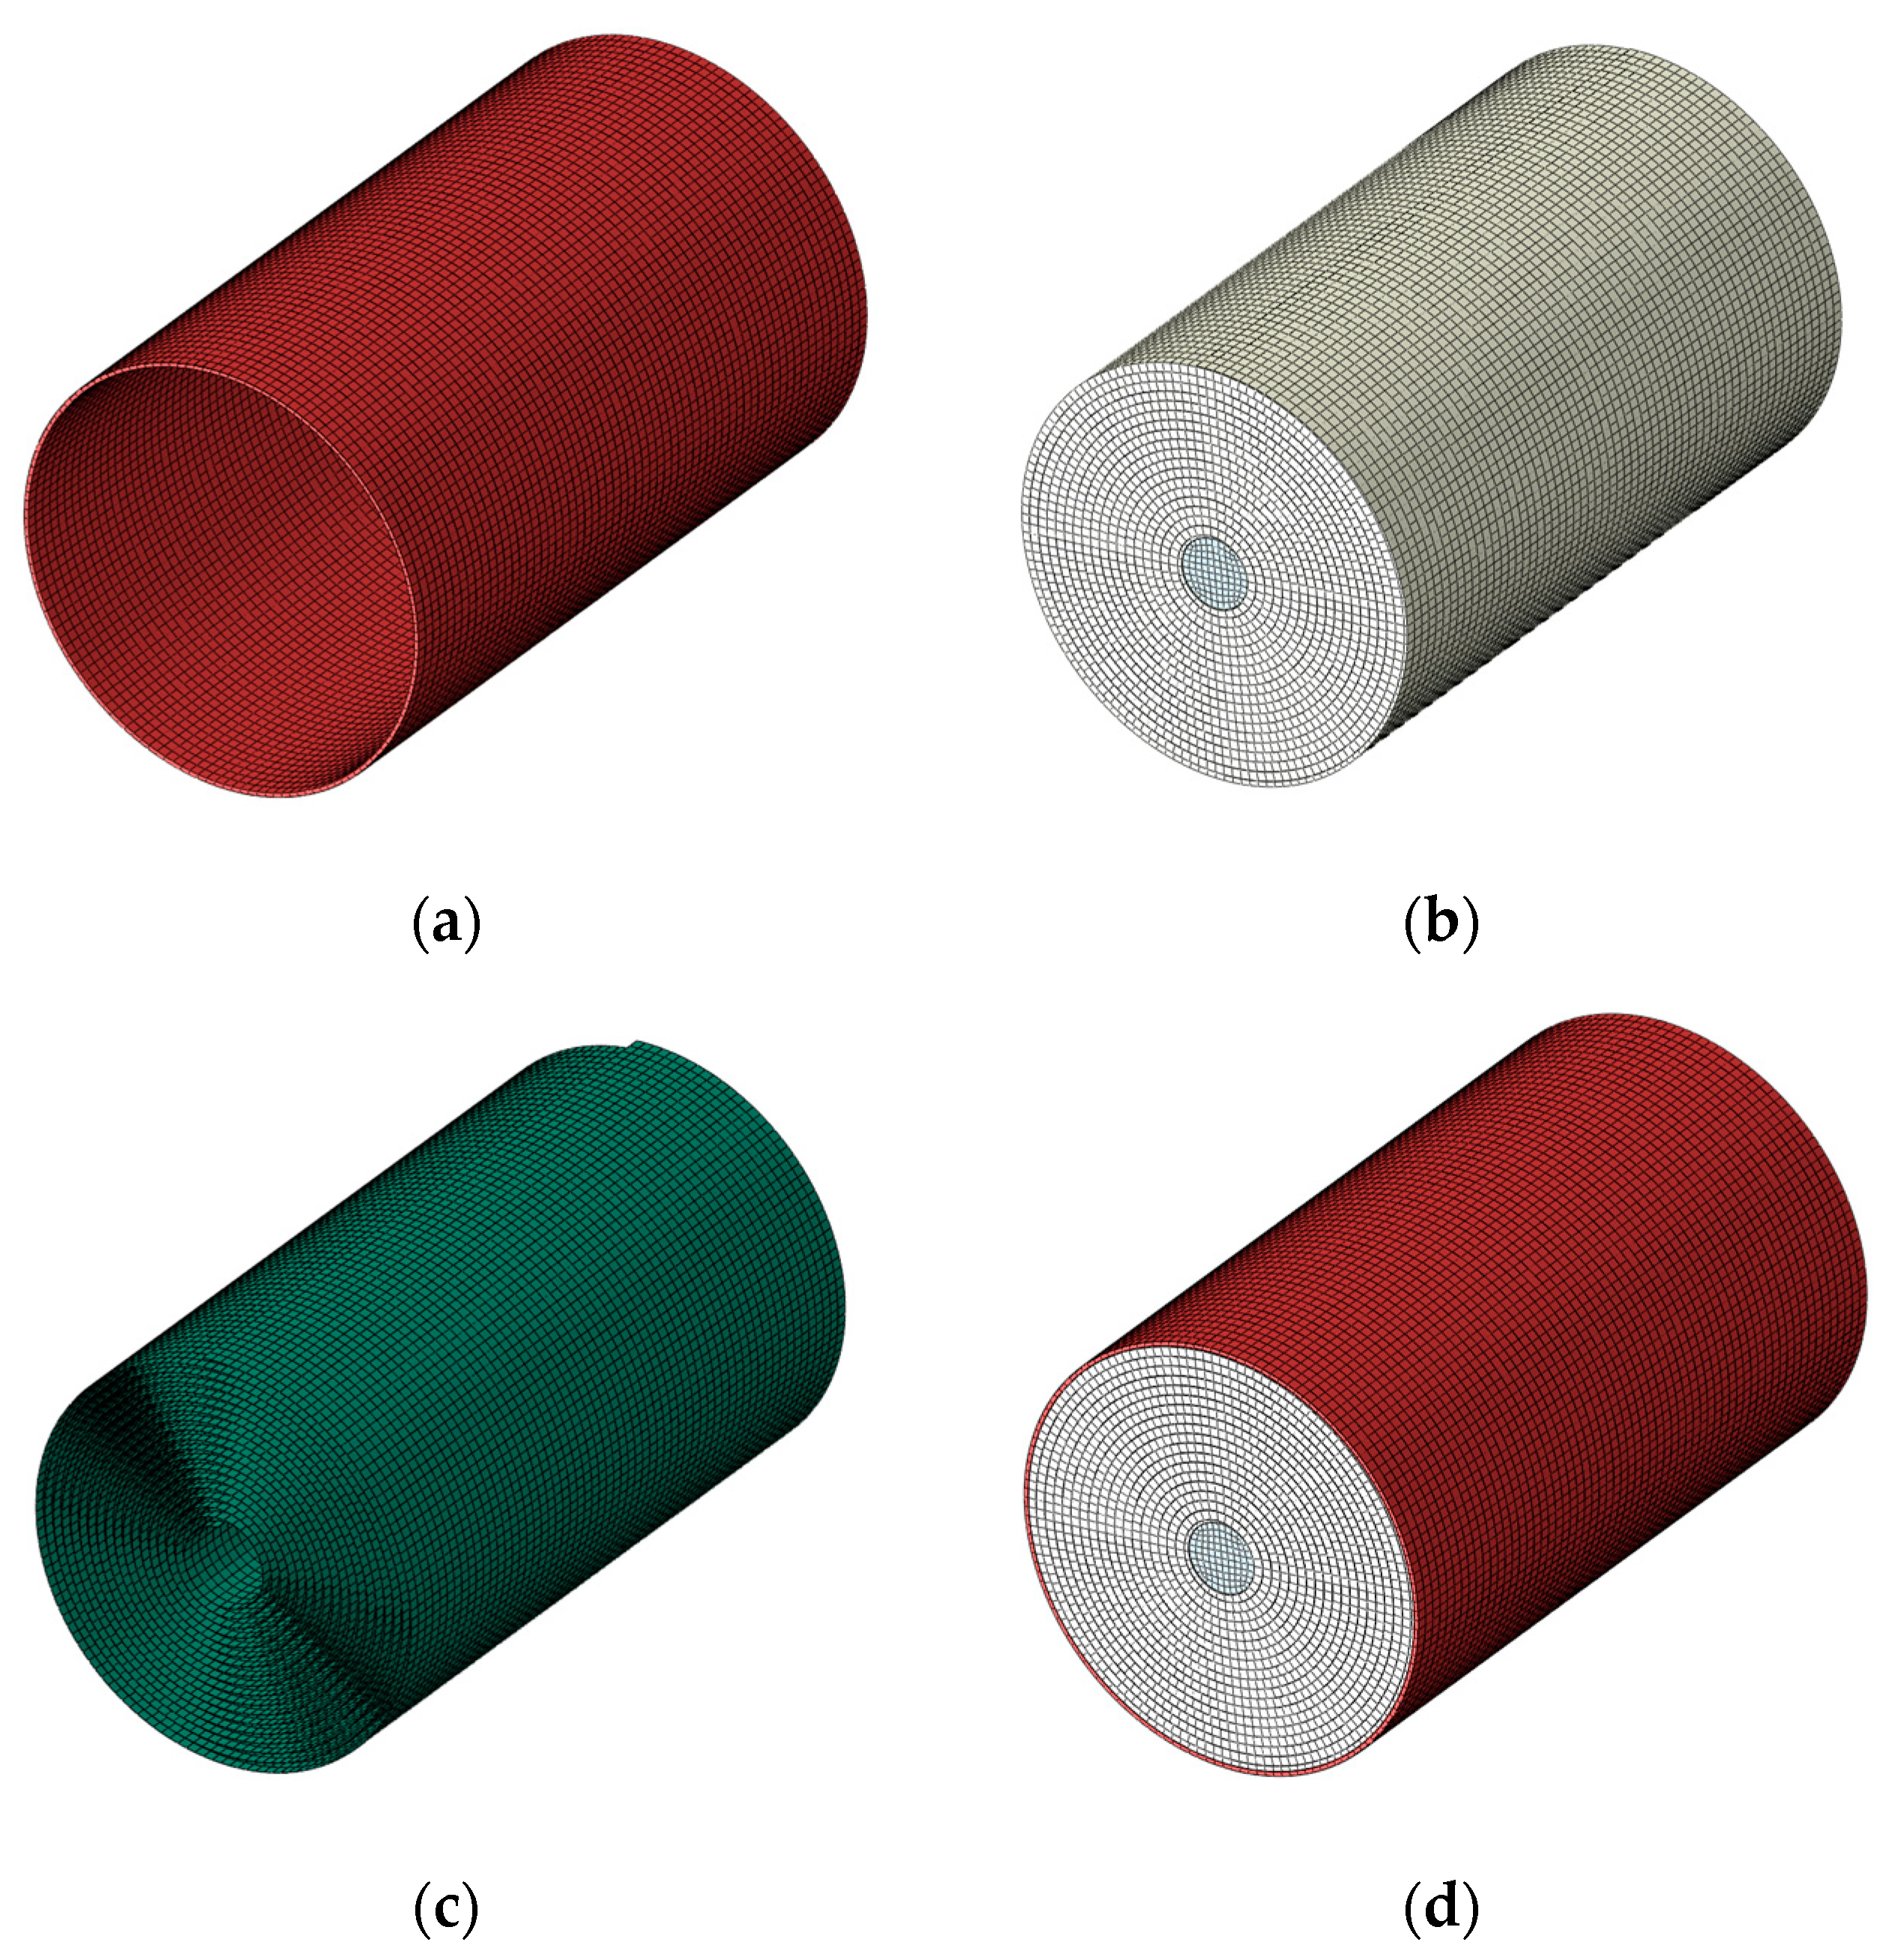
2.1. Finite Element Model

The casing was modeled as a steel with the elastic modulus E = 207   GPa , elastic Poisson ratio ν = 0.3 , and the density ρ = 7.85   g / cm 3 . The true stress and strain for the plastic hardening was given as follows:
R housing ε ¯ p = 700 ( 0.00801 + ε ¯ p ) 0.1385   MPa ,
where ε ¯ p is the equivalent plastic strain [9].
The jellyroll and the center-pin were modeled as volumetric hardening crushable foam with the elastic modulus E = 1500   MPa , elastic Poisson’s ratio ν = 0.0 , and density ρ = 2.27   g / cm 3 . The yield surface in the volumetric hardening defines the ratio ( k t = p t / p c 0 ) as yield stress in hydrostatic tension ( p t ) to the yield stress in hydrostatic compression ( p c 0 ) and the yield strength ratio ( k = σ c 0 / p c 0 ) as yield stress in uniaxial compression ( σ c 0 ) to the yield stress in hydrostatic compression ( p c 0 ),
α p t p c 2 + p 2 + q 2 1 / 2 = α p c + p t 2 ,
as shown in Figure 2a. The yield surface evolves with the following shape factor:
α = 3 k ( 3 k t + k ) ( 3 k )   with   k = σ c 0 p c 0   and   k t = p t p c 0 ,
where q is the Mises equivalent stress, and p is the hydrostatic pressure. The flow potential was chosen as follows:
h = 9 2 p 2 + q 2 .
The hardening curve was represented as a function of the value of volumetric compacting plastic strain ( ε vol p l ),
p c ε vol p l = σ c ε axial p l σ c ε axial p l 1 α 2 + 1 9 + p t 3 p t + σ c ε axial p l 3 ,
in which the uniaxial plastic strain is the same as the volumetric plastic strain [20]. In Equation (5), the uniaxial compression test data were given as follows [9]:
σ c = 0.8 + 848 ε ¯ axial p 2.7   MPa   ,
and Abaqus/Explicit used the true stress-logarithmic strain curve of Equation (6) as shown in Figure 2b. The yield stress ratios for compressible and hydrostatic loadings for volumetric hardening were calibrated with the force–displacement curve of the crush test, which will be discussed in Section 3.1.
The thin-layered winding played an important role in describing the plastic behavior of the jellyroll under tensile loading. Therefore, the material would show elastic behavior within the elastic limit and undergo fully plastic behavior as the stress surpasses the elastic limit. The elastic parameters were assumed to be the same as the jellyroll to avoid stress discontinuity between two layers, and the yield stress in the elastic limit was assumed to be 10 MPa, which corresponds to the tensile cut-off strength of the material in the jellyroll.

2.2. Numerical Simulation Method in Abaqus/Explicit

First, each deformable part created in Section 2.1. was meshed. The outer shell casing was modeled with the homogeneous shell elements to consider the bending effect in Abaqus/Explicit. It was modeled with S4R 4-node doubly curved explicit shell elements, including reduced integration, hourglass control, and finite membrane strains. The jellyroll with core was modeled with C3D8R 8-node liner explicit brick elements, including reduced integration and hourglass control. The thin-layered roll was modeled as homogeneous membrane explicit elements, including reduced integration and hourglass control. The mesh size of the shell, solid, and membrane elements was approximately 0.5 mm enough to capture the localized deformation. Second, rigid parts were modeled. The indenter was modeled by an analytic rigid surface, and the rigid body reference node was attached to it. The analytic rigid indenter was fully constrained except in the vertical direction, and the reaction force was measured at a reference node of the indenter when the indenter was displaced quasi-statically. The displacement of the indenter was prescribed using the smoothing step so that a quasi-static response was expected. The floor was modeled as a 3D analytic rigid surface with the reference node fixed. Third, the contact pairs were defined between the surfaces of each component. The coefficient of Coulomb friction was assumed to be 0.3 between a contact pair. The tie constraint was applied between the jellyroll and the thin-layered roll. Fourth, boundary and loading conditions were imposed on each part. The symmetry condition was applied to the left symmetry plane of all components, and the rest of the boundary condition for each part was summarized in Table 2. The loading rate of the indenter was 0.35 m/s, in which the kinetic energy of the entire structure was negligible of the internal energy. Last, the Abaqus/Explicit solution method was used in the simulation using an HP-Z8 workstation with 6 CPUs, and it took four hours for each loading scenario.

3. Numerical Results and Discussion

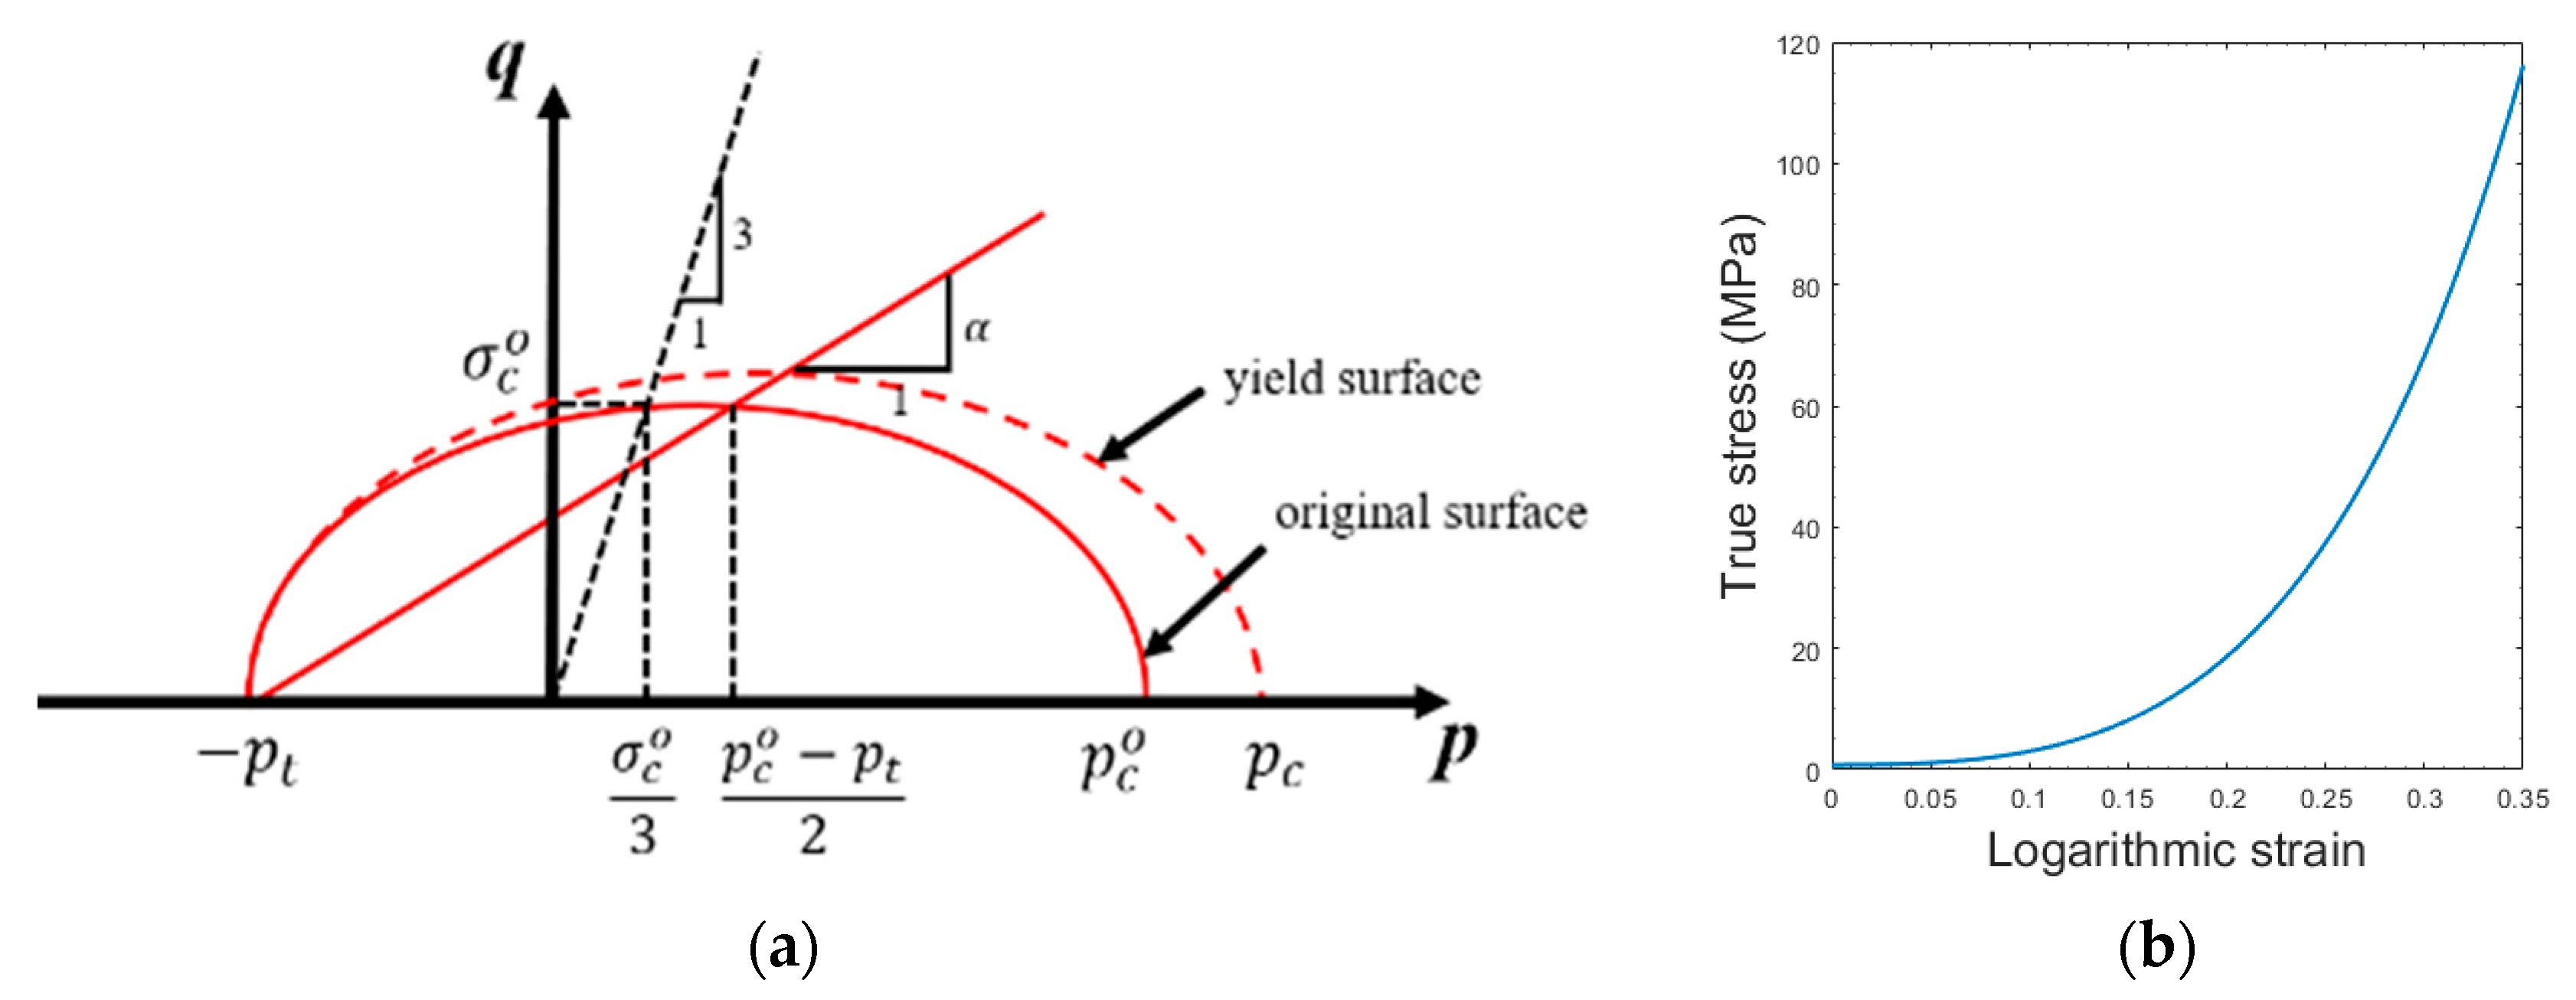
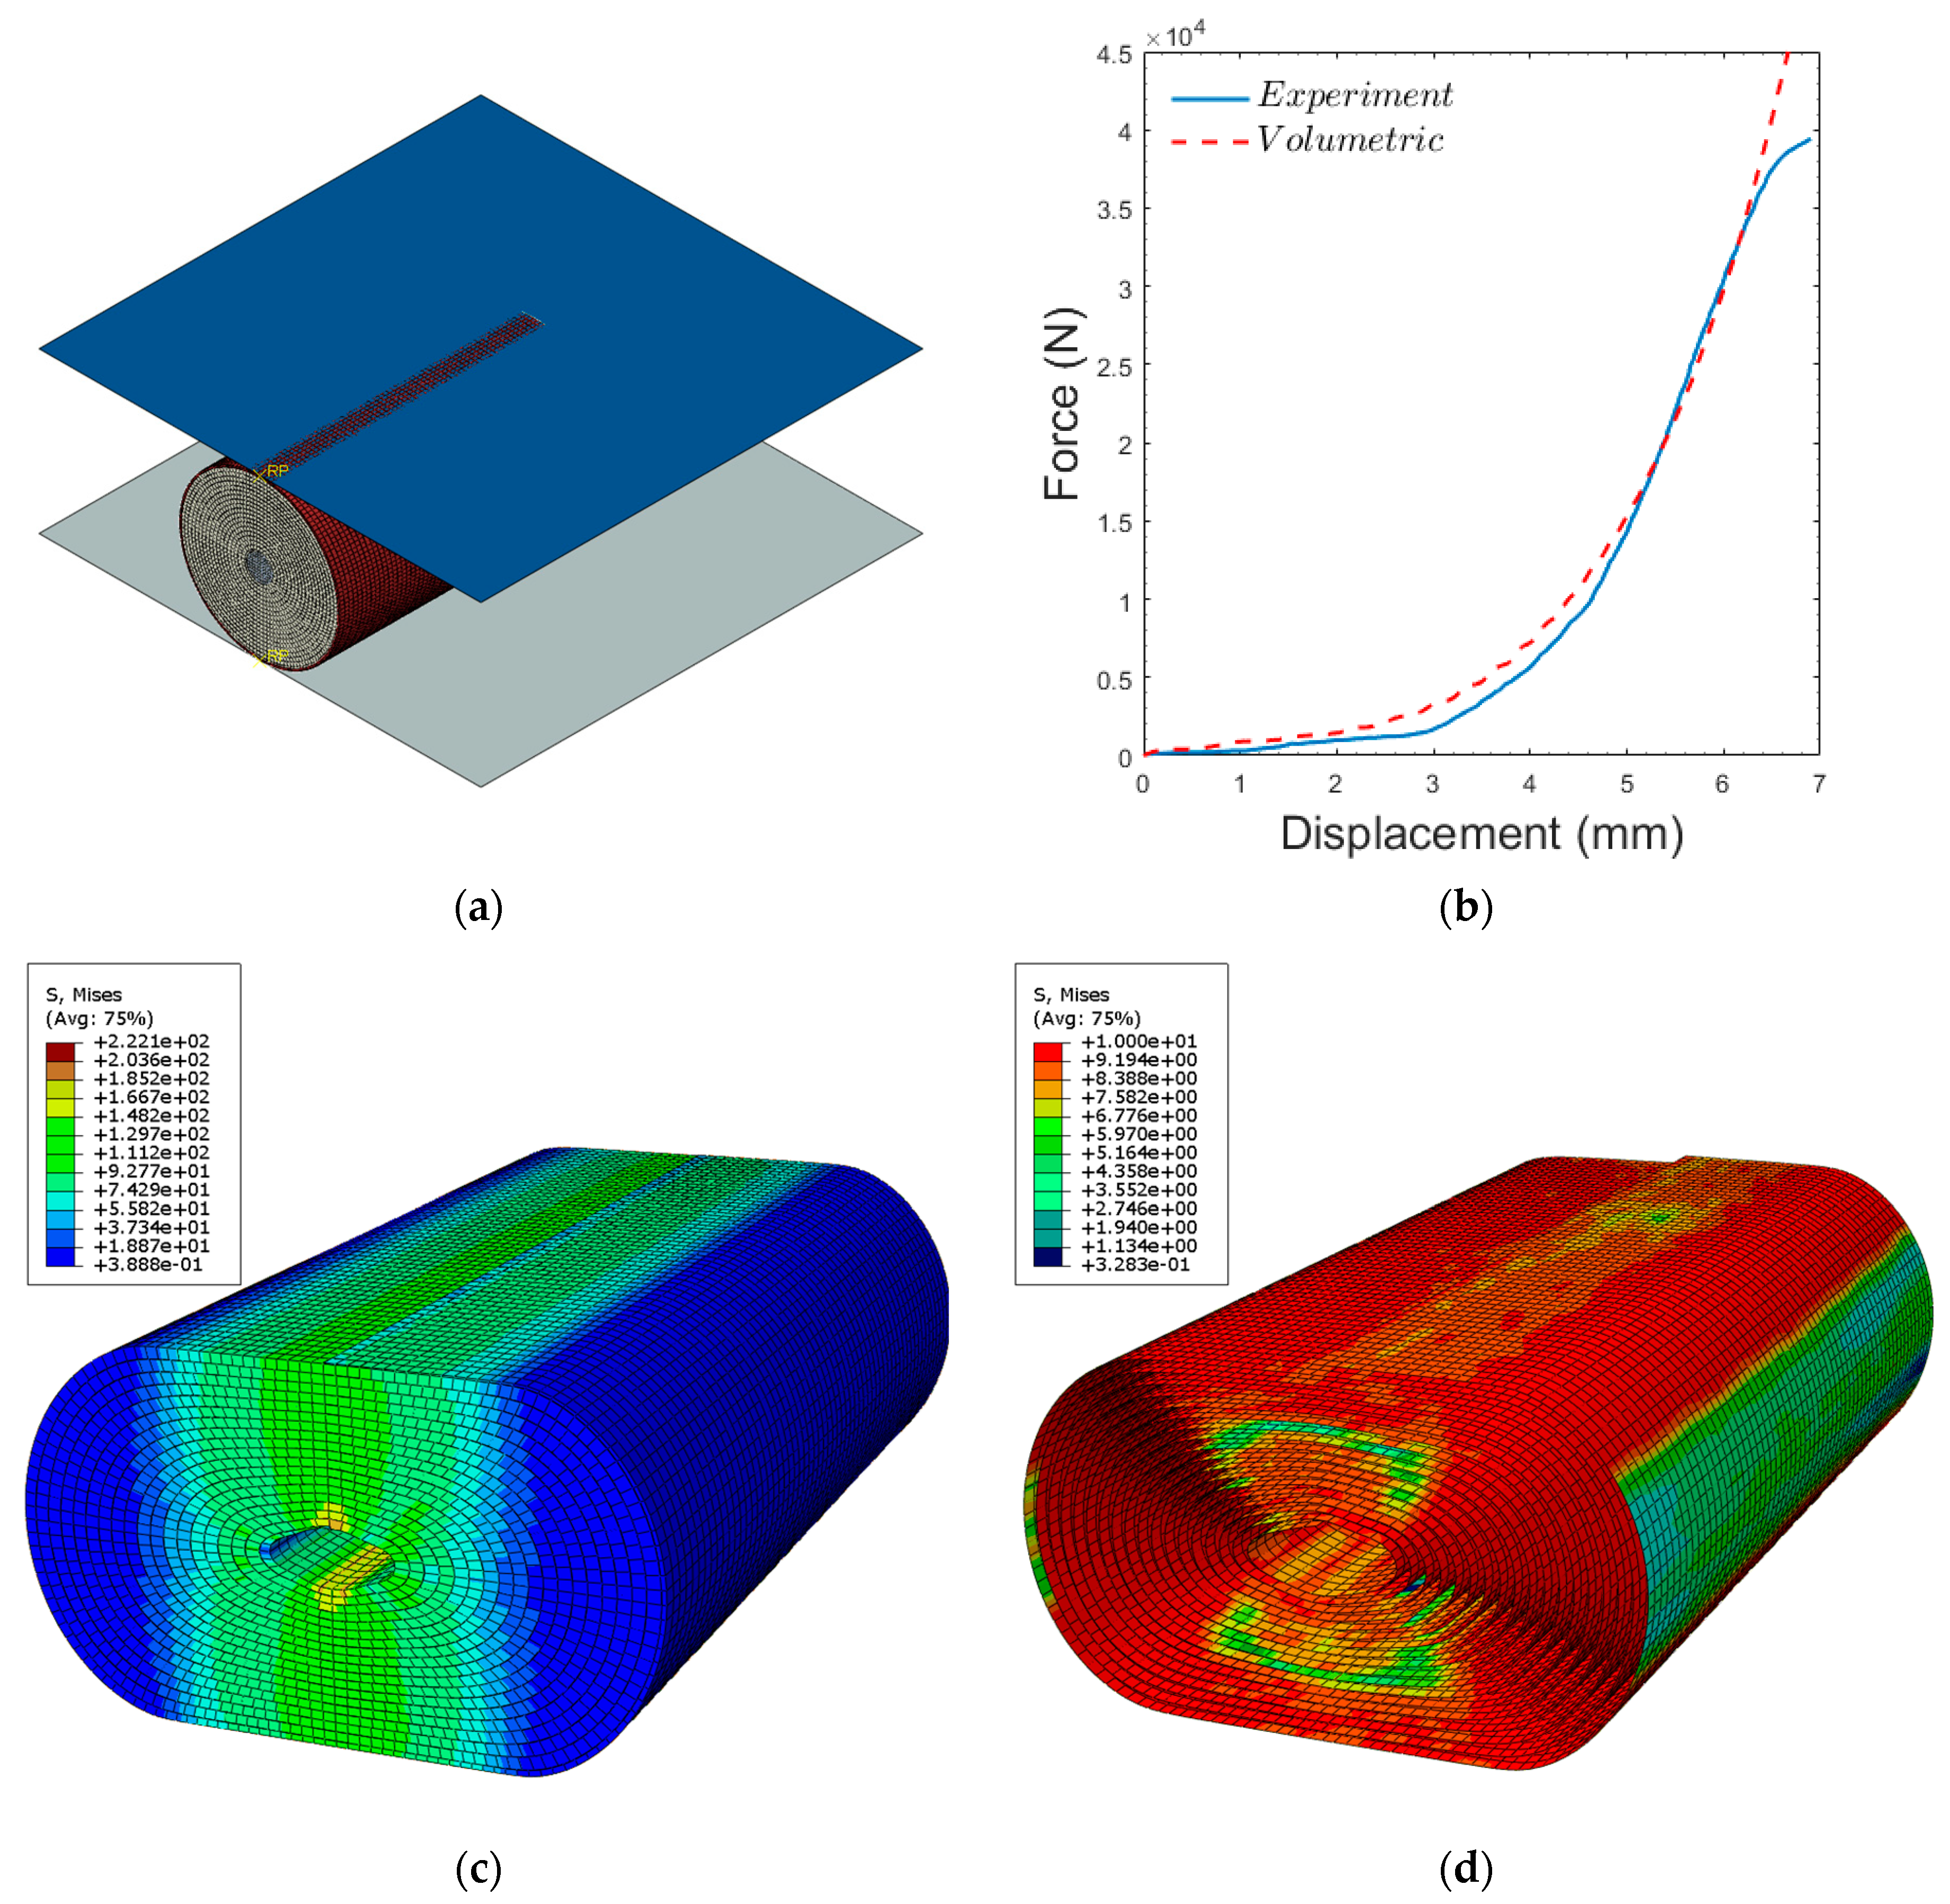
3.1. Calibration of Material Parameters with Crush Simulation

The cylindrical-cell indentation problem with two identical plates was used to calibrate the material parameters for the three-dimensional volumetric models. In Figure 3a, the assembled cylindrical battery on the rigid floor was crushed by the upper rigid indenter until the displacement reached 7 mm. Due to the difficulty in performing the tensile test of the jellyroll, the ratio ( k t ) was assumed to be the default value (1.0), and the ratio ( k ) was iteratively changed until the force–displacement response in the simulation agreed with it in the experiment. The detailed calibration procedure was explained in the literature [18]. The calibrated material parameters for the plastic behavior of jellyrolls are listed in Table 3. In Figure 3b, the solid and dotted lines represent the force–displacement relation obtained by the experiment and the simulation with the calibrated parameters, respectively. In the simulation, the force and displacement were measured at the reference point of the rigid indenter.
The force–displacement relation in the simulation is in good agreement with one in the experiment by Sahraei [10], and the peak force for the simulation was 50,441 N. The yield strength ratio is increased from 2.5 in the lumped jellyroll model [18] to 2.7 in the two-layered jellyroll due to the interaction between two layers. Figure 3c shows the deformed configurations and the contour of compressive stress distributions in the jellyroll when the punch is displaced downward by 7 mm. The compressive areas are concentrated in the central rectangular regions with the red, yellow, and green colors, while the blue regions show no compressive stresses. The maximum compressive stress approaches 222 MPa in the middle of the jellyroll. Figure 3d shows the deformed configurations and the contour of stress distribution in the thin-layered roll. The plastic yield stress limit (10 MPa) spreads over the whole region in the thin-layered roll, but it is not clear to identify where the severe damage starts. As an alternative, effective plastic strains are investigated. Figure 4a,b show that the volumetric compacting plastic strain in the jellyroll occurs in the central rectangular regions similar to the stress distribution. The maximum strain approaches from 25% to 39% in the middle of it, as shown in Figure 4a,b. On the other hand, as the punch is displaced at 3.5 mm, the effective plastic strain develops in the hoop direction near the core as shown in Figure 4c, and the maximum value approaches 60% near the core as shown in Figure 4d as the punch is displaced by 7 mm. The experimental observation with an infrared image showed that the short circuit initiated close to the core [9], but it was not clear which component or location in the jellyroll started to be damaged. Based on the radial crushing simulation, high-tensile material like a separator might be damaged in the hoop direction close to the core, while the damage might initiate in the central radial direction from the core for high-compressible materials such as anodes or cathodes.

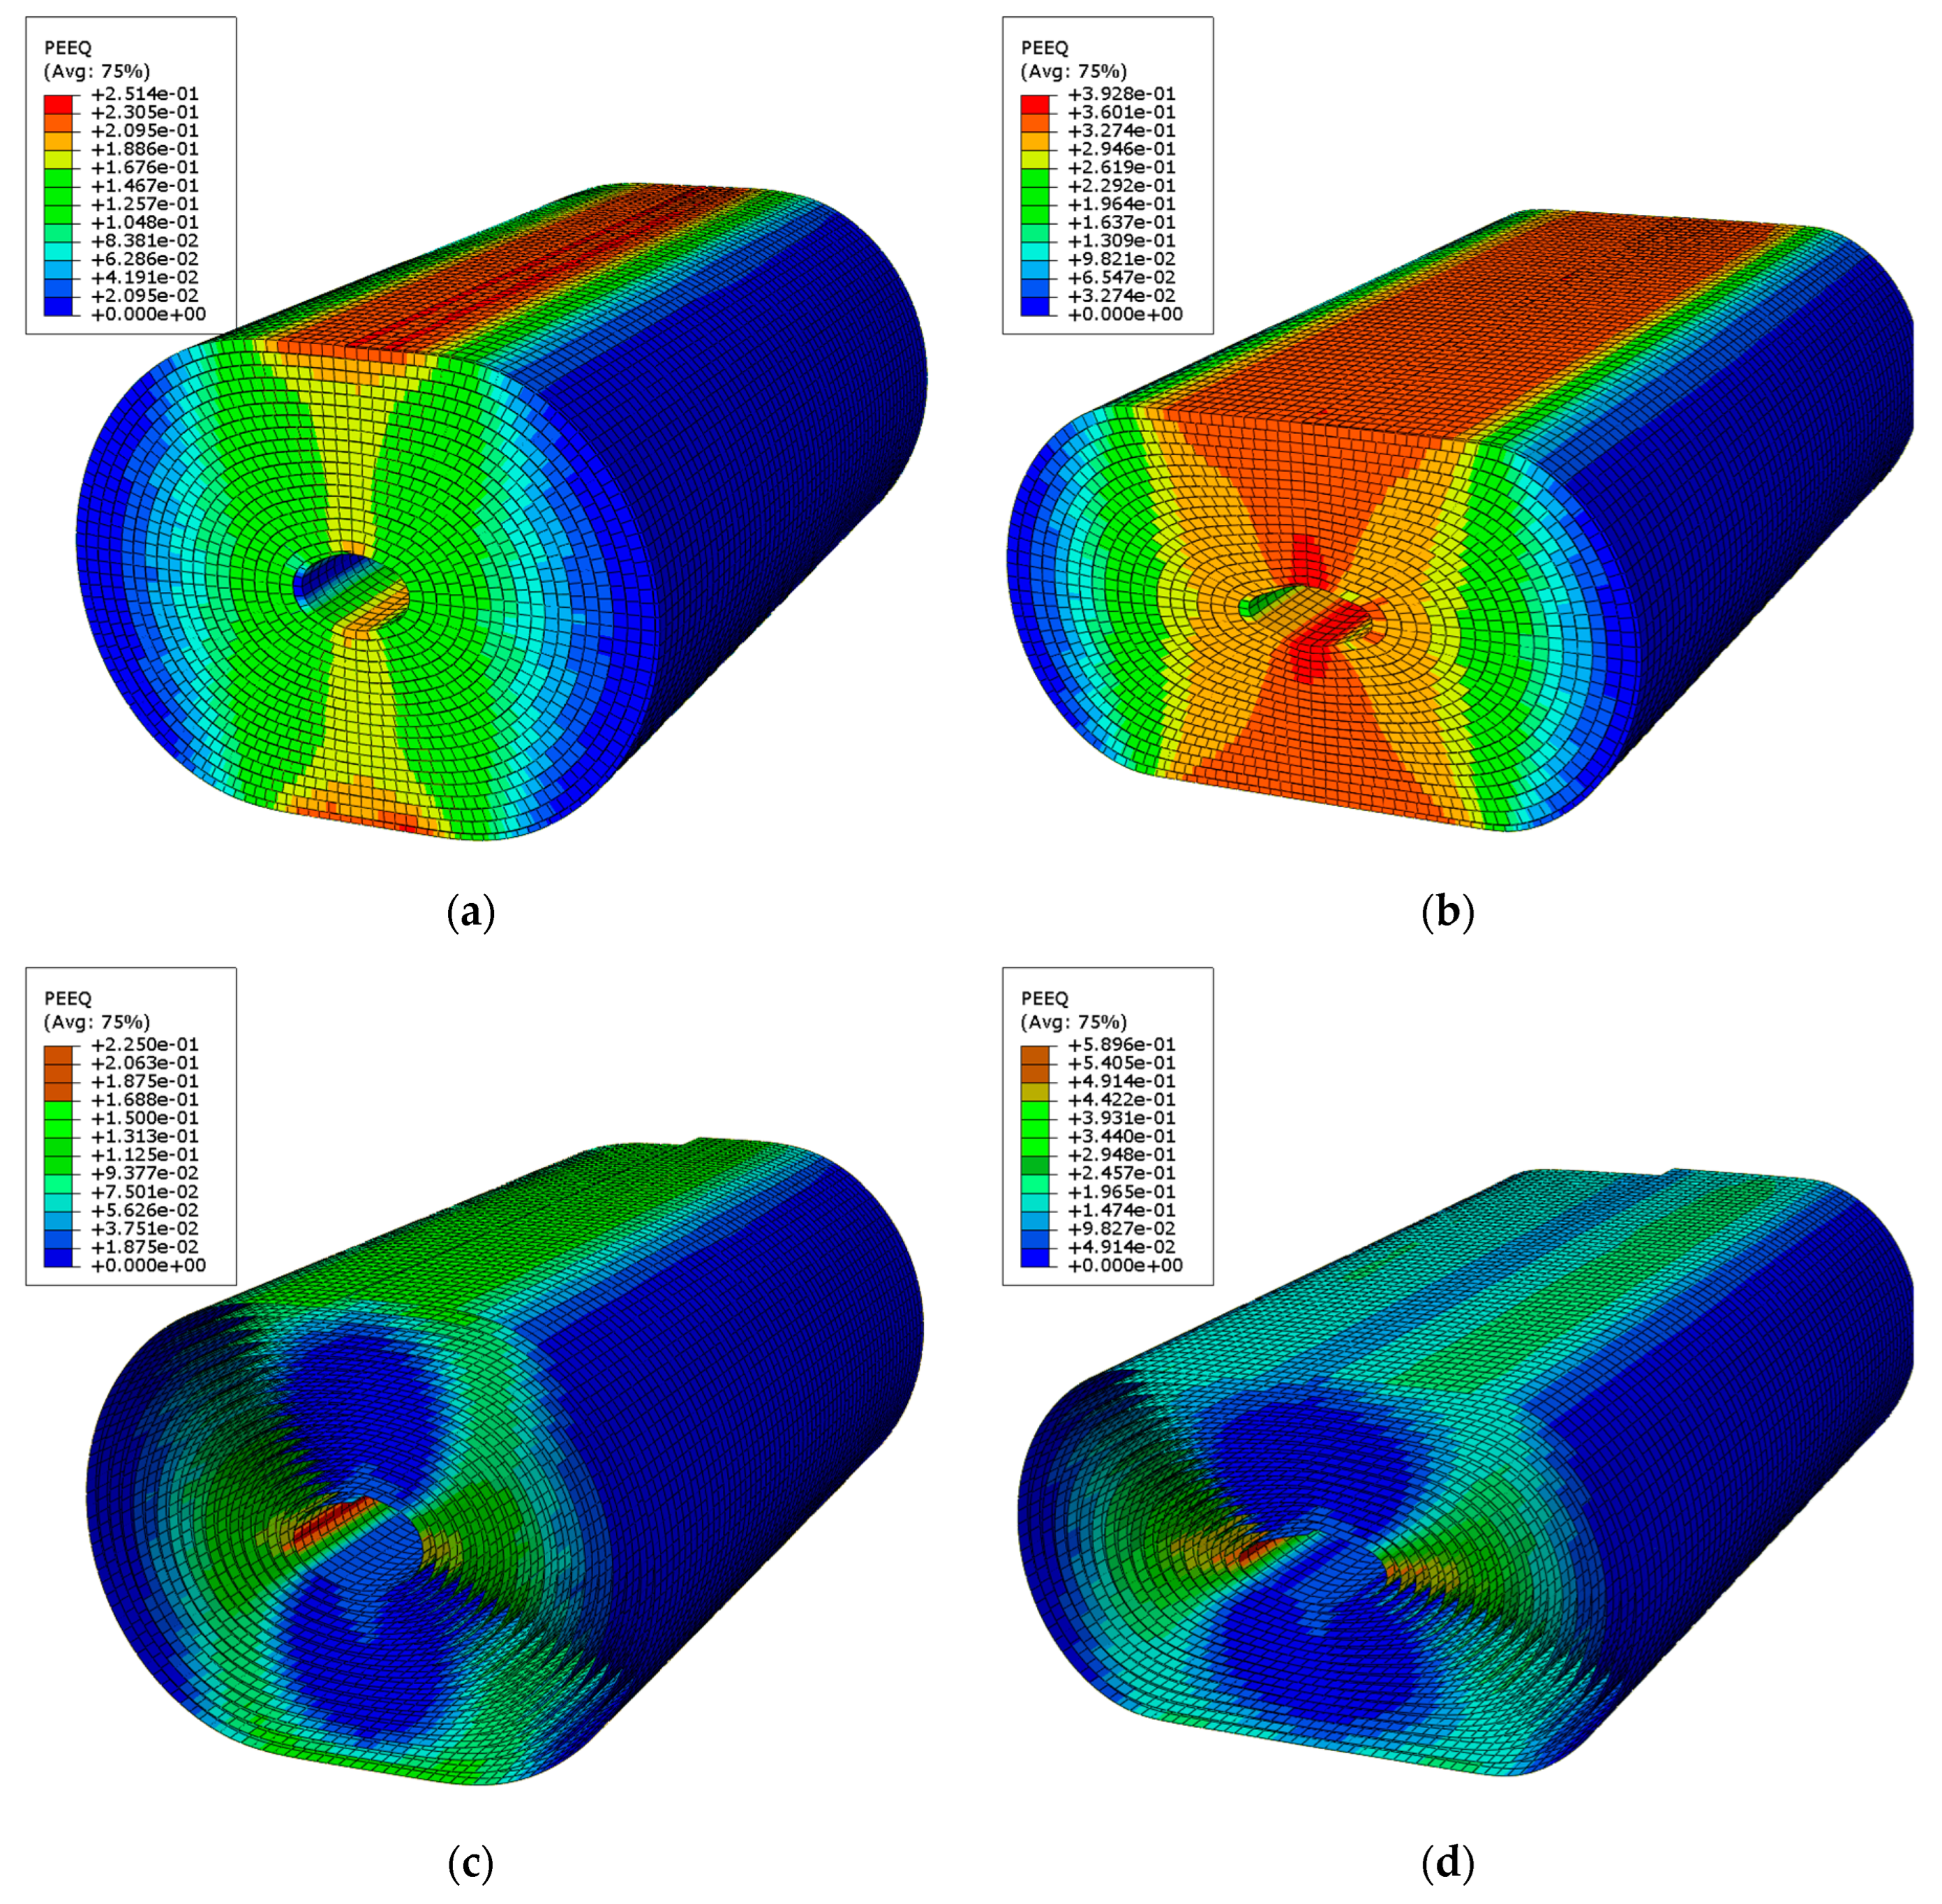
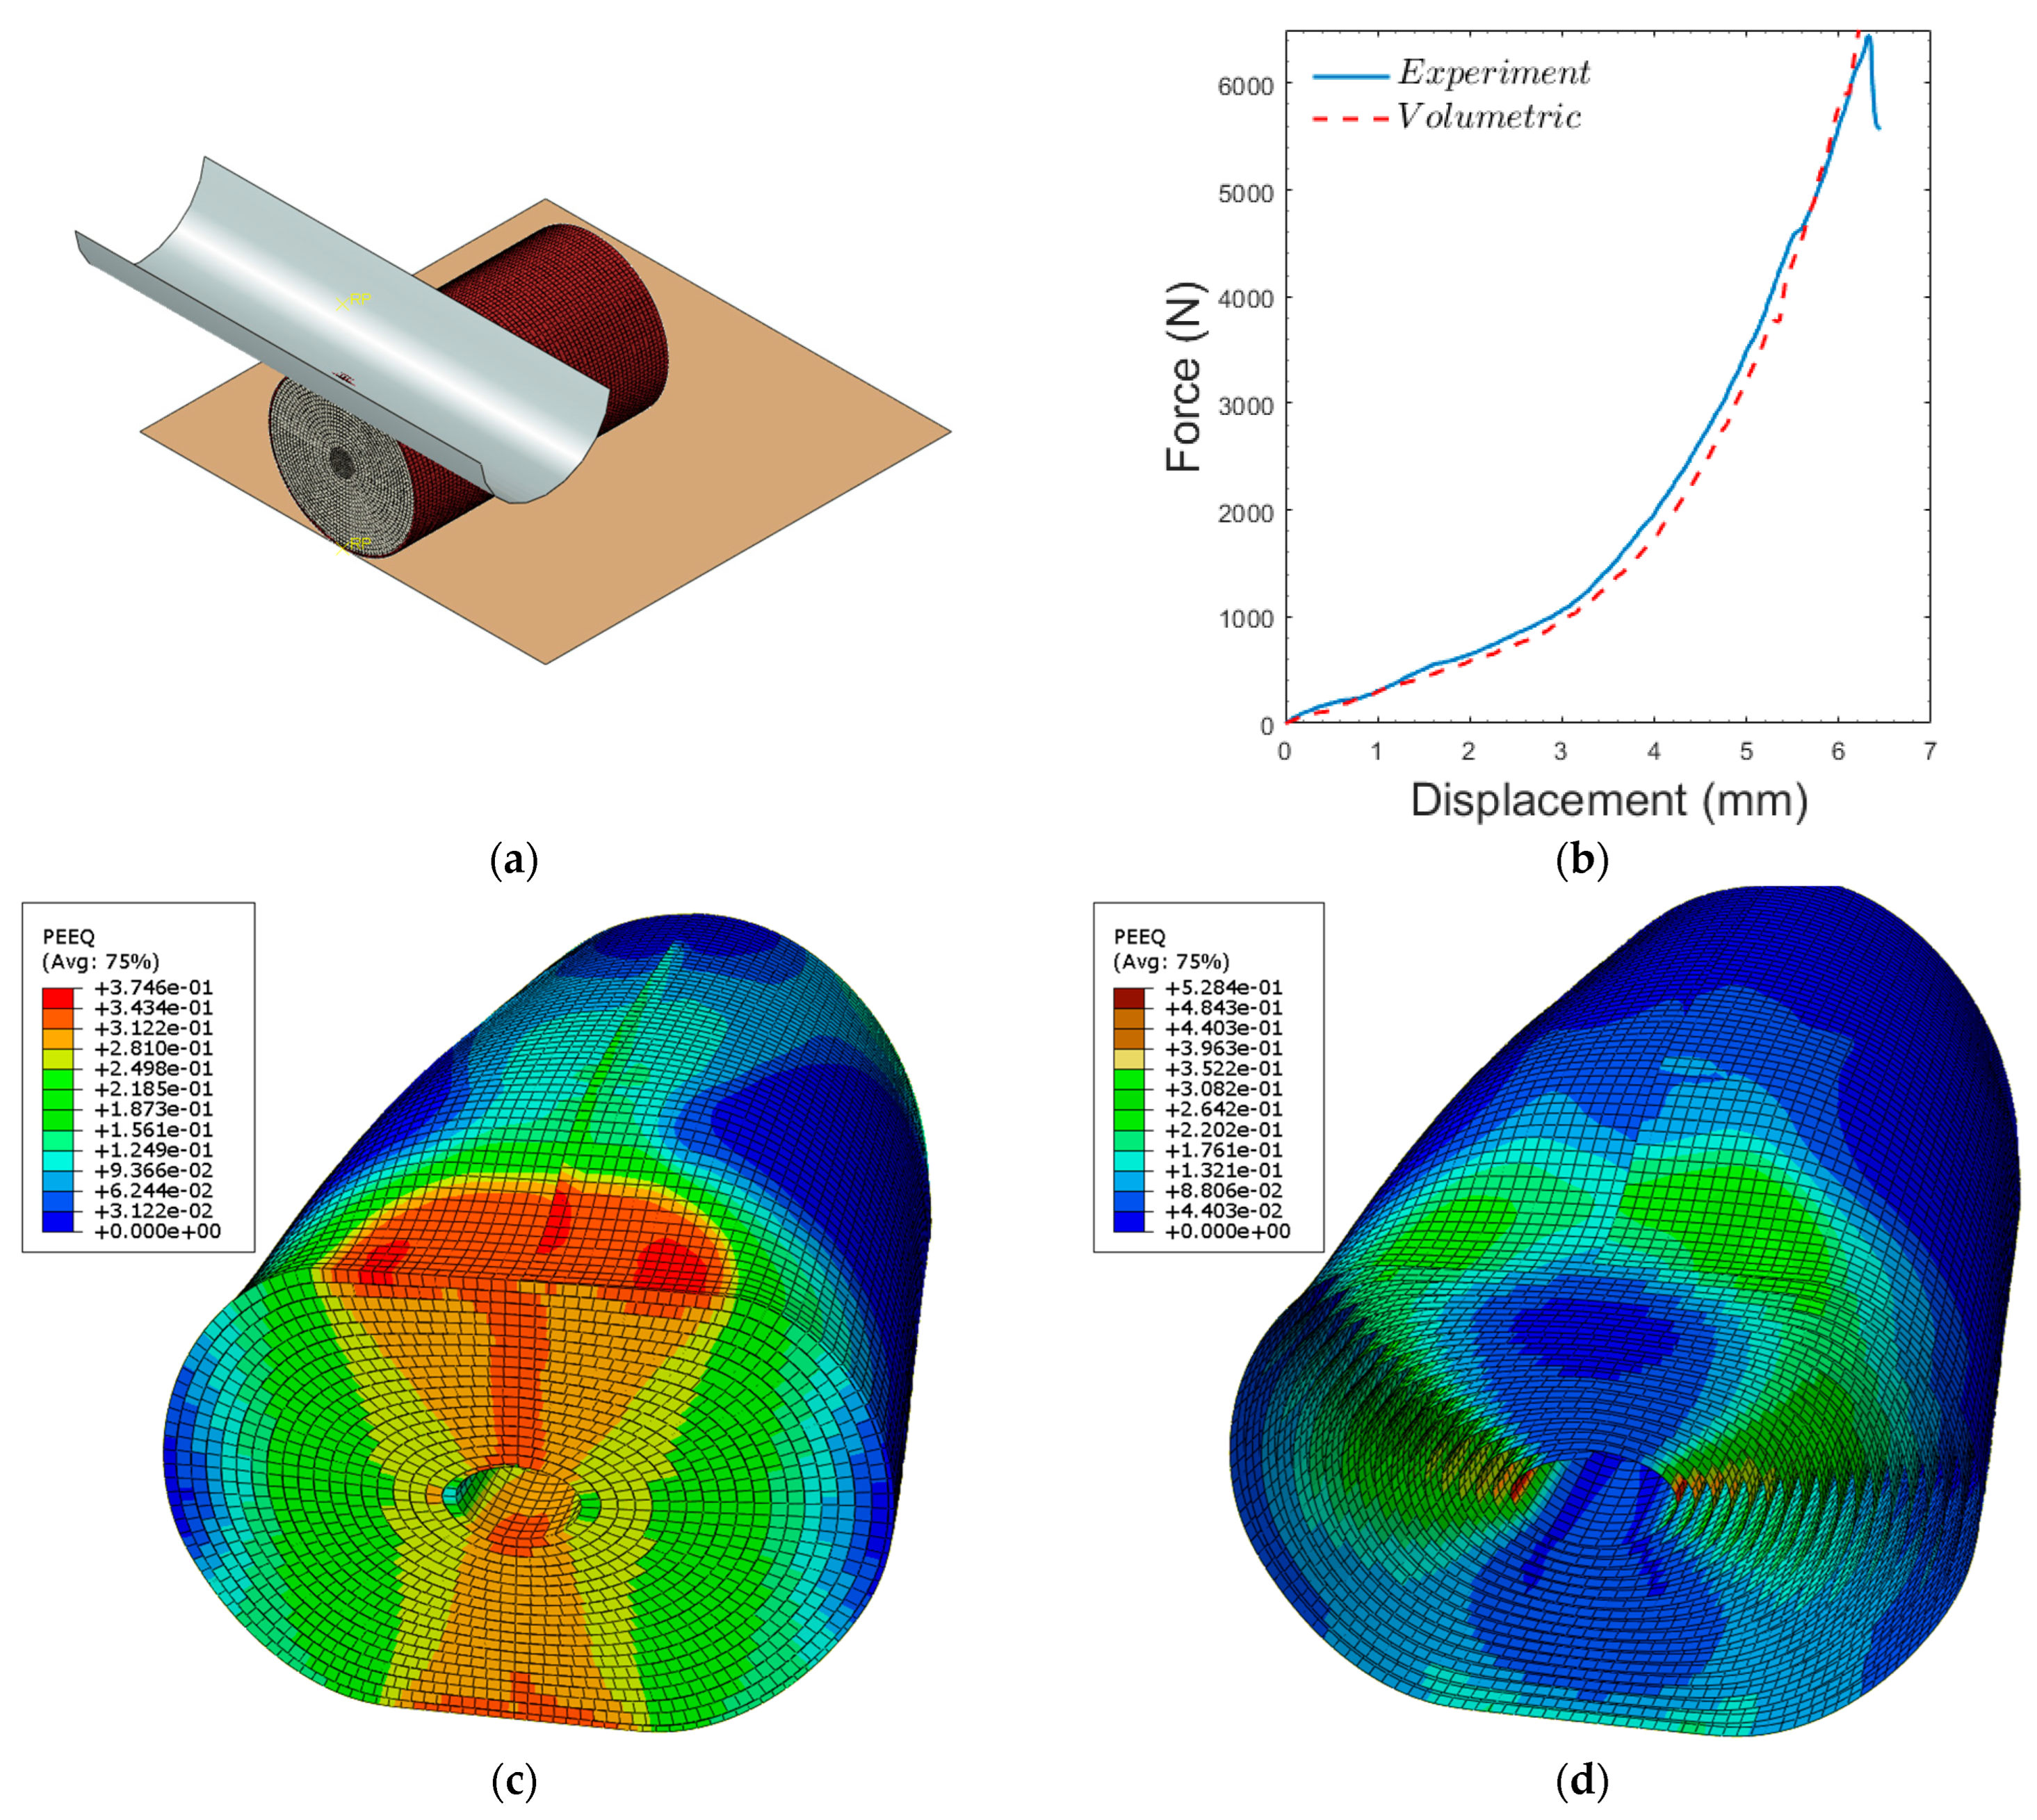
3.2. Indentation of a Cell by a Rigid Rod

A cell was indented quasi-statically by a cylindrical rod with a radius of 8 mm as shown in Figure 5a. The test was designed to apply the compressive stresses both in the radial direction and tensile stresses in the axial direction. The load–displacement response of the cell is plotted in Figure 5b for indentation with the cylindrical punch, and the simulated response is in good agreement with the experiment result by Sahraei [10], and the peak force for the simulation was 7544 N. Figure 5c shows the deformed configuration and the volumetric compacting plastic strain when the punch is displaced by 6.3 mm. The maximum compacting plastic strain occurs in the vicinity of the punch (region in red color), and the magnitude approaches 37%, while the magnitude is 32% in a small rectangular region from the punch to the core. Figure 5d shows the deformed configuration and the effective tensile plastic strain when the punch is displaced by 6.3 mm. The maximum effective plastic strain occurs in the vicinity of the core in the hoop direction, and the magnitude approaches 52%, while the magnitude is 20% in the vicinity of the punch. The locations where the maximum plastic strain occurs are different between the jellyroll and the layered roll.

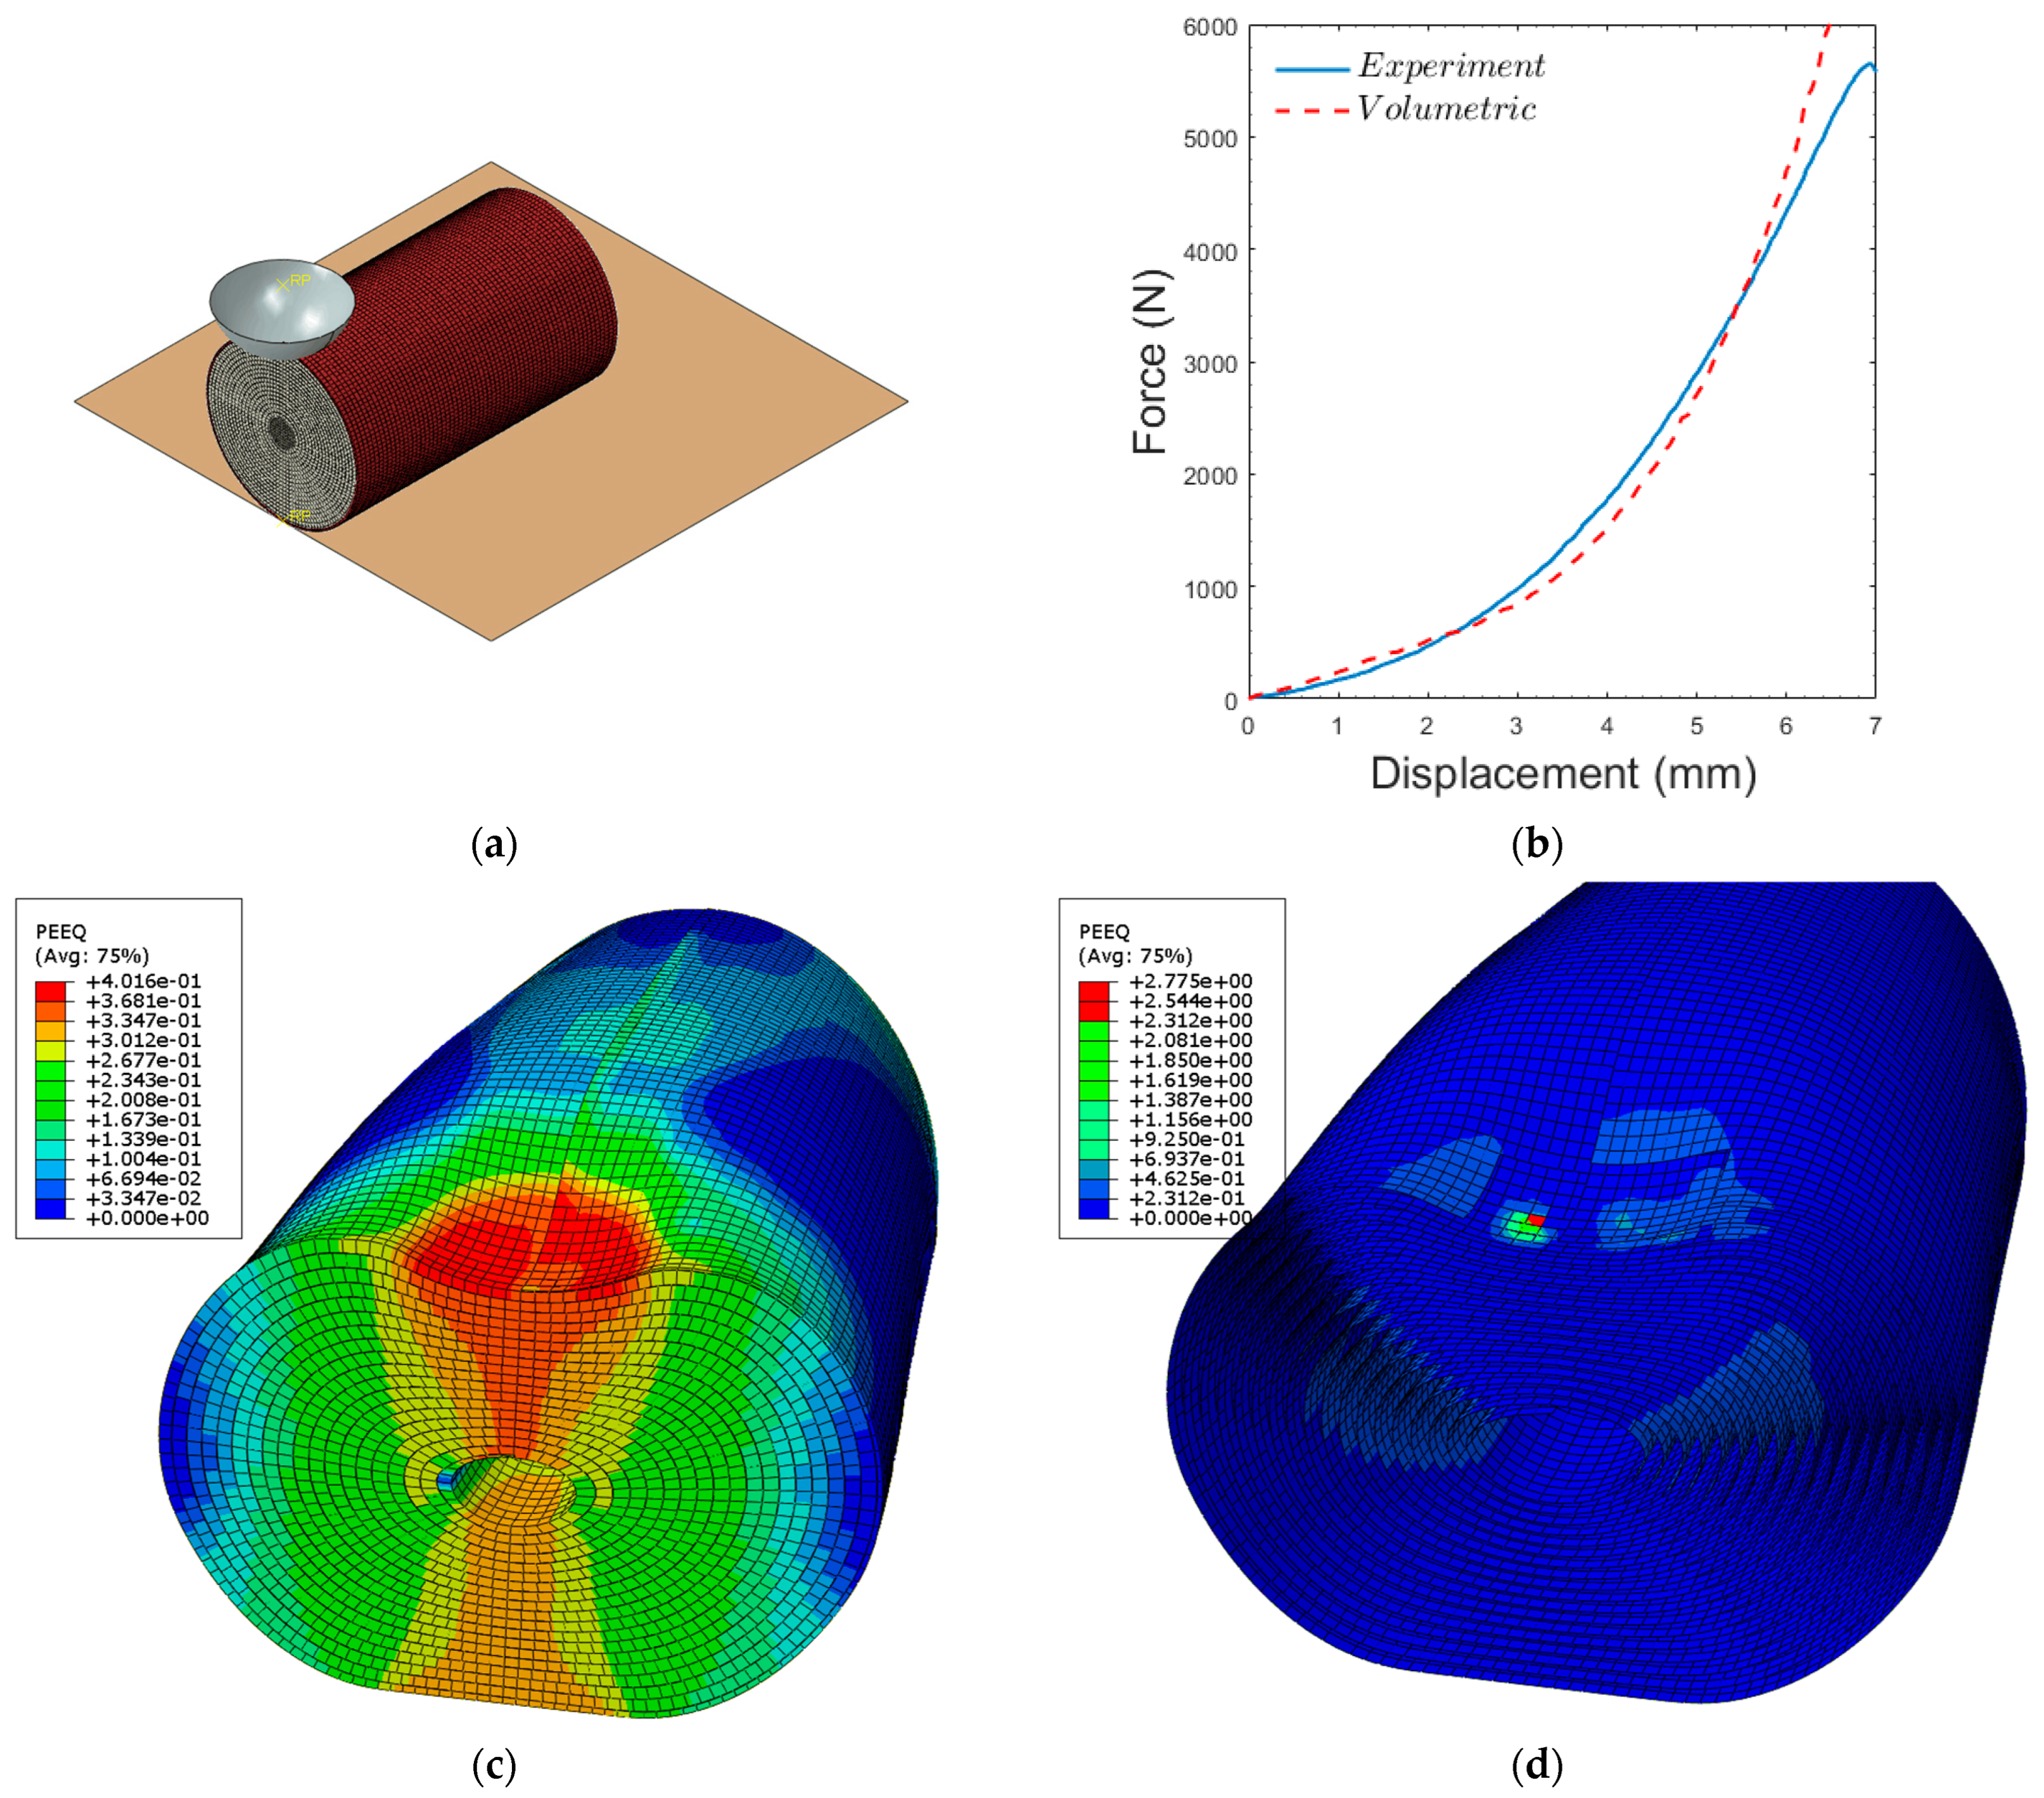
3.3. Indentation of a Cell by a Spherical Punch

A cell was indented quasi-statically by a hemispherical punch with a radius of 6.4 mm as shown in Figure 6a. The test was intended to apply the compressive stresses in the radial direction and tensile stresses both in axial and cross-sectional elements. The load–displacement response of the cell is plotted in Figure 6b for both the experiment and simulation, and as the hemispherical punch crushes the jellyroll, the simulated response is getting slightly higher than the experiment result by Sahraei [10]. The peak force for the simulation was 6011 N when the punch is displaced by 6.5 mm. Figure 6c shows the deformed configuration and the volumetric compacting plastic strain when the punch is displaced by 6.5 mm. The maximum compacting plastic strain occurs in the vicinity of the punch, and the magnitude approaches 40%, while the magnitude is 35% near the core. The effective tensile plastic strain simultaneously develops in the vicinity of the punch and core at the beginning of loading but increases more rapidly in the vicinity of the punch than in the core at the end of loading. Figure 5d shows the deformed configuration and the effective tensile plastic strain when the punch is displaced by 6.5 mm. The maximum effective plastic strain occurs near the punch, and the magnitude approaches 277%, while the magnitude is 60% near the core. The location where the maximum plastic strain occurs in the jellyroll is the same as the location in the layered roll for the hemispherical indentation simulation.
The simulation results for both loading scenarios (rigid rod and spherical punch) show that a cross-sectional local crack is predicted in the jellyroll. Therefore, the model makes it possible to predict the location of short circuits due to local damage in both loading scenarios.

4. Conclusions

To reflect both tensile and compressive plastic behavior for a jellyroll under compressive loading conditions, an 18650 cylindrical cell model with a jellyroll and a casing was constructed. The jellyroll consists of two winding layers, in which one layer used the crushable foam model describing the compressive plastic behavior, and the other used the elastoplastic model to track the tensile plastic behavior. The material parameters in the crushable foam model were calibrated by comparing the experimental force–displacement curve for the crush test between two plates, and the tensile yield stress was chosen as 10 MPa. The validity of the proposed jellyroll model was further justified by the comparison of the simulation results with the experimental results for a cylindrical rod and a spherical punch indentation test. Through the numerical experiments for three simulation cases, the following main observations were drawn:
(1) In the crush simulation, the maximum effective compacting strain occurred in the central rectangular regions, while the maximum effective tensile strain occurred near the core in the hoop direction.
(2) In the cylindrical rod simulation, the maximum effective compacting strain occurred in the vicinity of the rod punch, while the maximum effective tensile strain occurred in the vicinity of the core in the hoop direction.
(3) In the spherical punch simulation, the maximum effective compacting and tensile strain occurred near the punch.
The maximum effective tensile strain inside the thin-layered roll represents the potential location of severe damage or short-circuit, so the proposed method makes it possible to identify the weakness in a cell development stage. Also, we expect that the winding modeling used in this study might be useful to track or extract the change of continuous deformation or stress distribution inside a layered structure. Furthermore, the future study requires us to model a four-layered structure of a cell to identify the potential location of the short-circuit, even though the computational cost is expensive.

Funding

This research was supported by the Basic Science Research Program through the National Research Foundation of Korea (NRF) funded by the Ministry of Education (NRF-2017R1D1A1B03030013 and NRF-2020R1I1A3072373).

Institutional Review Board Statement

Not applicable.

Informed Consent Statement

Not applicable.

Data Availability Statement

The data presented in this study are available upon request from the corresponding author.

Conflicts of Interest

The author declares no conflicts of interest.

References

  1. Zhang, X.; Sastry, A.M.; Shyy, W. Intercalation-Induced Stress and Heat Generation within Single Lithium-Ion Battery Cathode Particles. J. Electrochem. Soc. 2008, 155, A542. [Google Scholar] [CrossRef]
  2. Golmon, S.; Maute, K.; Dunn, M.L. Numerical modeling of electrochemical–mechanical interactions in lithium polymer batteries. Comput. Struct. 2009, 87, 1567–1579. [Google Scholar] [CrossRef]
  3. Chen, Y.H.; Wang, C.W.; Zhang, X.; Shyy, W.; Sastry, A.M. Porous cathode optimization for lithium cells: Ionic and electronic conductivity, capacity, and selection of materials. J. Power Sources 2010, 195, 2851–2862. [Google Scholar] [CrossRef]
  4. Arora, P.; Zhang, Z.J. Battery separators. Chem. Rev. 2004, 104, 4419–4462. [Google Scholar] [CrossRef] [PubMed]
  5. Sheidaei, A.; Xiao, X.; Huang, X.; Hitt, J. Mechanical be-havior of a battery separator in electrolyte solutions. J. Power Sources 2011, 196, 8728–8734. [Google Scholar] [CrossRef]
  6. Lee, H.; Yanilmaz, M.; Toprakci, O.; Fu, K.; Zhang, X. A review of recent developments in membrane separators for rechargeable lithium-ion batteries. Energy Environ. Sci. 2014, 7, 3857–3886. [Google Scholar] [CrossRef]
  7. Zhang, X.; Sahraei, E.; Wang, K. Li-ion Battery Separators, Mechanical Integrity and Failure Mechanisms Leading to Soft and Hard Internal Shorts. Sci. Rep. 2016, 6, 32578. [Google Scholar] [CrossRef] [PubMed]
  8. Sahraei, E.; Hill, R.; Wierzbicki, T. Calibration and finite element simulation of pouch lithium-ion batteries for mechanical integrity. J. Power Sources 2012, 201, 307–321. [Google Scholar] [CrossRef]
  9. Greve, L.; Fehranbach, C. Mechanical testing and macro-mechanical finite element simulation of the deformation, fracture, and short circuit initiation of cylindrical Lithium ion battery cells. J. Power Sources 2012, 214, 377–385. [Google Scholar] [CrossRef]
  10. Sahraei, E.; Campbell, J.; Wierzbicki, T. Modeling and short circuit detection of 18650 Li-ion cells under mechanical abuse conditions. J. Power Sources 2012, 220, 360–372. [Google Scholar] [CrossRef]
  11. Gibson, L.J.; Ashby, M.F. Celluar Solids: Structure and Properties; Cambridge University Press: Cambridge, UK, 1997. [Google Scholar]
  12. Zhang, J.; Kikuchi, N.; Li, V.; Yee, A.; Nusholtz, G. Constitutive modeling of polymeric foam material subjected to dynamic crash loading. Int. J. Impact Eng. 1998, 21, 369–386. [Google Scholar] [CrossRef]
  13. Santosa, S.; Wierzbicki, T. Crash behavior of box columns filled with aluminum honeycomb or foam. Comput. Struct. 1998, 68, 343–367. [Google Scholar] [CrossRef]
  14. Santosa, S.P.; Wierzbicki, T.; Hanssen, A.G.; Langseth, M. Experimental and numerical studies of foam-filled sections. Int. J. Impact Eng. 2000, 24, 509–534. [Google Scholar] [CrossRef]
  15. Deshpande, V.S.; Fleck, N.A. Isotropic Constitutive Model for Metallic Foams. J. Mech. Phys. Solids 2000, 48, 1253–1276. [Google Scholar] [CrossRef]
  16. Wang, J.G.; Sun, W.; Anand, S. A microstructural analysis for crushable deformation of foam material. Computat. Mater. Sci. 2008, 44, 195–200. [Google Scholar] [CrossRef]
  17. Wierzbicki, T.; Sahraei, E. Homogenized mechanical properties for the jellyroll of cylindrical Lithium-ion cells. J. Power Sources 2013, 241, 467–476. [Google Scholar] [CrossRef]
  18. Ahn, Y.J. Calibration of Crushable Foam Models for the Jellyroll of Cylindrical Lithium-Ion Batteries. Energies 2024, 17, 1360. [Google Scholar] [CrossRef]
  19. Ahn, Y.J.; Lee, Y.S.; Cho, J.R. Multi-Layered Numerical Model Development of a Standard Cylindrical Lithium-Ion Battery for the Impact Test. Energies 2022, 15, 2509. [Google Scholar] [CrossRef]
  20. Abaqus Reference Manual; R2022x; Dassault Systems Simulia Corp.: Johnston, RI, USA, 2022.
Figure 1. The three-dimensional half-symmetry FE model of (a) a casing, (b) a jellyroll winding with core, (c) a thin-layered winding, and (d) an assembled cylindrical cell.
Energies 17 03357 g001
Figure 2. Crushable foam models with yield surface in the p–q stress plane: (a) the volumetric hardening model and (b) the uniaxial compression curve.
Energies 17 03357 g002
Figure 3. (a) Indentation with the two identical plates. (b) Load–displacement responses for the experiment and the simulation. (c) Von Mises stress distributions in the jellyroll. (d) Von Mises stress distribution in the layered roll.
Energies 17 03357 g003
Figure 4. Effective plastic strain distribution: the jellyroll at (a) 3.5 mm and (b) 7 mm; the thin-layered roll at (c) 3.5 mm and (d) 7 mm.
Energies 17 03357 g004
Figure 5. (a) Indentation by a rigid rod; (b) load–displacement responses for the experiment and the simulation; (c) effective compacting strain distributions in the jellyroll; and (d) effective plastic strain distribution in the layered roll.
Energies 17 03357 g005
Figure 6. (a) Indentation by a spherical punch; (b) load–displacement responses for the experiment and the simulation; (c) effective compacting strain distributions in the jellyroll; and (d) effective plastic strain distribution in the layered roll.
Energies 17 03357 g006
Table 1. Geometric measurements of components.
PartsNeutral Radius (mm)Thickness (mm)Length (mm)
Casing (w/o endcaps)8.90.1831
Jellyroll with core (18 turns)1.43 (starting)0.430
8.9 (ending)
Thin-layered roll (18 turn)1.53 (starting)0.01630
8.9 (ending)
Table 2. Boundary conditions.
PartsBoundary Condition
Casing and center-pinSymmetry condition in the middle plane
JellyrollSymmetry condition in the middle plane at the edge of both the beginning and the ending of the winding
IndenterAll movements constrained except in the vertical direction
Rigid floorAll movements constrained
Table 3. Volumetric crushable foam constants for jellyroll with core.
Parameter E   ( MPa ) ν p k k t
Value150002.71.0
Disclaimer/Publisher’s Note: The statements, opinions and data contained in all publications are solely those of the individual author(s) and contributor(s) and not of MDPI and/or the editor(s). MDPI and/or the editor(s) disclaim responsibility for any injury to people or property resulting from any ideas, methods, instructions or products referred to in the content.

