Abstract
Micro-corona devices could be extensively utilized in gas sensing, switchgear, biomedicine, and other fields. As the influence mechanism of the cathode curvature radius on micro-corona discharge dynamical processes is very important for performance optimization and the promotion of these devices, a micro-scale corona discharge gas model in a mixture of N2-O2 is proposed based on the fluid–chemical mixing method, which describes the dynamic process of the discharge at atmosphere and normal temperatures. To reveal the influence mechanism of the nanowire curvature radius on the micro-corona discharge, the effect of the cathode nanowire radius on the discharge current, electric field, ionization reaction rate, and charged particle characteristics at different gaps and voltages were determined. The findings indicate that the effect of curvature radius on discharge intensity varies under different gap and voltage conditions. Further analysis indicates that an increase in curvature radius reduces the electric field near the tip while increasing the ionization area and secondary emission area as well as the number of positive ions in the space, consequently affecting the coupling process between the collision ionization and the secondary emission. Especially under the conditions of either small gap or low voltage, a suitable increase in the curvature radius could promote the coupling process and then increase the discharge current.
1. Introduction
Micro-corona devices utilize micro–nano tip structures to generate a high field intensity to ionize local gasses and generate current. The micro-scale, local, self-sustaining discharge is between a high-energy breakdown and a non-self-sustaining discharge, resulting in a stable and controllable discharge current, which could be widely used in gas sensing, switchgear, biomedicine, and other fields [1,2,3,4,5]. Due to the micro-discharges caused by the micro–nano tip structure of the cathode, the cathode nano-tip is one of the important factors affecting the micro-discharge process and the performance of micro-corona devices [6,7]. Therefore, to roundly understand the principles and provide theoretical guidance for micro–nano device performance optimization, it is essential to investigate the dynamic influence mechanism of the cathode curvature radius on the discharge of the device.
At present, the mechanism of the micro-scale corona discharge process has been researched through experiments, which can only capture macroscopic electrical characteristics. Nevertheless, numerical simulations enable the observation of alterations in the internal microscopic electrical characteristics. Consequently, most studies on the micro-scale discharge mechanism have utilized a method integrating numerical simulations with experimental verification [8,9,10,11]. In Reference [12], a two-dimensional discharge model for micro-gaps and nano-tips is established, elucidating the dynamic discharge process in the micro–nano field. The study reveals that the discharge attains a dynamic equilibrium through the generation and consumption of positive and negative ions. Several other scholars have found that micro-gap corona discharge is caused by the collision ionization of seed electrons, and then ion collisions lead to electron emissions, or field emissions dominate the development process of discharge [13,14,15]. At the same time, the influence mechanism of the nanowire curvature radius on discharge has also yielded significant advancements. In Reference [16], the influence mechanism of a curvature radius of 0.5 μm to 3 μm on discharge breakdown was studied, and it was found that reducing the curvature radius would enhance the field emission effect, leading to accelerated breakdown development. In Reference [17], the corona characteristics of AC and DC voltage discharge were studied, and it was found that the corona voltage increased with the increase in the curvature radius and electrode gap and that the electrode gap had a greater impact on discharge compared to the curvature radius. In [18], an investigation of simulations and experiments on the breakdown discharge between micrometer airgaps revealed that when the curvature radius is less than 5 μm, the electric field distortion is greatly affected, and the discharge area and breakdown current increase with the curvature radius. In [19], the impact of tip size on the detailed parameters of the current pulse were investigated using fluid mechanics. The study revealed that the pulse rise time, current amplitude, pulse width, and pulse fall time of the tip size increased. At present, most research on the influence of the cathode curvature radius on discharge mechanisms is focused on breakdown states, but the mechanism of corona discharge, that is, the local self-sustaining discharge state, remains insufficiently explored.
In this work, a two-dimensional micro-corona discharge model based on the mixed fluid–chemical method is established to simulate the micro-scale corona discharge process with different curvature radii (0.05–1 μm) in an air atmosphere. The crucial electrical characteristics, such as current density, ionization reaction rate, charged particle characteristics, and electric field, were obtained. Through an analysis of the variations and interactions of these electrical characteristics, the influence mechanism of the cathode curvature radius on micro-corona discharge processes has been revealed.
2. Simulation Model
2.1. Model Description
The micro-corona discharge device is characterized by the field enhancement effect of one-dimensional nano-tip electrode arrays, for which quasi-modeling requires a large amount of computational resources. With the same electrode gap and voltage parameters, the main difference between an array tip and a single tip is that there is a certain shielding effect between the arrays, which results in the electric field at the array tip being lower than that of the single tip, and the overall view of the discharge is still in line with that of a corona discharge [20]. This paper focuses on the effect of tip radius curvature on the discharge process, so the model has been simplified to a corona discharge model with a single tip, as shown in Figure 1. The simulation model consists of a flat plate anode and a cathode with a nanowire. The electrode gap d is the distance from the tip of the nanowire to the plate, while the radius r denotes the curvature of the cathode. The height h of the nanowires is 20 μm, and the two ends of the electrodes are connected to a series RC protection circuit with resistance R1 = 1000 Ω and capacitance C1 = 1 pF.
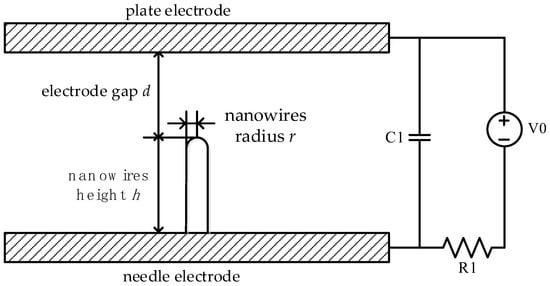
Figure 1.
Schematic diagram of micro-corona discharge simulation model.
To simulate the air discharge environment, nitrogen (N2) and oxygen (O2) were taken as background gasses, and the ratio of N2 to O2 was set to 4:1. To simplify the physical calculation and analysis process, we selected particle types that have a significant impact on the discharge process and chemical reactions that have a substantial influence on the generation and consumption of charged particles. The reaction system was simplified to include the main 21 chemical reactions of the 10 kinds of particles involving e, N2O2, O, N2+, O2+, N4+, O4+, N2O2+, and O2−. The specific reaction formula is shown in Table 1. The collision reaction cross section data were sourced from the LXCat database, and reaction rates of the others were obtained from references [12,21,22,23].

Table 1.
N2-O2 plasma chemical equations.
In the fluid mechanics model, the electron continuity equation is used to describe the electron distribution state; the multicomponent diffusion transport equation is used to describe the distribution state of positive ions, negative ions, and neutral particles; and the Poisson equation is used to describe the spatial potential distribution [12]. The particles on the surface of the electrode will have a surface reaction, the positive ions colliding with the cathode surface will produce secondary electron emission, and the cathode tip part surface under the action of a high field intensity will produce field emission, so the governing equation at the boundary is as follows:
Electron flux equation:
where is the ionic flux; is the heat rate of electrons; is the secondary emission coefficient; is the number of charges of the ith particle; is the Boltzmann constant; is the electron temperature; and is the electron mass.
Ion flux equation:
where is the ion heat rate; is the number density of positive ions; α is the first ionization coefficient; is ionic mobility; and is the mass fraction of the ion.
The secondary electron emission coefficient and secondary electron average energy usually range from 0.001 to 0.5 and 1 to 5 eV [24]. Due to the small electric field near the nanowire sidewall, the likelihood of secondary electron emission caused by the positive ions’ impact is small, and the average initial electron energy is low. The electric field at the tip of the nanowire is stronger, leading to a more intense positive ion collision and secondary emission. Therefore, both the secondary emission coefficient and average initial electron energy are larger in the nanowire tip. The specific surface reaction and its corresponding secondary electron emission coefficient and secondary electron average energy are shown in Table 2 [12].
Table 2.
Surface reaction formula.
The Finite Element Method (FEM) is employed for the model calculations, and it is widely used in various physical fields described by the Laplace and Poisson equation, continuity equations, and Navier–Stokes equations due to the strong adaptability to irregular regions. The accuracy obtained by the FEM is directly associated with the finite element mesh. To enhance the accuracy, a free triangular mesh was selected to divide the reaction space, with a finer division at the nano tip boundary to achieve better convergence. The specific grid size is shown in Table 3. The time step size is variable based on the local error estimates. The range of the time step is from 1 × 10⁻¹⁶ s to 5 × 10⁻⁸ s. To ensure robustness in solving the particle transport problem, a more stable time step method based on the Backward Differentiation Formulas (BDF) is utilized.
Table 3.
Grid size.
2.2. Model Verification
The micro-corona discharge and acquisition circuit is shown in Figure 2. An ITECH IT6576D power (Nanjing, China) supply is used to provide DC voltage in the circuit. The current is measured by a 6482 dual-channel picoammeter with a measuring accuracy of 0.1%, a 1 kΩ 100 W power resistance is used to prevent the gas from breaking down and burning the silicon nanotubes, and the electrode gap is controlled by a micrometer with a resolution of 1 μm. A flat surface silicon wafer with a size of 1 cm × 2 cm is used as the anode of the device, and the silicon nanowire arrays were fabricated using a metal-assisted etching method as the cathode of the device. The surface morphology of the structure was characterized using a JEOL JSM-7000F (Tokyo, Japan) field emission scanning electron microscope. The cross sectional diagram of the nanowire arrays is depicted in Figure 3a, illustrating the nanowire height of approximately 20 μm. The surface characteristic of the nanowires is presented in Figure 3b, with the radius of nanowires measuring about 0.3 μm.
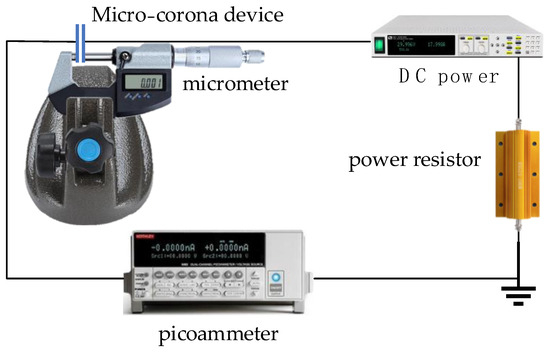
Figure 2.
Discharge experiment system of micro-corona devices.

Figure 3.
Morphology of silicon nanowire array: (a) cross sectional diagram; (b) surface diagram.
To determine the gap, a 50 μm insulation adhesive was adhered to a silicon wafer that was 500 μm thick onto the micrometer measuring rod. The electrode gap is equivalent to the subtraction of twice the insulation adhesive thickness, twice the silicon wafer thickness, and the height of the nanowires from the micrometer reading. To ensure the parallelism of the two electrodes, another micrometer was utilized to measure their gap at multiple locations of the top and bottom. To avoid physical contact between the plate electrode and some of these nanowires, which could lead to an abnormal I-V curve, the insulation degree of both plates was measured before and after voltage measurement. In the experiment, the data were recorded when the current stabilized after each voltage application. The final experimental result was determined as the average value of the data measured in 5 experiments. To ensure data reliability, three sets of silicon wafers and nanowire arrays were used as electrodes to repeat the experiment.
Due to the challenge of accurately controlling the nanowire radius, this work only verifies the discharge when the nanowire radius r = 0.3 μm. When the fixed voltage is 180 V and the regulating electrode gaps range from 5 μm to 30 μm with a step length of 5 μm, the simulation results and the discharge current of each group of silicon wafers as measured by experiments vary with gaps as shown in Figure 4a. Similarly, when the fixed gap is 10 μm and the applied voltages range from 160 V to 200 V with a step length of 10 V, both the simulation and experimental results vary with the voltages as shown in Figure 4b. Although there are slight variations in the discharge current values among the three groups of silicon wafers due to difficulties in achieving consistent nanowire array morphology and wafer assembly during the experimentation, it can be observed that their variation trends align closely with those obtained through simulation. This qualitative alignment reflects positively on the accuracy of the simulation model.
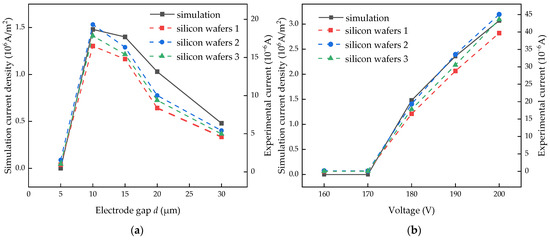
Figure 4.
Comparison of experimental and simulation results at different scales: (a) different gaps; (b) different voltages.
3. Calculation Results and Analysis
To analyze the influence of the curvature radius on corona discharge in the microgap, the discharge conditions have been studied for the electrode gaps of 5 μm, 8 μm, 10 μm, 15 μm, 20 μm, and 30 μm at the fixed voltage of 180 V and for the voltages of 160 V, 170 V, 180 V, 190 V, and 200 V at the fixed gap of 10 μm. The discharge process has been simulated when the curvature radius r is 0.05 μm, 0.075 μm, 0.1 μm, 0.2 μm, 0.3 μm, 0.5 μm, and 1 μm.
3.1. Influence of Curvature Radius on Discharge Current
Discharge current is an important reference for measuring the discharge performance of micro-corona devices. The variation in current density with curvature radius under different radii is shown in Figure 5a. The current density presents different change patterns at different gaps with the increase in curvature radius. When the electrode gap d > 10 μm, the current density decreases with the increase in the curvature radius. For an electrode gap d = 5 μm, there is almost no discharge observed. According to the Townsend discharge theory, electrons originate from the cathode and ionize gas molecules along the direction of the electric field, leading to the formation of an electron avalanche process. The current can be calculated using Formula (5) as follows [25]:
where i is the discharge current; i0 is the initial current generated by space seed electrons; α is the ionization coefficient; and d is the electrode gap. It is evident that the current exponentially increases with the electrode gap. When the electrode gap is too small, it reduces the total collision ionization times of electrons from the cathode to the anode. This insufficiently develops the electron multiplication process, resulting in a very small current. At an electrode gap of d = 10 μm, the current density increases first and then decreases with the increase in the curvature radius. When d = 8 μm, no discharge occurs for a curvature radius r < 0.3 μm; however, when the curvature radius r ≥ 0.3 μm, discharge starts, and the current density also increases first and then decreases with the increase in the curvature radius, which is not consistent with the law that the discharge current is positively correlated with the electric field. Furthermore, Reference [19] also reported that within a range of cathode radius, the current amplitude increases with the increase in curvature radius when the voltage is fixed. The change curve of current density with curvature radius under different voltages is shown in Figure 5b. When voltage V0 > 180 V, the current density decreases with the increase in curvature radius, which has a similar change trend to that of d > 10 μm when V0 = 180 V. At voltage V0 = 160 V, there is approximately no discharge. When the voltage V0 = 170 V, the change law is similar to that of d = 8 μm when V0 = 180 V; that is, when the curvature radius r < 0.5 μm, there is no discharge. However, for curvature radius r ≥ 0.5 μm, discharges begin and show an increasing trend as the radius of curvature increases.
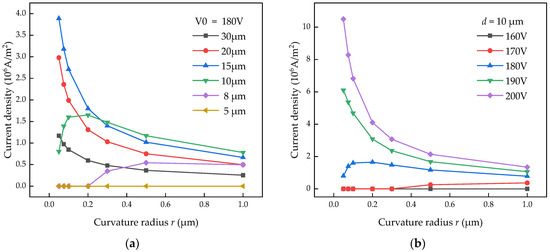
Figure 5.
Variation in current density with curvature radius: (a) under different gaps; (b) under different voltages.
The curvature radius has different effects on the discharge intensity under different gaps and different voltages, with similarities in the role of voltage and gap. To explore the spatio-temporal coupling mechanism between the radius of curvature and the discharge effect, this paper will analyze in detail the influence of different cathode curvature radii on the development process of micro-corona discharge.
3.2. Influence of Curvature Radius on Discharge Process
3.2.1. Electric Field
The electric field intensity directly affects the ionization intensity, particle motion rate, and other factors. The electric field value at the tip is directly related to the field enhancement factor. The field enhancement factor is calculated as follows:
In the formula, h is the height of the nanowire electrode, r is the radius of curvature, and d is the electrode gap. The field enhancement factor is inversely proportional to the radius of curvature and the electrode gap. Therefore, the electric field at the tip of the influence decreases with the increase in radius of curvature and increases with the decrease in the gap. When d = 10 μm and V0 = 170 V, the structure with a curvature radius r ≤ 0.3 μm failed to discharge, while corona discharge occurred in structures with small electric field strength at r = 0.5 μm and r = 1.0 μm, resulting in discharge current. Similar results were observed under conditions of d = 8 μm and V0 = 180 V. Indicating that the curvature radius affects the discharge field strength, the tip field strength is not the only factor that determines the discharge current.
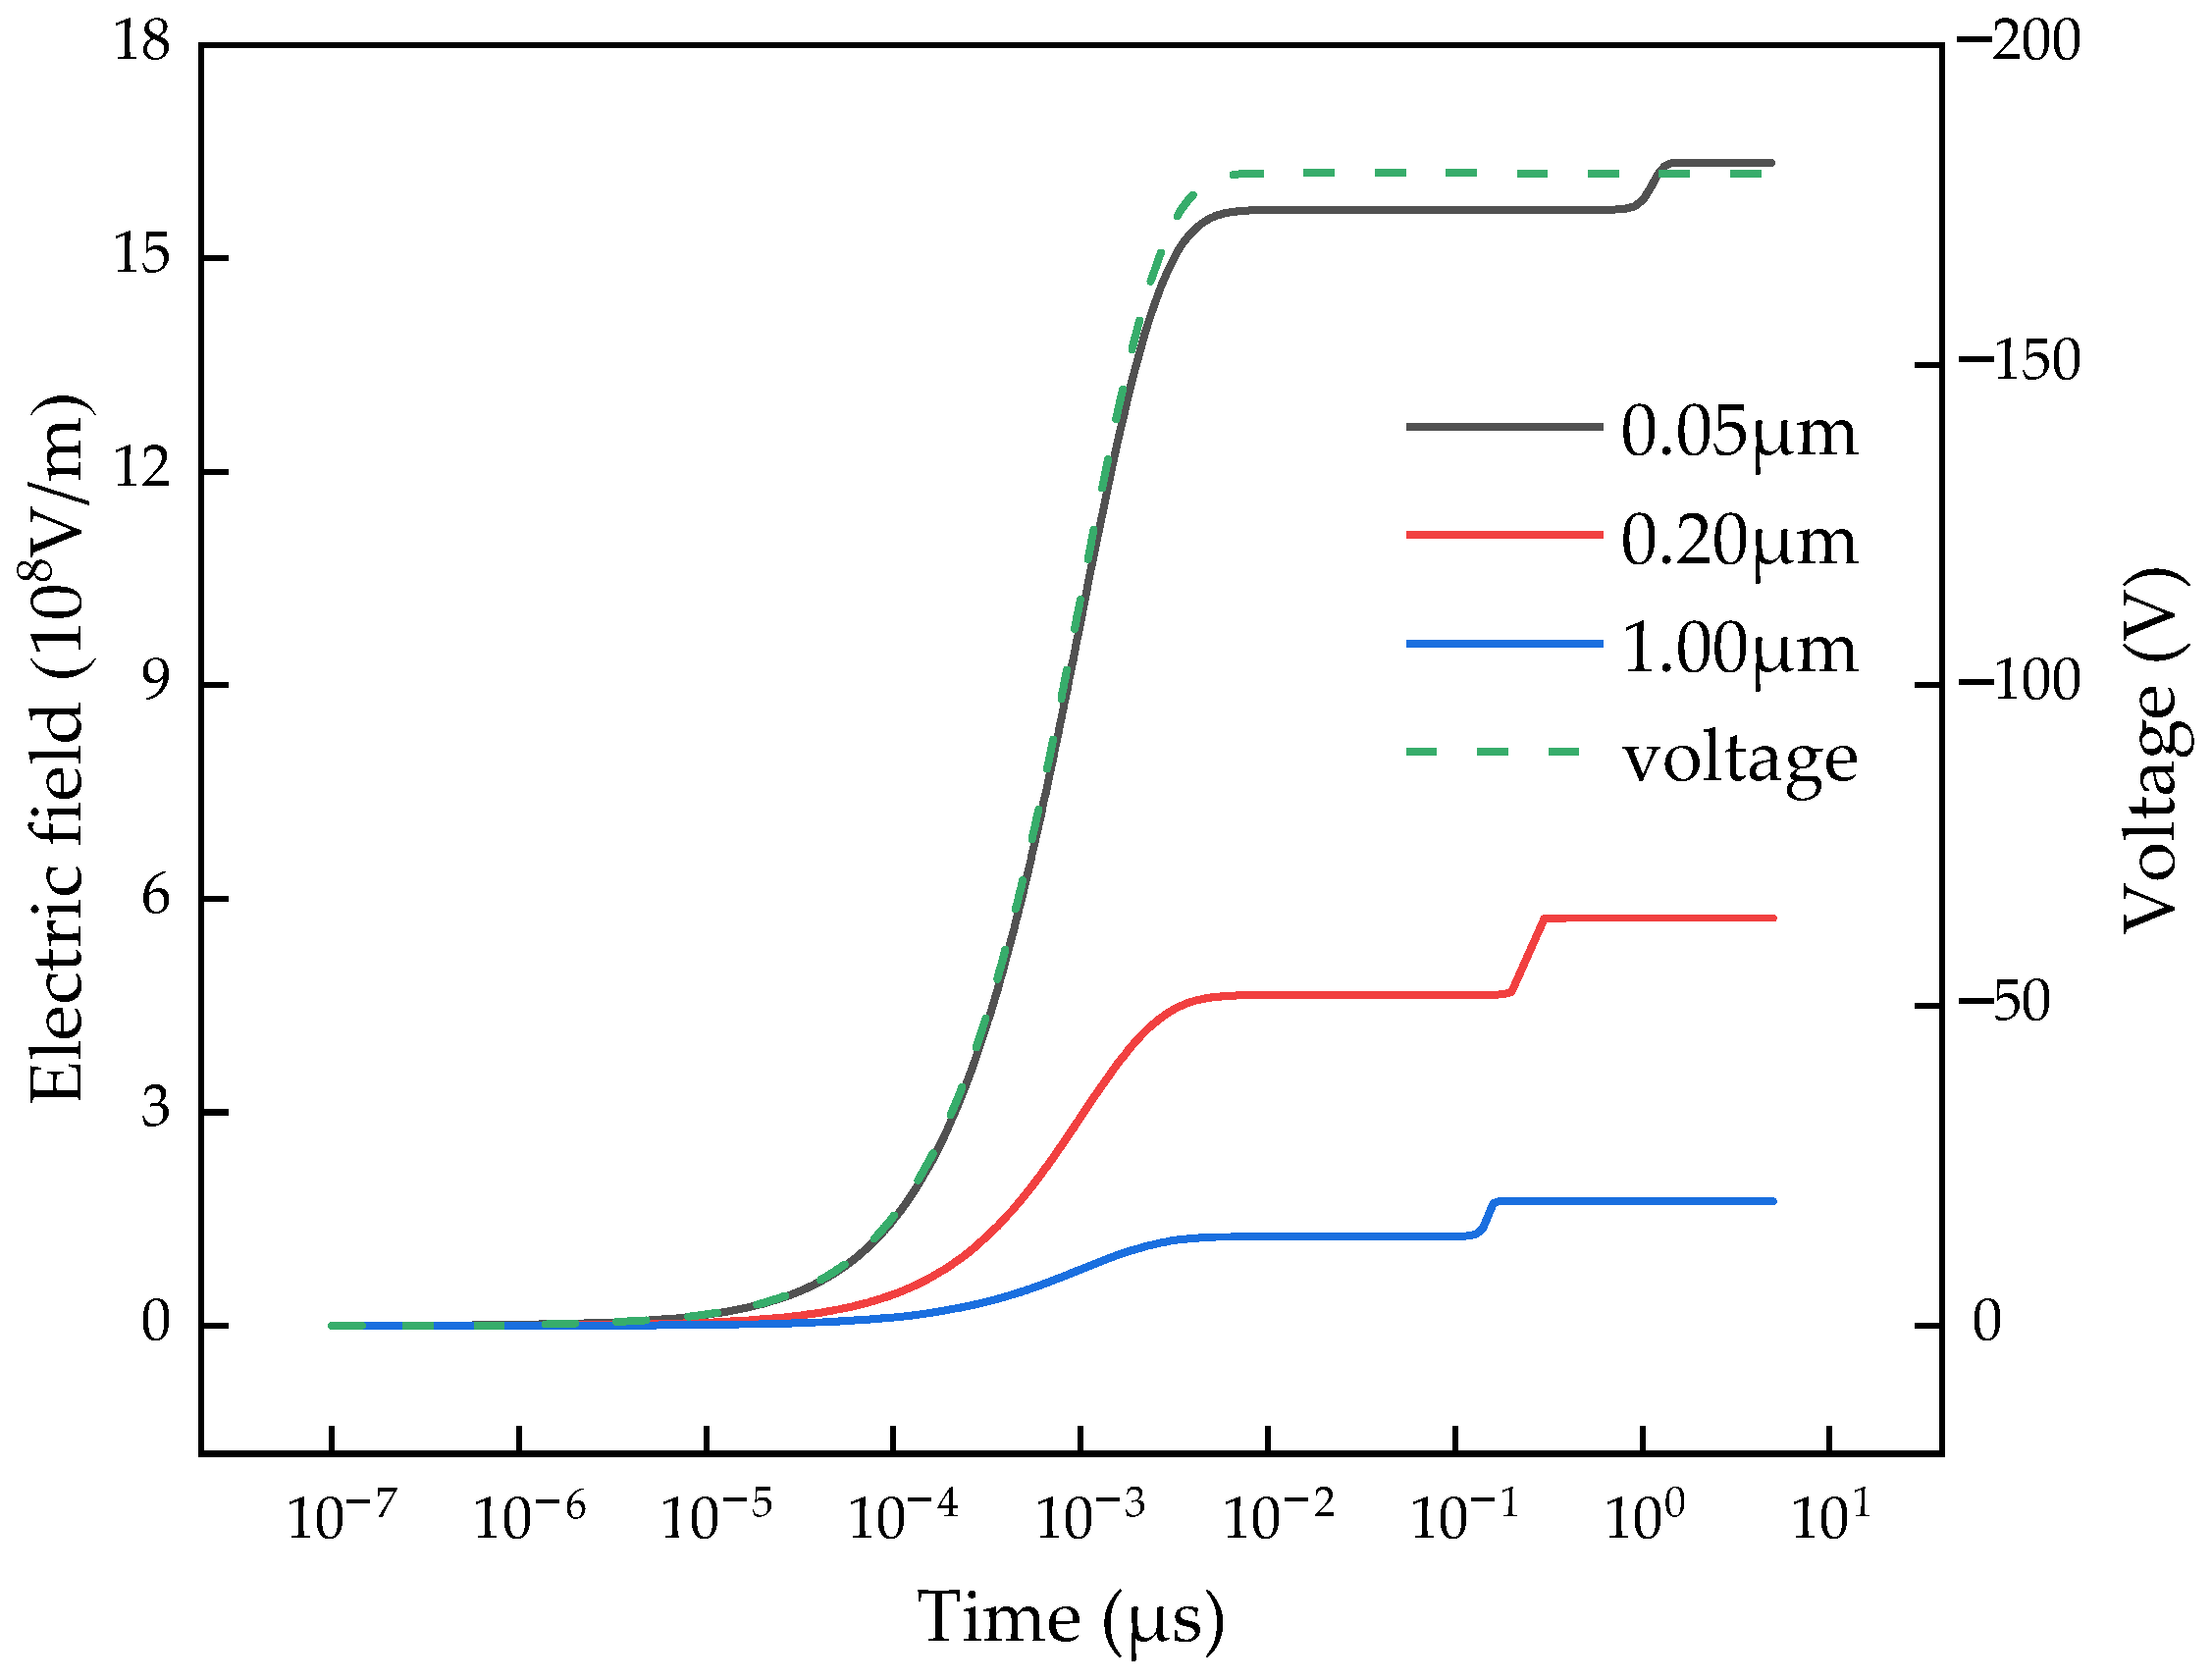
The variation in the electric field with time and space is further analyzed. In Figure 5, with the increase in the curvature radius, the discharge current of the structure with a 180 V time interval of 10 μm has both an increase and a decrease process, and the changing trend is obvious. Therefore, the electric field of the current change trend turning point r = 0.2 μm and the curvature radius structure r = 0.05 μm and r = 1 μm are compared and analyzed. The variations in electric field and voltage at the tips of these structures over time are depicted in Figure 6. It can be observed that the changes in the electric field exhibit similarities across all three structures. In terms of spatial distribution, the electric field rapidly rises to a certain value and maintains this level for a period before experiencing a second increase to its peak value; thereafter, it almost remains constant. This is because the electric field is primarily determined by the applied voltage at the initial stage of discharge (pre-discharge phase). As the voltage gradually increases, so does the electric field at the tip. When the voltage reaches its peak, there is an increase in the ionization intensity of the gas in space. The positive ions generated by this process show a reinforcing effect on the cathode electric field, while the negative ions show a weakening effect on it. However, there are not enough ions to change the tip’s field strength at this time, so it remains unchanged for a period of time.
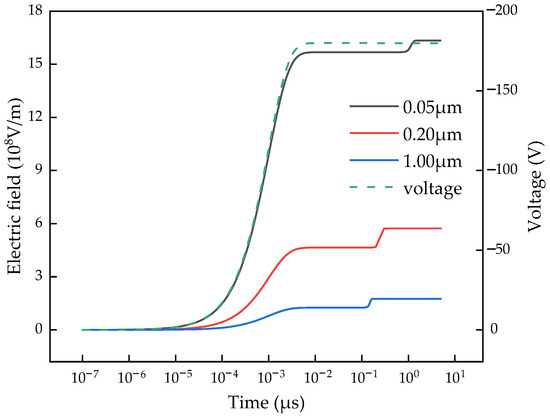
Figure 6.
Variation in electric field and voltage at the tip of three radius structures with time.
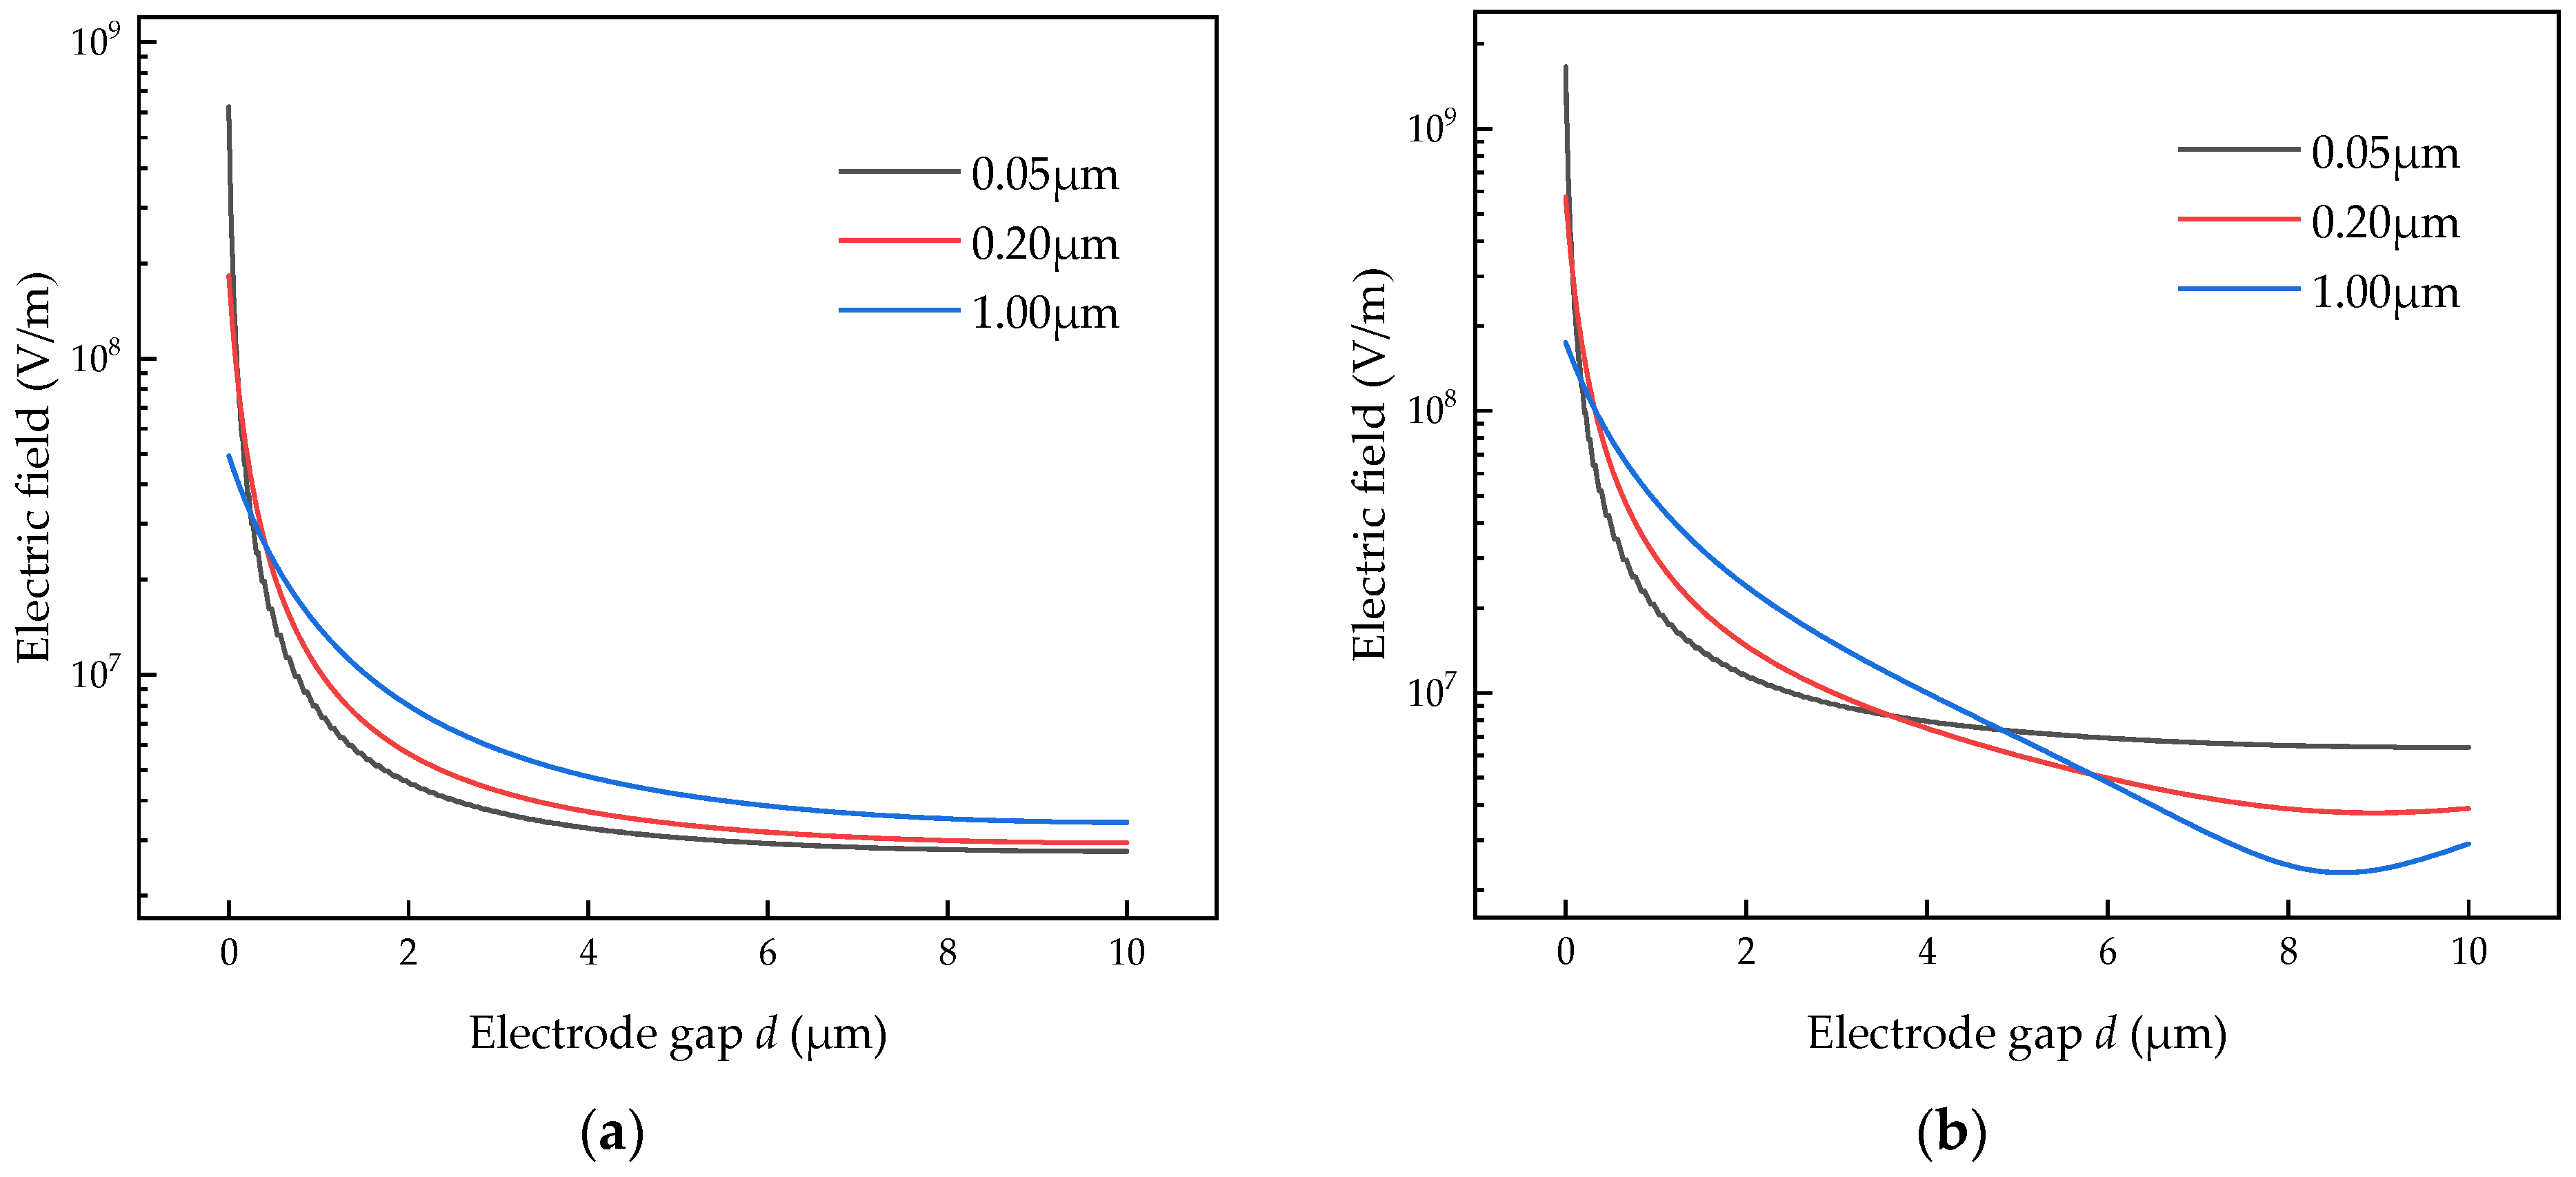
The variation in the electric field at the central axis of the three structures at different times with pole gaps is depicted in Figure 7. At 0.5 ns, the electric field near the tip decreases as the curvature radius increases, while the opposite is observed in space. This indicates that even during the pre-discharge phase, a small amount of electric charge is sufficient to change the electric field distribution in space. At 5 μs, there are changes in electric field intensity near the tip, and when the electrode gap in space is less than 5–6 μm, the results are similar to the pre-discharge phase. However, when the electrode gap in space exceeds 5–6 μm, there is a decrease in the electric field with an increase in the curvature radius. This phenomenon can be attributed to positive ions being close to the cathode nano-tip and negative ions being close to the anode plate. A weakening of the electric field between these ion groups is observed when the electrode gap is less than 5–6 μm, excluding the near-the-tip region, while enhancing the electric field between the negative ion group and the anode plate.
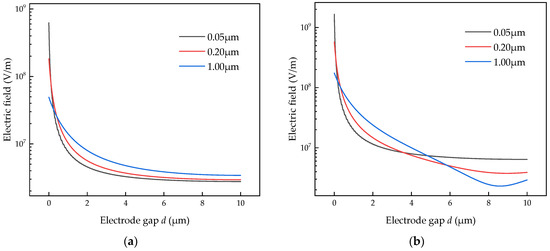
Figure 7.
Variation in the electric field at the central axis of the three structures at different times with pole gap: (a) t = 0.5 ns; (b) t = 5 μs.
The field strength near the tip is predominantly influenced by the nanostructure, leading to a decrease with increasing curvature radius. Conversely, the electric field in space is primarily affected by charge distribution, and as the curvature radius increases, so does the impact of charge on spatial electric field distribution.
3.2.2. Ionization Reaction Rate
The electric field directly influences the ionization reaction rate, and this rate reflects the ionization intensity. Therefore, to further explore the factors influencing discharge current, the dynamic analysis of the changing process of ionization reaction rate is conducted. The three curvature structures with a voltage of 180 V and a gap of 10 μm are also taken as examples.
Figure 8a shows the spatial ionization rate distribution at the time t = 0.5 ns. It is evident that as the curvature radius increases, the ionization rate in space decreases, while the ionization area expands. This is because in the pre-discharge phase, the RC protection circuit causes a gradual voltage rise, resulting in a low field intensity near the tip. As a result, only a small amount of gas near the tip is ionized, leading to a low ionization rate, and the ionization does not develop into space. At this time, the increase in the curvature radius of the tip leads to a reduction in the electric field in its vicinity, thereby diminishing the energy acquired by electrons and weakening the ionization intensity. Simultaneously, an increased radius of curvature expands the field distortion range caused by the nanowire electrode, consequently widening the ionization channel and expanding the ionization area. Figure 8b illustrates the distribution of the spatial ionization rate at t = 5 μs, representing the late stage of the discharge development. The ionization rate shows an increase with the curvature radius, exhibiting a contrary trend to that observed at 0.5 ns. This is because as the voltage rises, the electric field increases, and the positive ions produced by ionization move to the cathode tip for secondary electron emission. The newly generated electrons move towards the cathode for collision ionization, and the positive ions produced by ionization will cause the secondary electron emission, so reciprocally, the ionization rate in space increases rapidly until the charge disappearance and production reach dynamic equilibrium. At this time, within the structure of a large curvature radius, the ionization area in the space is larger, and more positive ions are produced in the space. The positive ions, in turn, serve to enhance the electric field in space and facilitate ionization. In addition, the increase in the curvature radius leads to an increase in the effective collision area of the cathode tip, which together lead to an increased collision of the positive ions with the cathode, resulting in a significant increase in secondary electron emission and ionization rate in space.
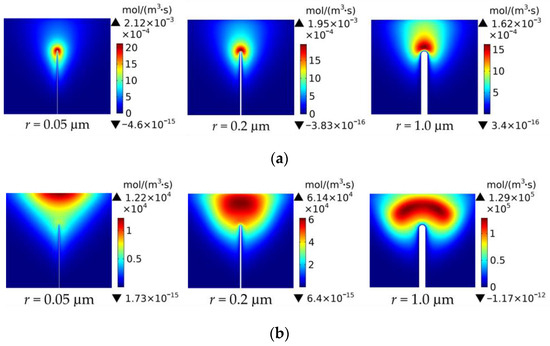
Figure 8.
Ionization rate distribution of the three structures at different times: (a) t = 0.5 ns; (b) t = 5 μs.
Although the increase in the curvature radius reduces the electric field of the tip and the ionization reaction rate in the initial stage of discharge, it also increases the ionization channel and the effective collision area of the cathode. Consequently, the ionization area in space expands, and the ionization rate increases after the development of discharge.
3.2.3. Charged Particle Characteristics
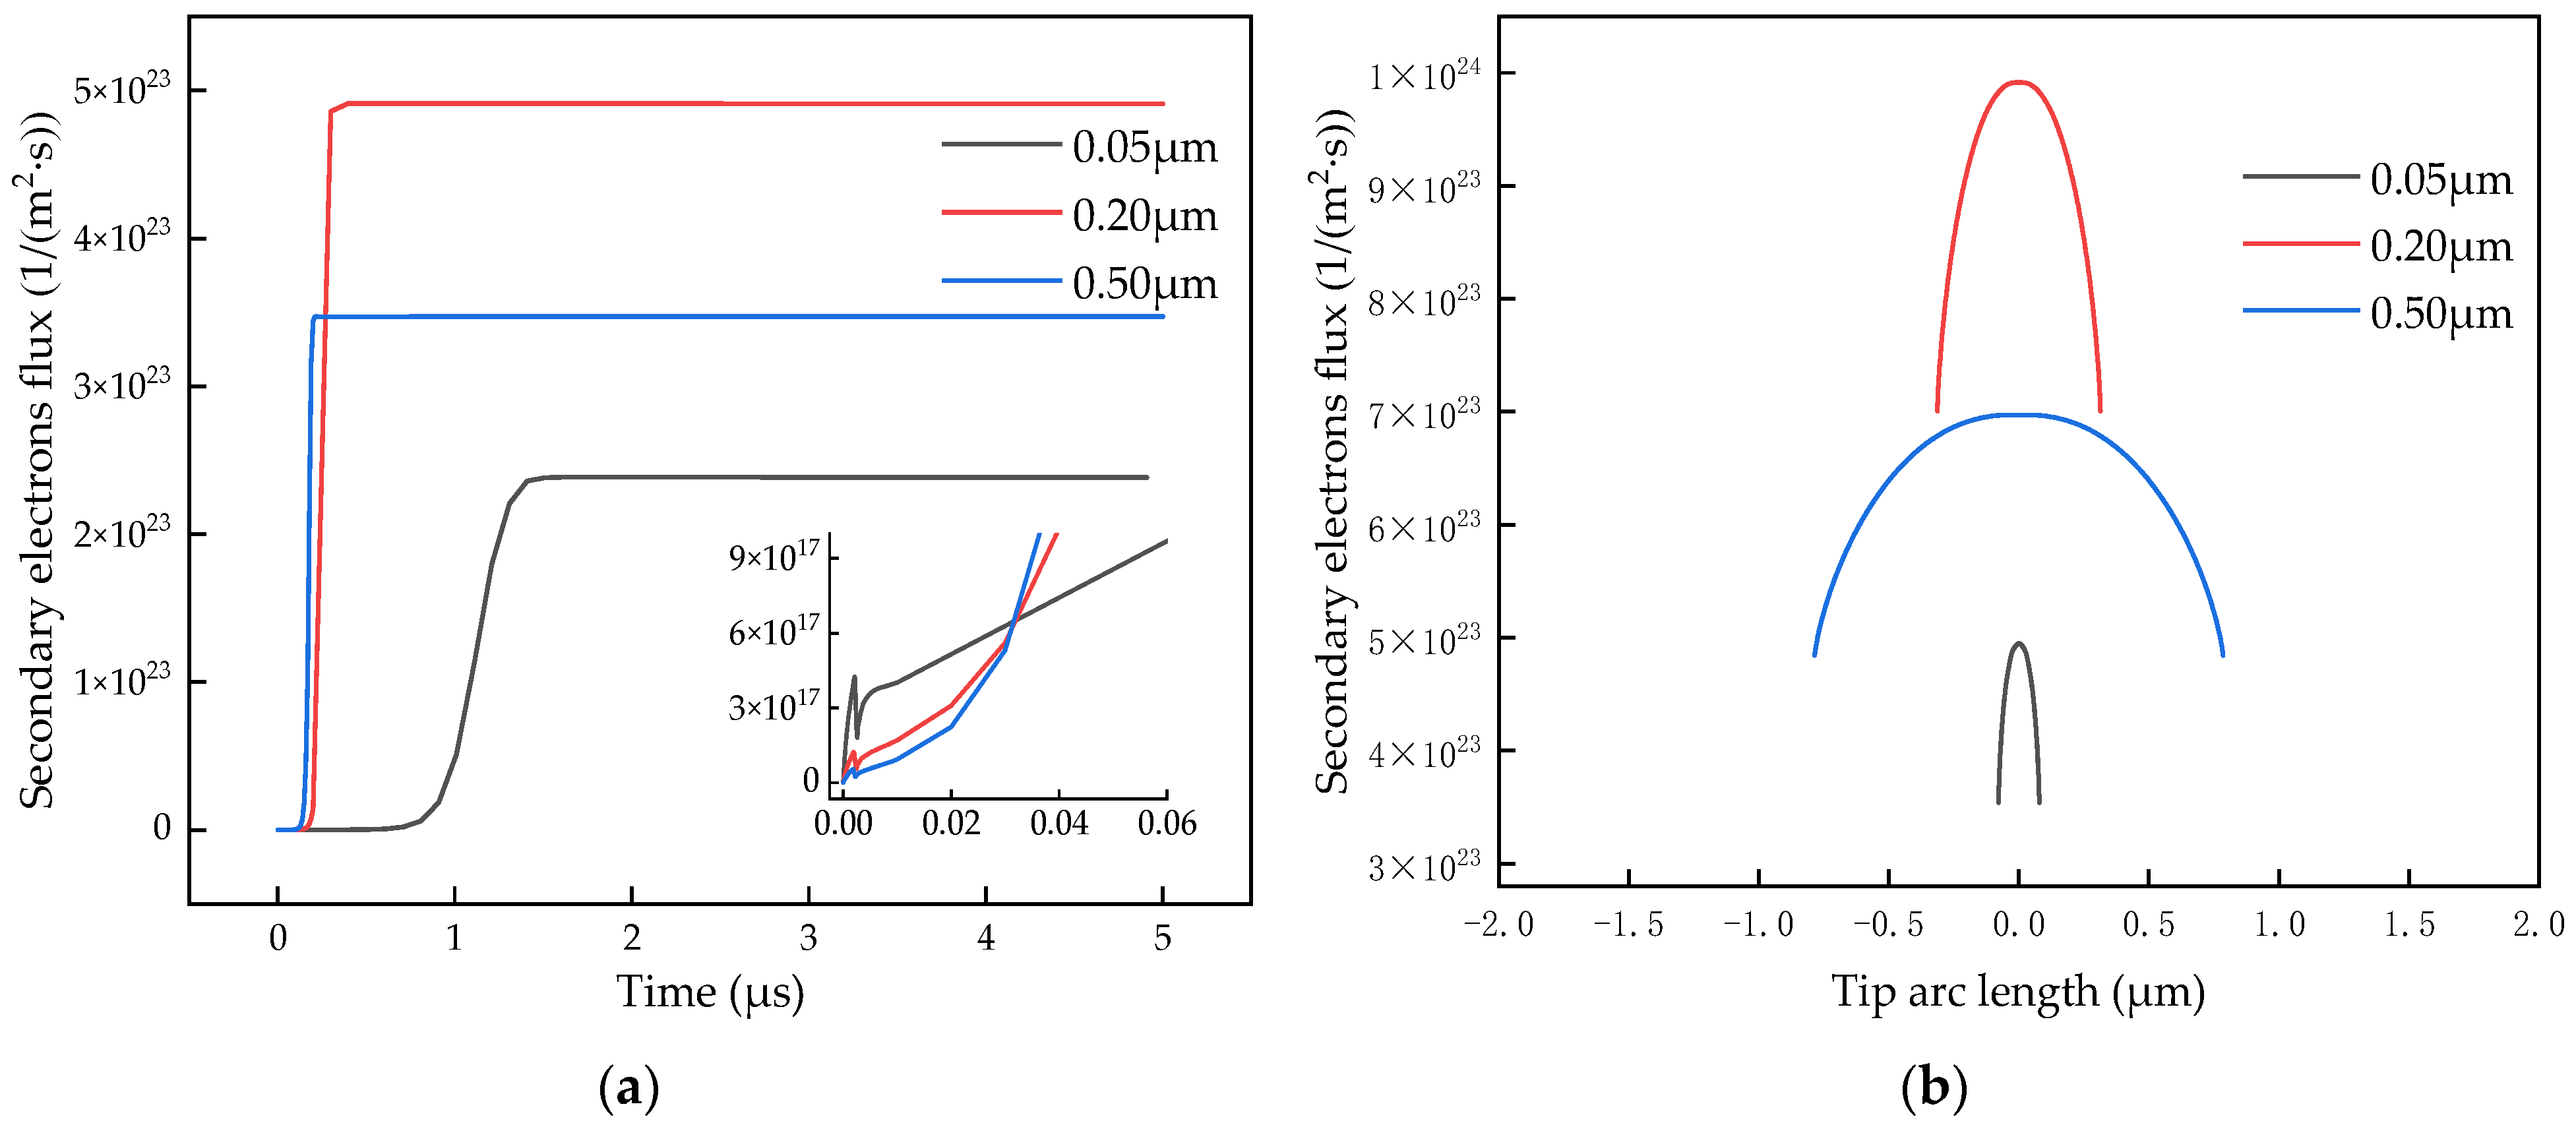
Secondary electrons are the primary factor in maintaining discharge. The flux of the secondary electron is analyzed with V0 = 180 V and d = 10 μm. Figure 9a shows the temporal change curve of the secondary electron flux at the tip. When the time is less than 0.03 μs, the emission flux reaches its maximum with a curvature radius of 0.05 μm, corresponding to the pre-discharge stage mentioned in Section 3.2.2 where the emission quantity is solely related to the electric field. When the time is greater than 0.03 μs, the electron emission flux of the three structures surges and finally reaches a stable value. When the curvature radius is 0.2 μm, the electron emission flux reaches the maximum. With the increase in the curvature radius, the electron emission flux first increases and then decreases, which is like the change law of current density. Figure 9b illustrates the variation curve of secondary emission flux with tip arc length under three structures during discharge stabilization time, taking the midpoint of the tip as 0 scale. The emission area of the tip will also increase when the curvature radius increases, so the overall secondary electron flux increases. Since the secondary electrons in this field are mainly produced by the positive ions colliding with the cathode, the characteristics of the positive ions are further analyzed.
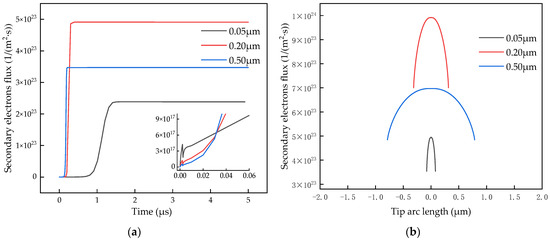
Figure 9.
The secondary electrons flux curve: (a) varies with time at the tip; (b) the t = 5 μs time varies with arc length.
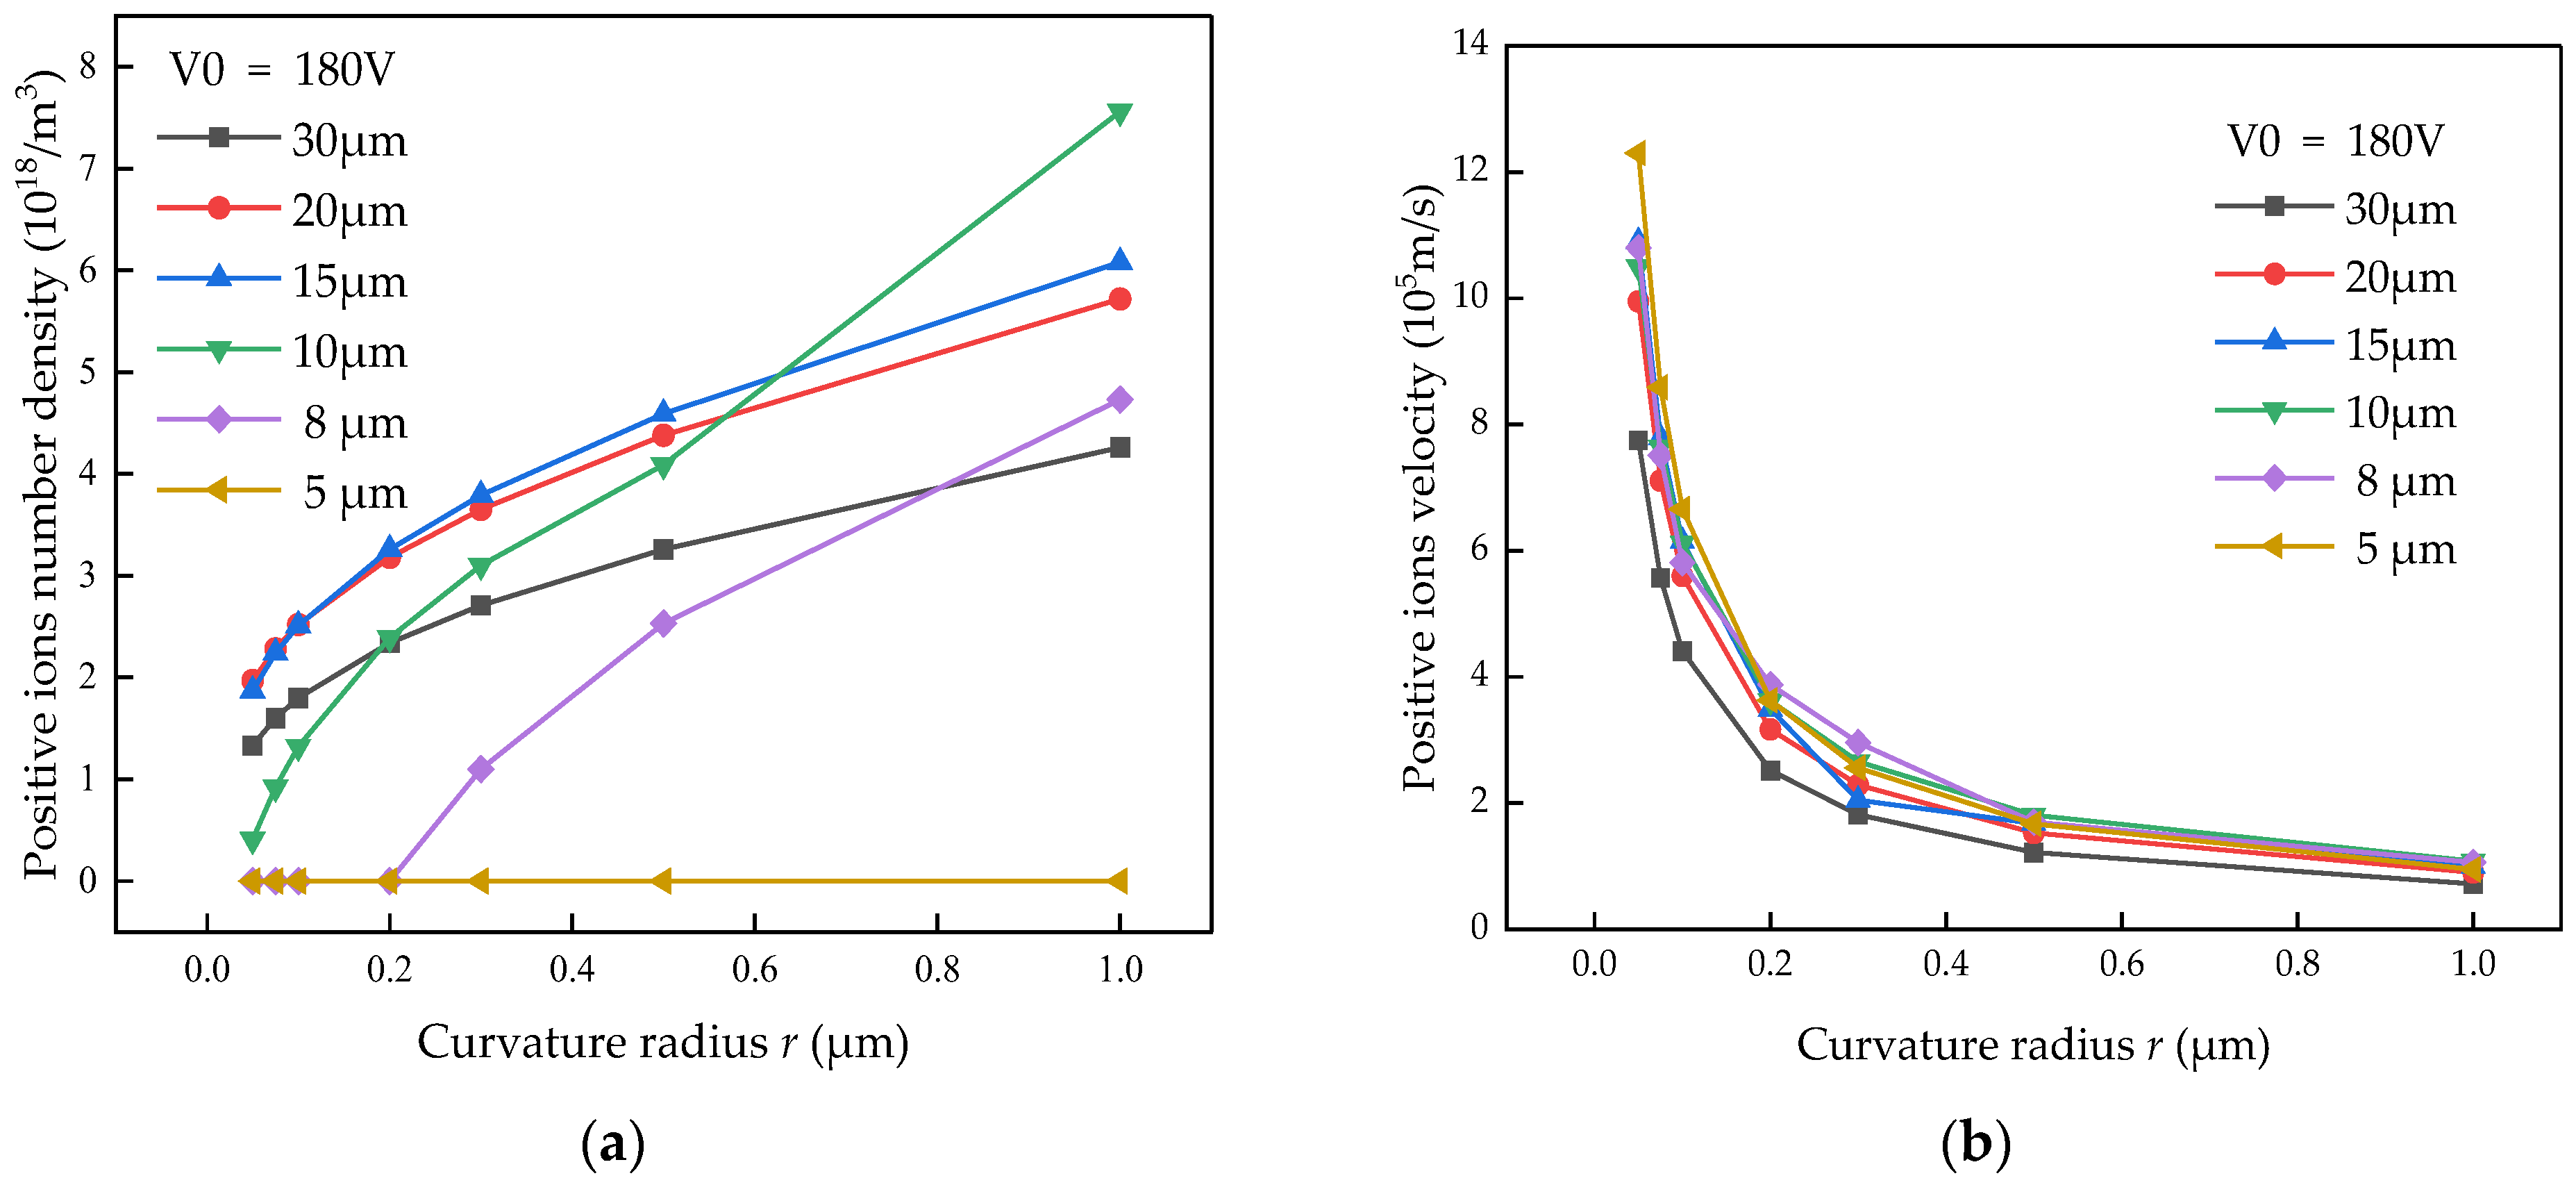
The ion flux at the tip is represented by formula (3), and the number density and motion rate of positive ions have a positive correlation with the ion flux. Using a voltage of 180 V across all structures as an example, the curve of the average positive ion number density in space with the curvature radius is shown in Figure 10a. Regardless of the change law of the current density, the number density of positive ions always increases with the increase in curvature radius. This can be attributed to the increase in ionization rate and ionization area in space as the curvature radius increases, as indicated by the above analysis. The maximum velocity of the positive ions in space is illustrated in Figure 10b. The velocity of the positive ions decreases as the curvature radius increases because the velocity of positive ions is determined by the electric field of the tip, which diminishes with the increase in curvature radius. The energy released by the positive ions is positively correlated with their motion rate. Therefore, as the radius of curvature increases, the energy released by a single positive ion colliding with the cathode tip decreases. However, at the same time, the effective collision area of the cathode and the number density of positive ions increase, leading to an overall increase in the total number of positive ions colliding with the cathode. The overall energy released is influenced by both factors, impacting the flux of secondary electron emission. Therefore, as the radius of curvature increases, the charged particle flux at the tip of the nanowire can both increase and decrease.

Figure 10.
Variation in the positive ions number density with the curvature radius at different gaps: (a) number density; (b) velocity.
3.3. Analysis and Discussion
The influence of the curvature radius on the corona discharge process is reflected in two aspects. First, an increase in curvature radius leads to a decrease in the electric field intensity at the tip of the nanowire. As a result, the velocity of the positive ions decreases, and the energy released when colliding with the cathode tip also decreases. This ultimately leads to a decrease in impact ionization intensity at the initial stage of discharge. Second, an increase in curvature radius expands the field distortion area and the effective emission area of the cathode. This expansion leads to an increased ionization area and the production of more positive ions during collision processes. Consequently, there is an increase in the number of positive ions at the collision tips, which produces more secondary emission electrons that promote the gas ionization in space. At the same time, an increase in the number of ions could also lead to an increase in the spatial field intensity. This process could further facilitate the ionization of space gas.
In the micro-gap discharge, there are two cases where the cathode tip electric field is enough to ionize the gas, but ionization cannot develop, thus there is no discharge current. First, when there is sufficient voltage, but the gap is too small, such as 8 μm in Figure 5, the ionization space becomes limited, and charged particles quickly enter the electrode, resulting in a reduced number of positive ions produced by collision. Second, when the gap is large enough, but the voltage is small, such as 170 V as shown in Figure 5b, although the ionization space is large enough, the ionization strength is weak, resulting in a smaller number of positive ions produced by ionization in the space. Therefore, in these two cases, the secondary emission process caused by the positive ions is weak, leading to challenges in discharge development. In such cases, increasing the curvature radius can increase the ionization area and the secondary emission area, thereby enhancing the number of secondary emissions to promote the development of ionization and generate discharge. However, when the ionization space is large enough and there are enough seeds provided by the secondary emission, that is, when the collision ionization process (α) and the secondary emission process (β) are coupled well, increasing the curvature radius would weaken their coupling degree, ultimately reducing current density.
4. Conclusions
In this study, a two-dimensional micro-corona simulation model was established based on the fluid–chemical mixture, and the influence mechanism of the nanowire curvature radius on corona discharge in the micro-gap gas discharge was studied. The following conclusions were drawn:
- (1)
- The electric field at the tip of the nanowires is not the only factor determining the discharge current. The curvature radius affects not only the electric field but also the emission area. The polar gap impacts not only the spatial electric field but also the growth of collision ionization. The discharge current is a result of the time-coupled effects of the electric fields, collisions, and emissions.
- (2)
- The increase in curvature radius will reduce the electric field near the tip of the nanowires and reduce the pre-discharge ionization intensity. Simultaneously, it will increase the ionization area and the secondary emission area, leading to an increase in the number of the secondary emission electrons, promoting space ionization during the development of discharge. The positive ions generated by ionization further promote the secondary emission, subsequently reciprocating, resulting in an overall increase in positive ions within the space.
- (3)
- The discharge intensity is not strictly proportional to the curvature radius or the static electric field intensity under conditions of a small gap and a low voltage. While reducing the curvature radius of the nanowires can increase the electric field of the tip, appropriately increasing it can enhance the coupling of the collision ionization and the secondary emission process, leading to an increase in the discharge current. However, there is a competitive interval for the discharge parameters under weak discharge conditions, indicating that the curvature radius cannot be increased indefinitely.
Author Contributions
Conceptualization, J.Z. and B.Z.; methodology, J.Z. and H.P.; software, B.Z.; validation, Z.L. and B.Z.; formal analysis, Y.Y.; resources, J.Z., Y.Y. and H.P.; data curation, Z.L.; writing—original draft preparation, B.Z. and J.Z.; writing—review and editing, J.Z.; funding acquisition, J.Z. All authors have read and agreed to the published version of the manuscript.
Funding
This research was funded by Shaanxi Natural Science Basic Research Program (2023-JC-QN-0452) and the China Postdoctoral Science Foundation (2018M643811XB).
Data Availability Statement
The original contributions presented in this study are included in the article; further inquiries can be directed to the corresponding author.
Conflicts of Interest
The authors declare no conflicts of interest.
References
- Kim, J.Y.; Kaganovich, I.; Lee, H.-C. Review of the Gas Breakdown Physics and Nanomaterial-Based Ionization Gas Sensors and Their Applications. Plasma Sources Sci. Technol. 2022, 31, 033001. [Google Scholar] [CrossRef]
- Fu, Y.; Zhang, P.; Verboncoeur, J.P.; Wang, X. Electrical Breakdown from Macro to Micro/Nano Scales: A Tutorial and a Review of the State of the Art. Plasma Res. Express 2020, 2, 013001. [Google Scholar] [CrossRef]
- Nazemi, H.; Joseph, A.; Park, J.; Emadi, A. Advanced Micro- and Nano-Gas Sensor Technology: A Review. Sensors 2019, 19, 1285. [Google Scholar] [CrossRef]
- Macheret, S.O.; Tholeti, S.S.; Alexeenko, A.A. Low Pressure Microplasmas Enabled by Field Ionization: Kinetic Modeling. Appl. Phys. Lett. 2016, 108, 194102. [Google Scholar] [CrossRef]
- Abedini Sohi, P.; Kahrizi, M. Low-Voltage Gas Field Ionization Tunneling Sensor Using Silicon Nanostructures. IEEE Sens. J. 2018, 18, 6092–6096. [Google Scholar] [CrossRef]
- Venkattraman, A. Theory and Analysis of Operating Modes in Microplasmas Assisted by Field Emitting Cathodes. Phys. Plasmas 2015, 22, 057102. [Google Scholar] [CrossRef]
- Lee, W.C.; Fang, Y.; Turner, J.F.C.; Bedi, J.S.; Perry, C.C.; He, H.; Qian, R.; Chen, Q. An Enhanced Gas Ionization Sensor from Y-Doped Vertically Aligned Conductive ZnO Nanorods. Sens. Actuators B Chem. 2016, 237, 724–732. [Google Scholar] [CrossRef]
- Sun, Z.; Shao, Z.K.; Sun, X.; Sun, W.F. Trichel Pulse Characteristics and Mechanism of Negative Corona Discharge in Sub-Millimeter Gaps. Phys. Plasmas 2023, 30, 063901. [Google Scholar] [CrossRef]
- Wang, D.; Du, L.; Yao, C. Statistical Study on Space Charge Effects and Stage Characteristics of Needle-Plate Corona Discharge under DC Voltage. Energies 2019, 12, 2732. [Google Scholar] [CrossRef]
- Ren, X.; Jiang, X.; Yang, G.; Huang, Y.; Wu, J.; Yang, Z. Effect of Environmental Parameters on Streamer Discharge in Short Air Gap between Rod and Plate. Energies 2022, 15, 817. [Google Scholar] [CrossRef]
- Li, S.; Wang, F.; Wang, Q.; Ouyang, L.; Chen, X.; Li, J. Numerical Modeling of Branching-Streamer Propagation in Ester-Based Insulating Oil Under Positive Lightning Impulse Voltage: Effects From Needle Curvature Radius. IEEE Trans. Dielect. Electr. Insul. 2023, 30, 139–147. [Google Scholar] [CrossRef]
- Chai, Y.; Zhang, N.; Liu, J.; Yin, N.; Liu, S.-L.; Zhang, J.-Y. Two-dimensional simulation of dynamic characteristics of N2–O2 corona discharge at micro scale. Acta Phys. Sin. 2020, 69, 165202. [Google Scholar] [CrossRef]
- Garner, A.L.; Loveless, A.M.; Dahal, J.N.; Venkattraman, A. A Tutorial on Theoretical and Computational Techniques for Gas Breakdown in Microscale Gaps. IEEE Trans. Plasma Sci. 2020, 48, 808–824. [Google Scholar] [CrossRef]
- Sun, Y.; Wang, L.; Dong, K.; Liu, X. Research on Ion Enhancement Effect in Micro-Gap Gas Discharge. J. Phys. Soc. Jpn. 2020, 89, 094501. [Google Scholar] [CrossRef]
- Go, D.B.; Venkattraman, A. Microscale Gas Breakdown: Ion-Enhanced Field Emission and the Modified Paschen’s Curve. J. Phys. D Appl. Phys. 2014, 47, 503001. [Google Scholar] [CrossRef]
- Meng, G.; Ying, Q.; Wang, K.; Gao, X.; Cheng, Y. The Influence of the Cathode Radius on the Microgap Breakdown in Air Based on PIC/MCC Simulation. In Proceedings of the 2019 IEEE Conference on Electrical Insulation and Dielectric Phenomena (CEIDP), Washington, DC, USA, 20–23 October 2019; IEEE: Richland, WA, USA, 2019; pp. 769–772. [Google Scholar] [CrossRef]
- Ma, Z.; Zhou, Y.; Xia, J.; He, X.; Zhao, L.; Shen, B.; Bian, X. Experimental Study on Corona Onset Characteristics of Small Curvature Electrode Under Combined AC–DC Voltages. IEEE Trans. Dielect. Electr. Insul. 2022, 29, 1785–1794. [Google Scholar] [CrossRef]
- Chang, Z.; Meng, G.; Ying, Q.; Cheng, Y. Study on the influence of cathode radius on the breakdown characteristics across microgaps in air. Trans. China Electrotech. Soc. 2023, 38, 1032–1041. [Google Scholar] [CrossRef]
- Zhang, L.; Sheng, G.; Hou, H.; Song, H.; Jiang, X. Influence of Protrusion Tip Size on Current Pulse Characteristics of Negative Corona Discharge Based on Numerical Simulation. IEEE Trans. Power Deliv. 2022, 37, 3792–3802. [Google Scholar] [CrossRef]
- Ma, X.; Chen, L.; Wang, Y.; Wang, W.; Zhang, X. Microplasma Emission Performances Dependent on Silicon Nanowires Morphologies. J. Phys. D Appl. Phys. 2022, 55, 395201. [Google Scholar] [CrossRef]
- Kossyi, I.A.; Kostinsky, A.Y.; Matveyev, A.A.; Silakov, V.P. Kinetic Scheme of the Non-Equilibrium Discharge in Nitrogen-Oxygen Mixtures. Plasma Sources Sci. Technol. 1992, 1, 207–220. [Google Scholar] [CrossRef]
- Feng, N.; Ma, T.; Chen, C.; Yao, B.; Gao, W. Simulation and Study of DC Corona Discharge Characteristics of Bar-Plate Gap. Energies 2022, 15, 6431. [Google Scholar] [CrossRef]
- Pan, Z.; Zhang, Y. Gas Discharge Mechanism of Weakly Ionized Gas Sensor Using Nanomaterials. Ionics 2021, 27, 389–395. [Google Scholar] [CrossRef]
- Snoeckx, R.; Setareh, M.; Aerts, R.; Simon, P.; Maghari, A.; Bogaerts, A. Influence of N2 Concentration in a CH4/N2 Dielectric Barrier Discharge Used for CH4 Conversion into H2. Int. J. Hydrog. Energy 2013, 38, 16098–16120. [Google Scholar] [CrossRef]
- Xu, X.; Chu, D. Gas Discharge Physics, 1st ed.; Fudan University Press: Shanghai, China, 1996; pp. 87–95. [Google Scholar]


Disclaimer/Publisher’s Note: The statements, opinions and data contained in all publications are solely those of the individual author(s) and contributor(s) and not of MDPI and/or the editor(s). MDPI and/or the editor(s) disclaim responsibility for any injury to people or property resulting from any ideas, methods, instructions or products referred to in the content. |
© 2024 by the authors. Licensee MDPI, Basel, Switzerland. This article is an open access article distributed under the terms and conditions of the Creative Commons Attribution (CC BY) license (https://creativecommons.org/licenses/by/4.0/).