Article

Thermochemical Valorization of Plastic Waste Containing Low Density Polyethylene, Polyvinyl Chloride and Polyvinyl Butyral into Thermal and Fuel Energy

by
Beata Jabłońska
1,*,
Gabriela Poznańska
2,
Paweł Jabłoński
3 and
Joanna Zwolińska
4
1
Institute of Environmental Engineering, Faculty of Infrastructure and Environment, Czestochowa University of Technology, Brzeźnicka St. 60a, 42-200 Częstochowa, Poland
2
HIG Polska Sp. z o.o., Niedźwiedziniec St. 18, 41-506 Chorzów, Poland
3
Faculty of Electrical Engineering, Czestochowa University of Technology, Armii Krajowej 17, 42-200 Czestochowa, Poland
4
Center for Advanced Technology, Adam Mickiewicz University, Wieniawskiego St. 1, 61-712 Poznań, Poland
*
Author to whom correspondence should be addressed.
Energies 2024, 17(14), 3458; https://doi.org/10.3390/en17143458
Submission received: 4 June 2024 / Revised: 1 July 2024 / Accepted: 11 July 2024 / Published: 13 July 2024

Abstract

:
Pyrolysis is a promising technology for transforming waste plastics (WPs) into high-value products. In the near future it will play a key role in the circular economy, as a sustainable and environmentally friendly method of managing this waste. Although the literature reports on the pyrolysis of plastics, it is focused on pure polymers. On the other hand, the state-of-the-art knowledge about the pyrolysis of mixed and contaminated WPs is still scarce. Industrial waste processing usually uses polymer mixtures containing various impurities that influence the pyrolysis process during chemical WPs recycling. In the paper the pyrolysis of three types of WPs: low density polyethylene (LDPE), polyvinyl chloride (PVC) and polyvinyl butyral (PVB) from repeated mechanical recycling of plastics, as well as their binary and ternary mixtures, is considered. The influence of particular components on the pyrolysis process is analyzed. The aim is to determine synergistic behavior of the mixtures during the pyrolysis process, which is important for increasing the efficiency and quality of the obtained bioproducts. Methods such as thermogravimetric (TG/DTG) analysis coupled with Fourier transform infrared spectroscopy (FTIR) and mass spectroscopy (MS) are used. The variations in the initial and final temperature of pyrolysis, mass loss and mass loss rate are determined. The content of PVC significantly lowers the initial temperature and mass loss and increases the final temperature. The pyrolysis of the considered mixtures shows a noticeable synergism—in the initial stage of pyrolysis up to a temperature around 450 °C, the mass loss is accelerated compared to what is predicted by simple superposition. The inhomogeneity of the mixtures as well as the waste origin causes a significant variation in the activation energy. Three main conclusions are obtained: (i) if the waste does not contain PVC, the pyrolysis is nearly complete at a temperature around 500 °C at a heating rate of 10 °C/min, whereas PVC is not fully processed even at 995 °C; (ii) the synergistic effects affect significantly the pyrolysis process by accelerating some steps and lowering the activation energy; and (iii) the presence of PVC noticeably lowers the temperature of the first stage of PVB pyrolysis. The investigation results prove that chemical recycling of mixed LDPE, PVC and PVB waste can be an effective method of plastic waste management.

1. Introduction

Plastics are ubiquitous in people’s daily lives and are widely used in almost every industry [1]. Every year the world produces around 367 Mt of plastics, and by 2034 this number is expected to double [2,3]. The global production of plastics is constantly increasing, which generates an increasing amount of plastic waste. In recent years, also as the result of the COVID-19 pandemic, the excessive production of personal protective equipment and plastic waste from healthcare facilities has increased. The high resistance of plastics to biodegradation in the natural environment means that the rate of their degradation is very low. Most of the commonly used polymers do not degrade quickly enough under the influence of environmental factors such as water, sunlight, air or as a result of decomposition by microorganisms; therefore, the degradation process of polymers is supposed to last from 60 to 1000 years [3,4]. The high resistance of plastics to external factors results from their high molecular weight, hydrophobicity and the content of various additives, such as stabilizers and antioxidants, which usually extend the life of polymers [5]. They often also contain various types of toxic and carcinogenic plasticizers, pigments and flame retardants, which causes an additional threat from waste plastics (WPs) [6,7].
Currently, the pollution of the natural environment with plastics has become a global problem, because they are basically everywhere—in inland waters, seas, oceans, in the water and soil environment, and even in the organisms of animals and humans [7]. In addition, the global production of plastics and the incineration of plastic waste generates about 400 Mt of CO2 annually, also contributing to adverse climate change [8].
According to the Environmental Investigation Agency (EIA), the destruction of the environment caused by plastics is irreversible and poses a threat to civilization and the Earth’s fundamental ability to maintain a livable environment [9]. In order to avoid damage caused by WPs, first of all it is necessary to improve the management system of this waste by introducing new environmentally friendly methods of its disposal. Currently, the efforts are undertaken to transform the plastics economy from a linear one, in which post-consumer plastics are usually subjected to energy recovery or storage, to a circular and climate-neutral economy [2]. Such an economic model puts the emphasis primarily on maximizing the use of already existing plastic resources by increasing the amount of recyclates from mechanical recycling, as well as intensifying chemical recycling as a method of obtaining new raw materials for the production of polymers, while reducing the demand for non-renewable raw materials [10,11]. In comparison to mechanical recycling, chemical recycling allows for processing even heterogeneous and contaminated plastic waste [12], for which mechanical recycling techniques are ineffective (e.g., for multi-layer plastic packaging).
Pyrolysis is one of the methods of thermal-chemical recycling in which long chains of polymers break down into smaller and less complex particles at high temperatures in a deoxygenated atmosphere. The conversion of plastic waste into a mixture of hydrocarbons by pyrolysis has now generated great interest among scientists, as it allows for the procurement of new raw materials for the production of high-quality polymers or chemical hydrocarbons and can replace conventional fuels [13,14,15]. Moreover, the use of pyrolysis to degrade plastics minimizes the problem of storing this waste and its negative impact on the environment. Compared to traditional combustion, the pyrolysis process allows the transformation of pyrolysis gases into high-value chemicals and reduction CO2 emissions generated in the process by approximately 5% [16]. For example, the value of the global warming potential calculated in [17] for the pyrolysis process of surgical masks into liquid tar was 0.244 kg CO2eq/kg, and for combustion 2.53 kg CO2eq/kg, which indicates that the pyrolysis process is more environmentally friendly. Due to the variability of the composition of the raw materials subjected to pyrolysis, the mechanism of chemical transformations occurring during the pyrolysis process is often complex and multi-stage, and the products formed during these transformations are difficult to identify precisely [18,19]. The parameters affecting the course of the polymer pyrolysis process are the type of raw material, the residence time of the degraded polymers in the reactor, the temperature of the process, the partial pressures of hydrocarbons, the heating rate, the type of catalyst used, and others [20,21]. Depending on the selection of these parameters and the conditions of the pyrolysis process, products of various quality can be obtained; therefore, detailed studies on plastic degradation before its use for bioenergy production are necessary. For example, increasing the pyrolysis temperature causes an increase in the gas fraction and a decrease in the wax fraction in the resulting products [22]. Depending on the type of mixed plastic waste and pyrolysis conditions, the efficiency of the process is quite diverse, and the obtained products, both gaseous and liquid, are mixtures of many different compounds. For example, the breakdown of polyolefins in the pyrolysis process is accompanied with a random mechanism of bond breaking, resulting in a mixture of linear olefins and paraffins with a wide boiling range, the so-called wide hydrocarbon fraction [23]. In general, thermal degradation mechanisms involve depolymerization, side-group elimination, random chain scission and oxidation of the polymer [24]. Analysis of thermal properties during the pyrolysis process of WPs enables the identification of compounds and products formed during thermal degradation of polymers [25,26].
Recently, the interest of researchers in the use of the pyrolysis process for chemical recycling of plastics from municipal and other waste has increased [27]. Currently, chemical recycling is perceived as a technology that perfectly responds to the need to obtain new raw materials for the production of polymers and to increase the degree of recycling of inhomogeneous plastics in a circular economy [28,29,30]. Thermal-chemical recycling technologies make it possible to manage contaminated and/or mixed polymer waste that is not suitable for mechanical recycling. They also allow for net negative CO2 emissions, which is a beneficial process in the context of global warming [28,31].
Numerous scientific publications on the processing of mixed plastic waste indicate that liquid fractions obtained by any method of polymer degradation are not suitable for direct use as a fuel or chemical component. For example, by examining the pyrolysis efficiency of mixed plastics from the DKR-350 stream sorting category (rigid/foil polyethylene, rigid/foil polypropylene (PP), polyethylene terephthalate (PET), polystyrene (PS), multilayer flexible, and plugged materials), it was observed that the presence of significant amounts of PET (above 33 wt.%) in this waste stream negatively impacts the production of product susceptible to condensation and promotes the formation of solid products in excess of expected projected values [27]. Therefore, the process of pyrolysis of mixed polymer waste requires further research, which will contribute to determining the mechanism of thermal transformations of plastics, selection of appropriate conditions for conducting this process, as well as the input material [27,32]. Choosing the right polymer processing method requires a deeper understanding of the combustion mechanisms, as different polymers behave differently under the influence of heat (e.g., have different emission factors), and therefore not all types of waste polymers can be processed with the same method [33]. Recent studies on the pyrolytic conversion of WPs into value-added products (e.g., for pyro-oil, wax) have mainly focused on testing raw materials such as high-density polyethylene (HDPE), low-density polyethylene (LDPE), PP, PS, PET and polyester-elastane (PES-EL) [27,33,34,35,36,37]. However, the research is focused mainly on the pyrolysis of pure polymers or segregated plastic waste (e.g., plastic bottles or household items).
Until now, the literature has not considered mixtures of LDPE, polyvinyl chloride (PVC) and polyvinyl butyral (PVB), which are also often found in mixed polymer waste. For example, LDPE is used to make bags, food foils, bottle caps, PVC—in pipes, linings, syringes, catheters and drains used in medicine, while PVB foil has been used in the automotive industry, in inks for ribbons and others. It is now known that chemical recycling methods allow the use of heterogeneous polymer waste as a raw material. However, the recycling is particularly difficult due to mineral fillers, various additives like flame retardants and plasticizers present in plastic waste. Besides, different plastics exhibit different reactivity and the synergy between various plastic components in multiphase conversion processes is not fully explored [29]. Plastic waste made of LDPE, PVC and PVB after several mechanical recycling cycles, also containing various contaminants and additives, is an example of a troublesome waste stream. The lack of basic understanding of the reactions occurring in the thermal decomposition processes of mixed polymer waste is definitely one of the main factors limiting the future development of chemical recycling.
The aim of this work is to analyze the behavior of single and mixed WPs, in particular LDPE, PVC and PVB, during the pyrolysis process. At the same time, using analytical methods such as FTIR and MS integrated with thermogravimetric analysis, their thermal decomposition was identified and individual stages of thermal degradation of these polymers were visualized and evaluated. These studies also identified intermediate products formed during thermal conversion and polymer interaction, which is of particular importance for the sustainable management of these wastes and increasing the efficiency of their conversion into thermal or fuel energy.

2. Materials and Methods

2.1. Materials

Three WPs were used for the tests: LDPE, PVC and PVB, which were obtained from plastic waste recycling plants after several cycles of mechanical recycling. Granulates of LDPE and PVC polymers were obtained from Polimer Sp. z o.o., Solec Kujawski, Poland and waste PVB foil from Saint Gobain, Courbevoie, France. The mechanically recycled regranulates do not meet the quality requirements (e.g., in terms of melt flow index (MFI), melting point, color); therefore, they are not suitable for re-use as a raw material for the production of new plastic products. In turn, PVB foil is a post-production waste generated during glass lamination in the automotive industry. PVB is used in the production of car windshields as an adhesive to connect individual layers; therefore, it most often contains plasticizers in an amount of about 30% (alkyl phthalates) that give the foil properties similar to rubber.
The samples were washed and dried to remove moisture, and then ground in a 6875 Freezel/Mill cryogenic mill (Cole-Parmer, Metuchen, NJ, USA) to a mesh size of less than 1 mm (Figure 1) in order to obtain homogeneous two- and three-component mixtures. Several binary and ternary mixtures of all three WPs were prepared in accordance with mass proportions given in Table 1.

2.2. Experimental

Analyses of physical and chemical properties were carried out in accordance with the applicable standards as follows:
  • Total moisture content (Wa) was determined in the analytical sample by the gravimetric method in accordance with CEN/TS 15414-1:2010 [38] based on the measurement of the weight loss of the sample while heating it at a temperature of 105–110 °C until the mass remained unchanged;
  • Ash content (Ashd) was determined by the gravimetric method in accordance with PE-EN ISO 3451-1 [39]; the samples were ashed and calcined to a constant weight at 600 °C for 30 min in an FCF22S muffle furnace by CZYLOK, Jastrzębie-Zdrój, Poland;
  • The content of volatile matter (VMdaf) was found based on the difference in mass of the sample placed at a temperature of 900 °C (for 7 min) in an air-free environment [40]. The weight loss, except for moisture which evaporates in the form of water vapor, is the content of volatile substances;
  • The actual density of the material was detected in accordance with PN-EN ISO 1183 [41] using a liquid pycnometer placed in a thermostat together with the sample (2 g) for 30 min;
  • The basic elemental composition (Cd, Hd, Nd) was determined by the method of high-temperature combustion with IR detection on a CHN 828 analyzer by Leco, St. Joseph, Michigan, USA in accordance with PN-EN ISO 21663:2021-06 [42];
  • Sulfur content (Sd) was found using the high-temperature combustion method with IR detection on the CS 580 analyzer by Eltra, Bydgoszcz, Poland in accordance with PN-EN ISO 21663:2021-06 [42];
  • The oxygen content was calculated as follows: Od = 100% − (Ashd + Cd + Nd + Hd + Sd), where: O—oxygen content (%), Ashd—ash content (%, dry basis), C—carbon content (%), N—nitrogen content (%), H—hydrogen content (%), and S—sulfur content (%);
  • Heat of combustion ( Q s ) was measured using the calorimetric method on an isoperiobolic calorimeter (6400 Calorimeter by Parr, Moline, IL, USA) in accordance with PN-EN ISO 21654:2021-12 [43]; the measurement consisted of determining the heat of combustion of the tested sample at a constant volume and temperature of 25 °C by burning certified benzoic acid;
  • Total chlorine content (Cld) on a dry basis was detected using the method of high-temperature combustion in an HF-210 Horizontal Furnace (Mitsubishi Chemical Analytech, Tokyo, Japan), coupled with the Dionex Aquion ion chromatograph (Thermo Scientific, Waltham, MA, USA) in accordance with PN-EN 15408:2011 [44].
Analyses of individual physicochemical quantities were performed three times (each series of measurements was carried out in the same way), and the arithmetic mean was calculated.
To study the pyrolytic behavior of WPs, TG-FTIR analyzers were used, which were performed on a STA6000 analyzer coupled with a FTIR Frontier, PerkinElmer, Waltham, MA, USA. The samples were placed in a ceramic crucible and heated at a rate of 10 °C/min in the temperature range of 25–995 °C. In addition, the samples of single components, 1:1 binary and 1:1:1 ternary mixtures were heated at two rates of 20 and 30 °C/min. Measurements were carried out in a nitrogen atmosphere with a flow rate of 20 mL/min. Products formed during the pyrolysis of WPs from the TG analyzer were blown into the FTIR analyzer with capillary bundles. The temperature of the transfer line and the FTIR measurement cell was 260 °C to prevent condensation of the emitted gases. FTIR spectra were measured using an MCT detector (TL8000, PerkinElmer) in the range of 4000–450 cm−1, with a resolution of 4 cm−1 and 16 scans. The Spectrum software (PerkinElmer) was used to record the spectra.
TG-MS analyzes were performed on a Pyris TGA1 apparatus (PerkinElmer) coupled with a quadrupole mass spectrometer MS Clarus 680 SQ8, PerkinElmer. Samples weighing 10–25 mg were placed in ceramic crucibles and heated to 995 °C. The measurements were carried out at a heating rate of 10 °C/min in a helium atmosphere at a flow rate of 40 mL/min. The transfer line and source temperature were 210 °C and 180 °C, respectively. The range of measured mass to charge ratios (m/z) was 10–300 amu.

2.3. Synergy Effects

To assess the effect of synergy, the model TG/DTG curves based on simple blending for the considered mixtures were constructed as follows:
T G m = γ L D P E T G L D P E + γ P V C T G P V C + γ P V B T G P V B ,
D T G m = γ L D P E D T G L D P E + γ P V C D T G P V C + γ P V B D T G P V B ,
where superscript “m” stands for “model”, γ L D P E , γ P V C and γ P V B are LDPE, PVC and PVB fractions in the mixtures ( γ LDPE + γ PVC + γ PVB = 1 ) given in Table 1. Then the following differences are calculated:
Δ T G = T G T G m ,
Δ D T G = D T G D T G m .
Positive values of ΔTG and ΔDTG mean that the experimental values of mass loss and mass loss rate, respectively, are higher than those predicted by simple superposition. Hence, positive values indicate desired synergy effects, whereas negative values mean unwanted synergy effects.

2.4. Kinetic Model for a Multi-Step Mechanism

Since the experimental DTG curves contained usually several peaks, it was necessary to assume a multi-step mechanism of the pyrolysis. To separate individual peaks, one of the deconvolution methods was used. The asymmetric double sigmoidal function (ADSF) was used to describe each peak in the DTG curve. The function has the following form [45]:
A D S F x ; w 1 , w 2 , w 3 = 1 1 + exp x + w 1 / 2 w 2 1 1 1 + exp x w 1 / 2 w 3 ,
where w 1 ,   w 2 ,   w 3 are shape parameters related to the width and position of the peak. Various values of these parameters result in a variety of symmetric and asymmetric shapes, which are suitable for modelling real peaks in DTG curves.
In the first step, the DTG curve of each sample was represented in terms of time as follows:
D T G c t = p = 1 P I p A D S F ( t t 0 p ; w 1 p , w 2 p , w 3 p ) ,
where P is the assumed number of peaks in the measured DTG curve, parameter I p is related with the intensity of the peak, and parameter t 0 p is related with peak position. The least squares method (via Microsoft Office Excel 2019 Solver add-in) was used to determine 5 P parameters (five parameters I p ,   t 0 p ,   w 1 p ,   w 2 p ,   w 3 p per peak). In the next step, each peak was processed as for a single-step mechanism. The degree of conversion, α p , related to peak p is evaluated as follows:
α p = m i p m t p m i p m f p ,
where m i p , m f p and m t p are the initial mass, final mass and temporal mass at time t , respectively, for p -th peak (calculated based on the deconvolution). The rate of conversion for each peak, d α p / d t , is assumed to be proportional to a certain function f α p depending on the assumed kinetics model as follows:
d α p d t = k T f α p ,
where k ( T ) is the reaction rate, expressed with the Arrhenius equation:
k T = A p exp E a p R T ,
where A p is the so-called preexponential factor (min−1), E a p is the activation energy (J·mol−1), R is the universal gas constant (≈8.31 J·mol−1·K−1), and T is temperature (K).

2.5. Activation Energy

The activation energy E a for each peak was calculated based on two isoconversional methods: the Friedman method and the Starink method [46,47]. Three temperature programs with a heat rate β equal to 10, 20 and 30 °C/min were used. After deconvolution as described above, the peaks for each program were grouped into triples containing peaks for each temperature program. This allowed the use of the above-mentioned isoconversional methods.
The Friedman method is a differential method based on Equations (8) and (9). After transformation the final relationship may be written as follows:
ln d α d t   α , β = ln A α , β f α E α R T α , β ,
where E α denotes the energy activation (for p -th peak) at a conversion degree of α . For an assumed value of α , a set of points 1 T , ln d α d t corresponding to different temperature programs β is plotted, and a straight line is fitted to them. The slope of this line determines E α .
The Starink method is an integral method being an improvement of the so-called Kissinger–Akahira–Sunose method. After combining Equations (8) and (9) into one, integrating it with respect to time and performing some additional assumptions (see [47] for details), the following relationship can be obtained:
ln β T α , β 1.92 = c o n s t 1.0008 E α R T α , β .
The activation energy E α is determined by fitting a straight line to points 1 T , ln β T 1.92 for different temperature programs at a constant value of α .

2.6. Comprehensive Pyrolysis Index (CPI)

To evaluate the overall pyrolysis process of particular WPs and their mixtures, the so-called comprehensive pyrolysis index (CPI) was used [32]. For p -th peak in a DTG curve, the index is denoted as D p and calculated as follows:
D p = R m R a Δ m T i T m Δ T 1 / 2    % 3 ° C 3 min 2 ,
where R m (%/min) is the maximum mass loss rate (dm/dt)max in p -th peak, R a (%/min) is the average mass loss rate, Δ m (%) is the total mass loss in the pyrolysis process, T I (°C) is the initial temperature of the pyrolysis process, T m (°C) is the peak temperature, and Δ T 1 / 2 (°C) is the half rate peak width, corresponding to temperature range around T m when the average mass loss rate is at least half the maximum ( R / R m 1 / 2 ) . The overall CPI is calculated then as a weighted average:
C P I = p = 1 P η p D p ,
where η p is the contribution of peak p to mass loss, equal to Δ m p / Δ m , where Δ m p (%) is the mass loss associated with the peak.

3. Results and Discussion

3.1. Material Characteristics

Pure PE, PVC and PVB are polymers whose chains consists of repeating segments shown in Figure 2 [48,49]. Due to the fact that the used PE was LDPE and the polymers originated from wastes, additional substances could be present because these plastics are commonly used with various additives, such as antioxidants, anti-UV stabilizers, plasticizers, lubricants, fillers or inorganic pigments [50].
The results of the physicochemical analysis of the plastics used for pyrolysis are given in Table 2. PVC has the highest density and LDPE the lowest (1.421 g/cm3 and 0.906 g/cm3, respectively). According to [18], higher density plastics used in the pyrolysis process contribute to greater tar degradation and reduce solids production. The low water (moisture) content in the raw materials ranging from 0.1 to 0.2%, as well as the sulfur content, should not affect the quality of the final product, as well as the energy consumption of the process. Moreover, all three polymers are characterized by similar and low ash content (from 1.1% to 1.3%), which indicates the presence of inorganic substances in their composition. This indicates that the polymers used for research are not pure polymers, but contain small amounts of impurities (e.g., metals) and modifying additives (UV stabilizers, emulsifiers, plasticizers, inhibitors and others), which may affect the course of the conversion processes of these wastes [35]. The tested samples showed a high content of volatile substances and a low ash content, which proves that these materials have a significant potential to produce large amounts of liquid oil in the pyrolysis process. LDPE has the lowest amount of filler and moisture, making it the most desirable raw material for the pyrolysis process (Table 2). The results of the elemental analysis indicate that the highest C and H content is featured by LDPE, the average by PVB, and the lowest one—by PVC. Thus, the energy value of LDPE and PVB is higher than PVC, and the presence of hydrogen additionally increases their calorific value [51]. Similarly, LDPE and PVB feature higher combustion heat than PVC, in which the presence of chlorine impairs the fuel quality. PVC is characterized by the lowest combustion heat, approximately 14 kJ/g, due to the high chlorine content (approximately 18%) in the structure. In turn, the energy content in LDPE and PVB is 44.85 kJ/g and 39.05 kJ/g, respectively, which is comparable to that for fuel oil of approximately 42 kJ/g [52]. The heat of combustion for PVB is lower (<40 MJ/kg) than that for polyolefin plastic due to its structure composed of butyral and hydroxyl groups, which has a lower combustion energy than aliphatic hydrocarbons [50,53].

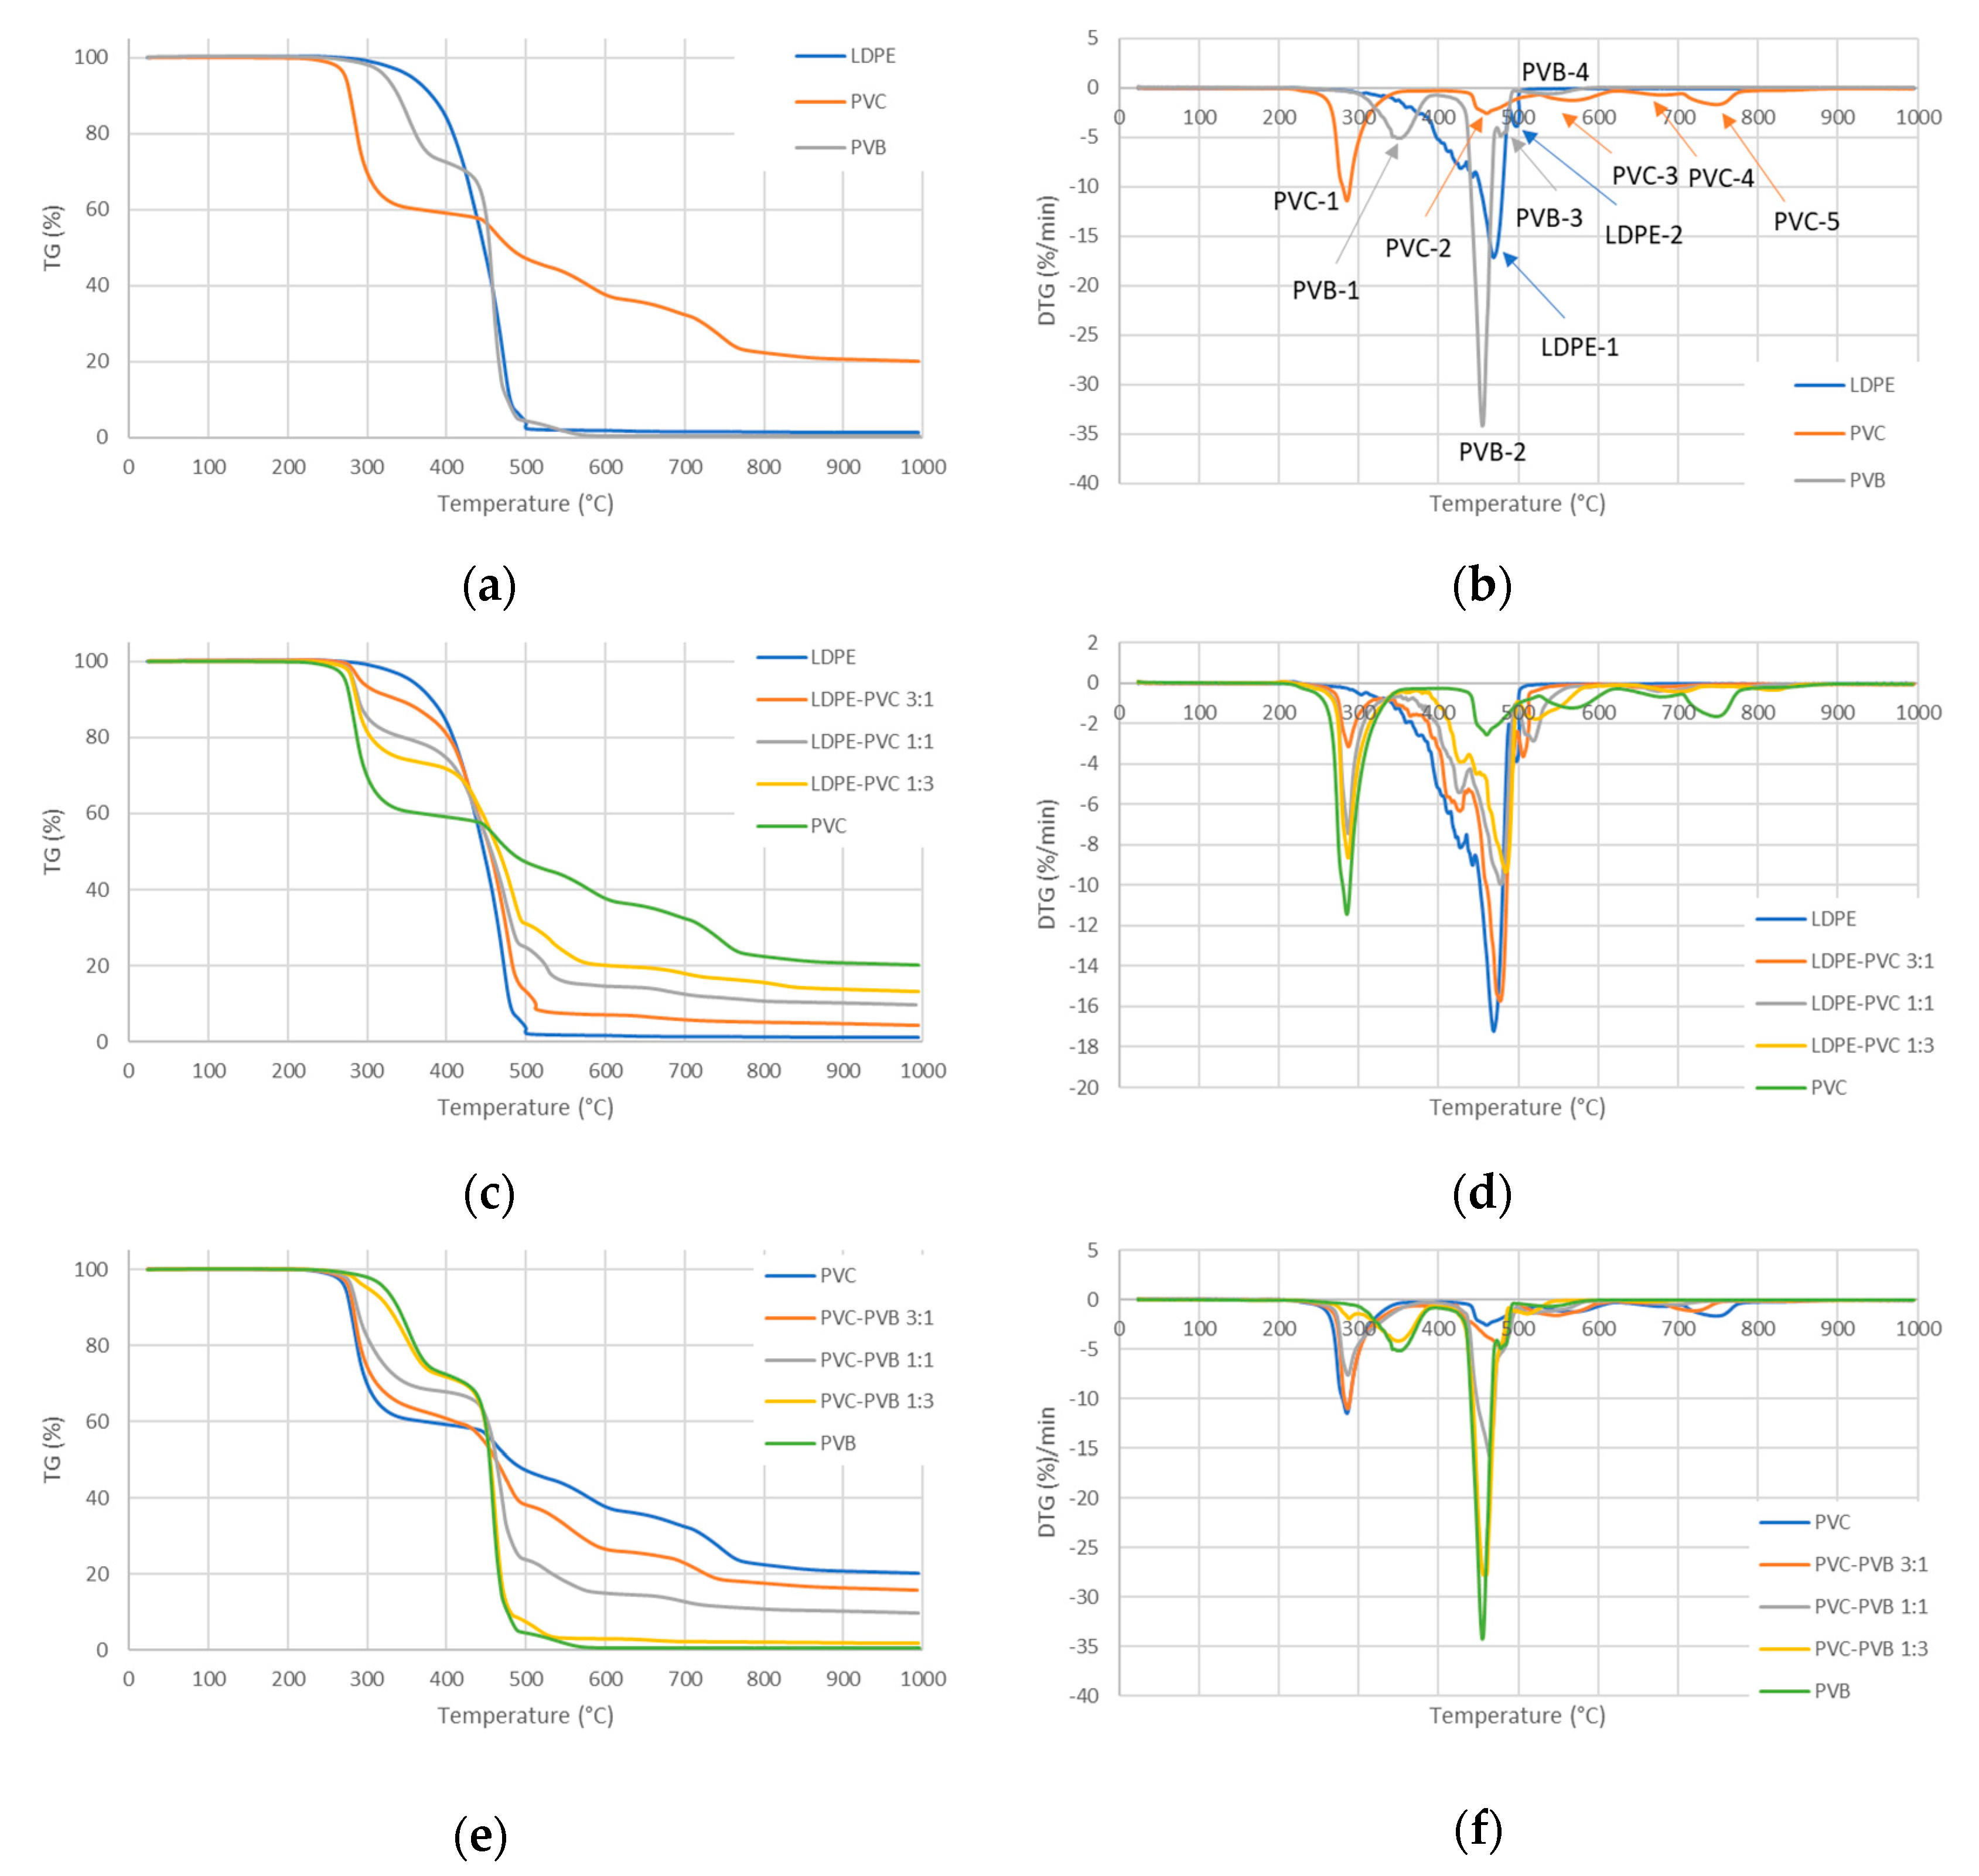
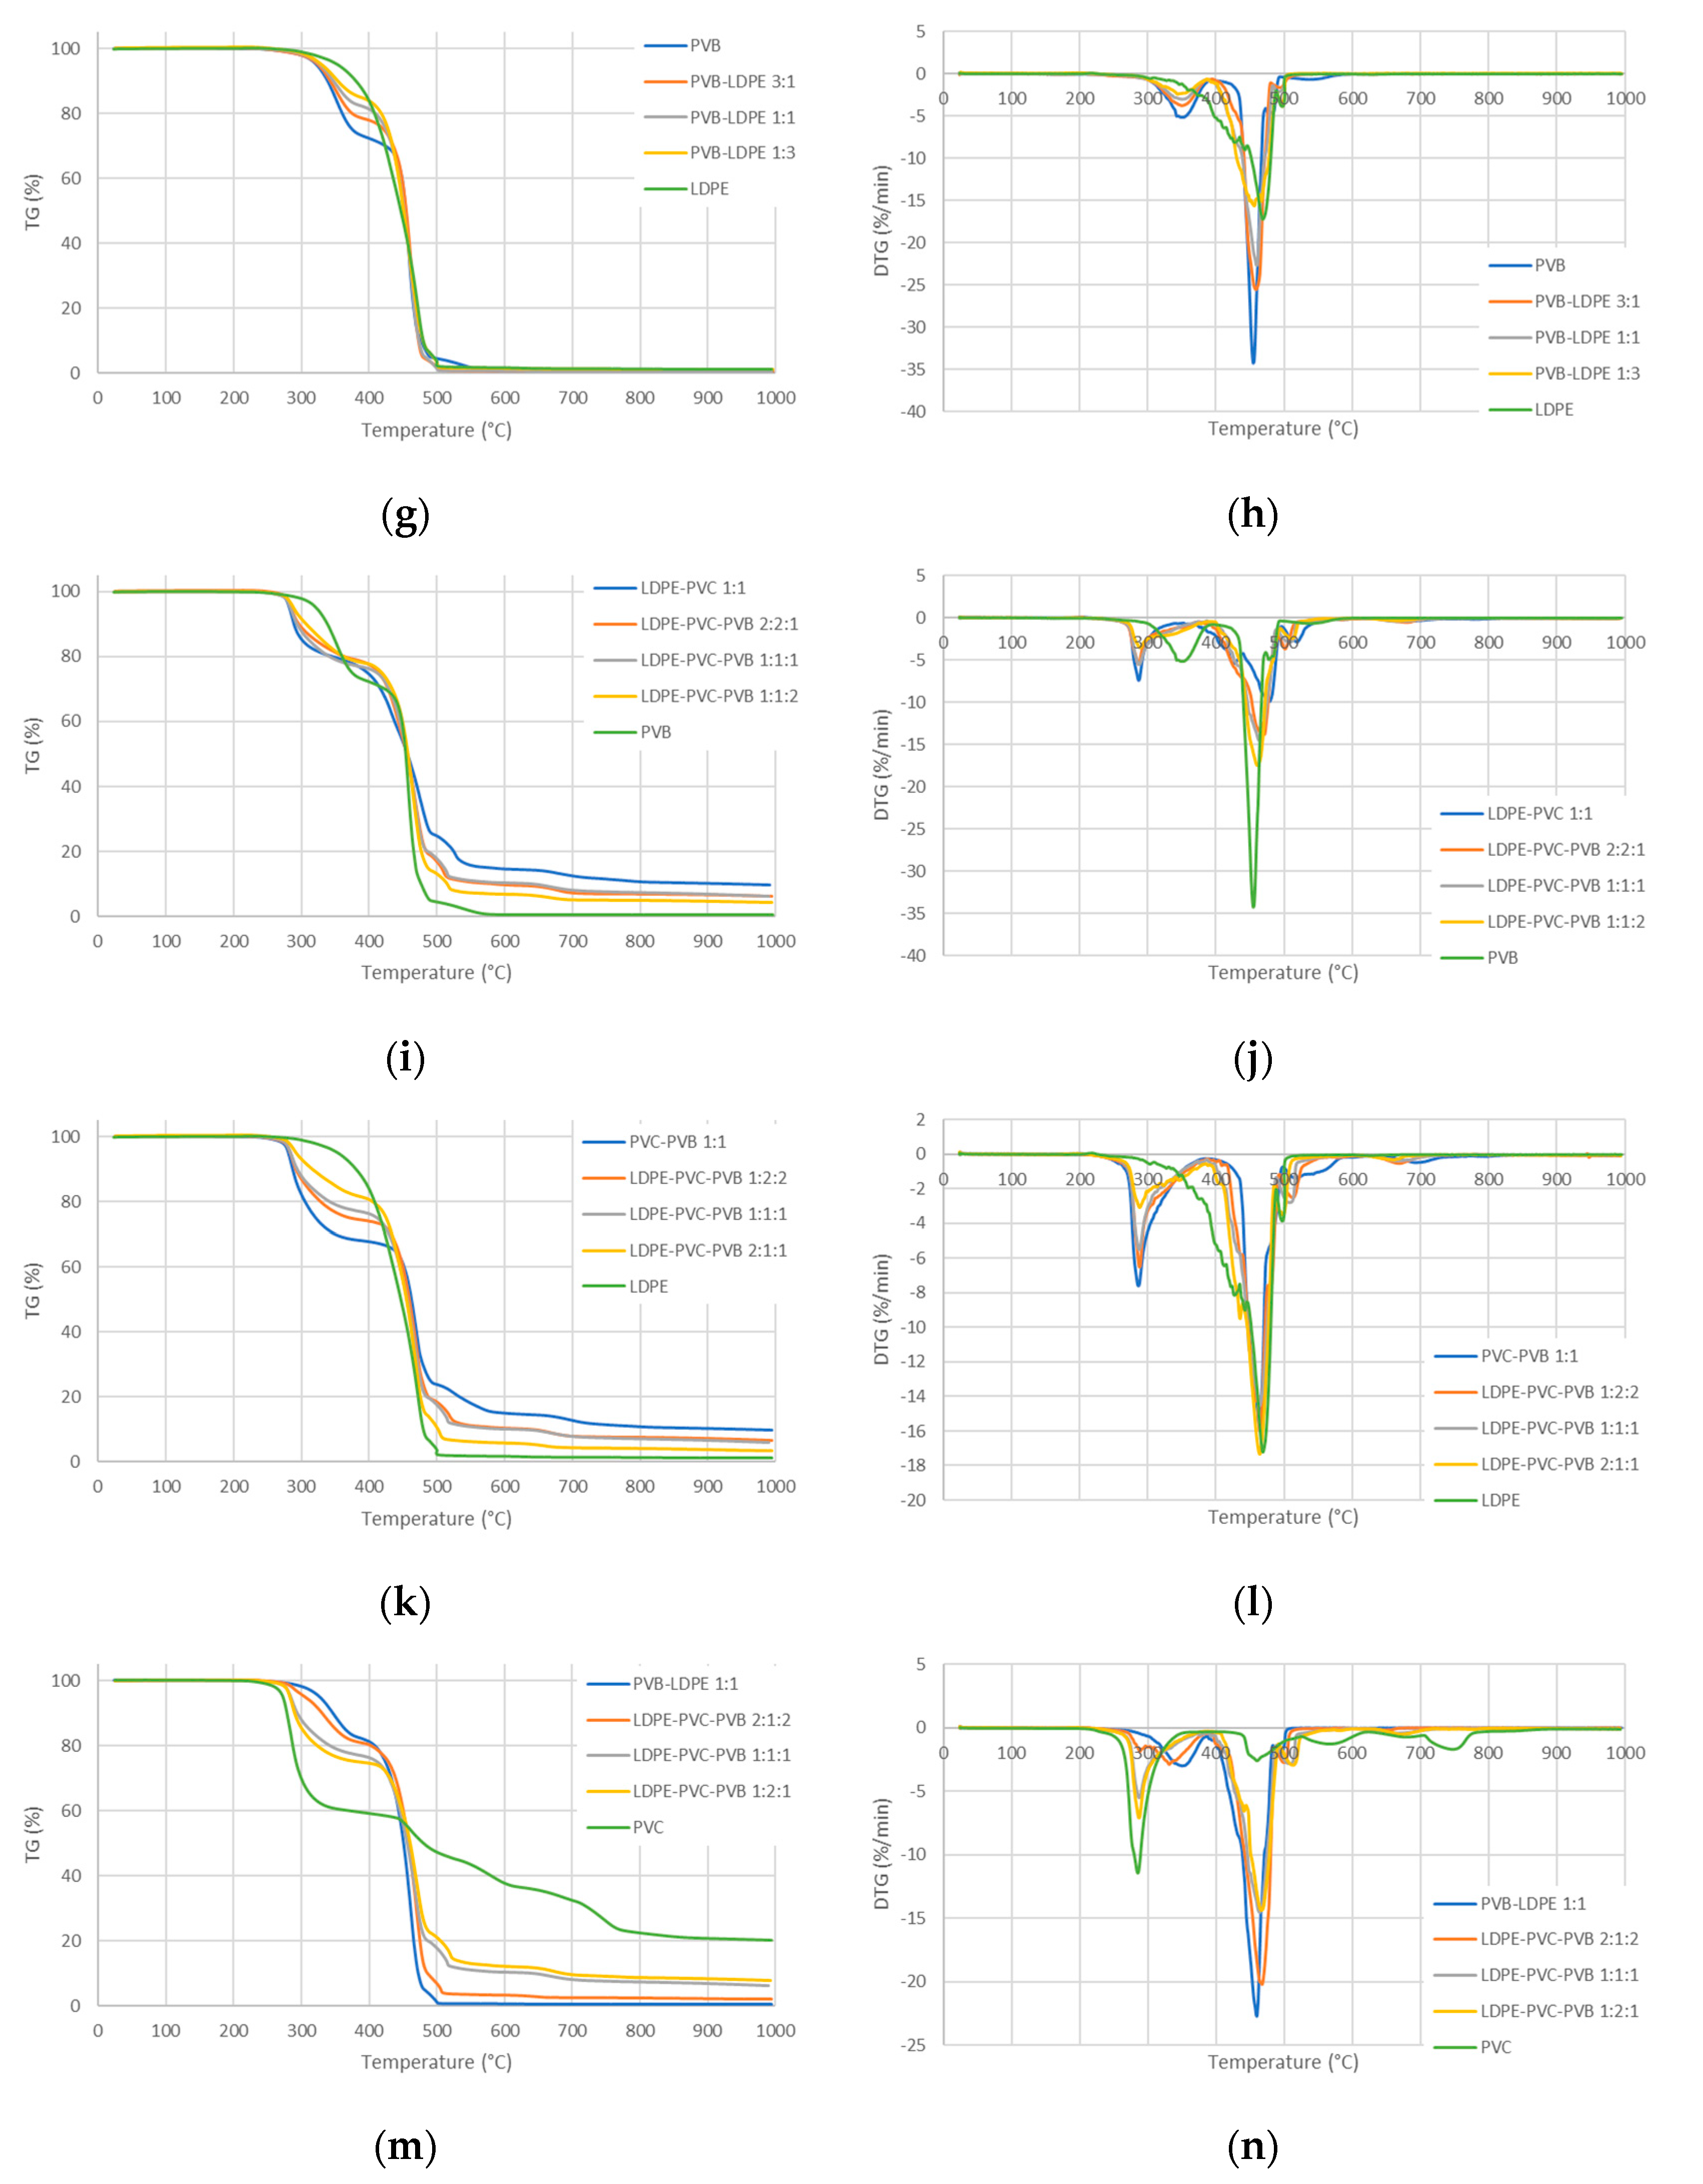
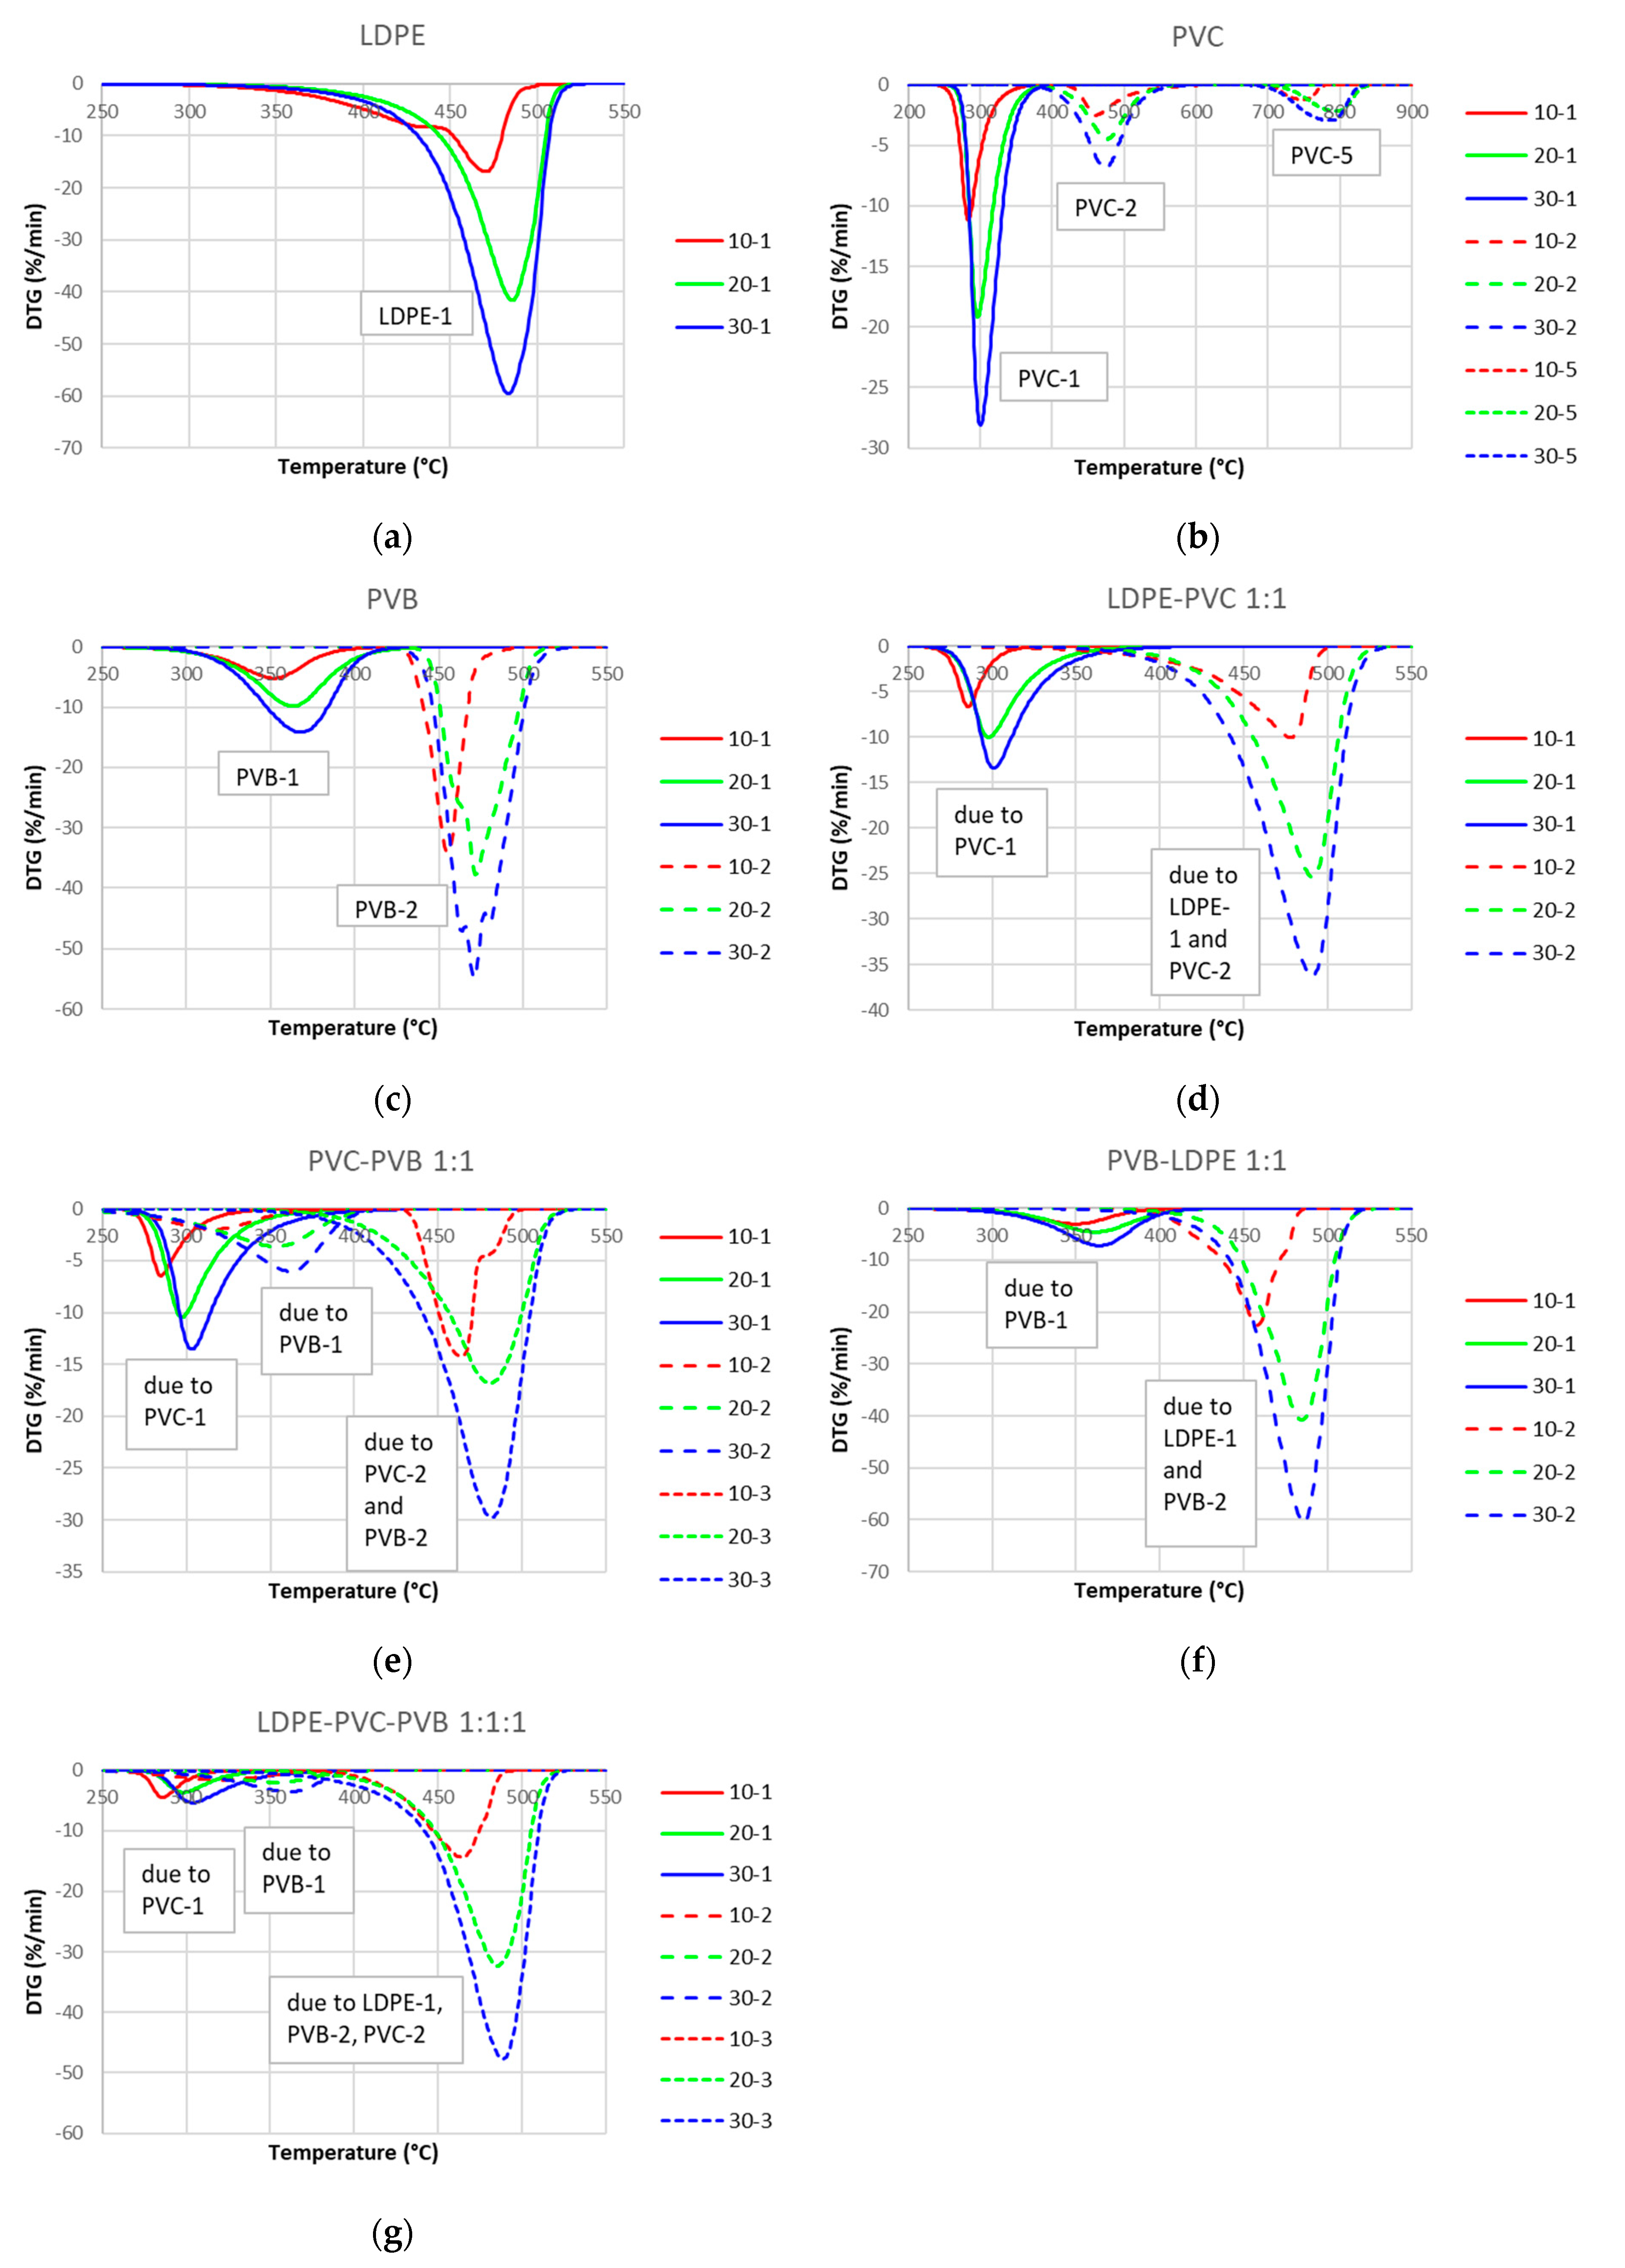
3.2. TG/DTG Analysis

Figure 3 presents TG/DTG curves for LDPE, PVC and PVB, and their binary and ternary mixtures at a heating rate of 10 °C/min, respectively. The DTG curve for LDPE (Figure 3b) reveals one large peak at 469 °C (designated LDPE-1) and a much smaller one around 497 °C (LDPE-2). The first peak is related strictly with LDPE pyrolysis [54], whereas the second one is probably a result of unidentified admixtures mentioned at the beginning of Section 3.1. The DTG curve for PVC waste shows one large peak, 286 °C (PVC-1), and four smaller ones (461, 568, 678 and 748 °C, denoted PVC-2 to PVC-5, respectively). Among them, peak PVC-1 corresponds to C-Cl bond cleavage and vaporization of HCl [25], and peak PVC-2 (461 °C) is related to further degradation of the PVC chain and creation of aromatic rings [55], whereas further peaks originate probably from specific admixtures. Peak PVB-1 (349 °C) in the DTG curve is related to elimination of water from vinyl alcohol copolymer with formation of small amounts of butanal [56] and the presence of a plasticizer in the PVB waste sample [57], whereas peak PVB-2 (455 °C) corresponds to the side group elimination and main chain scission [56,57]. Two smaller peaks, PVB-3 (478 °C) and PVB-4 (547 °C), show the presence of unidentified admixtures.
The pyrolysis temperature ranges for LDPE, PVC and PVB are 230–511 °C, 217–876 °C and 237–584 °C, respectively. PVC pyrolysis started at the lowest temperature and finished at the highest one, whereas LDPE pyrolysis started at the highest and finished at the lowest temperature. Compared to LDPE and PVB, PVC had a wide range of thermal decomposition temperatures, which is consistent with the results reported by [58,59]. Differences in the molecular structures of these materials significantly influence the thermal degradation process. The mass loss for LDPE and PVB was very high and reached around 99%, whereas it reached only around 80% for PVC. Hence, it follows that LDPE and PVB pyrolysis is nearly complete and occurs in a relatively narrow range of temperatures, whereas PVC pyrolysis is not full and requires a wide range of temperatures. The binary (Figure 3c–h) and ternary mixtures (Figure 3i–n) show TG/DTG curves approximately being blends of those for the main components. The differences between expected and observed TG/DTG curves for the blends are discussed in Section 3.4.
Since it is difficult to gain an overall view on the pyrolysis process using separate TG curves, they were used to prepare snapshots of a processed percentage for any mixture of LDPE:PVC:PVB. Each triangle in Figure 4 represents one moment in time and an approximate value of temperature. Each point in the triangle corresponds to certain proportions of LDPE:PVC:PVB, equal to the barycentric coordinates of that point (pure components are represented by vertices, binary blends are represented by the triangle sides, and ternary blends—by the interior of the triangle). The snapshots were prepared for temperatures 300–500 °C, in which almost all mass is processed. It is visible that the pyrolysis starts first for PVC, then around 340 °C, the PVB pyrolysis starts, and around 440–460 °C, the LDPE-PVB blends are intensively processed so that around 500 °C, nearly 100% of LDPE, PVB and their blends are used, whereas a significant part of samples containing larger amounts of PVC remains unprocessed. The contours in the snapshots for temperatures below 400 °C and above 460 °C are nearly straight, indicating that the pyrolysis in that range of temperatures is approximately a simple superposition of used components. However, for 400–460 °C, the contours are not straight; therefore, pyrolysis of the blends in that temperature range is more complex.
The initial temperature, final temperature, total mass loss and average mass loss rate are presented in triangular plots illustrating the effect of LDPE, PVC and PVB share (Figure 5). The initial temperature of pyrolysis is lowest for PVC and rises as the share of LDPE or PVB grows. In turn, the final temperature is highest for PVC and drops as the share of PVC decreases. As for the total mass loss, it is lowest for PVC and grows as the share of PVC decreases. As a result, the average mass loss rate is lowest for PVC and highest for LDPE. It is visible that mass loss at 500 °C for LDPE and PVB is nearly 100%, whereas it is only 53% for PVC (Figure 5d). The lower thermal degradation efficiency of the PVC sample indicates a greater production of a gaseous product during the pyrolysis of this material, most likely as a result of the de-chlorination process, which causes the release of more gas instead of a liquid product [21,60].

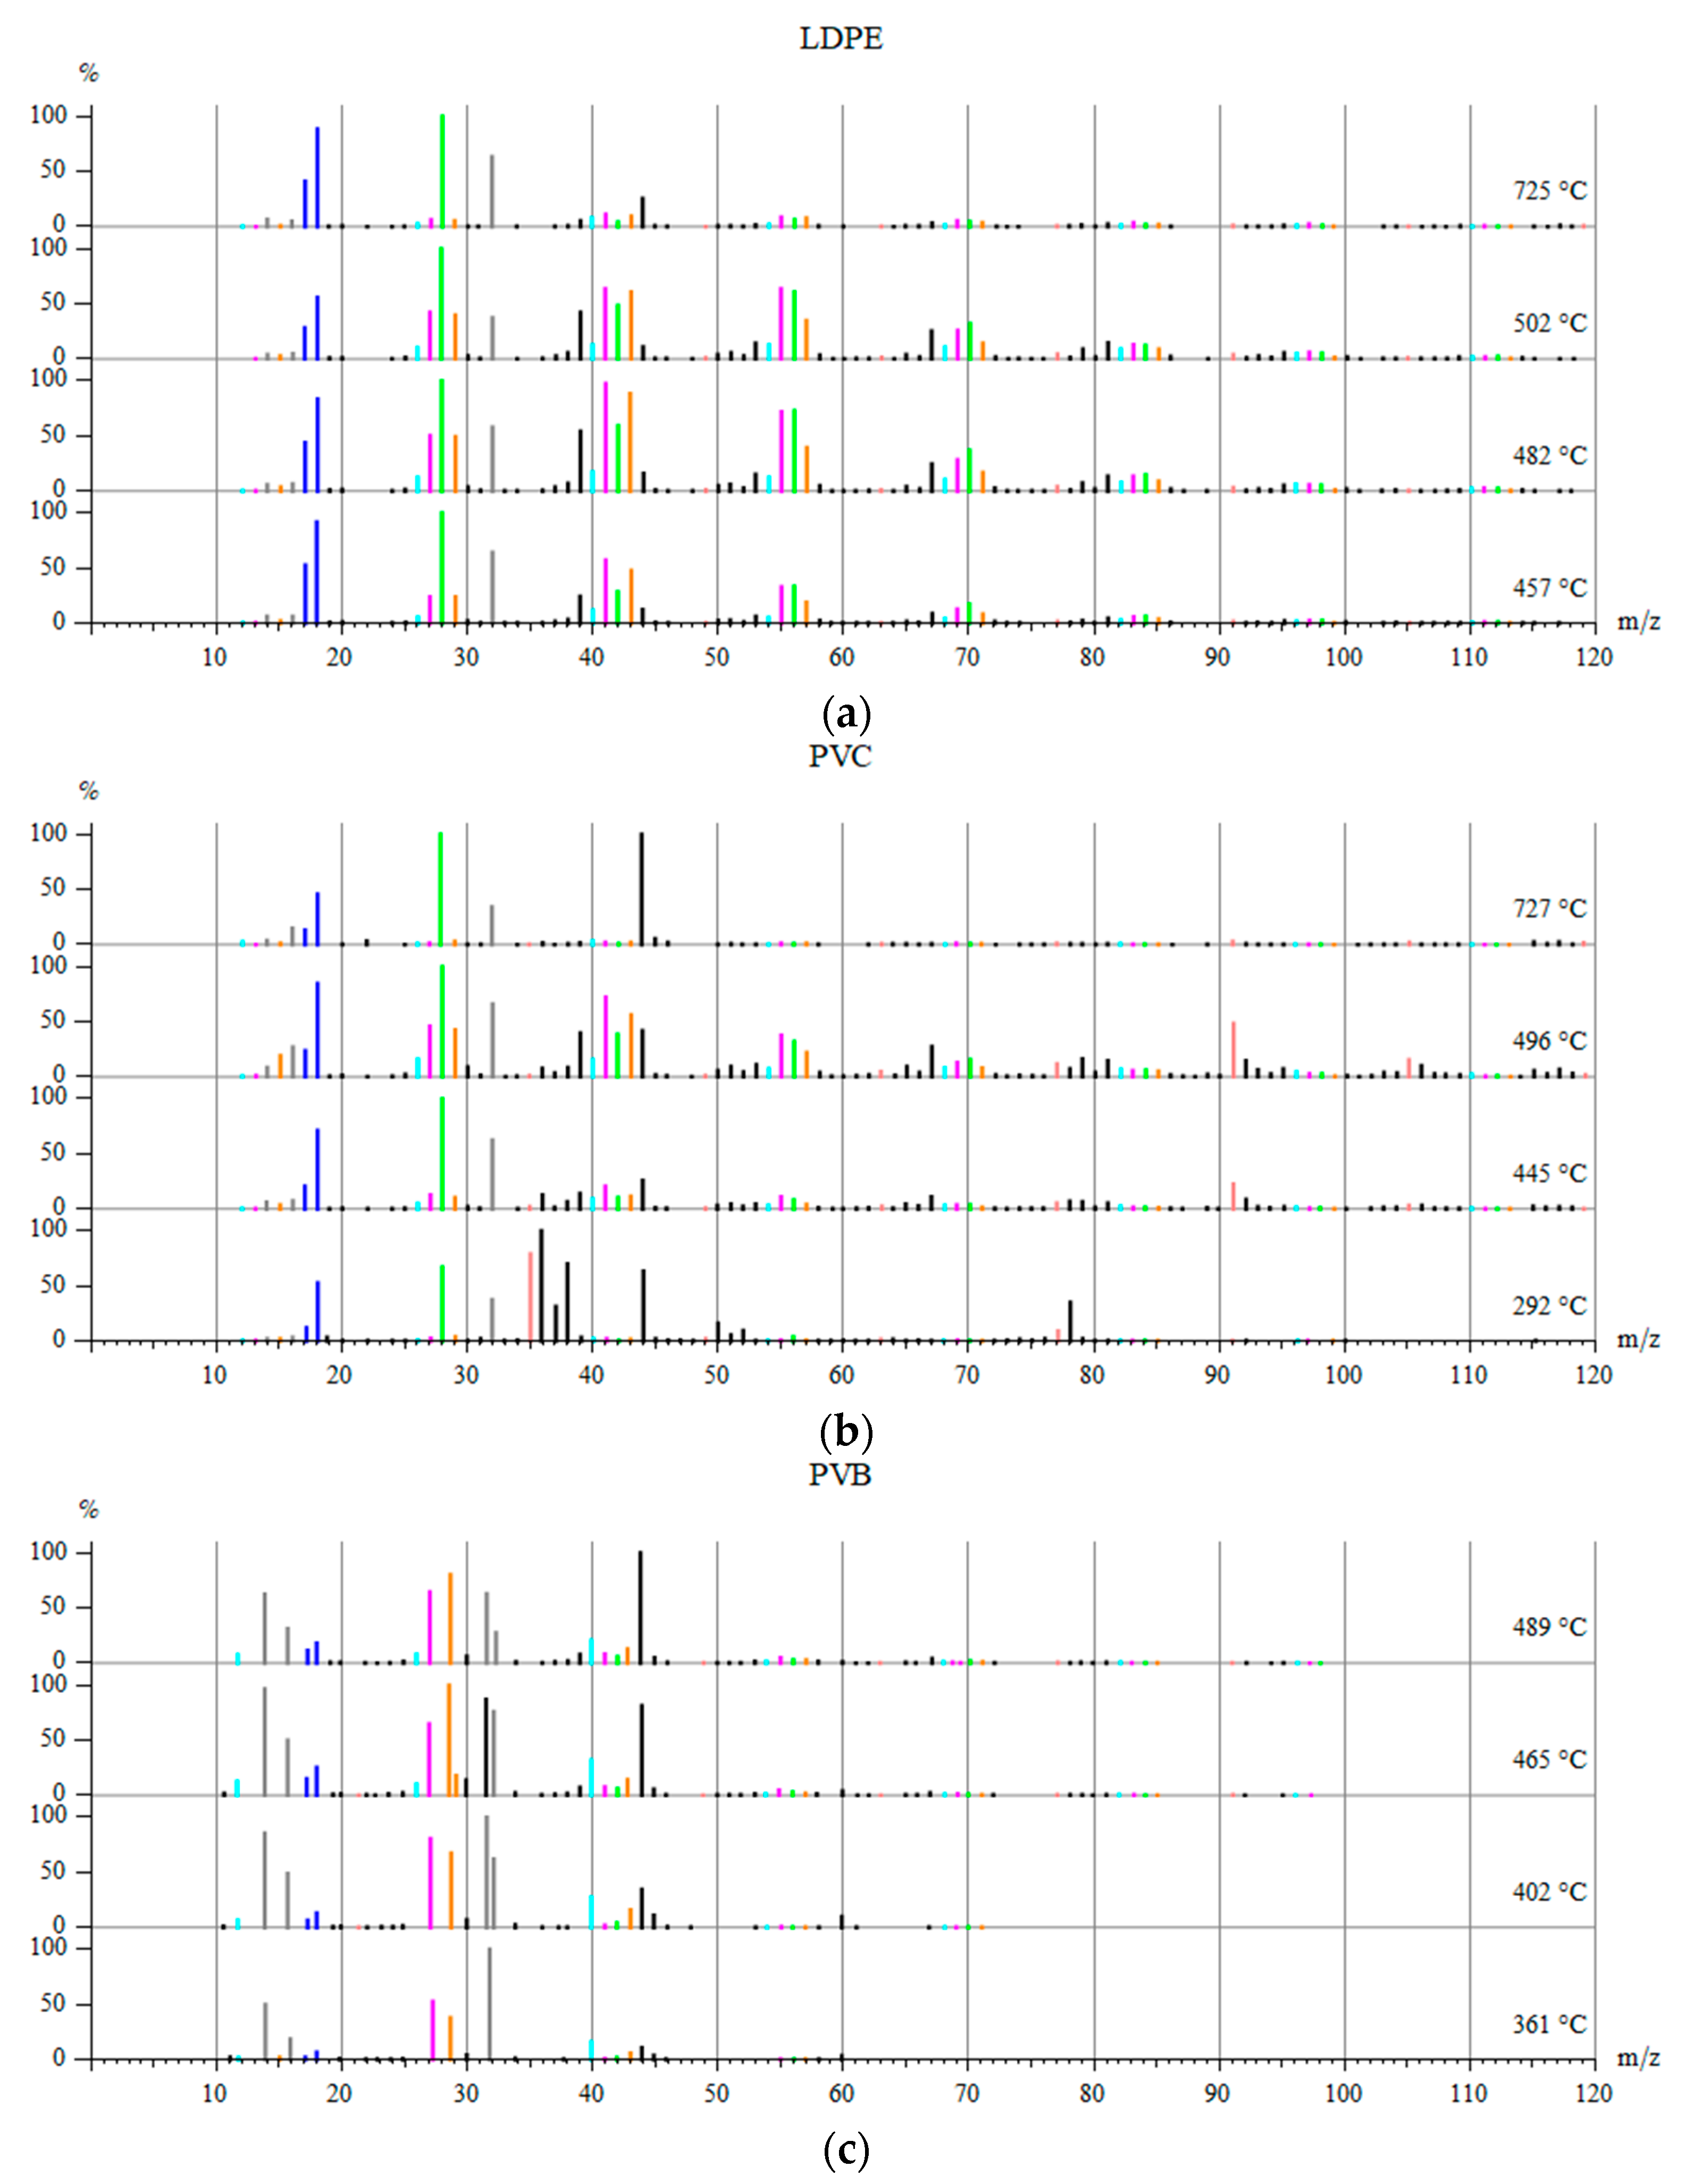
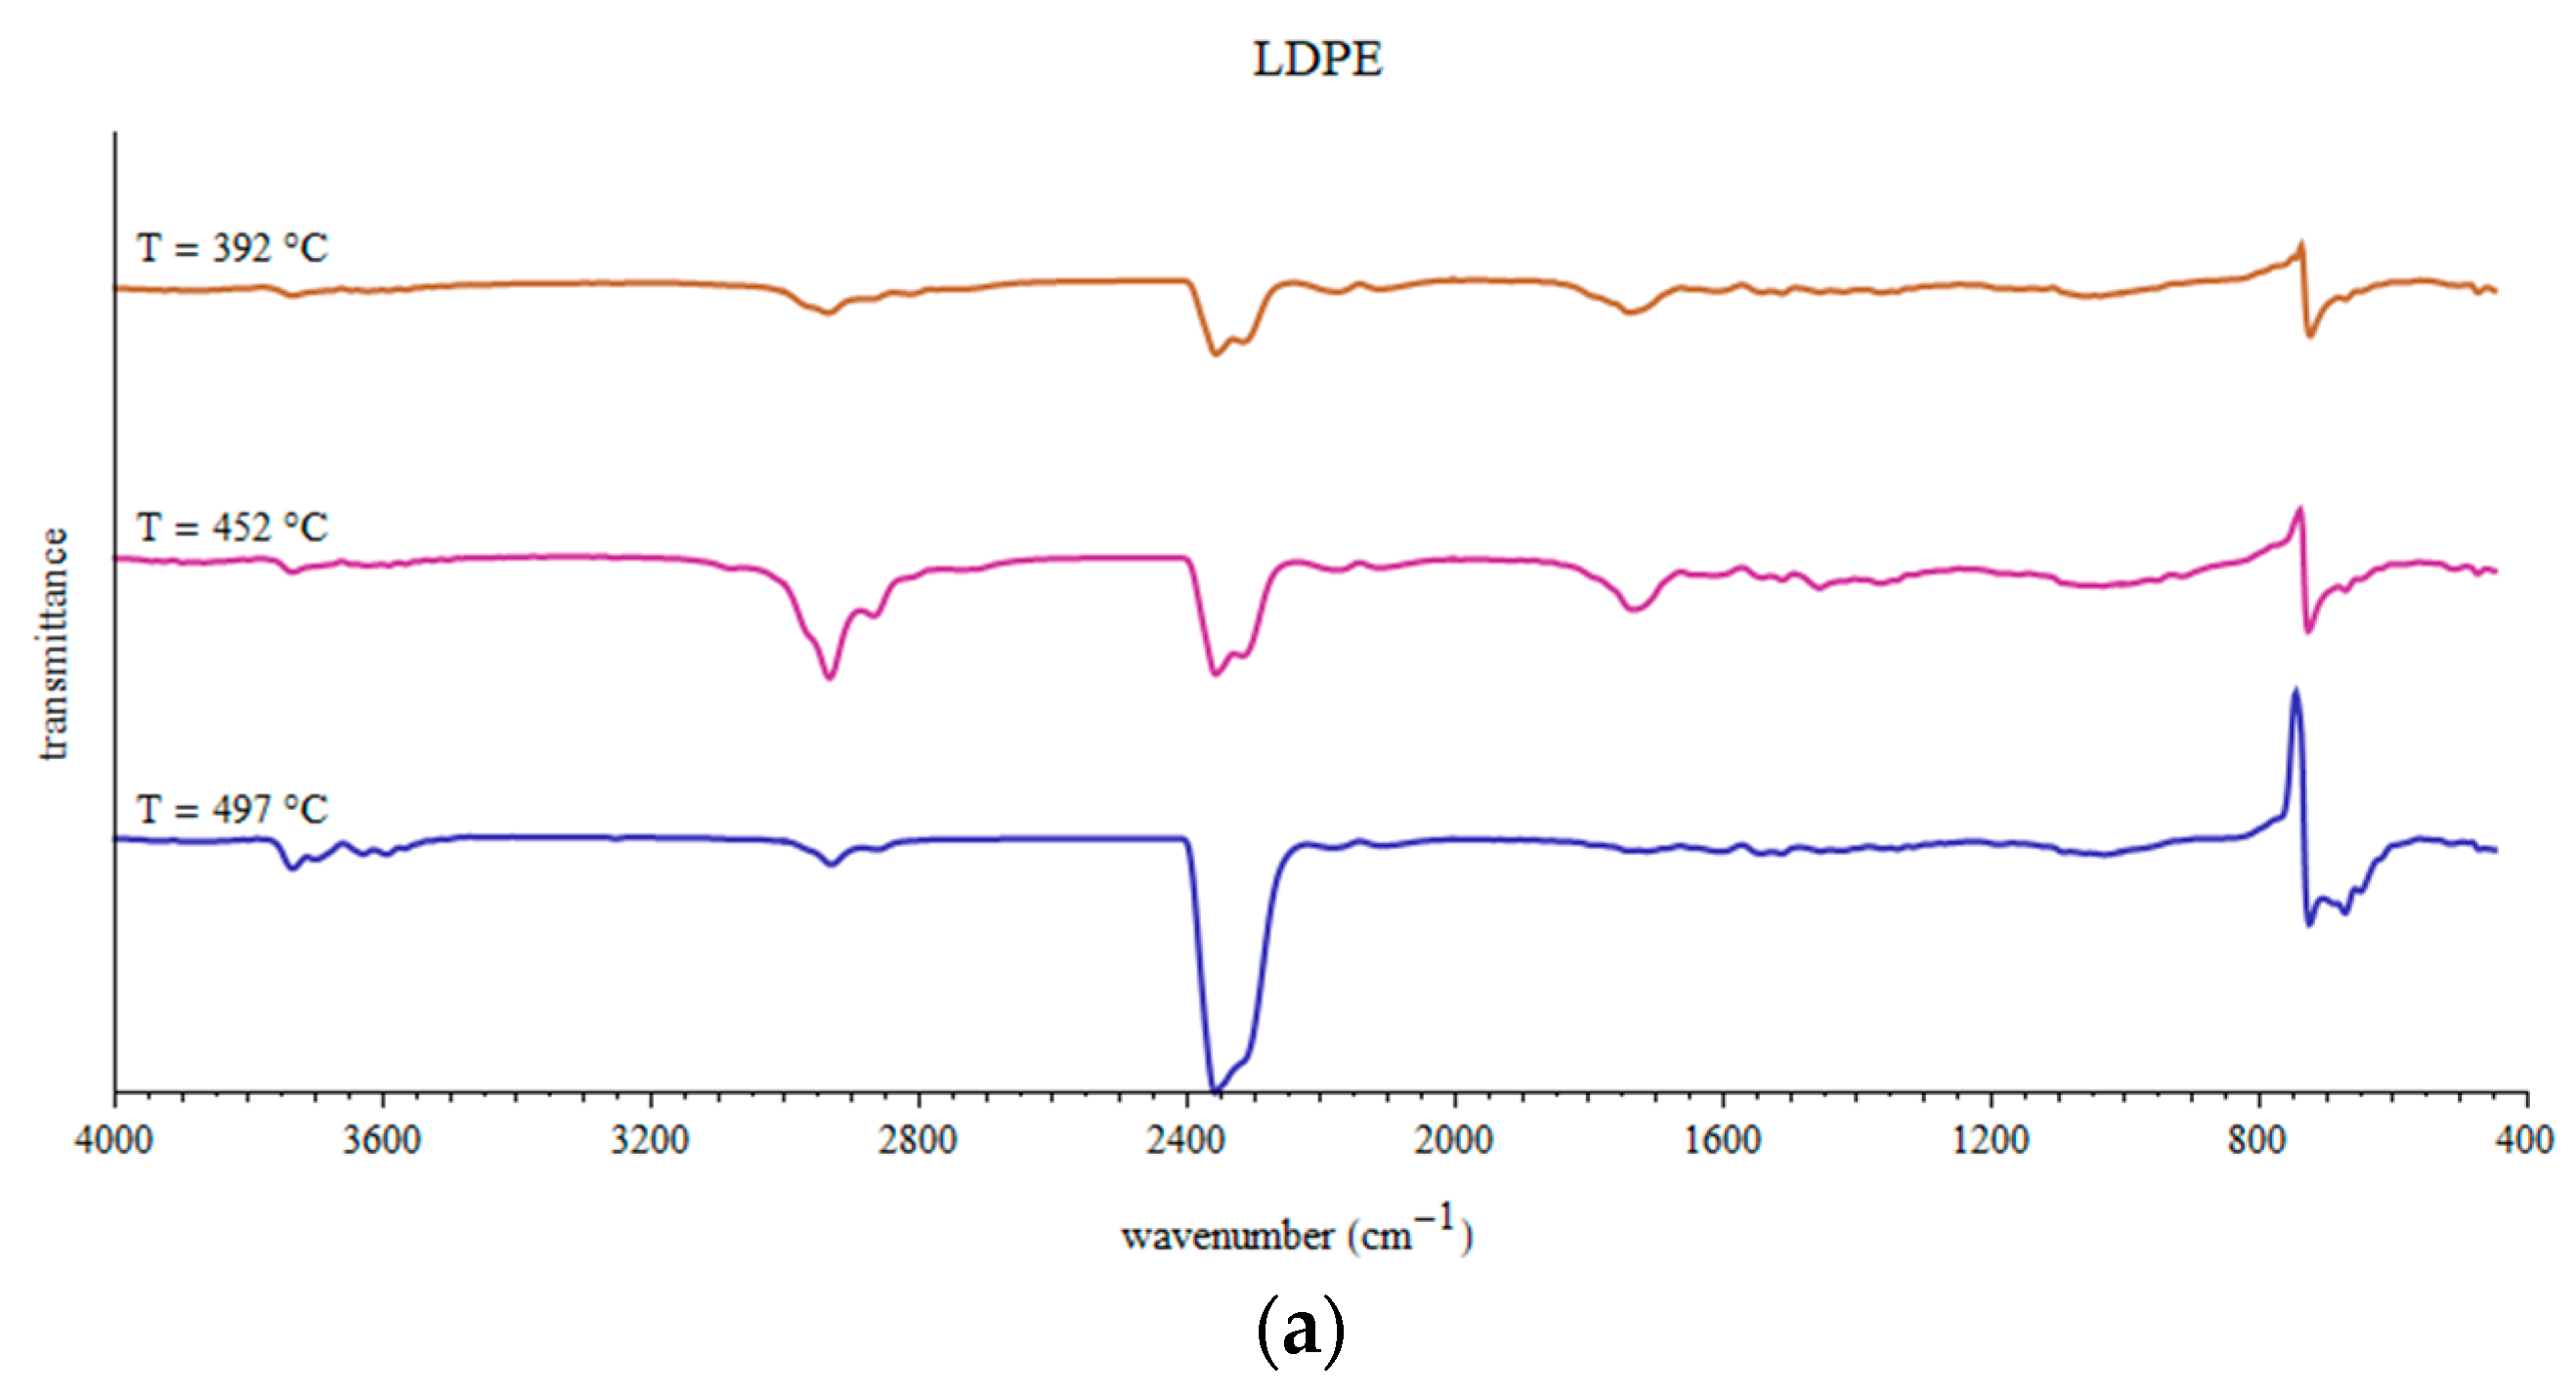
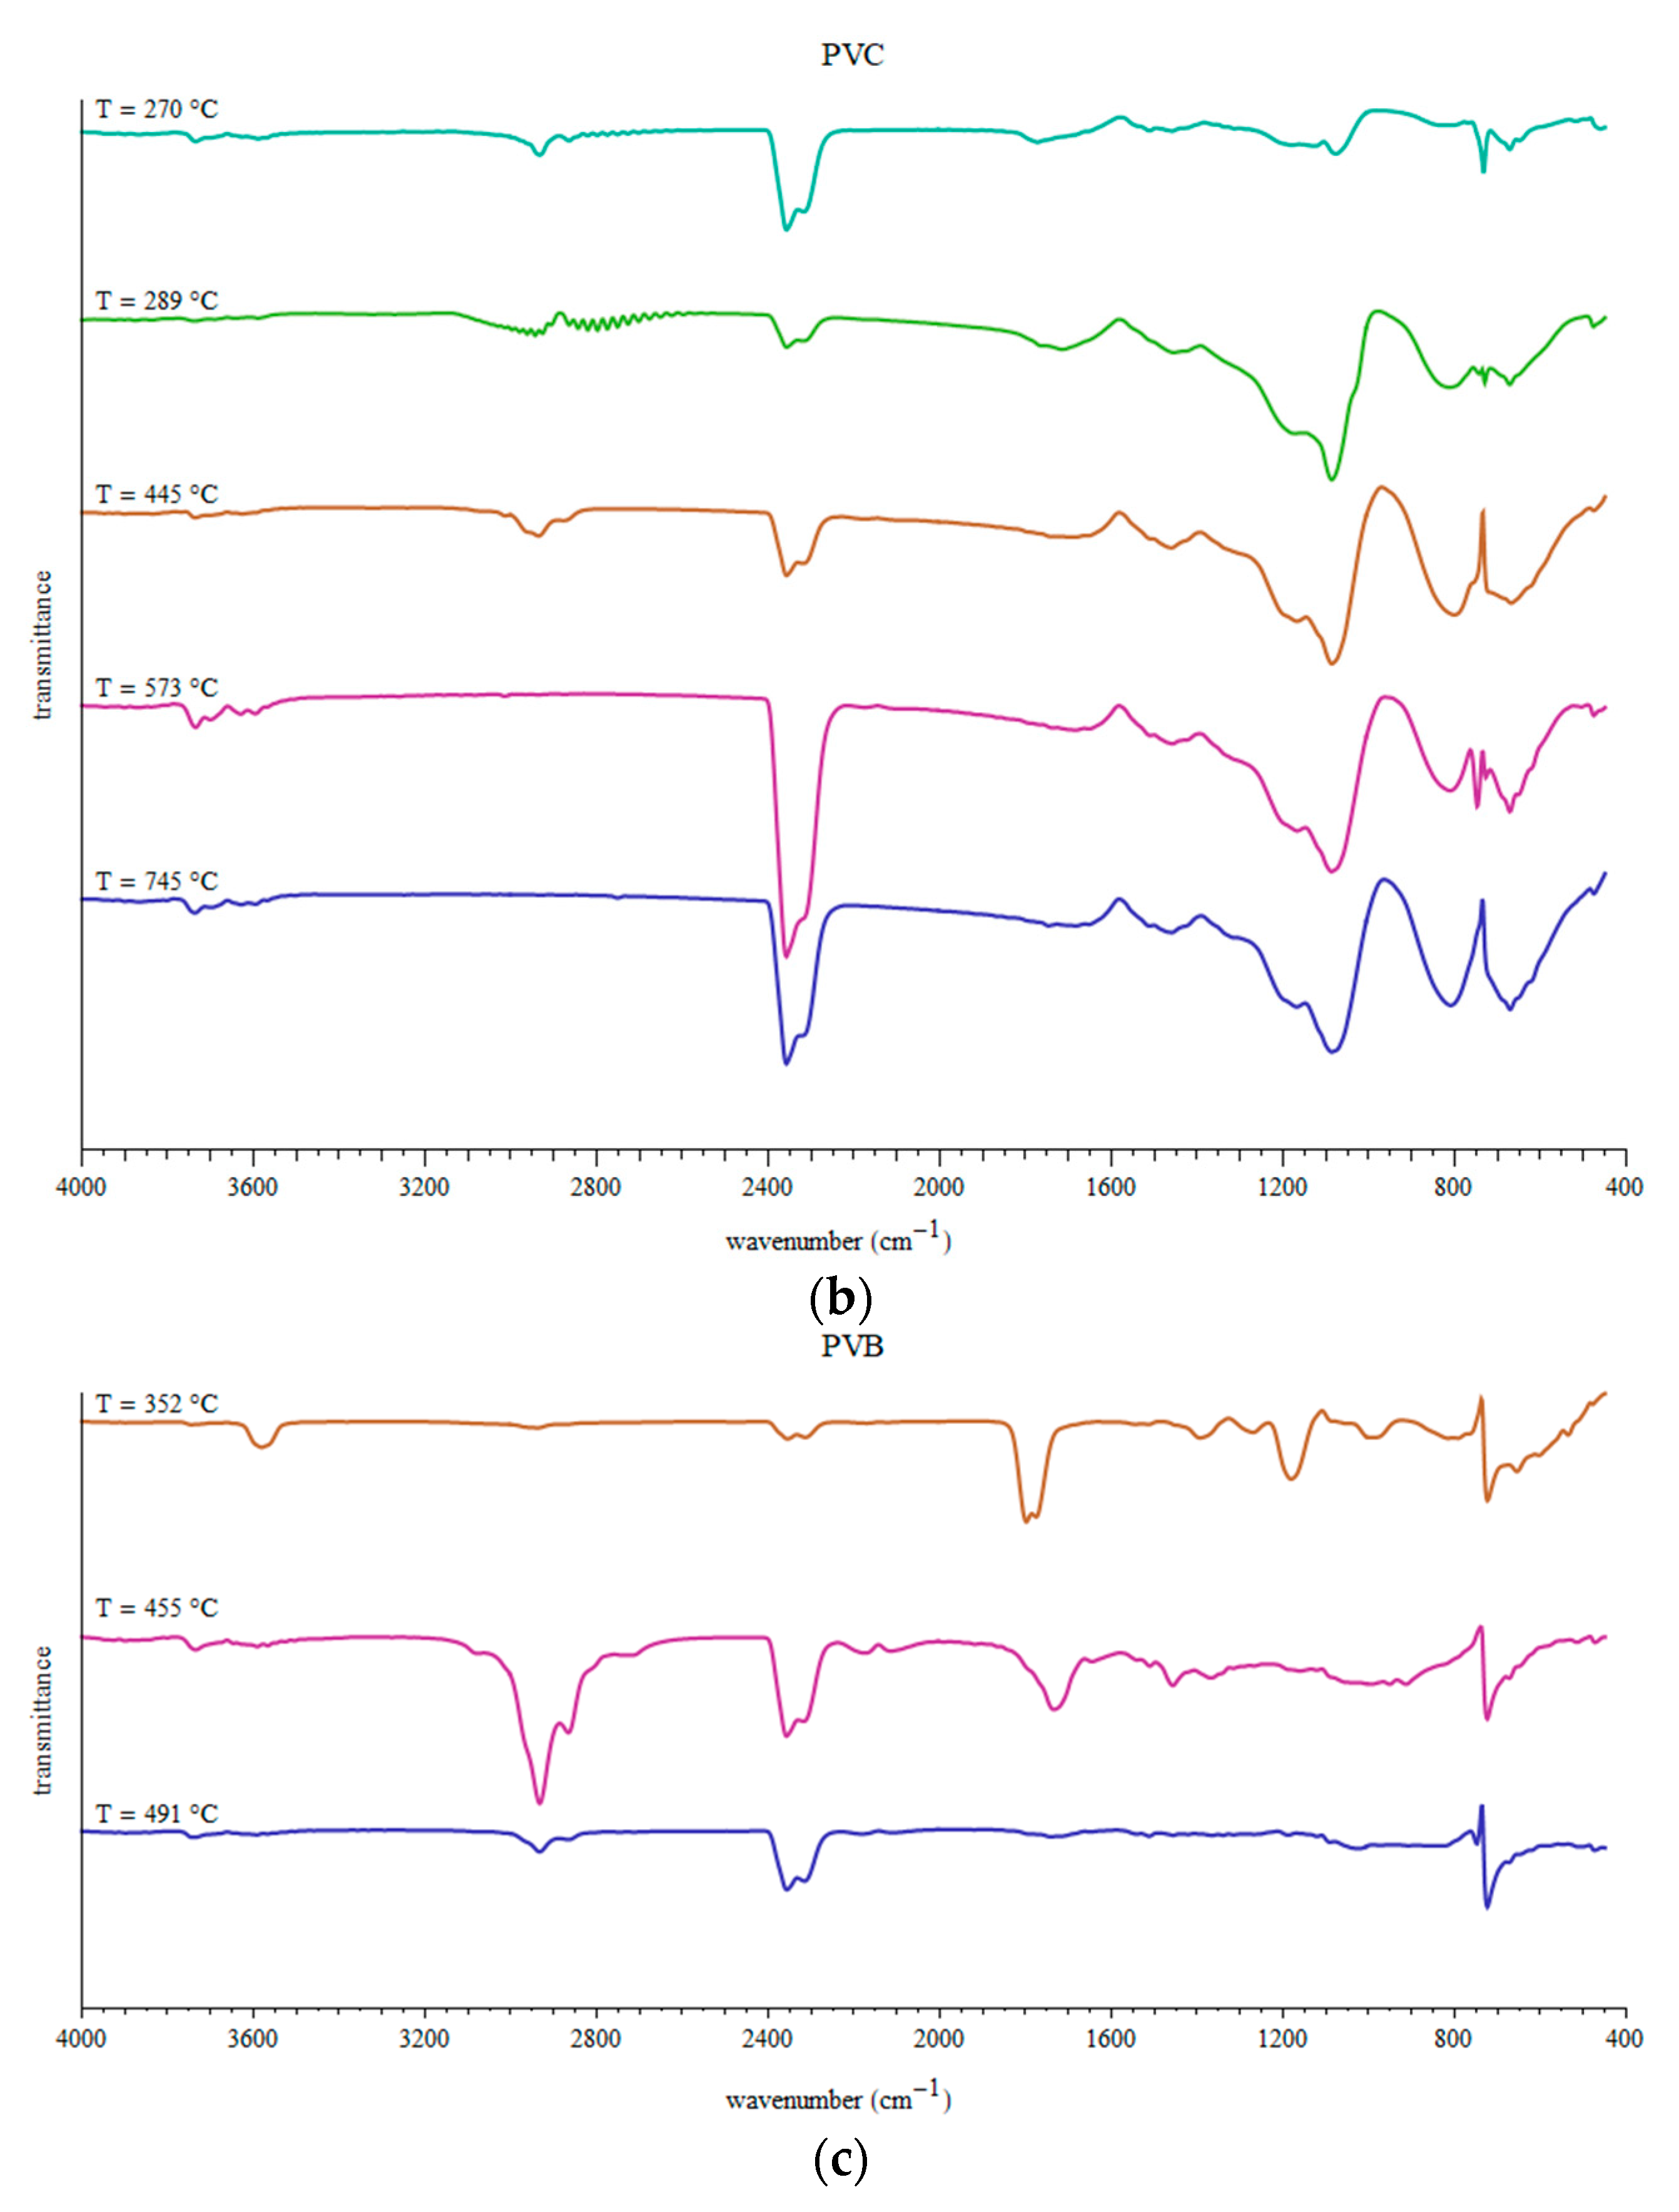
3.3. Fragments Arising during Pyrolysis of Considered WPs

The pyrolysis of LDPE leads to the production of various hydrocarbons with one to several dozen carbon atoms [54]. A similar situation takes place for PVC, but the fragments often contain chlorine atoms. PVB can contain three types of monomers: most abundant vinyl butyral -CH2-CH(C2H5O2CH-C3H7)-, vinyl alcohol -CH2-CHOH-, and vinyl acetate -CH2-C2H3O2- of less abundance [48]. The much more complicated structure of the PVB chain makes it possible to produce compounds such as C3H7COOH, C4H9OH, C3H7COH, CH3COOH and others [61]. It should be noted that the used samples were prepared from waste, therefore the samples can contain plasticizers as well as other compounds which are difficult to identify. Nevertheless, the above-mentioned fragments were identified in mass spectra as shown below (the interpretation was based mainly on [62,63] unless otherwise indicated). Figure 6 shows the mass spectra for the used LDPE, PVC and PVB at specific temperatures.
LDPE pyrolysis shows clearly one stage starting at around 300 °C. In mass spectrograms for LDPE above this temperature, there are several series of lines corresponding to carbocations with two, three to eight and even more atoms of carbon, mainly alkyl [CnH2n+1]+ (lines 29, 43, 57, 71, 85), alkenyl [CnH2n−1]+ (lines 27, 41, 55, 69, 83) or alkene radical cations [CnH2n]+• (lines 28, 42, 56, 70, 84). There are also lines which can be assigned to nitriles [CnH2n−2N]+ (weak lines 26, 40, 54, 68, 82) or low-mass aromatic compounds (e.g., line 39 corresponding to [C3H3]+). The intensity of the lines is highest for a temperature around 480 °C, when the loss in mass is highest.
The pyrolysis of PVC shows three stages, starting at around 200 °C, 400 °C and 700 °C. In the first stage, the mass spectrum (Figure 6b, temperature 292 °C) shows clear lines 35 and 37 corresponding to 35Cl+ and 37Cl+ (the intensity of line 35 is around three times the intensity of line 37 corresponding to three times higher abundance of 35Cl compared to 37Cl). There are also lines 36 and 38, which should be attributed to [HCl]+• as well as lines 50 and 52 that are probably related to [CH3Cl]+•. Line 78 could be assigned to [C3H7Cl]+• but it originates mostly from benzene [55]; moreover, lines 38, 50–52 and 77–79 can be also attributed to low-mass aromatic carbocations. In the second stage of pyrolysis, a large number of species appear, which can be assigned similarly as in the case of LDPE, i.e., there are series of hydrocarbons with several atoms of carbon, aliphatic as well as aromatic ones. Line 91 which has clearly high intensity is related mainly to [C7H7]+, and lines 105 and 106 to xylene [55]. However, line 91 and also 63, 77, 105 can be attributed to chloroalkyl ions [CnH2nCl]+, too.
In PVB pyrolysis, two stages starting at around 300 °C and 400 °C are visible. In the first stage, the mass spectrum (Figure 6c, temperature 361 °C) shows intensive lines 27 and 29, assigned to [C2H3]+ and [C2H5]+. Line 44 can be related to vinyl alcohol radical cation [C2H3OH]+• as well as [CO2]+•. There are also lines related with carbocations with three atoms of carbon, and a clear line 60 assigned to [CH3COOH]+•, which can arise from vinyl acetate. These lines are visible also in the next stage of pyrolysis, but in addition, lines related to carbocations with several atoms of carbon can also be observed then. Also lines 18 and 17 corresponding to [H2O]+• and [OH]+ are visible, as well as atomic (16) and molecular (32) oxygen. However, line 32 can also originate from [CH3OH]+•.
The observations were also confirmed by an FTIR analysis based on [63]. The FTIR spectra for the main constituents are presented in Figure 7. The following bonds are present in the fragments found in the mass spectra: C-H, C-C, C=C, C≡C, C-O, C=O, H-Cl, O-H. In general, there are many more or less intensive bands. The following bands can be clearly identified:
  • Several peaks around 2960, 2940, 2880 and 2845 cm−1 correspond to C-H stretching in alkanes (-CH3 and >CH2). Small peaks in region 3100–3000 cm−1 indicate C-H stretching in alkenes or aromatic compounds.
  • A series of oscillations in region 3100–2600 cm−1 visible for samples containing PVC for temperatures 250–350 °C (Figure 7b) show H-Cl stretching modes [32].
  • Smaller series of peaks in region 3700–3500 cm−1 can be due to O-H stretching in free OH groups.
  • Two usually strong double peaks around 2350 and 2315 cm−1 which should be attributed to CO2 presence in the gaseous products of pyrolysis.
  • Weak peaks around 2170 and 2110 cm−1 can be assigned to C≡C in alkynes or C≡O in CO.
  • Peaks around 1800–1540 cm−1 can be attributed to C=O stretching in carbonyl group.
  • The peak around 1610 cm−1 can be related to C=C stretching.
The fingerprint region (below 1500 cm−1) contains many peaks, which cannot by uniquely assigned; however, peaks around 1455 and 1360 cm−1 can be attributed to C-H in-plane bending, peaks around 985 and 910 cm−1 correspond to vinyl C-H out-of-plane bending, and the peak around 720 cm−1 may be related to C-H rocking in longer alkenes.

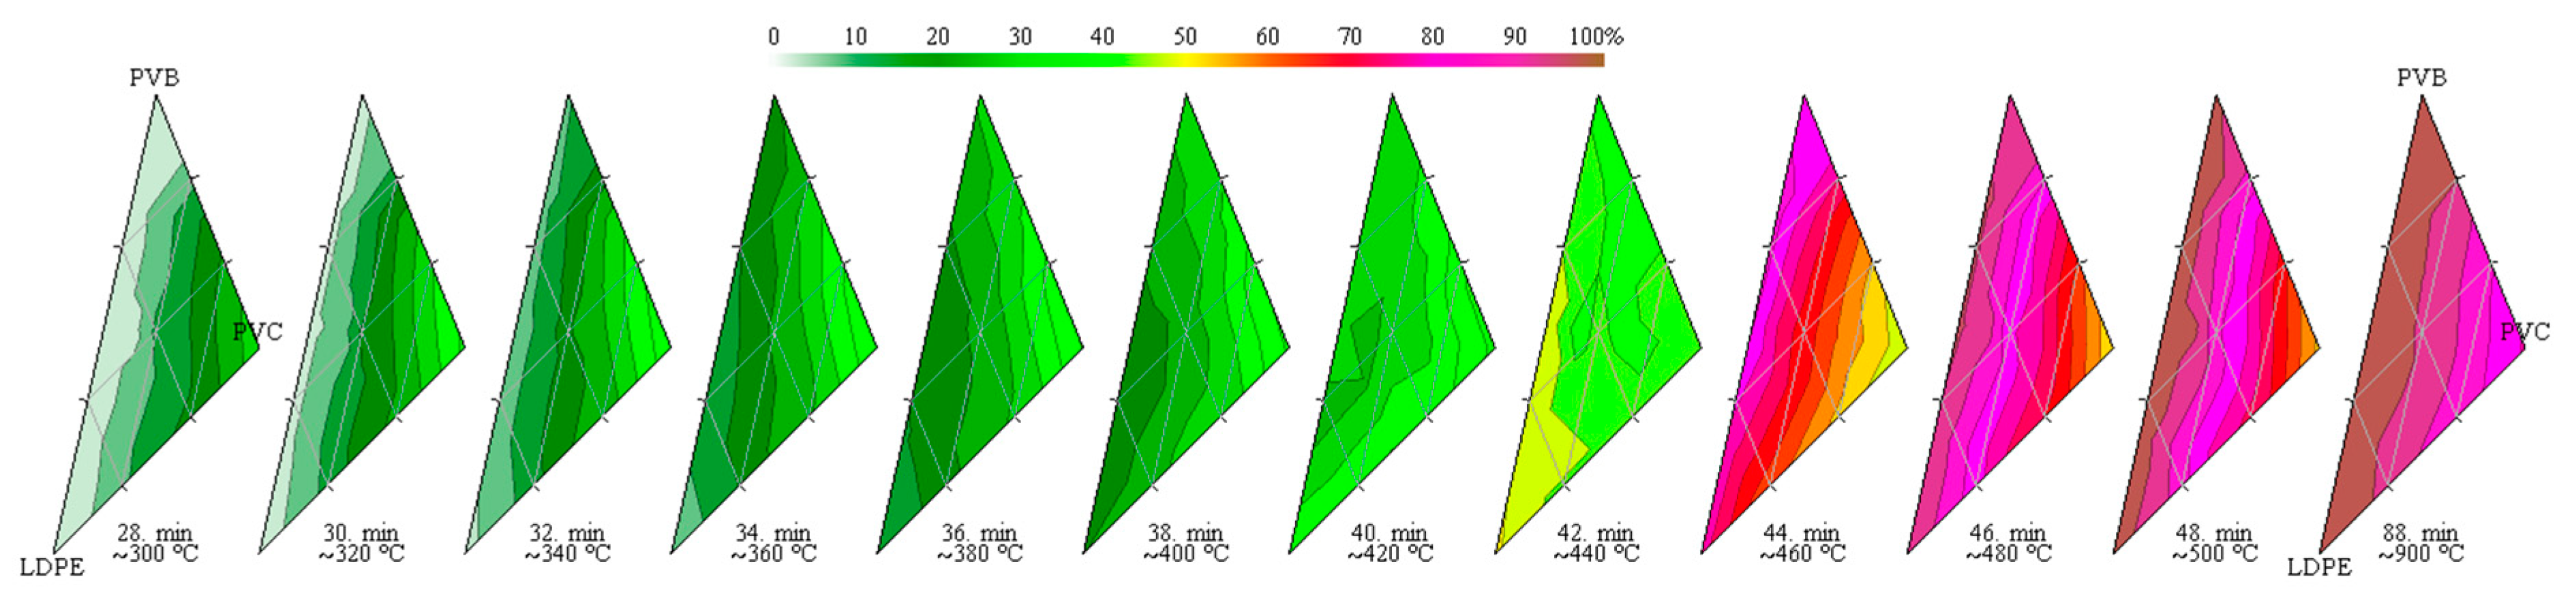
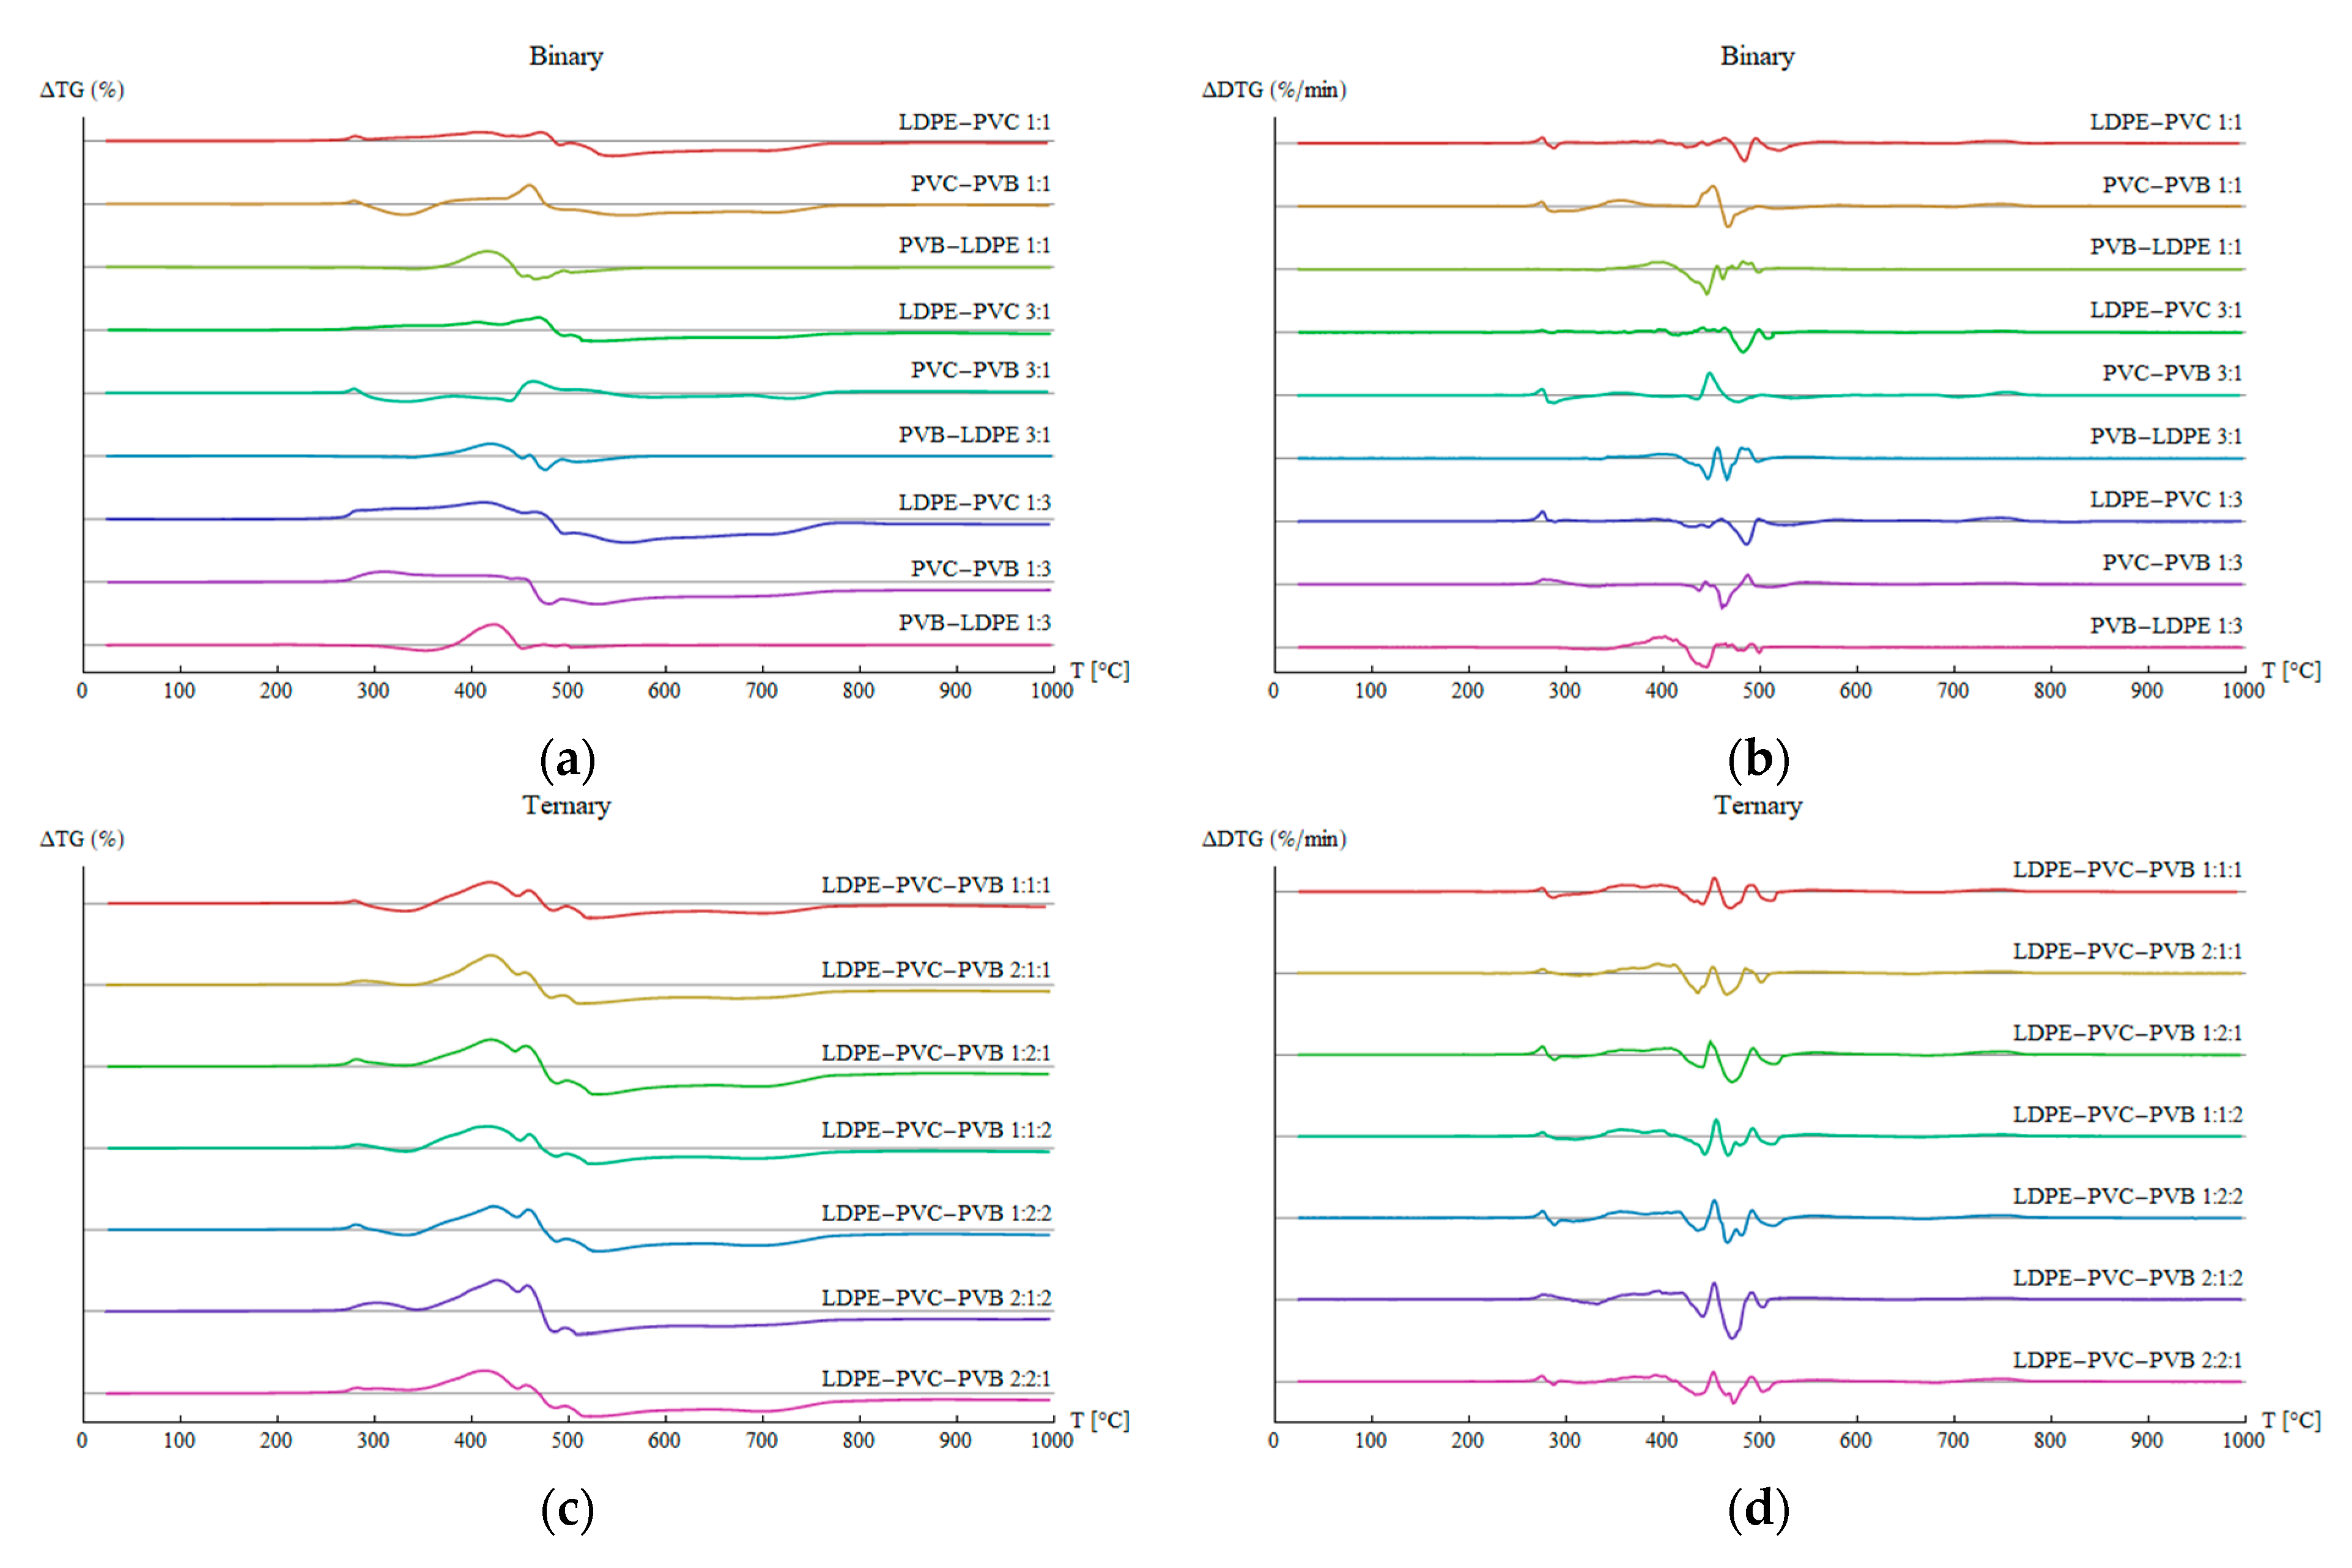
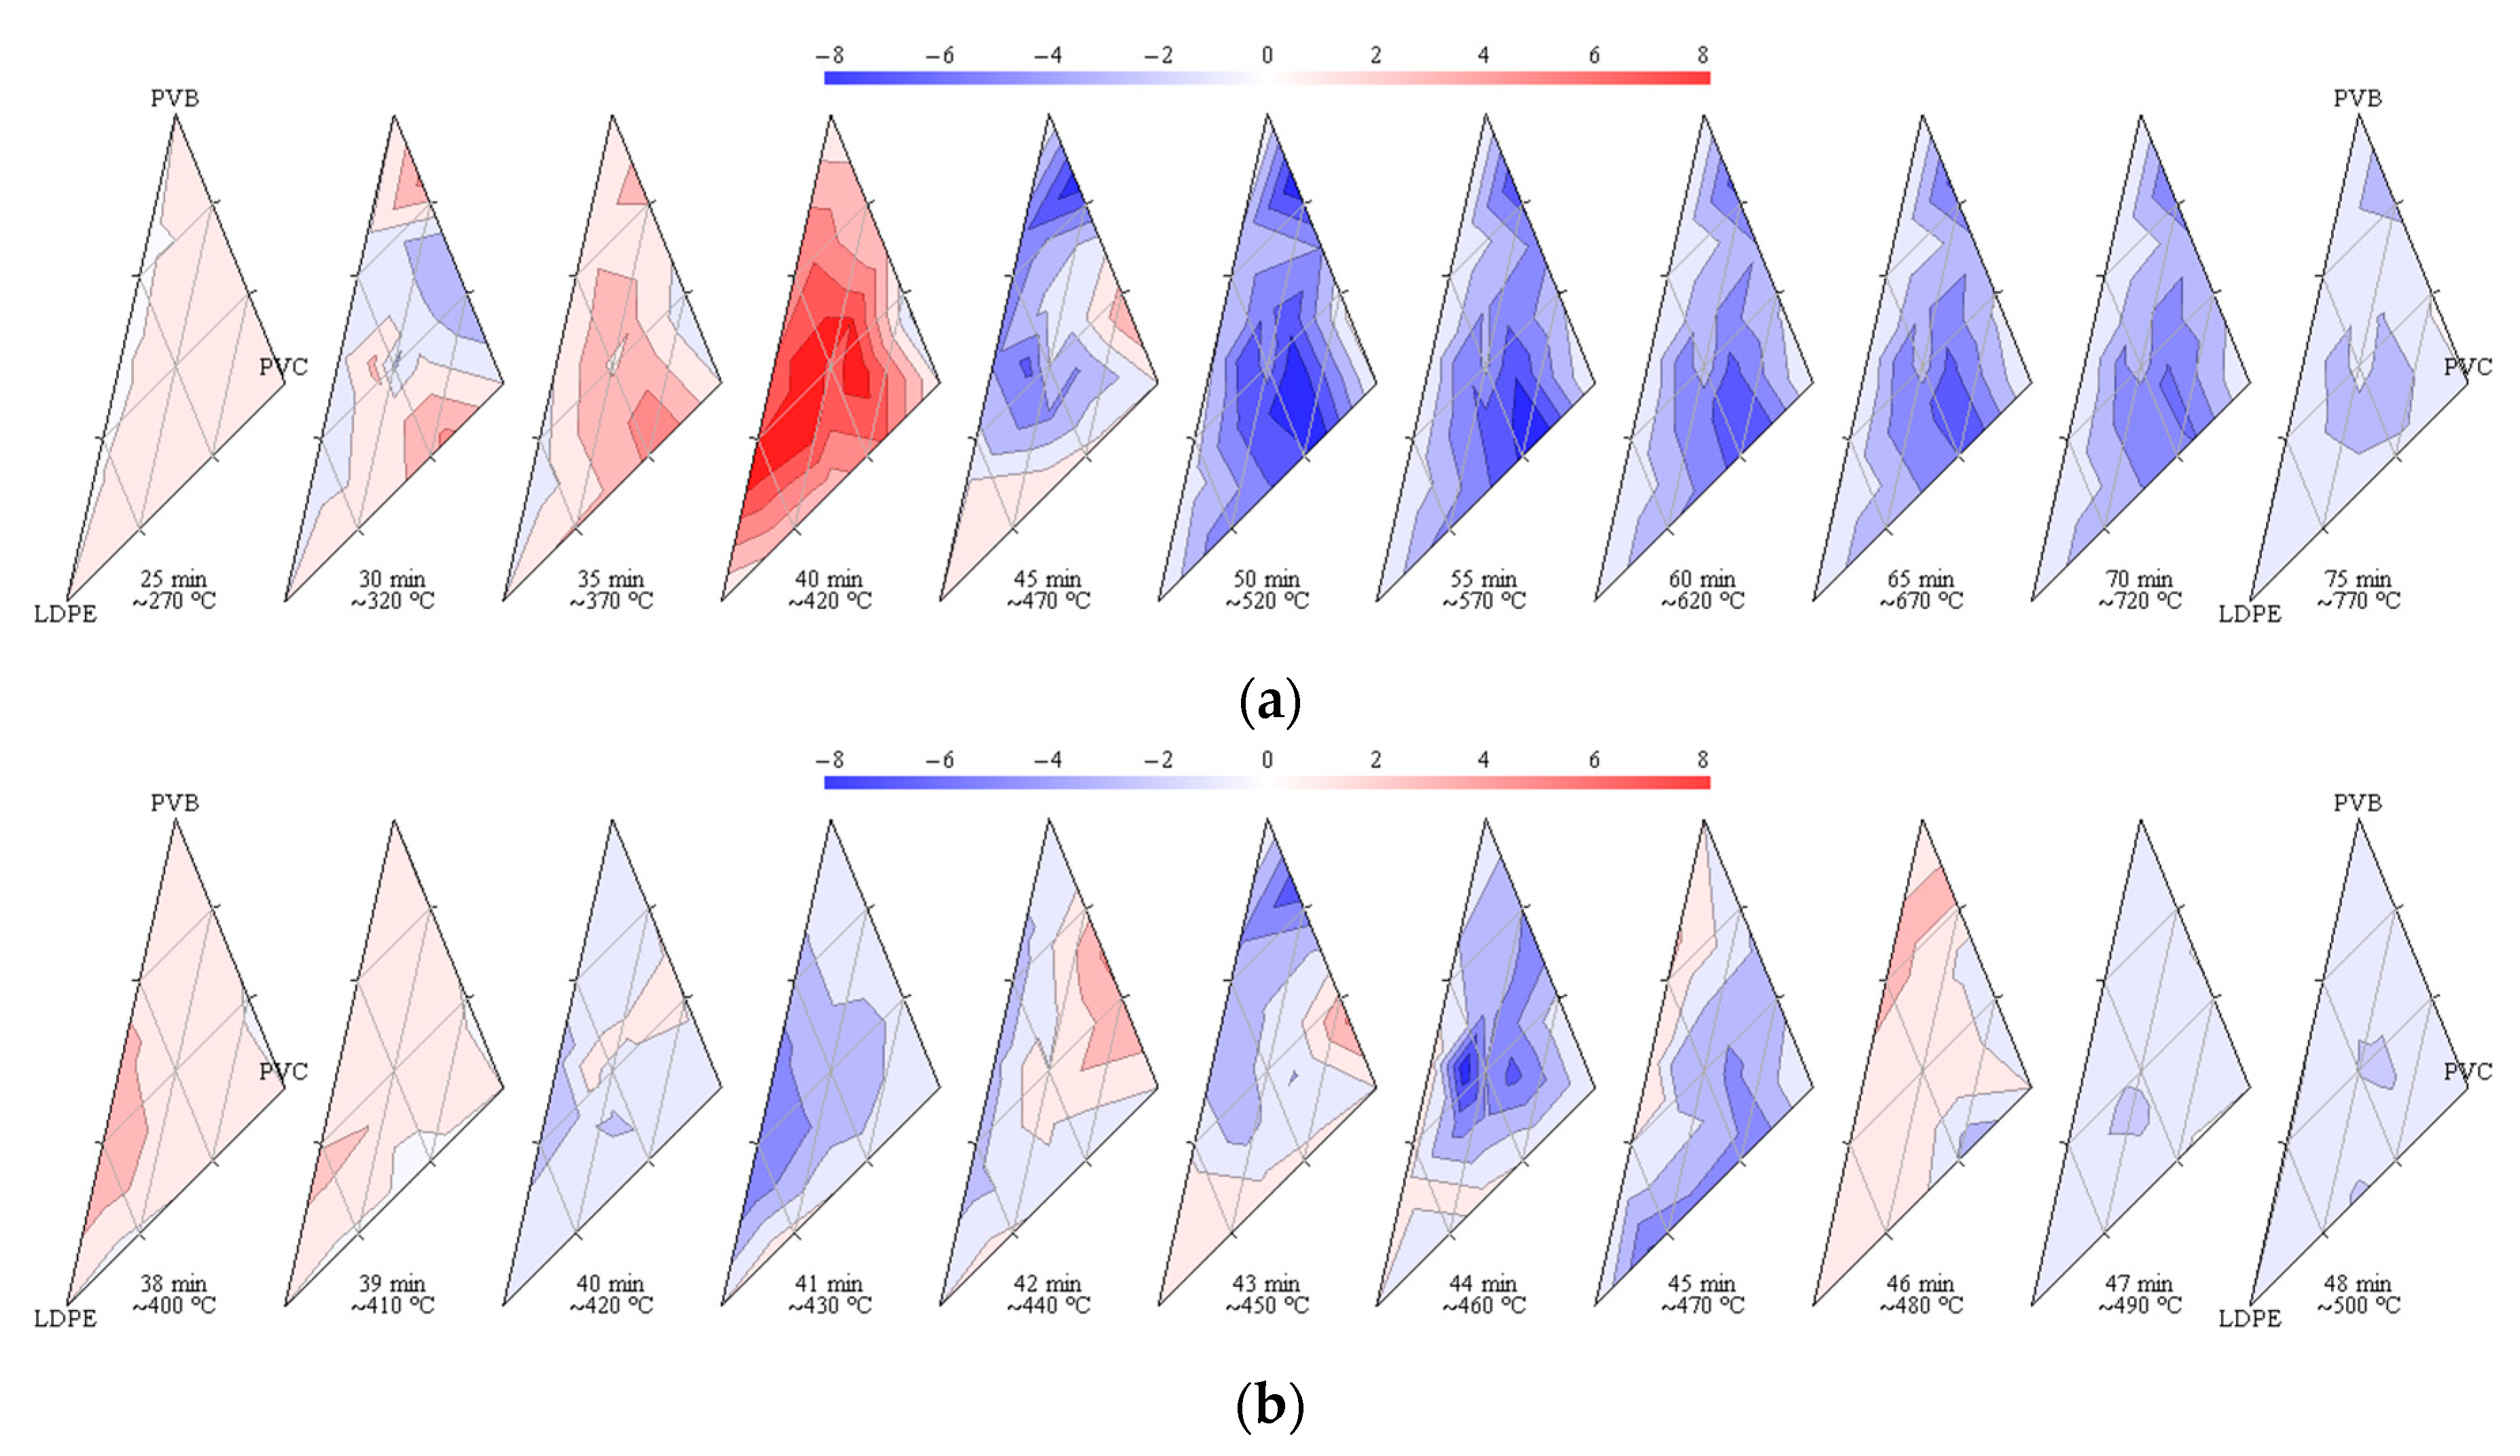
3.4. Synergy Effects

Figure 8 show plots of ΔTG and ΔDTG given by Equations (3) and (4) for binary and ternary mixtures of LDPE, PVC and PVB. Most ΔTG curves are above zero for temperatures less than around 450–470 °C, whereas below zero for larger temperatures. This means that the synergy effects for mass loss is positive in the initial stage of pyrolysis and negative in the further stage. However, samples PVC-PVB 1:1, PVB-LDPE 1:3, LDPE-PVC-PVB 1:1:1, 1:1:2 and 1:2:2 manifest negative synergy effects for temperatures up to 350–370 °C, and even to 440 °C for PVC-PVB 1:1. As for synergy in mass loss rate, the effects are variable, but in the temperature range of 350–450 °C they are mostly positive, which indicates a significant interaction of polymers in these temperatures.
To obtain a more comprehensive image of the synergy, a series of triangular plots of ΔTG for individual times was prepared (Figure 9a). The most dynamic changes in ΔDTG occur for temperatures around 400–500 °C; therefore, Figure 9b shows plots of ΔDTG in this temperature range. Each triangular plot represents synergy effects at a certain time, and each point in the triangles represents an individual sample, in which contributions of LDPE, PVC and PVB are equal to the barycentric coordinates of that point. The red color corresponds to positive values of ΔTG and ΔDTG, i.e., positive synergy effect, whereas the blue color corresponds to negative values. In the initial stage of pyrolysis up to temperatures around 450 °C, the mass loss is usually accelerated compared to the prediction (red regions). This effect may be regarded as positive because a higher conversion rate is obtained quicker for mixtures than for pure components.

3.5. Deconvolution Results

The deconvolution results for the components and basic blends 1:1 and 1:1:1 are presented in Figure 10, which shows the main peak triplets indicating the particular reaction steps for the three temperature programs. In addition, Table 3 presents the detailed analysis results for individual peaks. In some cases, the decomposition was ambiguous. Such unclear peaks were not processed and analyzed in the next steps. If the deconvolution led to two or three nearly overlapping peaks for which it was impossible to ascribe uniquely the corresponding steps in all the temperature programs, the overlapping peaks were combined back into one. Hence, the shape of some peaks in Figure 10 deviates from that produced by ADSF. It should be emphasized that although the deconvolution is sometimes unclear, it allows hidden information to be extracted, ordering of the results and elimination of some discrepancies due to the unidentified admixtures present in the samples.
In general, the corresponding peaks for different temperature programs are usually shifted towards higher temperatures when the heating rate increases. This is a typical behavior which is related to the inertia of particular processes during pyrolysis. Some discrepancies from this scheme can be partially ascribed to the reasons mentioned above; however, it is also possible that synergy effects can affect the shape and position of particular peaks. This will be discussed below.
In LDPE, one large peak was detected (LDPE-1) which is in accordance with the literature results [54]. In PVC, three significant peaks (PVC-1, PVC-2, PVC-5) were detected for all temperature programs, and in PVB—two significant peaks (PVB-1, PVB-2). The designations of the deconvoluted peaks were left the same as in Figure 3 for consistency.
In the LDPE-PVC 1:1 blend (Figure 10d), two peaks were clearly identified. Peak 1 corresponds to PVC-1 and is related to C-Cl bond cleavage, whereas peak 2 is a result of overlapping reactions in LDPE and PVC (peaks LDPE-1 and PVC-2). The temperature of peak 1 is insignificantly shifted upwards by 2–3 °C compared to PVC-1 (maxima at 283→286 °C, 297→299 °C, 300→302 °C for heating rates 10, 20, 30 °C/min, respectively—see Table 3). In turn, the composed peak 2 is shifted upwards by 5–8 °C compared to dominant peak LDPE-1 (470→488 °C, 486→491 °C, 483→491 °C, respectively—see Table 3). The minor peaks present in the PVC sample were hardly detected, and therefore were not further processed.
Three peaks were recognized in the PVC-PVB 1:1 blend (Figure 10e). Peak 1 is related to PVC-1 (C-Cl bond cleavage in PVC), peak 2 corresponds to PVB-1 (elimination of water from vinyl alcohol copolymer in PVB), and peak 3 is a combination of processes in PVC and PVB in that range of temperatures (PVC-2 + PVB-2). As in the LDPE-PVC 1:1 sample, peak 1 temperature is nearly unaffected by the presence of PVB (maxima at 283→285, 297→298, 300→303 °C compared to PVC-1). However, peak 2 is clearly shifted towards lower temperatures compared to PVB-1 (352→316, 363→354, 368→361 °C), which indicates that the first step in PVB degradation is positively affected by the presence of PVC, especially for the lowest heating rate. Peak 3 is a combination of smaller PVB-2 and dominant PVC-2 peaks. The temperature of the maximum is noticeably higher than that for both component peaks by around 5–8 °C. Hence, peak 3 is not a simple superposition of PVC-2 and PVB-2. This suggests that although processes related to PVC-2 begin at lower temperatures compared to PVB-2, they occur together in a certain range of temperatures and slightly affect one another.
Two peaks in the PVB-LDPE 1:1 sample (Figure 10f) were clearly identified—peak 1 originates in PVB-1 and peak 2 is a result of combined PVB-2 and LDPE-1. The temperature ranges of peak 1 are hardly changed compared to PVB-1 (see Table 3). Similarly, peak 2 shows small differences compared to its constituent peaks PVB-2 and LDPE-1. The changes are not regular; therefore, at least some of them must be a result of measurement and modelling errors. This, however, does not mean that there is no interaction between the processes corresponding to PVB-2 and LDPE-1.
Three peaks were detected in the LDPE-PVC-PVB 1:1:1 sample (Figure 10g). Peak 1 corresponds to PVC-1 and is shifted towards higher temperatures by around 2–4 °C (283→286, 297→299, 300→304 °C). Peak 2 is related to PVB-1. Similarly, as in PVC-PVB 1:1 blend, it is clearly shifted towards lower temperatures (352→320, 363→353, 368→361 °C). Peak 3 corresponds to interaction of LDPE-1, PVC-2 and PVB-2.
Based on the above analysis, it can be stated that in the presence of PVC, the peak related to the elimination of water from the vinyl alcohol copolymer in PVB is significantly shifted towards lower temperatures. As for temperatures of other peaks, they seem considerably unaffected with the presence of other components.

3.6. Peak Parameters and CPI

Based on Table 3, the overall CPI for the temperature program 10 °C/min was calculated and presented in Figure 5f. It follows that the highest CPI is observed for PVB (large narrow peak and high mass loss), whereas admixtures of LDPE (smaller and wider peak) and especially PVC (several smaller peaks and low total mass loss) significantly lower the index. The CPI value of a single component decreased in the order PVB > LDPE > PVC, which is caused by a different composition and structure of the tested materials. For binary and ternary mixtures, the CPI value increases as the PVC share decreases. However, the lowest observed CPI was found for the LDPE-PVC 1:1 mixture (amounted 167). A similar relationship was observed in the work [32] for a mixture of PVC with PE and PS.

3.7. Activation Energy

The activation energy for deconvoluted peaks of the components and their basic mixtures is summarized in Table 4. The Friedman and Starink methods led to similar values of activation energy and similar values of the determination coefficient R2, although usually the Starink method resulted in higher values of R2 and lower relative dispersion δR2—see bolded entries in Table 4. In case of some peaks, R2 was too low or δR2 too high to be accepted—those peaks were excluded from further analysis. Figure 11 shows activation energy vs. degree of conversion for the remaining peaks. The plots were prepared using the Friedman or Starink method based on higher value of R2 (bold numbers in Table 4).
The activation energy for individual steps varies from 70 to 380 kJ/mol. Peak PVC-1 has the activation energy nearly at a constant level of 150 kJ/mol (Figure 11a), but after adding LDPE or PVB, the energy changes from around 200 kJ/mol for a low degree of conversion to around 80 kJ/mol at the end of the stage (Figure 11b,c). Therefore, the admixture of LDPE and PVB affects the stage related with the C-Cl bond cleavage. The activation energy related to peak PVB-1 is around 150–200 kJ/mol (Figure 11a). Similar values are observed after adding LDPE (Figure 11b). However, in contact with PVC the activation energy is significantly lowered to around 80 kJ/mol (Figure 11b), whereas in the LDPE-PVC-PVB sample, it varies from around 80 do 120 kJ/mol (Figure 11c). This stays in agreement with the earlier observation that the presence of PVC shifts the PVB-1 peak towards lower temperatures (Section 3.5) and introduces interactions between PVC and PVB during the first stages of pyrolysis. Moreover, the activation energy for peaks in binary and ternary mixtures are lower than those for the corresponding peaks in the single-component samples.

4. Conclusions

The above-given study revealed the following observations:
  • Among the considered PWs, LDPE pyrolysis occurs in the narrowest range of temperatures, whereas PVC pyrolysis starts at the lowest temperature and ends at the highest one;
  • The mass loss was around 99% for LDPE and PVB, whereas it was only around 80% for PVC;
  • The highest mass loss rate was for PVB and the lowest was for PVC;
  • The pyrolysis of the considered mixtures showed noticeable synergy effects—in the initial stage of pyrolysis up to a temperature around 450 °C, the mass loss is accelerated compared to the prediction based on a simple superposition, which means a higher conversion rate than expected;
  • If the waste does not contain PVC, the pyrolysis is nearly complete at a temperature of around 500 °C for a heating rate of 10 °C/min, whereas PVC is not fully processed even at 995 °C;
  • The stage related to the elimination of water from the vinyl alcohol copolymer during PVB pyrolysis seems considerably affected by the presence of PVC by lowering the temperature of that step, whereas other pyrolysis steps do not show significant shifts in temperatures;
  • The activation energy varies significantly during the pyrolysis for all samples and all pyrolysis stages; it falls in the range around 70–380 kJ/mol; the activation energy related with particular pyrolysis steps was significantly lower in mixtures than in single-component samples;
  • CPI values are highest for PVB, and lowest for PVC.
The findings are indicative for management of LDPE, PVB and PVC wastes. The following conclusions can be formulated:
  • If the waste contains only LDPE and PVB, and PVC is absent, the final pyrolysis temperature can be around 500 °C, i.e., there is no need to use higher temperatures. This may significantly accelerate the process and lower the costs.
  • The synergistic effects influence significantly the pyrolysis process by accelerating some steps below around 450 °C and lowering the activation energy.
Further research will be focused on determining specific parameters of the chemical pyrolysis process for various plastic wastes.

Author Contributions

Conceptualization, B.J. and G.P.; methodology, B.J. and G.P.; software, P.J.; validation, B.J.; formal analysis, B.J. and G.P.; investigation, G.P. and J.Z.; resources, B.J. and G.P.; data curation, G.P.; writing—original draft preparation, B.J., G.P. and P.J.; writing—review and editing, B.J.; visualization, P.J.; supervision, B.J.; project administration, B.J.; funding acquisition, B.J. and G.P. All authors have read and agreed to the published version of the manuscript.

Funding

This research was funded by the Minister of Education and Science, grant number DWD/6/0571/2022. This research was financially supported by the Faculty of Infrastructure and Environment of the Czestochowa University of Technology. The APC was funded by the Faculty of Electrical Engineering of the Czestochowa University of Technology (BS/PB-3-300-3011/2024/P).

Data Availability Statement

The datasets presented in this article are not readily available because the data are part of an ongoing study.

Acknowledgments

The work was carried out as part of the 6th edition of the “Implementation Doctorate” program of the Minister of Education and Science and the subsidy of the Częstochowa University of Technology for the development and maintenance of the research potential of the Faculty of Infrastructure and Environment.

Conflicts of Interest

The authors declare no conflicts of interest. The funding sponsors had no role in the design of the study; in the collection, analyses, or interpretation of data; in the writing of the manuscript, and in the decision to publish the results.

References

  1. Vijaykumar, S.; Patel, M.R.; Patel, J.V. Pet Waste Management by Chemical Recycling: A Review. J. Polym. Environ. 2010, 18, 8–25. [Google Scholar] [CrossRef]
  2. Plastics Europe, The Circular Economy for Plastics—A European Overview. Available online: https://plasticseurope.org/knowledge-hub/the-circular-economy-for-plastics-a-european-overview/ (accessed on 3 March 2024).
  3. Harussani, M.M.; Sapuan, S.M.; Rashid, U.; Khalina, A.; Ilyas, R.A. Pyrolysis of polypropylene plastic waste into carbonaceous char: Priority of plastic waste management amidst COVID-19 pandemic. Sci. Total Environ. 2022, 803, 149911. [Google Scholar] [CrossRef] [PubMed]
  4. Chamas, A.; Moon, H.; Zheng, J.; Qiu, Y.; Tabassum, T.; Jang, J.H.; Abu-Omar, M.; Scott, S.L.; Suh, S. Degradation rates of plastics in the environment. ACS Sustain. Chem. Eng. 2020, 8, 3494–3511. [Google Scholar] [CrossRef]
  5. Geyer, R.; Jambeck, J.R.; Law, K.L. Production, use, and fate of all plastics ever made. Sci. Adv. 2017, 3, e1700782. [Google Scholar] [CrossRef] [PubMed]
  6. Lithner, D.; Larsson, A.; Dave, G. Environmental and health hazard ranking and assessment of plastic polymers based on chemical composition. Sci. Total Environ. 2011, 409, 3309–3324. [Google Scholar] [CrossRef] [PubMed]
  7. Yuan, Z.; Nag, R.; Cummins, E. Human health concerns regarding microplastics in the aquatic environment—From marine to food systems. Sci. Total Environ. 2022, 823, 153730. [Google Scholar] [CrossRef] [PubMed]
  8. European Commission. A European Strategy for Plastics in a Circular Economy, Communication from the Commission to the European Parliament, the Council, the European Economic and Social Committee and the Committee of the Regions. Strasburg, 2018. Document 52018DC0028. Available online: https://eur-lex.europa.eu/legal-content/EN/TXT/?uri=COM%3A2018%3A28%3AFIN (accessed on 3 March 2024).
  9. Environmental Investigation Agency. Available online: https://eia-international.org/about-us/reports/ (accessed on 3 March 2024).
  10. Jabłońska, B. Water consumption management in polyethylene terephthalate (PET) bottles washing process via wastewater pretreatment and reuse. J. Environ. Manag. 2018, 224, 215–224. [Google Scholar] [CrossRef] [PubMed]
  11. Jabłońska, B.; Kiełbasa, P.; Korenko, M.; Dróżdż, T. Physical and Chemical Properties of Waste from PET Bottles Washing as A Component of Solid Fuels. Energies 2019, 12, 2197. [Google Scholar] [CrossRef]
  12. Ragaert, K.; Delva, L.; Van Geem, K. Mechanical and chemical recycling of solid plastic waste. Waste Manag. 2017, 69, 24–58. [Google Scholar] [CrossRef]
  13. Supriyanto; Ylitervo, P.; Richards, T. Gaseous products from primary reactions of fast plastic pyrolysis. J. Anal. Appl. Pyrolysis 2021, 158, 105248. [Google Scholar] [CrossRef]
  14. Calero, M.; Solís, R.R.; Muñoz-Batista, M.J.; Pérez, A.; Blázquez, G.; Martín-Lara, M.A. Oil and gas production from the pyrolytic transformation of recycled plastic waste: An integral study by polymer families. Chem. Eng. Sci. 2023, 271, 118569. [Google Scholar] [CrossRef]
  15. Infiesta, L.R.; Ferreira, C.R.N.; Trovo, A.G.; Borges, V.L.; Carvalho, S.R. Design of an industrial solid waste processing line to produce refuse-derived fuel. J. Environ. Manag. 2019, 236, 715–719. [Google Scholar] [CrossRef] [PubMed]
  16. Costa, P.L.; Vaz de Miranda, D.M.; Pinto, J.C. Critical evaluation of life cycle assessment analyses of plastic waste pyrolysis. ACS Sustain. Chem. Eng. 2022, 10, 3799–3807. [Google Scholar] [CrossRef]
  17. Yousef, S.; Eimontas, J.; Stasiulaitiene, I.; Zakarauskas, K.; Striūgas, N. Pyrolysis of all layers of surgical mask waste as a mixture and its life-cycle assessment. Sustain. Prod. Consum. 2022, 32, 519–531. [Google Scholar] [CrossRef]
  18. Punkkinen, H.; Oasmaa, A.; Laatikainen-Luntama, J.; Nieminen, M.; Laine-Ylijoki, J. Thermal Conversion of Plastic-Containing Waste: A Review; Research Report No D4.1-22; VTT Technical Research Centre of Finland: Helsinki, Finland, 2017. [Google Scholar]
  19. Al-Salem, S.M.; Antelava, A.; Constantinou, A.; Manos, G.; Dutta, A. A review on thermal and catalytic pyrolysis of plastic solid waste (PSW). J. Environ. Manag. 2017, 197, 177–198. [Google Scholar] [CrossRef] [PubMed]
  20. Gabbar, H.A.; Aboughaly, M.; Stoute, C.A.B. DC thermal plasma design and utilization for the low density polyethylene to diesel oil pyrolysis reaction. Energies 2017, 10, 784. [Google Scholar] [CrossRef]
  21. Sharuddin, D.A.S.; Abnisa, F.; Daud, W.M.A.W.; Aroua, M.K. A review on pyrolysis of plastic wastes. Energy Convers. Manag. 2016, 115, 308–326. [Google Scholar] [CrossRef]
  22. Conesa, J.A.; Font, R.; Marcilla, A.; Garcia, A.N. Pyrolysis of polyethylene in a fluidized bed reactor. Energy Fuels 1994, 8, 1238–1246. [Google Scholar] [CrossRef]
  23. Poznańska, G.; Jabłońska, B. Europejskie trendy w recyklingu odpadów z tworzyw sztucznych. In Inżynieria Środowiska i Biotechnologia—Wyzwania i Nowe Technologie; Rosińska, A., Karwowska, B., Madeła, M., Eds.; Wyd. Politechniki Częstochowskiej: Częstochowa, Poland, 2022. [Google Scholar]
  24. Pielichowski, K.; Njuguna, J.; Majka, T.S. Thermal Degradation of Polymeric Materials, 2nd ed.; Elsevier: Amsterdam, The Netherlands, 2023. [Google Scholar] [CrossRef]
  25. Cho, M.H.; Song, Y.J.; Rhu, C.J.; Go, B.R. Pyrolysis Process of Mixed Microplastics Using TG-FTIR and TED-GC-MS. Polymers 2023, 15, 241. [Google Scholar] [CrossRef]
  26. Majewsky, M.; Bitter, H.; Eiche, E.; Horn, H. Determination of microplastic polyethylene (PE) and polypropylene (PP) in environmental samples using thermal analysis (TGA-DSC). Sci. Total Environ. 2016, 568, 507–511. [Google Scholar] [CrossRef]
  27. Genuino, H.C.; Ruiz, M.P.; Heeres, H.J.; Kersten, S.R.A. Pyrolysis of mixed plastic waste: Predicting the product yields. Waste Manag. 2023, 156, 208–215. [Google Scholar] [CrossRef]
  28. Hou, Q.; Zhen, M.; Qian, H.; Nie, Y.; Bai, X.; Xia, T.; Rehman, M.L.U.; Li, Q.; Ju, M. Upcycling and catalytic degradation of plastic wastes. Cell Rep. Phys. Sci. 2021, 2, 100514. [Google Scholar] [CrossRef]
  29. Dogu, O.; Pelucchi, M.; Van de Vijver, R.; Van Steenberge, P.H.M.; D’hooge, D.R.; Cuoci, A.; Mehl, M.; Frassoldati, A.; Faravelli, T.; Van Geem, K.M. The chemistry of chemical recycling of solid plastic waste via pyrolysis and gasification: State-of-the-art, challenges, and future directions. Prog. Energy Combust. Sci. 2021, 84, 100901. [Google Scholar] [CrossRef]
  30. Solis, M.; Silveira, S. Technologies for chemical recycling of household plastics—A technical review and TRL assessment. Waste Manag. 2020, 105, 128–138. [Google Scholar] [CrossRef] [PubMed]
  31. Karlsson, M.B.; Benedini, L.; Jensen, C.D.; Kamp, A.; Henriksen, U.B.; Thomsen, T.P. Climate footprint assessment of plastic waste pyrolysis and impacts on the Danish waste management system. J. Environ. Manag. 2024, 351, 119780. [Google Scholar] [CrossRef]
  32. Li, D.; Lei, S.; Wang, P.; Zhong, L.; Ma, W.; Chen, G. Study on the pyrolysis behaviors of mixed waste plastics. Renew. Energy 2021, 173, 662–674. [Google Scholar] [CrossRef]
  33. Mentes, D.; Nagy, G.; Szabó, T.J.; Hornyák-Mester, E.; Fiser, B.; Viskolcz, B.; Póliska, C. Combustion behaviour of plastic waste—A case study of PP, HDPE, PET, and mixed PES-EL. J. Clean. Prod. 2023, 402, 136850. [Google Scholar] [CrossRef]
  34. Alawa, B.; Choudhary, J.; Chakma, S. Discernment of synergism in co-pyrolysis of HDPE and PP waste plastics for production of pyro-oil: Mechanistic investigation with economic analysis and health risk assessment. Process Saf. Environ. Prot. 2023, 169, 107–131. [Google Scholar] [CrossRef]
  35. Martínez-Narro, G.; Royston, N.J.; Billsborough, K.L.; Phan, A.N. Kinetic modelling of mixed plastic waste pyrolysis. Chem. Thermodyn. Therm. Anal. 2023, 9, 100105. [Google Scholar] [CrossRef]
  36. Subhashini; Mondal, T. Experimental investigation on slow thermal pyrolysis of real-world plastic wastes in a fixed bed reactor to obtain aromatic rich fuel grade liquid oil. J. Environ. Manag. 2023, 344, 118680. [Google Scholar] [CrossRef]
  37. Jiang, G.; Fenwick, R.; Seville, J.; Mahood, H.B.; Thorpe, R.B.; Bhattacharya, S.; Sanchez Monsalve, D.A.; Leeke, G.A. Lumped kinetic modelling of polyolefin pyrolysis: A non-isothermal method to estimate rate constants. J. Anal. Appl. Pyrolysis 2022, 164, 105530. [Google Scholar] [CrossRef]
  38. European Standard CEN/TS 15414-1:2010; Solid Recovered Fuels—Determination of Moisture Content Using the Oven Dry Method—Part 1: Determination of Total Moisture by a Reference Method. European Committee for Standardization: Brussels, Belgium, 2010.
  39. Polish Standard PN-EN ISO 3451-1; Tworzywa Sztuczne. Oznaczanie Popiołu. Metody Ogólne. Polish Committee for Standardization: Warsaw, Poland, 2010.
  40. Skalmowski, K.; Wolska, K.; Pieniak, U.; Roszczyńska, I. Badania Właściwości Technologicznych Odpadów Komunalnych. Ćwiczenia Laboratoryjne; Oficyna Wydawnicza Politechniki Warszawskiej: Warszawa, Poland, 2004; pp. 94–97. [Google Scholar]
  41. Polish Standard PN-EN ISO 1183; Tworzywa Sztuczne—Metody Oznaczania Gęstości Tworzyw Sztucznych Nieporowatych—Część 1: Metoda Zanurzeniowa, Metoda Piknometru Cieczowego i Metoda Miareczkowa. Polish Committee for Standardization: Warsaw, Poland, 2019.
  42. Polish Standard PN-EN ISO 21663:2021-06; Solid Secondary Fuels—Instrumental Methods for the Determination of Carbon (C), Hydrogen (H), Nitrogen (N) and Sulphur (S). Polish Committee for Standardization: Warsaw, Poland, 2021.
  43. Polish Standard PN-EN ISO 21654:2021-12; Stałe Paliwa Wtórne—Oznaczanie Wartości Opałowej. Polish Committee for Standardization: Warsaw, Poland, 2021.
  44. Polish Standard PN-EN 15408:2011; Stałe Paliwa Wtórne—Metody Oznaczania Zawartości Siarki (S), Chloru (Cl), Fluoru (F) i Bromu (Br). Polish Committee for Standardization: Warsaw, Poland, 2011.
  45. da Silva, J.C.G.; de Albuquerque, J.G.; de Araujo Galdino, W.V.; de Sena, R.F.; Andersen, S.L.F. Single-step and multi-step thermokinetic study—Deconvolution method as a simple pathway for describe properly the biomass pyrolysis for energy conversion. Energy Convers. Manag. 2020, 209, 112653. [Google Scholar] [CrossRef]
  46. Vyazovkin, S.; Burnham, A.K.; Criado, J.M.; Pérez-Maqueda, L.A.; Popescu, C.; Sbirrazzuoli, N. ICTAC Kinetics Committee recommendations for performing kinetic computations on thermal analysis data. Thermochim. Acta 2011, 520, 1–19. [Google Scholar] [CrossRef]
  47. Starink, M. The determination of activation energy from linear heating rate experiments: A comparison of the accuracy of isoconversion methods. Thermochim. Acta 2003, 404, 163–176. [Google Scholar] [CrossRef]
  48. Brendgen, R.; Graßmann, C.; Grethe, T.; Mahltig, T.; Schwarz-Pfeiffer, A. Coatings with recycled polyvinyl butyral on polyester and polyamide mono- and multifilament yarns. J. Coat Technol Res. 2021, 18, 819–829. [Google Scholar] [CrossRef]
  49. Królikowski, M.; Żach, P.; Kalestyński, M. Selection of Conditions in PVB Polymer Dissolution Process for Laminated Glass Recycling Applications. Polymers 2022, 14, 5119. [Google Scholar] [CrossRef]
  50. Carrot, C.; Bendaoud, A.; Pillon, C. Polyvinyl Butyral. In Handbook of Thermoplastics, 2nd ed.; Olabisi, O., Adewale, K., Eds.; CRC Press: Boca Raton, FL, USA, 2016. [Google Scholar] [CrossRef]
  51. Singh, M.V.; Kumar, S.; Sarker, M. Waste HD-PE plastic, deformation into liquid hydrocarbon fuel using pyrolysis-catalytic cracking with a CuCO3 catalyst. Sust. Energy Fuels 2018, 2, 1057–1068. [Google Scholar] [CrossRef]
  52. Polish Standard PN-C-96024:2020-12; Petroleum Products—Fuel Oils. Polish Committee for Standardization: Warsaw, Poland, 2020. (In Polish)
  53. Onwudili, J.A.; Insura, N.; Williams, P.T. Composition of products from the pyrolysis of polyethylene and polystyrene in a closed batch reactor: Effects of temperature and residence time. J. Anal. Appl. Pyrolysis. 2009, 86, 293–303. [Google Scholar] [CrossRef]
  54. Lee, N.; Joo, J.; Lin, K.Y.A.; Lee, J. Waste-to-Fuels: Pyrolysis of Low-Density Polyethylene Waste in the Presence of H-ZSM-11. Polymers 2021, 13, 1198. [Google Scholar] [CrossRef]
  55. McNeil, I.C.; Memetea, L.; Cole, W.J. A study of the products of PVC thermal degradation. Polym. Degrad. Stab. 1995, 49, 181–191. [Google Scholar] [CrossRef]
  56. Liau, L.C.K.; Yang, T.C.K.; Viswanath, D.S. Reaction Pathways and Kinetic Analysis of PVB Thermal Degradation Using TG/FT-IR. Appl. Spectrosc. 1996, 50, 1058–1065. [Google Scholar] [CrossRef]
  57. Yan, H.; Cannon, W.R.; Shanefield, D.J. Poly(vinyl butyral) pyrolysis: Interactions with plasticizer and AIN ceramic powder. MRS Online Proc. Libr. 1992, 249, 377–382. [Google Scholar] [CrossRef]
  58. Iida, T.; Nakanishi, M.; Gotō, K. Investigations on poly(vinyl chloride). I. Evolution of aromatics on pyrolysis of poly(vinyl chloride) and its mechanism. J. Polym. Sci. Polym. Chem. Ed. 1974, 12, 737–749. [Google Scholar] [CrossRef]
  59. Mehl, M.; Marongiu, A.; Faravelli, T.; Bozzano, G.; Dente, M.; Ranzi, E. A kinetic modeling study of the thermal degradation of halogenated polymers. J. Anal. Appl. Pyrolysis. 2004, 72, 253–272. [Google Scholar] [CrossRef]
  60. Cepelioğullar, Ö.; Pütün, A. Utilization of two different types of plastic wastes from daily and industrial life. J. Selcuk Univ. Nat. Appl. Sci. 2013, 2, 694–706. [Google Scholar]
  61. Liau, L.C.K.; Viswanath, D.S. Thermal Degradation of Poly(vinylbutyral)/Ceramic Composites: A Kinetic Approach. Ind. Eng. Chem. Res. 1998, 37, 49–57. [Google Scholar] [CrossRef]
  62. McLafferty, F.W.; Tureček, F. Interpretation of Mass Spectra, 4th ed.; University Science Books: Sausalito, CA, USA, 1993. [Google Scholar]
  63. Silverstein, R.M.; Webster, F.X.; Kiemle, D.J. Spectrometric Identification of Organic Compounds, 7th ed.; Wiley: Hoboken, NJ, USA, 2005. [Google Scholar]
Figure 1. LDPE (a), PVC (b) and PVB (c) waste granulates used in the tests: upper photos—original regranulates from mechanical recycling, lower photos—ground material for blending in presumed proportions.
Energies 17 03458 g001
Figure 2. Structural formulas of pure PE (a), PVC (b) and PVB (c).
Energies 17 03458 g002
Figure 3. TG/DTG curves for used LDPE, PVC, PVB and their binary blends at a heating rate of 10 °C/min: (a) TG for LDPE, PVC, PVB, (b) DTG for LDPE, PVC and PVB with designations of peaks, (c) TG for LDPE-PVC blends, (d) DTG for LDPE-PVC blends, (e) TG for PVC-PVB blends, (f) DTG for PVC-PVB blends, (g) TG for PVB-LDPE blends, (h) DTG for PVB-LDPE blends, (i) TG for LDPE-PVC to PVB blends, (j) DTG for LDPE-PVC to PVB blends, (k) TG for PVC-PVB to LDPE blends, (l) DTG for PVC-PVB to LDPE blends, (m) TG for PVB-LDPE to PVC blends, and (n) DTG for PVB-LDPE to PVC blends.
Energies 17 03458 g003aEnergies 17 03458 g003b
Figure 4. Snapshots of percentage of processed mass for used LDPE, PVC and PVB waste and their blends in the temperature range 300–500 °C and 900 °C.
Energies 17 03458 g004
Figure 5. Overall parameters of the pyrolysis process vs. LDPE, PVC and PVB share at a heating rate of 10 °C/min (boundaries of the zones obtained by linear approximation between data points): (a) initial pyrolysis temperature, (b) final pyrolysis temperature, (c) total mass loss, (d) mass loss at 500 °C, (e) average mass loss rate, and (f) influence of LDPE, PVC and PVB contribution on CPI (values in %3 °C−3min−2 × 10⁻⁶).
Energies 17 03458 g005aEnergies 17 03458 g005b
Figure 6. Mass spectra of gaseous products at various temperatures during pyrolysis of used LDPE (a), PVC (b) and PVB (c) (colors are used to indicate particular groups of fragments: magenta—CnH2n−1, green—CnH2n, orange—CnH2n+1, blue—water related, cyan—CnH2n−2N).
Energies 17 03458 g006
Figure 7. FTIR spectra of gaseous products at various temperatures during pyrolysis of used waste LDPE (a), PVC (b) and PVB (c).
Energies 17 03458 g007aEnergies 17 03458 g007b
Figure 8. Synergy effects in TG and DTG curves at a heating rate of 10 °C/min: (a) ΔTG for binary mixtures, (b) ΔDTG for binary mixtures, (c) ΔT for ternary mixtures, and (d) ΔDTG for ternary mixtures.
Energies 17 03458 g008
Figure 9. Synergy effects in TG and DTG curves at a heating rate of 10 °C/min; each triangle represents synergy effects vs. share of the components; red color—positive, blue color—negative; (a) TG synergy effects for 25–75 min, and (b) DTG synergy effects for 38–48 min corresponding roughly to temperatures 400–500 °C.
Energies 17 03458 g009
Figure 10. The results of decomposition of DTG curves into model peaks (less significant peaks are not shown for clarity; color indicates the temperature program, and different line styles are used for particular peaks): (a) LDPE, (b) PVC, (c) PVB, (d) LDPE-PVC 1:1, (e) PVC-PVB 1:1, (f) PVB-LDPE 1:1, and (g) LDPE-PVC-PVB 1:1:1.
Energies 17 03458 g010
Figure 11. Activation energy vs. the degree of conversion: (a) activation energy for LDPE, PVC and PVB peaks, (b) activation energy for 1:1 binary mixtures, and (c) activation energy for ternary 1:1:1 mixture peaks.
Energies 17 03458 g011
Table 1. Samples used in the study.
GroupNoFull DesignationShort DesignationNormalized Share
γ LDPE γ PVC γ PVB
Components1LDPE1:0:01.000.000.00
2PVC0:1:00.001.000.00
3PVB0:0:10.000.001.00
Binary 4LDPE-PVC 1:11:1:00.500.500.00
mixtures5PVC-PVB 1:10:1:10.000.500.50
6PVB-LDPE 1:11:0:10.500.000.50
7LDPE-PVC 3:13:1:00.750.250.00
8PVC-PVB 3:10:3:10.000.750.25
9PVB-LDPE 3:11:0:30.250.000.75
10LDPE-PVC 1:31:3:00.250.750.00
11PVC-PVB 1:30:1:30.000.250.75
12PVB-LDPE 1:33:0:10.750.000.25
Ternary 13LDPE-PVC-PVB 1:1:11:1:10.330.330.33
mixtures14LDPE-PVC-PVB 2:1:12:1:10.500.250.25
15LDPE-PVC-PVB 1:2:11:2:10.250.500.25
16LDPE-PVC-PVB 1:1:21:1:20.250.250.50
17LDPE-PVC-PVB 1:2:21:2:20.200.400.40
18LDPE-PVC-PVB 2:1:22:1:20.400.200.40
19LDPE-PVC-PVB 2:2:12:2:10.400.400.20
Table 2. Physical and chemical analysis of used WPs.
WPProximate AnalysisUltimate Analysis
W aAsh dVM daf ρ Q s CHNSOCl
wt%wt%wt%g/cm3kJ/gwt%wt%wt%wt%wt%wt%
LDPE0.121.0898.920.90644.8585.213.250.020.010.910.61
PVC0.111.1998.801.42114.2131.53.690.090.0144.8218.7
PVB0.231.3198.691.06939.0576.811.450.050.0110.090.29
Wa—moisture content, Ashd—ash content, VMdaf—volatile matter content, ρ —density, Q s —heat of combustion, a—analytic basis, d—dry basis, and daf—dry, ash free basis.
Table 3. The dominant peak parameters obtained via peak deconvolution ( β —temperature program, T i —initial temperature, T f —final temperature, T m —maximum loss rate temperature, Δ T 1 / 2 —half width temperature range, Δ w —mass loss percentage, R m —maximum mass loss rate, R a —average mass loss rate, η —fraction of total mass loss, and D —peak CPI).
Parameter β T i T f T m Δ T 1 / 2 Δ w R m R a η D
Sample°C/min°C°C°C°C%%/min%/min*
LDPE10334.0492.3470.036.892.616.96.40.961734
Peak 120394.5509.3485.739.393.441.616.50.998546
30396.5511.6483.242.590.959.524.60.9916,319
PVC10254.8340.6283.127.337.911.24.60.48983
Peak 120269.2357.4296.634.536.419.28.60.502159
30272.9360.5300.137.635.628.112.90.504166
Peak 210422.2582.3461.850.114.82.51.00.194
20395.6553.0476.258.614.34.51.90.2011
30391.5551.4473.260.014.66.92.80.2026
Peak 510701.6778.7748.947.15.81.20.70.070
20708.1836.5794.266.27.32.21.10.100
30689.5827.7785.274.77.13.01.60.101
PVB10276.1401.7352.145.126.45.22.20.2768
Peak 120289.1420.1363.047.425.49.94.00.27203
30299.9411.7368.050.822.814.26.50.25374
Peak 210432.3476.6454.919.458.334.213.90.607285
20442.5506.2471.735.459.837.819.30.635892
30438.3508.1471.035.962.454.927.50.6812,724
LDPE-PVC10266.8313.8286.015.213.06.62.80.15207
1:120272.3359.9298.529.417.010.04.00.20284
Peak 130273.9366.8301.530.915.513.45.20.18422
Peak 210355.0496.5477.942.348.110.03.70.54251
20401.9518.7491.442.258.725.410.40.681857
30398.5520.5491.146.159.336.315.10.703592
PVC-PVB10267.8330.8284.819.616.56.42.60.19186
1:120273.3358.9297.528.217.110.54.10.20322
Peak 130277.3375.6303.430.915.913.65.10.19427
Peak 210226.6377.5316.059.512.92.00.90.155
20234.2409.0353.665.912.83.61.50.1513
30255.2405.8361.455.911.56.02.40.1333
Peak 310433.0493.1463.227.636.714.26.80.42640
20389.4516.2481.152.846.716.87.50.54598
30389.8515.5482.047.450.429.812.50.592110
PVB-LDPE10263.8402.1350.452.417.73.11.30.1815
1:120285.7420.3361.053.513.14.62.00.1422
Peak 130284.6413.7364.549.112.27.23.00.1352
Peak 210400.8482.3457.830.275.322.510.50.773196
20421.3513.6485.137.181.440.718.10.877924
30416.8511.1486.137.780.760.526.30.8816,824
LDPE-PVC-10268.0320.7285.918.510.14.61.90.1163
PVB 1:1:120274.2349.4298.628.55.73.71.60.0614
Peak 130277.0377.4304.135.66.85.42.20.0827
Peak 210223.3392.5320.767.412.31.70.70.133
20248.7411.6353.662.66.92.00.90.082
30258.2403.9361.253.46.83.71.50.087
Peak 310394.7486.7464.141.256.314.47.00.61748
20403.3513.4485.242.774.532.313.90.824012
30397.6515.5488.742.172.047.818.90.817967
* D in units of %3 °C−3 min−2 × 10⁻⁶.
Table 4. Activation energy summarization for used LDPE, PVC, PVB and their basic mixtures.
Friedman MethodStarink Method
PeakMean EδE *Mean R2δR2 *Mean EδE *Mean R2δR2 *
kJ/mol%%kJ/mol%%
LDPE-1183960.89111261160.826
PVC-1144460.963141140.962
PVC-2 **0.701150.76106
PVC-5 **711410.39148169210.5584
PVB-1212100.8845191290.9422
PVB-2902610.47196268770.8311
LDPE-PVC-1522660.491681281040.946
LDPE-PVC-2204570.917169900.849
PVC-PVB-189880.991128731.000
PVC-PVB-282580.901574200.9612
PVC-PVB-3 **0.551610.8367
PVB-LDPE-1197280.8241177380.8420
PVB-LDPE-2143880.832516380.8413
LDPE-PVC-PVB-1601560.9611122951.001
LDPE-PVC:PVB-2109920.901885480.9214
LDPE-PVC:PVB-3146510.8233199490.8732
* δE = 100% (Max E − Min E)/(Mean E), δR2 = 100% (Max R2 − Min R2)/(Mean R2). ** peaks excluded from further analysis.
Disclaimer/Publisher’s Note: The statements, opinions and data contained in all publications are solely those of the individual author(s) and contributor(s) and not of MDPI and/or the editor(s). MDPI and/or the editor(s) disclaim responsibility for any injury to people or property resulting from any ideas, methods, instructions or products referred to in the content.

