Abstract
The Meager Mountain Geothermal Project stands as one of the pioneering geothermal energy initiatives in its early stages of resource development. Despite its abundant geothermal heat resources, no prior studies have systematically evaluated the potential of implementing coaxial borehole heat exchangers on site. This study addresses this research gap by presenting a comprehensive heat transfer model for an underground closed-loop geothermal system utilizing a single coaxial well. Finite element analysis incorporated fluid and solid heat transfer, as well as solid mechanics. The results obtained facilitated the construction of the temperature and thermal stress profiles induced by the cooling effects resulting from years of heat extraction. After 25 years of operation, the outlet temperature has reached approximately 74 °C, and the maximum radial tensile thermal stress amounts to ~47 MPa. Furthermore, the analysis demonstrates that higher fluid velocities contribute to more perturbed temperature and stress distributions. The study attained maximum thermal and electric power outputs of 208 kW and 17 kW, respectively. This research also underscores the significant impact of geothermal gradient and well length on BHE design, with longer wells yielding more power, especially at higher injection velocities.
1. Introduction
The growing conflict between the traditional use of fossil fuels and environmental concerns has intensified as the socioeconomic factors have become stronger. The utilization of fossil fuels leads to the emission of carbon dioxide and sulfur dioxide, posing a threat to the environment [1]. Consequently, the study and development of renewable energy sources have garnered significant public attention. One emerging category of renewable energy is geothermal energy due to its reduced emissions, higher availability, higher base-load production, and climatic independence [2].
The Mount Meager geothermal project stands as Canada’s most advanced volcano-hosted geothermal energy initiative in its early stages of resource development, particularly within its southern region [3]. The Mount Meager Volcanic Complex, in southwestern British Columbia, is an active volcanic massif that last erupted around 2350 years ago. Numerous reports and publications have confirmed its great potential as a geothermal energy source, with zones of high permeability residing in the fractured basement reservoir [3,4,5,6]. The results of the exploration work completed to date strongly indicate the presence of a geothermal reservoir with an aerial extent of 4.5 to 7.5 km2 and an average temperature from 220 to 240 °C, with a maximum measured temperature of 275 °C. These attributes identify the South Meager field as a “high-temperature” field and a major geothermal site. The abundant geothermal resource could be the result of either water being heated at great depths or a cooling intrusive phase being present due to the volcanic activity [4].
Geothermal energy deeply stored within hot dry rocks can be harnessed through either an enhanced geothermal system (EGS) or by utilizing borehole heat exchangers (BHEs) [7,8]. An EGS creates a designed hydrothermal reservoir for extracting geothermal energy from hot rocks when the natural permeability or porosity is insufficient to support the required flow rates of the enhanced system [7]. With EGS, extraction is achieved by pumping a working fluid into a designed fracture system through an injection well, where it is heated by the rocks before being transferred to a different well. On the other hand, a BHE is a geothermal energy extraction system that utilizes a structure to transfer heat between the ground and a heat pump system. BHEs can be designed in various configurations, such as single well or well array, depending on the specific application [9,10]. The heat transfer performance of BHEs is influenced by factors such as the thermal conductivity of the surrounding rock and soil, the stratum structure, and the characteristics of the fluid inside the exchanger [11,12]. Overall, both EGSs and BHEs offer efficient methods for geothermal energy extraction, with EGSs providing a stable heat mining rate, and BHEs offering enhanced heat transfer performance [12]. EGSs also have the advantage of minimal land area requirement, good seasonal heat storage performance, and high efficiency in winter [13]. However, EGSs present technological challenges due to their potential to induce seismic activity [14]. On the other hand, BHEs, functioning as closed-loop solution, can avoid issues like fracture blockage and fluid losses in porous reservoirs [15].
Much research has been conducted in recent years to investigate the applicability, efficiency, and performance of BHEs at specific project sites. The most commonly used BHEs are exchangers with either a single or a double U-tube structure, as well as a coaxial heat exchanger. Using a U-tube structure, Tarrad [16] performed a thermal assessment for a heat pump utilized for cooling purposes; Li et al. [17] conducted experimental and numerical studies on the heat transfer characteristics of a vertical deep U-pipe for geothermal purposes; and Alimonti et al. [15] carried out a sustainability assessment and performance evaluation of a heat pump system coupling model. On the other hand, when examining a coaxial structure, Huang et al. [18] compared field tests with numerical investigations on a deep coaxial borehole heat exchanger based on a distributed optical fiber temperature sensor; Song et al. [19] evaluated the heat extraction performance of a downhole coaxial heat exchanger by considering the fluid flow in the reservoir; and Hu et al. [20] modeled a coaxial borehole heat exchanger to exploit geothermal energy from abandoned petroleum wells. Due to the great amount of computational effort, scholars have employed various means to find a solution, including commercial software, such as COMSOL, ANSYS [21], FLUENT [17], OGS [18], and numerical computing methods utilizing different coding languages [15,19,22].
The thermoelastic impact on geothermal extraction is a significant factor in determining the efficiency and safety of heat extraction for both EGSs and BHEs [23,24]. The stress field disturbance caused by cold fluid injection can alter the porosity and permeability of the reservoir, affecting the overall temperature and pressure of the system [25]. The mechanical aspect of stress redistribution during and after the working cycle plays a crucial role in the behavior of the reservoir and the surrounding rock masses [26]. Understanding the consequences of long-term heat extraction is important for the development of geothermal projects and requires collaboration between the oil/gas, mining, and geothermal industries and academia [27].
Numerous prior studies engaged in numerical modeling have been conducted to assess the performance of BHEs, integrating the sensitivity analyses of diverse factors. However, most of these investigations exhibit site specificity and have encountered multifaceted constraints. Notably, none of these studies were conducted at the Mount Meager project site. Although the southern Mount Meager geothermal resource is available at a shallow depth with temperatures reaching 200 °C at a depth of 500 m, the low permeability of the geothermal reservoir makes traditional hydrothermal systems, which rely on extracting large volumes of in-situ fluid, economically unfeasible and unscalable. Here, we investigate the use of a coaxial heat exchanger for heat resources in shallow and low-permeability reservoirs in the area. Furthermore, limited research has delved into evaluating thermal stresses induced by the cooling effect resultant from heat extraction, presenting a notable research gap. The present study addresses this gap by proposing a numerical model utilizing COMSOL to ascertain the temperature and thermally induced stress change profile using site-specific geological data. This model incorporates considerations for fluid and solid heat transfer, as well as solid mechanics.
2. Methodology
Drawing from the geological features of Mount Meager, a numerical model that couples the wellbore and the reservoir was established. Although this research possesses three-dimensional characteristics, it was approached in a two-dimensional asymmetrical manner due to the wellbore’s asymmetry. This reduction significantly minimized both the required mesh density and computational time. Furthermore, the model was constructed based on the following assumptions:
- Components such as casing, cement, and rock exhibit homogeneity and isotropy.
- The rocks are fully saturated with water. Little groundwater movement is simulated due to the rock matrix’s low permeability and porosity [28]. In fact, given that a BHE operates as a closed-loop system, the impact of seepage is not deemed critical. The heat transfer effectiveness of the BHE is not significantly enhanced by the groundwater flow unless there is a simultaneous improvement in the thermal conductivity of the borehole and the velocity of groundwater. For this study, the heat transfer within the reservoir follows the theory of local thermal equilibrium.
- The non-isothermal pipe flow model characterizes fluid movement and heat transfer within the injection and production pipe, and the radial flow of the circulating fluid is neglected.
- The occurrence of phase change in the circulating fluid is neglected, as the pressures are maintained at a sufficiently high level to prevent any phase change within the well.
- Since the wellbore is circular, a circular rock matrix is simulated; so, the 3D model can be simplified into a 2D axisymmetric model.
While these assumptions are recognized as a limitation, their application in this preliminary study is reasonable.
2.1. Geometric Configuration of the Coaxial BHE
In this study, a coaxial BHE was modeled to examine its heat extraction efficiency and power generation capability. The underground coaxial closed-loop geothermal system primarily comprises a vertical well and a coaxially aligned casing with a central pipe within the geothermal reservoir [15]. During operation, a high-pressure pump is used to circulate the working fluid into the annular space from the surface, after which, it is returned to the surface through the central pipe. Due to temperature differences between the reservoir and the wellbore, the circulating working fluid within the annulus absorbs heat from the wellbore walls and subsequently passes through a heat exchanger. The wellbore and reservoir are separated by either casing or cement, and thus, the thermal conductivity of these materials significantly influences the heat transfer efficiency [18]. With a notable temperature difference between the circulating fluid and the surrounding reservoir, thermal conduction occurs between the wellbore and the reservoir.
The modeled BHE’s geometric configuration is illustrated in Figure 1. The wellbore extends 500 m into the ground. Immediately above the bottom of the well, a 1 m space exists between the annulus bottom and the projection tube bottom to allow fluid circulation for geothermal production. It is important to note that the working fluid does not come into contact with the reservoir fluid at any point; the working fluid is solely heated depending on the ground temperature by heat conduction. The lateral and vertical extent of the reservoir surrounding the wellbore is established as 200 m and 100 m, respectively. All other geometric configuration parameters are summarized in Table 1 below.
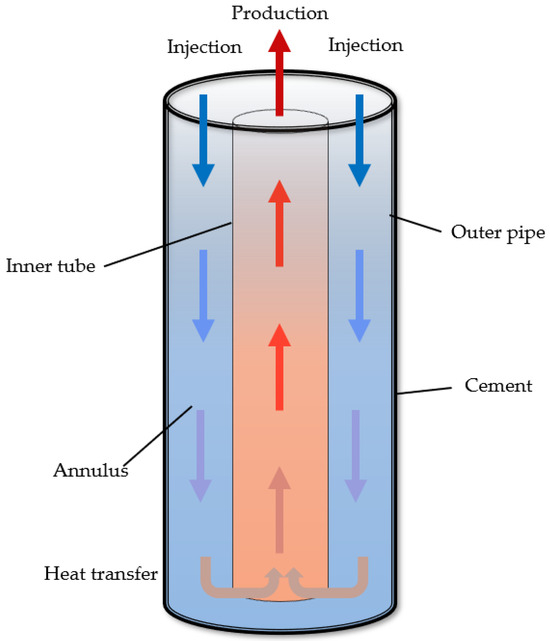
Figure 1.
Schematic diagram of a vertical coaxial BHE.

Table 1.
Geometric configuration of the model.
2.2. Fluid Heat Transfer Formulations
The heat transfer field in a coaxial heat exchanger includes heat transfer in the circulating fluid, the rock matrix, and through the cement surrounding the annulus [20]. Heat transfer within the pipe fluid is predominantly convective heat transfer, while temperature variations in the formation matrix and through the cement are primarily influenced by thermal conduction.
The mathematical model of heat transfer in a rock formation can be characterized by the diffusion–convection equation as:
where is the density of the fluid in the pipe, is the heat capacity at constant pressure, and is the heat source/sink. The effective volumetric heat capacity, and the effective thermal conductivity, , can be expressed as:
where is the density of the rocks, is the heat capacity of the rocks, is the porosity, is the dry density, and and are the thermal conductivities of the fluids and rocks, respectively.
The energy balance equation for the working fluids in the insulated tube involving forced convection and heat conduction through the insulated tube is
where and are the density and the heat capacity of the working fluid, respectively; is the mass flow rate; is the inner diameter of the insulated tube; and is the thermal resistance between the working fluids in the insulated tube and annulus.
The convection heat transfer coefficient () representing the strength of the heat convection can be described as:
where is the thermal conductivity of the working fluid, is the hydraulic diameter, which is defined as four times the open frontal area divided by the geometric surface area [29], and is the Nusselt number, dependent on the flow turbulence [30]:
where is the Reynolds number, is the Prandtl number, and is Darcy’s friction factor.
The energy balance equation for the working fluid in the annulus involving forced convection and heat conduction can be expressed as:
where and are the outer and inner diameters of the annulus, respectively, and is the convection heat transfer coefficient between the working fluid and the casing.
Thermally thick layers are defined for both the inner and outer tubes. The tangential heat flux is neglected; thus, the heat flux across the layer’s thickness, and , can be written as:
where and are the thickness and the thermal conductivity of the thin layer. The subscripts denote the outer tube, the inner tube, the exterior of the layer, and the interior of the layer, respectively.
2.3. Thermally Induced Stress Formulations
Previous research was conducted to evaluate the in-situ stress state at Mount Meager under the effect of tectonic stress and gravity [31]. What is missing is the thermally induced stress change due to the cooling effect caused by geothermal extraction over years of operation, which will be determined by this study. Thermal strain ( can be defined as:
where is the thermal conductivity of the rock matrix, and is the reference temperature without applied stress at a certain location. The stress–strain relationship for the induced thermal stress can then be written as:
where and are the thermal stresses in radial and vertical directions, and and are Young’s modulus and Poisson’s ratio, respectively.
2.4. Initial Values and Boundary Conditions
Previous drilling and production tests for heat extraction confirmed that within the core of the South Meager geothermal project, temperatures exceeding 200 °C were recorded at depths as shallow as 500 m [32]. Assuming a linear correlation between temperature and depth, the temperature gradient can be calculated as 0.38 °C/m, considering that the average ambient temperature at the surface is 11 °C over the course of a year.
Apart from the geothermal gradient, the intrinsic properties of materials were crucial for the accuracy of this study. The model incorporates various materials, including thermally insulated production steel pipes, cement surrounding the annulus, the working fluid, and the reservoir rock matrix. In the coastal mountains in southwest British Colombia where Mount Meager is located, the geothermal reservoir is composed of crystalline rock of quartz diorite under the volcanic cover [6]. The material properties of the rock matrix were therefore based on the characteristics of the granodiorite basement. Table 2 lists the specific rock property values used, with references for the sources. The properties used to simulate the working fluid, i.e., water, are temperature-dependent [33].
Table 2.
Material properties.
In the initial state, the temperature of the working fluid was set to match the injection temperature, and the temperature of the rocks aligned with the in-situ temperature of the geothermal reservoir. The boundary conditions for all borders, except the ground surface, were considered temperature boundaries, determined by the geothermal gradient of the reservoir. The bottom temperature boundary condition was determined by the geothermal gradient of the formation, the reservoir thermal conductivity, and the distance to the bottom of the production well. In our model, the bottom boundary was positioned 100 m deeper than the well’s depth. A previous study suggested that for a complex, deep closed-loop production configuration, there is little well interference during 30 years of production when the wells are 100 m apart, which means that we might treat the 100 m deeper boundary as an insulated boundary [35]. Meanwhile, the ground surface was treated as a thermally insulated boundary, neglecting radiation and heat exchange with the ground.
It is important to note that this study focused exclusively on thermal stresses induced by the cooling effect and did not address stress variations resulting from other factors. Previous studies were conducted on the induced stress state at Mount Meager, considering the effects of tectonic stresses, gravity, and topography, which readers can consult for further details [31]. As a result, the initial condition assumed a stress-free state. To assess the thermally induced stresses, the following constraints were applied within the framework of solid mechanics: the top was considered a free surface capable of expansion and contraction; the vertical boundaries were subject to roller constraints that allowed for movement in the vertical direction; and the bottom was fixed.
The remaining boundary conditions regarded the operational parameters, particularly the varying injection velocities and temperatures that were analyzed for sensitivity. The values employed for each simulation trial will be specified in the following result section.
2.5. Organic Rankine Cycle
To quantify the potential power generation, the Organic Rankine Cycle (ORC) was chosen as the method to convert the thermal energy harvested from the heat exchanger into electricity. The schematic diagram of the binary plant is illustrated in Figure 2 [36]. The heat carrier fluid was directed into the heat exchanger at a specified flow rate facilitated by the pump. Upon emerging from the well, it proceeded through the heat exchanger located within the ORC power plant. The heating and boiling processes were managed by the preheater, progressively raising the temperature until the working fluid reached its boiling point. This was followed by the evaporation phase in the evaporator, leading to the achievement of a state characterized by saturated vapor. The integration of the BHE and the ORC power plant occurred through their combination within the heat exchange unit.
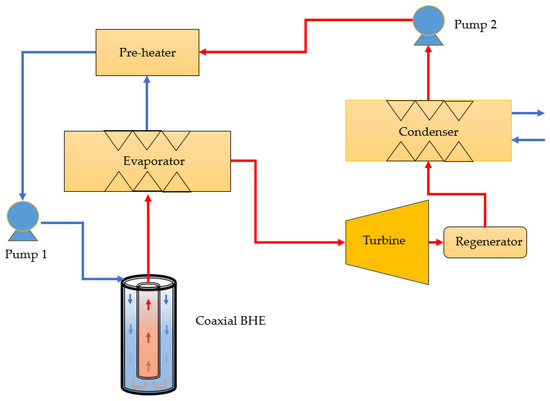
Figure 2.
Schematic diagram of a binary ORC power plant.
Aligned with the circulation rate within the borehole heat exchanger, the model calculated the exit temperature of the heat carrier fluid as it left BHE, subsequently entering the heat exchange unit. This facilitated the assessment of the heat exchange unit to determine the mass flow rate of the working fluid within the ORC facility, based on the temperature profile established using the previously discussed model.
Thermal efficiency () is a percentage that can be determined from its correlation with the production temperature, developed by the Massachusetts Institute of Technology based on worldwide active ORC plants [37]:
And the thermal power and electrical power can be subsequently determined with:
where is the flow rate of the fluid produced, is the production temperature, and is the injection temperature.
3. Model Sensitivity and Study Limitations
COMSOL Multiphysics 6.2 was employed as the modeling software to simulate the coaxial borehole heat exchanger in this study. COMSOL is a finite element software widely used to solve various engineering problems, particularly those related to geothermal modeling, due to its efficient handling of multiple physics aspects, including heat transfer in various materials [38]. The Laminar Flow module was utilized to simulate the circulating fluid within the heat exchanger, while the Heat Transfer in Fluids module was selected to calculate the resulting temperature due to the thermal extraction process.
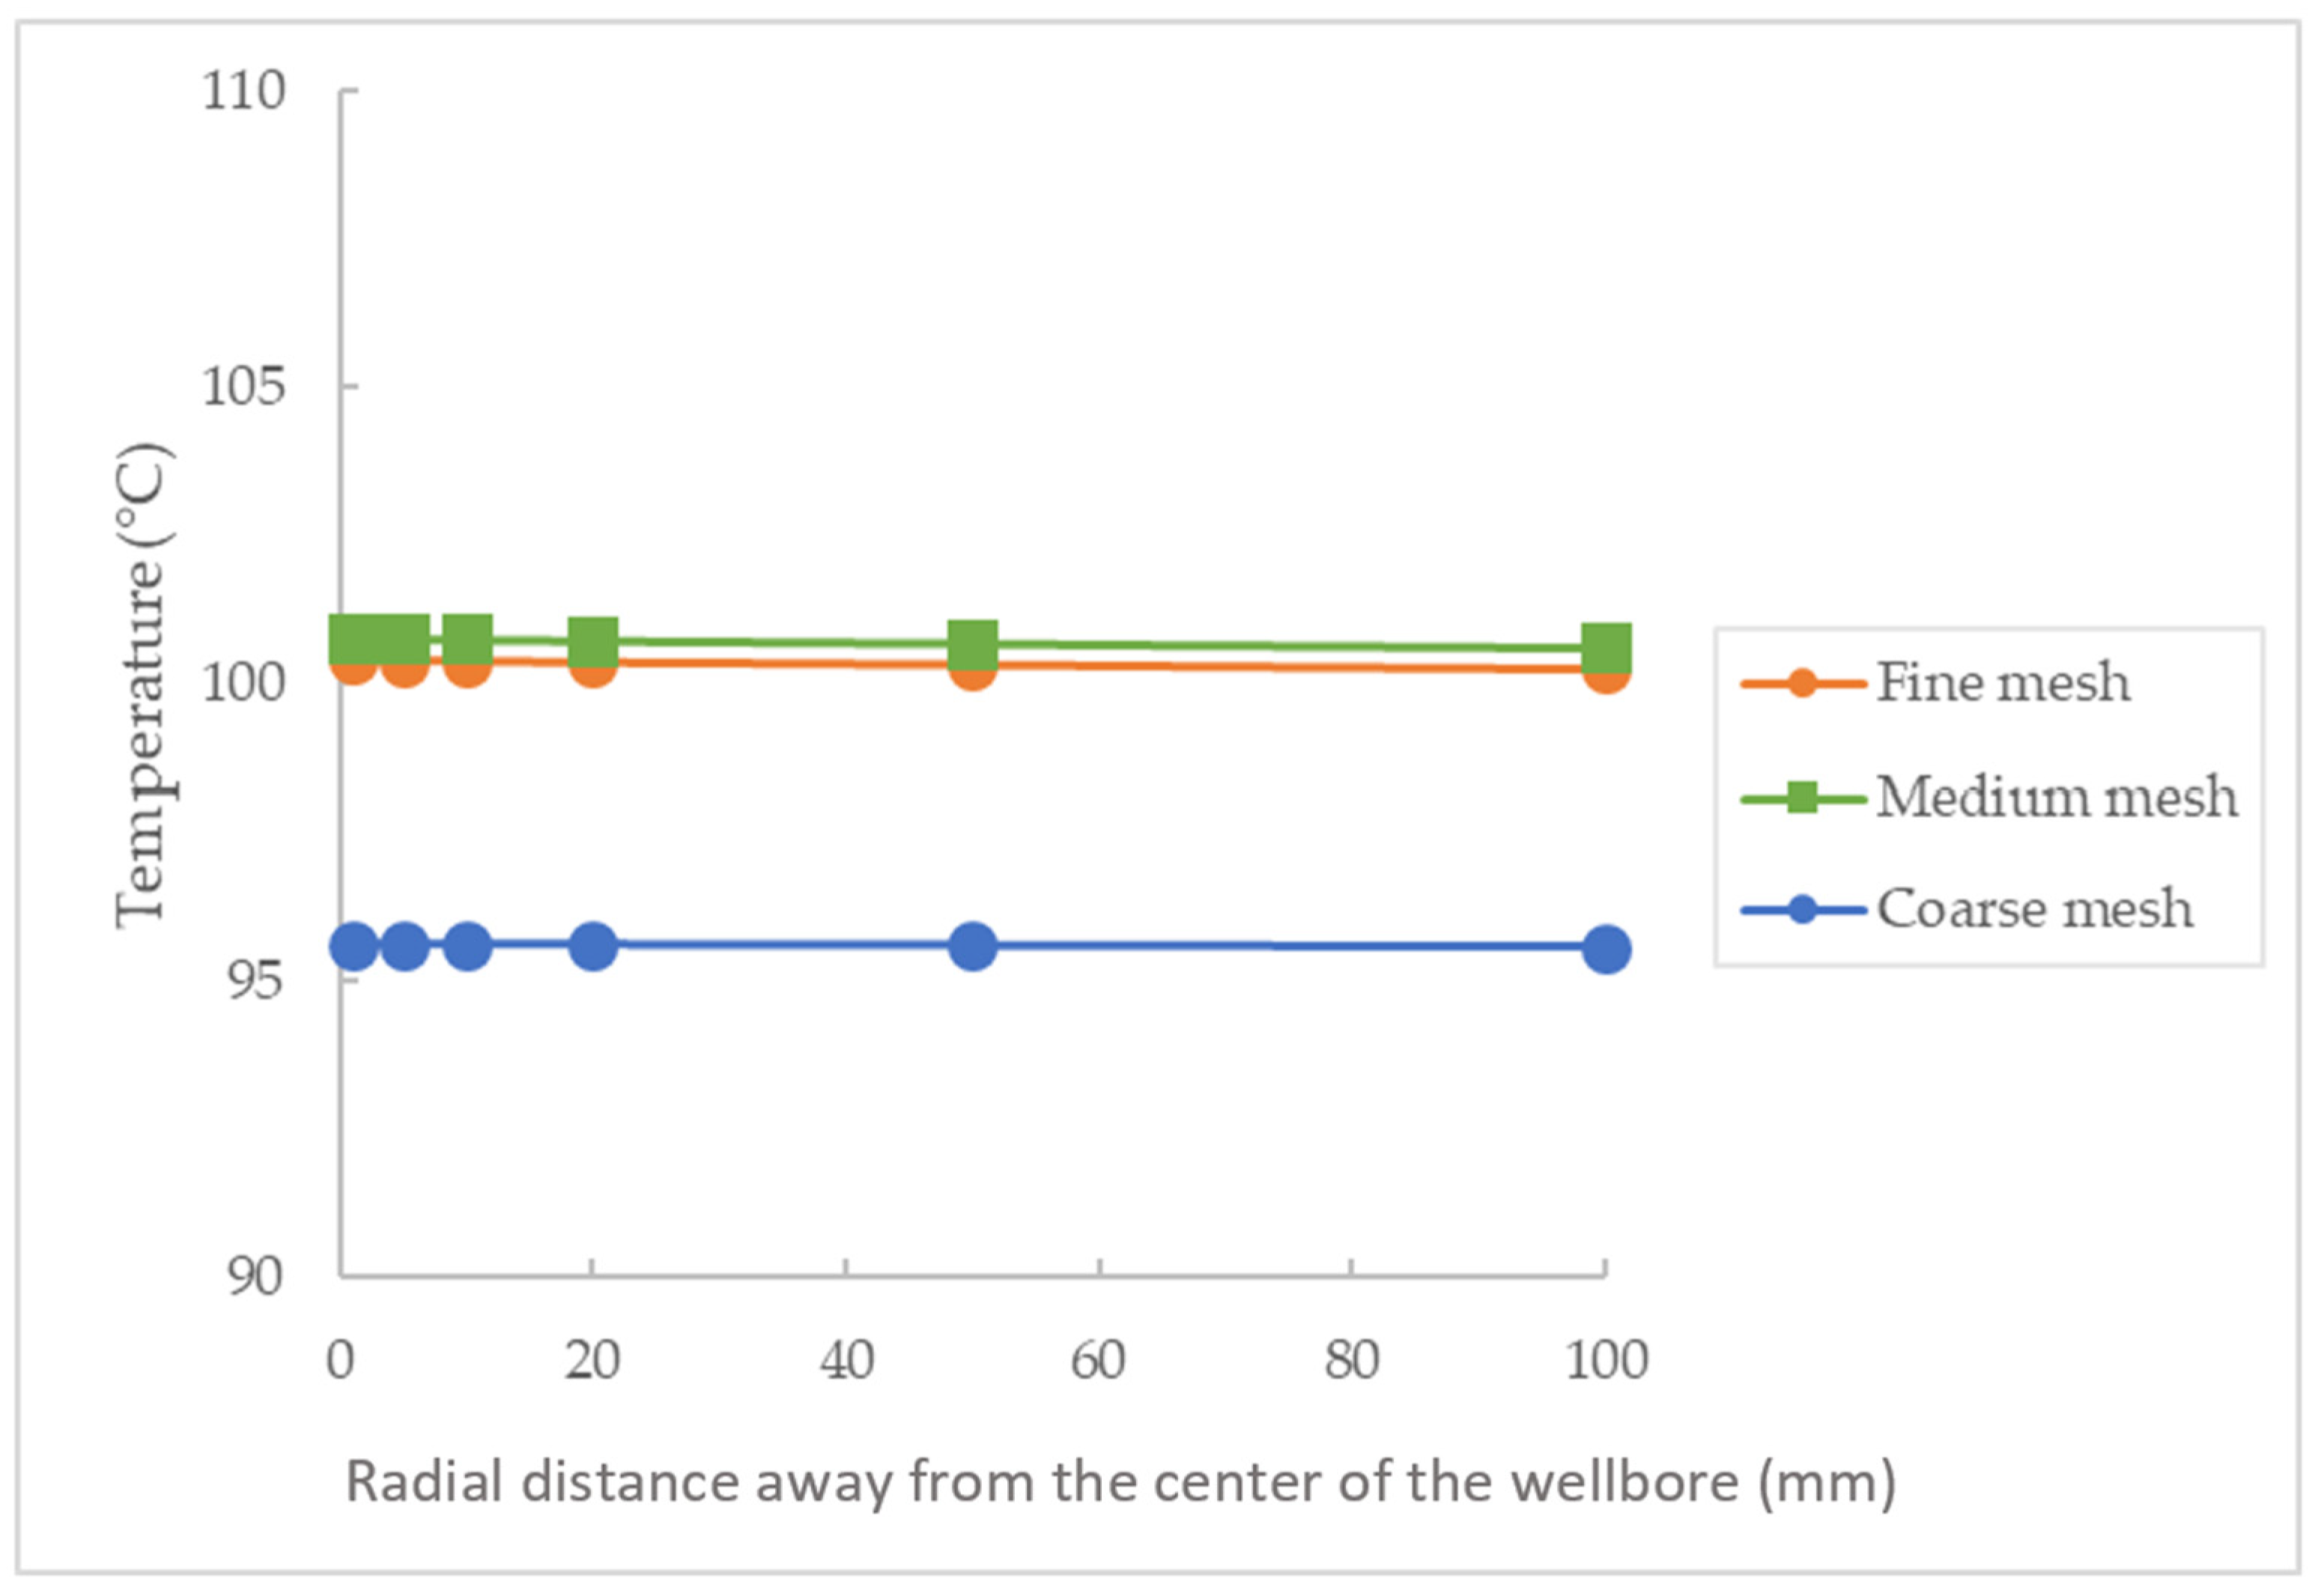
The mesh consisted of triangular elements, with corner refinements specifically applied to the domains of the BHE. In Figure 3, the radial temperature distribution at the well bottom is presented using three different mesh densities. The coarse mesh encompassed 7538 elements, the normal mesh employed 10,751 elements, and the fine mesh was composed of 15,364 elements. Notably, Figure 3 reveals a distinct variation in the radial temperature distributions, primarily seen in the coarse mesh, where the temperature was significantly higher than in the other two meshes. Considering the marginal difference between the normal and the fine meshes, we opted for the normal mesh to enhance the computational efficiency.
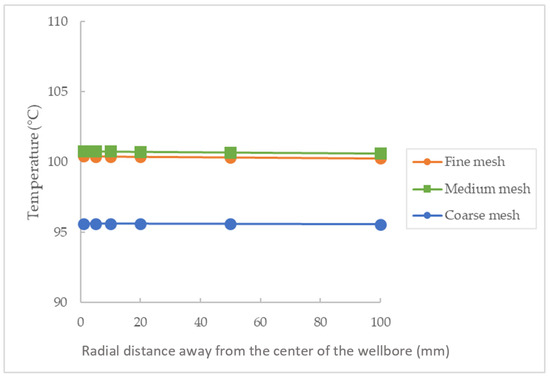
Figure 3.
Radial temperature distributions at the end of the wellbore with varying mesh densities.
It is essential to acknowledge the limitations inherent in this study, primarily stemming from necessary simplifications. Firstly, the assumption of rock matrix homogeneity, although expedient for modeling, deviated from the actual geological heterogeneity. Secondly, the presumed constancy of the thermal parameters, irrespective of the varying temperatures, could occasionally lead to an underestimation of heat transfer, particularly in instances of significant temperature fluctuations. Thirdly, our analysis did not encompass any consideration of phase change for the working fluid due to the high-pressure constraint applied. Lastly, we employed an axisymmetric model for the temperature and thermal stress analysis, recognizing the inherent constraints of this simplification. Fourthly, no groundwater seepage was considered in this study. These limitations will be addressed in future studies.
4. Results and Discussion
4.1. Base Case
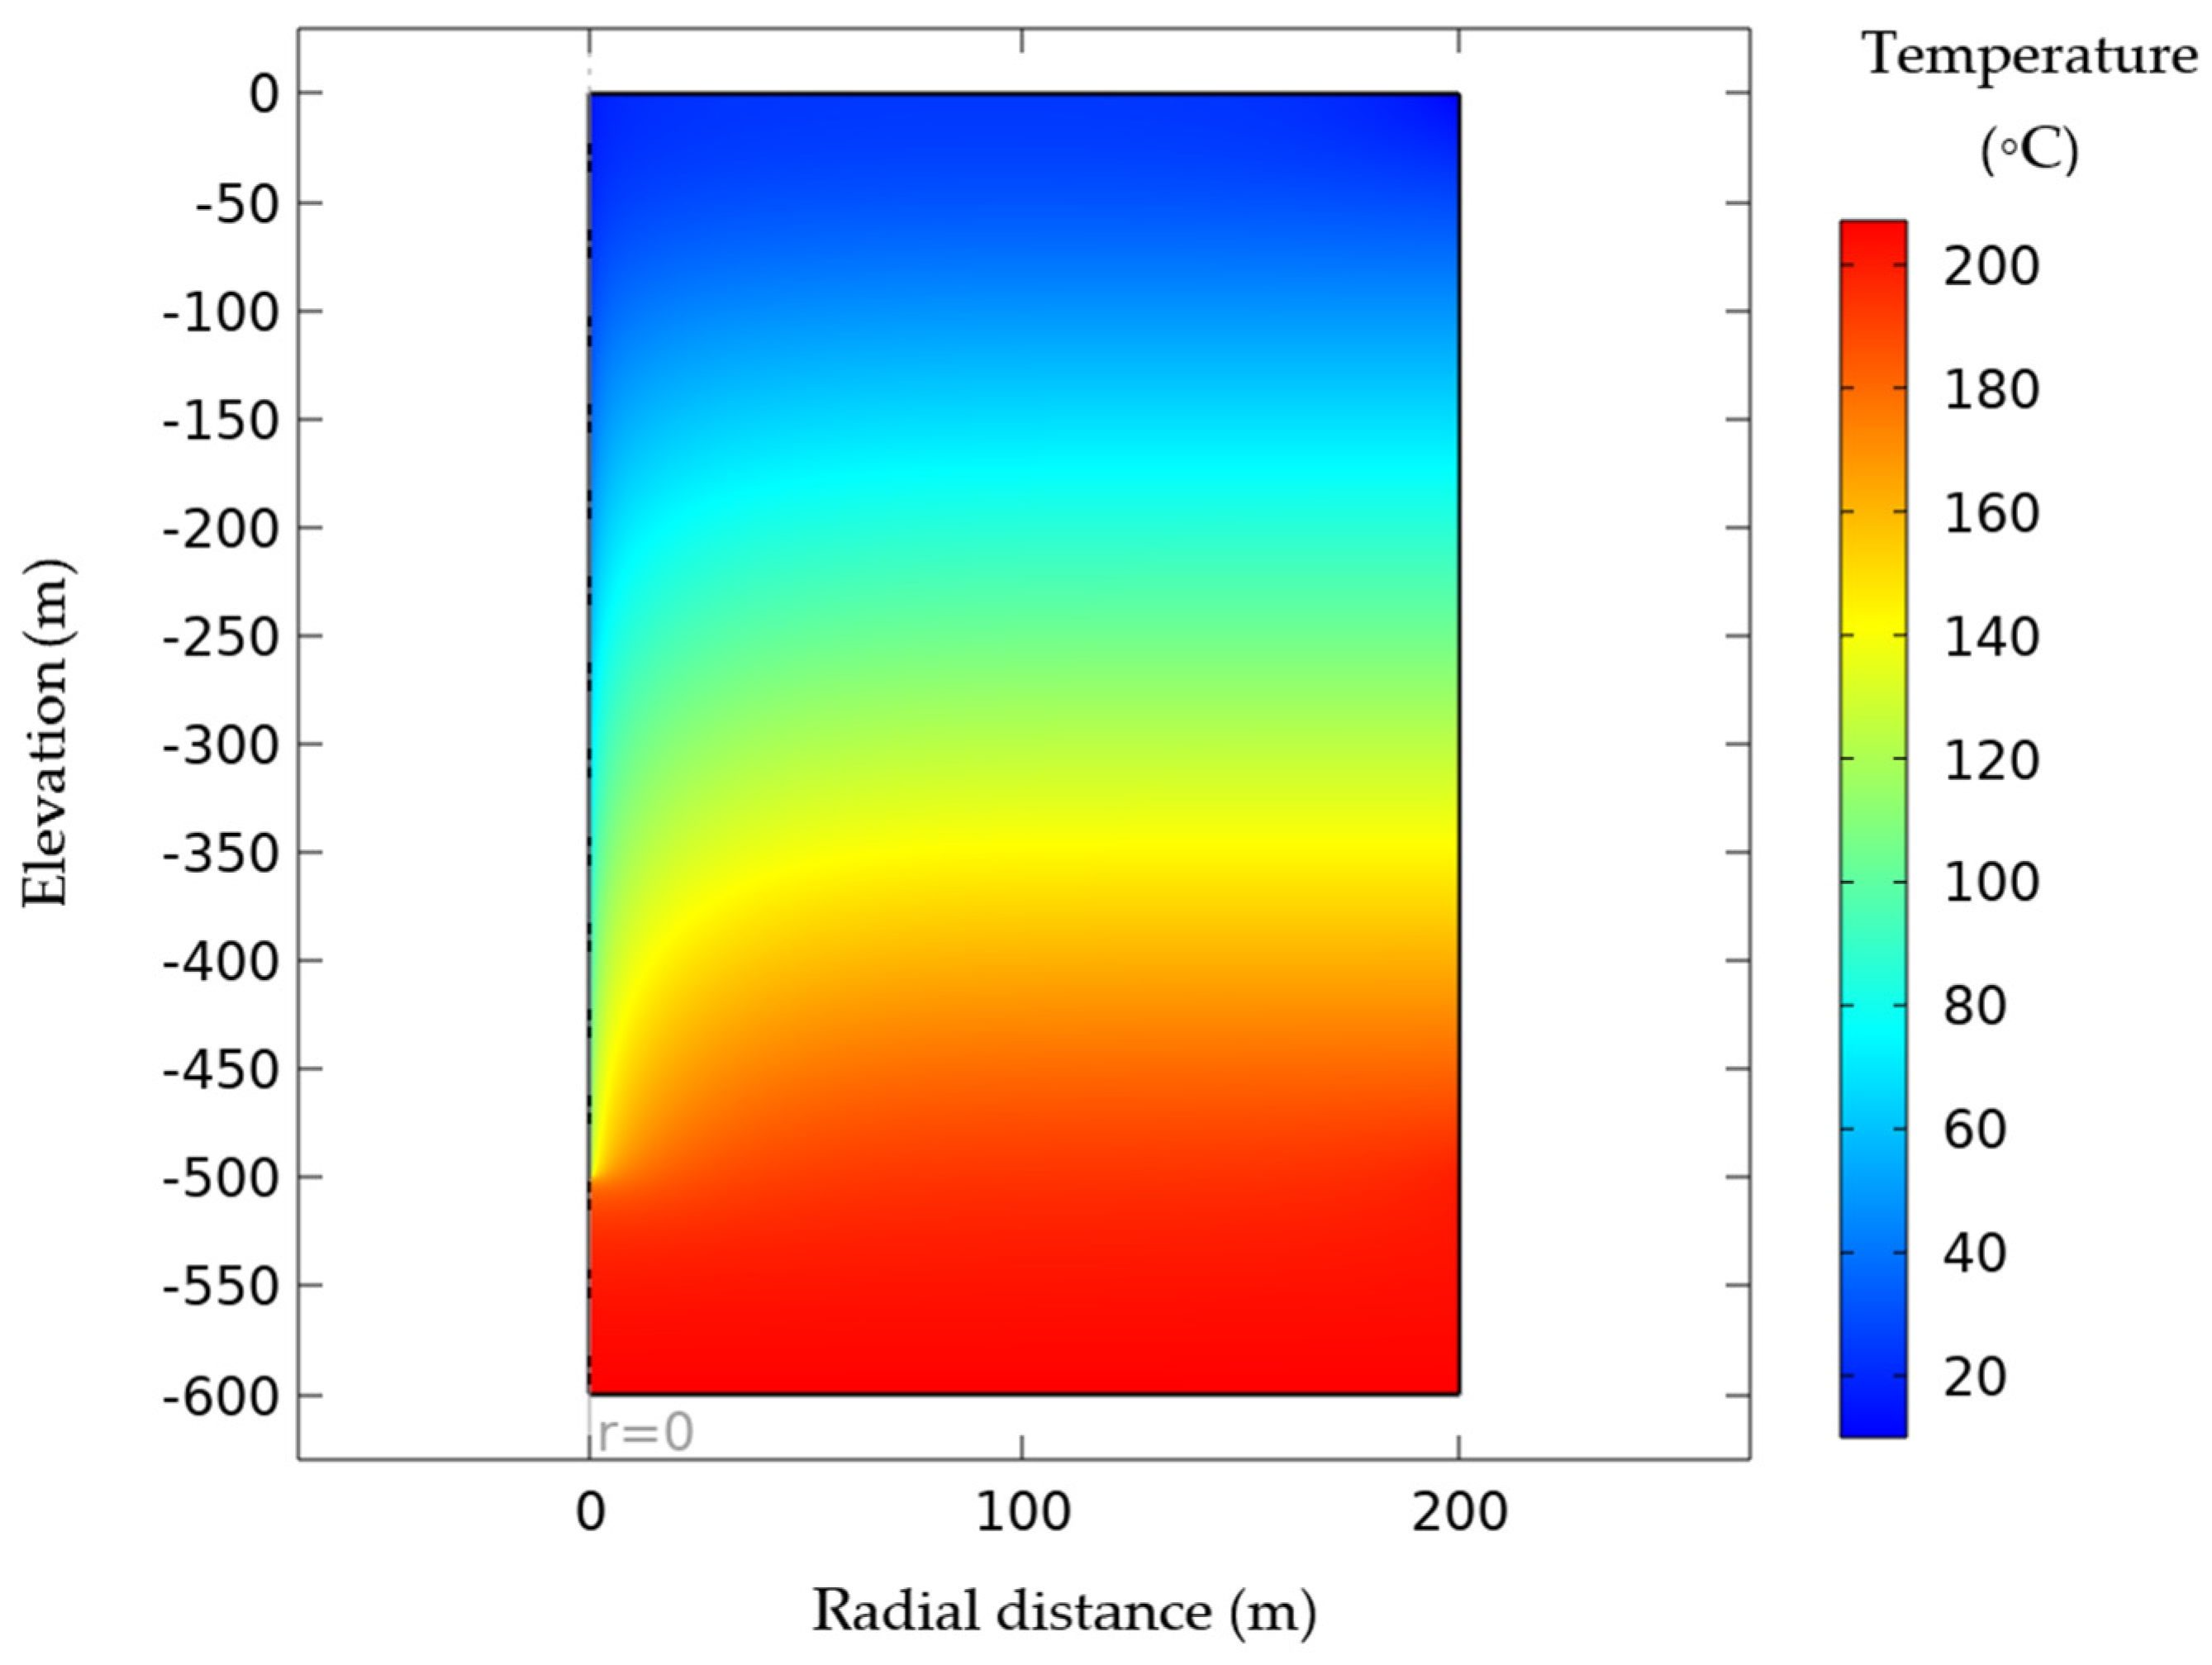
The simulations were carried out using the previously mentioned method within the South Meager project area at the north end of the Garibaldi Volcanic Belt. A base case was considered with the parameters given in Table 1 and Table 2 to examine the temperature and radial stress distribution profiles that were induced due to heat extraction. For consistency, a steady injection velocity of 0.1 m/s and an injection temperature of 10 °C were maintained. Figure 4 illustrates the temperature fluctuations over a 25-year operational period. As the operational years progressed, cooling occurred within the surrounding rocks to raise the temperature of the injection liquid. This effect diminished rapidly when moving away from the central borehole. At greater depths, a larger radial expanse exhibited more observable temperature drops. Towards the end of the wellbore, an extended area of influence could be observed, reaching approximately 100 m after 25 years of operation.

Figure 4.
Temperature isothermal contour at the end of 25 years of operation.
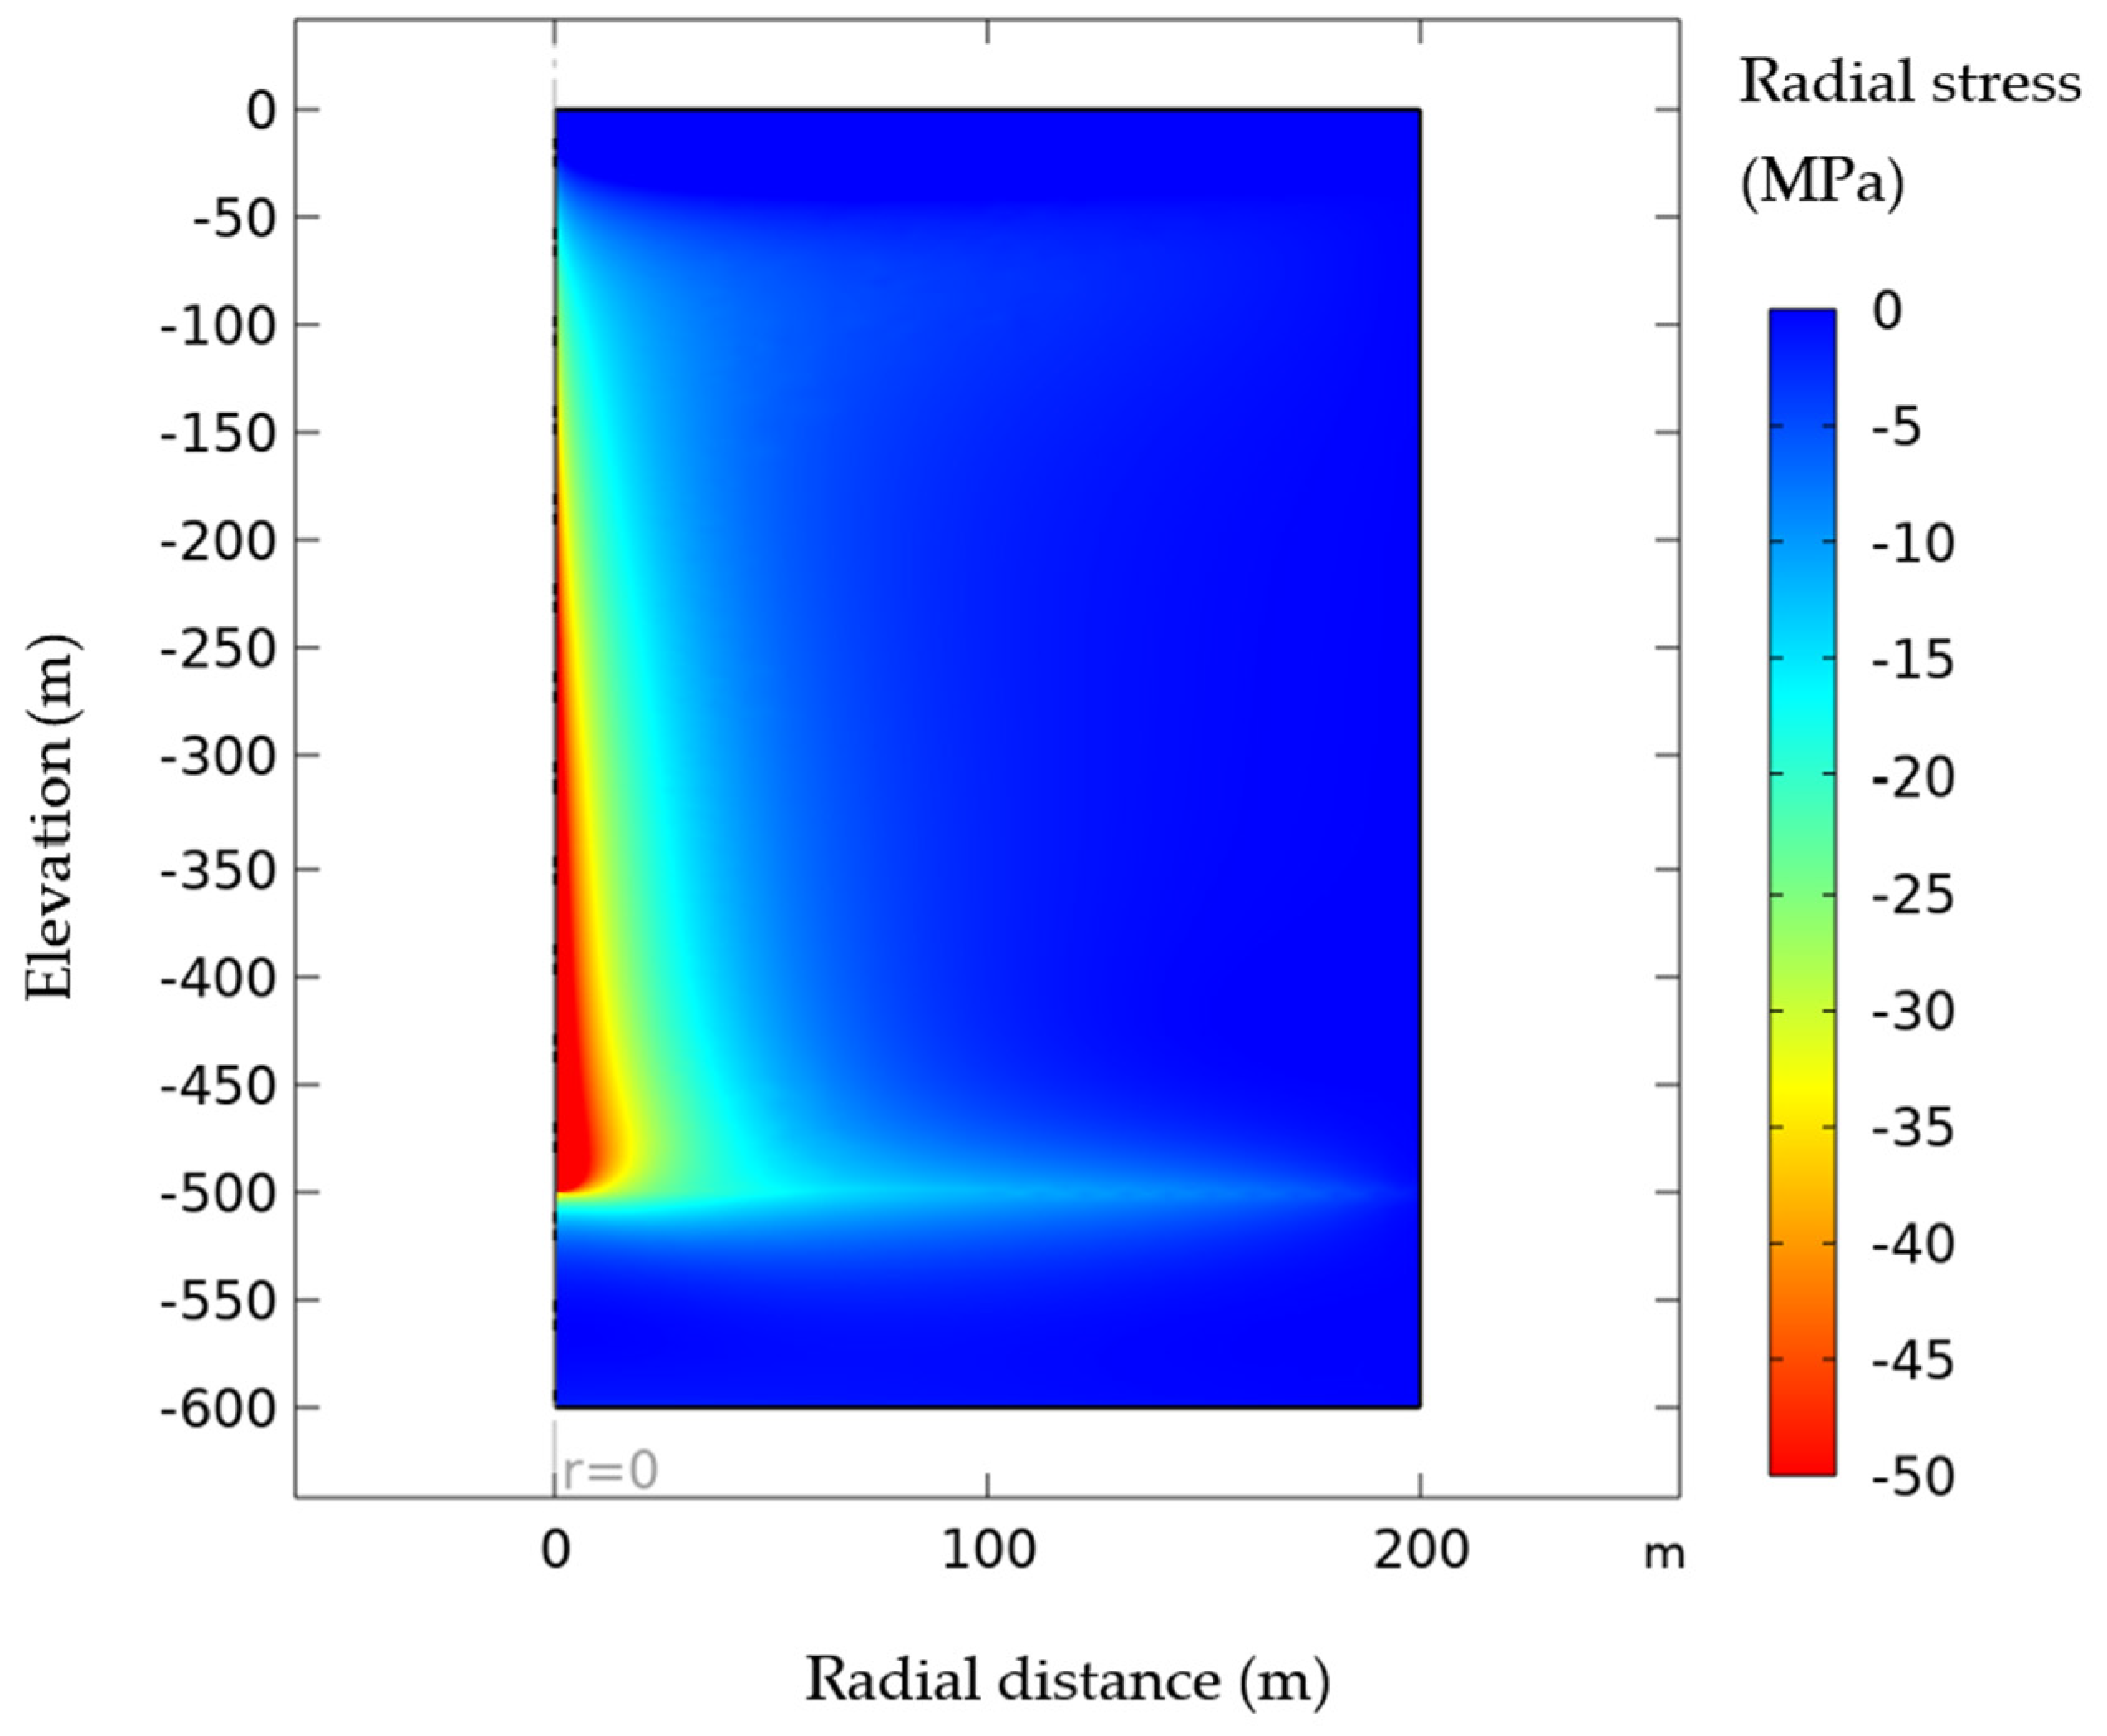
Figure 5 illustrates the variation in radial thermal stress over a 25-year operational period using 2D contours. During the heat extraction process, cooling occurred within the rock matrix surrounding the heat exchanger, causing thermal contraction within the materials. However, the surrounding rocks, represented as fixed constraints, confined the material displacement, leading to tensile stresses that restricted such movement. Consequently, as time passed and temperature decreased, the induced stresses progressively became more tensile. The increase in tensile stress was notably pronounced near the borehole’s terminus. Greater depth was associated with a larger extent of induced radial stress.

Figure 5.
Radial thermal stress contour at the end of 25 years of operation.
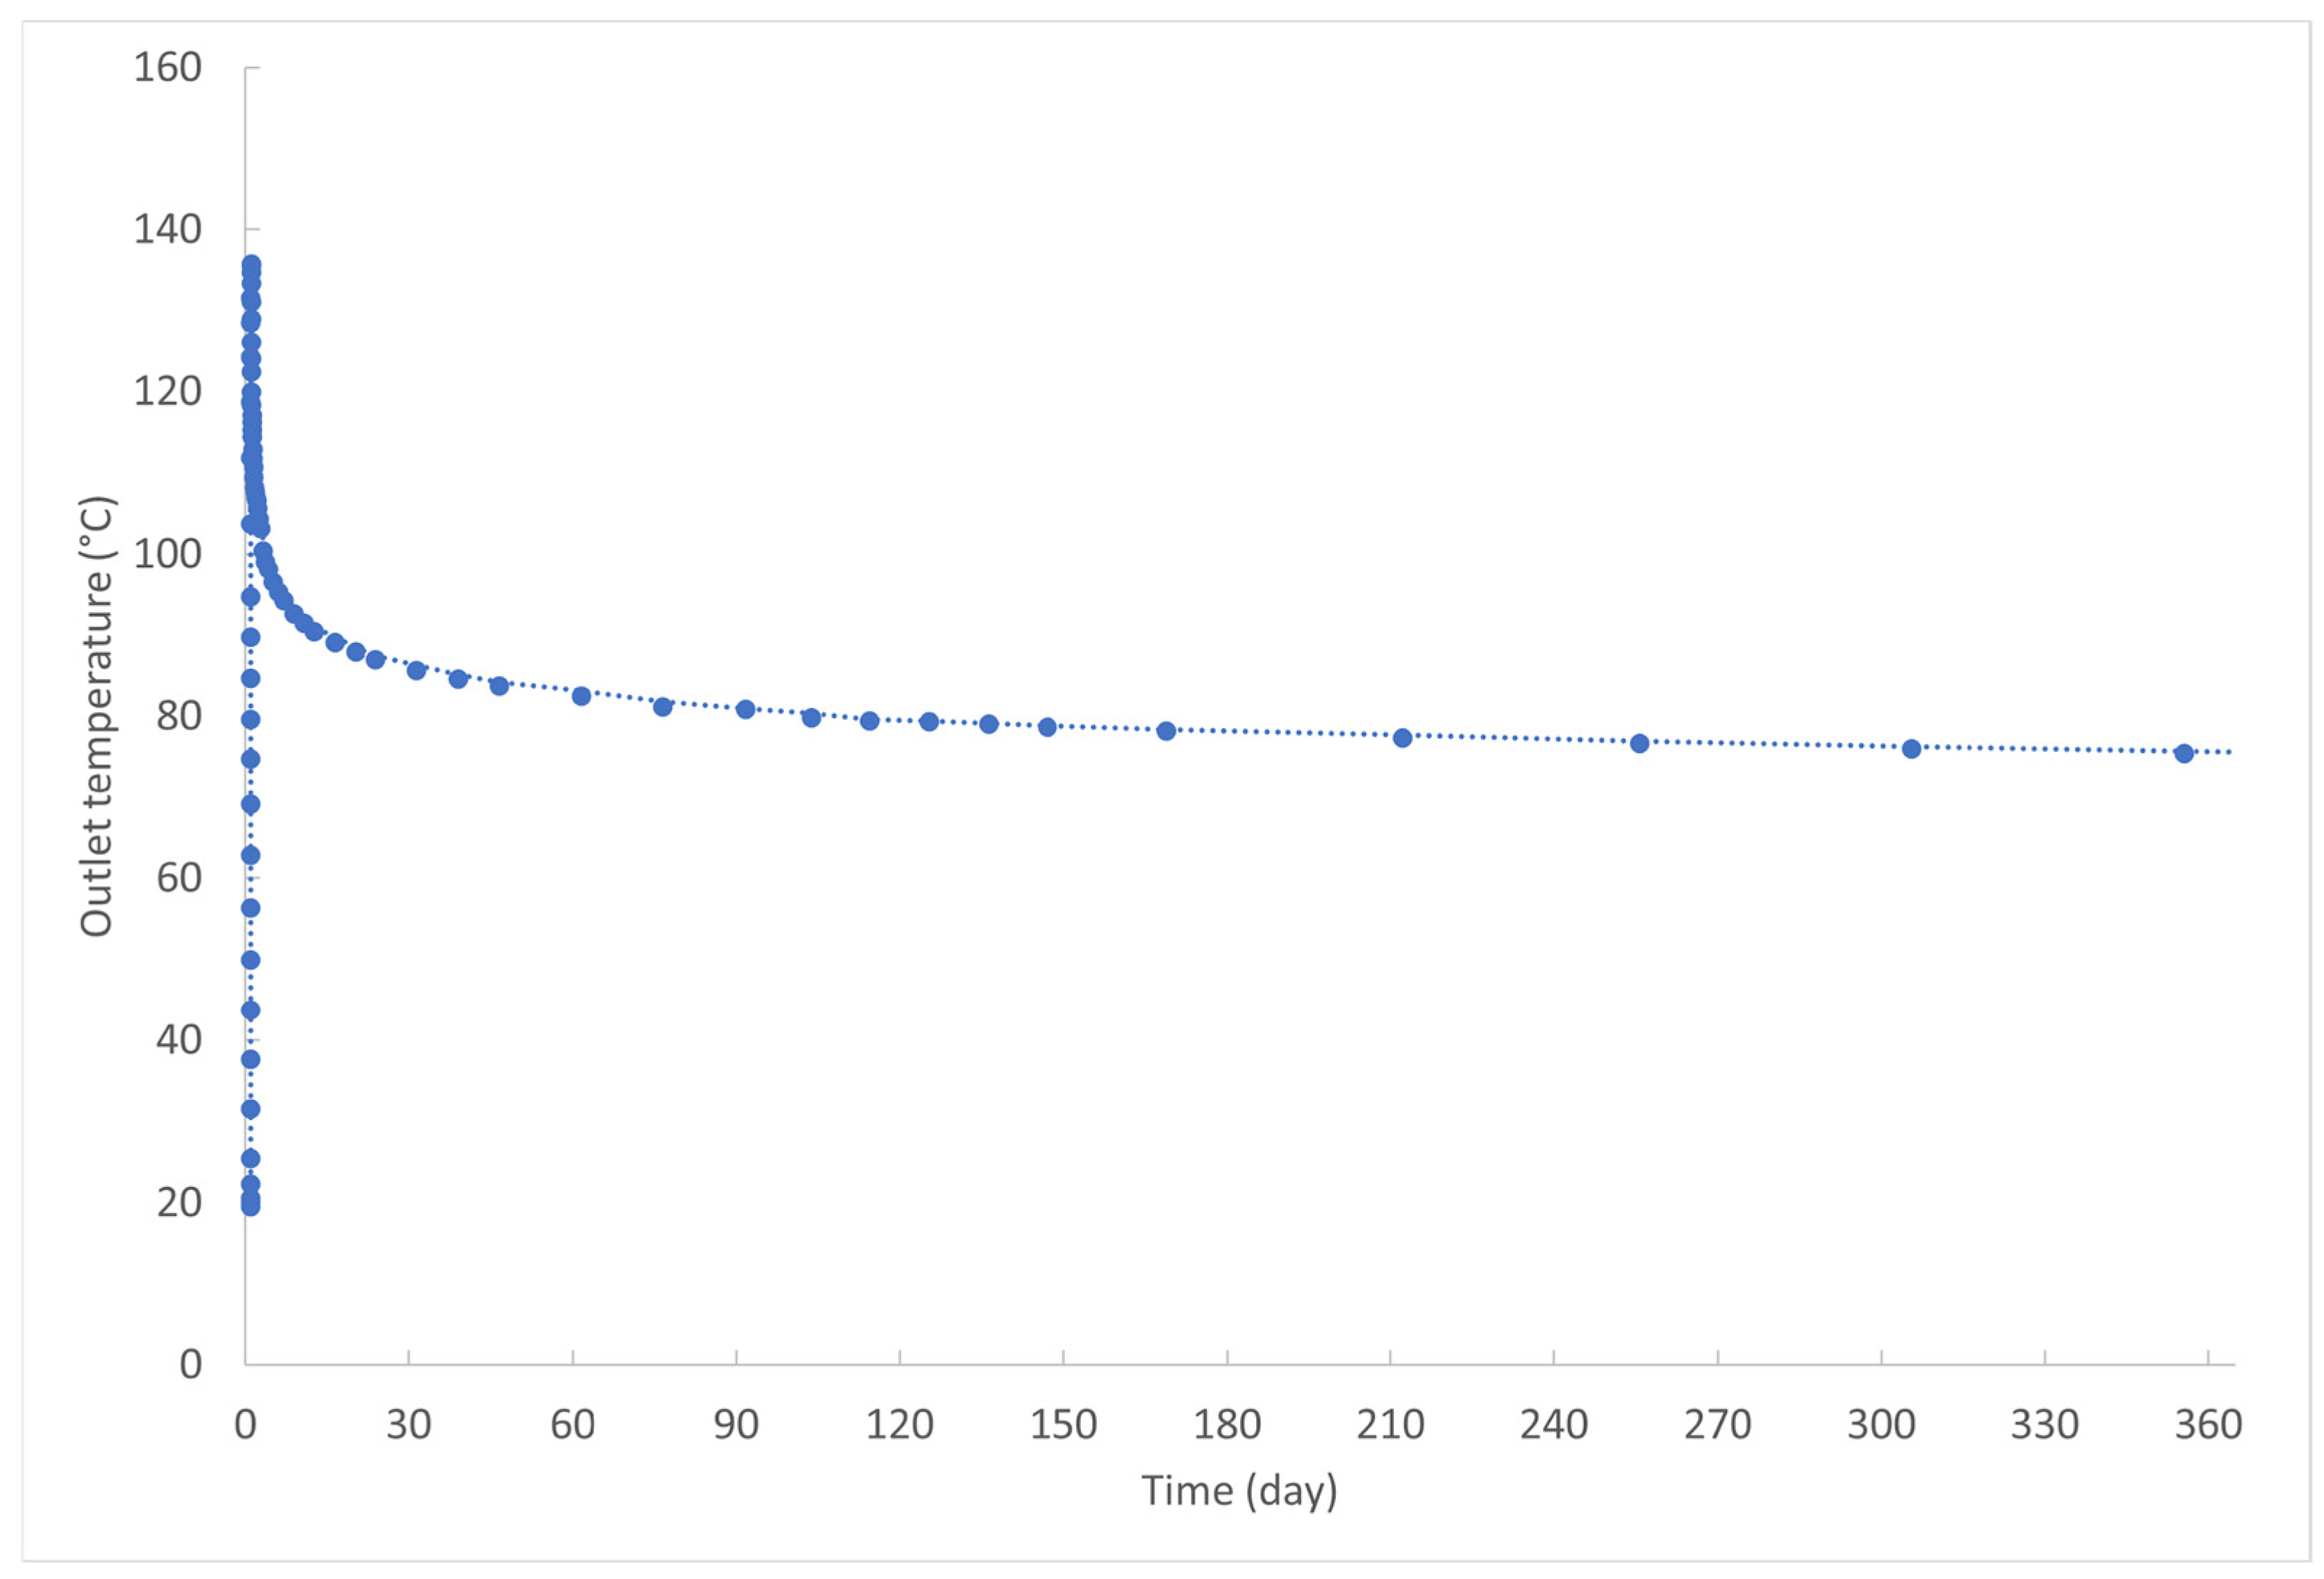
Figure 6 displays the production temperature at the wellbore throughout the heat extraction period. Initially, there was a rapid increase in temperature, followed by a sharp decline. Over the extended operational years, a pseudo-equilibrium state emerged, marked by a gradual decrease in temperature. Data after the first year were omitted for visualization purposes, as only a very gradual decrease in temperature was observed.
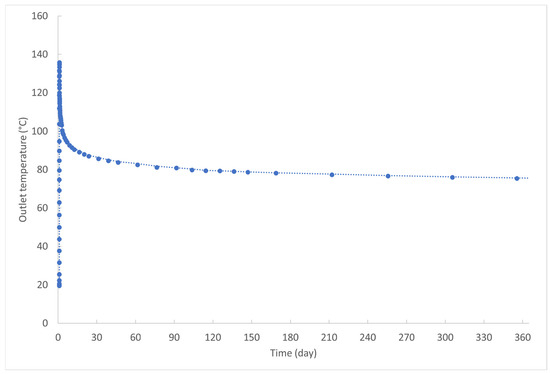
Figure 6.
Production temperature at the outlet.
4.2. Sensitivity Analyses
After analyzing the base case, we proceeded to scrutinize the sensitivity of various parameters concerning their potential impact on geothermal energy production. In the subsequent sections, we will analyze the injection parameters, including injection velocity and temperature, with a focus on the outlet temperature and the potential for geothermal and electric power generation. Additionally, we will simulate two alternative wellbore designs featuring longer lengths and non-linear thermal gradients, supplementing our current design. This investigation aimed to quantify the additional power that can be generated through these alternative configurations.
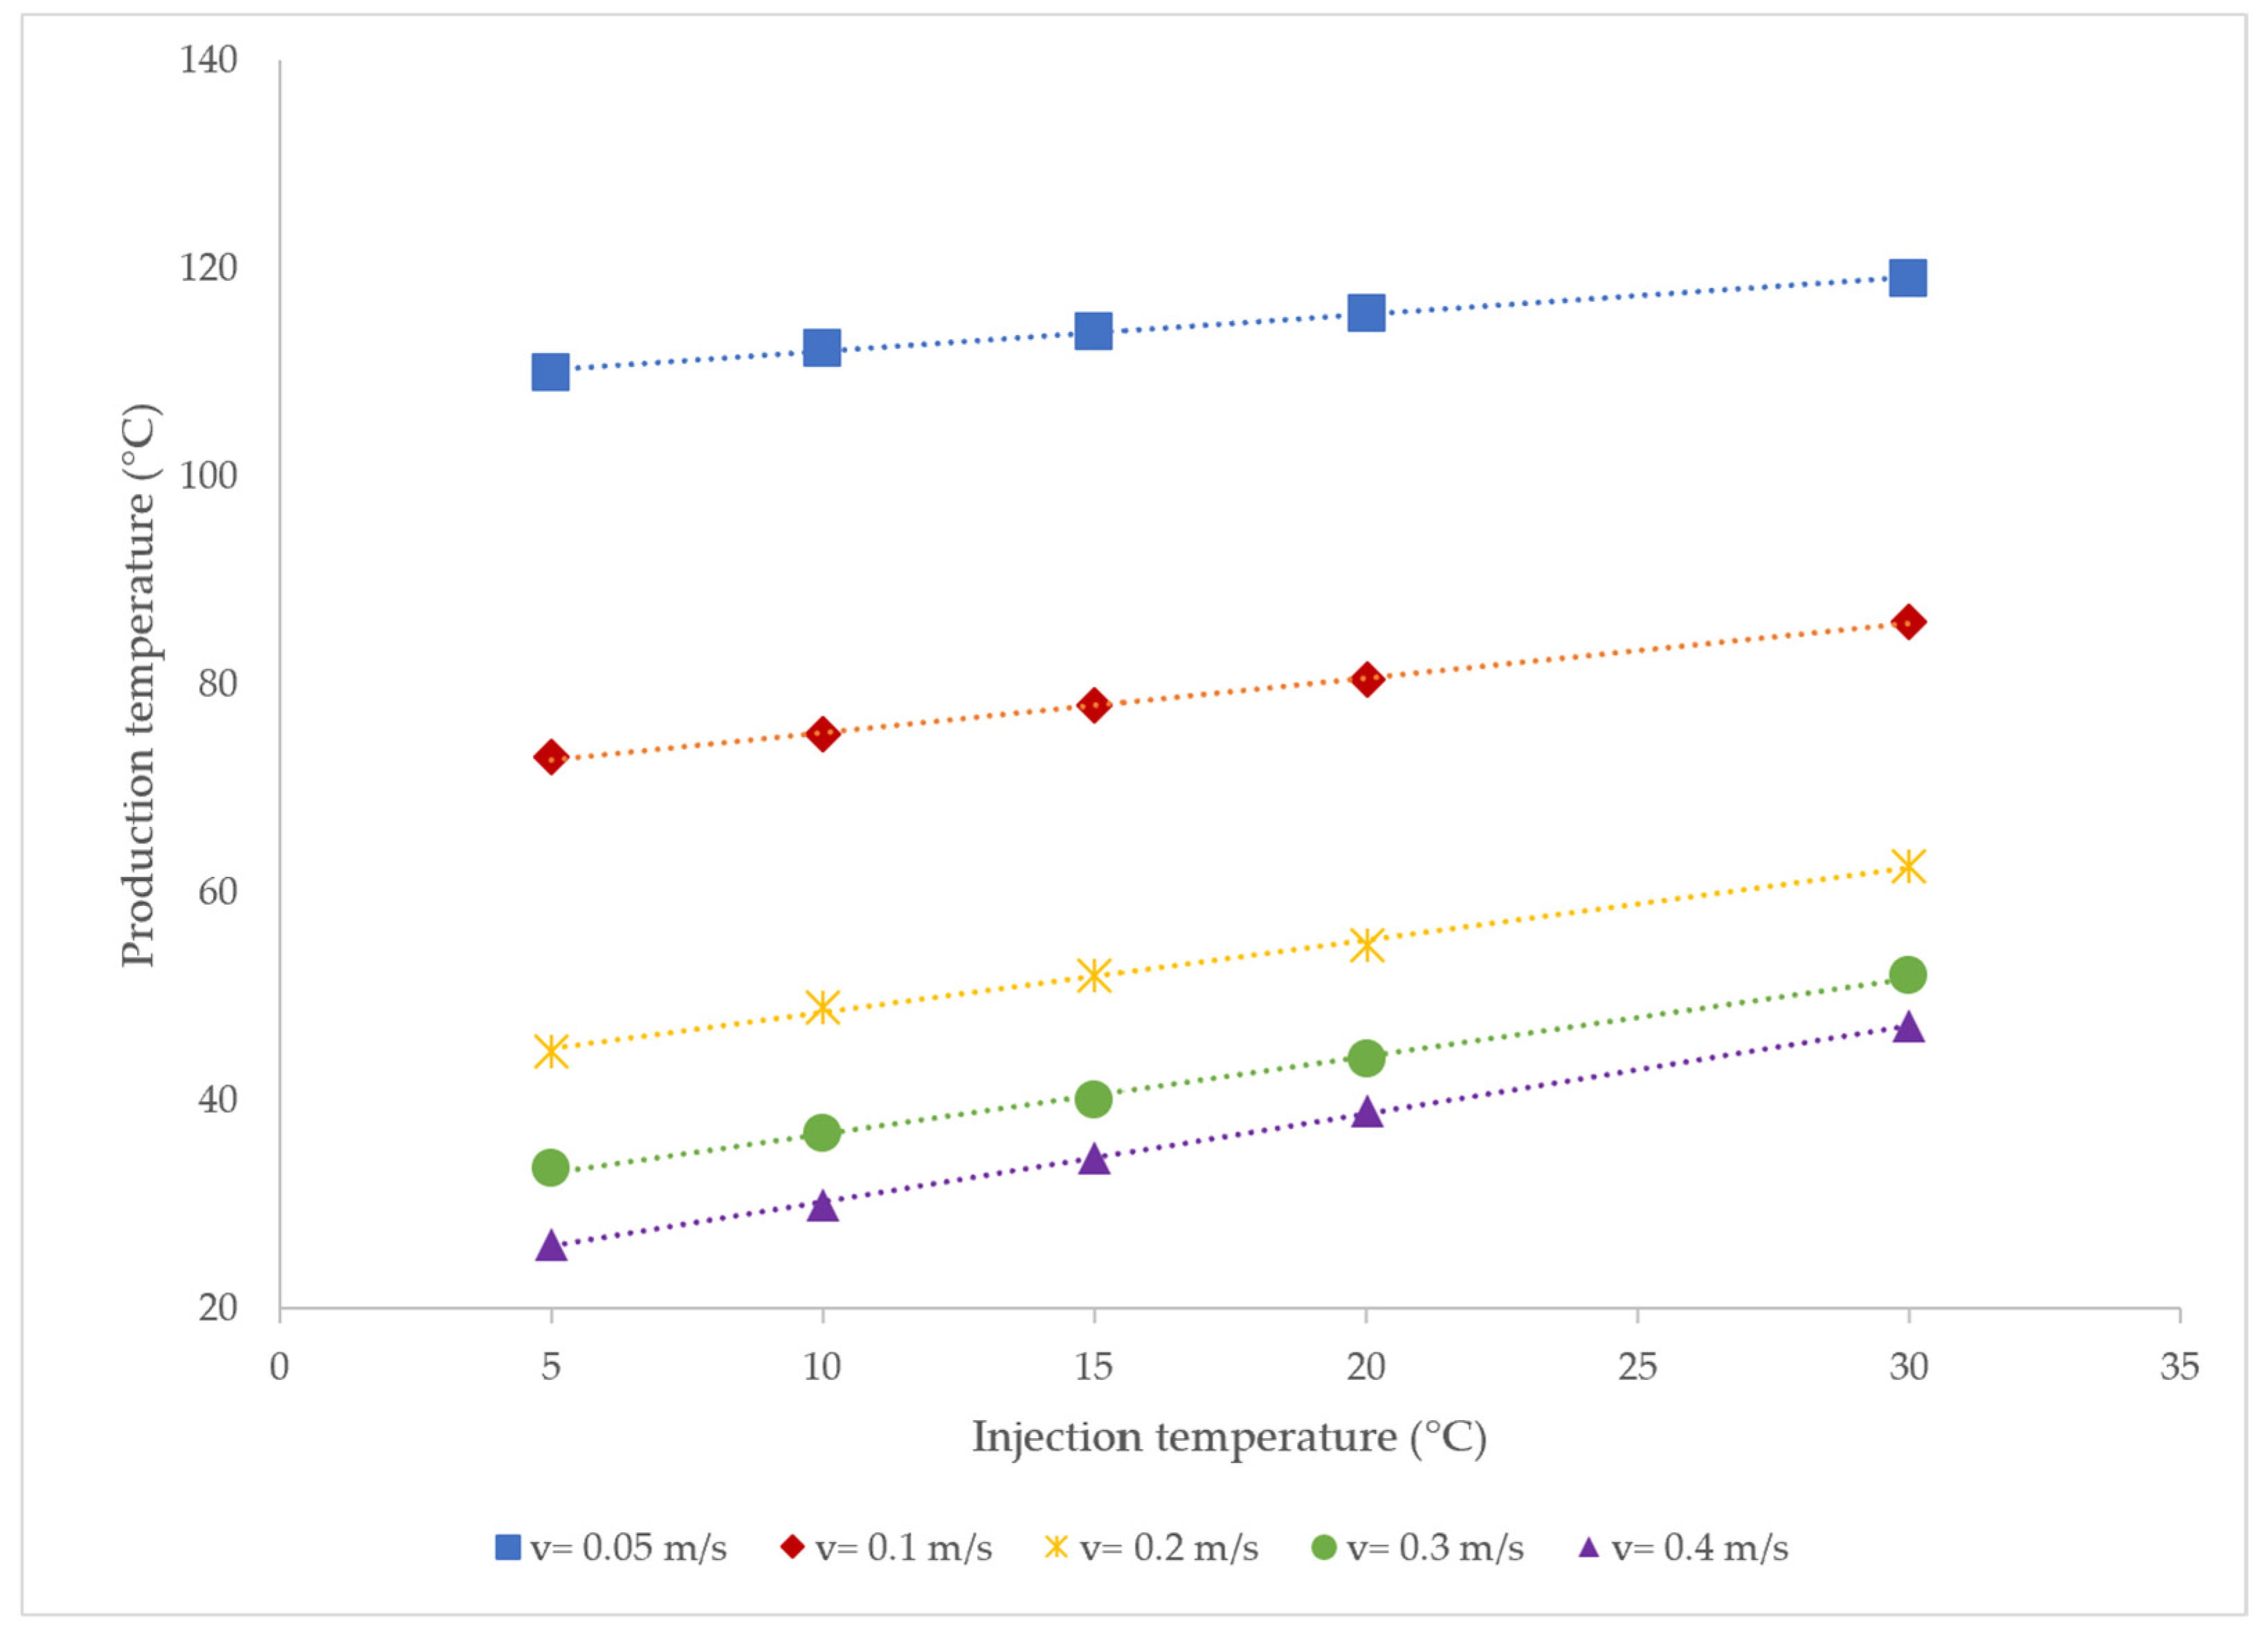
Figure 7 illustrates the production temperature in relation to the injection temperature with respect to various injection velocities. A higher injection temperature exhibited a positive linear correlation with the outlet temperature. On the other hand, elevated water flow rates contributed to increased heat extraction from the rock matrix, causing a more rapid loss of heat stored in the surroundings and consequently yielding a lower outlet temperature by the end of the operation. This impact gradually diminished as the injection velocity became higher.
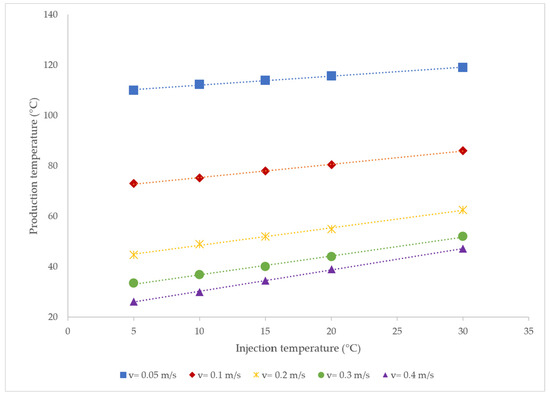
Figure 7.
Production temperature at the outlet with respect to injection temperature with varying velocities at the end of 25 years of operation.
Power Generation
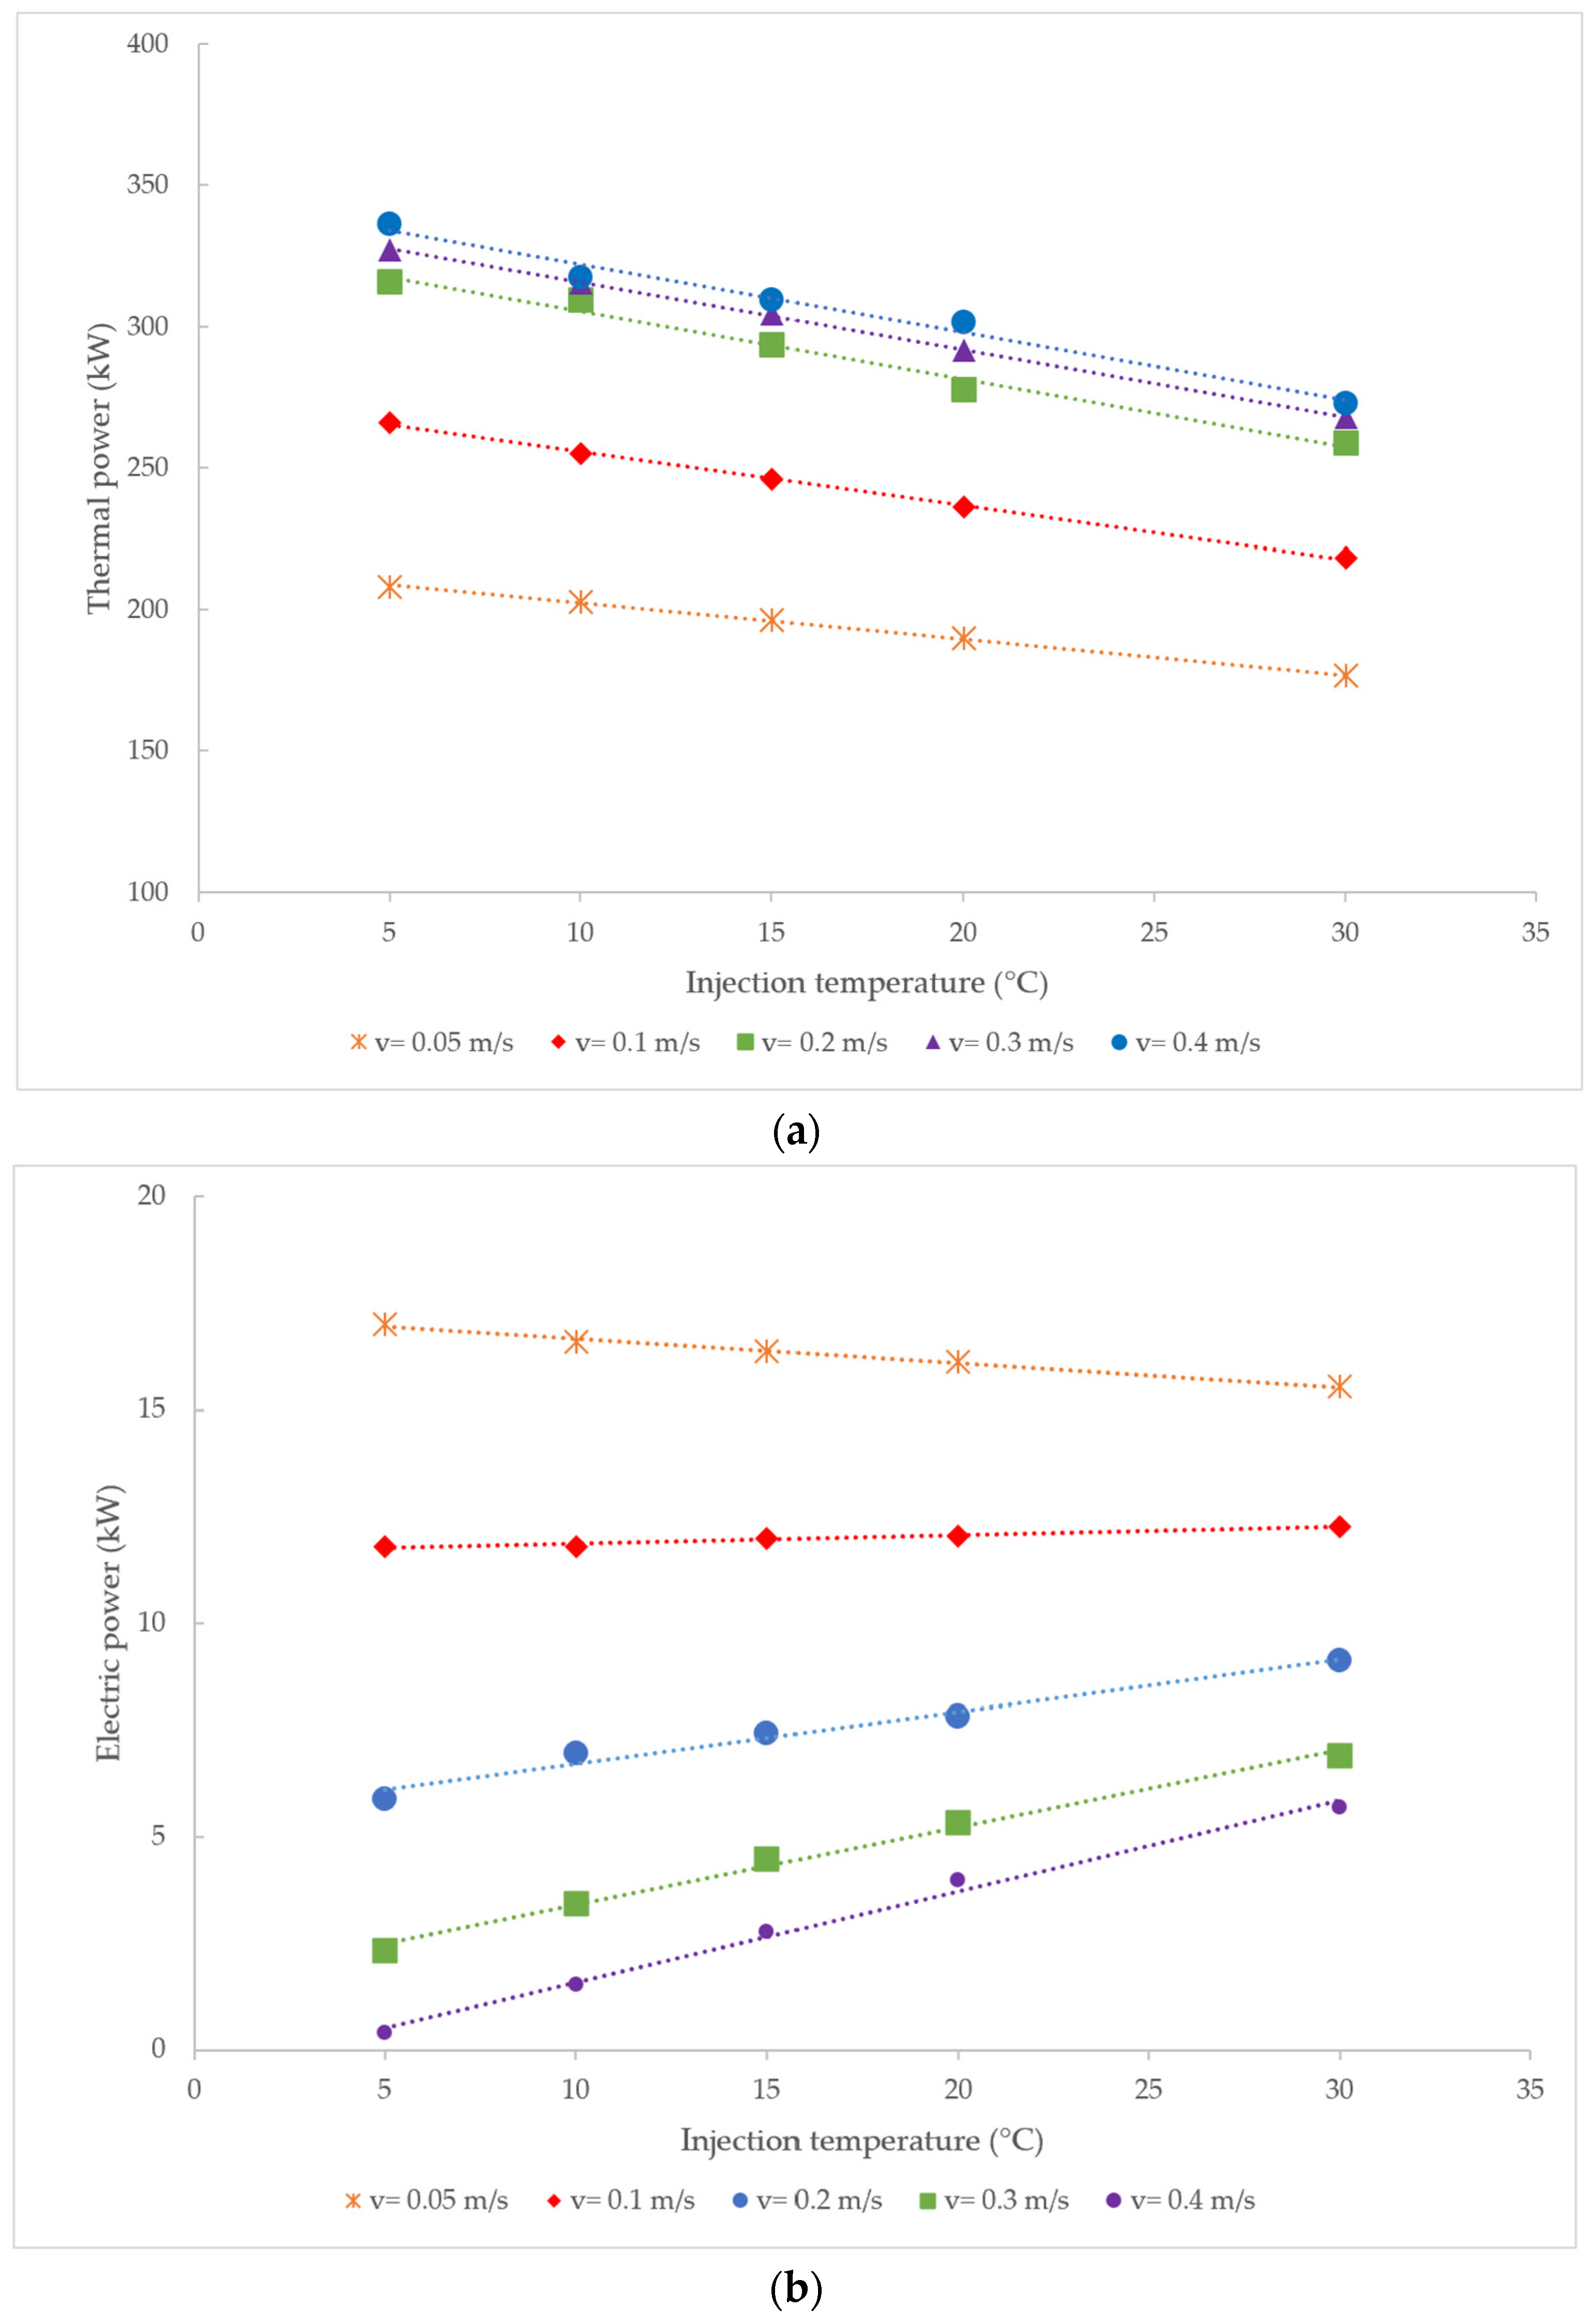
Figure 8 illustrates both thermal and electric powers generated by the ORC plant, considering varying injection velocities and temperatures. In terms of thermal power, it was observed that a higher injection temperature led to a reduction in thermal power output. On the other hand, with a consistent injection temperature, a higher fluid velocity resulted in increased thermal power generation. Conversely, the correlation between injection temperature and electric power does not follow a constant slope. Up to an injection velocity of 0.1 m/s, the electrical power decreased with the rising injection temperature. However, once the injection velocity surpassed 0.1 m/s, the relationship remained consistent: higher injection temperatures resulted in larger electric power outputs. Lower velocities led to increased electric power production, a trend that became less obvious with diminishing injection velocities.
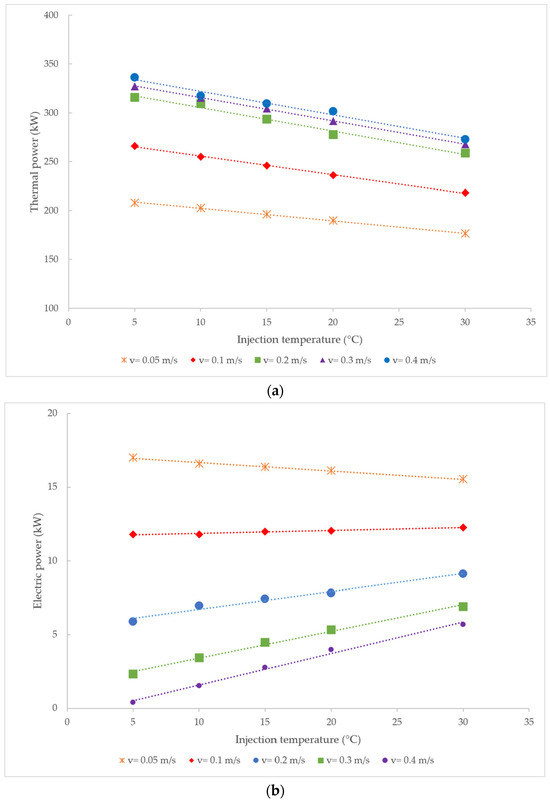
Figure 8.
(a) Thermal and (b) electric power generated from the ORC plant at the end of 25 years of operation.
Since the electric power generated at a 5 °C injection temperature became negative with an injection velocity above 0.4 m/s, this was chosen as the upper limit for all injection velocities. This is due to the operational constraints of ORC facilities, where no more electricity can be generated with a production temperature that is too low, a result of the rising injection temperatures. Consequently, the optimal condition for thermal power generation was achieved with an injection velocity of 0.4 m/s at 5 °C. On the other hand, a velocity of 0.05 m/s and an injection temperature of 5 °C were identified as the optimal parameters for maximizing the electric power production, among all the conditions investigated.
4.3. Non-Linear Thermal Gradient
Unlike the current methodology that assumed a linear geothermal gradient, an extended study incorporating alternative well configurations with increased lengths was conducted to examine their impacts. At Mount Meager, the temperature distribution indicated a maximum of approximately 250 °C at a depth of 1200 m and around 265 °C at 2000 m. The temperature increases from 500 m to 1200 m and from 1200 m to 2000 m follows a linear pattern. In Figure 9 and Figure 10, four additional well designs, deepened at 400 m intervals (i.e., 800 m, 1200 m, 1600 m, and 2000 m), are illustrated to assess the resultant electric power output in relation to varying injection velocities.
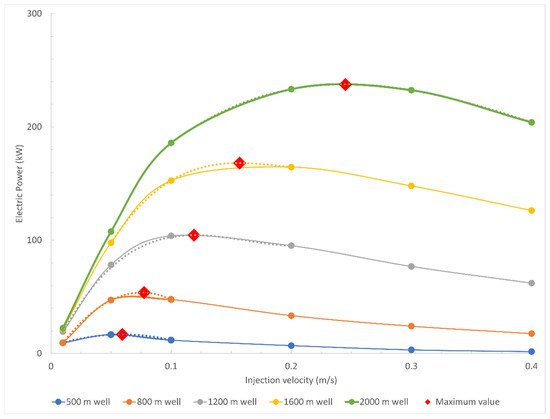
Figure 9.
Electric powers, comparing different well depths.
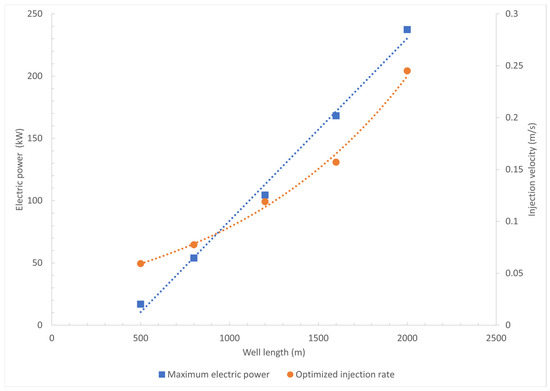
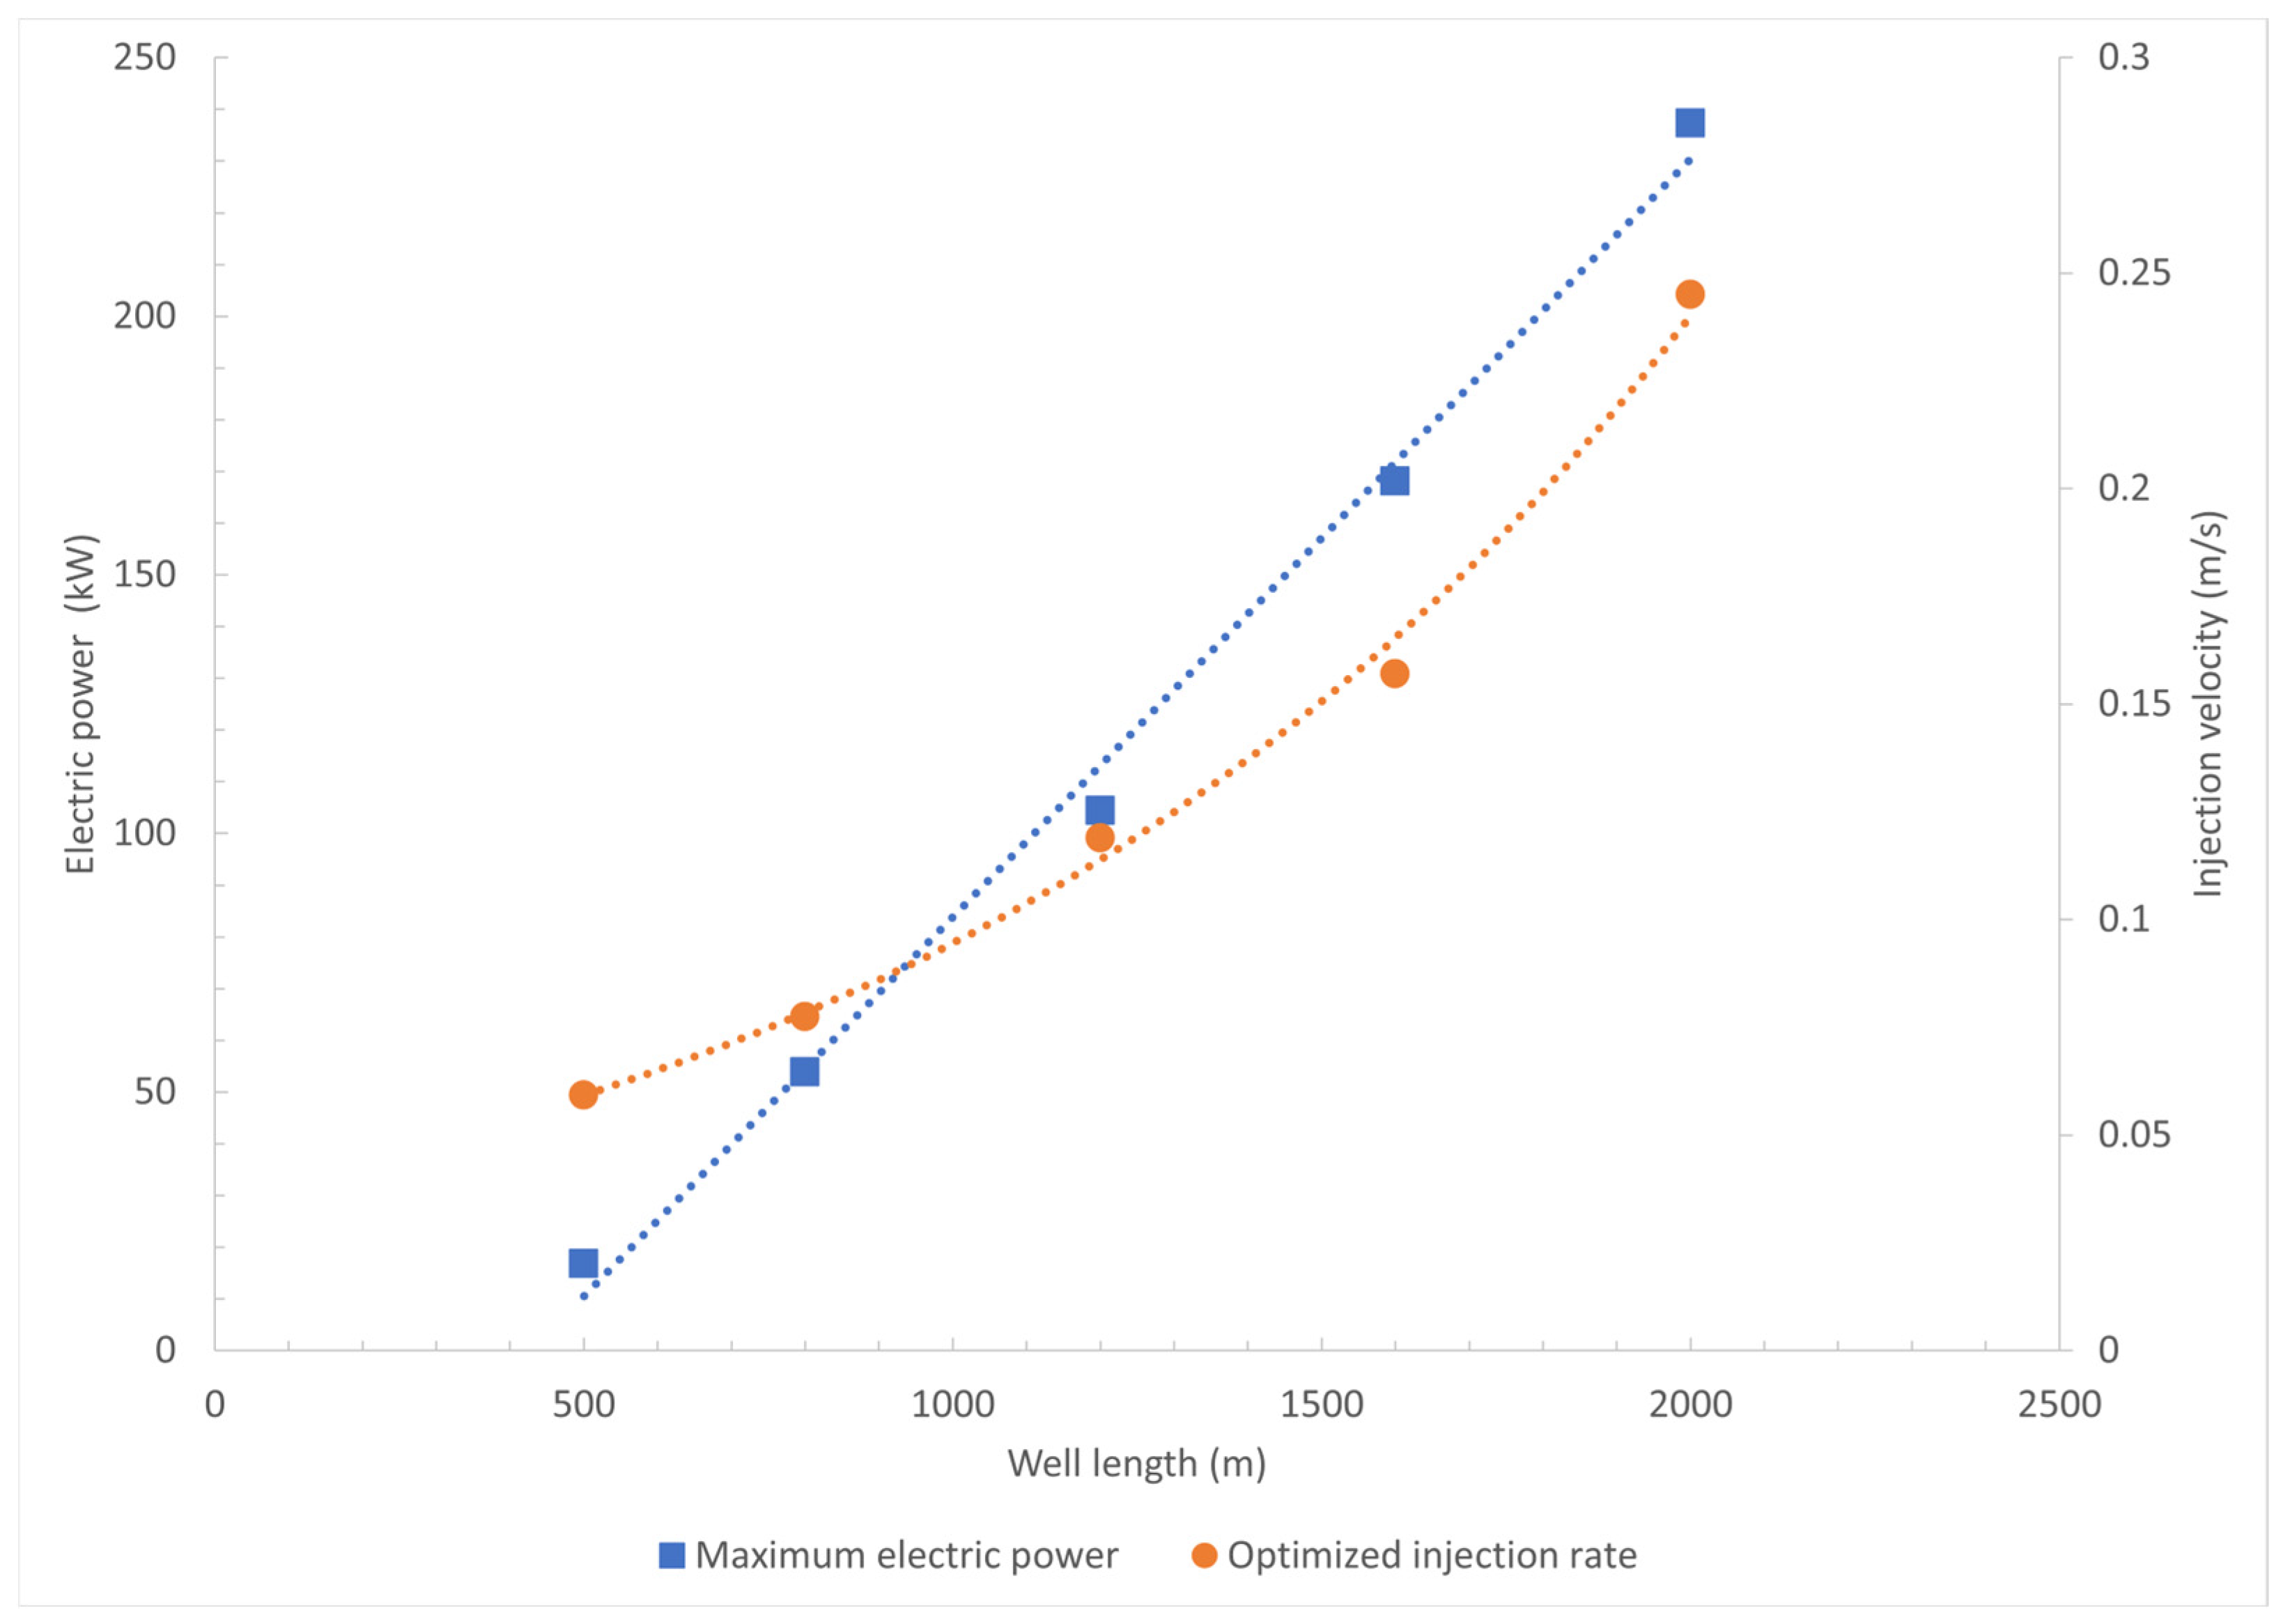
Figure 10.
Well length vs. optimal electric power output and corresponding injection velocity.
In Figure 9, a parabolic correlation is observed for each well configuration, initially increasing as the injection velocity increases, and then declining after reaching a peak. This suggests that there is an optimal range of injection velocities that maximizes the output, beyond which the efficiency of power generation declines. The solid lines connect each data point, while the dashed lines denote the trendlines applied for data correction. Deeper wells tend to have higher optimal electric power outputs, indicated by red diamond markers, achievable at correspondingly higher optimal injection velocities.
Figure 10 explores the relationship between well length, electric power output, and optimized injection velocity. The plot shows two distinct trend lines: one for the maximum electric power output, and the other for the optimized injection velocity as functions of the well length. The maximum electric power output demonstrates a linear relationship with the well length, indicating that longer wells consistently produce more power. This was expected, as deeper wells can access zones with higher temperatures, which significantly improves the thermodynamic efficiency of heat extraction. Conversely, the injection velocity shows an exponential relationship with the well length. As the wells become longer, the optimized injection velocity increases at a faster rate. This pattern suggests that more energy (in the form of fluid velocity) is required to efficiently harness geothermal energy from deeper depths. The discrepancy between the linear increase in power output and the exponential increase in required injection velocity highlights the challenges of balancing energy input with output in geothermal systems, as deeper wells necessitate higher pressures and velocities to overcome the increased resistance and to maximize heat extraction. This relationship may also reflect the non-linear thermal-dependent properties of water used in the system.
5. Conclusions
Utilizing site-specific parameters for Mount Meager, we successfully developed a comprehensive heat transfer model for a closed-loop geothermal system employing the finite element software COMSOL. The findings of this study highlight significant implications for sustainable geothermal energy extraction and effective reservoir management. The detailed findings are summarized below.
The output temperatures of BHEs are constrained by the injection velocity due to the non-isothermal flow. Initially, the modeled BHE rapidly attained extremely high temperatures but stabilized into a pseudo-steady state over the 25-year operational period considered in this study. The extraction of heat induced a cooling effect within the surrounding rock matrix and generated tensile stresses. A higher injection velocity amplified both the magnitude and the extent of these induced tensile stresses, thereby restricting the movement of the rocks. However, this effect diminished with increasing distance from the borehole. The substantial levels of thermally induced tensile stresses will undoubtedly result in the displacement and deformation of the pipes, thus giving rise to potential wellbore integrity issues, which will be the focus of future investigations. For a 500 m wellbore, an injection velocity of 0.4 m/s at 5 °C yielded the highest magnitude of thermal power production, reaching 273 kW after 25 years of operation. Conversely, the most effective injection condition for electric power production was a velocity of 0.05 m/s at 5 °C, resulting in 17 kW at the end of the 25-year period.
The geothermal gradient and well length are crucial factors to be considered in the design of dBHEs. Longer wells result in a significantly increased power output after optimization, with the difference becoming more pronounced at higher injection velocities. For example, a well length of 2000 m can generate 237.4 kW of electric energy at an injection velocity of 0.245 m/s, which is 14 times greater than the energy produced in the base case with a 500 m wellbore. This substantial increase in power output enhances the economic viability of dBHEs for future applications, contingent upon advancements in drilling operations’ cost-effectiveness and capabilities.
By proving the feasibility of this technology in a low-permeability environment, this study extends the research on utilizing geothermal resources in areas previously considered unsuitable. The analysis of thermal stresses and temperature distributions provided crucial insights for optimizing the design and operational strategies of geothermal systems, enhancing their efficiency and longevity. These advancements will contribute to the development of more reliable and efficient geothermal energy solutions, positioning geothermal energy as a vital component in the future of renewable energy and sustainable resource management.
Author Contributions
Implementation and writing, Y.C.; review and editing, Y.C. and Z.C.; supervision, Z.C. and S.Y. All authors have read and agreed to the published version of the manuscript.
Funding
The financial support of the Natural Sciences and Engineering Research Council of Canada (NSERC) is gratefully acknowledged.
Data Availability Statement
Data are available upon request due to restrictions.
Acknowledgments
We thank the three anonymous journal reviewers and the editor for their helpful comments and suggestions that greatly improved the quality of the paper.
Conflicts of Interest
The authors declare no conflicts of interest.
References
- Li, Q.; Han, Y.; Liu, X.; Ansari, U.; Cheng, Y.; Yan, C. Hydrate as a By-Product in CO2 Leakage during the Long-Term Sub-Seabed Sequestration and Its Role in Preventing Further Leakage. Environ. Sci. Pollut. Res. 2022, 29, 77737–77754. [Google Scholar] [CrossRef] [PubMed]
- Cano, N.; Cespedes, S.; Redondo, J.; Foo, G.; Jaramillo, D.; Martinez, D.; Gutiérrez, M.; Pataquiba, J.; Rojas, J.; Cortés, F.; et al. Power from Geothermal Resources as a Co-Product of the Oil and Gas Industry: A Review. ACS Omega 2022, 7, 40603–40624. [Google Scholar] [CrossRef] [PubMed]
- Witter, J. South Meager Geothermal Project: New Perspectives from Recently Unearthed Data. Innovate Geothermal Ltd., 2019. Available online: https://cdn.geosciencebc.com/pdf/Report-2019-07-Innovate-Geothermal.pdf (accessed on 30 June 2024).
- Lewis, T.J.; Souther, J.G. Meager Mountain, B.C.: A Possible Geothermal Energy Resource; Geothermal Series; Energy, Mines and Resources Canada, Earth Physics Branch: Ottawa, ON, Canada, 1978.
- Chen, Z.; Grasby, S.E.; Yuan, W.; Liu, X. Ground Surface Temperature Monitoring Data Analysis and Applications to Geothermal Exploration in Volcanic Areas, Mount Meager, Western Canada. Geothermics 2023, 108, 102610. [Google Scholar] [CrossRef]
- Geoscience BC Mount Meager Geothermal Data Compilation Project. Available online: https://www.geosciencebc.com/projects/2017-006/ (accessed on 28 November 2023).
- Tester, J.W.; Anderson, B.J.; Batchelor, A.S.; Blackwell, D.D.; DiPippo, R.; Drake, E.M.; Garnish, J.; Livesay, B.; Moore, M.C.; Nichols, K.; et al. Impact of Enhanced Geothermal Systems on US Energy Supply in the Twenty-First Century. Philos. Trans. A Math. Phys. Eng. Sci. 2007, 365, 1057–1094. [Google Scholar] [CrossRef]
- Walch, A.; Mohajeri, N.; Gudmundsson, A.; Scartezzini, J.-L. Quantifying the Technical Geothermal Potential from Shallow Borehole Heat Exchangers at Regional Scale. Renew. Energy 2021, 165, 369–380. [Google Scholar] [CrossRef]
- Bu, X.; Jiang, K.; Li, H.; Ma, F.; Wang, L. Experimental Study on Convective Heat Transfer of an Open-Loop Borehole Heat Exchanger. Geotherm. Energy 2023, 11, 8. [Google Scholar] [CrossRef]
- Ma, H.; Mao, R.; Zhou, J.; Pei, P.; Tian, X.; Zhang, Z. Study on Influence of Geotechnical Characteristics on Heat Transfer Performance of Borehole Heat Exchanger. Energy Sources Part A-Recovery Util. Environ. Eff. 2023, 45, 1822–1841. [Google Scholar] [CrossRef]
- Amanzholov, T.; Belyayev, E.; Mohanraj, M.; Toleukhanov, A. Study of borehole heat exchanger heat transfer enhancement parameters. J. Math. Mech. Comput. Sci. 2022, 115, 65–77. [Google Scholar] [CrossRef]
- Sun, L.; Fu, B.; Wei, M.; Zhang, S. Analysis of Enhanced Heat Transfer Characteristics of Coaxial Borehole Heat Exchanger. Processes 2022, 10, 2057. [Google Scholar] [CrossRef]
- Renaud, T.; Pan, L.; Doran, H.; Falcone, G.; Verdin, P.G. Numerical analysis of enhanced conductive deep borehole heat exchangers. Sustainability 2021, 13, 6918. [Google Scholar] [CrossRef]
- Bräunig, L.; Jusri, T.; Seupel, C.; Bertani, R.; Buske, S. A Comprehensive Seismic Data Analysis for Geothermal Reservoir Characterization within Project DESCRAMBLE. 2018. Available online: https://www.researchgate.net/publication/323218989_A_comprehensive_seismic_data_analysis_for_geothermal_reservoir_characterization_within_project_DESCRAMBLE (accessed on 30 June 2024).
- Alimonti, C.; Soldo, E.; Bocchetti, D.; Berardi, D. The wellbore heat exchangers: A technical review. Renew. Energy 2018, 123, 353–381. [Google Scholar] [CrossRef]
- Tarrad, A.H. 3D numerical modeling to evaluate the thermal performance of single and double U-tube ground-coupled heat pump. HighTech Innov. J. 2022, 3, 115–129. [Google Scholar] [CrossRef]
- Li, C.; Guan, Y.; Wang, X.; Li, G.; Zhou, C.; Xun, Y. Experimental and numerical studies on heat transfer characteristics of vertical deep-buried U-bend pipe to supply heat in buildings with geothermal energy. Energy 2018, 142, 689–701. [Google Scholar] [CrossRef]
- Huang, Y.; Zhang, Y.; Xie, Y.; Zhang, Y.; Gao, X.; Ma, J. Field Test and Numerical Investigation on Deep Coaxial Borehole Heat Exchanger Based on Distributed Optical Fiber Temperature Sensor. Energy 2020, 210, 118643. [Google Scholar] [CrossRef]
- Song, X.; Zheng, R.; Li, G.; Shi, Y.; Wang, G.; Li, J. Heat Extraction Performance of a Downhole Coaxial Heat Exchanger Geothermal System by Considering Fluid Flow in the Reservoir. Geothermics 2018, 76, 190–200. [Google Scholar] [CrossRef]
- Hu, X.; Banks, J.; Wu, L.; Liu, W.V. Numerical Modeling of a Coaxial Borehole Heat Exchanger to Exploit Geothermal Energy from Abandoned Petroleum Wells in Hinton, Alberta. Renew. Energy 2020, 148, 1110–1123. [Google Scholar] [CrossRef]
- Noorollahi, Y.; Pourarshad, M.; Jalilinasrabady, S.; Yousefi, H. Numerical Simulation of Power Production from Abandoned Oil Wells in Ahwaz Oil Field in Southern Iran. Geothermics 2015, 55, 16–23. [Google Scholar] [CrossRef]
- Kolo, I.; Sousa, R.; Zhang, T. Heat Transmission in a Geothermal Wellbore: Modelling and Application. In Proceedings of the 19th Australasian Fluid Mechanics Conference, AFMC 2014, Melbourne, Australia, 8–11 December 2014. [Google Scholar]
- Mahmoodpour, S.; Singh, M.; Turan, A.; Bär, K.; Sass, I. Simulations and Global Sensitivity Analysis of the Thermo-Hydraulic-Mechanical Processes in a Fractured Geothermal Reservoir. Energy 2022, 247, 123511. [Google Scholar] [CrossRef]
- Mahmoodpour, S.; Singh, M.; Bär, K.; Sass, I. Thermo-Hydro-Mechanical Modeling of an Enhanced Geothermal System in a Fractured Reservoir Using Carbon Dioxide as Heat Transmission Fluid- A Sensitivity Investigation. Energy 2022, 254, 124266. [Google Scholar] [CrossRef]
- Mahmoodpour, S.; Singh, M.; Mahyapour, R.; Tangirala, S.K.; Bar, K.; Sass, I. Numerical Simulation of Thermo-Hydro-Mechanical Processes at Soultz-Sous-Forêts. Energies 2022, 15, 9285. [Google Scholar] [CrossRef]
- Abe, H.; Sekine, H.; Shibuya, Y. Thermoelastic Analysis of a Cracklike Reservoir in a Hot Dry Rock During Extraction of Geothermal Energy. J. Energy Resour. Technol. Trans. Asme 1983, 105, 503–508. [Google Scholar] [CrossRef]
- Nakagawa, M.; Jahanbakhsh, K.; Arshad, M. Beyond Hydrocarbon Extraction: Enhanced Geothermal Systems. In New Frontiers in Oil and Gas Exploration; Springer: Cham, Switzerland, 2016; pp. 487–506. ISBN 978-3-319-40122-5. [Google Scholar]
- Guo, L.; Zhang, J.; Li, Y.; McLennan, J.; Zhang, Y.; Jiang, H. Experimental and Numerical Investigation of the Influence of Groundwater Flow on the Borehole Heat Exchanger Performance: A Case Study from Tangshan, China. Energy Build. 2021, 248, 111199. [Google Scholar] [CrossRef]
- Paul Day, J. Substrate Contributions to Automotive Catalytic Converter Performance: The Role of Channel Shape on Catalyst Efficiency. In Studies in Surface Science and Catalysis; Kruse, N., Frennet, A., Bastin, J.-M., Eds.; Catalysis and Automotive Pollution Control IV; Elsevier: Amsterdam, The Netherlands, 1998; Volume 116, pp. 453–463. [Google Scholar]
- Saeid, S.; Al-Khoury, R.; Barends, F. An Efficient Computational Model for Deep Low-Enthalpy Geothermal Systems. Comput. Geosci. 2013, 51, 400–409. [Google Scholar] [CrossRef]
- Chai, Y.; Chen, Z.; Yin, S. A Preliminary Analysis of In-Situ Stress at Mount Meager by Displacement Discontinuity Method with Topography and Tectonics Considered. Energies 2023, 16, 1397. [Google Scholar] [CrossRef]
- Fairbank Engineering Ltd. 2001–2002 Drilling Program South Meager Geothermal Project British Coloumbia; Fairbank Engineering Ltd.: Worcester, MA, USA, 2002. [Google Scholar]
- Water—Density, Specific Weight and Thermal Expansion Coefficients. Available online: https://www.engineeringtoolbox.com/water-density-specific-weight-d_595.html (accessed on 1 May 2024).
- Zeb, A.; Abid, M.; Zeb, M.A.; Qureshi, M.O.; Younas, U.; Batool, I. Measurement and Prediction of Thermal Conductivity of Volcanic Basalt Rocks from Warsak Area. Adv. Mater. Sci. Eng. 2020, 2020, e4756806. [Google Scholar] [CrossRef]
- Yuan, W.; Chen, Z.; Grasby, S.E.; Little, E. Closed-Loop Geothermal Energy Recovery from Deep High Enthalpy Systems. Renew. Energy 2021, 177, 976–991. [Google Scholar] [CrossRef]
- Alimonti, C.; Soldo, E. Study of Geothermal Power Generation from a Very Deep Oil Well with a Wellbore Heat Exchanger. Renew. Energy 2016, 86, 292–301. [Google Scholar] [CrossRef]
- Massachusetts Institute of Technology (Ed.) The Future of Geothermal Energy: Impact of Enhanced Geothermal Systems (EGS) on the United States in the 21st Century: An Assessment; Massachusetts Institute of Technology: Cambridge, MA, USA, 2006; ISBN 978-0-615-13438-3. [Google Scholar]
- COMSOL Multiphysics Reference Manual. Available online: https://doc.comsol.com/5.5/doc/com.comsol.help.comsol/COMSOL_ReferenceManual.pdf (accessed on 1 May 2024).


Disclaimer/Publisher’s Note: The statements, opinions and data contained in all publications are solely those of the individual author(s) and contributor(s) and not of MDPI and/or the editor(s). MDPI and/or the editor(s) disclaim responsibility for any injury to people or property resulting from any ideas, methods, instructions or products referred to in the content. |
© 2024 by the authors. Licensee MDPI, Basel, Switzerland. This article is an open access article distributed under the terms and conditions of the Creative Commons Attribution (CC BY) license (https://creativecommons.org/licenses/by/4.0/).