Article

Multi-Scenario Research on the Coupled and Coordinated Development of the Economic–Energy–Environmental (3E) System under the Reconstruction of the Power System—New Exploration Based on the “Dual Triangle” Theory

1
Guangzhou Power Supply Bureau of Guangdong Power Grid Co., Ltd., Guangzhou 510620, China
2
Guangzhou Institute of Energy Conversion, Chinese Academy of Sciences, Guangzhou 510640, China
3
School of Energy Science and Engineering, University of Science and Technology of China, Hefei 230026, China
*
Author to whom correspondence should be addressed.
Energies 2024, 17(14), 3468; https://doi.org/10.3390/en17143468
Submission received: 20 June 2024 / Revised: 8 July 2024 / Accepted: 9 July 2024 / Published: 14 July 2024
(This article belongs to the Special Issue Energy for Sustainable Development and Circular Economy—2nd Edition)

Abstract

:
Under the background of building a new-type power system, as the core of the energy system, the restructuring of the power system will inevitably have a linked impact on the coordinated development of the economy–energy–environment system. A “Dual Triangle” theoretical framework consisting of the “Energy Impossibility Triangle” and “Sustainable Development Triangle” was constructed in this paper. By combining historical statistical analysis with scenario predictive analysis, the historical characteristics of the “Dual Triangle” and future trends under different scenarios were analyzed, and the coupled interaction relationship of the “Dual Triangle” was also studied. Conclusions were as follows: The energy system gradually inclined towards economy and cleanliness from 2010 to 2022, and the operation status of the “Dual Triangle” was stable. A positive coupling relationship within the “Dual Triangle” in vigorously promoting renewable energy scenarios is close, which can be regarded as the preferred path for the reconstruction of the power system. The security and low-carbon phased development scenario is a development model that dynamically mitigates the challenges of the “Energy Impossibility Triangle”. Security has become the core contradiction of the “Energy Impossibility Triangle”. This paper conducts an integrated and innovative application of the “Dual Triangle” theory and provides a case basis for how to achieve the coupled interaction of the “Dual Triangle”.

1. Introduction

In the 1980s, the World Commission on Environment and Development (WCED) formally introduced the concept of “sustainable development” in its report “Our Common Future” [1], indicating that sustainable development is development that can meet the needs of the present generation without compromising the ability of future generations to meet their own needs. Since then, numerous international energy, economic, and environmental protection agencies have begun to focus on exploring the coordination and sustainable development issues of the economy–energy–environment system (hereinafter referred to as the 3E system), which is the “Sustainable Development Triangle” problem. That is to say, the “Sustainable Development Triangle” is used to describe the interconnected relationship between energy, economy, and environment [2]. In 2010, the World Energy Council (WEC) proposed the “Energy Trilemma”, which is what we call the “Energy Impossibility Triangle”. The “Energy Impossibility Triangle” is used to describe the balance between the three indices of energy security, energy affordability (economy), and environmental sustainability (cleanliness) in the development of the energy system itself. The underlying logic is that it is impossible to ensure the simultaneous development of all three indices, as they are mutually exclusive [3,4]; hence, a balanced choice must be made.
Research on the “Sustainable Development Triangle” issue has been conducted by scholars both domestically and internationally. They have developed a series of models using quantitative methods, such as multi-objective programming [5,6], exploratory spatial data analysis (ESDA) [7], the analytic hierarchy process (AHP) [8], kernel function density analysis [9], and the life cycle assessment method [10], and across different spatial scales, such as national [8], provincial [11,12], urban agglomeration [13], and city-level [14] scales, to conduct comprehensive evaluation studies on the coordinated development of the 3E system from multiple perspectives. Results show that the coupled and coordinated development of the 3E system has significant regional differences. Different research methods may also lead to completely opposite research results. Therefore, the method of combining subjective and objective weighting of indicators can make the results more in line with reality. For instance, in the construction of the 3E system evaluation index system, scholars designed and added indices according to their areas of interest, leading to a more refined description of the 3E system [15]. In addition, scholars have also expanded their research on the 3E system by incorporating an additional subsystem, extending the 3E system to a quaternary system for study. For example, Oliveira, C. et al. [6] integrated the social subsystem into the 3E system to study the interactions between the economy, energy, and their impact on the environment; Yiming Wei [16] included the population system in the research scope, constructing multi-objective planning and integrated models to reflect the balancing relationship of subsystem coordinated development. With the rapid development of technology, the impact of technological factors on the 3E system has become increasingly significant. Yang Yu [17,18,19], Wanjun Ye [11], and Hailong Chen [20] incorporated technological elements into the 3E system to measure and evaluate the coordinated development of the quaternary system. The research results indicate that conforming to the characteristics of the times and adding a subsystem (or index) closely related to the characteristics of the era can make the coordinated development state of a region more realistic. Besides the 3E coupled system, some scholars have expanded their focus to include the social system, constructing a 3E1S coupled system. Jiajun Bai [21] and Linyu Wang [22] conducted empirical research on the Chengdu-Chongqing urban agglomeration and Jiangsu Province, respectively, obtaining conclusions about the temporal and spatial heterogeneity differences between different urban agglomerations through temporal and spatial evolution.
Since the proposal of the “Energy Impossibility Triangle”, scholars both domestically and internationally have conducted extensive research, mainly involving three aspects: First, a qualitative explanation of the basic meaning and deep logic of the “Energy Impossibility Triangle” from an interdisciplinary perspective. The “Impossible Triangle” was first proposed in the financial field, indicating that a country cannot simultaneously achieve free capital flows, independent monetary policy, and stable exchange rates in its financial policies. This theory has since been widely cited and applied in various fields. Qiuye Sun [23] and others introduced entropy theory as a quantitative tool into the problem of the energy system’s impossible triangle, summarizing the issues of the energy system, analyzing the advantages and challenges of the ETI, and outlining potential future research directions. Second, exploration into solving the “Energy Impossibility Triangle” issue. Chunzhi Wang [3], Guang Chen [24], Chuanjun Liu [25], and others used the coupled coordination model to construct a comprehensive evaluation index system for energy development from the perspectives of energy security, energy cost, and energy environment, analyzing the feasibility of breaking the “Energy Impossibility Triangle”; Qingjun Zhang [26] and others used spatial measurement methods to analyze the impact of financial openness on energy security, finding a significant negative correlation between financial openness and energy security. Masoud [27] and others used the state transition vector autoregression model to analyze the impact of the “Energy Impossibility Triangle” on sustainable economic development and geopolitical risks, and they pointed out that countries should formulate relevant policies to promote energy technology transformation to facilitate sustainable economic growth. The choices made by some foreign countries in the process of energy development in the face of the “Energy Impossibility Triangle” also provide relevant experience and lessons. Cosimo [28] and others used time series analysis and machine learning to study the trilemma of carbon emissions, energy supply, and economic growth in Russia, and finally, combined with the policies initiated by Russia and the current economic background, it was proved that stabilizing or even reducing greenhouse gas emissions without harming economic growth is possible. Elsa and Neil [29] used the Brain-Energy generation investment model to simulate the energy transition path trends in the UK, Germany, and Italy, and the results indicate that achieving an energy transition to break the “Energy Impossibility Triangle” requires the evolution of policies and strategies of different market participants.
The aforementioned research mostly explores the development patterns of the “Sustainable Development Triangle” and the “Energy Impossibility Triangle” (hereinafter referred to as the “Dual Triangle”) by analyzing historical data. However, there is a relative lack of predictive analysis on the future development trends and influencing factors of the “Dual Triangle”, especially research that conducts coupled and collaborative analysis of the “Dual Triangle”. With the proposal of China’s carbon peak by 2030 and carbon neutrality by 2060 (referred to as the “double carbon” strategic goal) and the rapid restructuring of the power system, it would be difficult to comprehensively study the impact of the energy and power industry’s development on the economy and society and to accurately grasp the society’s and economy’s requirements for the energy and power industry, if the connections between the “Dual Triangle” are not considered. This need becomes even more urgent, especially when the power industry’s goals of peaking carbon emissions and achieving carbon neutrality are increasingly related to the overall target realization.
In light of this, this study takes the energy system as the center, constructs a “Dual Triangle” theoretical framework, and takes Guangzhou City, one of the four central cities in the Guangdong-Hong Kong-Macao Greater Bay Area, as an example. By combining historical statistical analysis with scenario predictive analysis, this study deeply analyzes the historical patterns and future trends of the energy system’s security, cleanliness, and economy, identifies the key factors influencing the relationship between the economy, energy, and environment, and explores the optimal combination for the collaborative development of the “Dual Triangle”.
Case region introduction: Guangzhou City is one of the four central cities (Hong Kong, Macau, Guangzhou, Shenzhen) in the Guangdong-Hong Kong-Macao Greater Bay Area and is one of the largest super-large cities in terms of energy consumption in China. However, it is also a typical energy-importing city. Fossil energy sources such as coal, oil, and natural gas rely on imports and transfers from other regions, and the local endowment of renewable energy is poor. Except for solar energy resources, the development potential of other renewable energy sources is already close to saturation. The local power generation capacity is relatively weak. In 2022, Guangzhou City’s power consumption was 115.5 billion kWh [30], with a power self-sufficiency rate of only 31.63%. It has the typical characteristics of “serious energy scarcity and extremely high power load density”. In terms of the environment, the city’s annual average PM2.5 concentration was about 22 microgram/cubic meter in 2022, far exceeding the standard recommended by the World Health Organization (WHO) (PM2.5 < 10 microgram/cubic meter). There is a strong desire for the restructuring of the power system and the coupled and coordinated development of the 3E system.

2. Materials and Methods

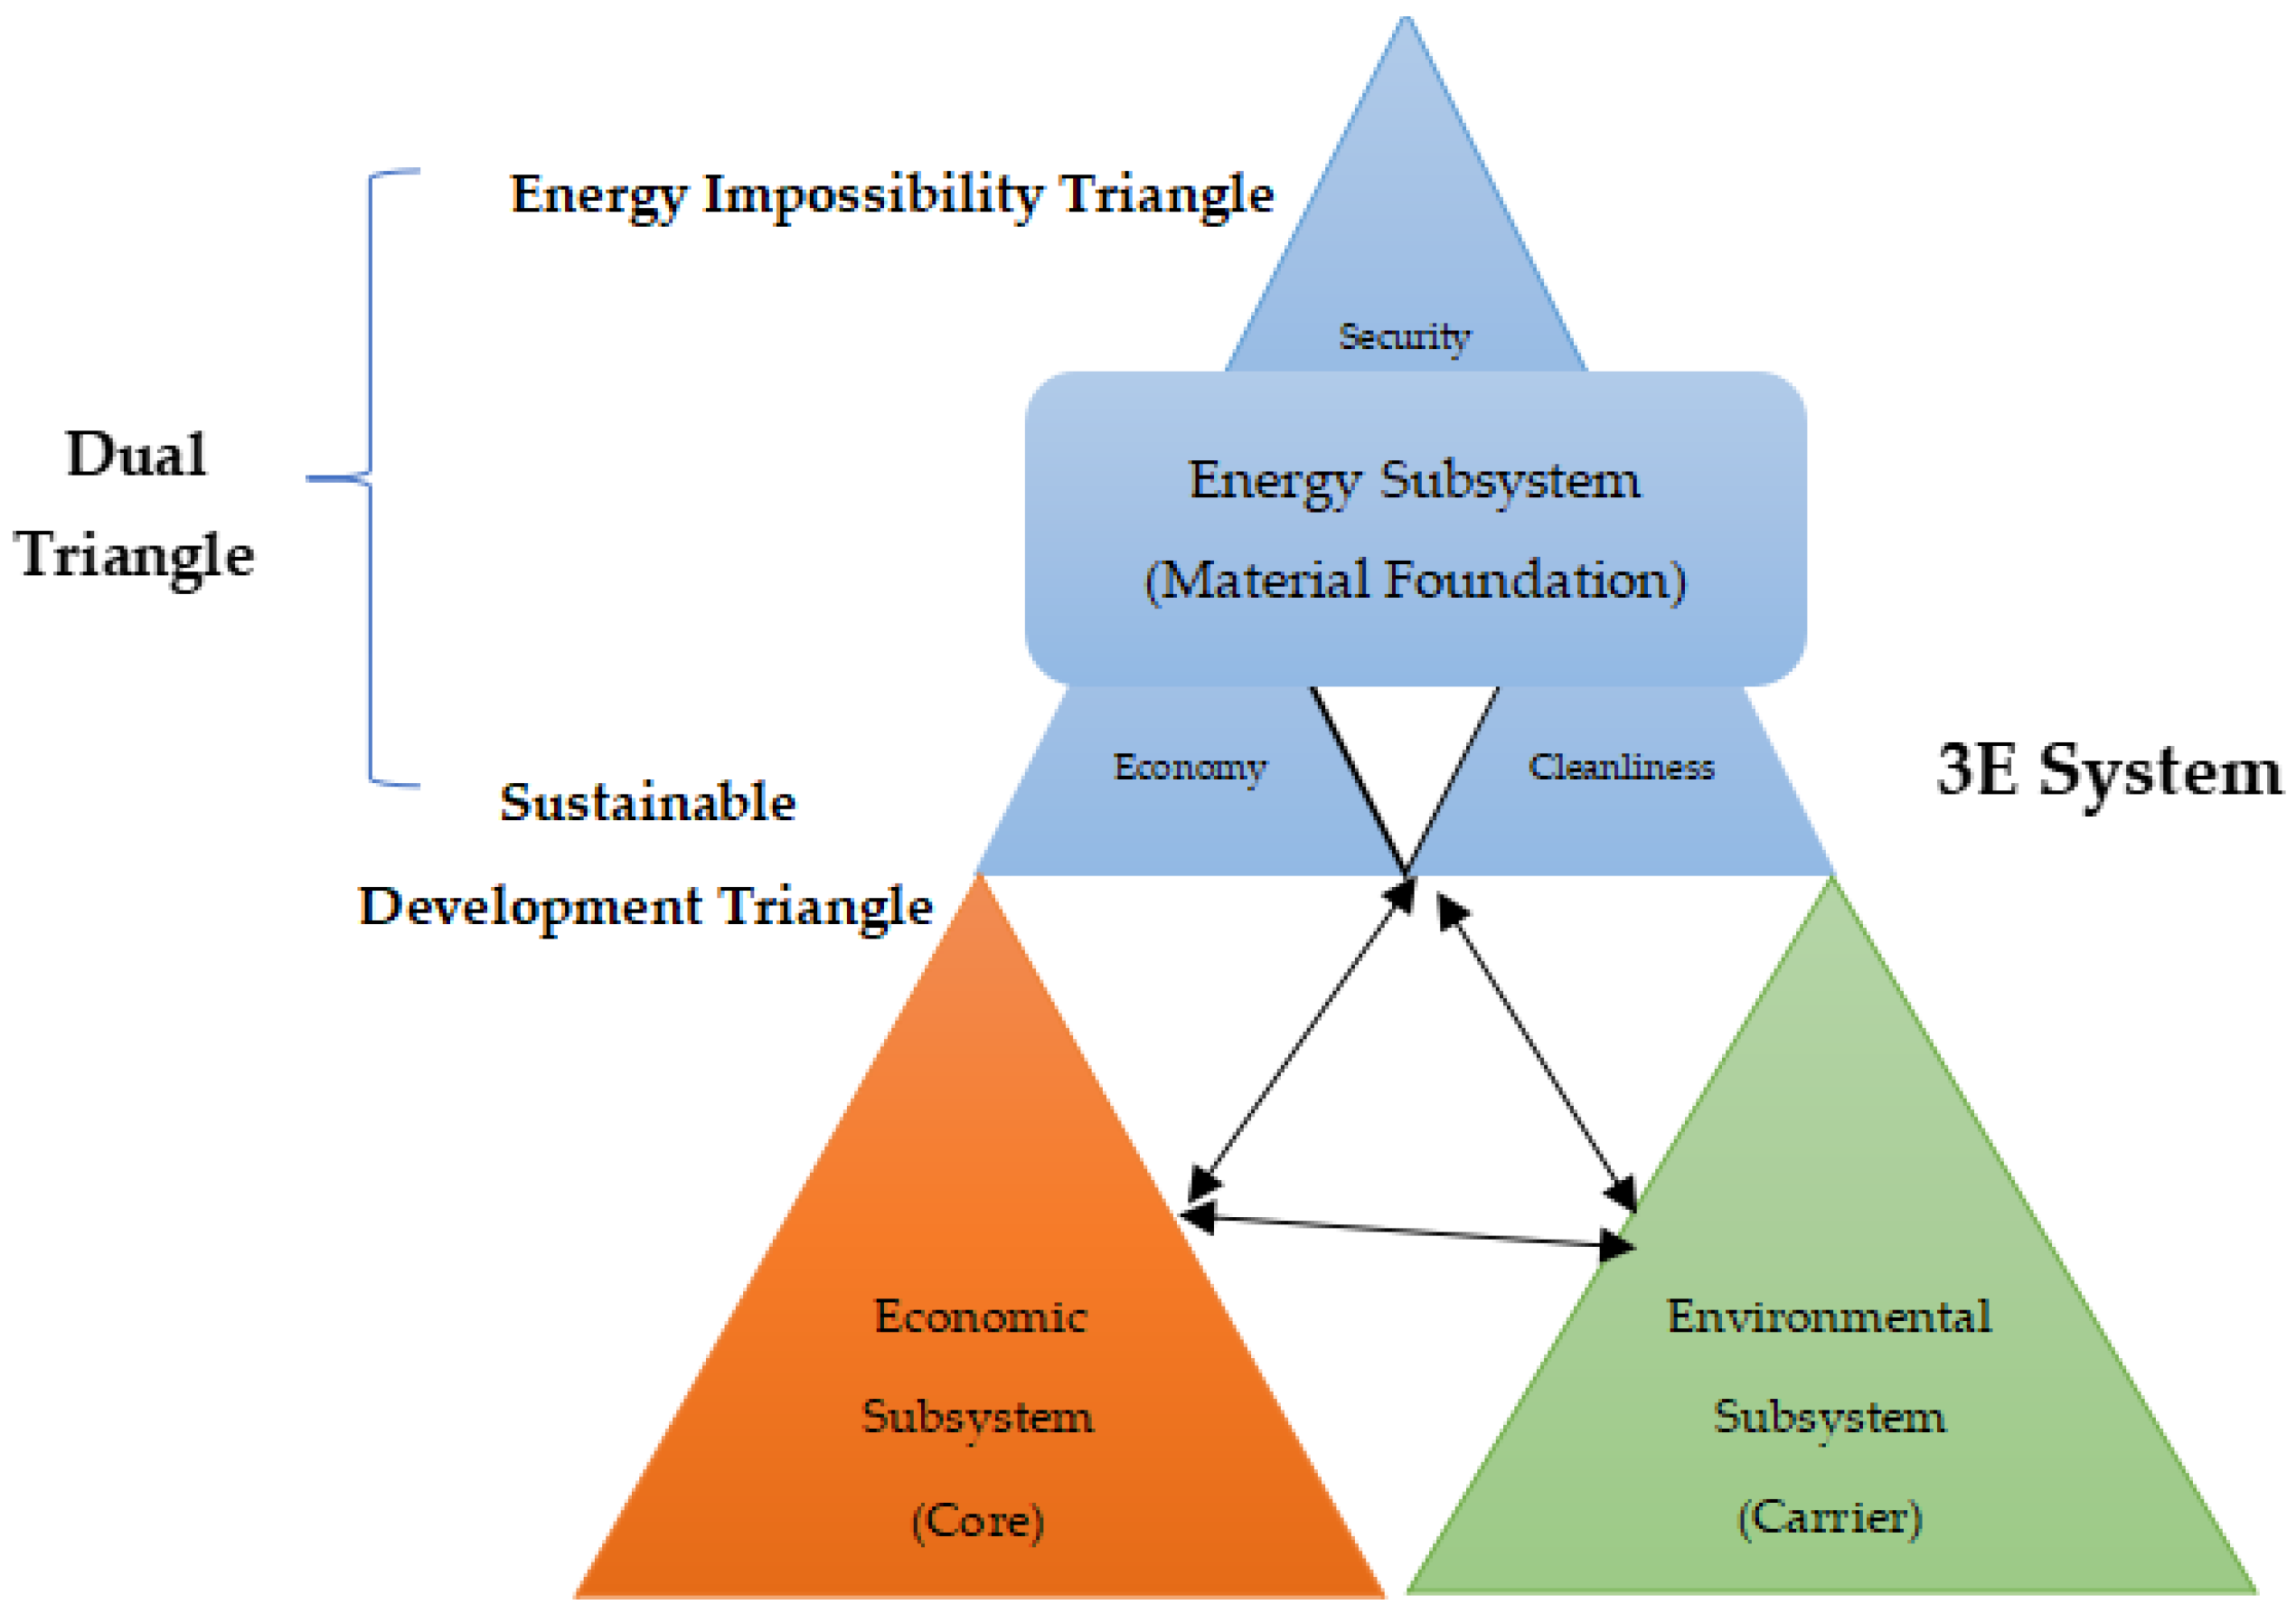
2.1. The “Dual Triangle” Theoretical Framework

The “Sustainable Development Triangle” is used to describe the interconnected relationship between energy, economy, and environment [2]. The economic subsystem is the core of the 3E system, with both energy and environment serving this core. In return, the economic system provides financial and material support for energy and the environment. The environmental subsystem is the carrier of the 3E system, providing a space for economic and energy activities. The energy subsystem is the material basis of the 3E system, providing power support for economic development and environmental protection. Any changes in a subsystem of the 3E system will affect the others through their connections with other subsystems, thus impacting the coordinated development of the entire 3E system.
The “Energy Impossibility Triangle” is used to describe the balance between security, cleanliness, and economy in the development of the energy system itself. These three aspects are interrelated and mutually restrictive. Pursuing higher energy security may require increased investment, thus affecting the economy of energy. Overemphasizing the cleanliness of energy may increase costs in the short term, impacting economic performance. Meanwhile, focusing too much on economy may sacrifice the security or cleanliness of energy to some extent.
We call the “Sustainable Development Triangle” and the “Energy Impossibility Triangle” the “Dual Triangle”. There is an intrinsic link within the “Dual Triangle” (Figure 1). Sustainable development requires a stable and clean energy supply as support, and the direction of energy system development will influence the focus choice of the “Energy Impossibility Triangle”. When the development of the economic system is hindered, it is necessary to reduce energy costs to provide more space for economic growth, and the focus of energy development should lean towards economy. On the other hand, the energy, economy, and cleanliness in the “Energy Impossibility Triangle” will affect the economic, social, and ecological activities in the “Sustainable Development Triangle”. When the focus of energy development leans towards cleanliness, it may enhance the carrying capacity of the external environmental system while possibly causing energy price shocks and weakening the potential for economic development. Therefore, the energy system primarily interacts with the economic system and environmental system through changes in energy security, economy, and cleanliness.

2.2. Energy System Index Accounting

(1)
The selection of measurement indicators for the “Energy Impossibility Triangle”
Based on the three dimensions of the “Energy Impossibility Triangle”, ten measurement indicators were selected (see Table 1 for details).
(2)
Power demand forecasting
The Long-range Energy Alternatives Planning System (LEAP) model is a bottom-up energy–environment accounting tool developed jointly by the Stockholm Environment Institute and Boston University in the United States. As a bottom-up simulation model, the LEAP model can be used to analyze and predict the fuel demand, gas pollutant emissions, cost-effectiveness, etc., of various regions and sectors, and it has been widely used in global, national, and regional energy consumption research and greenhouse gas emission reduction evaluation [31]. The LEAP model is mainly composed of energy demand, processing and conversion, resource supply, cost analysis, environmental assessment, and other modules. Researchers can freely choose the appropriate model framework and data structure according to the characteristics of research objects, data availability, analysis purposes, and types. In this study, it is primarily used for power consumption forecasting; here, the model is modified to include activity levels and power intensity.
E = V k × ρ k
Among them, we have the following:
E—power demand.
Vk—value added of sector k, with k = 1, 2, …, 11, denoting the 11 sub-sectors including agriculture, industry, construction, transportation, etc.
ρ k —power intensity, which mainly refers to the power consumption per unit of value added in sector k. Considering the current economic, social, and industrial structure characteristics of Guangzhou, and assuming that technological development levels and the efficiency of electrical equipment will steadily improve based on the first two years of the 13th and 14th Five-Year Plans, the government will also adopt more feasible policies and measures to guide and promote a steady increase in the electrification level of various industries.
The forecast results (Table 2) show that the power demand of Guangzhou city will increase from 115.5 billion kWh in 2022 to 156.5 billion kWh in 2030, with an average annual growth rate of 3.67%.
(3)
Power supply forecast
(a)
Scenario setting
In this paper, four power supply scenarios are set, and the settings of different scenarios and various parameters are shown in Table 3, Table 4 and Table 5. Taking 2022 as the base year, the forecast period is 2023–2030.
The value of the mandatory time period (Table 4) was set according to the characteristics of coal power units and the city’s electricity consumption of Guangzhou. The period from 11 p.m. to 5 a.m. is usually a load trough period, during which the power load usually shows a situation where the supply is greater than the demand, so there will be excess power, resulting in a large amount of power transmission to the outside. In this case, however, the transmission of electricity is not taken into account, so the coal-fired units, which are the main power suppliers, are not required to generate electricity during that period. The electricity load during this period is met by other power generation devices. In addition, in actual production, the hot start of boilers and steam turbines is generally carried out within 10 h of shutdown, and it takes 1.5 h–2 h to operate. In this paper, the extremely hot start-up of coal-fired units is considered to reduce the start-up time and reduce the loss of equipment life.
(b)
Model method
Taking the lowest net present cost (NPC) as the optimization goal and considering the influence of fuel price, local natural resource endowment, and other factors on the whole regional power system,
N P C = m i n i Ω C i c a p + C i r e p + C i o m + C i g d + C i f p R i g d R i s
where i stands for each equipment type. Ω represents the collection of all devices in the whole system. C i c a p represents the initial capital cost of the i-th type of equipment. C i r e p represents the replacement cost of the i-th type of equipment. C i o m represents the operation and maintenance cost of the i-th type of equipment. C i g d represents the cost of purchasing power from the power grid for the i-th type of equipment. C i f p represents the fuel purchase cost of the i-th type of equipment. R i g d is the income from selling power to the grid by the i-th type of equipment. R i s is the residual value of the i-th type of equipment at the end of the project’s lifecycle. In terms of constraints, the main constraint is energy balance, ensuring the energy balance of the power system.
In terms of carbon emission forecasting, local power source carbon emissions are calculated based on the measured values of carbon content in various fuels from public sources and the default values in the HOMER software [35,36]. The carbon emissions from purchased electricity from 2022 to 2030 are calculated using the recommended average carbon emission factor for Guangdong Province’s electricity in the “Notice by the Guangdong Provincial Development and Reform Commission on the Issuance of Methods for Accounting Carbon Dioxide Emissions in Cities above Prefecture Level in Guangdong Province” (see Table 6).

2.3. Index Accounting of 3E System

(1)
The construction of the 3E system’s index system
To adapt to China’s statistical standards and the development characteristics of the 3E (economy–energy–environment) system, this paper selects several papers published by Chinese scholars in recent years as representatives [37,38] and statistically analyzes the 3E system indicator frameworks mentioned in these papers. Considering the availability of relevant data in Guangzhou, 12 indicators are optimally selected as the measurement indicators for the 3E system (Table 7), ensuring that the indicator system has a high degree of industry recognition.
(2)
The calculation of the coupling coordinated development degree
The calculation formula of the coupling coordinated development degree is as follows:
D = C ( x , y , z ) · T ( x , y , z )
Among them,
C = 3 × f ( x ) g ( y ) h ( z ) f ( x ) + g ( y ) + h ( z ) 3 1 / 3
T = θ f ( x ) + β g ( y ) + γ h ( z )
In the formula, D is the coupling coordinated development degree, D ∈ [0, 1]; C is the degree of coordination, reflecting the synergy level of interaction between systems; and T is the degree of development, reflecting the comprehensive development level of the 3E system. x, y, and z, respectively, represent the economic subsystem, energy subsystem, and environment subsystem; θ, β, and γ are the weights to be determined for economic, energy, and environmental systems, respectively, with θ + β + γ = 1. In order to maintain the robustness of the results, this paper uses the factor analysis weighting method to verify the rationality of the weights given in this paper. The weighted results of factor analysis show that the weights of the economy, energy, and environment subsystems are 0.3628, 0.3227, and 0.3145, respectively, which are basically consistent with the weighted results in this paper and can ensure the robustness of the results. f(x), g(y), and h(z) are the comprehensive scores of each subsystem to measure the development level and status of each subsystem. The calculation formula is:
f ( x ) = i = 1 3 w i x i
g ( y ) = j = 1 6 w j y j
h ( z ) = k = 1 3 w k z k
x i , y j , and z k represent the values of the economic, energy, and environmental system indicators, respectively, after linear proportional transformation and standardization, and they are calculated using the extreme value method. w i , w j , and w k are the weights assigned to each indicator using the entropy method. Taking the calculation of x i and wi as an example, the method is described below [39]. The calculations of y j , z k , w j , and w k are similar to those of x i and w i , where j = 1–6 and k = 1–3.
The standardization of indicators is as follows:
x i = x i λ min λ max λ min ,   λ min x i λ max ,   x i   is   p o s i t i v e   ( i = 1 3 ) λ max x i λ max λ min ,   λ min x i λ max ,   x i   is   n e g a t i v e   ( i = 1 3 )
We determine the proportion of indicators:
X i = x i i = 1 3 x i
We calculate the entropy value of the i-th index, where k > 0 and k = ln(i):
e i = k i = 1 3 X i ln ( X i )
We calculate the information utility value of the i-th index:
u i   =   1     e i
We calculate the weight of each index:
w i = u i i = 1 3 u i

2.4. Data Sources and Processing

The data sources include national, Guangdong provincial, and Guangzhou municipal statistical yearbooks, government plans, and other public documents or statistical materials. Some data are sourced from first-hand research conducted by relevant government departments and enterprises in Guangzhou. The study primarily uses the LEAP model, HOMER software, and Statistical Product and Service Software Automatically (SPSSAU 2024)

3. Results

3.1. Analysis of the Historical Patterns and Future Trends of the “Energy Impossibility Triangle”

(1)
Safety characteristic analysis
From the perspective of local power generation (Figure 2), the local generation capacity of Guangzhou City showed a year-by-year decline from 2010 to 2015. However, due to increasing power consumption, the power self-sufficiency rate showed a significant downward trend (Figure 3). From 2015 to 2019, with the addition of gas power and renewable energy installations, the local generation capacity showed an upward trend. However, due to the rapid growth in power demand, the power self-sufficiency rate still showed a downward trend. Since 2020, the self-sufficiency rate of electricity has begun to rise slowly, and the security of power supply has improved. Under the four scenarios, scenarios BAU and S1 are relatively low in this aspect, especially S1, where new energy installations have replaced part of thermal power, leading to a decline in generation capacity after 2028. Scenario S3 has the highest generation capacity, reaching 697 billion kWh in 2030, with the highest power self-sufficiency rate of 44.51%. This is the only scenario among the four where the power self-sufficiency rate continues to rise. In the other scenarios, the power self-sufficiency rate begins to decline slowly from 2027. Due to the much faster growth rate of power demand than local power production, the demand for purchased power has shown an increasing trend since 2010 (Figure 4), with scenario S3 having the lowest demand for purchased power. It is evident that scenario S3 is the most secure option.
(2)
Cleanliness characteristic analysis
Looking at the proportion of local clean and renewable energy generation, the proportion of clean energy generation in Guangzhou’s total local power generation increases year by year from 2010 to 2028 (Figure 4). In 2028, under Scenario S2, this proportion reaches its highest at 68.34%, indicating a continuous improvement in the cleanliness of Guangzhou’s power generation structure. From 2028 to 2030, the proportion of clean energy remains largely stable. In terms of local renewable energy supply, the proportion of renewable energy generation increases year by year from 2010 to 2020. However, after 2020, except for a slight increase in the proportion of renewable energy supply under Scenario S2, the proportions in other scenarios show a slow downward trend, hovering around 10%.
In terms of carbon emissions, since the study optimizes for the lowest cost, none of the four scenarios show a significant peak in carbon emissions. From 2010 to 2022, carbon emissions increase year by year. From 2023 to 2030, the carbon emissions in the BAU, S2, and S3 scenarios show a rising trend year by year, with no signs of peaking. The S1 scenario has the lowest carbon emissions and reaches a peak in 2025, but then it experiences a rebound (Figure 5). Under this scenario, it is necessary to introduce end-of-pipe measures such as carbon capture, storage, and utilization (CCS or CCUS) and ultra-low emissions for coal and gas power to ensure that Guangzhou can achieve a carbon peak by 2030. Looking at the average carbon emissions per kilowatt-hour (Figure 5), the carbon emissions per kilowatt-hour in all four scenarios decrease year by year, with the S1 scenario showing the fastest decline, indicating that the local power generation structure in scenario S1 is the cleanest.
(3)
Economic characteristics analysis
The total cost of power generation investment under the four scenarios increases year by year (Figure 6a), among which the BAU scenario has the highest investment cost and the S1 scenario has the lowest economic advantage. Especially in the Fifteenth Five-Year Plan period, the economic advantage of the S1 scenario is more obvious, and the gap with BAU cost increases year by year. The main reason for the gap is that a high proportion of photovoltaic installed capacity replaces the operation of other types of generator sets, which reduces the overall fuel cost (Figure 6b,c). With the continuous progress of renewable energy development technology, the power generation cost of renewable energy with zero fuel cost represented by solar energy decreases year by year, and the gap with fossil fuel power generation cost becomes smaller and smaller. Renewable energy power generation becomes the default economic option to increase power capacity. Thus, the S1 scenario is not only the cleanest scenario, but also the most economical scenario. In the future, renewable energy generation will significantly weaken the competitiveness of fossil fuels, which is exactly the development trend we most hope to see in the process of building a new power system.

3.2. Analysis of the History and Future Trends of the Coordinated Development of 3E Systems

From 2010 to 2030, the comprehensive score f(x) of Guangzhou’s economic subsystem continues to rise (see Figure 7), indicating that the economic development of Guangzhou is steadily improving. On the whole, the comprehensive score g(y) of the energy subsystem shows a trend of first decreasing and then increasing, while the comprehensive score h(z) of the environmental subsystem shows a trend of first increasing and then decreasing. The trend lines of the comprehensive development level of the three subsystems meet, forming two significant stages:
  • Stage 1: Continuous improvement stage of environmental system (2010–2020)
From 2010 to 2020, the comprehensive development level of environmental subsystems fluctuated and rose, with h(z) > g(y) > f(x) at this stage. Among them, from 2010 to 2015, Guangzhou’s economy developed rapidly, the industrial structure was optimized and upgraded, the proportion of the secondary industry decreased, the proportion of the tertiary industry increased, and the comprehensive development level of economic subsystems continued to rise. At this stage, the energy demand was also rising steadily. However, due to the slow progress of renewable energy development and insufficient energy production capacity in Guangzhou, the local power generation continued to decrease, and the self-sufficiency rate of power decreased, and the comprehensive development level of energy subsystems decreased accordingly. From 2015 to 2020, with the improvement in energy utilization efficiency and local power production capacity, the comprehensive development level of energy subsystems was significantly improved.
  • Stage 2: The stage of environmental system decline (2021–2030)
From 2021, the comprehensive development level of the environmental subsystem begins to decline, especially after 2022, due to the economic recovery after the epidemic and the surge in demand for energy; the comprehensive development level of economic and energy subsystems continues to rise in the four scenarios, while the comprehensive development level of environmental subsystems declines to varying degrees. Among them, in the S1 scenario, the decline speed of the environmental subsystem is the slowest, and the comprehensive development level of the economic and energy subsystems exceeds that of the environmental subsystem in 2026 and 2028, respectively. In the S2 scenario, the comprehensive development level of the environmental subsystem decreases the fastest, and the comprehensive development level of the economic and energy subsystems will surpass that of the environmental subsystem in 2023.
From the perspective of the development of 3E system coupling and coordination (see Figure 8), the development degree of 3E system coupling and coordination was on the rise from 2010 to 2020, which shows that the development state of Guangzhou coupling and coordination was constantly improving. In 2020–2022, affected by the epidemic situation with COVID-19, economic development was severely limited, and the degree of coupled and coordinated development of 3E system decreased significantly. From 2023, the degree of coupled and coordinated development in Scenario S1 shows a continuous upward trend after reaching its lowest point in 2024. By 2030, the coupling coordination development degree of this scenario rises to 0.724, reaching the intermediate coordination level. The development degree of coupling and coordination of other scenarios declines continuously. By 2030, the development degrees of coupling and coordination of the BAU, S2, and S3 scenarios will drop to 0.55, 0.60 and 0.46, respectively, which are in a state of reluctant coordination, primary coordination, and on the verge of imbalance. Therefore, the S1 scenario is the most consistent with the “high-quality” development of China.

4. Discussion

From 2022 to 2030, under the BAU and S3 scenarios, the coordination and coupled development degrees between the security, cleanliness, and economy of the power system show a fluctuating downward trend (see Figure 9). This indicates that the balance of “Energy Impossibility Triangle” of the power system gradually deteriorates under these scenarios. As a result, the coupled and coordinated development level of the 3E system under both scenarios also shows a downward trend (see Figure 8 above). The decline in the comprehensive development level of the environmental system is the main driving force behind the decrease in the coupled and coordinated development level of the 3E system (see Figure 7 above). At this point, although the interlinkage within the “Dual Triangle” is relatively close, it is not what we hope to see, and we refer to it as “malignant coupling”.
Under the S1 scenario, the installed capacity of electric power is compared with the latest report “Statistical Report on Installed Capacity of Renewable Energy in 2023” issued by IRENA: “If we want to keep the global warming at 1.5 °C, by 2030, the annual installed capacity of renewable energy must be tripled”. According to the endowment potential of renewable energy in Guangzhou and the current development situation, Guangzhou still has great installed potential in solar energy. Therefore, in this scenario, the installed capacity of solar photovoltaic will be tripled on the basis of 2022, that is, it needs to reach 4 million kW in 2030. Because renewable energy replaces fossil energy, clean energy accounts for a relatively high proportion, which makes the total power generation smaller. At the same time, massive access to renewable energy also brings great challenges to the security and stability of the power grid. Therefore, the security of the energy system in this scenario is significantly lower than that in other scenarios. However, with the progress of renewable energy power generation technology and the improvement in efficiency, renewable energy power generation has broken through the cost bottleneck and has more and more economic advantages. Therefore, in this scenario, the economy and cleanliness of the whole energy system are high, and the relationship between the economic system and environmental system is becoming closer and closer, and the coupling and coordinated development degree of the 3E system is gradually improved. The coupling and coordination relationship within the “Dual Triangle” is the closest, representing “benign coupling” that aligns with China’s high-quality development requirements. The power transition path under this scenario can be considered the optimal choice for the reconstruction of the energy system.
In scenario S2, considering the economic recovery needs after the end of the COVID-19 pandemic, as well as the characteristics of Guangzhou’s power development and the constraints of the carbon peak target, the government adopts a phased development approach, with different focuses at each stage. From 2022 to 2025, the economic recovery increases the demand for energy, shifting the focus of energy system development towards safety. During this phase, the increase in power installation and generation capacity is mainly driven by clean natural gas power, ensuring the cleanliness of the energy and power system. The balance between the safety, cleanliness, and economy of the energy system is relatively stable, and although the coupled and coordinated development level of the 3E system shows a slow downward trend, the overall impact is minimal. After 2026, the development in the energy sector focuses primarily on carbon peak and carbon reduction targets, with no new coal or natural gas power installations. The incremental generation is mainly from renewable sources, which reduces overall fuel costs and enhances the economic viability of the power system. However, this also significantly lowers the system’s safety. At this stage, the balance between high cleanliness, high economy, and low safety is disrupted, leading to a significant decrease in the coupled and coordinated development level of the 3E system. This demonstrates that phased development with clear focuses can exacerbate the breaking of the balance in the “Energy Impossibility Triangle”.

5. Conclusions

Addressing the question of how the restructuring of the energy and power system affects the coupled and coordinated development of the 3E system, this study constructs a “Dual Triangle” theoretical framework. It analyzes the historical characteristics and future trends of the “Dual Triangle,” and it studies the coupled interaction relationship within it to explore the optimal transformation path of the power system that is most conducive to the coupled and coordinated development of the 3E system. The conclusions are as follows:
(1)
From the perspective of historical development patterns, from 2010 to 2022, the local electricity production in Guangzhou initially decreased and then increased. With the rapid development of the economy, the demand for electricity increased rapidly, leading to a year-by-year decrease in the self-sufficiency rate of electricity and an increase in the dependence on purchased electricity, which endangers energy security. However, with the proposal of targets for climate change response and energy conservation and emission reduction, the proportion of clean energy power generation increased year by year, the growth rate of power carbon emissions slowed down, and progress was made towards the goal of carbon peak. The level of coordinated development of the 3E system fluctuated upwards, and the operation status of the “Dual Triangle” was stable.
(2)
Looking at future development trends, from 2023 to 2030, under the BAU and S3 scenarios, the development levels of the “Dual Triangle” show a downward trend. Although the coupling relationship within the “Dual Triangle” is relatively close, it is not what we hope to see, which is considered “malignant coupling”. Under scenario S1, the development levels of the “Dual Triangle” show an upward trend, and the positive coupling relationship between them is close, which is considered “benign coupling”. Although the contradiction of the impossible triangle has always existed, the comprehensive development level of the sustainable development triangle in Guangzhou has been continuously improving since 2010. If this coordinated relationship is to be maintained in the future, a power transformation will need to develop along the path of scenario S1. Under scenario S2, due to the clear focus of phased development, it is the closest to the historical development characteristics of our country. Although this development model may exacerbate the breaking of the balance of the “Energy Impossibility Triangle”, it is an effective development model for dynamically mitigating the challenges of the “Energy Impossibility Triangle “.
(3)
In summary, the “Dual Triangle” is interrelated and mutually influential. A benign coupling within it can jointly promote society towards a more sustainable and balanced direction. Due to the progress of power generation technology and the reduction in the cost of clean energy generation brought about by economies of scale, the contradiction between economy and cleanliness is continuously weakened, and security becomes the core contradiction of the “Energy Impossibility Triangle”. Vigorously developing renewable energy and equipping it with energy storage is the key to resolving this contradiction. This can promote the “Dual Triangle” to achieve coordination at a higher level, thereby achieving high-quality development in energy and supporting the high-quality development of the economy.

Author Contributions

H.C. and W.W. contributed equally to this work. H.C.: data curation, methodology. W.W.: conceptualization, writing—original draft, visualization, validation. L.C.: data curation. W.H.: methodology. Z.G.: validation. J.L.: data curation. G.C. validation. All authors have read and agreed to the published version of the manuscript.

Funding

This research is funded by the Guangdong Power Grid Co., Ltd., power science and technology project (GZHKJXM20210044 (080005KK52210024)).

Data Availability Statement

The data presented in this study are available on request from the corresponding author.

Conflicts of Interest

Author Haifeng Cen, Liping Chen and Zhe Guan were employed by the Guangdong Power Grid Co., Ltd. The authors declare that this study received funding from Guangdong Power Grid Co., Ltd.. The funder was not involved in the study design, collection, analysis, interpretation of data, the writing of this article or the decision to submit it for publication. The remaining authors declare that the research was conducted in the absence of any commercial or financial relationships that could be construed as a potential conflict of interest.

References

  1. World Commission on Environment and Development. Our Common Future; Oxford University Press: Oxford, UK, 1987. [Google Scholar]
  2. Lu, G.; Xu, S.Z.; Wang, P. Strategic Thinking of the Path for Electric Power Carbon Peak and Carbon Neutrality on Basis of Energy-Economy-Environment Relations. Pet. Sci. Technol. Forum 2020, 1, 57–62+107. [Google Scholar]
  3. Wang, C.Z.; Zhao, W.Y.; Fan, W.J. Cracking the Energy “Trilemma” in China-Dynamic QCA Analysis Based on Provincial Panel Data. J. Stat. 2023, 4, 46–63. [Google Scholar] [CrossRef]
  4. Qin, B.A.; Shan, B.G.; Li, Q.H.; Yan, H.; Wang, C.X. Rethinking of the “Three Elements of Energy” Toward Carbon Peak and Carbon Neutrality. Proc. CSEE 2022, 42, 3117–3126. [Google Scholar]
  5. O1iveira, C.; Antunes, C.H. A multiple objective model to deal with economy-energy-environment interactions. Eur. J. Oper. Res. 2004, 153, 370–385. [Google Scholar] [CrossRef]
  6. Oliveira, C.; Coelho, D.; Antunes, C.H. Coupling input–output analysis with multi-objective linear programming models for the study of economy–energy–environment–social (E3S) trade-offs: A review. Ann. Oper. Res. 2016, 247, 471–502. [Google Scholar] [CrossRef]
  7. Li, L.; Hong, X.F.; Wang, J.; Xie, X.L. Coupling and Coordinated Development of Economy Energy-Environment System Based on PLS-ESDA. Soft Sci. 2018, 32, 44–48. [Google Scholar]
  8. Yan, X.; Chen, M.; Chen, M.Y. Coupling and coordination development of Australian energy, economy, and ecological environment systems from 2007 to 2016. Sustainability 2019, 11, 6568. [Google Scholar] [CrossRef]
  9. Yu, Y.; Gong, X. Study on the coupling problem of coordinated development of economy–energy–environment–technology system in Northeast China). Energy Rep. 2022, 8, 305–312. [Google Scholar] [CrossRef]
  10. Zhang, X.G.; Zhang, M.Y.; Zhang, H.; Jiang, Z.G.; Liu, C.H.; Cai, W. A review on energy, environment and economic assessment in remanufacturing based on life cycle assessment method. J. Clean. Prod. 2020, 255, 120160. [Google Scholar] [CrossRef]
  11. Ye, W.J. Temporal and spatial characteristics of China’s provincial comprehensive coordinated development level. Tax. Econ. 2018, 6, 66–71. [Google Scholar]
  12. Wang, J.L.; Li, Y.W.; Yue, J.F. Research on the establishment of coordinated degree evaluation index system of energy-economy-environment (3E) system in Hebei province. Econ. Manag. 2012, 26, 36–37. [Google Scholar]
  13. Zuo, Y.; Shi, Y.L.; Zhang, Y.Z. Research on the sustainable development of an economic-energy-environment (3e) system based on system dynamics (sd): A case study of the Beijing-Tianjin-Hebei Region in China. Sustainability 2018, 9, 1727. [Google Scholar] [CrossRef]
  14. Li, W.W.; Yi, P.T. Assessment of city sustainability—Coupling coordinated development among economy, society and environment. J. Clean. Prod. 2020, 256, 120453. [Google Scholar] [CrossRef]
  15. Zhao, T.; Li, X.Y. On the coordinating evaluation model for energy-economy-environment system. J. Beijing Inst. Technol. (Soc. Sci. Ed.) 2008, 2, 11–15. [Google Scholar]
  16. Wei, Y.M.; Zeng, R.; Fan, Y.; Cai, X.T.; Xu, W.X.; Fu, X.F. A multi-objective goal programming model for Beijing’s coordination development of population, resources, environment and economy. Syst. Eng.-Theory Pract. 2002, 2, 74–83. [Google Scholar]
  17. Yu, Y.; Zhang, L.M.; Chen, C. Pattern evolution of the coordinated development of economy-energy environment-science and technology quaternary system in eastern China. Econ. Geogr. 2019, 39, 14–21. [Google Scholar]
  18. Yu, Y.; Chen, C. Evolution characteristics and improvement strategies of the coupling level of China’s economy-energy-environment-science quaternary system from a regional perspective. Inq. Into Econ. Issues 2018, 5, 139–144, 157. [Google Scholar]
  19. Yu, Y.; Chen, Y.J.; Gao, Y.D.; Yu, Z.Z.; Chen, F. Study on the coordinated development of economy-energy-environment science and technology-taking the provinces and cities along “The Belt and Road” as examples. Northeast. Asia Econ. Res. 2020, 2, 21–31. [Google Scholar]
  20. Chen, H.L.; Wang, Z.; Feng, C.L.; Luo, Y.Y. Investigation of the coupling of energy-economy-environment-technology in resource-based city: A case study of Panzhihua. Conserv. Util. Miner. Resour. 2018, 5, 94–100, 105. [Google Scholar]
  21. Bai, J.J. Study on the Coupling and Coordinated Development of Urban Energy, Economy, Environment and Social System in Chengdu-Chongqing Economic Circle. Master’s Thesis, Sichuan University, Chengdu, China, 2022. [Google Scholar] [CrossRef]
  22. Wang, L.Y.; Chen, H.; Chen, S.Y.; Wang, Y.K. Dynamic Evolution and Empirical Analysis of Coordinated and Coupling Development of Energy-Economy-Environment-Society at Urban Level—A Case Study of Jiangsu Province. J. Beijing Inst. Technol. (Soc. Sci. Ed.) 2022, 1, 51–64. [Google Scholar] [CrossRef]
  23. Sun, Q.Y.; Ren, Y.P.; Liu, Z.M.; Hu, X.G. Review of “Energy Impossibility Triangle” research of integrated energy system based on entropy theory. Control Decis. 2023, 38, 2106–2121. [Google Scholar] [CrossRef]
  24. Chen, G.; Zhong, F.Y.; Zhou, X.Y.; Ming, C.Q. Configuration and Path Identification of Driving Factors of Regional Innovation Based on fsQCA Analysis of 31 Provinces and Cities in China. Sci. Technol. Manag. Res. 2022, 42, 75–86. [Google Scholar]
  25. Liu, C.J.; Yang, Q.; Zhang, B.Y. Research on the Social Responsibility Performance of Carbon Neutral Energy Enterprises-Qualitative Comparative Analysis Based on FsQCA. Sci. Technol. Econ. 2022, 35, 6–10. [Google Scholar] [CrossRef]
  26. Zhang, Q.J.; Wang, X.X.; Liu, M.N. The Spatial Effect and Mechanism of Financial Opening on Energy Security-Empirical Analysis Based on Cross-country Data. J. Ind. Technol. Econ. 2023, 42, 139–150. [Google Scholar]
  27. Shirazi, M.; Fuinhas, J.A.; Silva, N. Sustainable economic development and geopolitics: The role of “Energy Impossibility Triangle” policies. Sustain. Dev. 2023, 31, 2471–2491. [Google Scholar] [CrossRef]
  28. Magazzino, C.; Mele, M.; Drago, C.; Kuşkaya, S.; Pozzi, C.; Monarca, U. The trilemma among CO2 emissions, energy use, and economic growth in Russia. Sci. Rep. 2023, 13, 10225. [Google Scholar] [CrossRef]
  29. Barazza, E.; Strachan, N. The co-evolution of climate policy and investments in electricity markets: Simulating agent dynamics in UK, German and Italian electricity sectors. Energy Res. Soc. Sci. 2020, 65, 101458. [Google Scholar] [CrossRef]
  30. Guangzhou Statistics Bureau, 2023 Statistical Yearbook of Guangzhou. 2023. Available online: https://tjj.gz.gov.cn/datav/admin/home/www_nj/ (accessed on 5 May 2024).
  31. Zhou, D.D. 2020 Sustainable Energy Scenario in China; China Environmental Science Press: Beijing, China, 2003; pp. 30–35. [Google Scholar]
  32. The People’s Government of Guangzhou. Guangzhou Energy Development “14th Five-Year Plan”. 2022. Available online: https://www.gz.gov.cn/zwgk/fggw/sfbgtwj/content/post_8585481.html (accessed on 26 April 2024).
  33. The People’s Government of Guangzhou. Guangzhou Carbon Peak Implementation Plan. 2023. Available online: http://www.gzns.gov.cn/gznslxj/gkmlpt/content/8/8996/post_8996686.html#12498 (accessed on 15 May 2024).
  34. IRENA. Renewable Capacity Statistics 2023. Available online: https://www.irena.org/Publications/2023/Mar/Renewable-capacity-statistics-2023 (accessed on 28 April 2024).
  35. Zheng, J.P. Study on carbon content per unit calorific value of coals in China. Coal Process. Compr. Util. 2022, 1, 58–62. [Google Scholar] [CrossRef]
  36. Zhang, B.K.; Li, Y.Y.; Zhang, X.; Wang, S.Y.; Zhou, L.; Lv, S. Carbon emission calculation and reduction effects of municipal solid waste incineration power generation project. Environ. Prot. Sci. 2022, 1, 75–81. [Google Scholar] [CrossRef]
  37. Lu, J.; Chang, H.; Wang, Y.B. Dynamic evolution of provincial energy economy and environment coupling in China’s regions. China Popul. Resour. Environ. 2017, 27, 60–68. [Google Scholar]
  38. Zhang, Y. Construction and demonstration of evaluation index system of coordination degree of energy-economy-environment system. Mod. Econ. Inf. 2019, 21, 20–21. [Google Scholar]
  39. Yang, L.; Sun, Z.C. The Development of western new type urbanization level evaluation based on entropy method. Econ. Probl. 2015, 3, 115–119. [Google Scholar]
Figure 1. “Dual Triangle” theoretical framework.
Energies 17 03468 g001
Figure 2. Trend of local power production under different scenarios.
Energies 17 03468 g002
Figure 3. Variation trend of power self-sufficiency rate under different scenarios.
Energies 17 03468 g003
Figure 4. Proportion of clean energy and renewable energy power generation.
Energies 17 03468 g004
Figure 5. Changing trends of carbon emissions and carbon emissions per kWh.
Energies 17 03468 g005
Figure 6. Trend of investment cost changes. (a) Total investment cost; (b) Replacement cost; (c) Fuel cost.
Energies 17 03468 g006
Figure 7. Comprehensive score of each subsystem of 3E system.
Energies 17 03468 g007
Figure 8. Trend of coupled and coordinated development degree of 3E system.
Energies 17 03468 g008
Figure 9. Coordination relationship diagram of “Energy Impossibility Triangle”.
Energies 17 03468 g009
Table 1. The characteristics and measurement indicators of the new power system on the supply side.
Measure IndexMeasure IndexIndex Selection Basis
Security (2)Self-sufficiency rate of power (+)The self-sufficiency rate of resources is an index used to measure the productivity of resources in a region, and it is also a key index used to characterize the safety of resource supply. Self-sufficiency rate of power = local power generation/power consumption of the whole society, focusing on measuring the actual supply capacity from the perspective of output.
Demand for purchased power (−)The demand for purchased power indicates the external dependence of power, and high external dependence will seriously affect energy security.
Cleanliness (3)Proportion of renewable energy generation (+)The proportion of renewable energy power generation to the total power generation. High proportion of renewable energy power generation is the basic requirement for the construction of new power system.
Proportion of clean energy power generation (+)The proportion of clean energy power generation, including natural gas, to the total power generation is an important indicator used to measure the cleanliness of power supply.
Carbon emissions (−)Carbon emission is one of the important indicators of whether the energy system is clean and low-carbon.
Economy (5)Initial investment cost (−)The cost required for the construction and installation of an electricity project is one of the important factors determining the total investment cost.
Replacement cost (−)The expenses incurred when replacing or updating existing electricity-related equipment, facilities, or systems.
Operational and maintenance costs (including the cost of purchased electricity, −)The various expenses generated during the operation and maintenance of the power system.
Fuel cost (−)The costs of various fuels used for power generation.
Residual value of equipment (+)The residual value of the equipment at the end of the project lifecycle, which is better when higher.
Note: “+” represents positive index; “−” represents negative index.
Table 2. Forecast results of power demand.
202220232024202520262027202820292030
Power demand (billion kWh)115.5121.0127.7133.5136.9142.0146.7151.0156.5
Table 3. Description of scenario parameters.
ScenariosScenario DescriptionParameter Setting
Business as Usual (BAU)All power supply indicators remain at the level of 2022.Installed capacity: put into production in strict accordance with Guangzhou planning [32,33].
Energy consumption for power generation: both will maintain the level of 2022.
Electricity generation utilization hours: all of them maintain the level of 2022.
Investment cost: all of them are maintained at the level of 2022.
Vigorously promoting renewable energy scenario (S1) Vigorously promote the installation of renewable energy; improve the power generation time of gas, power, and biomass units; reduce the energy consumption of coal and gas power generation. According to the demand of economic recovery after the epidemic, the power generation time of coal power units is set to increase before 2025 and decrease year by year in 2026.Installed capacity: According to the “Renewable Energy Capacity Statistics 2023” report released by the International Renewable Energy Agency (IRENA) [34], “to stay on track to limit global warming to 1.5 °C, the annual increase in renewable energy installation capacity must triple by 2030”. Based on Guangzhou’s renewable energy potential and the current development situation, the solar photovoltaic installation capacity will be increased to 3.99 million kW, and wind power will add 0.160 million kW of installation capacity in 2025, replacing coal and gas power with equal capacity.
Energy consumption for power generation: The coal power unit consumption will be increased to the national benchmark and average benchmark level in 2025 and 2030, respectively. The gas power unit consumption will decrease to 217 gce/kWh in 2025 and to 210 gce/kWh in 2030.
Electricity generation utilization hours: According to the characteristics of each type of power generation and the constraints of relevant policies, a mandatory power generation time period is given for each type of power generation (see Table 4). The actual hours of power generation will be optimized through the HOMER software (x64 3.14.2).
Investment cost: set according to Table 5.
Security and low-carbon phased development scenario (S2)During the Fourteenth Five-Year Plan period, the primary goal is to ensure power supply safety, while during the Fifteenth Five-Year Plan period, energy conservation and carbon reduction are the main considerations.Installed capacity: In 2025, we plan to achieve the government’s planned natural gas power installation capacity for 2028 under the baseline scenario, which is 12.7419 million kW. We plan to complete all planned natural gas power installation capacity for 2030, which is 14.15 million kW, before 2027. The planned installation of renewable energy will be postponed and concentrated for completion in the Fifteenth Five-Year Plan, with the main new installation being photovoltaic power generation.
Generation energy consumption: the same as in Scenario S1.
Electricity generation utilization hours: the same as in Scenario S1.
Investment costs: the same as in Scenario S1.
Double high self-sufficiency rate scenario (S3)Taking thermal power as the main power supply as the development goal, the power generation duration and energy consumption of various units are the same as in the S2 scenario.Installed capacity: Currently, China has very strict regulations on the approval of coal-fired power. Whether Guangzhou can newly commission coal-fired power requires thorough justification. We assume that after efforts expended during the Fourteenth Five-Year Plan, the additional installation capacity of coal-fired power is 10% of the current installed capacity, with the new capacity to be completed and put into operation after 2025. The remaining production capacity will be supplemented by natural gas power.
Generation energy consumption: the same as in Scenario S1.
Electricity generation utilization hours: the same as in Scenario S1.
Investment costs: the same as in Scenario S1.
Table 4. The mandatory and optimization time periods for each type of power generation.
Power Generation CategoryMandatory Generation TimeSystem Optimization Time
Coal powerDoes not generate electricity from 11 p.m. to 5 a.m.Other time periods
Natural gas power10 a.m. to 9 p.m.Other time periods
Biomass9 a.m. to 2 p.m. and 3 p.m. to 9 p.m.Other time periods
Photovoltaic//
Wind power//
Hydropower12 a.m. to 12 p.m./
Other7 a.m. to 9 p.m.Other time periods
Table 5. Scenario parameter settings.
202220232024202520262027202820292030
Coal power consumption/(g/kWh)454451448445442439435432429
Energy consumption of gas and power (m3/kWh)185182179176176175174174173
Biomass energy consumption per kWh (g/kWh)182818281828182818281828182818281828
Photovoltaic investment cost (CNY /kW)450044104322423641514068398739073829
Table 6. Average carbon emission factors for electricity in Guangdong province.
202220232024202520262027202820292030
Average carbon emission factor (gCO2/kWh)373365358350340330320310300
Table 7. System index of 3E system.
3E System Index
Economic subsystem (3)Gross GDP (+)
Per capita GDP (+)
Proportion of tertiary industry (+)
Energy subsystem (6)Total energy consumption (−)
Power production (+)
Self-sufficiency rate of power (+)
Demand for purchased power (−)
Proportion of clean energy power generation (+)
Proportion of renewable energy power generation (+)
Environment subsystem (3)PM2.5 (−)
Carbon emissions (−)
Comprehensive utilization rate of general industrial solid waste (+)
Note: “+” represents positive index; “−” represents negative index.
Disclaimer/Publisher’s Note: The statements, opinions and data contained in all publications are solely those of the individual author(s) and contributor(s) and not of MDPI and/or the editor(s). MDPI and/or the editor(s) disclaim responsibility for any injury to people or property resulting from any ideas, methods, instructions or products referred to in the content.

