Article

A Design Tool for Battery/Supercapacitor Hybrid Energy Storage Systems Based on the Physical–Electrochemical Degradation Battery Model BaSiS

1
Energy Process Engineering Department, Fraunhofer IEE, 34117 Kassel, Germany
2
Faculty of Supply Engineering, Ostfalia University of Applied Sciences, 38302 Wolfenbüttel, Germany
*
Author to whom correspondence should be addressed.
Energies 2024, 17(14), 3481; https://doi.org/10.3390/en17143481
Submission received: 11 June 2024 / Revised: 10 July 2024 / Accepted: 10 July 2024 / Published: 15 July 2024
(This article belongs to the Section D: Energy Storage and Application)

Abstract

:
A design toolbox has been developed for hybrid energy storage systems (HESSs) that employ both batteries and supercapacitors, primarily focusing on optimizing the system sizing/cost and mitigating battery aging. The toolbox incorporates the BaSiS model, a non-empirical physical–electrochemical degradation model for lithium-ion batteries that enables accurate simulations of battery performance and degradation under realistic operating conditions. The paper presents a detailed description of the parameterization, and validation process for the battery model, emphasizing the high accuracy and strong reliability of the battery aging prediction. The HESS design toolbox can be used to investigate the impact of various battery/supercapacitor configurations and energy management algorithms on the design, battery degradation, and system investment cost of the hybrid storage system. To illustrate the effectiveness of the design toolbox, a case study on Dynamic Moderation frequency support in the UK grid was conducted. For this use case, the application of hybrid storage energy systems is well suited due to the highly dynamic power regulation requirements in island grids with low inertia. By utilizing the fast response of supercapacitors, the stress on the battery caused by short-term high-power peaks can be significantly alleviated. In this way, the hybrid storage system effectively reduces either the battery size or the battery aging rate. In summary, this research highlights the crucial role of a comprehensive analysis in the design of hybrid energy storage systems, addressing both battery aging and overall system costs. The design toolbox can provide transparency regarding the design space and assist in determining the most suitable HESS configuration for a given application.

1. Introduction

1.1. Application of HESS for Grid Frequency Support

The stable operation of power grids has become more challenging in recent years, due to the considerable penetration of renewable energy (RE) applications. Renewable energy sources, such as wind, solar, and wave, are inherently volatile and unpredictable in nature. Eventually, fluctuating power weakens the stability of the grid, resulting in large frequency deviations within the grid [1]. Battery Energy Storage Systems (BESSs) have been deployed to support grid stability, mostly in two ways: as standalone renewable power systems and grid-connected [2,3]. In the case of standalone renewable power systems, the BESS is combined with a standalone renewable power device to facilitate power smoothing, peak-shaving, and optimal power management [1,2,4]. Alternatively, a grid-connected BESS can support the grid directly by means of frequency and voltage regulation or during grid faults [3]. In continental Europe, BESSs connected directly to the grid are typically utilized for the primary regulation (PR) of frequency, requiring only moderate response times [5]. Classically, the short-term frequency stability of power grids is ensured by the rotating masses assigned with the synchronous generators of conventional power plants. In grid situations with a high penetration of renewable energies, however, the amount of inertia provided by rotating masses may be low, especially in island grids such as the grid in the UK. To maintain short-term frequency stability, highly dynamic grid frequency support may be required. New dynamic frequency services are currently established by transmission system operators (TSOs) such as Dynamic Regulation (DR), and Dynamic Containment (DC) in the UK [6]. While the new requirements for fast-response and short-duration high-power peaks can be achieved by conventional BESSs in principle, they may lead to unfavorable dimensioning in terms of power-to-energy ratio and the deteriorated degradation rates of batteries.
In such application scenarios with short-term high-power requirements, it is well-known that combining batteries with supercapacitors (SCs) is beneficial for mitigating the stress on the battery caused by power peaks. As a result, SCs may significantly extend the lifetime of batteries and reduce the required battery capacity. However, since the combination of batteries with SCs also adds costs and system complexity, lowering the overall system costs over the lifetime (Total Cost of Ownership) requires a systematic design approach. The tools needed for system design and operational optimization, considering the influence of operating parameters on battery aging, have been lacking in some cases [2,7,8,9].

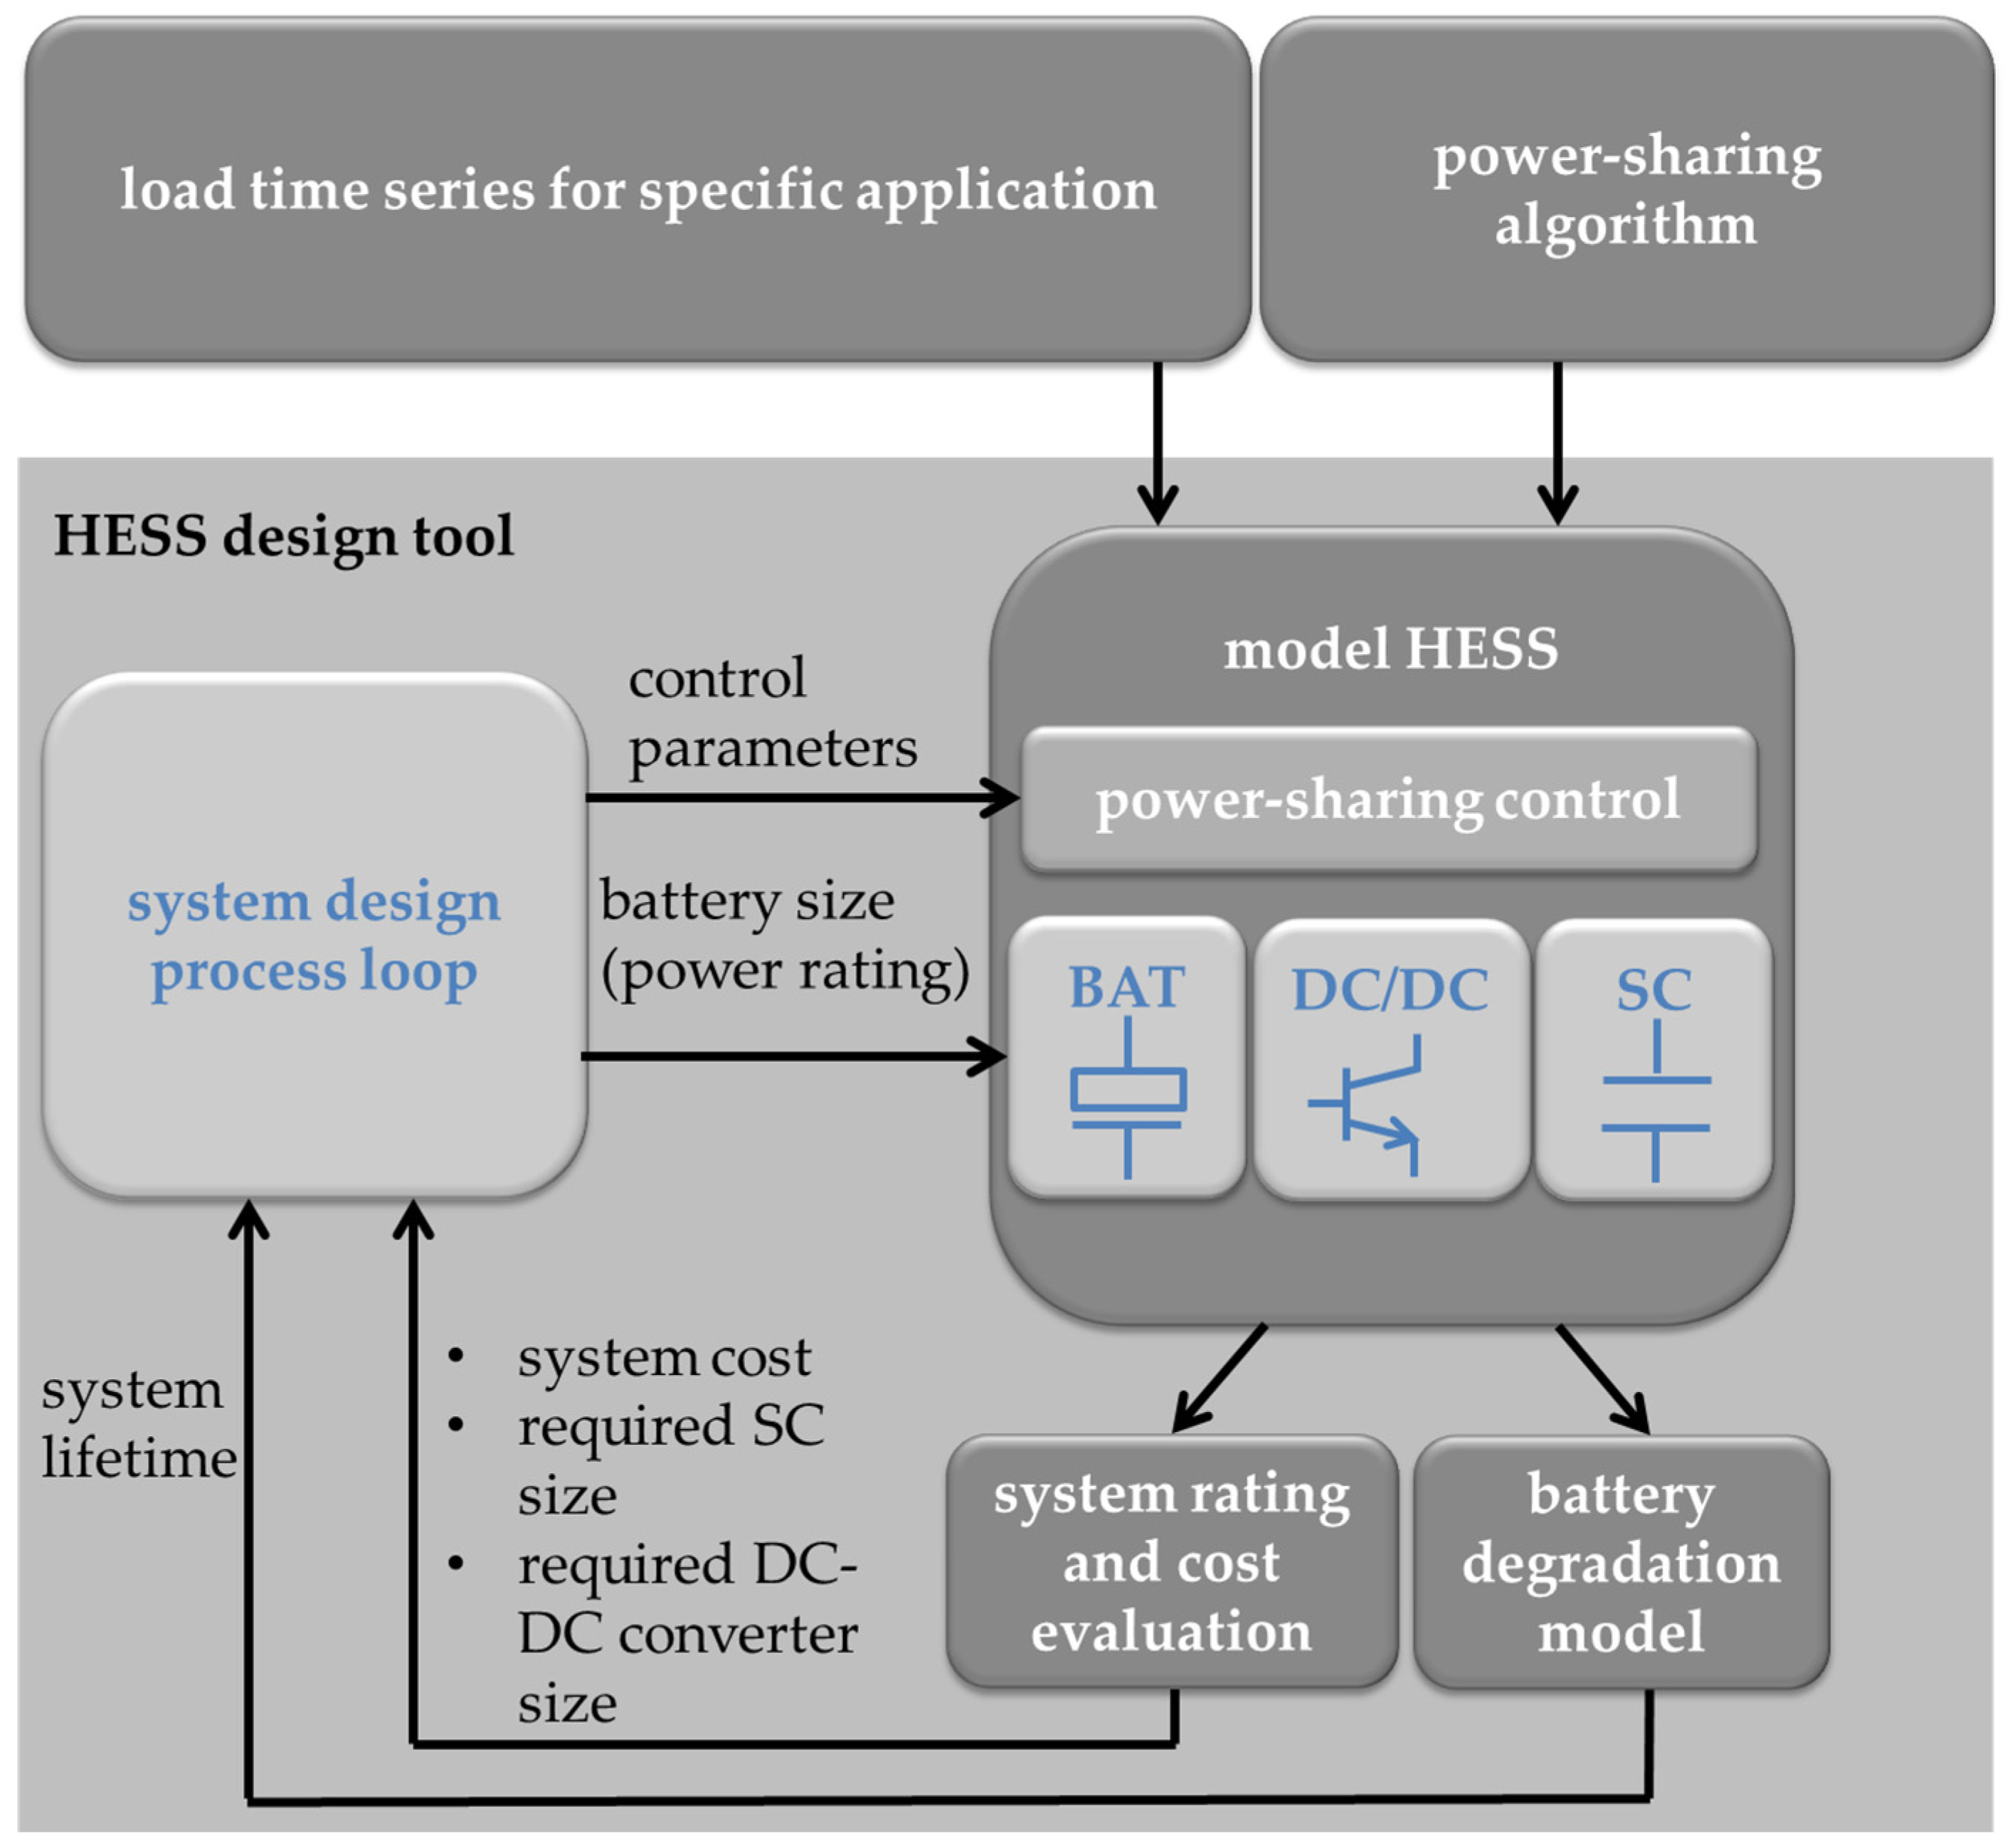
1.2. Concept and Structure of Design Tool

The goal of this study was to develop an effective design tool that allows the investigation of different battery/SC design configurations, control algorithms, and custom use cases for hybrid storage systems. This tool is intended to be used to analyze high-performance applications, determine a suitable system capacity, and optimize for both battery degradation and system economics.
The structure of the design tool is shown schematically in Figure 1. The critical element is the model of the hybrid storage system, comprising a battery (BATT), supercapacitor (SC), and the required power electronics (e.g., DC-DC converter). The model uses the power time series of the given load profile as input and allows the calculation of the time series for all internal quantities of the HESS that are relevant for component design (e.g., cell voltages, currents, and State of Charge ( S O C )).
From the internal time series, the required ratings of the SC and DC-DC converter can be deduced, and the total system costs are estimated. In addition, the degradation and lifetime of the battery module are estimated in terms of State of Health ( S O H ), which is defined as the ratio of the present capacity to the capacity of a new battery. To simulate degradation, the rating of the battery module must be defined in advance for each simulation. In an iterative process, however, in the system design loop, the ratings can be modified between individual simulations. Similarly, the power-sharing algorithms and controller structure can be pre-defined for the HESS model. For a degree of freedom, tunable controller parameters that define the amount of power and energy taken by the SC modules are systematically varied during the system design process. Based on the system rating, investment cost, and lifetime, the optimum system design can be selected for a given application.
As part of the design tool, the battery model is an essential component to predict the degradation of the battery corresponding to the different configurations of the HESS. The key novelty of this paper is the adoption of a validated physical–electrochemical (PEC) degradation model within a tool for optimizing the design of the HESS, which can answer quantitative questions such as the following:
  • How much impact does an additional SC module of a given size have on the battery lifetime?
  • By how much can the battery size in the HESS be reduced, to achieve a pre-defined lifetime?
Typically, only qualitative statements are given in the available literature, e.g., Sahin et al. [10]. In some cases, less detailed empirical degradation models are used to analyze the lifetime of a HESS, e.g., [7,8,9]. These models are often referred to as empirical models [11,12], which can only offer estimations of the capacity loss but are unable to describe the degradation of electrical performance as the battery ages. The accuracy of these models depends on the number of degradation test datasets used, which must cover all conditions that should be prescribed by the model.
  • In comparison, the general advantages of PEC degradation models are the following:
  • The parameters to be determined in PEC models are properties of physical and electrochemical equations that express the internal aging processes in the battery cells (e.g., the growth of the SEI layer, evolution of cracks, etc.). Once the parameters have been determined, the model can extrapolate the battery performance and degradation to any temperatures, S O C values, and current profiles. A comprehensive comparison with the cyclic testing results is usually conducted only for validation purposes in the final step.
  • Different aspects of aging are considered in PEC models, which cause the loss of capacity and an increase in impedance. These aspects include passivation and the decrease of active surfaces, the increase of internal resistance, the growth of the SEI layer, loss of active lithium ions (Li-ions), and loss of active material, etc. As a result of battery aging, changes in other electrical characteristics critical to practical applications can also be examined, such as capacity, voltage profile, power profile, charging/discharging efficiency, and heat production, etc. Additionally, the PEC model can provide insights into the individual contributions of the different mechanisms to the aging process.
A detailed review of battery aging modeling in the context of grid-connected storage systems is explored, for example, by Hesse et al. [3].

2. Evaluation of Battery Degradation with Detailed Physical–Electrochemical (PEC) Model

A non-empirical PEC model, the Battery Simulation Studio (BaSiS) developed by Fraunhofer IEE, has been applied in this investigation. The BaSiS software 2024 is a platform designed to simulate the behavior of electrochemical energy storage devices. Currently, there are models for lead–acid, Li-ion, and Li-metal batteries, electrolyzes, and supercapacitors (SCs) available within the BaSiS framework. It provides a very high accuracy across the whole operating range of simulated devices, ensuring that all other computations in the design tool based on this model have highly reliable data. The BaSiS Li-ion batteries (LIB) model, with its degradation prediction, is applied as a major component in the design toolbox in this research.
A commercial LIB used in the HESS has been investigated in the laboratory to parametrize its performance and aging behavior for the BaSiS model. In Section 2.1, a brief description of the BaSiS LIB model is presented. The specific measurements, parametrizations, and model validations are discussed in Section 2.2.

2.1. Description of the Physical–Electrochemical Battery Model

Different from the widely used ECM approach, physical–electrochemical models offer a significantly higher precision in characterizing the performance and degradation of batteries [3]. They accurately depict the inner reactions of batteries and provide insights into internal mechanisms and electrochemical processes. The BaSiS models are based on Newman’s approach [13,14,15] for electrochemical systems, employing a pseudo two-dimensional layout. This implies that all relevant processes are assumed to be homogeneous over the entire cross-section of the cells, and only variations perpendicular to it are considered. The diffusion within the active material areas is calculated in an additional pseudo second dimension.
Both dimensions are coupled by the conservation of mass and charge at the interfaces between the electrolyte and active material particles, to accurately reproduce the dynamics of the respective systems. The BaSiS models also incorporate temperature variations resulting from entropy changes, power dissipation, and heat exchange with the environment, and their effects on all relevant physical and electrochemical processes. The surrounding framework includes numerical solvers that have been specifically developed and tailored for the models, ensuring precise results and an efficient execution. Furthermore, it comprises additional modules for the modeling of electrical networks of cells and thermal interactions in packs, accommodating various geometries and different sizes, as well as active heating or cooling. Interfaces for different environments such as MATLAB and Python, along with a graphical user interface, are also provided.
Newman and Doyle established PEC models to express mass transfer, diffusion, migration, and reaction kinetics, based on porous electrode theory, Ohm’s law, and Fick’s law, as well as charge and material balances [16]. The battery’s main components in this model include the negative electrode, the separator, the positive electrode, and the electrolyte. The active insertion material is modeled as spherical particles. According to concentrated solution theory [14], the key expressions in PEC models can simulate the transportation properties of Li-ions in the electrodes, the separator, and the electrolyte, which are coupled by Butler–Volmer kinetics [15].
The concentration of Li-ions in the electrolyte is described by diffusion equations, as follows [13]:
ε c e t = x D e c e x + a j n ( 1 t e )
where c e is the concentration of Li-ions, D e is the diffusion coefficient, j n is the pore wall flux of Li-ions, t e is the transference number of the cation, ε is the porosity, a is the interfacial area per volume, and x is the distance.
Based on Fick’s law, the concentration of the lithium in the solid phase can be modeled by the following equation [14]:
c s t = D s 2 c s r 2 + 2 r c s r
The boundary conditions are defined as follows:
c s r r = 0 = 0 ,   c s r r = R s = j n D s
and
c s t = 0 = c s , 0
where c s is the concentration of Li in the solid phase, D s is the diffusion coefficient, and R s is the radius of the solid-phase particle. The BaSiS LIB model also includes the option of planar particle symmetry, particularly in cases where there is a strong predominant diffusion in one direction due to material properties or morphology.
The pore wall flux j n expresses the insertion process into the porous electrode. It can be described by the Butler–Volmer equation as follows:
j n = i 0 F exp α a F R T η exp α c F R T η
where η is the overpotential, R is the gas constant, T is the temperature, F is Faraday’s constant, and i 0 is the exchange current density of the electrode reaction.
According to Ohm’s law, the current density in the solid phase is expressed in accordance with [15]:
i s = i + σ Φ e x
where i represents the superficial current density and σ denotes the electronic conductivity of the solid matrix.
The concentrations of Li and Li-ions in the solid and in the electrolyte phase can be calculated based on the chemical inner reactions, as well as cell aging processes. The degradation of a battery is an irreversible process that leads to noticeable capacity fade and an increase in internal resistance during application. Commonly, calendric aging and cyclic aging effects are distinguished. Calendric aging refers to degradation over time without load, while cyclic aging denotes the impact of charging–discharging cycles. The cell aging results from inner cell changes such as the growth of a solid electrolyte interphase (SEI), the chemical decomposition of components, loss of available lithium, changes in active material, and so on [16,17,18], during rest and cyclic application. The rate of calendric aging is influenced by factors such as cell temperature and S O C . The cyclic aging effects of LIBs are influenced by factors such as the temperature and current profile, as well as the S O C window used.
In the case of LIBs, a module for simulating calendric and cyclic aging is available in BaSiS. It covers all relevant effects based on Newman’s approach and is fully coupled with the rest of the model. It takes the growth of passivating layers, like the SEI, and the corresponding loss of electrolyte, lithium, and active material surface, as well as the evolution of gas, into account. The core principles in simulating battery degradation are as follows: The decomposition of the electrolyte, with the corresponding growth and healing of the SEI, accompanied by the consumption of lithium and solvent, as well as the evolution of gas, is modeled according to Butler–Volmer kinetics. The modeling takes the temperature and the overpotential into account, both depending on the current state of the cell and the charge transport processes. The exchange current density depends on the temperature according to the Arrhenius law, as well as the lithium and solvent concentrations at the reaction site, both determined by the cell’s state and the transport kinetics of the different species i.e., diffusion and migration. A mechanical model calculates the active surfaces and the total cross-section of cracks, and determines the loss of active material and the lithium stored in it on the cathode and the anode side due to broken contacts. It considers the strain in the active material due to the intercalation and deintercalation of lithium, as well as the influence of gas bubbles due to aging. In turn, all these effects influence the amount of available lithium, the capacities of the active materials in both electrodes, the kinetics of the main and side reactions, and the transport properties of the charge and active species. Thanks to its full integration, all influences on the remaining physical and electrochemical processes in the cells are directly considered, e.g., leading to a reduction in capacity, an increase in inner resistance, and a reduction in power capability on a macroscopical level.
The basic expressions applied in the BaSiS model have been introduced in this section. A more detailed explanation of PEC modeling can be found, for example, in references [13,14,15].

2.2. Model Characterization and Validation

The challenges of PEC models involve the relatively high computational effort and the comprehensive parametrization process based on measurements in the laboratory. However, the advantage lies in the flexibility of the model, which can be tailored to the specific characteristics of a certain cell type. The parametrization can represent cell chemistries and physical properties, as well as design and manufacturer specific characteristics. A high-quality parameter set is essential for the accurate performance of the model for a given cell.
The parametrization needs to be conducted in terms of performance characterization and degradation characterization, accompanied by extensive validation with a large amount of measurement data. The process consists of five steps: (1) parameterizing through mechanical measurements; (2) parameterizing and validating in the frequency domain; (3) parameterizing and validating in the time domain; (4) parameterizing and validating for calendric aging; and (5) validating for cyclic aging.
Steps (1) to (3) are part of performance characterization, while steps (4) and (5) relate to degradation characterization.

2.2.1. Measured Batteries

Cylindrical cells of the INR21700-50E type, manufactured by Samsung SDI Corporation (Yongin, Republic of Korea), were used for parameterization and validation in this study. The cell features a nickel–manganese–cobalt (NMC) cathode and a graphite anode. It has a rated capacity of 4.9   A h , achieved when charged with a current rate of 0.5   C (where 1   C = 4.9   A ) and discharged at a current rate of 0.2   C . The cell should be operated within a voltage range of 2.5   V to 4.2   V . Charging is permitted between 0   ° C and 45   ° C , while discharging is acceptable between 20   ° C and 60   ° C . The maximum charging current rate is 1   C , and the maximum discharging current rate is 2   C . Its nominal lifetime spans 500 cycles, with the cell being charged at a current rate of 0.5   C and discharged at 1   C , cyclically at 23   ° C until 80 % of the initial capacity remains.

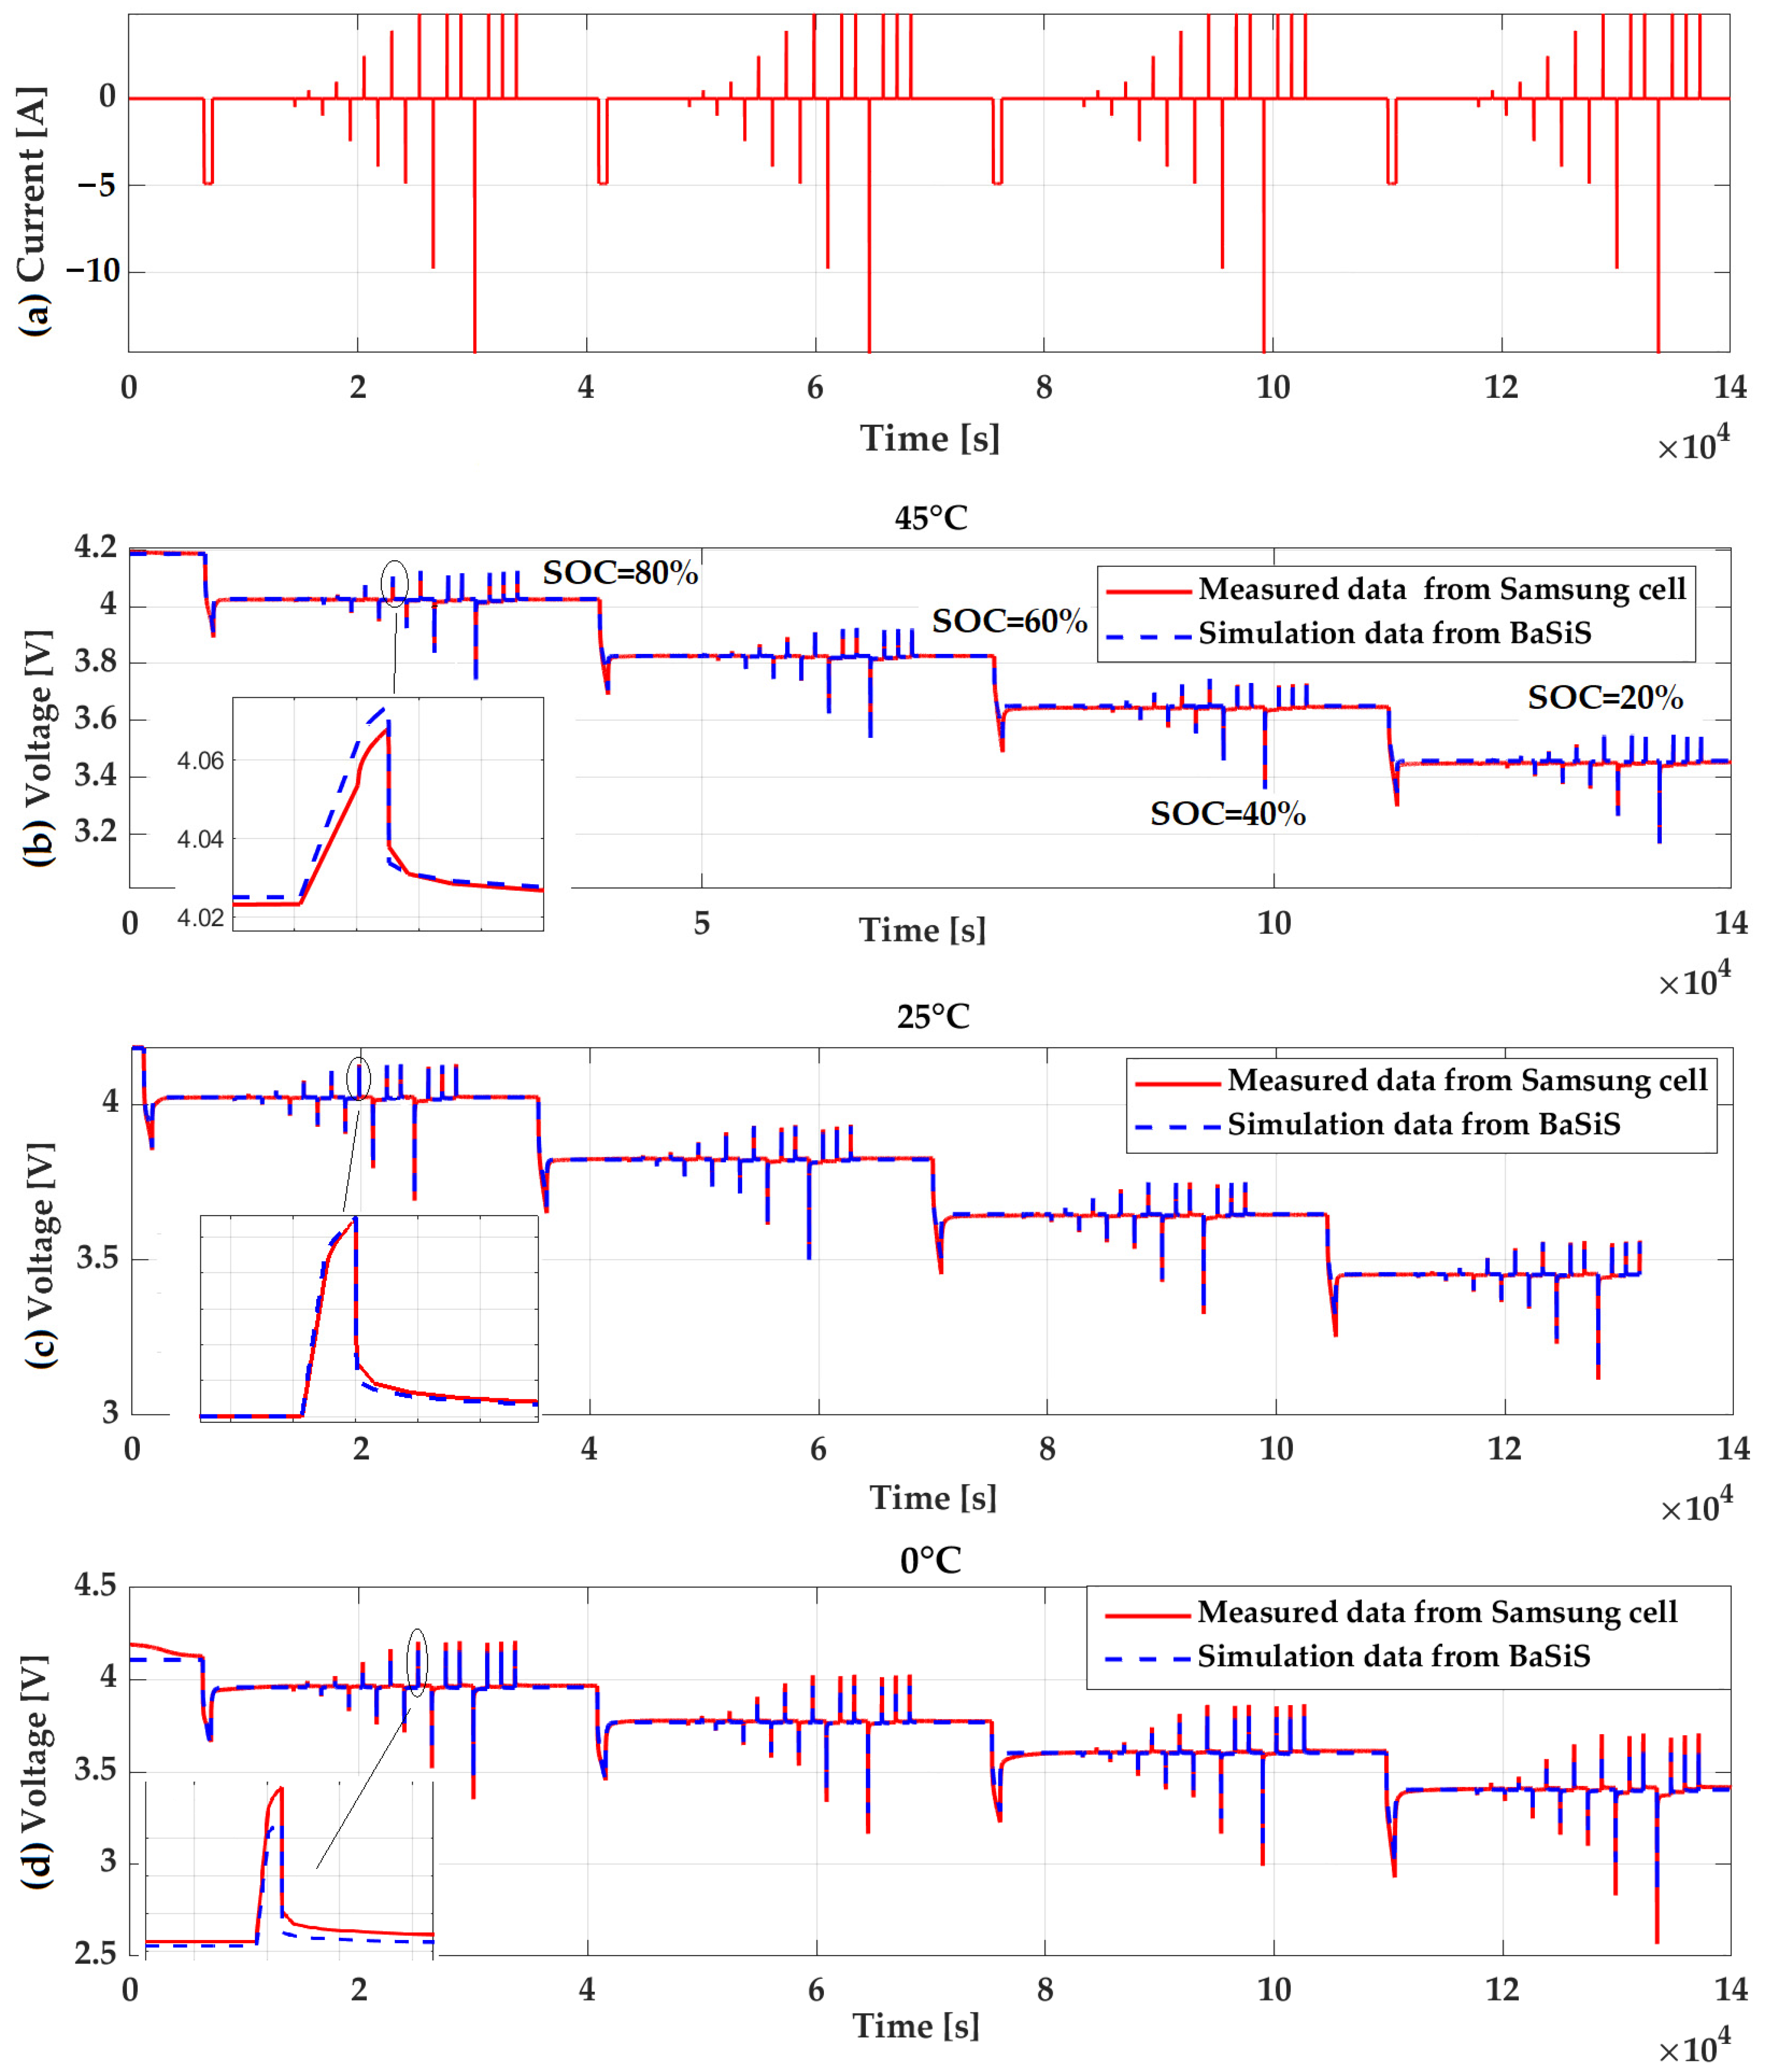
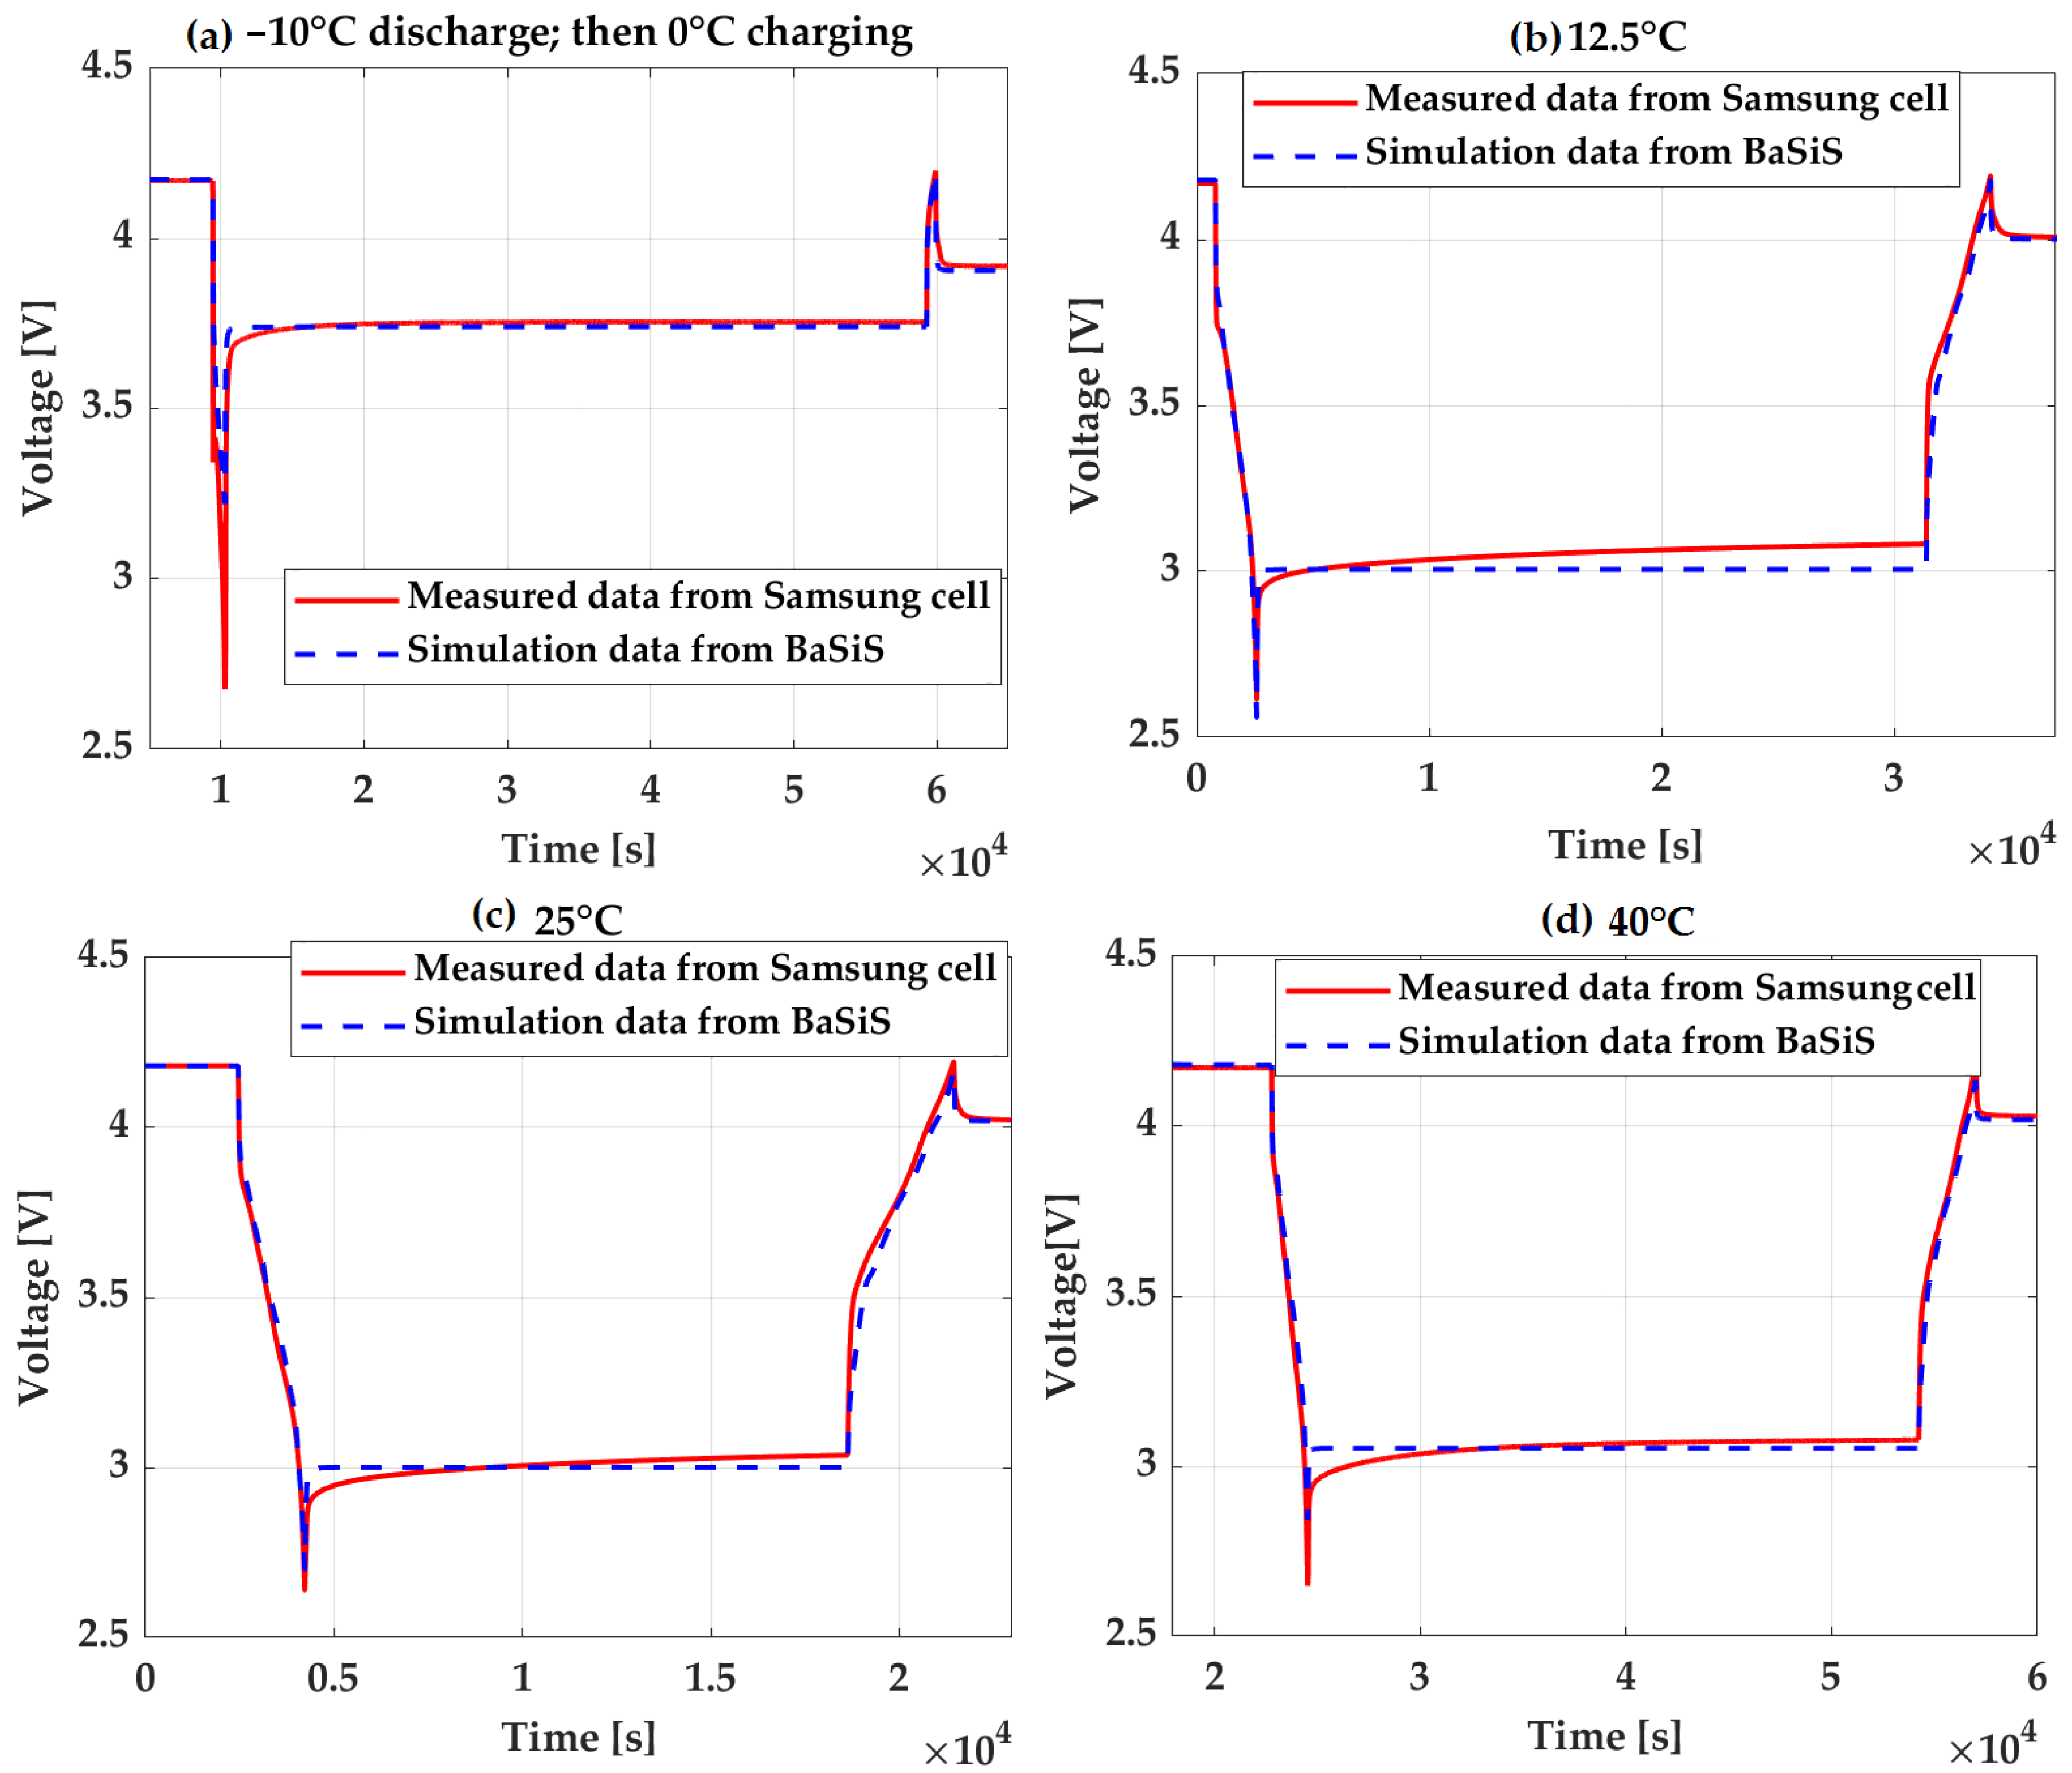
2.2.2. Performance Characterization and Validation

The first step involves conducting mechanical measurements by opening the cell to determine its geometric parameters, including the dimensions and porosities of all the components, as well as the Brunauer–Emmett–Teller (BET) surface of the anode and cathode.
Electrochemical Impedance Spectroscopy (EIS) measurements [19] were performed at seven temperatures ranging from 20   ° C to 45   ° C , with the S O C maintained at 50 % . The BaSiS model is linearized and Fourier-transformed to determine the parameters, including the double layer capacities, ohmic resistances, standard exchange current densities, activation energies, and inductivity from the collected data.
Figure 2 shows the impedance at two different temperatures simulated by the BaSiS model, compared with measurements, using the well-established parameters mentioned above. As this part of the parametrization process does not focus on diffusion processes or high-frequency effects such as the skin effect, the evaluation is limited to frequencies between a few hundred millihertz and a few kilohertz, as indicated by the red dots in Figure 2.
The third step, which involves parametrization in the time domain, is also a process of validating the model. The BaSiS model is characterized and then validated under standard conditions ( T = 25   ° C ), as well as at other temperatures. At each temperature, the BaSiS model is validated using experimental data from a standard pulse current test [20] and constant current charging and discharging at different rates.
Figure 3a depicts the current profile for the pulse test. Figure 3b–d illustrate the voltages simulated by the BaSiS model at different temperatures, which closely align with the experimental data. This validation confirms the accuracy of the determined parameters and the reliability of the PEC model.
At an ambient temperature of 25   ° C , constant current tests were conducted at rates of 0.375   C , 0.5   C , 0.75   C , and 1   C for charging and 0.01   C , 0.1   C , 1.1   C , and 2   C for discharging. These tests were carried out for a further validation of the parameters that had previously been determined by the pulse tests.
Next, the parameters related to thermodynamical characteristics were determined through constant current tests at temperatures ranging from 10   ° C to 45   ° C . Pulse tests were performed at specific temperatures, including T = 10   ° C ,   0   ° C ,   10   ° C ,   15   ° C ,   30   ° C , and 45   ° C , while constant current measurements were taken at T = 10   ° C ,   0   ° C ,   12.5   ° C , and 40   ° C , respectively. Some results of the constant current tests are shown in Figure 4. As can be seen, the simulated voltage in the time series from the BaSiS model matches the experimental data well.
Indeed, significant efforts are required for the parameter determination and laboratory measurements to characterize a PEC model. The accuracy of the parameters identified through the outlined process, as well as the high accuracy of the model itself, are consistent.

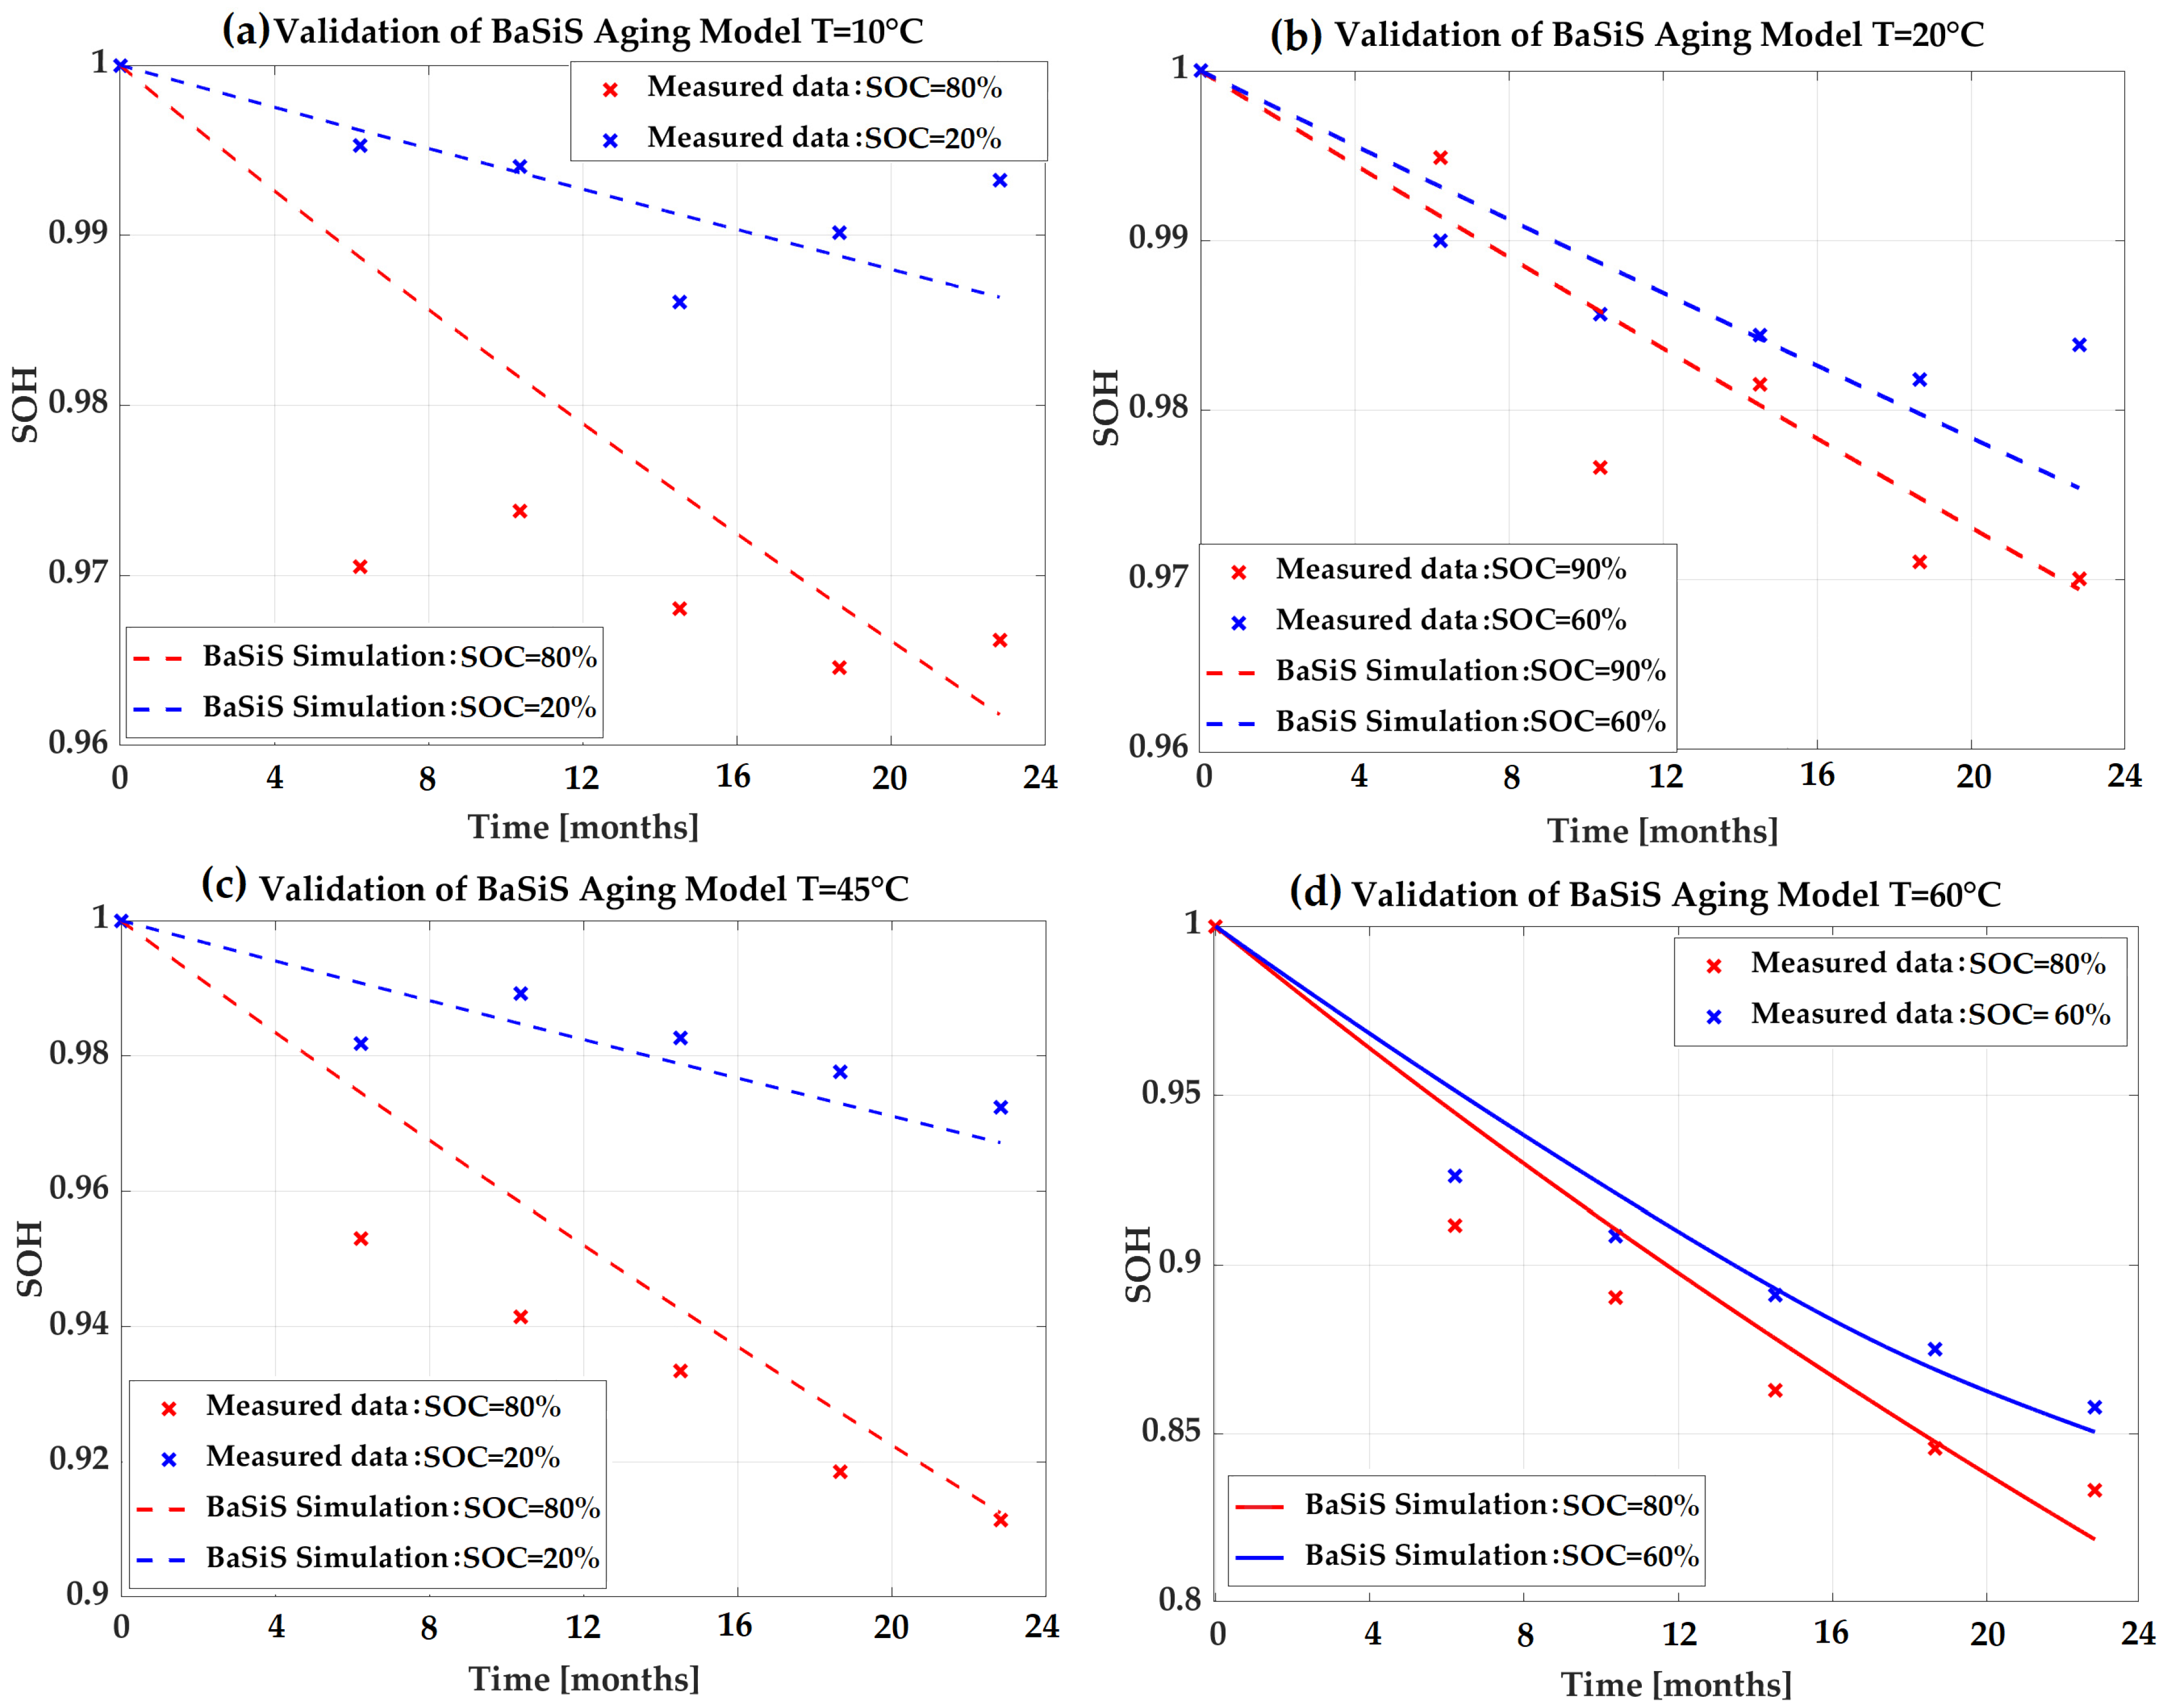
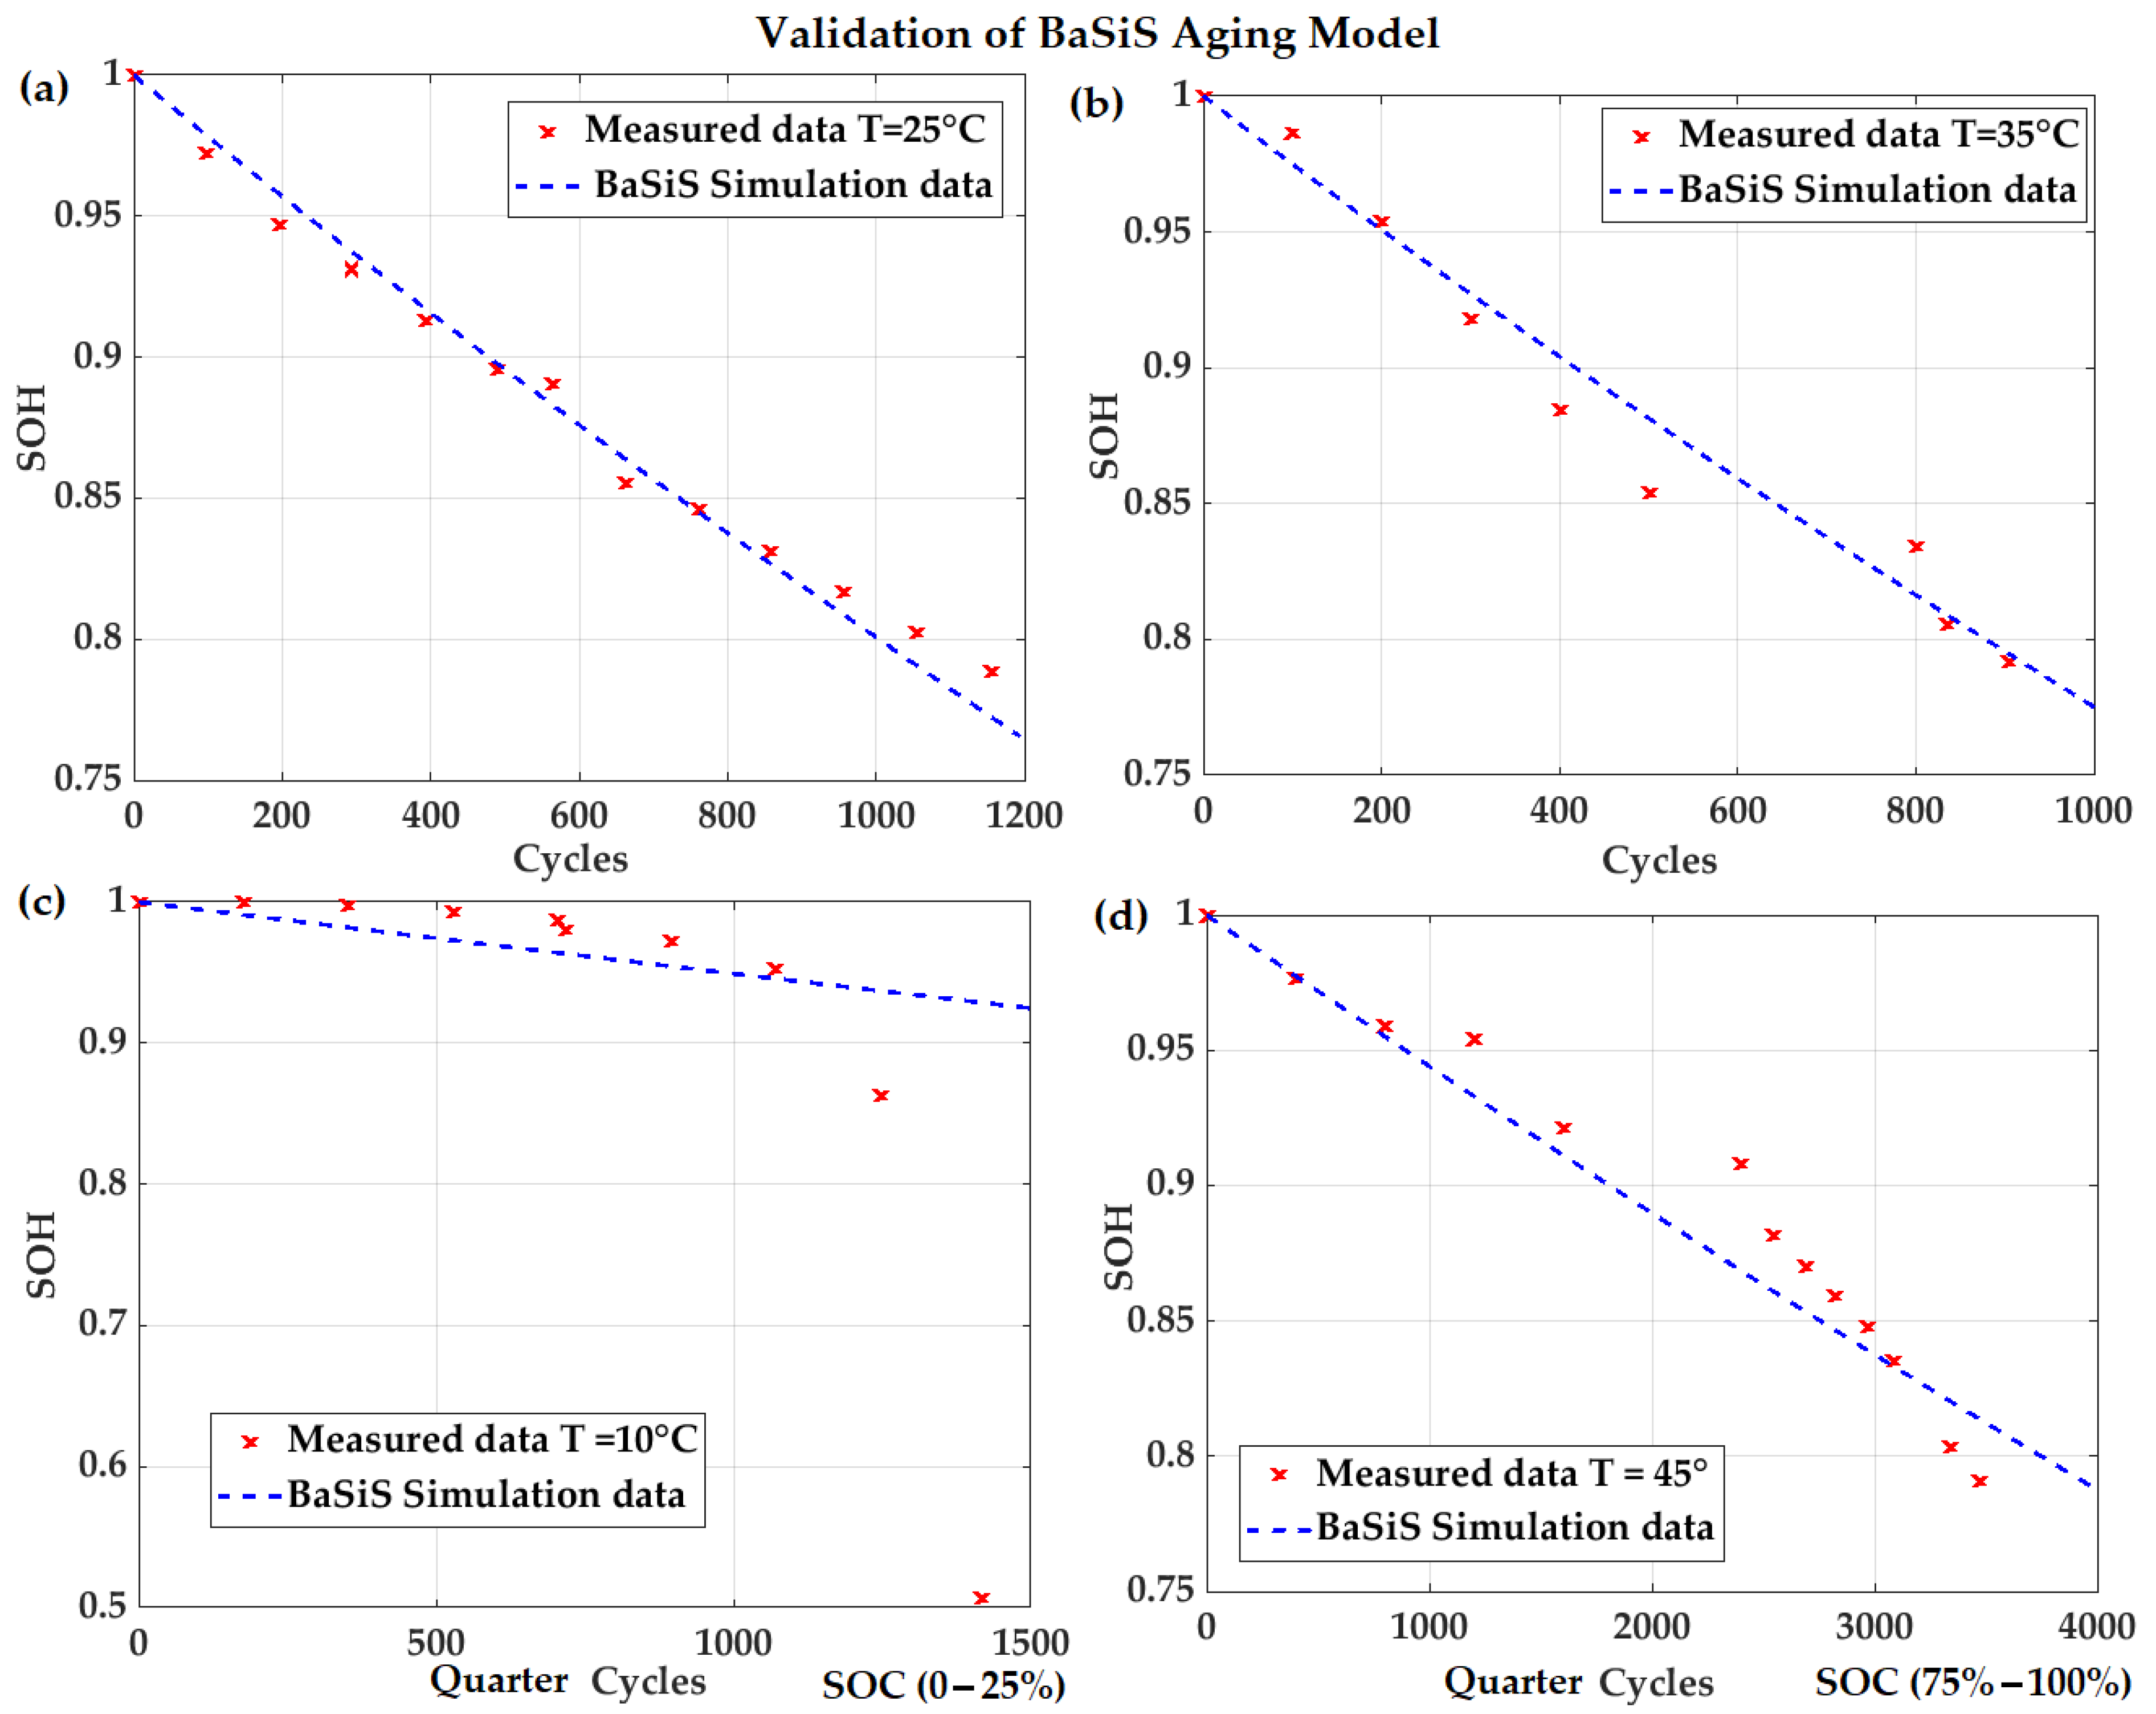
2.2.3. Degradation Characterization and Validation

Several parameters of the PEC model must be determined through measurements to properly characterize the degradation. The parameters are related to changes in the amount of available lithium, the capacities of the active materials in both electrodes, the kinetics of the main and side reactions, and the transport properties of the charge and active species. Following this, the results can be validated in terms of S O H values, depending on storage time or cycles.
Validation of the calendric aging model was conducted in the laboratory under various storage conditions, including temperature ranges from 10   ° C to 60   ° C and S O C levels from 20 % to 90 % . For the calendric aging experiments, the capacities and inner resistances were measured every three months for almost two years in total. The S O H is calculated based on the capacity. The cells exhibit a faster capacity loss at high temperatures, as displayed in Figure 5. Furthermore, the capacity fade increases at higher S O C s . The experimental data are represented as crosses in Figure 5. Comparing Figure 5a,b, it is evident that the calendric aging over 24 months shows more deterministic behavior at higher temperatures. The dependency of capacity loss at 60   ° C on time is clearly observed in the measurements, with the model predictions closely matching the measurement data. At lower temperature such as 10   ° C or 20   ° C , the measured capacity changes exhibit scattering around declining trend lines. The dependency becomes clearer only for measurements conducted over much longer storage times. However, the model predicts the trendline for the first 24 months quite accurately. At this step, most degradation parameters are determined by the calendric aging measurements.
In the last step, the aging model is validated for cells subject to cyclic charging/discharging. For cyclic aging, the capacity fade of the cells is measured under different cycles with various current amplitudes and different starting and ending values of the S O C . These include full cycles from 0 % to 100 %   S O C and quarter cycles from 0 % to 25 %   S O C and 75 % to 100 %   S O C . To carry out the laboratory measurements, R&D-grade multi-channel battery cyclers were used, in combination with climatic test cabinets, to ensure defined ambient temperatures for the cells.
Figure 6 displays a selection of validation results for a well-established parameter set. The crosses indicate experimentally determined capacity fades corresponding to increments of cycles. As shown in Figure 6, the capacity is measured until the S O H is below 80 % . Unfortunately, the cells charged between 0 % and 25 %   S O C at other temperatures exhibited a significant capacity loss after 85 %   S O H , similar to what occurred at 10   ° C , as depicted in Figure 6c. The S O H curves simulated by the BaSiS model, depicted as blue curves in Figure 6, align well with the experimental data.
The validation with a real load time series from a practical application would theoretically be possible, but it would require extensive time and specialized laboratory equipment. This is particularly true for grid applications, where full cycles occur rarely, and batteries degrade slowly. It would take several years for degradation to reach 80 %   S O H . Comparing simulations with measurements for full cycles with constant charging and discharging currents, which accelerates battery aging compared to real load profiles, is a widely accepted and commonly used validation method [19,20,21]. In fact, a major motivation behind the BaSiS model is its ability to simulate degradation much faster than real time. Systematic design optimization is only feasible with fast yet sufficiently accurate S O H simulations.

3. Hybrid Energy Storage System (HESS)

The design of the HESS involves various topologies and energy management strategies. Both factors impact the performance, efficiency, reliability, cost, and lifetime of the system, and they are often customized to specific applications [1]. In this chapter, after a brief discussion of different HESS topologies (Section 3.1), an explication of the hardware configuration, energy management strategy, and control is provided in Section 3.2 for the topology selected in this study.

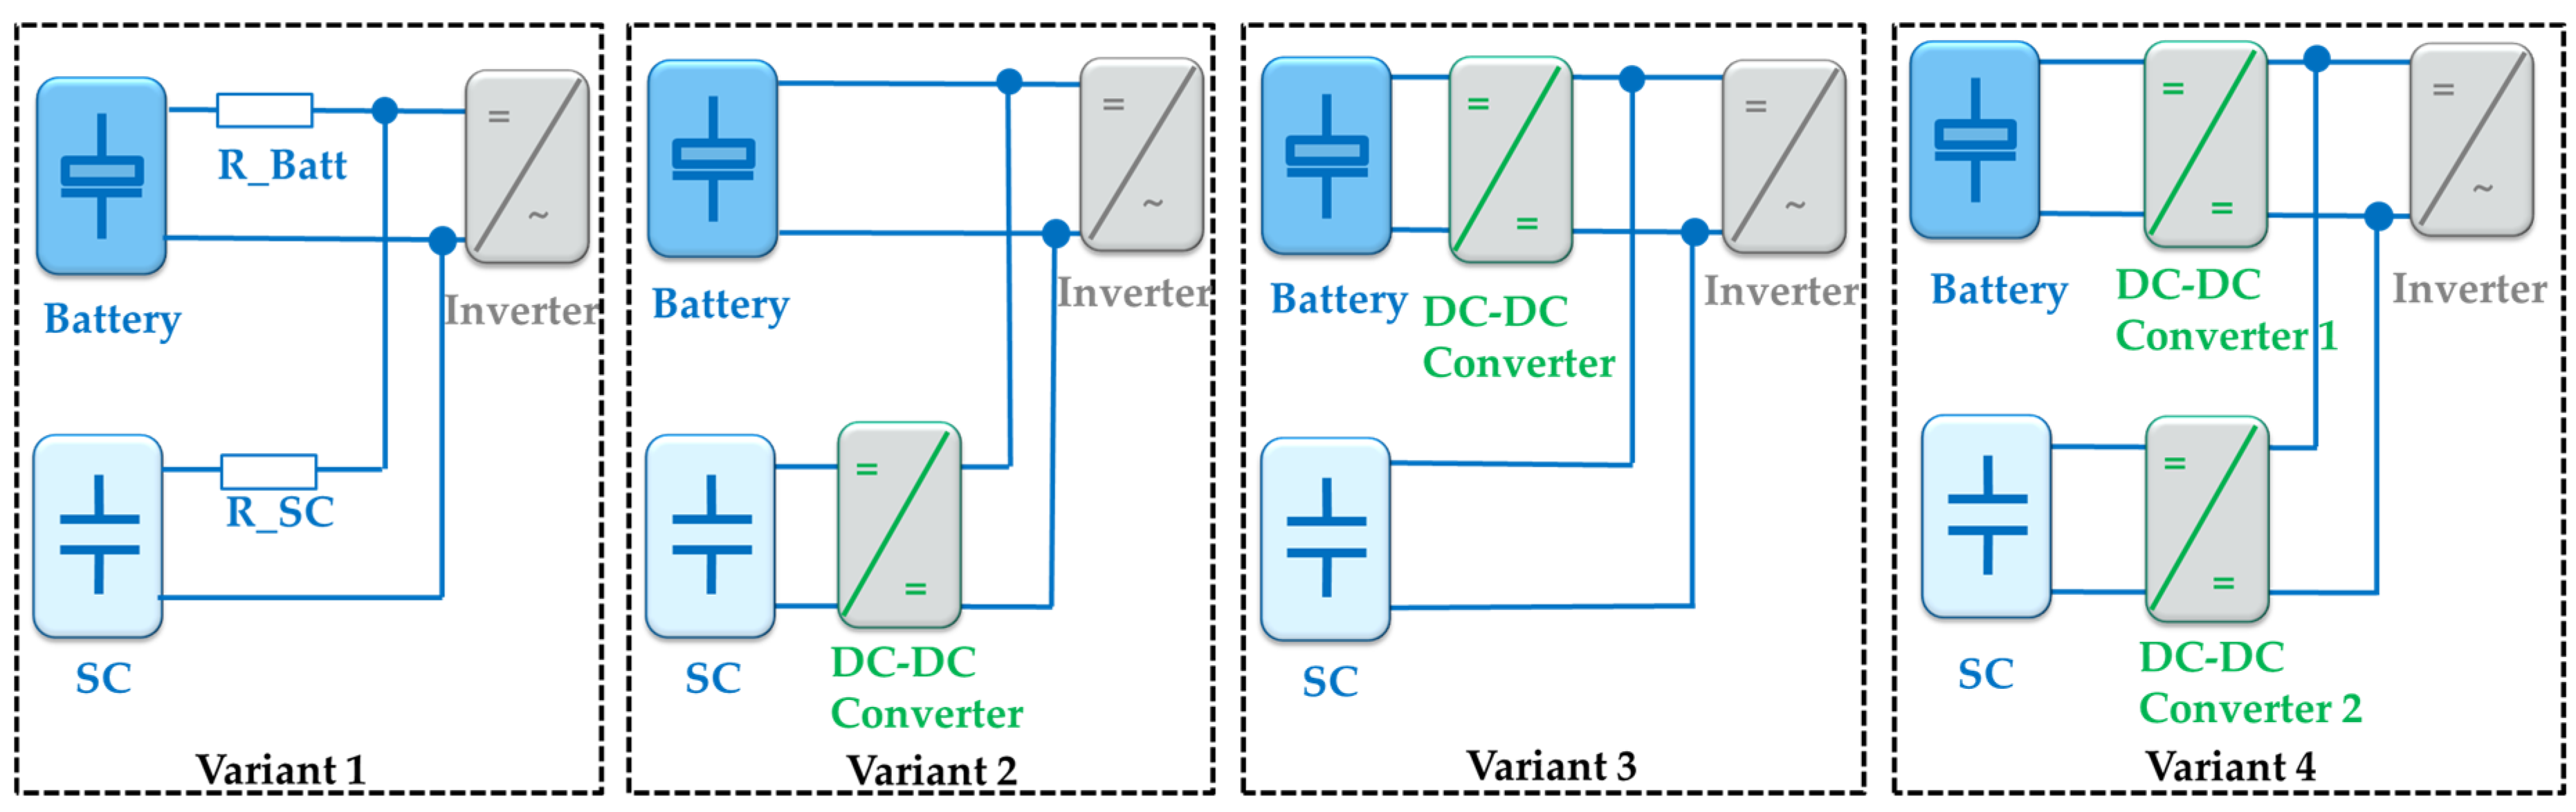
3.1. Topologies of Hybrid Energy Storage Systems

In this section, four common types of HESS topology are discussed with respect to system cost, sizing, and corresponding technologies for power-sharing and control strategies. The battery, SC module, and DC-DC converter serve as the main components in HESS, configured in a passive (variant 1), semi-active (variant 2 and variant 3), and fully active (variant 4) structure [2], as illustrated in Figure 7.
The first variant illustrates the passive topology, characterized by a direct coupling of the battery module and the SC module. In this configuration, the battery module and the SC module are connected with suitable resistances to the DC-AC inverter. It can be observed that this system is very simple, and there are no additional costs for power electronics compared to other variants. The passive topology can exhibit the behavior of a low-pass filter, where the SC module takes the high-frequency components of the power and smooths out the power fluctuations for the battery. The smoothness can be determined by the values of resistances R_Batt und R_sc relative to the size of the SC. However, it is important to note that there are additional losses caused by these resistances. Because the SC is directly coupled with the battery, the minimum voltage of the SC cannot be smaller than the cut-off voltage of the battery. Due to this limitation, the full capacity of the SC module cannot be utilized [22].
In general, the semi-active and fully active topologies offer more flexibility in energy management, thanks to their capability for active control. Various power-sharing algorithms, such as peak shaving, fuzzy logic, and rule-based approaches [1,2] can be implemented. These topologies also enable a better utilization of the available voltage range of the SC module. However, the required DC-DC converter is associated with a higher cost, larger size, and increased system complexity.
The second variant in Figure 7 is one type of semi-active configuration where the SC is connected by a bi-directional DC-DC converter, while the battery module directly interfaces with the DC-AC inverter. By incorporating an additional DC-DC converter, this configuration overcomes the limitations of the first variant: the voltage of the SC is regulated by the DC-DC converter, effectively decoupling it from the battery. The entire capacity of the SC can be utilized, and the power from the SC can be individually regulated.
Another configuration of the semi-active type is depicted as variant 3 in Figure 7. Unlike variant 2, in this configuration, the converter is connected to the battery, and the SC is directly coupled with DC-AC inverter. Since the voltage of the SC in this topology is coupled with the grid-side DC-AC converter, the minimum voltage is determined by the grid voltage. Similar to the issue in variant 1, some of the capacity of the SC is not available. The battery is connected via an additional DC-DC converter. The voltage level can be higher or lower than the SC voltage band; however, due to the battery’s characteristics, only a small voltage range is required on the battery side of the DC-DC converter. An advantage of this setup is that the battery is isolated by the DC-DC converter, which protects it from potentially harmful grid faults. For example, a voltage drop in the grid is challenging to mitigate effectively using a DC-AC inverter. Similar to variant 2, different approaches to power sharing can be applied in this variant.
In the last variant, the fully active topology, both the battery and the SC are equipped with DC-DC converters and isolated from the grid. Notwithstanding the costs for two sets of DC-DC converters, this topology includes all the advantages of variant 2 and variant 3.
It is evident that the topology directly influences the efficiency of HESSs. Generally, the losses of the DC-DC converter are important and form a drawback of the semi-active and active topologies. For the passive topology, the additional resistors required to properly define the passive load-sharing properties between the battery and SC may result in additional losses as well. Zhang et al. [7] provide a detailed discussion of the relation between HESS topology and efficiency, and they also elaborate on other topologies optimized for high efficiency. Further explanations of these topologies and more specific configurations for passive, semi-active, and fully active systems can also be found in references [2,8,10].

3.2. Energy Management System (EMS) of HESS

After comparing and analyzing the advantages and disadvantages of the different topologies discussed above, considering the aspects of sizing, flexibility, and cost–benefits, variant 2 has been selected and investigated in this study. This configuration allows for the implementation of various power-sharing control algorithms that can be tuned and optimized according to the application requirements. This section provides a comprehensive design description, including the energy management and control for both the battery and SC module.
The energy management system (EMS) in the context of the considered HESS system has two tasks: (1) coordinating power sharing between the battery module and SC module, and (2) adjusting and maintaining proper values of S O C for the SC module and battery module prior to power demand. Both aspects of the EMS mentioned above directly influence the performance, sizing, degradation, and cost of the HESS system, depending on the application. For example, if a higher peak power is taken by the SC module, it will necessitate a larger and more expensive DC-DC converter, which, on the other hand, could positively impact battery rating and degradation. Furthermore, if the SC module and battery S O C are not restored quickly enough to an appropriate level, larger reserve capacities might be required, thereby increasing costs. Yi et al. [8] provide a comprehensive discussion of the influence of EMS on HESS design and degradation for automotive applications in their paper.
The EMS, with the control structure for battery and SC, is depicted in the dotted black frame in Figure 8. Since the battery is directly integrated with the AC-DC inverter, an additional battery control system is designed to regulate the reference charging and discharging current from the power source. This battery control system comprises two loops: an inner current control loop and outer power control loop. The inner control loop regulates the battery current to the desired value I B a t , r e f , aimed at supplying or storing the battery power as required by the outer power control loop. The outer loop regulates the power to the reference value P B a t , r e f provided by the power-sharing algorithm. A typical anti-windup strategy is employed to address windup issues arising from the PI controller and saturator [23]. The output signal U D C , r e f from the current control loop is the reference voltage adjusted by the U D C controller, which belongs to the control system of the DC-AC inverter depicted in the gray frame in Figure 8. Since we assume that the required power can be achieved with high performance by the grid-side DC-AC inverter, shown in the gray part in Figure 8, it is not modeled in this toolbox.
The SC control system, consisting of an inner current loop and outer power loop, is developed similarly to the battery control system, as shown in the green dotted frame in Figure 8. The DC-DC converter is modeled, including the Pulse-Width Modulation (PWM) of the power electronic switches [24,25]. When the inner current control is integrated directly into the DC-DC converter module, typically only the power control loop needs to be implemented as part of the EMS.
The power-sharing control divides the overall required power between the battery and the SC. This study investigates two different algorithms for power-sharing control: (1) a low-pass filter (LPF) and (2) peak shaving (PKS) [8,26]. The low-pass filter approach decomposes the required power Pref into a low-frequency component supplied by the battery and a high-frequency component provided by the SC. This ensures that the charging or discharging current of the battery is smoothened out, as illustrated by the red curve in Figure 9. Simultaneously, the high-frequency component is handled by the SC. Alternatively, through peak shaving, a specified fraction of the power peak can be supplied by the SC, while the battery operates below a designated power limit, as depicted by the blue curve in Figure 9.
As a result of power sharing, the utilization of an SC module can effectively mitigate the immediate stress on batteries caused by short-term high-frequency power fluctuations. This, in turn, enhances battery lifespan and enables the optimization of the size and cost of the entire system [1]. The results displayed in Figure 9 have been simulated in the MATLAB environment according to the configuration shown in Figure 8. Both power-sharing algorithms have tunable parameters that directly influence the amount of power allocated to the SC module and battery, thereby affecting battery degradation and system cost. In the low-pass filter approach, a time constant of the filter must be defined, which determines the frequency band of power fluctuations managed by the SC module. The relationship between the time constant and the maximum SC current, however, is not straightforward. Peak shaving allows one to define the maximum power limit of the battery. If the maximum load power is known, the size of the required DC-DC converter can be determined in a straightforward way.
The battery model is employed as a high-accuracy BaSiS model, and the SC is modeled by a simple EMC model [26,27,28], represented by two blue symbols in Figure 8. Since the lifetime of the SC is much longer than that of the LIB by a factor of more than 100, both in terms of calendric and cycle lifetime [29,30,31], an EMC model is applied in this tool to express the behavior of the SC in supplying power and energy without any description of degradation. The DC-DC converter model and SC current control are illustrated as the green part in Figure 8. The control system, which was investigated for the optimal design toolbox, can be directly implemented in a Programmable Logic Controller (PLC) as a second step in a HESS demonstrator. The battery current control, SC outer power control, and power-sharing control designs have been developed with the potential for utilization in the PLC hardware system, represented by black symbols in Figure 8.

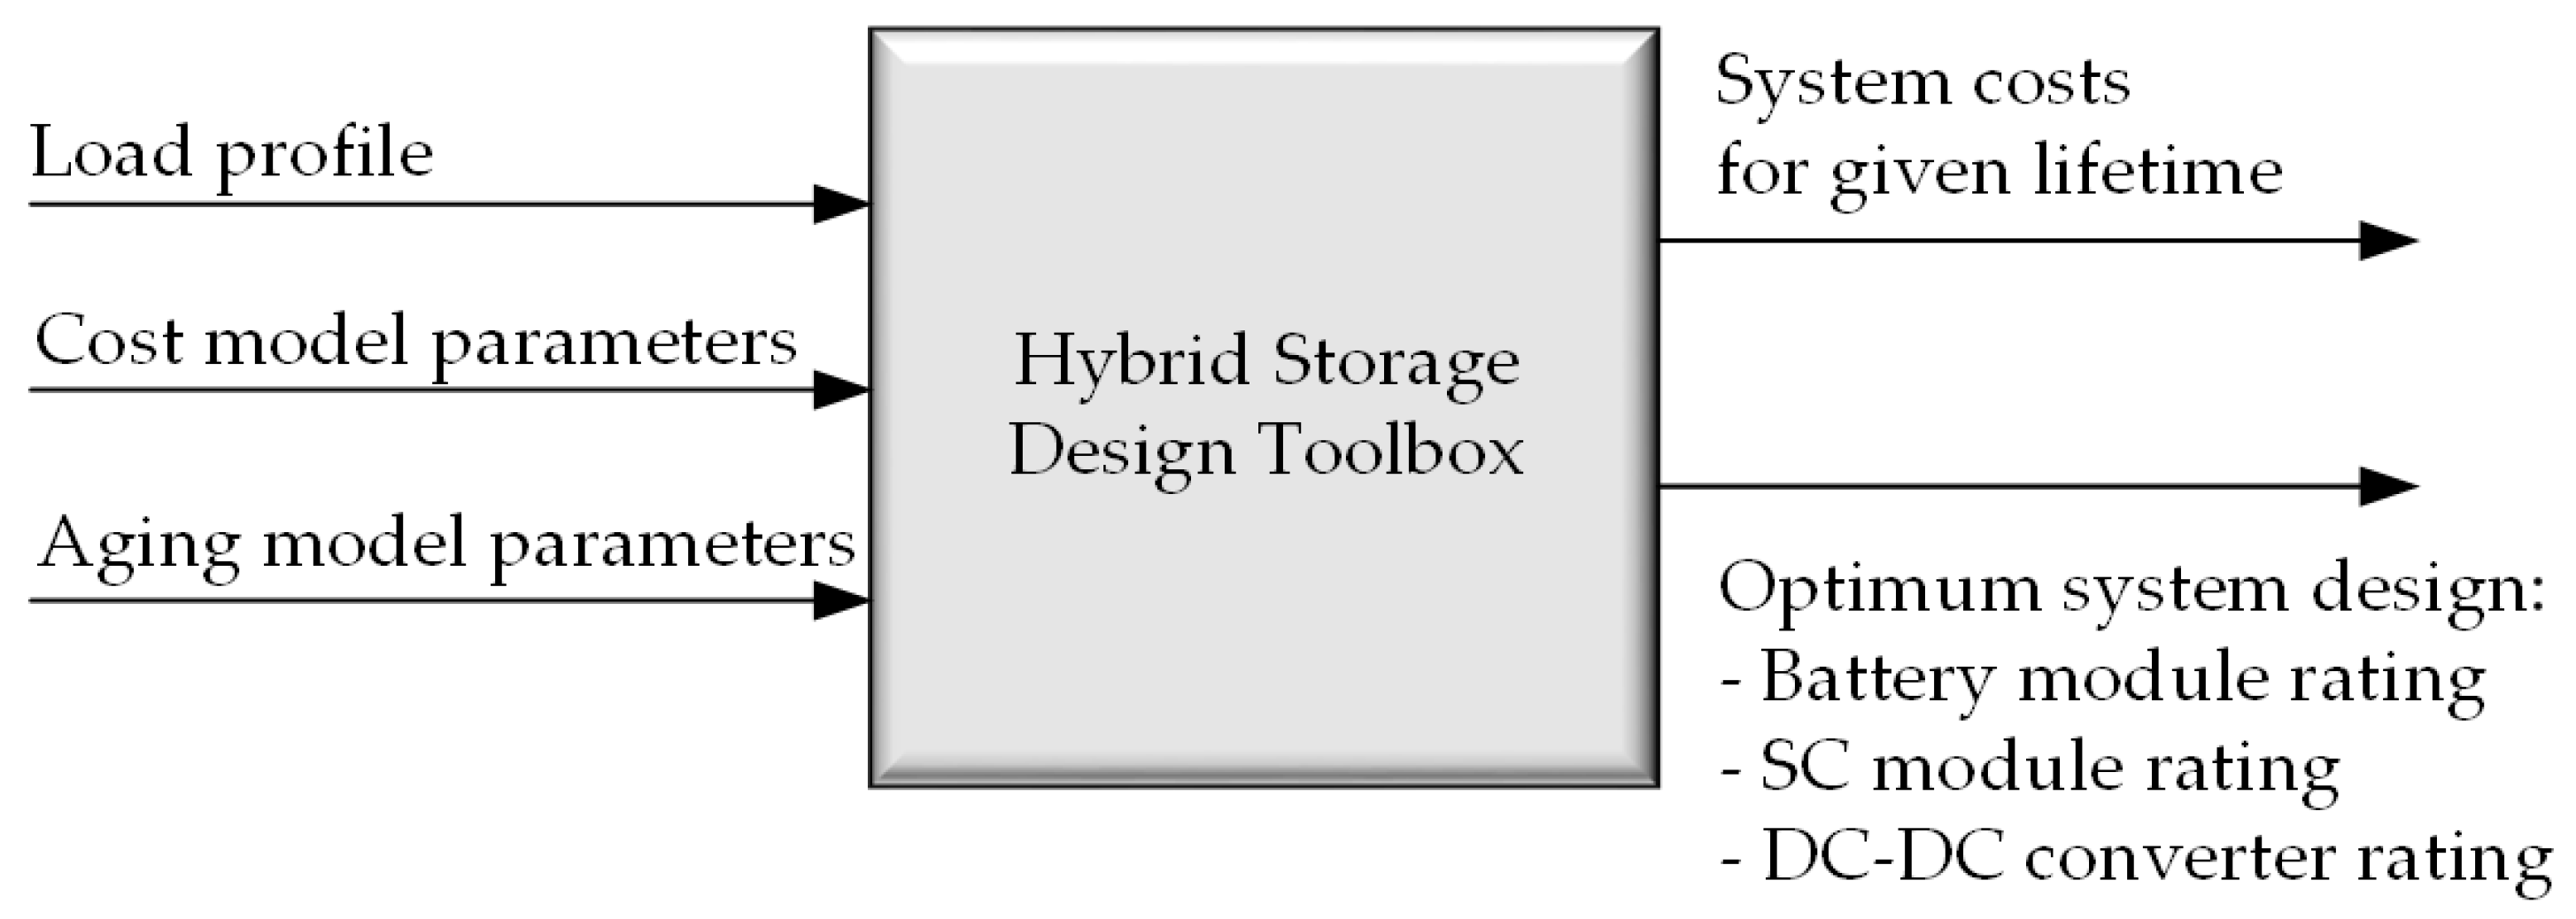
4. Optimal Design Toolbox

The principal idea of the optimal design toolbox is shown in Figure 10. As input information, the user provides load profiles and the parameters for investment cost, battery degradation, and the expected lifetime. In response, the toolbox will provide and visualize information on the cost and size of the HESS, including the battery module (BaSiS model), SC module (EMC model), and DC-DC converter.
This process involves two steps to determine the optimal design.

4.1. Step 1: Find Battery/SC Module Combination for Minimum Investment Costs

In the first step, for a given load profile, the minimum cost of the HESS system is determined for a given profile, without considering any lifetime requirements. The general assumption is that the battery size in the reference battery-only system is defined by the maximum admissible charging power. By adding an SC module, part of the power can be managed by the SCs through applying a suitable power-sharing approach. Therefore, the size of the battery can be reduced, as long as its capacity is sufficient to provide the required energy for the load cycles. Since SCs with low energy density cannot supply considerable energy, the HESS approach will only benefit applications with load profiles featuring distinct power peaks.
For step 1, only the peak shaving approach is considered for power sharing, because the analysis can be done quickly without simulations. Furthermore, the peak-shaving approach was found to result in lower total system costs compared to the LPF approach.
The algorithm for step 1 is as follows:
The positive part of the power time series (charging power) is divided into several charging cycles. Then, a power threshold P B a t t m a x for peak shaving is defined. Effectively, the power for the battery module is limited to P B a t t m a x . The excess energy for power values above the threshold should be stored in the SC. The stored energy for one cycle is thus,
E S C = c y c l e 0 m a x ( P P B a t t m a x , 0 ) d t
The energy is normalized by the maximum charging power in the load profile. The size of the SC is thus characterized by a time value, giving the required capacity in terms of seconds of maximum charging power P m a x ,   c h a r g e   :
t S C ( P B a t t m a x ) = E S C P B a t t m a x P m a x ,   c h a r g e  
By reducing the value of P B a t t m a x , a curve t S C ( P B a t t m a x ) can be derived for each charging cycle. An example of the resulting curves for several load cycles is shown in Figure 11. The red dotted line in Figure 11 represents the maximum envelope curve derived from individual curves across all charging cycles, providing a comprehensive depiction of the power and energy requirements for the HESS.
Next, a cost model is used, to determine the optimal system cost that fulfills the power and energy requirements, temporarily neglecting the lifetime requirements for the moment. The cost model assumes a fixed ratio between the maximum power and capacity of the battery module. The cost of the battery can thus be estimated as a factor of P B a t t m a x . The cost of the DC-DC converter will depend on the maximum power observed by the SC, which is the difference between the maximum charging power and P B a t t m a x . The cost of the SC module is assumed to be proportional to the maximum energy to be stored, specified in terms of t S C . Therefore, the total cost model can be formulated as,
C H E S S = c B a t t P B a t t m a x + c D C D C ( P m a x , c h a r g e P B a t t m a x ) + c S C t S C
To find the system with minimum costs, we rearrange this equation as,
P B a t t m a x = 1 c B a t t c D C D C C H E S S c D C D C P m a x , c h a r g e c S C t S C
For a given total system cost C H E S S , this equation defines the line of constant cost in the P B a t t m a x t S C diagram. We need to identify the line that intersects the load profile at minimum costs, i.e., the line should be positioned as far left as possible.
An example is exhibited in Figure 12. The red dashed line represents the envelope of all charging cycles. The blue dashed lines indicate lines of constant cost. The red point identifies the minimum cost system with a normalized power rating P B a t t m a x / P m a x ,   c h a r g e   = 0.53 for the battery and the required energy of the SC module given in full-load seconds t S C = 42   s . The gray areas indicate the probability levels of encompassing all charging cycles. It is evident that the investment cost of the HESS system would decrease significantly if 98   % of load cycles were covered instead of 100   % .
From Figure 12, we can deduce that there exists a HESS system with a lower cost than that of the reference battery-only system, if the following condition is fulfilled:
c S C c B a t t c D C D C < d P B a t t m a x d t S C P B a t t m a x = 1
The right side of this condition in Equation (11) is a property of the shape of the load profile and effectively will be large, if distinct high-power peaks with a short duration are present in the load time series. The left side relates only to component costs; it will be minimized if the cost of the SC per unit of energy is lower than the combined battery costs minus the DC-DC-converter costs, both per unit of power.

4.2. Step 2: Select Best System for Required Lifetime

In the second step, the lifetime of the HESS is additionally considered, to select the most suitable system design for a given application.
As a general principle, several simulations of the HESS are executed, including the detailed BaSiS model with battery aging explained in the former sections. In these simulations, the tunable parameters of the EMS power-sharing algorithms are systematically varied, using the optimization tool to assess different operating strategies. This directly affects the amounts of power and energy supplied by the battery and SC modules, as well as the required size of the DC-DC converter.
As a result, for a given load power time series and a pre-defined power-sharing algorithm, the toolbox allows the visualization of the dependencies of the following quantities, based on the required lifetime (see results in Section 5.2):
  • Required minimum battery module capacity;
  • Required minimum SC module capacity;
  • Required minimum DC-DC converter power rating;
  • Component and overall system costs.
Various system configurations, such as battery-only, SC-only, HESS, and combinations with different power-sharing control algorithms, can be compared. According to these curves, the most appropriate HESS configuration and sizing can be selected for a given application. Additionally, the maximum potential cost reductions and lifetime extensions with respect to the battery-only system can be determined. The optimal values of the tunable EMS parameters can be determined as well.
  • Two strategies are investigated for HESS system design:
  • Battery Size Reduction: For that design strategy, the maximum battery charging power and consequently the battery size is reduced. In this way, a cost reduction compared to the reference battery-only system can be achieved. However, reducing the size of the battery module increases the current amplitude for each individual cell, which in turn increases the number of full cycles. Consequently, a reduction in the system lifetime must be accepted.
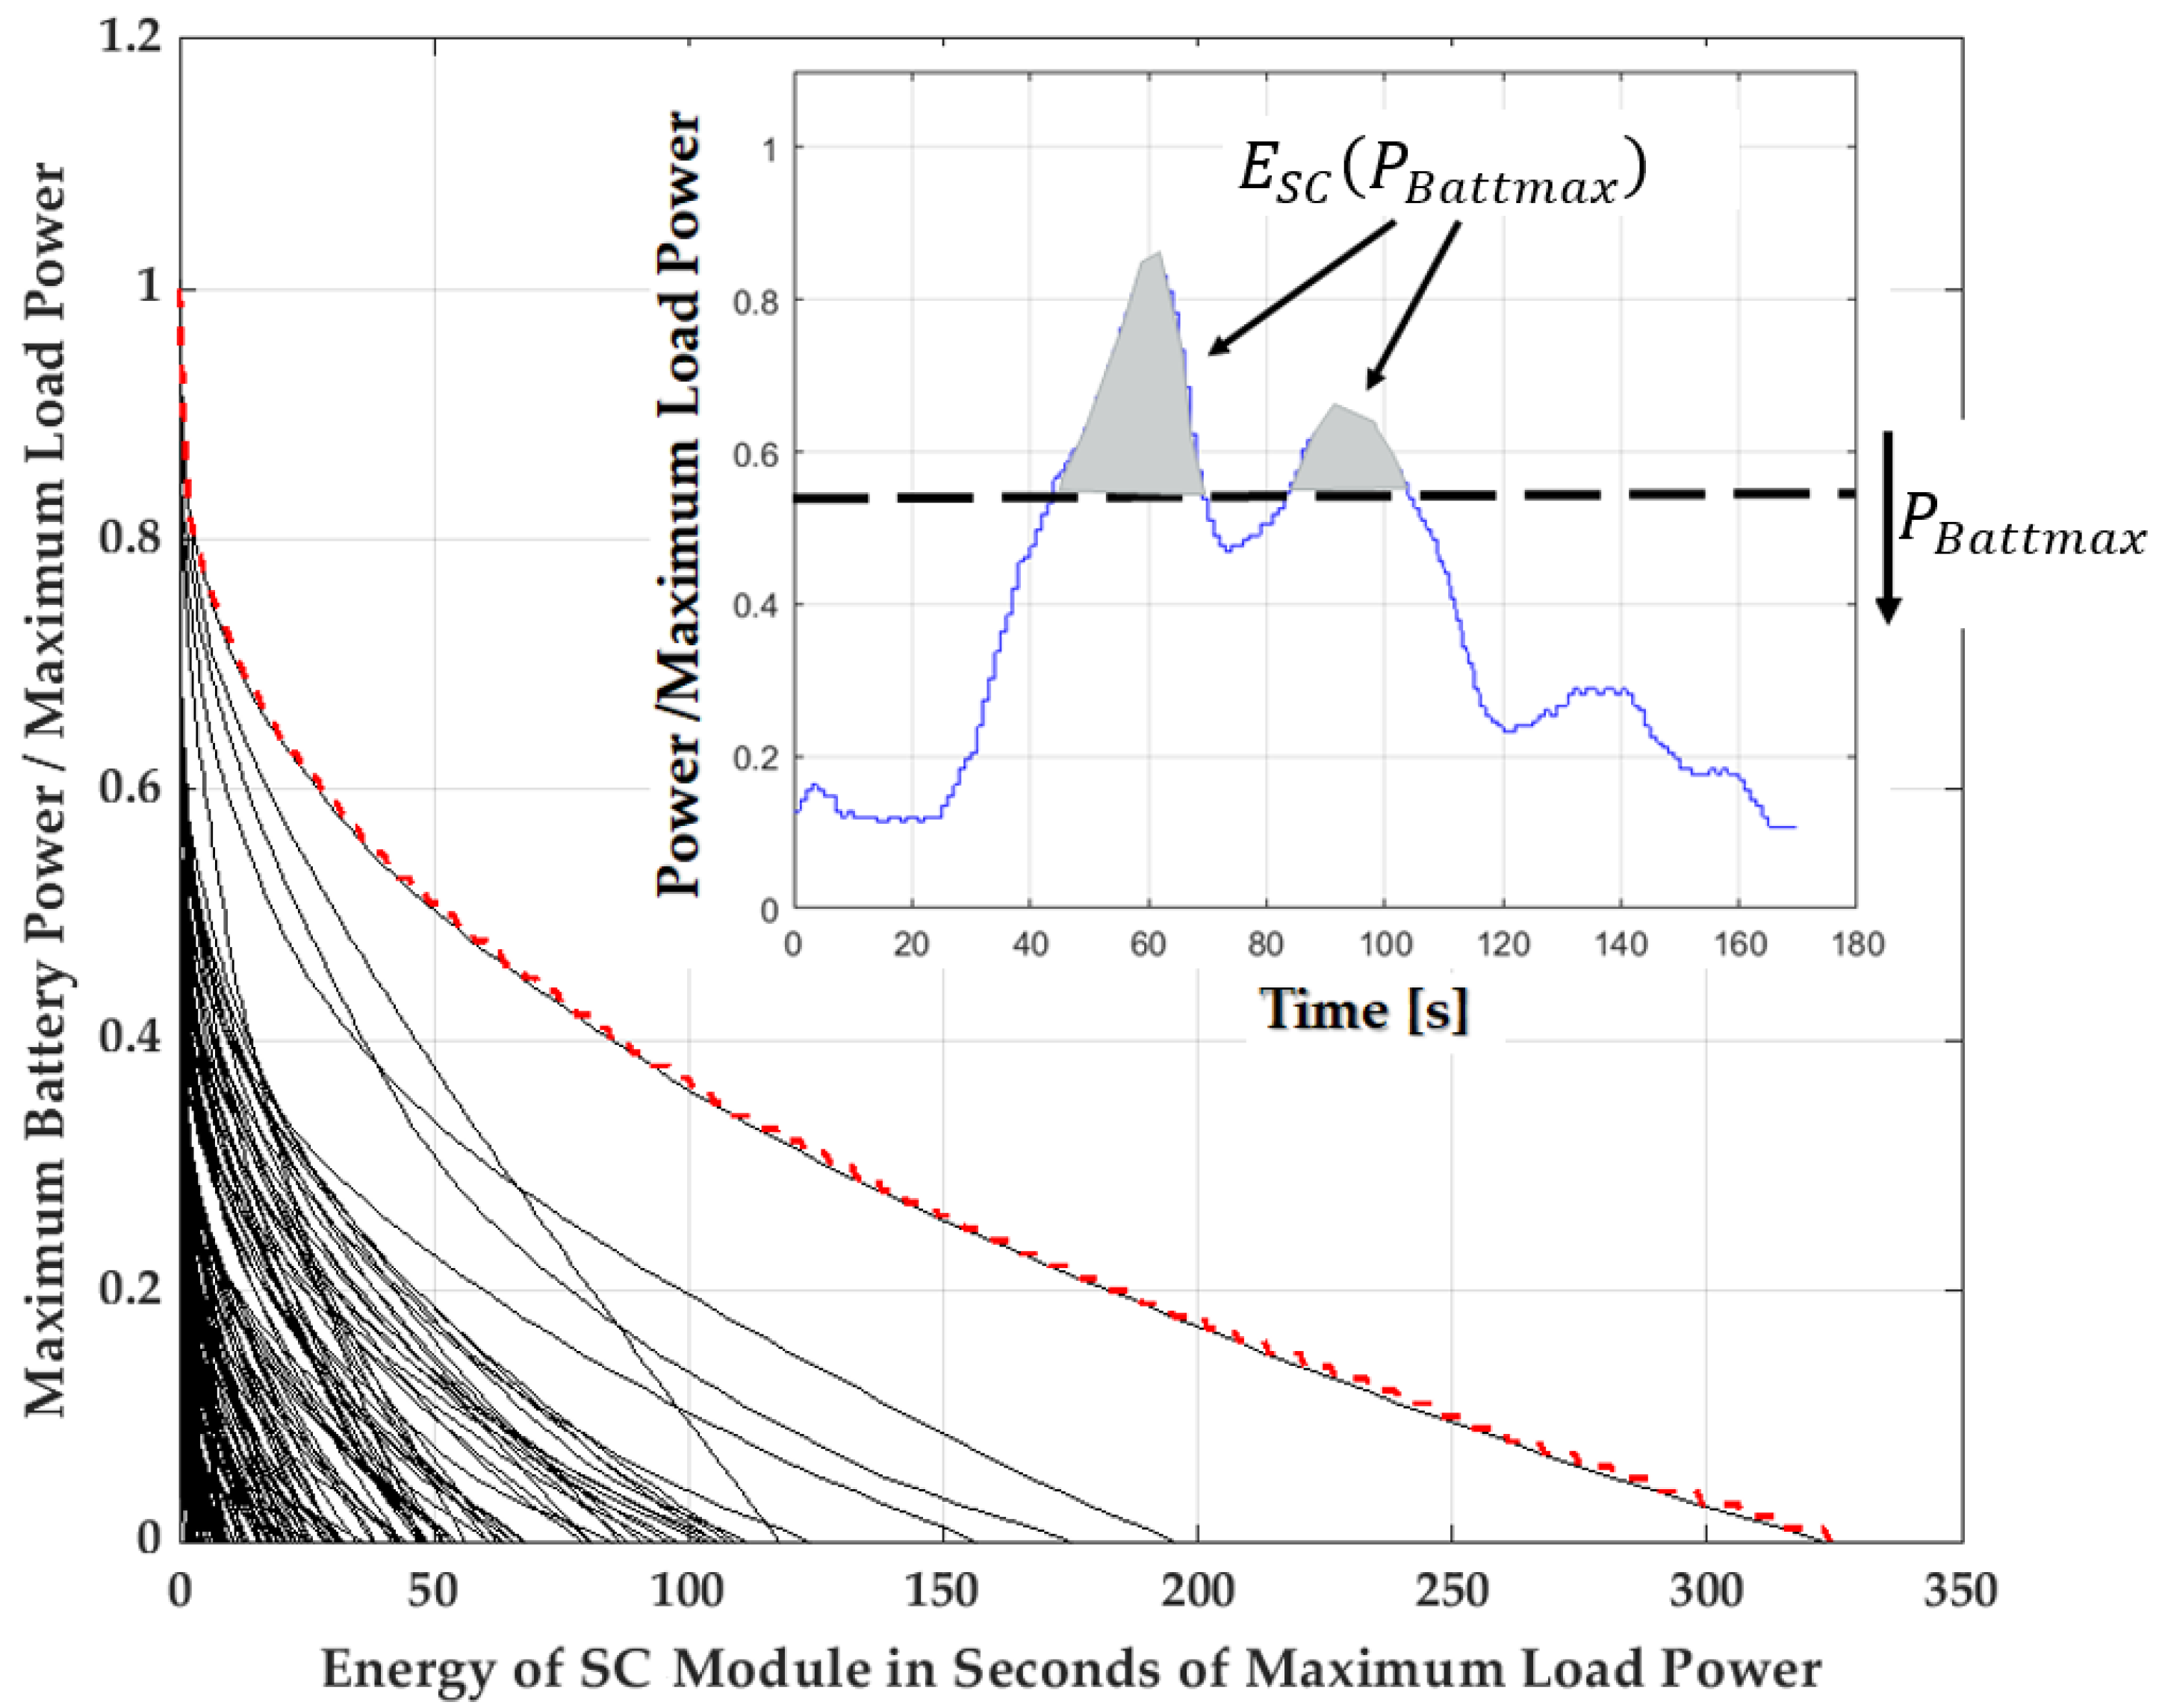
  • Lifetime Prolongation: For this strategy, the battery size remains constant, while an additional SC module is equipped to effectively reduce power peaks. This approach can extend battery lifetime. It is important to note that the HESS system will incur higher investment cost compared to the reference battery-only system.
Each of the outlined HESS system design strategies are investigated with the two different control strategies, aimed at achieving the desired power sharing between the battery and SC modules:
Peak Shaving (PKS): The battery charging power is limited to a specific level P B a t t m a x . If the overall power in absolute value exceeds this level, the difference will be taken up by the SC module.
P S C ( t ) = P HESS ( t ) | P HESS ( t ) | m a x | P H E S S ( t ) | P B a t t m a x , 0
Low-Pass Filter (LPF): The battery power is dynamically smoothened out by a low-pass filter. The difference between the battery power and HESS power is charged (or discharged) by the SC module:
P B a t t t = L o w p a s s P H E S S t , P S C ( t ) = P H E S S ( t ) P B a t t ( t )
The capacity of the SC module is not limited for both control strategies during the simulation. The required size will be determined after the simulation by considering the maximum value of stored (or supplied) energy. The zero-energy limit, nevertheless, is taken into account. The discharging of the SC module will stop if the zero-energy limit is reached.

5. Hybrid Storage Energy System in Grid Application: Case Study

In this section, we specifically highlight the application of hybrid storage technology within the context of the electrical grid. It provides a detailed description of an example of system implementation and discusses the application of the toolbox for designing and optimizing lifetime and investment costs.

5.1. Description of Grid Application

In Figure 13, a comparison of frequency deviation between the European mainland and the UK for the same time window (one week in a summer) is presented. The frequency data source is from the transmission system operator of the UK [32]. Obviously, the power grid in the UK experiences significantly higher fluctuations in frequency, necessitating stringent frequency regulation and rapid response dynamics.
The technical data comparison between Primary Response (PR) services specified by the TSO in the mainland of the EU and the dynamic services from the TSO in the UK are listed in Table 1 [6]. The following points can be concluded:
  • BESSs are well-suited and state-of-the-art for providing conventional grid services like PR;
  • In a weak grid such as the UK, the increased penetration of renewable energies necessitates more dynamic grid frequency support. New dynamic services such as Dynamic Moderation (DM) and Dynamic Containment (DC) are introduced in Table 1 [6];
  • For a BESS, these new requirements result in high power peaks of short duration, leading to high charging (or discharging) current ratings and fast degradation.
HESS systems, combining SCs with a high power density and batteries with a high energy density, are well-suited for supporting dynamic grid frequency stabilization. The SCs are capable of handling high-frequency power components, while the batteries provide the smoothened power component. The battery degradation caused by high-power rating stress and potential over-rating can be reduced in this way.
Moreover, HESSs and BESSs are capable of providing very fast responses. These storages can contribute full power with ramping times much smaller than 30   s , as required by classical PR [33]. Ramping times of one second, as specified for the UK´s new dynamic frequency support services like DM and DC [6] for weak grids with low inertia and high dynamic fluctuation, can easily be achieve by the HESS.
Considering the requirements of new dynamic services in the UK, as an exemplary case study, a hybrid storage design for active grid frequency support according to the DM service has been carried out. The DM has been investigated, since it needs a fast response time and is frequently activated. A HESS can be efficiently applied to respond to frequency deviations from a nominal value larger than 100   m H z [6]. The advantages of HESSs can be utilized for load profiles characterized by frequent, short-duration high-power peaks.
The simulation of the HESS system is carried out using a load profile derived from one week of frequency measurements from the UK grid, as illustrated in Figure 14. It is evident in this figure that the battery experiences considerably reduced degradation rates thanks to attenuated power peaks, by the application of additional SCs.

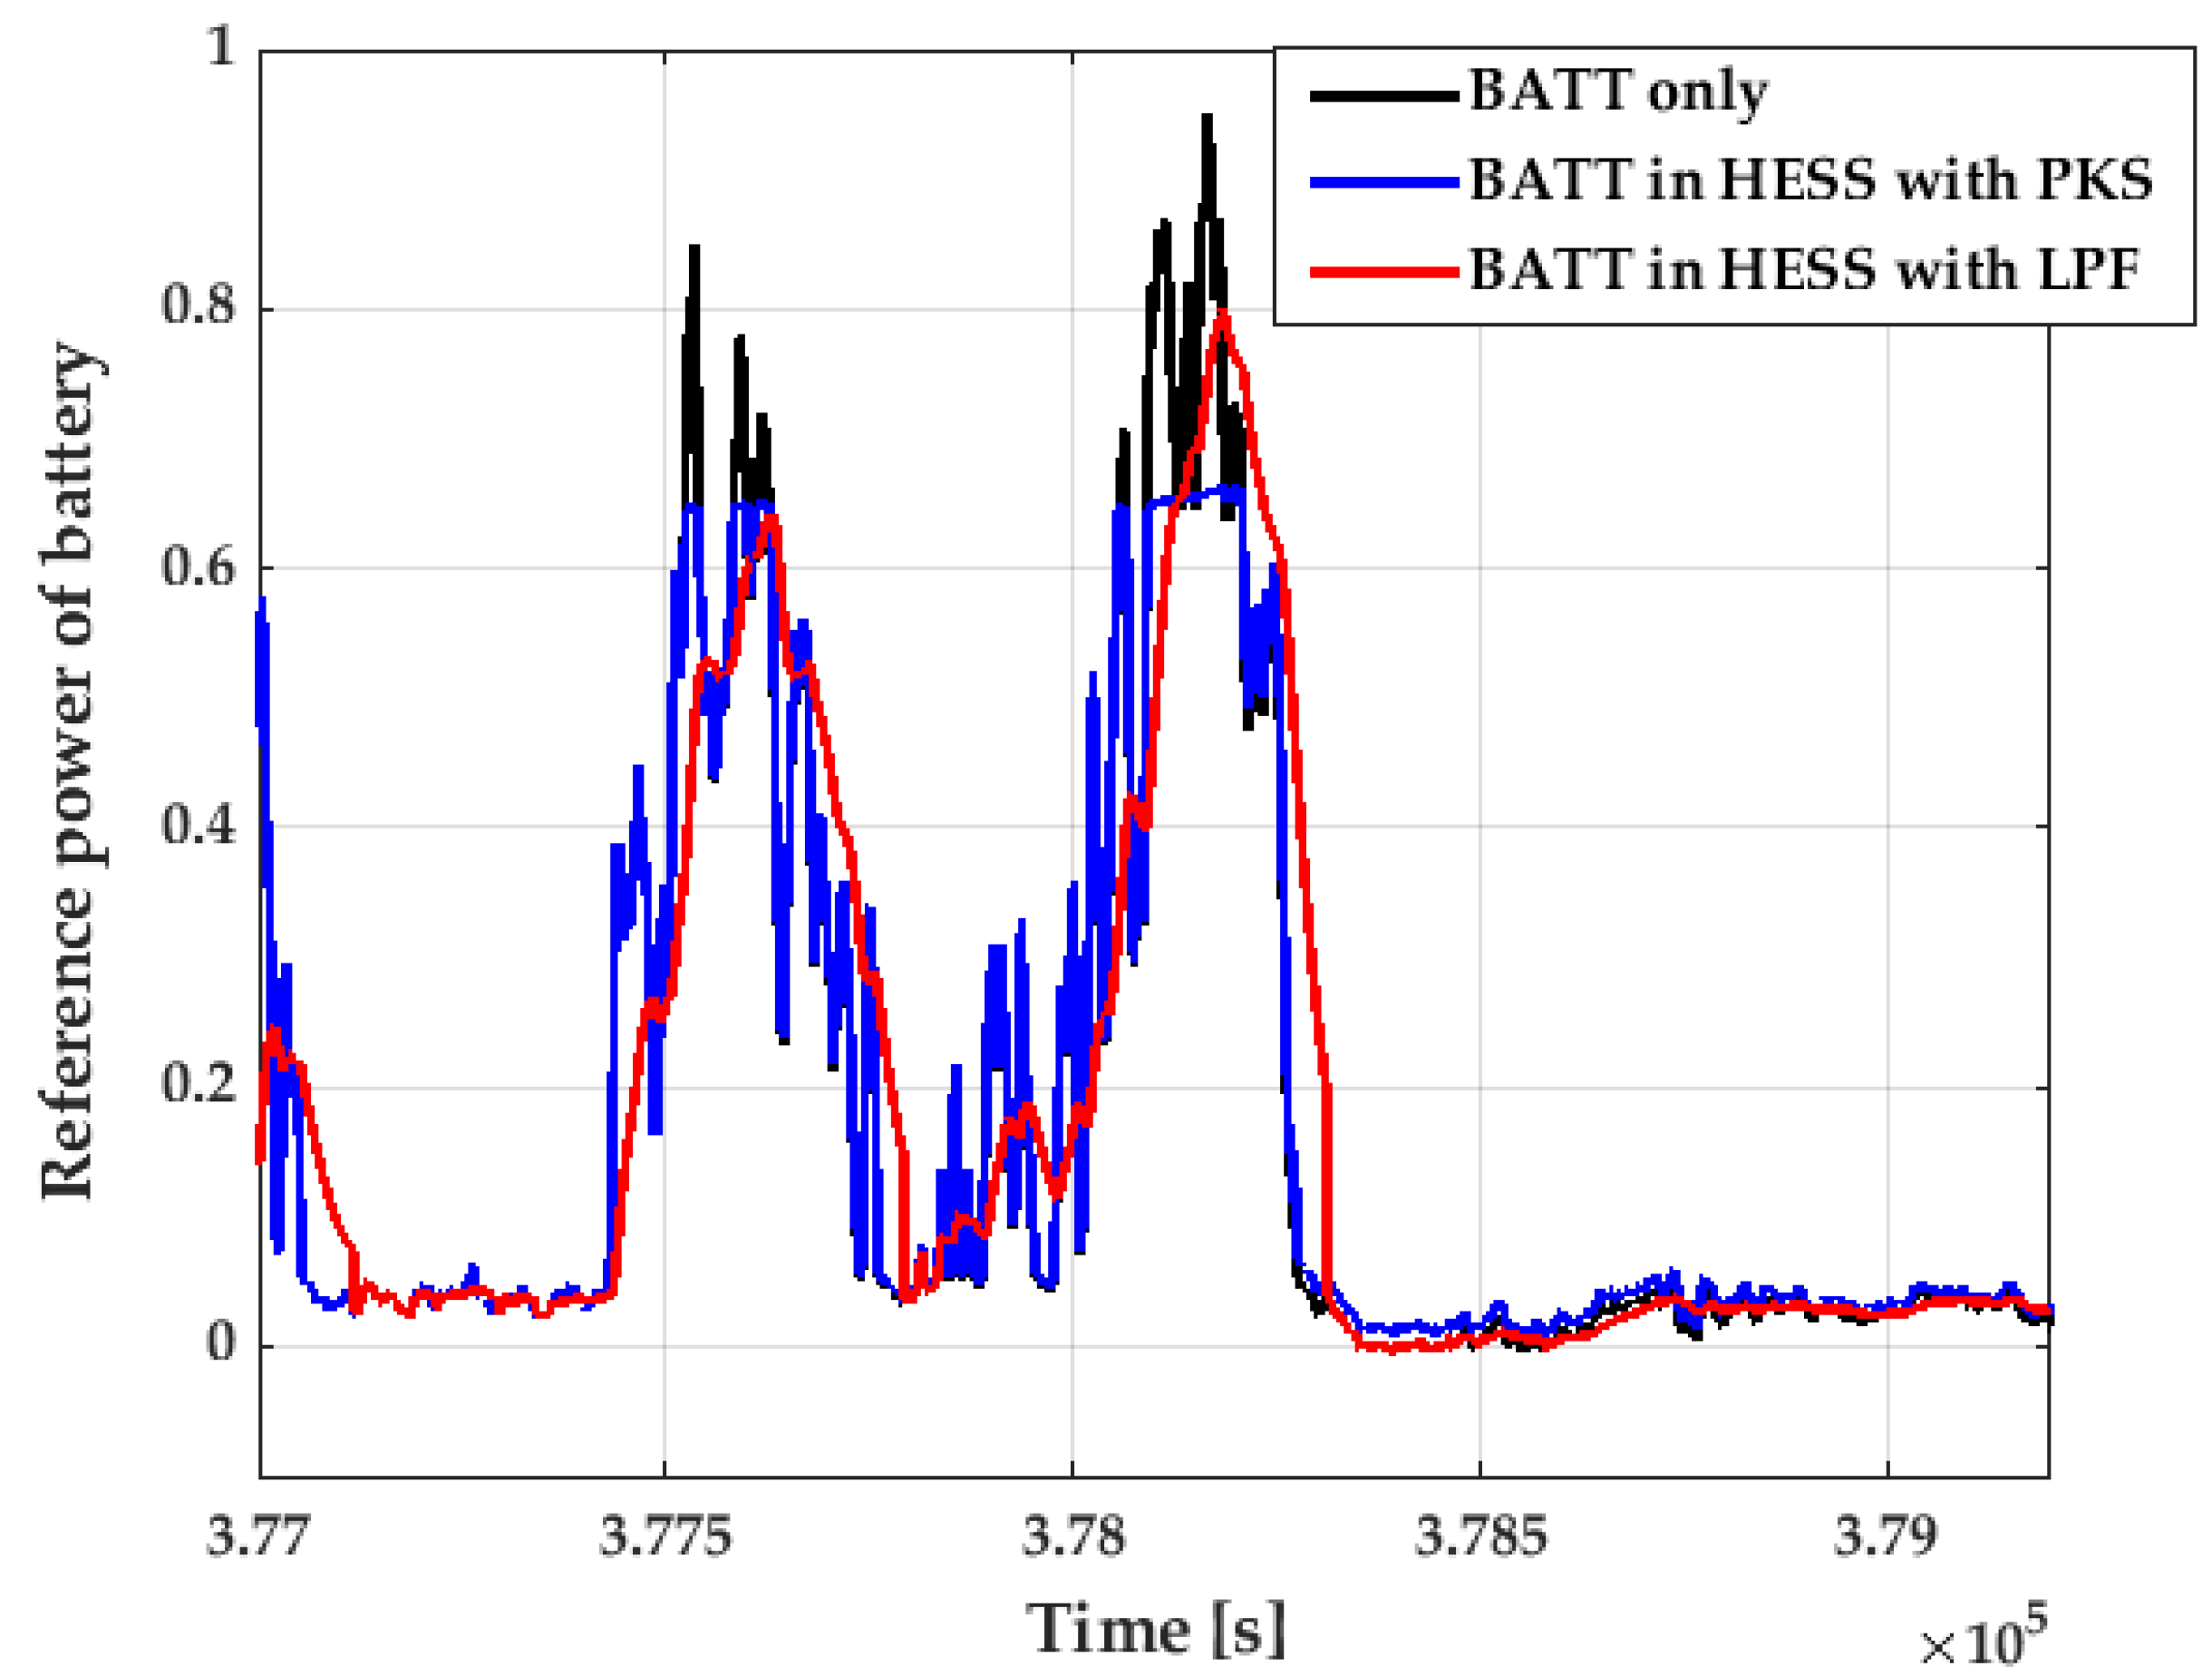
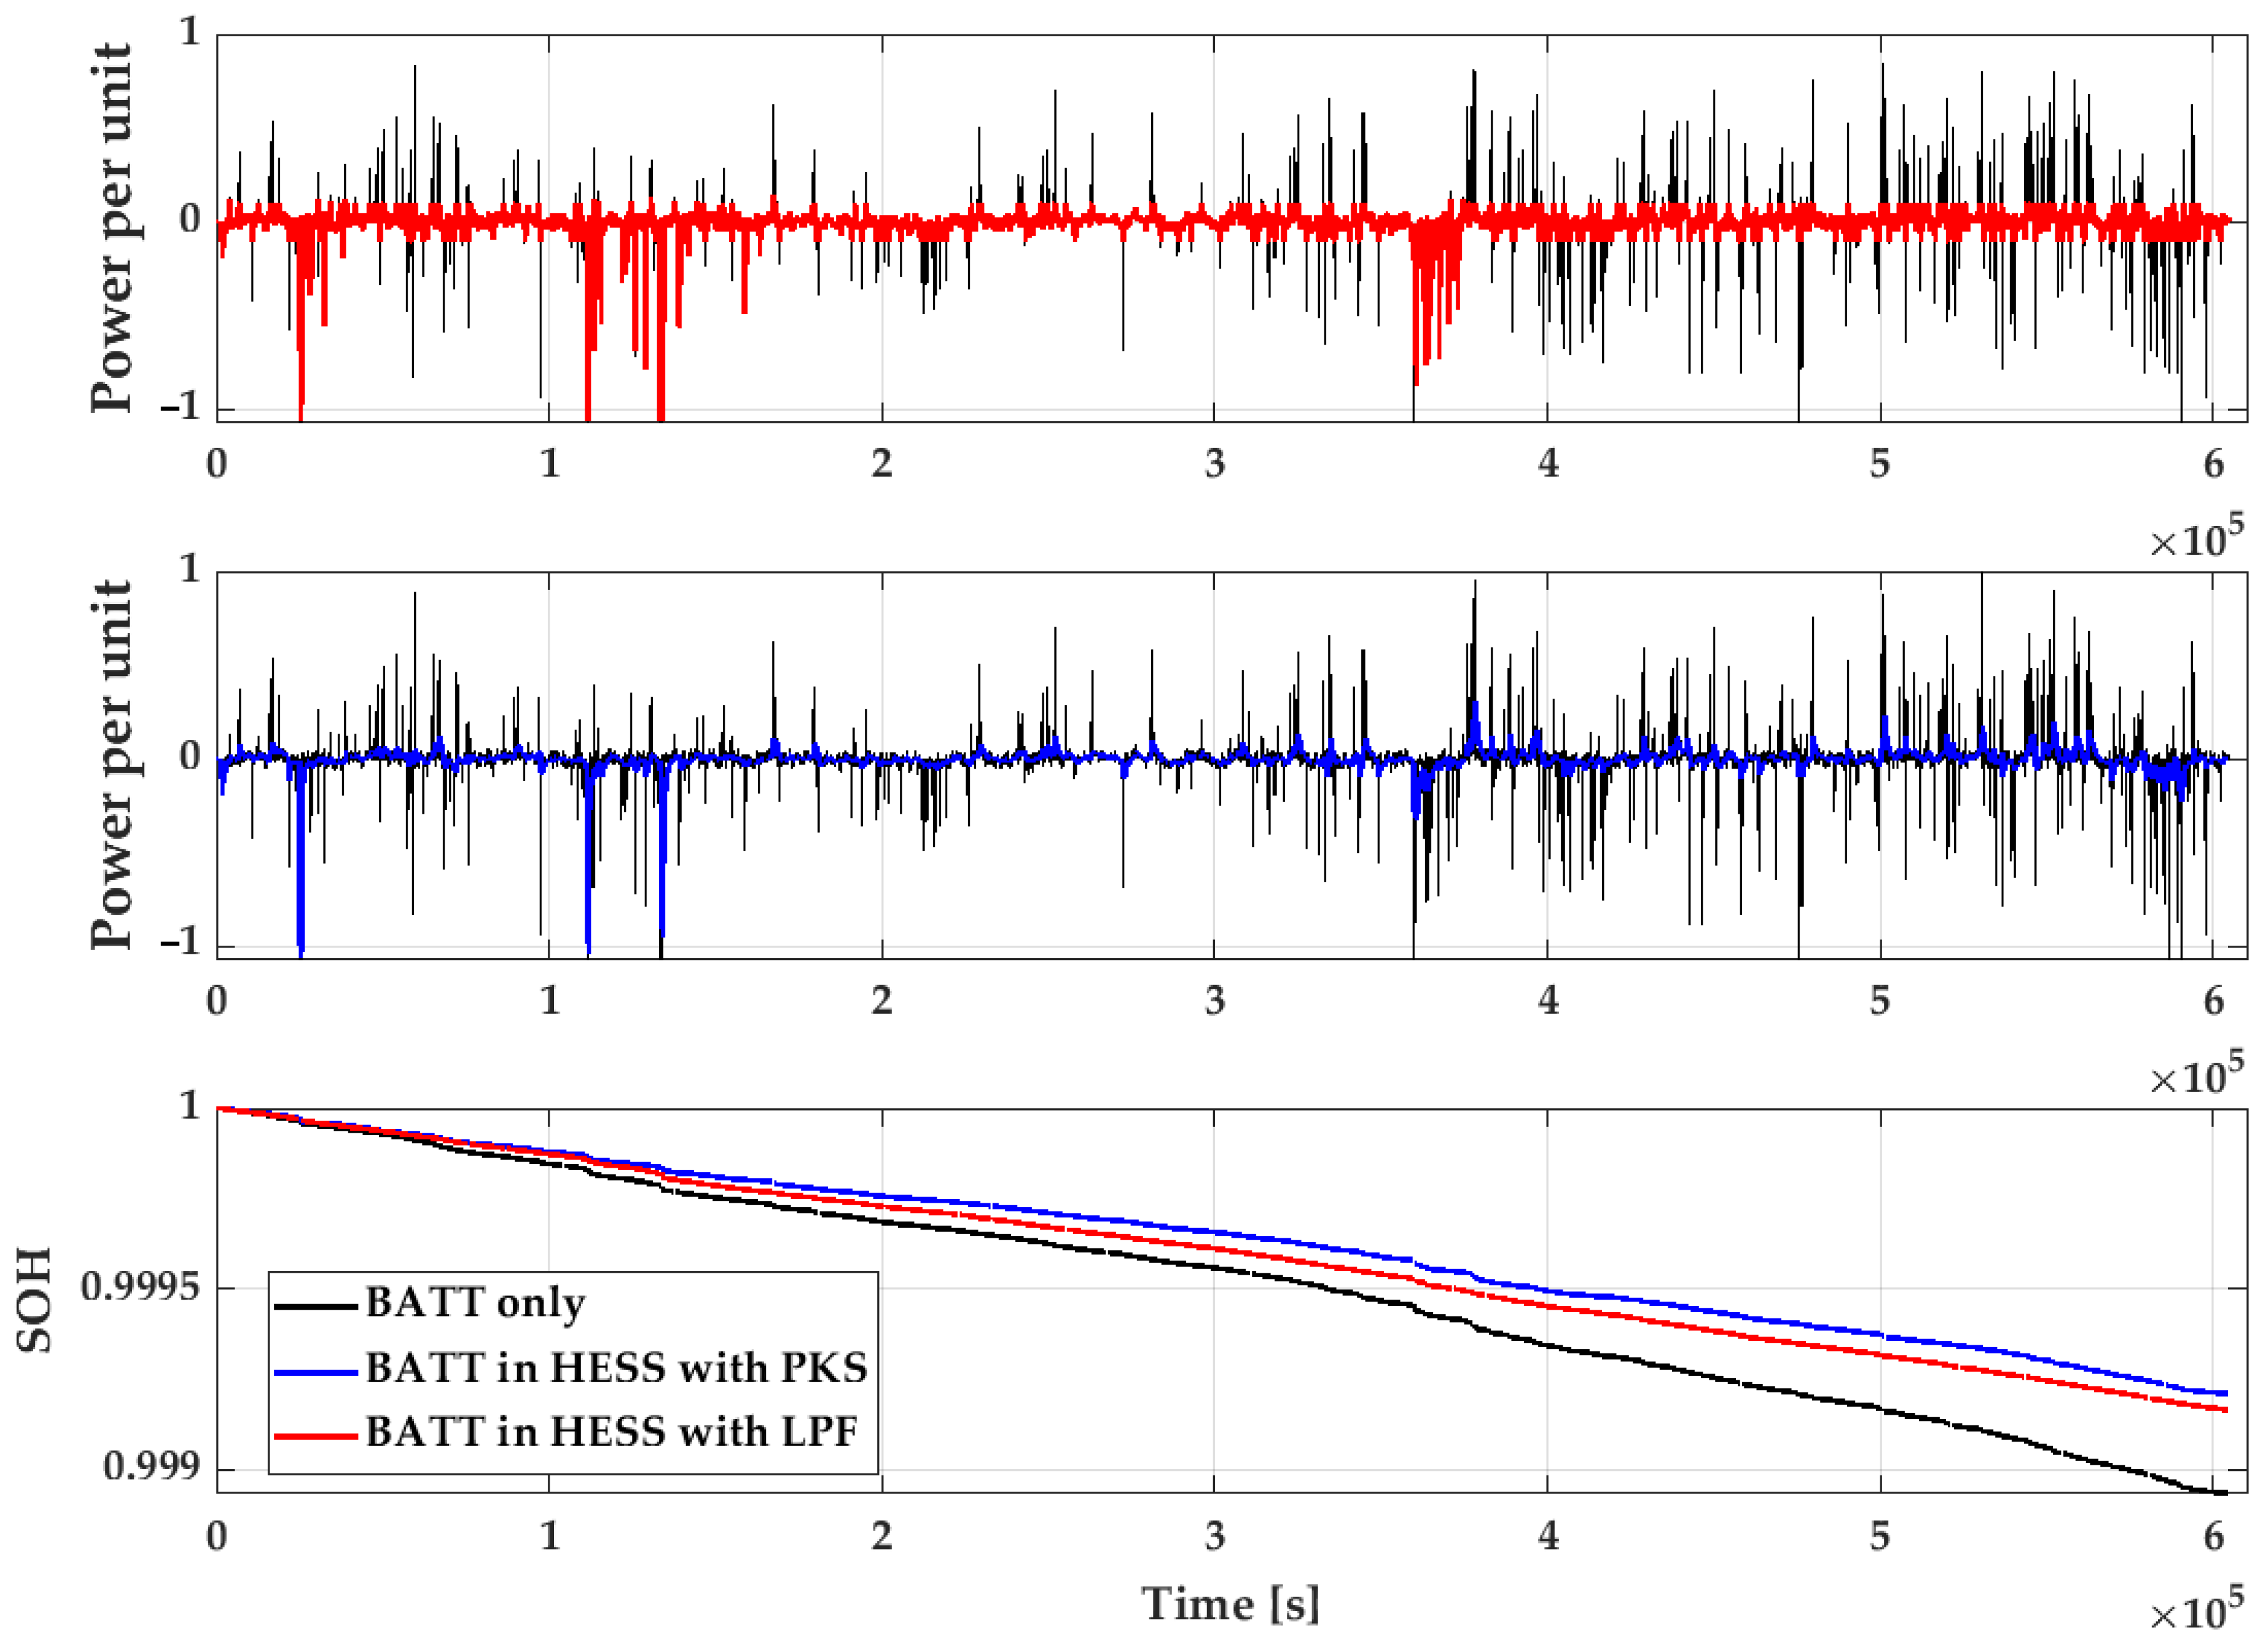
5.2. Results of Case Study

The results of the analysis provided by the design toolbox are shown in Figure 15. The blue point represents the battery-only reference system dimensioned according to the maximum charging power from the load profile. Each point on the curves in Figure 15 is calculated for a specific HESS, with specific tuning parameters of the power-sharing algorithm and resulting required sizes of battery and SC module. The values are normalized by those of the battery-only system. The minimum-cost HESS system is shown as a red point to the left, reflecting both a considerably reduced system cost and lifetime.
Battery Size Reduction: The curves between the red point (minimum-cost system) and blue point (battery-only reference system) have been calculated by running simulations for different degrees of power sharing between the battery and the SC module. It is evident that the peak-shaving approach within this range leads to higher cost reductions than the LPF approach. If a given lifetime below 1 is sufficient, the optimum cost system is a HESS with a smaller battery size, where the capacity of the SC module and the size of the battery can be obtained from the plots.
Lifetime Prolongation: If normalized lifetimes larger than 1 are to be achieved, the HESS approach can be chosen as well. In the investigated case, the battery size was kept at the normalized reference value 1. However, it can be seen that considerably larger SC module capacities are required to achieve lifetime prolongation, compared to reducing battery size. In the range of lifetime prolongation, the LPF control strategy appears to perform better than the PKS approach.
Figure 16 illustrates the normalized cost comparison between the battery-only system (indicated as blue point in Figure 15) and the HESS system with a minimum investment cost (expressed by the red point in Figure 15). The battery cost was calculated from the price of the considered Samsung cell available on the market, and the cost of the SC was sourced from reference [10].
As shown by the results in Figure 15 and Figure 16, the minimum cost of a HESS for the DM service in the UK is 20% less than that for the battery-only system. According to the computation of the toolbox, de-sizing the battery in the HESS system results in a shortened lifetime, as each cell in the battery is charged with larger current rates, compared to the battery-only system. Alternatively, the lifetime of the battery in the HESS can be extended by maintaining the battery size. In this scenario, additional SCs can smooth out the charging (or discharging) power peaks, thereby reducing the aging of the battery. Collectively, this case study serves as an example to explain the framework of this toolbox.
Besides the investigated NMC Samsung LIB, lithium–iron–phosphate (LFP) LIB batteries are also commonly applied in grid support applications [3,34,35], typically offering more cycles and a longer lifetime than NMC LIBs [36,37]. For this type of cell, the results in terms of lifetime and cost calculated by the toolbox could be very different compared to the results shown in Figure 15. However, due to the long lifetime of LFP LIBs, accomplishing the essential battery measurements, including degradation effects, would require a considerably longer time for this cell type, which was beyond the scope of this research project.

6. Conclusions and Outlook

For HESSs, different energy storage technologies are combined and integrated with suitable interfaces, such as power electronic devices. On the one hand, this tends to add complexity and costs, as compared to using a single storage technology. On the other hand, it also increases the number of design variables, providing more freedom or flexibility to customize the system to a specific application. The main challenge is to devise an optimal system design that achieves lower costs and a longer lifetime for a specific use case.
For that purpose, particularly for the combination of battery and SCs, a design tool has been developed and described in this paper. It is intended to support the design of HESSs for specific applications, considering battery degradation, system size, and cost.
The applied PEC model for LIBs has been explained and parameterized. The model has shown a high accuracy, validated by numerous experiments. It is demonstrated that integrating non-empirical physical–electrochemical (PEC) degradation models as part of the tool in a systematic design process for a HESS is beneficial and enhances its credibility.
Within the design tool framework, simulations are conducted for various points in the design space. These points are defined by the sizing of the battery, SC module, and DC-DC converter, as well as different tuning parameters of the energy management system. This approach allows for exploring and quantifying the trade-offs between investment cost and battery degradation in HESS design, thereby facilitating the identification of the most suitable system for the specific requirements.
The role of the toolbox has been demonstrated through an example use case in the field of dynamic grid frequency support. The example results are shown in Figure 15 and Figure 16. However, the results highly depend on the type of battery cells, the system topology, and the cost parameters. Note that the costs of batteries, supercapacitors (SCs), and DC-DC converters in this paper are sourced from existing references and may differ from actual device prices. The type of cell (e.g., NMC or LFP for LIB cells), battery/SC price per kWh, and DC-DC converter price per kW should be determined based on the specific application of the HESS.
Beyond the grid support application discussed in detail in the case study in this paper, the tools and methods presented have been also applied to various real-world automotive, transport, and construction machine applications, which are reported by Mödl et al. in [38].

Author Contributions

Writing—original draft, Methodology, Project administration: W.S.; Writing—review and editing, Methodology, Formal analysis: M.S. (Michael Schwalm); Writing—review and editing, Conceptualization: M.S. (Martin Shan). All authors have read and agreed to the published version of the manuscript.

Funding

The presented research was carried out in the joint research project “SuKoBa—Super capacitors for lifetime optimization of battery hybrid systems”, funded by the Federal Ministry for Economic Affairs and Climate Action (BMWK) of Germany, grant No. FKZ 03EI3033C The authors thank the BMWK for the funding support.

Data Availability Statement

The raw data supporting the conclusions of this article will be made available by the authors on request. Commercial restrictions apply to the models and software used in this paper.

Acknowledgments

The authors thank their colleagues Peter Loepelmann, Viktor Schmidt, Julian Daus, Tatjana Dabrowski, Benedikt Schäfer, and Chiaqian Tong for supporting this work and for efforts on reviewing, software programming, and cooperation work in the laboratory.

Conflicts of Interest

The authors declare no conflicts of interest. The funders had no role in the design of the study; in the collection, analyses, or interpretation of data; in the writing of the manuscript; or in the decision to publish the results.

References

  1. Khalid, M. A Review on the selected application of battery-supercapacitor hybrid energy storage. Energies 2019, 12, 4559. [Google Scholar] [CrossRef]
  2. Jing, W.L.; Lai, C.H.; Wallace, S.H.; Wong, M.I.; Wong, D. A comprehensive study of battery-supercapacitor hybrid energy storage system for standalone PV power system in rural electrification. Appl. Energy 2018, 224, 340–356. [Google Scholar] [CrossRef]
  3. Hesse, H.C.; Schimpe, M.; Kucevic, D.; Jossen, A. Lithium-Ion battery storage for the grid-A review of stationary battery storage system design tailored for applications in modern power grid. Energies 2017, 10, 2107. [Google Scholar] [CrossRef]
  4. Meng, J.; Luo, G.; Ricco, M.; Swierczynski, M.; Stroe, D.; Teodorescu, R. Overview of Lithium-Ion battery modelling methods for State-of-Charge estimation in electrical vehicles. Appl. Sci. 2018, 8, 659. [Google Scholar] [CrossRef]
  5. Brivio, C.; Mandelli, S.; Merlo, M. Battery energy storage system for primary control reserve and energy arbitrage. Sustain. Energy Grid Netw. 2016, 6, 152–165. [Google Scholar] [CrossRef]
  6. ESO. New Dynamic Services (DC/DM/DR). 2024. Available online: https://www.nationalgrideso.com/industry-information/balancing-services/frequency-response-services/new-dynamic-services-dcdmdr (accessed on 10 February 2024).
  7. Zhang, C.; Wang, D.; Wang, B.; Tong, F. Battery degradation minimization-oriented hybrid energy storage system for electric vehicles. Energies 2020, 13, 246. [Google Scholar] [CrossRef]
  8. Yi, F.; Lu, D.; Wang, X.; Pan, C.; Tao, Y.; Zhou, J.; Zhao, C. Energy management strategy for hybrid energy storage electric vehicles based on pontryagin’s minimum principle considering battery degradation. Sustainability 2022, 14, 1214. [Google Scholar] [CrossRef]
  9. Vulturescu, B.; Butterbach, S.; Forgez, C.; Coquery, G.; Freidich, G. Ageing study of a supercapacitor-battery storage system. In Proceedings of the ICEM 2010, Rome, Italy, 6–8 September 2010. [Google Scholar]
  10. Sahin, M.E.; Blaabjerg, F. A hybrid PV-battery/supercapacitor system and a basis active power control proposal in MATLAB/Simulink. Electronic 2020, 9, 129. [Google Scholar] [CrossRef]
  11. Wang, J.; Purewal, J.; Liu, P.; Hicks-Garner, J.; Soukazian, S.; Sherman, E.; Sorenson, A.; Vu, L.; Tataria, H.; Verbrugge, M.W. Degradation of lithium-ion batteries employing graphite negatives and nickel-cobalt-manganese oxide spinel manganese oxide positives: Part 1, aging mechanisms and life estimation. J. Power Sources 2014, 269, 937–948. [Google Scholar] [CrossRef]
  12. Xu, B.; Oudalov, A.; Ulbig, A.; Andersson, G. Modelling of Lithium-Ion battery degradation for cell life assessment. IEEE Trans. Smart Grid 2016, 9, 1131–1140. [Google Scholar] [CrossRef]
  13. Newman, J.; Thomas, K.E.; Hafezi, H.; Wheeler, D.R. Modelling of lithium-ion batteries. J. Power Sources 2003, 119–121, 838–843. [Google Scholar] [CrossRef]
  14. Newman, J.; Thomas-Alyea, K.E. Electrochemical Systems, 3rd ed.; Electrochemical Society Series; John Wiley & Sons: Hoboken, NJ, USA, 2004. [Google Scholar]
  15. Doyle, M.; Newman, J. The use of mathematical modelling in the design of lithium/polymer battery systems. Electrochem. Acta 1995, 40, 2191–2196. [Google Scholar] [CrossRef]
  16. He, W.; Pecht, M.; Flynn, D.; Dinmohammdi, F. A physic-based electrochemical model for lithium battery State-of-Charge estimation solved by an optimised projection-based method and moving window filter. Energies 2018, 11, 2120. [Google Scholar] [CrossRef]
  17. Smith, K.W.C.-Y. Solid-state diffusion limitations on pulse operation of a lithium-ion cell for hybrid electric vehicles. J. Power Sources 2006, 161, 628–639. [Google Scholar] [CrossRef]
  18. Liu, L.; Park, J.; Lin, X.; Sastry, A.M.; Lu, W. A thermal-electrochemical 185 model that gives spatial-dependent growth of solid electrolyte interphase in a Li-ion battery. J. Power Sources 2014, 268, 482–490. [Google Scholar] [CrossRef]
  19. Maheshwari, A.; Heck, M.; Santarelli, M. Cycle aging studies of lithium nickel manganese cobalt oxide-based batteries using electrochemical impedance spectroscopy. Electrochim. Acta 2018, 273, 335–348. [Google Scholar] [CrossRef]
  20. Käbitz, S.; Gerschler, J.B.; Ecker, M.; Yurdagel, Y.; Emmermacher, B.; André, D.; Mitsch, T.; Sauer, D.U. Cycle and calendar life study of a graphite |LiNi1/3Mn1/3Co1/3O2|Li-ion high energy system. Part A: Full cell characterization. J. Power Sources 2013, 239, 572–583. [Google Scholar] [CrossRef]
  21. Zhang, Q.; Wang, D.; Yang, B.; Cui, X.; Li, X. Electrochemical model of lithium-ion battery for wide frequency range applications. Electrochim. Acta 2020, 343, 136094. [Google Scholar] [CrossRef]
  22. Grün, T.; Smith, A.; Ehrenberg, H.; Doppelbauer, M. Passive hybrid storage systems: Influence of circuit and system design on performance and lifetime. Energy Procedia 2018, 155, 336–349. [Google Scholar] [CrossRef]
  23. Skogestad, S.; Postlethwaite, I. Multivariable Feedback Control: Analysis and Design, 2nd ed.; Wiley: Hoboken, NJ, USA, 2005; ISBN 978-0-470-01167-6. [Google Scholar]
  24. Kazmierkowski, M.P.; Malesani, L. Current control techniques for three-phase voltage-source PWM converters: A survey. IEEE Trans. Ind. Electron. 1998, 45, 691–703. [Google Scholar] [CrossRef]
  25. Rao, R.K.; Srinivas, P.; Kumar, M.V.S. Design and analysis of various inverters using different PWM techniques. In Proceedings of the International Conference on Innovations in Electrical & Electronics Engineering (ICIEEE-2014), IJES Special Issue 2014, London, UK, 2–4 July 2014; pp. 41–51. [Google Scholar]
  26. Keerthana, M.; Manoharan, P.S.; Ravi, A. Design of control strategy for battery-supercapacitor hybrid storage system. In Proceedings of the 2022 7th International Conference on Communication and Electronics Systems (ICCES), Coimbatore, India, 22–24 June 2022; pp. 798–803. [Google Scholar] [CrossRef]
  27. Rahmoun, A.; Biechl, H. Modelling of Li-Ion batteries using equivalent circuit diagrams. Prz. Elektrotechniczny 2012, 88, 152–156. [Google Scholar]
  28. Navas, S.J.; Gonzalez, G.M.C.; Pino, F.J.; Guerra, J.J. Modelling Li-ion batteries using equivalent circuits for renewable energy applications. Energy Rep. 2023, 9, 4456–4465. [Google Scholar] [CrossRef]
  29. He, X.; Zhang, X. A comprehensive review of supercapacitors: Properties, electrodes, electrolytes and thermal management systems based on phase change materials. J. Energy Storage 2022, 56, 106023. [Google Scholar] [CrossRef]
  30. Joshi, P.S.; Sutrave, D.S. Supercapacitor: Basics and Overview. J. Inf. Comput. Sci. 2019, 9, 609–625. [Google Scholar]
  31. Rajan, R.S.; Rahman, M.M. Lifetime analysis of super capacitor for many power electronics applications. IOSR-JEEE 2014, 9, 55–58. [Google Scholar] [CrossRef]
  32. ESO System Frequency. Available online: https://www.nationalgrideso.com/data-portal/system-frequency-data (accessed on 10 February 2024).
  33. Engels, J.; Claessens, B.; Deconinck, G. Optimal combination of frequency control and peak shaving with battery storage system. IEEE Trans. Smart Grid 2020, 11, 3270–3279. [Google Scholar] [CrossRef]
  34. Sankaran, G.; Venkatesan, S. An Overview of Lithium-Ion Batteries for Electric Mobility and Energy Storage Applications; IOP Conference Series: Earth and Environmental Science, Volume 1042; IOP Publishing Ltd.: Bristol, UK, 2022. [Google Scholar] [CrossRef]
  35. Nitta, N.; Wu, F.; Lee, J.T.; Yushin, G. Li-ion battery materials: Present and future. Materialstody 2015, 18, 252–264. [Google Scholar] [CrossRef]
  36. Chen, T.; Jin, Y.; Lv, H.; Yang, A.; Liu, M.; Chen, B.; Xie, Y.; Chen, Q. Applications of lithium-Ion batteries in grid-scale energy storage systems. Trans. Tianjing Univ. 2020, 26, 208–217. [Google Scholar] [CrossRef]
  37. Choi, D.; Shamin, N.; Crawfor, A.; Huang, Q.; Vartanian, C.K.; Viswanathan, V.V.; Paiss, M.D.; Alam, M.; Reed, D.M.; Sprenkle, V.L. Li-ion battery technology for grid application. J. Power Source 2021, 511, 230419. [Google Scholar] [CrossRef]
  38. Mödl, R.; Braun, A.; Kallis, L. Simulation and Evaluation of Battery Aging in Electric Hybrid Storage Systems; SAE Technical Paper 2024-01-2903; SAE: Warrendale, PA, USA, 2024. [Google Scholar] [CrossRef]
Figure 1. Schematic structure of design tool.
Energies 17 03481 g001
Figure 2. Bode plots for measurements and simulations at (a) 25   ° C and (b) 45   ° C .
Energies 17 03481 g002
Figure 3. (a) Current from pulse test ( 10   s); voltage from measurements and simulation: (b) at 45   ° C and S O C s of 80 % ,   60 % ,   40 % ,   20 % ; (c) at 25   ° C and S O C s of 80 % ,   60 % ,   40 % ,   20 % ; and (d) at 0   ° C and S O C s of 80 % ,   60 % ,   40 % ,   20 % .
Energies 17 03481 g003
Figure 4. Constant current test 2 C discharging, 1 C charging: (a) discharging at 10   ° C and charging at 0   ° C (LIB not allowed to charge under 0   ° C ); (b) at 12.5   ° C ; (c) at 25   ° C ; (d) at 40   ° C .
Energies 17 03481 g004
Figure 5. Validation of calendric aging over almost two years: (a) at 10   ° C ; (b) at 20   ° C ; (c) 45   ° C ; (d) at 60   ° C .
Energies 17 03481 g005
Figure 6. Validation of cyclic aging: (a) Full cycles, charging with current rate 0.5   C , discharging with current rate 1   C at 25   ° C . (b) Full cycles, charging with current rate 0.5   C , discharging with current rate 0.2   C at 35   ° C . (c) Quarter cycles and S O C changed from 0 % to 25 % , charging with current rate 0.5   C , discharging with current rate 1   C at 10   ° C . (d) Quarter cycles and S O C changed from 75 % to 100 % , charging with current rate 0.5   C , discharging with current rate 1   C at 45   ° C .
Energies 17 03481 g006
Figure 7. Types of battery/SC HESS topologies.
Energies 17 03481 g007
Figure 8. Detailed controller configuration of semi-active HESS.
Energies 17 03481 g008
Figure 9. Simulation results of battery required power in HESS with peak shaving (PKS) and low-pass filter (LPF), compared to reference power of battery-only system.
Energies 17 03481 g009
Figure 10. Inputs and outputs of optimal design toolbox.
Energies 17 03481 g010
Figure 11. Example of t S C ( P B a t t m a x ) curves for a number of load cycles. Red dotted line: maximum envelope curve for all cycles.
Energies 17 03481 g011
Figure 12. HESS size design combinations with investment cost. Red dotted line: maximum envelope curve for all cycles; blue dotted lines: lines of constant cost; black dotted line: energy of SC module for minimum system cost.
Energies 17 03481 g012
Figure 13. Grid frequency deviation in continental Europe and UK for same time period [32].
Energies 17 03481 g013
Figure 14. Simulation results from HESS based on DM service in UK.
Energies 17 03481 g014
Figure 15. System cost and capacity of HESS corresponding to battery lifetime.
Energies 17 03481 g015
Figure 16. Optimum cost of HESS compared to battery-only system.
Energies 17 03481 g016
Table 1. Technical data comparison between primary regulation in EU and dynamic services in UK [6].
TopicPRDMDCDR
Speed of response30 s1 s1 s2 s
Initial time5 s0.5 s0.5 s10 s
Deadband
(delivery %)
± 15 mHz
(0%)
Knee pointno knee pointwith knee
point
with knee
point
no knee point
Initial linear range
(delivery %)
none ± 15–100 mHz
(0–5%)
± 15–200 mHz
(0–5%)
none
Linear range
(delivery %)
± 15–200 mHz
(0–100%)
± 100–200 mHz
(5–100%)
± 2 00–500 mHz
(5–100%)
± 15–200 mHz
(0–100%)
Delivery
Duration
15
min
30
min
15
min
60
min
Disclaimer/Publisher’s Note: The statements, opinions and data contained in all publications are solely those of the individual author(s) and contributor(s) and not of MDPI and/or the editor(s). MDPI and/or the editor(s) disclaim responsibility for any injury to people or property resulting from any ideas, methods, instructions or products referred to in the content.

