Abstract
Battery voltage plateau characteristics are crucial for designing and controlling battery management systems. Utilising the plateau period attributes to their fullest extent can enable optimal battery control, enhance battery performance, and prolong battery lifespan. This research aimed to investigate the performance of cylindrical ternary lithium batteries at various discharge rates, focusing on the variations in terminal voltage, capacity, and temperature. The battery performance at different discharge rates was meticulously examined through cyclic charge/discharge experiments. The convexity of the voltage curve was used to analyse the voltage plateau characteristics at different rates. The findings revealed significant differences in battery performance under varying discharge rates. Higher discharge rates resulted in shorter discharge times and lower battery voltages at corresponding residual capacities. The discharge time, capacity, and voltage during the plateau phase decreased as the discharge rate increased. At discharge rates of 1 C, 3 C, 5 C, 7 C, 9 C, and 11 C, the proportion of discharged battery capacity ranged from 86.45% to 78.42%. At the same time, voltage and temperature variations during the plateau period decreased significantly compared to those before and after discharge. This research provides a crucial reference point for advancing battery design and thermal management systems.
1. Introduction
With the rapid development of electric vehicles, high-energy-density batteries as the primary power source have garnered significant attention [1]. The dominant power batteries employed in electric vehicles are nickel–metal hydride batteries, nickel–cadmium batteries, lead-acid batteries, and lithium batteries. Among these options, lithium batteries are widely used in electric vehicles due to their high energy density, low self-discharge rate, lack of memory effect, energy efficiency, environmental friendliness, and excellent cycle performance (typically more than 1000 charge and discharge cycles), as well as their strong adaptability to various operating conditions (usually able to withstand temperature ranges from −20 °C to 60 °C) [2,3]. With the advancement of differential electric hybrid vehicles, the demand for lithium-ion batteries to discharge at high rates is increasing. These demands are becoming increasingly stringent, requiring batteries to maintain a stable and reliable performance over a more comprehensive range of discharge rates.
During the battery discharging process, the voltage plateau period is crucial for estimating the state of charge (SOC). This phase is considered optimal and is a significant indicator for assessing battery performance stability and reliability [4]. There is a complex non-linear relationship between battery voltage and the SOC, with the voltage plateau period being the most critical stage. Therefore, accurately estimating the state of charge during this period is highly important [5]. Wide discharge rates, as common operating conditions, have an influence on the performance of the voltage plateau period. The discharge rate represents the rate at which the battery discharges in a unit of time and is usually denoted by C [6]. Higher discharge rates are frequently required in practical applications, such as the acceleration, braking, and climbing of electric cars. Therefore, a deeper understanding of the impact of discharge rates on battery performance and the optimisation of battery design to enhance performance is particularly important [7].
However, research on the impact of wide discharge rates on the battery voltage plateau period is currently relatively limited. As shown in Table 1, researchers have studied the effects of different discharge rates on battery performance. These studies cover variations in the performance of lithium-ion batteries under various operating conditions. Some studies explore the impact of discharge rates, temperature, and cycle count on battery performance, finding that increasing the discharge rate at low temperatures can improve battery discharge capacity. Other studies focus on changes in battery internal resistance with the discharge rate and state of charge and the impact of inconsistency in battery parameters on battery pack performance. Some research also indicates that increasing the content of positive electrode conductive agents and using functional electrolytes can improve batteries’ rapid charge and discharge performance, with synergistic benefits for battery performance. These studies provide essential experimental and theoretical support for optimising the performance and safety of lithium-ion batteries.

Table 1.
Effects of different discharge rates on battery performance.
The table above summarises the research results of various researchers on the impact of discharge rates on the performance of lithium-ion batteries. These studies encompass performance indicators such as battery capacity, heat generation rate, discharge capacity, temperature rise rate, and particle size distribution, offering a profound insight into battery performance. These research findings hold considerable reference value in comprehending the performance of high-energy-density lithium batteries in practical vehicle applications and enhancing battery design and thermal management systems.
Existing research has primarily focused on batteries’ capacity degradation and cycle life at varying discharge rates. However, the impact on the performance of voltage plateau characteristics has not been extensively explored. Unlike lithium iron phosphate batteries, there have been limited systematic experimental investigations into the segmented discharge features of ternary lithium batteries. This scarcity of studies makes optimising the operational stage of lithium batteries in electric vehicles across diverse conditions challenging. Consequently, this research aims to comprehensively examine the influence of broad discharge rates on the voltage plateau performance of cylindrical ternary lithium batteries and elucidate their underlying mechanisms.
Wang et al. [4,23] conducted a study on the effects of different temperature environments on the voltage plateau during the charge and discharge processes of square ternary lithium batteries. They elucidated and analysed the phenomenon of the voltage plateau during the low-rate charge and discharge processes of square ternary lithium batteries. This study focuses on assessing the performance of lithium-ion batteries in electric vehicles throughout various operational stages, such as acceleration and climbing phases. Our research specifically investigates their response to short-term high-load conditions across a range of discharge rates. The experimental design employed in this research provides a comprehensive understanding of battery performance throughout complete discharge cycles at varying discharge rates. The maximum discharge rate supported by the cylindrical ternary lithium battery under study is 11 C. By dividing the battery’s discharge rate using the method of arithmetic progression, a comprehensive cycling experiment within the range of 1 C to 11 C is conducted in a controlled environment at 20 °C. It dissects the variations in voltage, capacity, temperature, and energy of lithium batteries during the discharge process, investigates the distinct characteristics of the voltage plateau during discharge at different rates, and establishes an experimental groundwork for subsequent exploration of the thermal management system of lithium-ion power batteries.
2. Experiments and Methods
2.1. Test Samples and Equipment
Cylindrical lithium-ion batteries are widely recognised in the electric vehicle industry as the preferred battery type due to their high performance, excellent safety record, cost-effectiveness, and reliable market supply chain. This paper selects the INR18650-20R cylindrical ternary lithium battery produced by Samsung of Korea as the test object. It has a rated voltage of 3.6 V, a rated capacity of 2000 mAh, a charge cut-off voltage of 4.2 V, a discharge cut-off voltage of 2.5 V, a maximum charge current of 1 A, a maximum continuous discharge current of 22 A, and an internal resistance of less than 18 mΩ. The experimental platform consists of a Guangdong Sanwood programmable constant temperature and humidity test chamber (model SMC-800-CC-FB), Wuhan LAND precision battery tester (model G340A), LAND battery test system auxiliary channel AT2016B/200T32CP2, and a monitoring system. The precision battery tester G340A collects voltage and current signals with an accuracy of ±0.01%RD ± 0.01%FS and a sampling rate of 100SPS. In contrast, the LAND battery test system auxiliary channel AT2016B/200T32CP2 (K-type thermocouple temperature sensor) measures the battery surface temperature with an accuracy of ±0.4%. The battery test platform is shown in Figure 1.
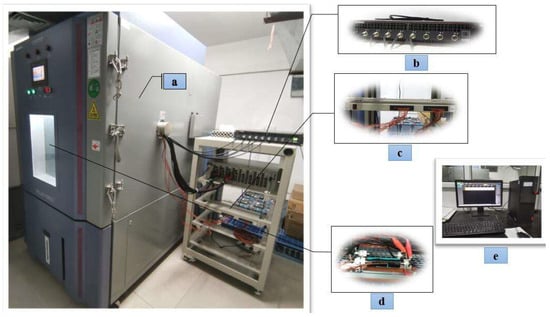
Figure 1.
Test experiment platform: (a) programmable constant temperature and humidity test chamber, (b) precision battery tester, (c) battery test system auxiliary channel, (d) battery fixture, (e) monitoring system.
2.2. Methods
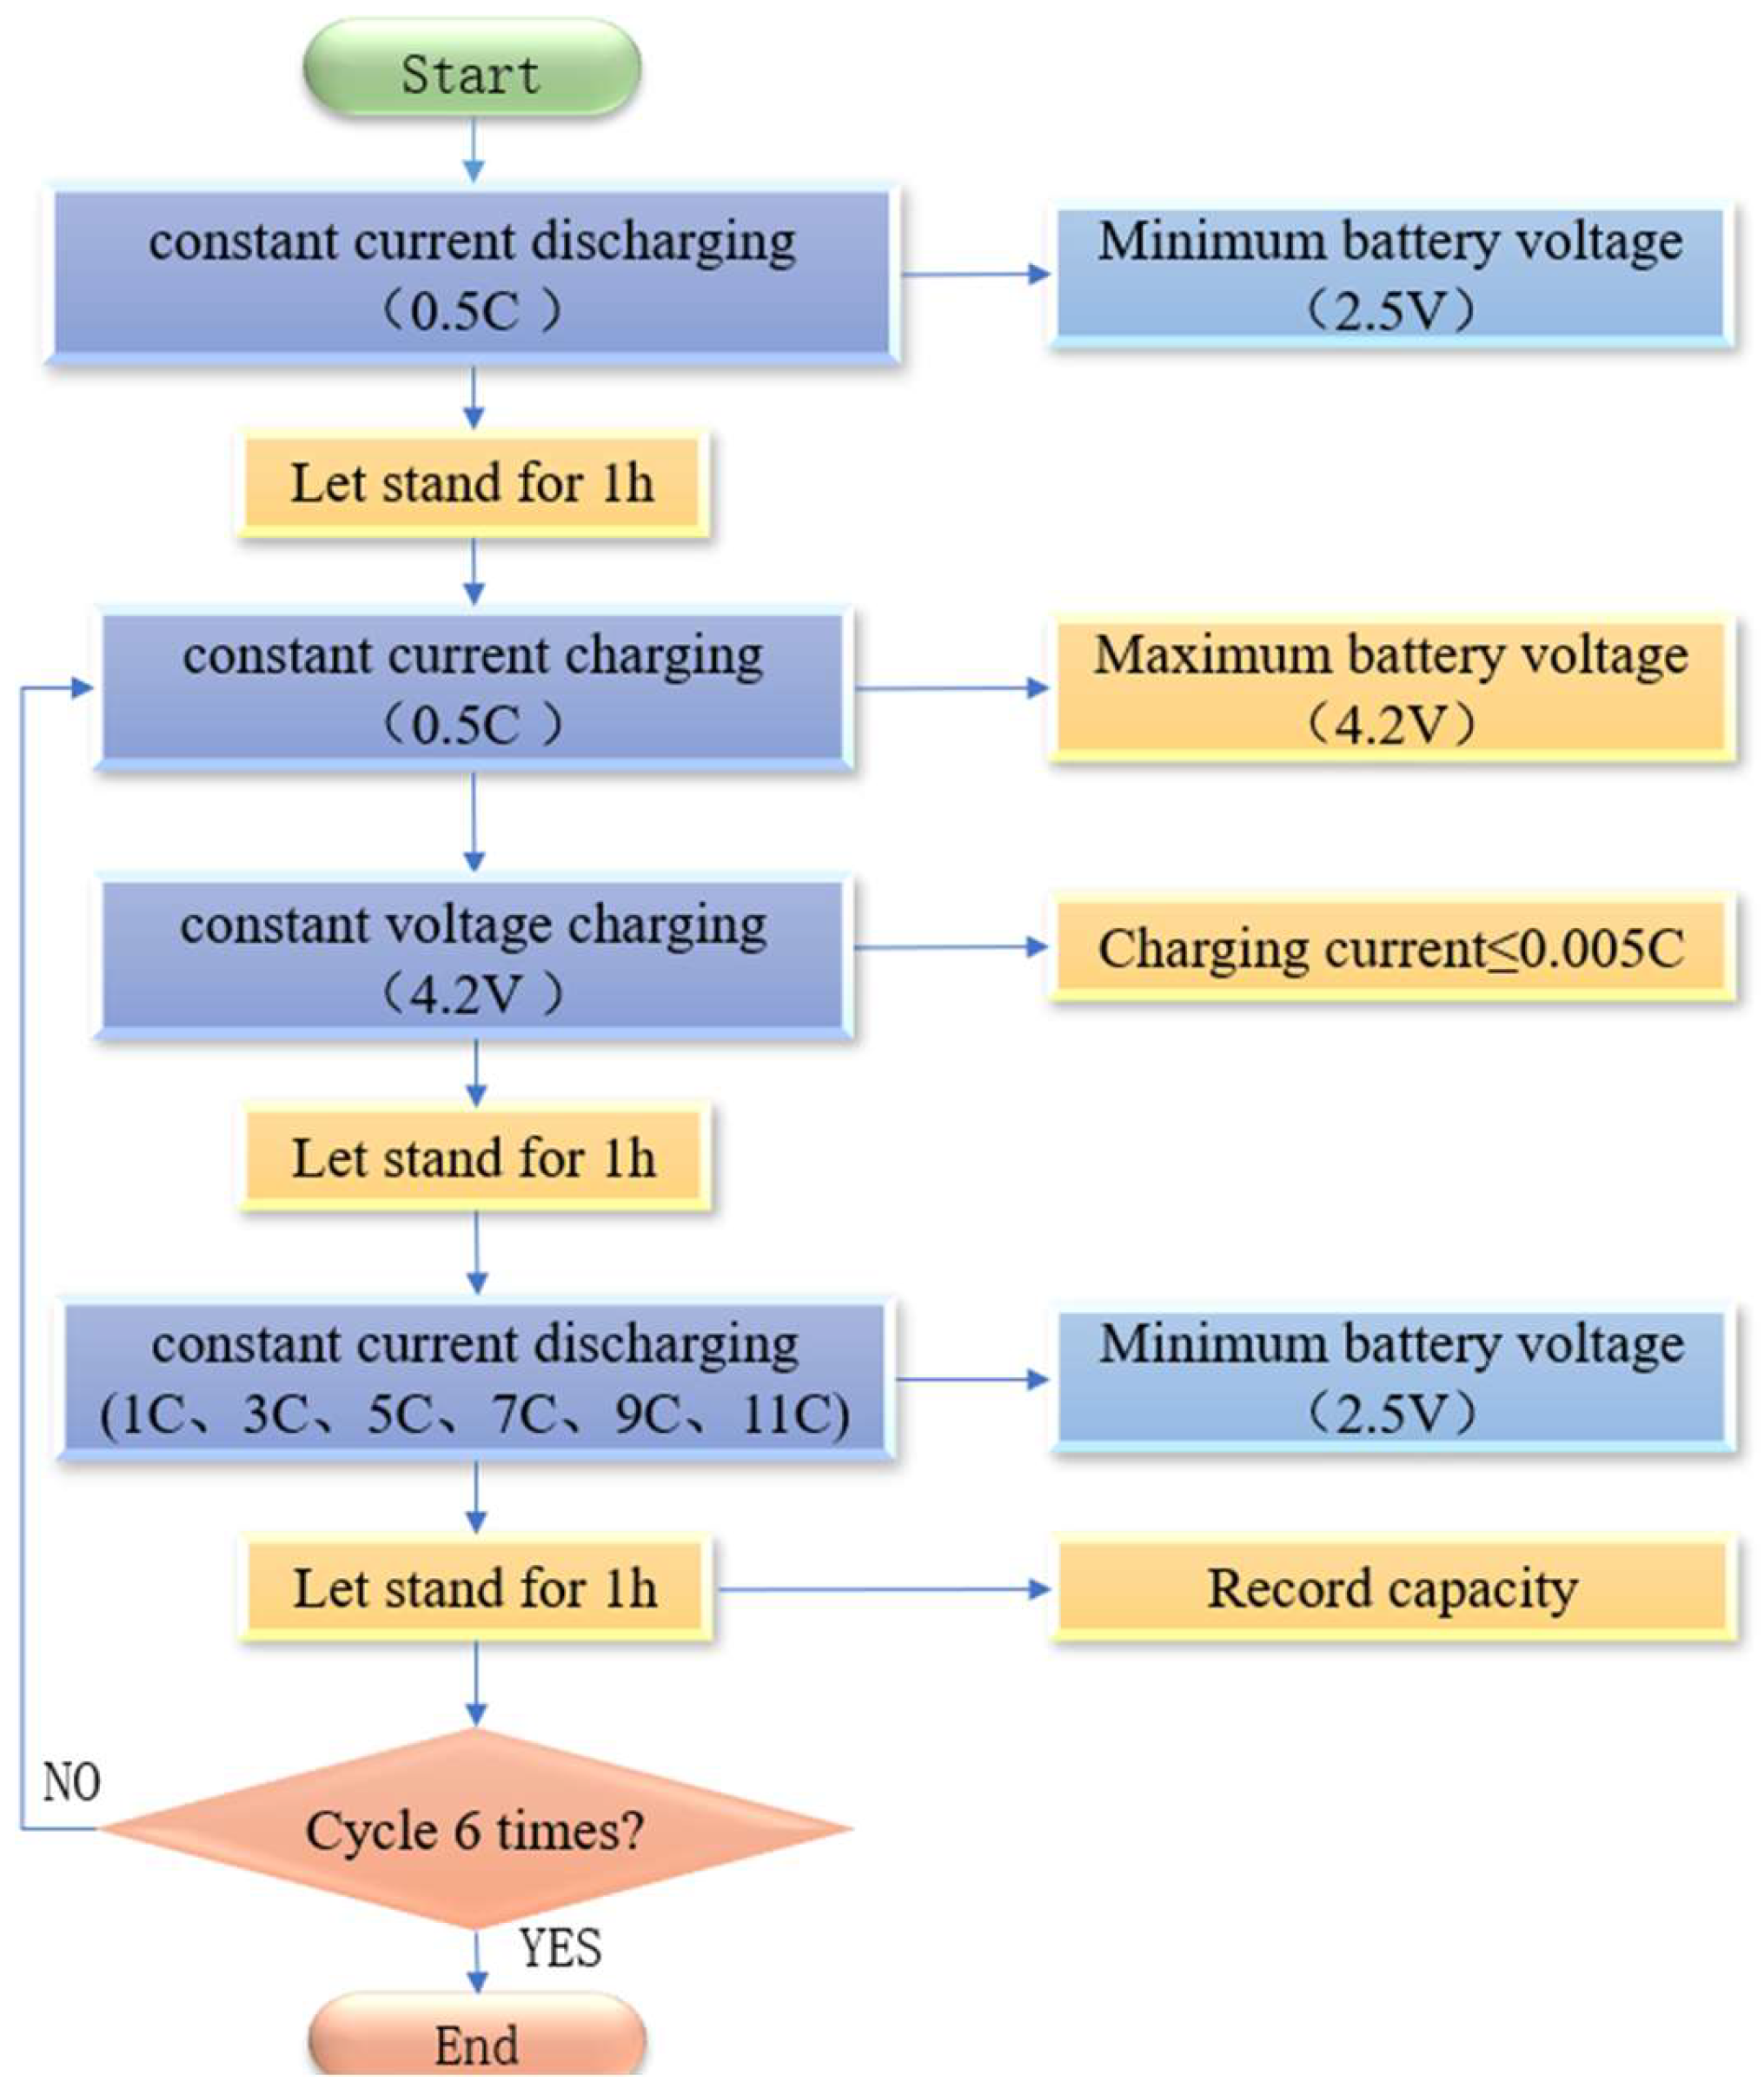
With ambient temperature and charge rate as the input constant and discharge rate as the input variable, the data such as terminal voltage, capacity, energy, and surface temperature of the battery are output. The arrangement of the K-type thermocouple temperature sensor on the battery is shown in Figure 2. The specific experimental procedure is as follows: ① set the temperature of the constant temperature and humidity test chamber to 20 °C, discharge the battery with a 0.5 C constant current to the lower limits of voltage, and leave it for 1 h; ② charge the battery with a 0.5 C constant current to the upper limits of voltage, turn to a 4.2 V constant voltage charging until the charging current ≤ 0.005 C to stop charging, and leave it for 1 h; ③ discharge the battery with a (1 C, 3 C, 5 C, 7 C, 9 C, 11 C) constant current to the lower limits of voltage, and leave it for 1 h; ④ repeat steps ② and ③ three times to end. The flow chart is shown in Figure 3.
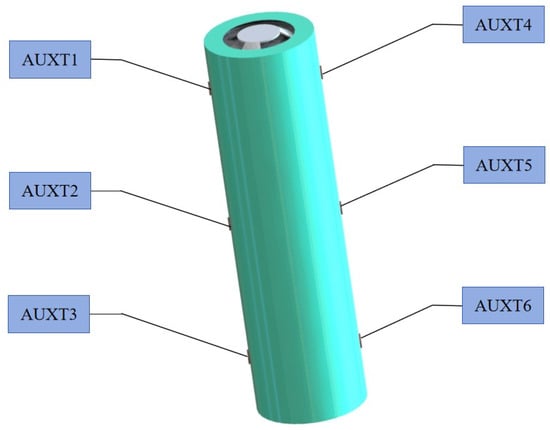
Figure 2.
K-type thermocouple sensor arrangement.

Figure 3.
Flow chart of the test experiment.
3. Experimental Results
3.1. Effect of Different Discharge Rates on Battery Discharge Voltage
As depicted in Figure 4, the curve of battery voltage variation over time at different discharge rates is shown under the ambient temperature of 20 °C. The density of the dots in the graph indicates the voltage drop rate. The denser the dots, the slower the voltage drop. The change in voltage of lithium batteries during the entire discharge process can be divided into distinct stages. Initially, the terminal voltage is rapidly declining, with a faster drop observed at higher discharge rates. A relatively gradual change occurs as time progresses, known as the plateau phase. The duration of this plateau phase is inversely related to the discharge rate. Finally, at the end of the discharge cycle, the terminal voltage experiences a sharp decline until it reaches the cut-off voltage.
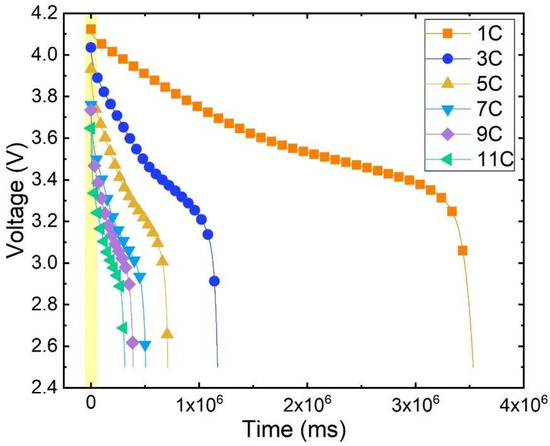
Figure 4.
Discharge voltage variation curve with time.
The battery discharge voltage curve undergoes significant changes at different rates. Under the same ambient temperature, the initial terminal voltage decreases continuously as the discharge rate increases. At 1 C discharge, the initial terminal voltage measures 4.1239 V; at 5 C discharge, it drops to 3.9328 V, representing a decrease of approximately 4.63% compared to 1 C. Furthermore, at 11 C discharge the initial terminal voltage further dwindles to 3.6481 V, signifying an 11.54% decrease from 1 C. Hence, it becomes evident that during the early stages of discharge there exists a notable discrepancy in the battery’s terminal voltage at various discharge rates.
3.2. Effect of Different Discharge Rates on Battery Capacity
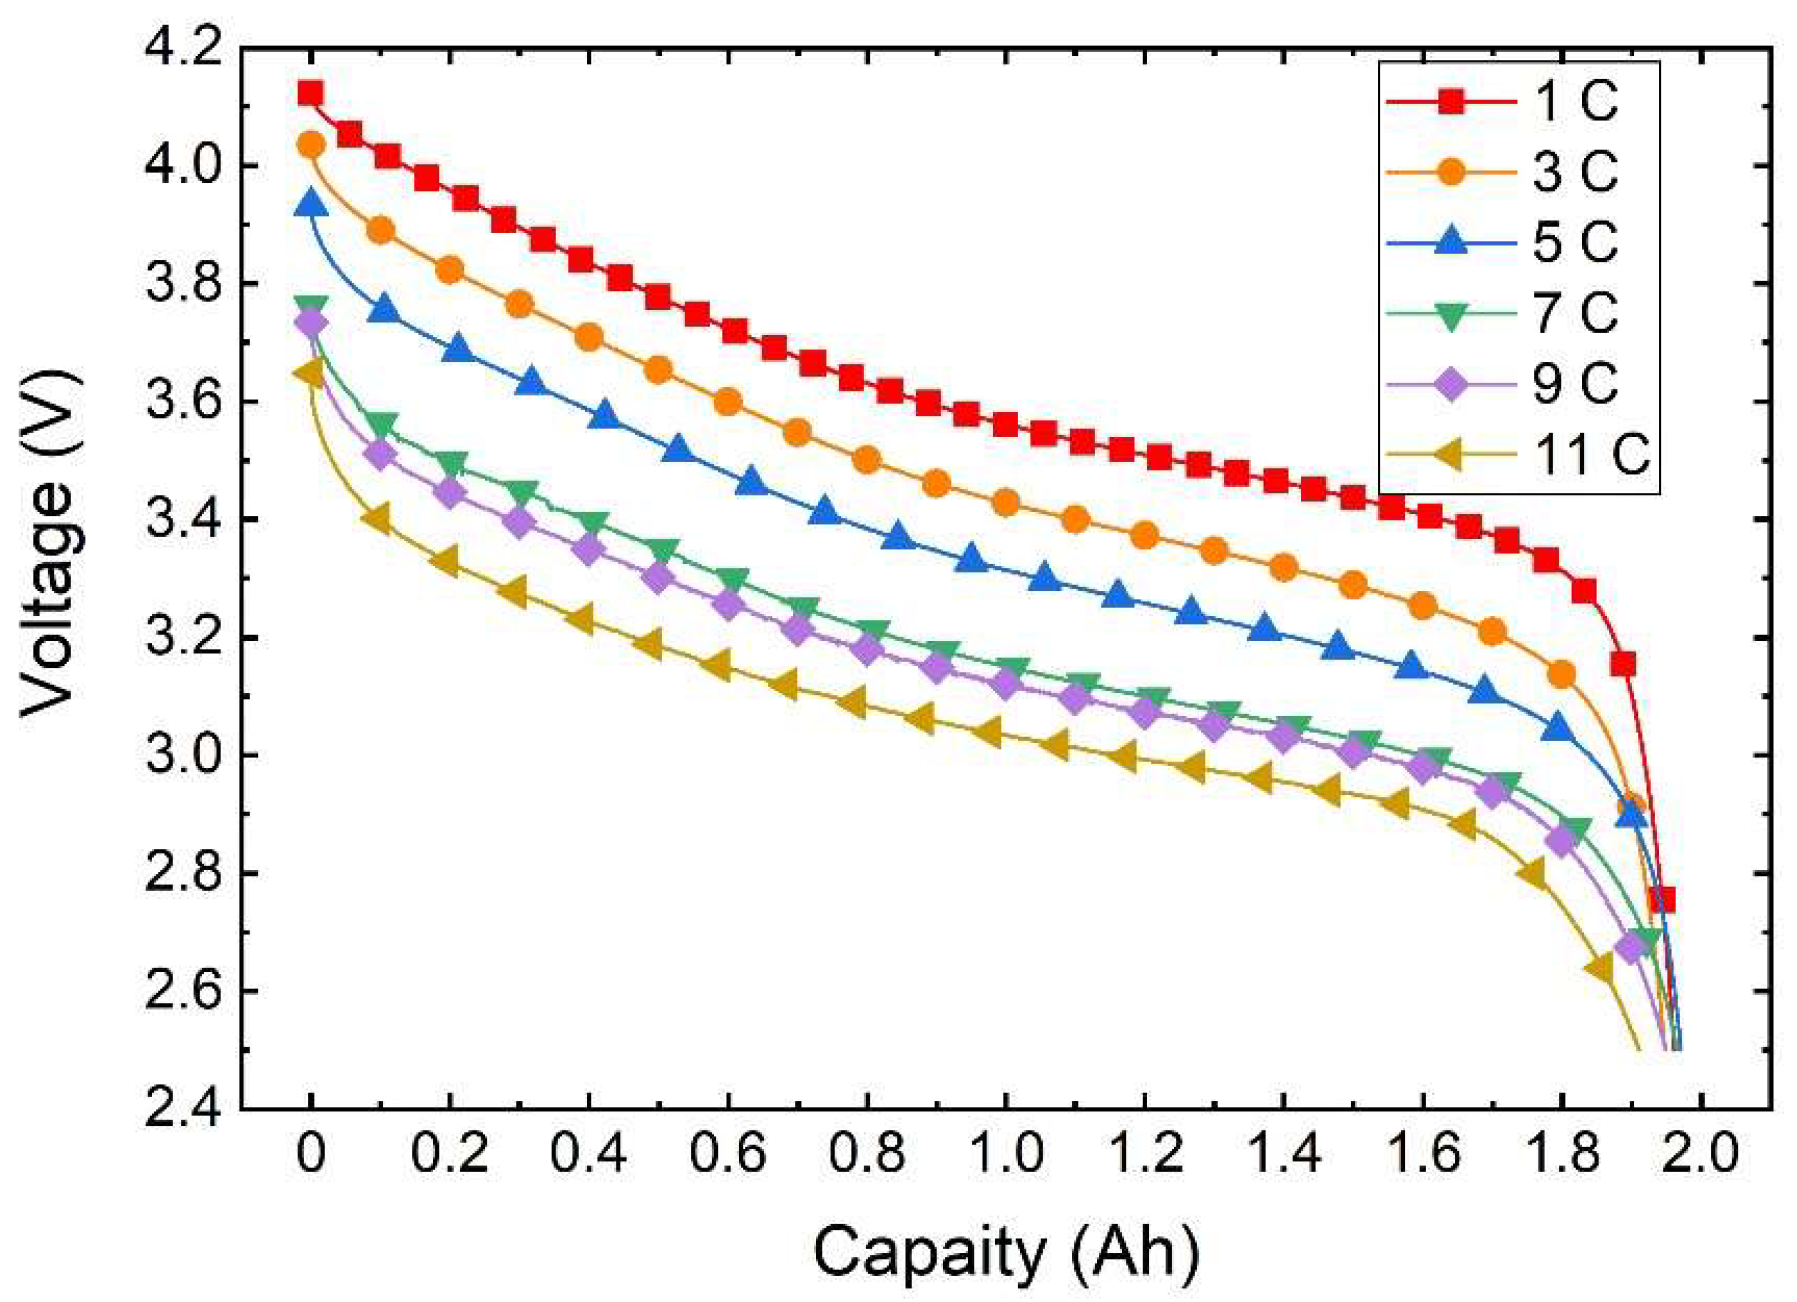
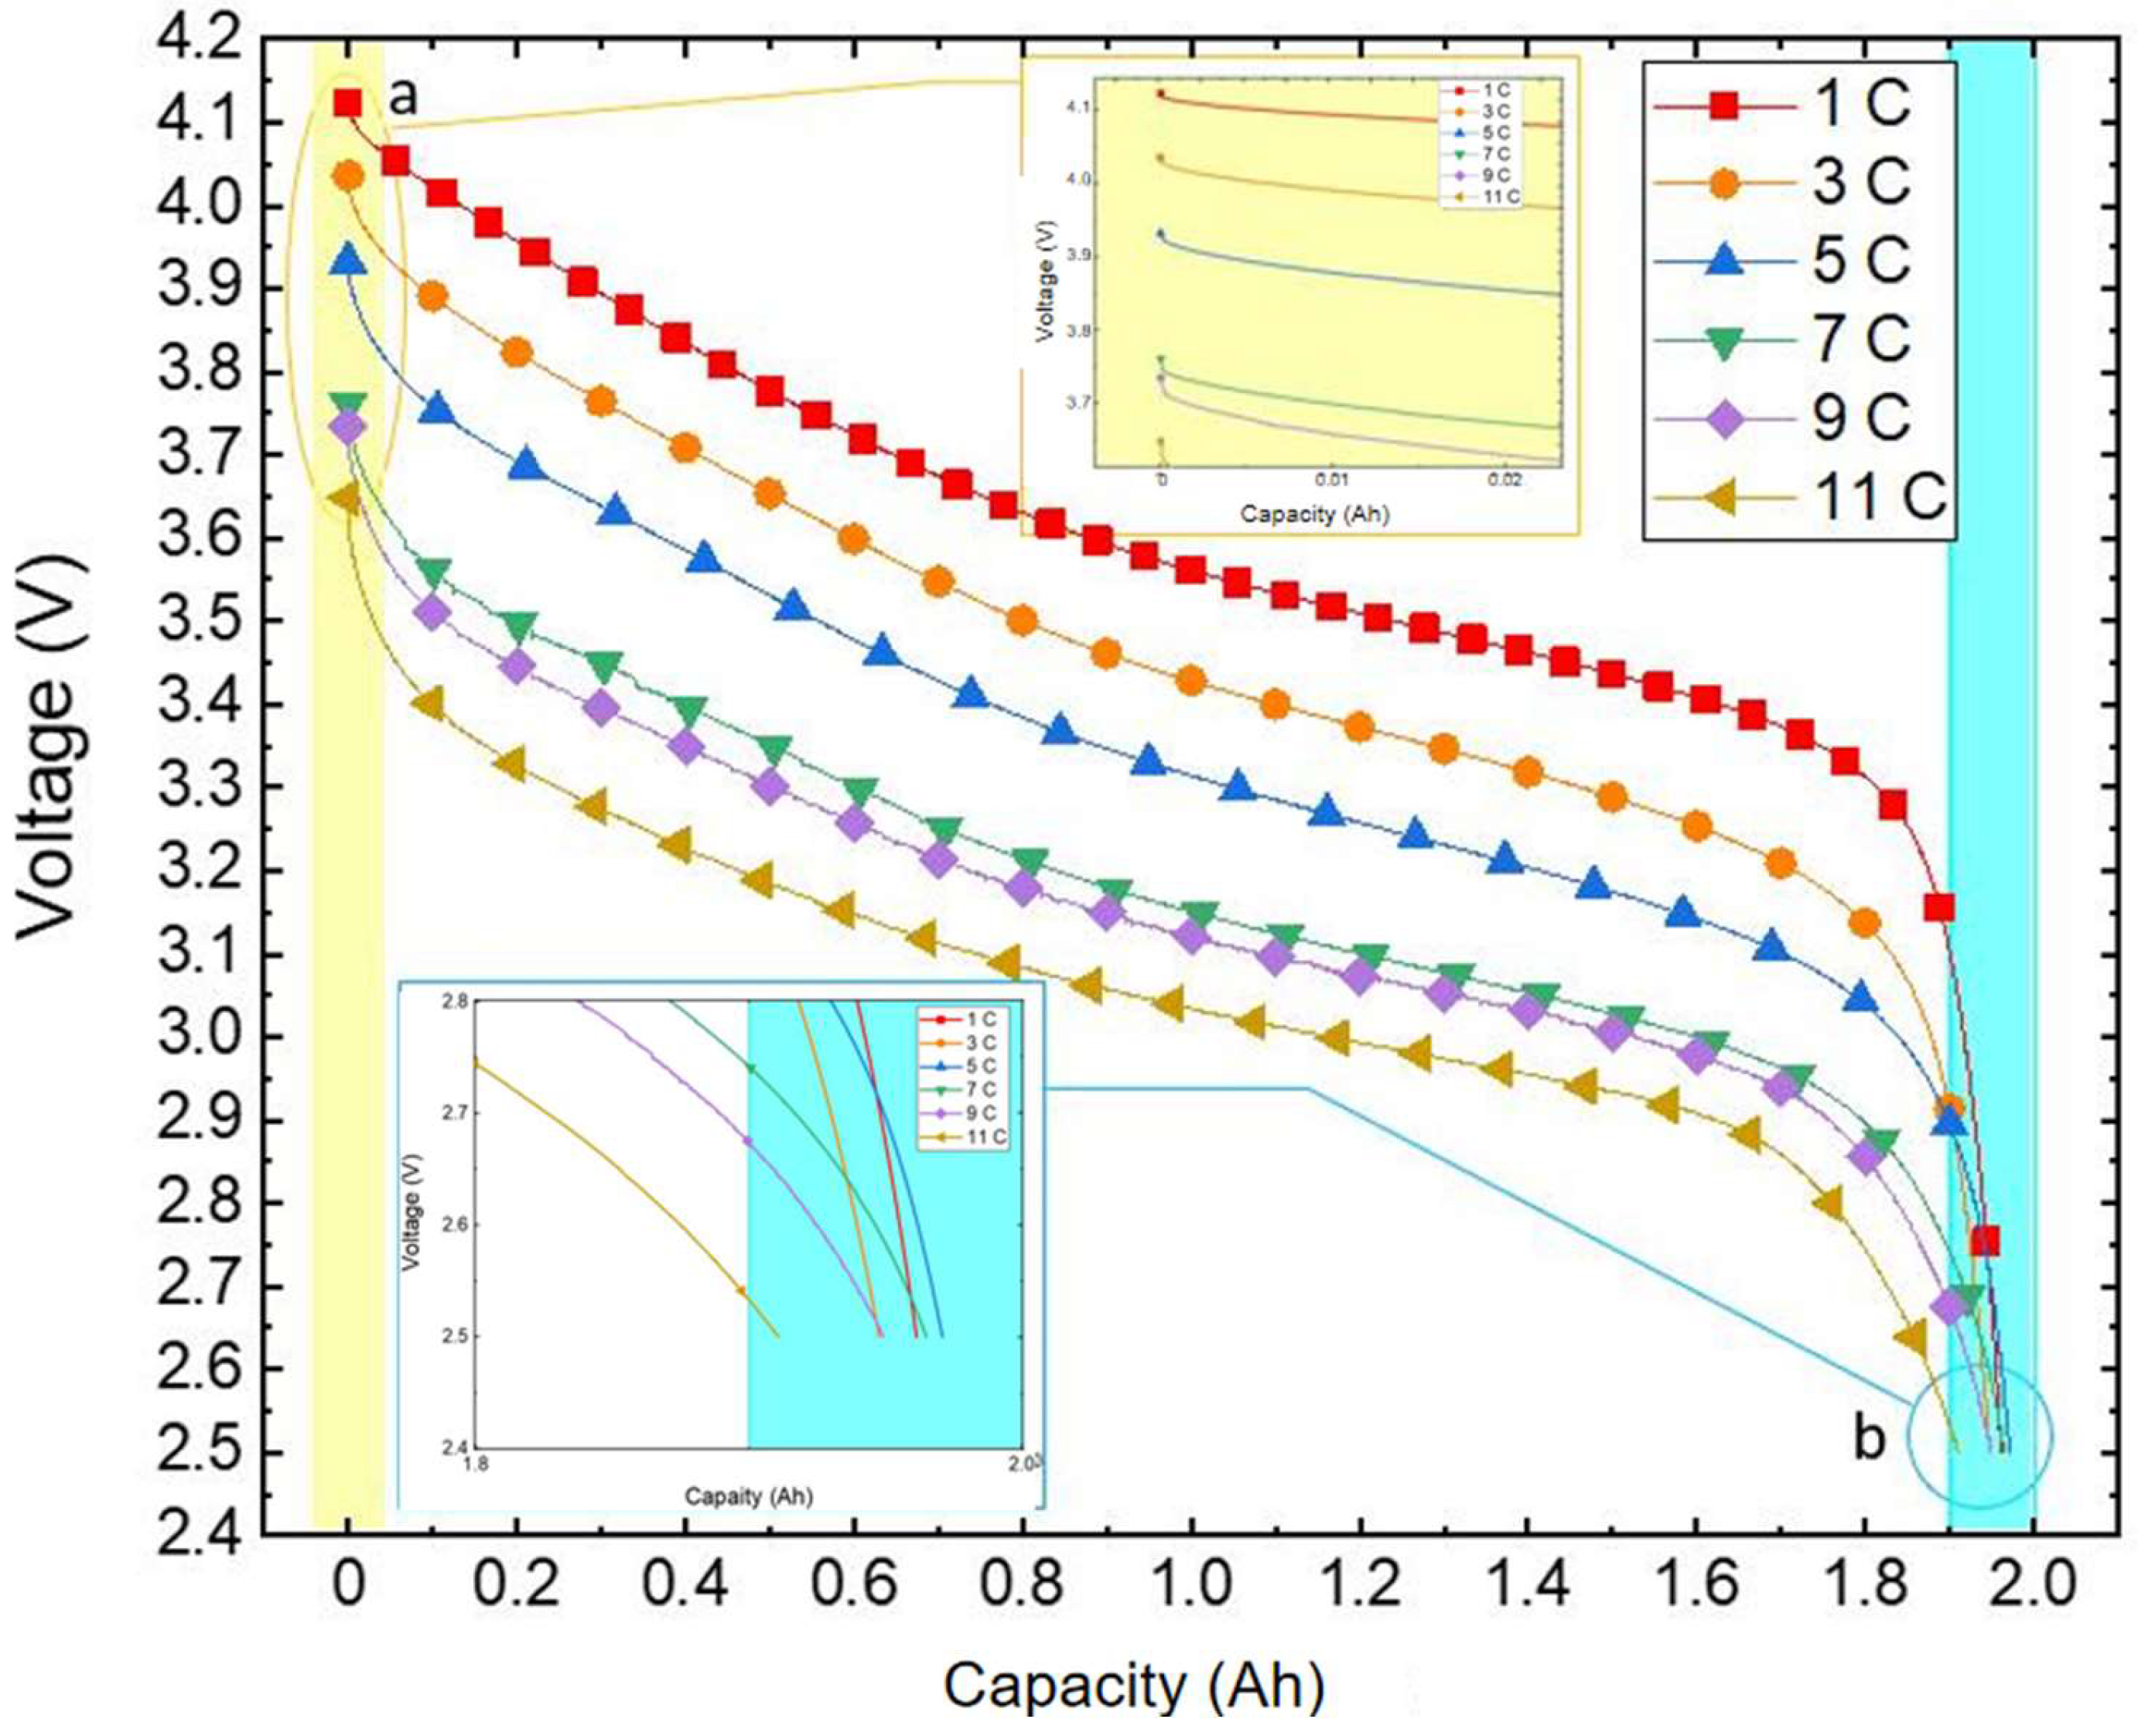
As depicted in Figure 5, the voltage curve varies with capacity at different discharge rates under an ambient temperature of 20 °C. It is evident from the illustration that at the same temperature the discharge rate directly impacts the actual available capacity of the battery. This is due to the fluctuation in the polarisation phenomenon of the battery as the discharge rate shifts, leading to altered voltage loss and causing variation in the discharge platform and capacity.

Figure 5.
Variation curve of the discharge voltage with capacity.
During the discharge initiation to plateau phase, a higher discharge rate results in a larger voltage shift and a lower corresponding voltage for the same battery capacity being discharged. Subsequently, in the plateau phase a heightened discharge rate yields a smoother voltage transition. Moving towards the end voltage stage, a higher discharge rate leads to a slower decrease in voltage, with a marginal difference in discharged capacity. Remarkably, at a discharge rate of 5 C the battery releases the maximum capacity of 1.9708 Ah, whereas at 11 C discharge the minimal capacity of 1.9108 Ah is observed, with a negligible difference not surpassing 0.07 Ah.
3.3. Effect of Different Discharge Rates on Battery Temperature
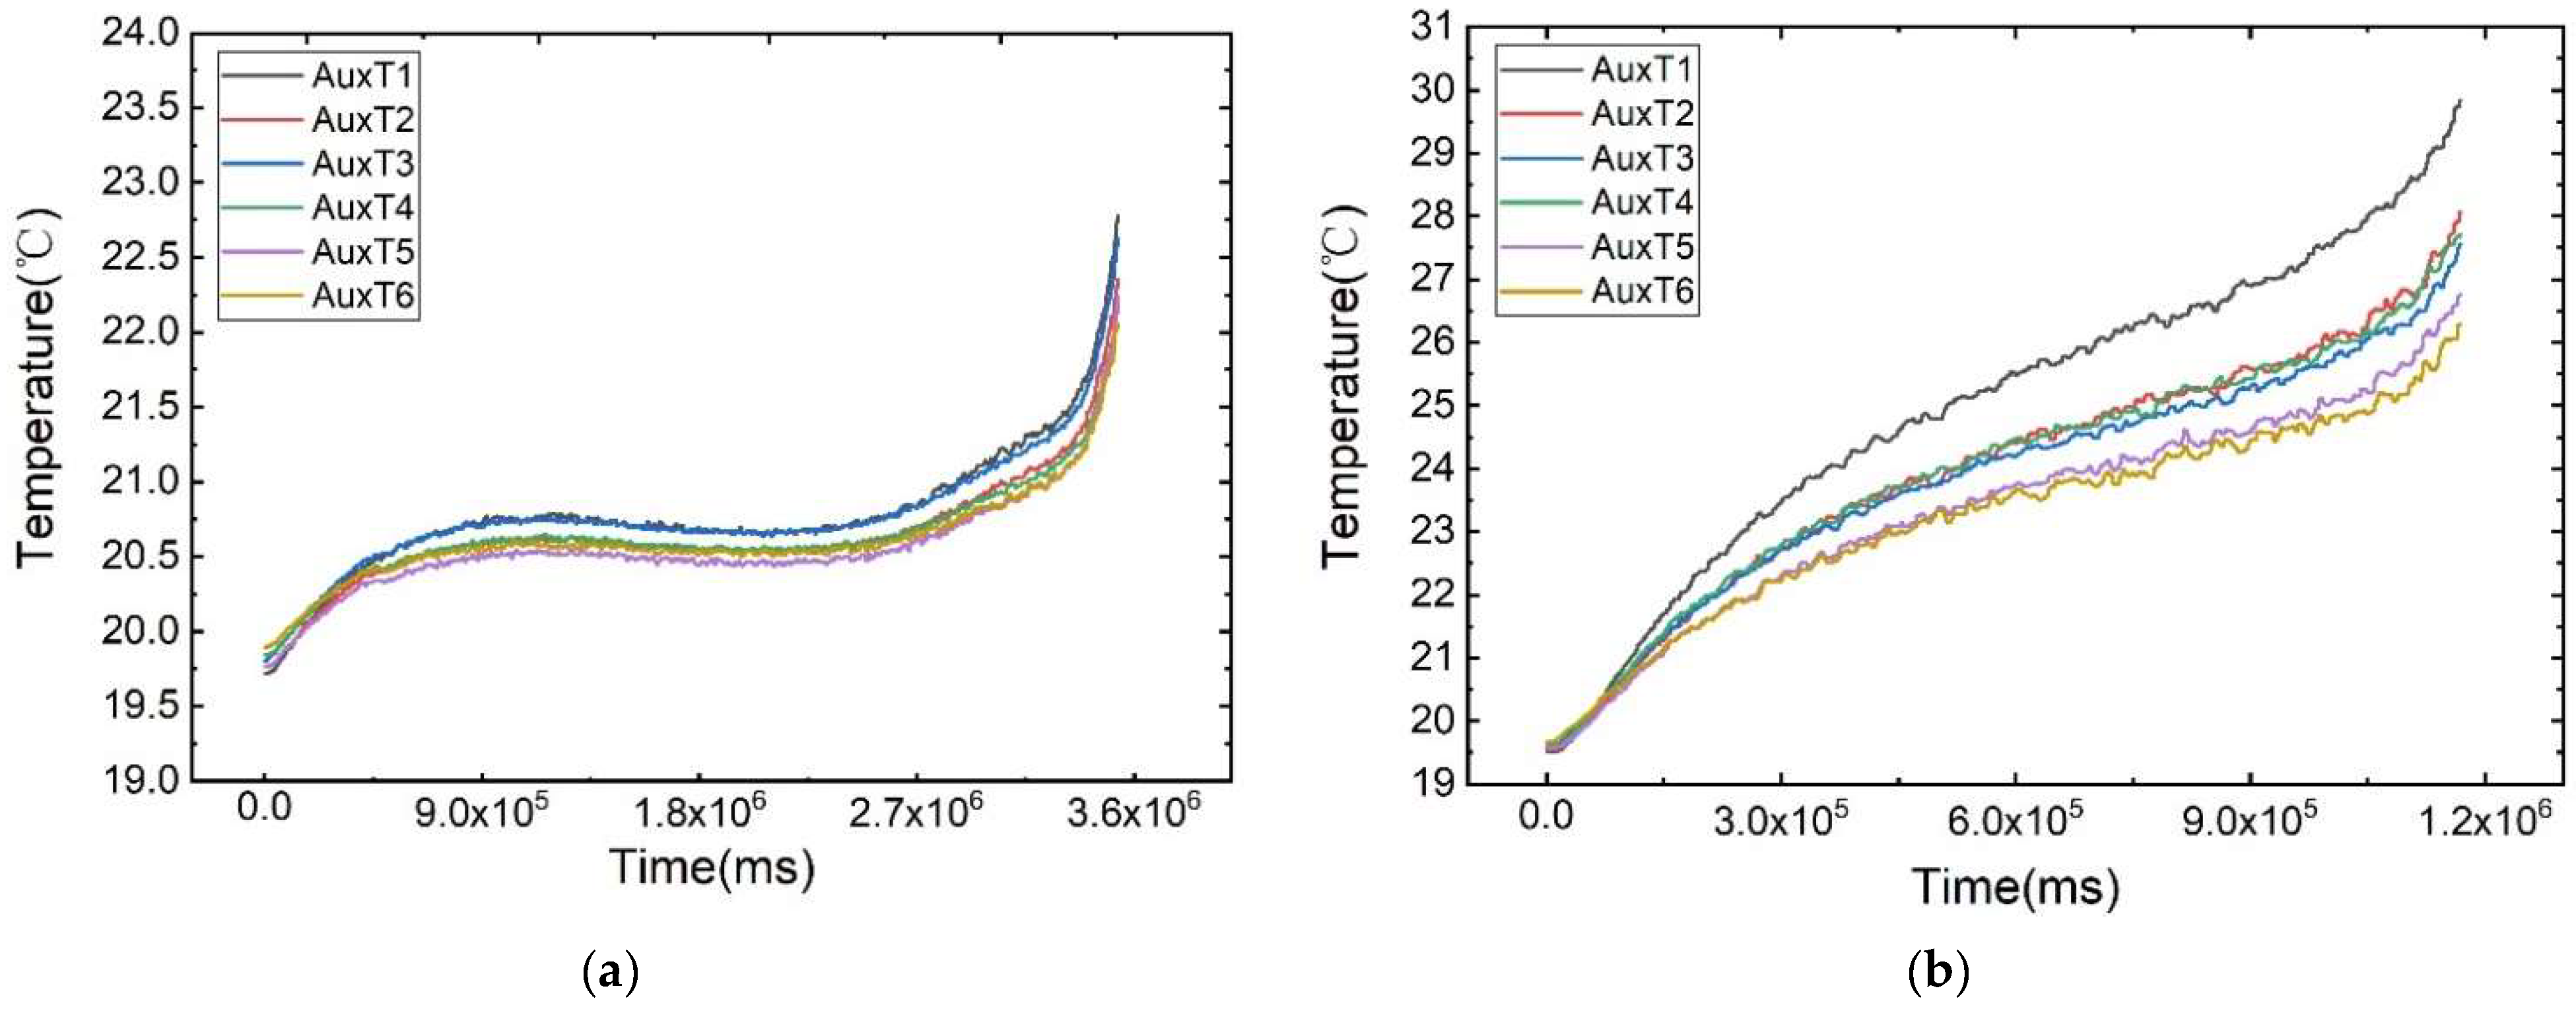
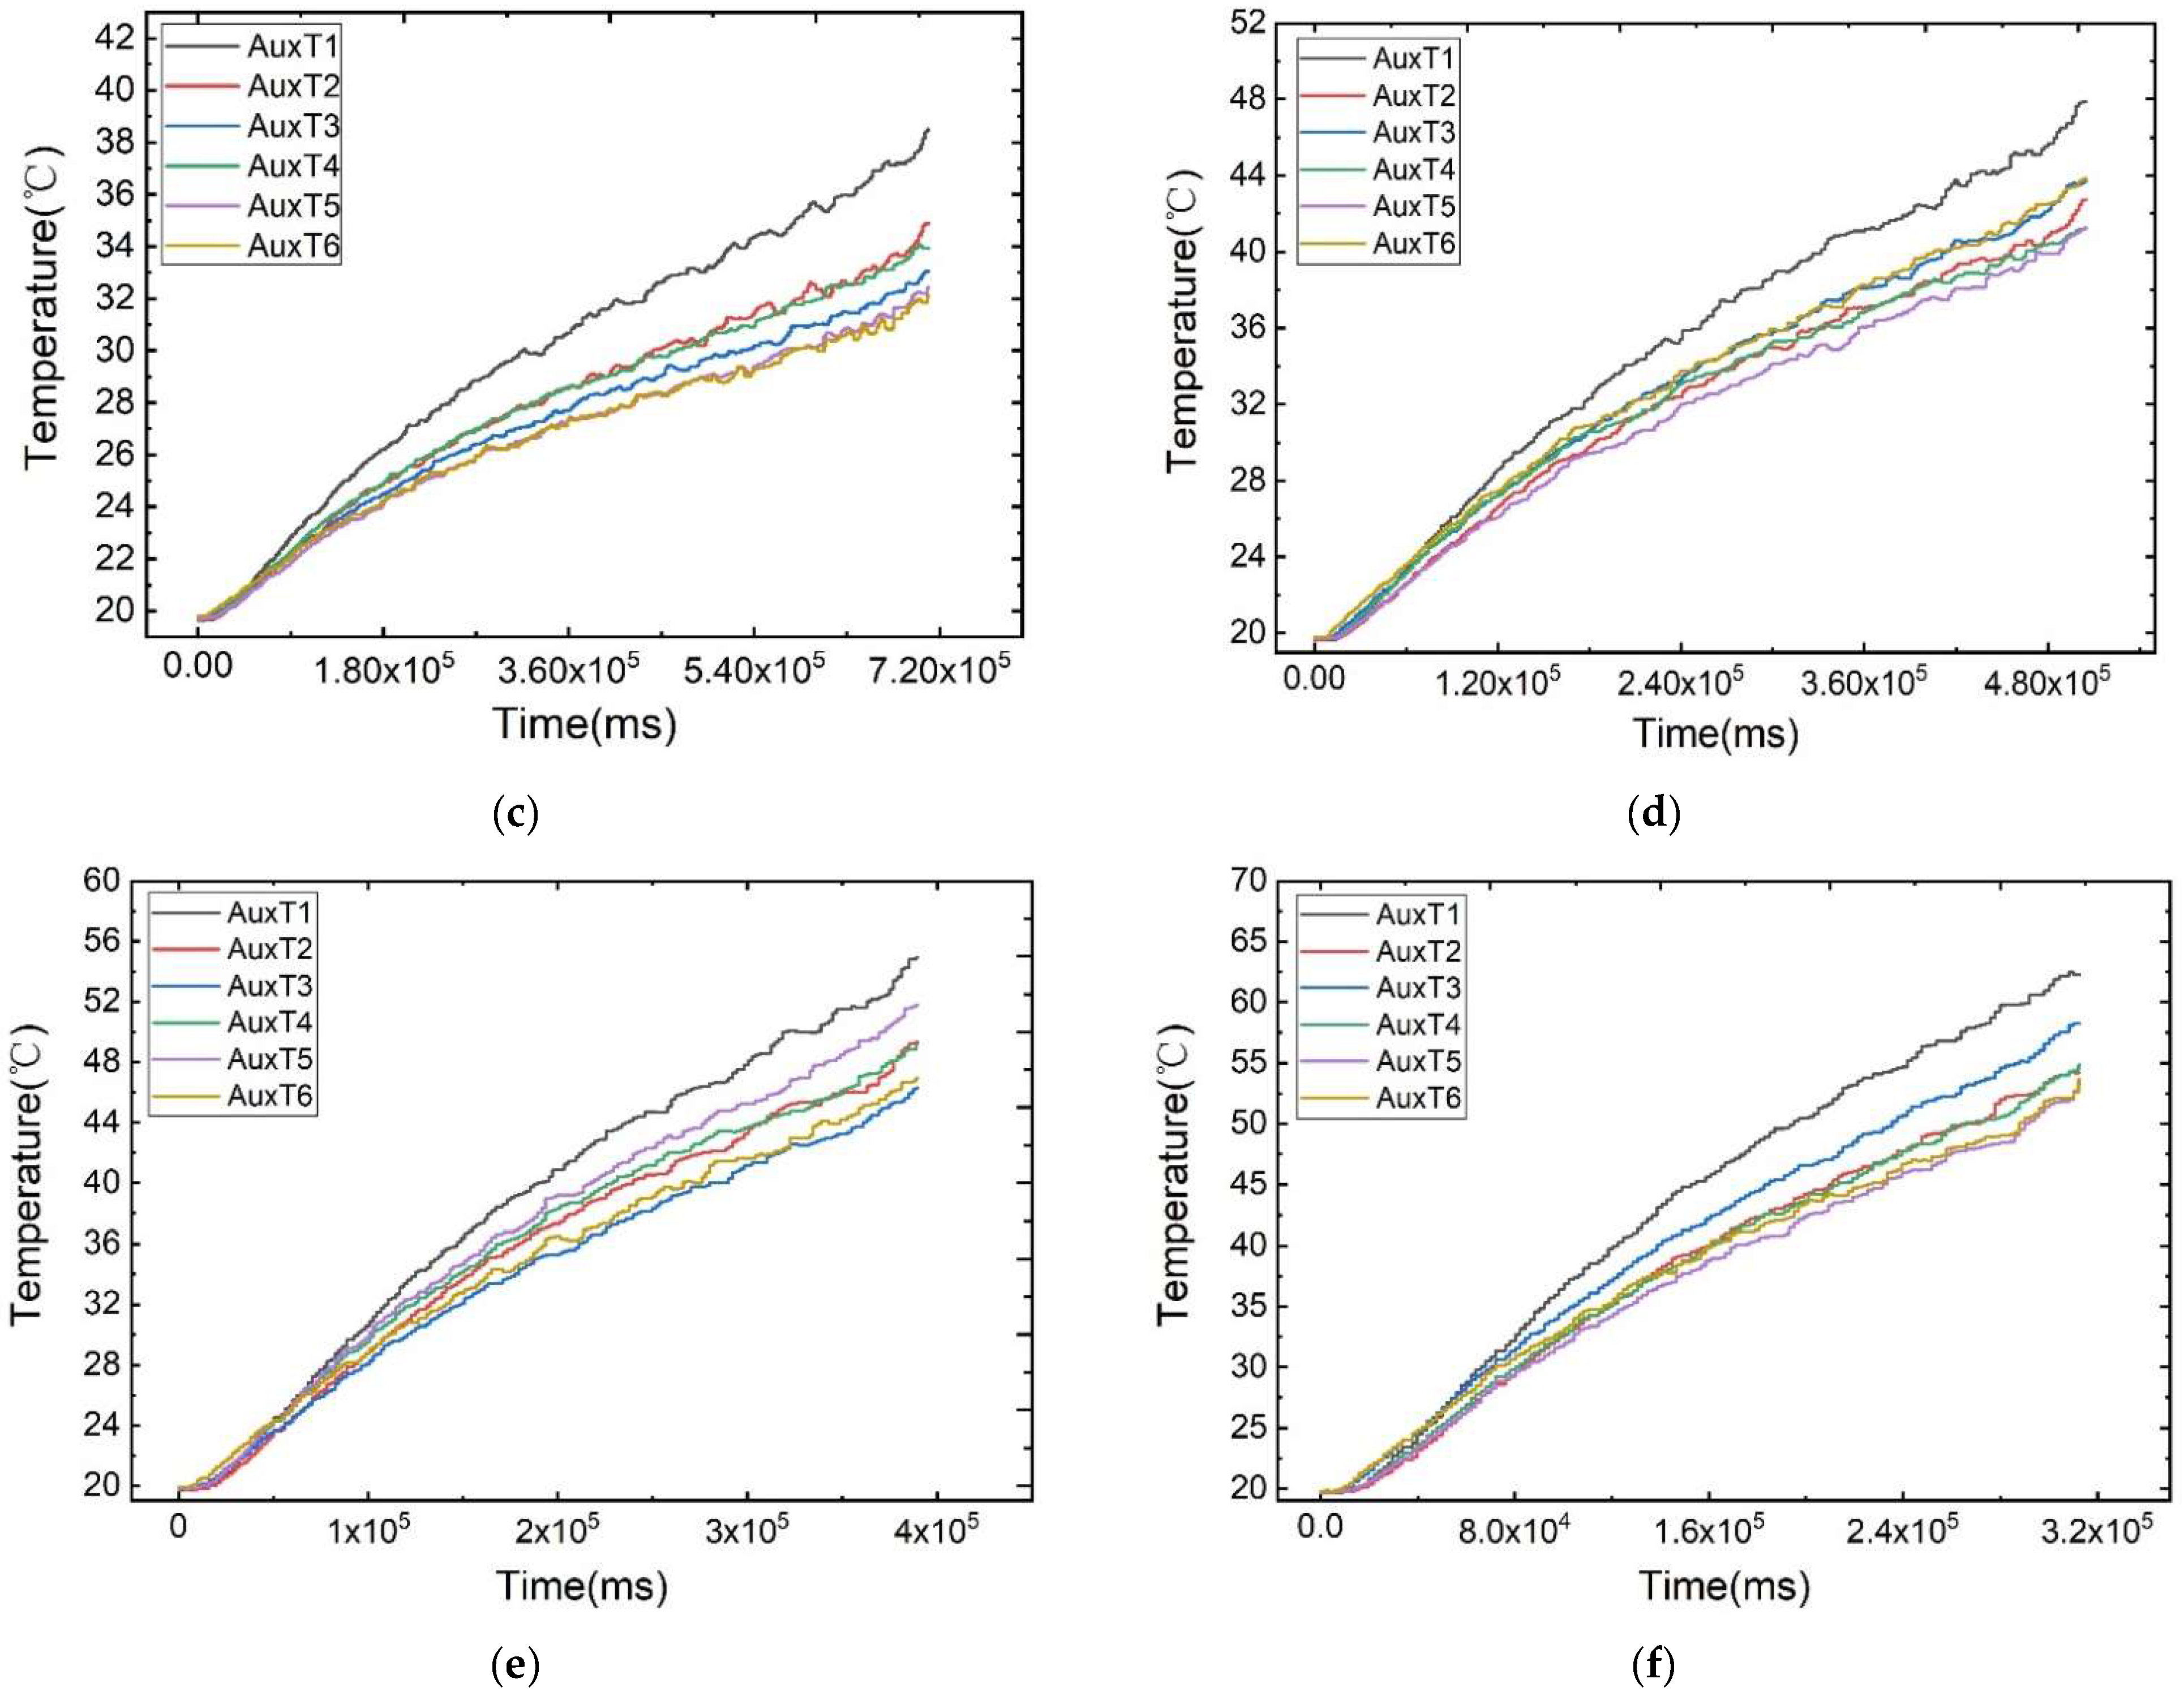
As illustrated in Figure 6, the temperature change curves of each measurement point under different discharge rates at an ambient temperature of 20 °C are displayed. The battery’s surface temperature rises rapidly at the beginning and end of discharge, attributed to the polarisation phenomenon. During the voltage plateau phase, the temperature increase is more gradual. Notably, the plateau phase is more pronounced at lower discharge rates due to its prolonged duration.
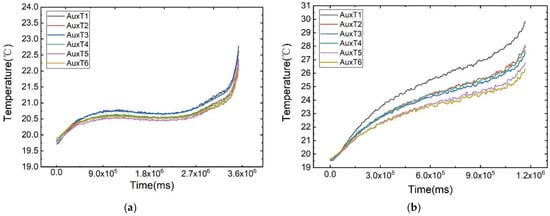
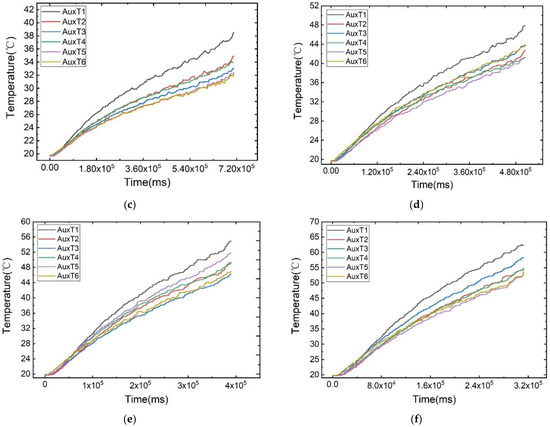
Figure 6.
Temperature variation curves of the cell surface at different discharge rates: (a) 1 C, (b) 3 C, (c) 5 C, (d) 7 C, (e) 9 C, (f) 11 C.
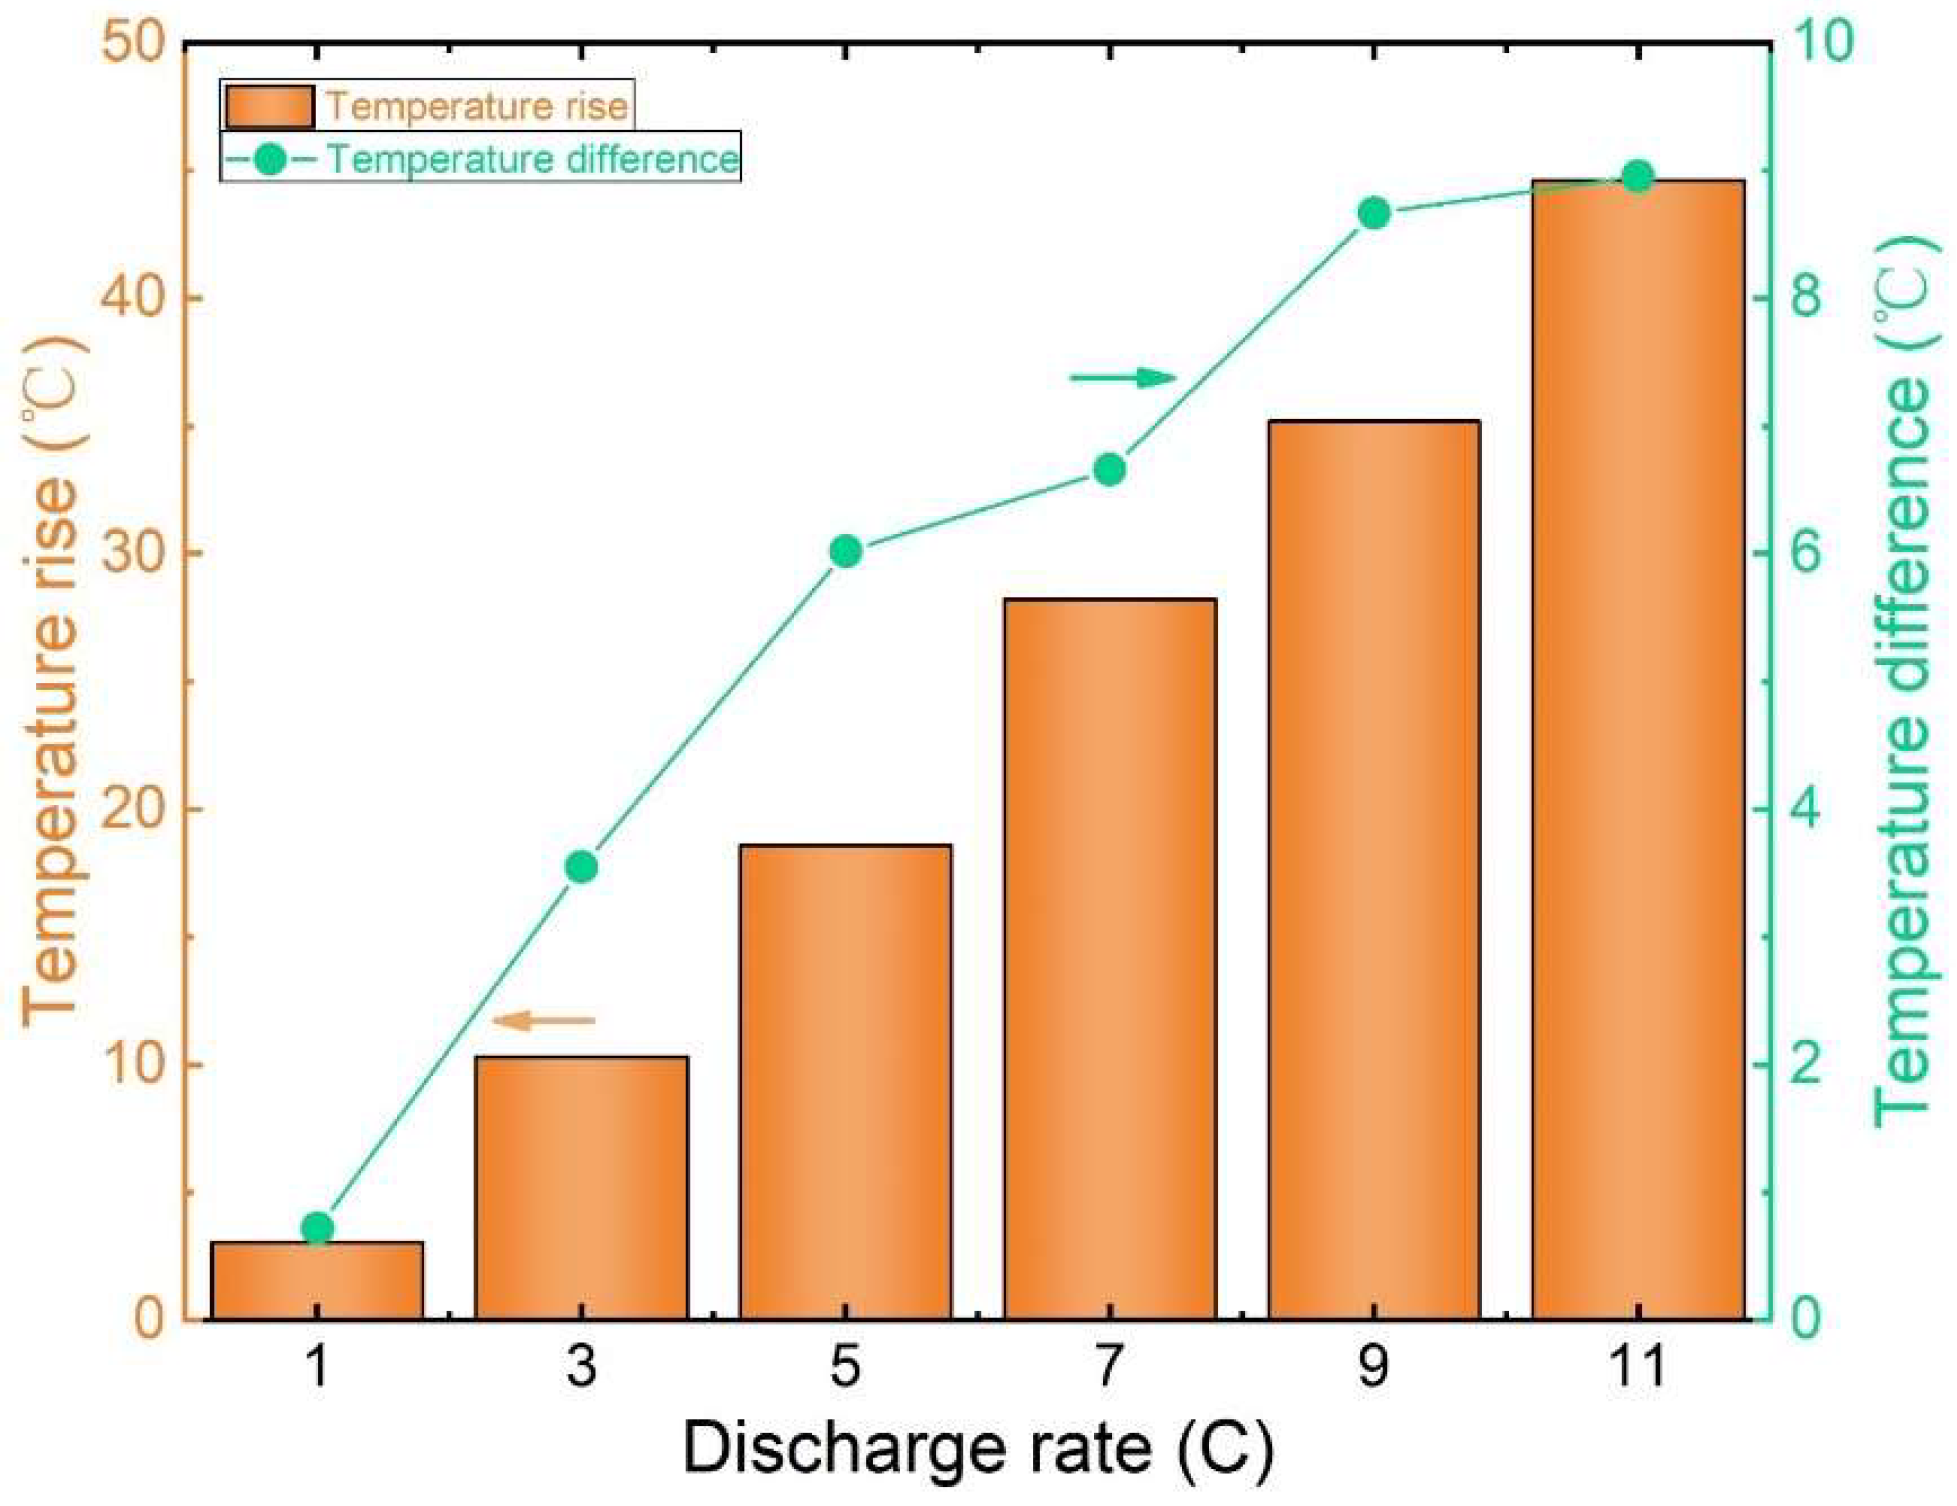
Figure 7 shows the peak temperature contrast and thermal elevation on the battery’s surface under varying discharge rates at an ambient temperature of 20 °C. The graph illustrates a clear correlation between a lithium-ion battery’s discharge rate and temperature dynamics. Notably, as the discharge rate increases, so does the battery’s temperature rise and temperature variation.

Figure 7.
Graph of the maximum temperature difference and temperature rise in the cell surface.
During a 1 C discharge, the highest temperature recorded on the battery surface is 22.78 °C and the lowest recorded is 22.06 °C, resulting in a mere 0.72 °C temperature variance with a temperature rise of 3.06 °C. Contrastingly, a 5 C discharge yields a maximum surface temperature of 38.24 °C, a minimum of 32.21 °C, and a temperature difference of 6.02 °C. The temperature rise significantly escalates to 18.60 °C, representing a striking 736.11% increase in temperature difference and a substantial 500.84% rise compared to the 1 C discharge.
Moreover, a discharge rate of 11 C results in a peak surface temperature of 62.26 °C, a minimum of 53.29 °C, a temperature differential of 8.96 °C, and a temperature elevation of 42.63 °C. Notably, the temperature disparity rises by 65.61%, and the temperature elevation increases by 129.19% compared to the 5 C discharge.
4. Analysis of the Experimental Results
4.1. Analysis of the Internal Resistance and Polarisation Phenomenon
Not all the chemical energy in lithium-ion batteries can be fully converted into electrical energy during the charge and discharge process. There will always be a certain amount of energy loss, with the majority of this loss attributed to the battery’s internal resistance [24,25].
The internal resistance of lithium batteries typically consists of ohmic and polarised internal resistance [26]. Ohmic internal resistance is primarily made up of four components: the contact resistance of the lithium battery components, the resistance of the collector fluid, the resistance of the lithium battery separator, and the resistance of the positive and negative electrode materials, among others [27,28]. The size of the battery also influences this resistance, the overall layout of the battery structure, and the battery’s manufacturing technology. Based on its formation principle, the polarised internal resistance can be further divided into electrochemical and concentration polarisation. Electrochemical polarisation resistance is primarily caused by the rate of electrochemical reaction in the lithium battery electrolyte being slower than the movement of electrons, while concentration polarisation resistance is mainly due to the rate of lithium-ion insertion, detachment from the positive and negative electrodes of the lithium battery, and transfer within these electrodes being slower than the transfer rate of lithium-ions to these electrodes [29,30].
During the discharge process, as the current passes through the internal battery, it must overcome the resistance created by its internal resistance. Consequently, the terminal voltage of the lithium-ion battery is lower than the open-circuit voltage. The disparity between these two voltages represents the voltage consumed by the internal resistance of the lithium-ion battery during discharging, a phenomenon known as battery polarisation [31]. Equation (1) can be used to express the voltage relationship of the battery:
where is the open-circuit voltage, is the terminal voltage, and is the polarisation voltage of the battery. During the discharge of Li-ion batteries, some effective measures should be taken to reduce the value of the battery polarisation voltage as much as possible to improve the discharge efficiency.
Numerous factors contribute to the polarisation of lithium-ion batteries, which are typically divided into three overarching categories: ohmic polarisation, electrochemical polarisation, and concentration polarisation, based on the underlying causes of the polarisation.
(1) Ohmic polarisation
Ohmic polarisation arises due to the internal resistance of the components within the lithium-ion battery during charging and discharging. As the current flows through these components, it encounters hindrances, leading to the phenomenon of ohmic polarisation [32,33]. An electrochemical reaction occurs when the battery is being charged, causing lithium ions to move towards the electrode. However, this diffusion process faces resistance from the internal components, requiring a portion of the charging current to drive the diffusion of lithium ions. The loss of ohmic polarisation can be expressed by the following Equation (2):
where is the discharge current; is the ohmic internal resistance; is the resistance generated by the external circuit; is the ohmic resistance generated by charged ion transport; is the electrode area; is the electrode spacing; and is the conductivity of the battery electrolyte. Therefore, when high current discharge is used, increases and subsequently the ohmic voltage also increases, i.e., the ohmic polarisation phenomenon increases, which can cause an increase in the internal temperature of the battery.
(2) Electrochemical polarisation
During the discharge process of the cell, the rate of chemical reaction generated on the surface of the electrode active material is slower than the rate of electron migration, which in turn causes the potential on the negative surface to deviate from the equilibrium potential, resulting in electrochemical polarisation [18]. The electrochemical polarisation loss can be expressed by the following Equation (3):
where is the ideal gas constant; is the absolute temperature; is the current density; is the Faraday constant; is the electrochemical reaction coefficient; is the number of electrons transferred by the reaction; and is the exchange current density in the standard case. The escalation of charging and discharging the current will result in an augmentation of electrochemical polarisation, thereby amplifying the electrochemical reaction occurring within the lithium battery. This process leads to a significant alteration in electrolyte concentration, leading to the generation of gas through electrolyte reactions. Consequently, this gas production may induce corrosion and distortion of the lithium-ion battery’s electrode plates, ultimately causing irreversible damage.
(3) Concentration polarisation
When a lithium-ion battery is charged and discharged, on both its positive and negative plates chemical reactions occur, and these chemical reactions cause the concentration of various particles involved in electrochemical reactions to change in the electrolyte inside the lithium-ion battery, i.e., the concentration of the electrolyte inside the lithium-ion battery changes before and after charging, and this change causes a potential difference between the positive and negative electrodes of the lithium-ion battery, which is the concentration polarisation phenomenon [34]. The concentration polarisation loss can be expressed by the following Equation (4):
where is the limiting current density for battery operation. Therefore, when the charge/discharge current increases, the electrochemical reaction will intensify, increasing the current density, , and the concentration polarisation.
The phenomenon of polarisation in the power battery steadily intensifies throughout the charging process. Concentration polarisation becomes more pronounced in the later stages. While the ohmic polarisation shows relatively minimal changes, it persists. The electrochemical polarisation consistently resides between ohmic and chemical polarisation [35,36].
Therefore, reducing the charge/discharge current can effectively mitigate ohmic polarisation, electrochemical polarisation, and concentration polarisation phenomena.
As shown in Figure 8, the voltage–capacity change curve of the lithium-ion battery during discharge is illustrated. The yellow-filled section indicates that a higher discharge rate in an identical temperature setting results in a quicker drop in initial end voltage and a lower discharge plateau. This phenomenon occurs because at lower room temperature the active material inside the battery becomes insufficient to fully participate in the reaction, reducing the electrolyte’s ionic conductivity. As a result, the resistance of the SEI film and electrochemical reaction increases. With an escalating discharge rate, the ohmic, electrochemical, and concentration polarisations intensify, causing a rise in voltage loss. Consequently, the voltage sharply declines at the onset of discharge.
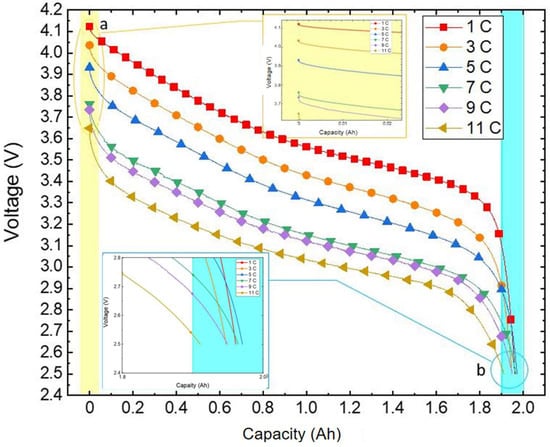
Figure 8.
Partial enlargement of the variation curve of the discharge voltage with capacity.
In the partial magnification diagram (a), it is evident that a higher discharge rate corresponds to a lower initial terminal voltage. This occurs because at a consistent temperature the battery’s open-circuit voltage remains fixed. During discharge, the potential difference between the positive and negative electrodes diminishes due to the successive development of ohmic, electrochemical, and concentration polarisations. As the discharge rate increases, the polarisation voltage also escalates, resulting in a lower initial terminal voltage.
At the end of discharge, the battery voltage drops rapidly, with many reasons leading to this rapid decrease in voltage. Li et al. [37] researched lithium-ion batteries and found that the electrode materials (such as the cathode material) undergo lithium-ion insertion and de-insertion during the charging and discharging process. When discharging to the end, the cathode material may undergo phase transformation or structural changes, leading to a decrease in its electrochemical reaction performance, thus causing the battery’s discharge voltage to decline rapidly. Aurbach et al. [38] explored how changes in lithium-ion concentration in the electrolyte affect the stability of electrode materials and the discharge performance of the battery, and found that as the battery discharges the lithium-ion concentration in the electrolyte gradually decreases. When the battery is discharged to a certain extent, the number of lithium-ions available in the electrolyte to be inserted into the cathode decreases, leading to a decrease in the discharge reaction rate of the battery, and thus causing a voltage drop. In conclusion, the reasons for the rapid decrease in voltage of lithium batteries at the end of discharge include changes in electrode material structure, changes in lithium-ion concentration in the electrolyte, and changes in internal chemical reactions of the battery.
Generally, an increase in discharge rate will lead to an increase in internal polarisation resistance of the battery. This will result in the battery reaching its cut-off voltage faster and reducing its discharge capacity. However, upon closer observation at the end of discharge in Figure 8 (inset (b)) it is quite clear that the curves of 1C and 3C intersect with the curve of higher discharge rates, and the battery’s capacity does not decrease with increasing discharge rates. Simone et al. [39] conducted charging and discharging experiments on lithium cobaltate batteries (8773160K). The experimental data showed that the resistance of the new battery at 20 °C was more than twice that at 46 °C. Chen et al. [40] conducted charging and discharging experiments on lithium batteries (ICR18650-26F). The experimental data showed that, at a discharge rate of 1 C, as the temperature decreases the battery’s internal resistance significantly increases. Panchal et al. [41] conducted charging and discharging experiments on prismatic lithium-ion batteries. The experimental data showed that as the charging rate decreases, the battery’s internal resistance significantly increases. Overall, as the temperature rises, the Ohmic resistance decreases. In the experiment, we used a constant temperature and humidity chamber to control the battery testing environment. High discharge rates cause the battery to generate a large amount of heat internally, which cannot dissipate quickly, resulting in an increase in battery temperature. This temperature increase reduces the battery’s internal resistance, delaying the time at which the battery reaches the cut-off voltage during discharge and showing a rise in discharge capacity. At the same time, at relatively low discharge rates (1C–3C), the internal reactions of the battery are relatively slow. Higher discharge rates will lead to lower voltage. According to the basic principle of battery energy (the product of battery capacity and battery voltage), the amount of electricity released by a battery at high discharge rates is greater than that released at low discharge rates. The above two points explain why the curves intersect at the end of the discharge in Figure 8 (inset (b)).
4.2. Voltage Plateau Period Fitting Curve Analysis
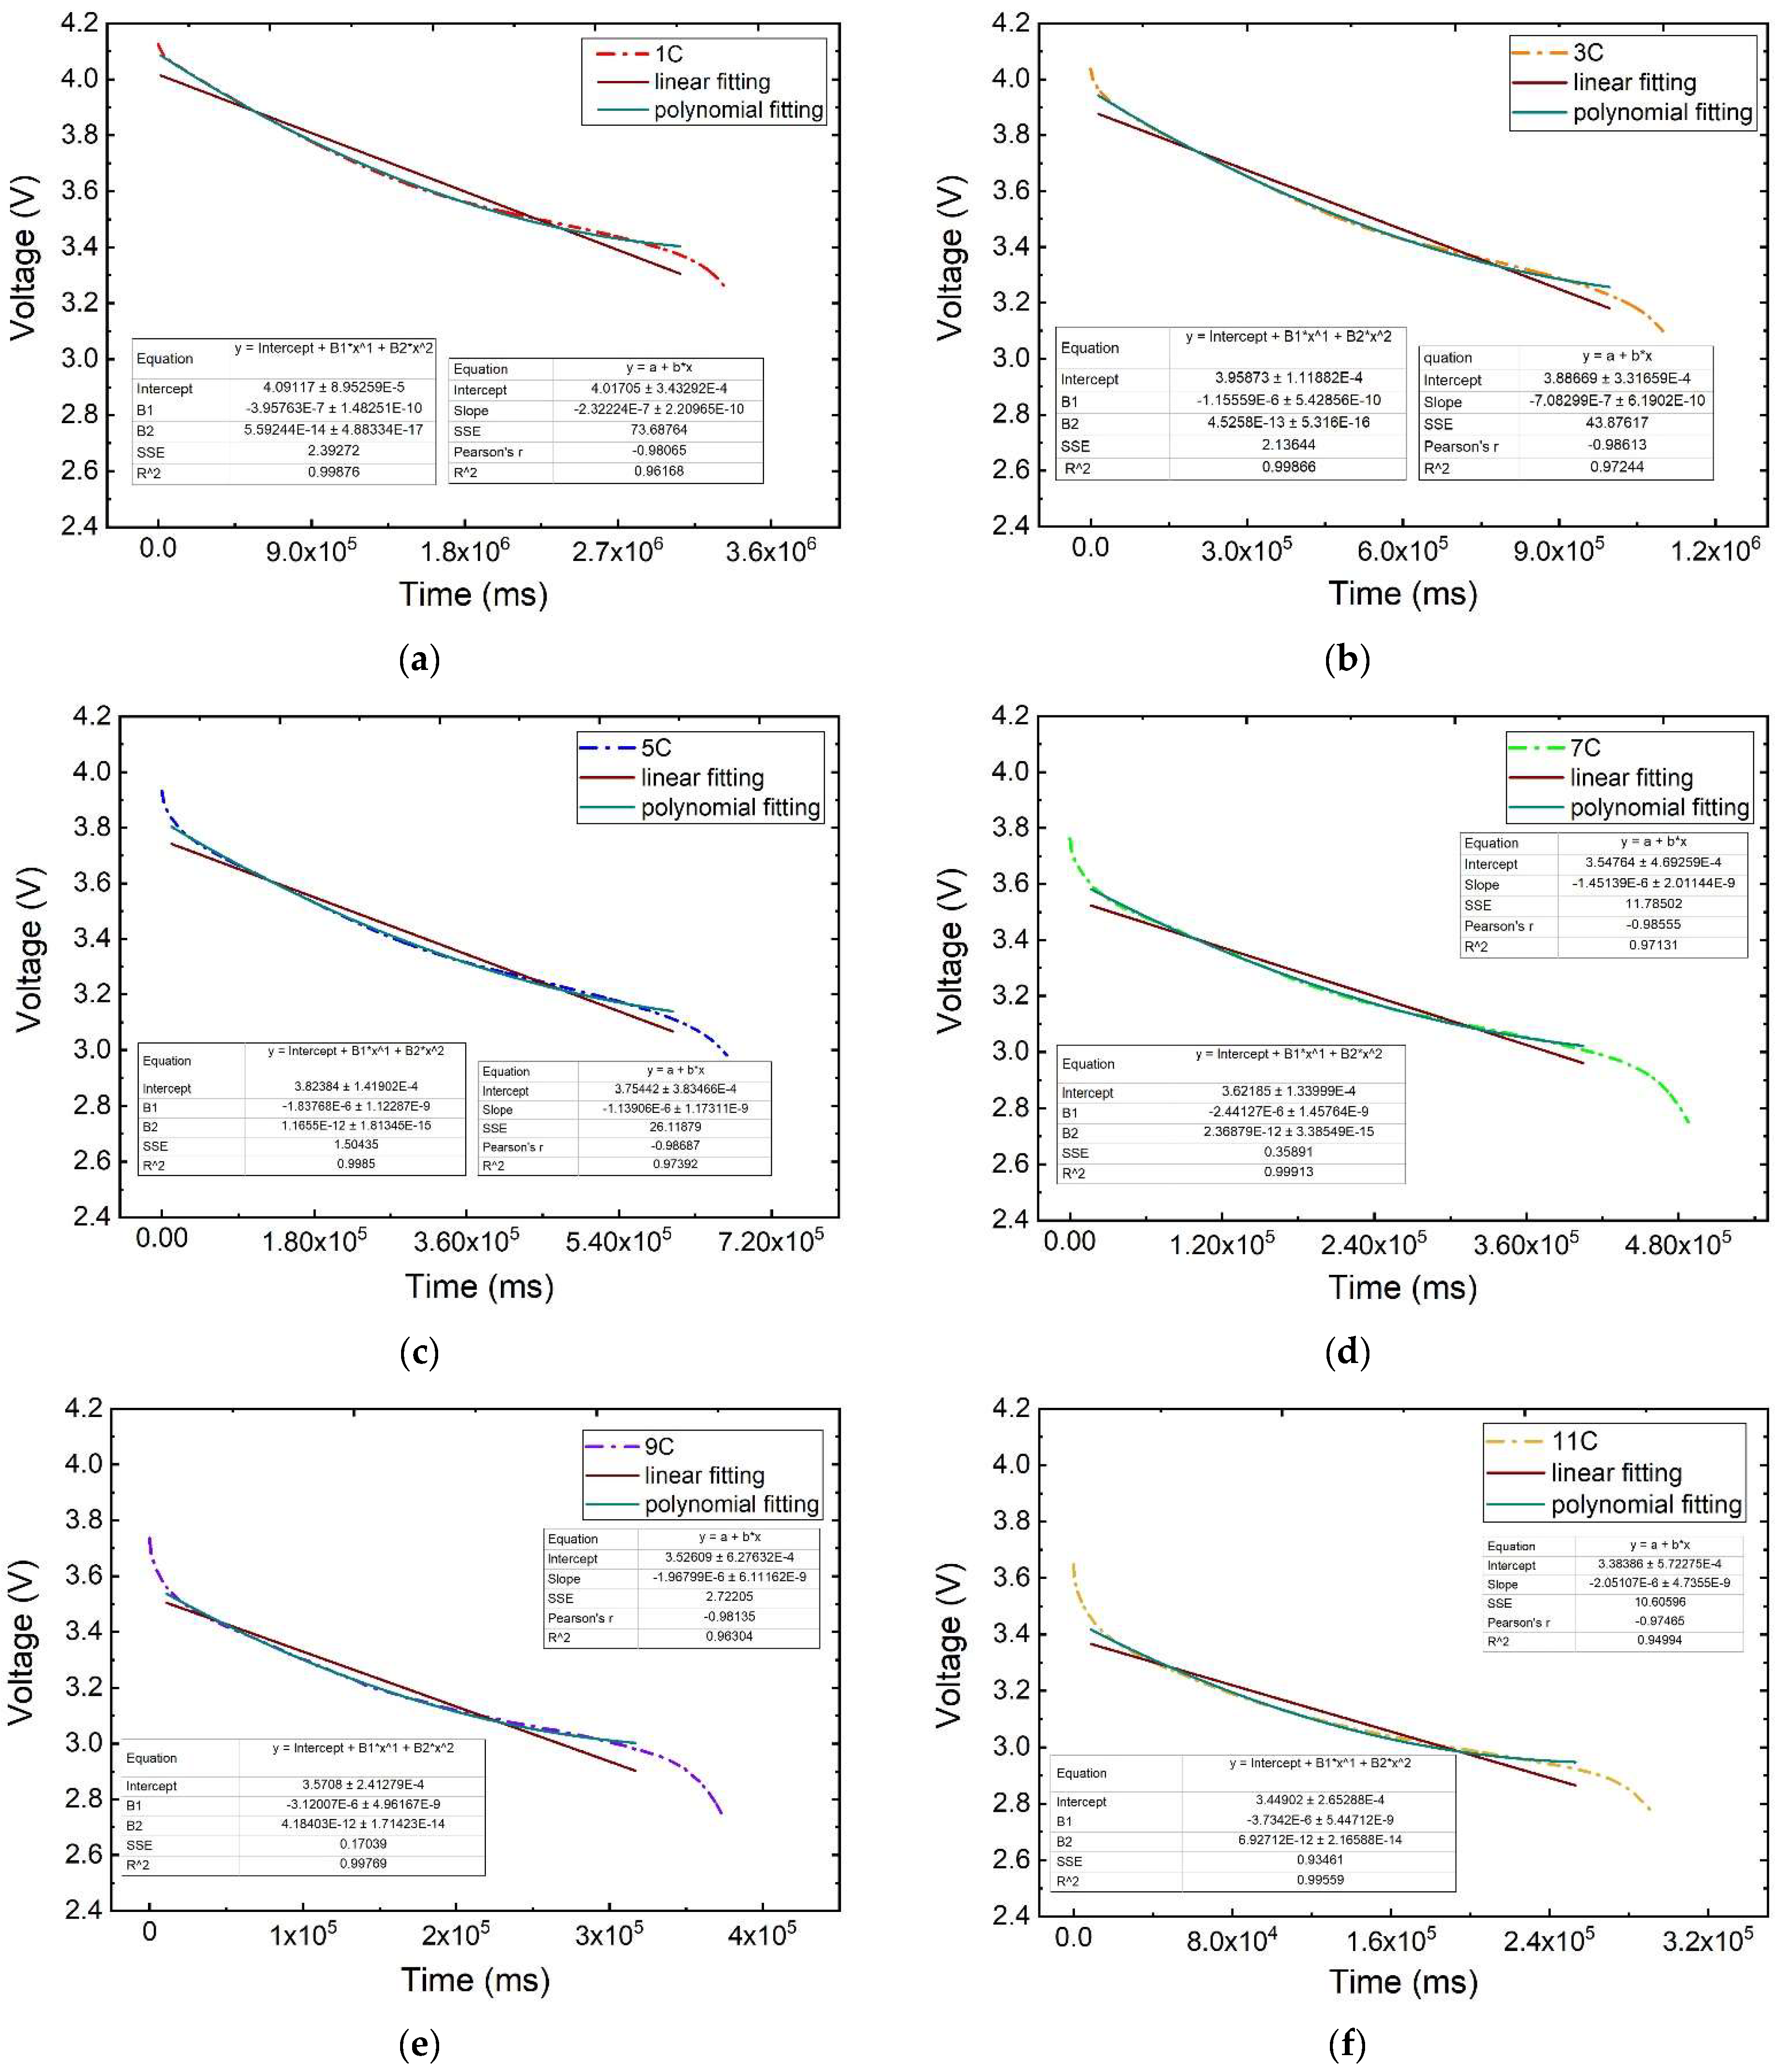
The voltage plateau period is identified through an analysis of the curvature of the curve during the discharge process. The transition point to the plateau phase is indicated by a concave curve, where the second-order derivative is positive and the third-order derivative reaches a maximum, whereas the transition point at the end of the plateau to the subsequent phase is marked by a convex curve, with a negative second-order derivative and a peak in the third-order derivative. Subsequently, following the identification of inflection points and the application of optimisation corrections, the discharge curve is segmented into three phases: the initial phase, the voltage plateau phase, and the final phase. A segmented regression analysis is conducted in the voltage plateau period to determine a fitting graph and equation, as well as additional analysis. This paper presents a comparative evaluation of linear and polynomial fitting approaches for voltage–time parameters.
As shown in Figure 9, the curves representing the battery voltage plateau period for various discharge rates are displayed. It is evident that the polynomial fitting curve aligns more closely with the original voltage–time parameter curve than the linear fitting line. To delve deeper into the fitting performance of both curves, the parameters of the fitted curve equation will be extracted for a quantitative comparison in the following analysis.
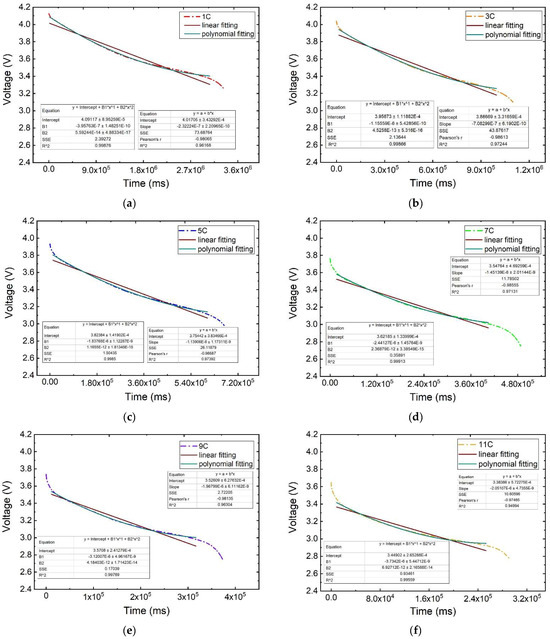
Figure 9.
Influence law on the voltage plateau period at different discharge rates: (a) 1 C, (b) 3 C, (c) 5 C, (d) 7 C, (e) 9 C, (f) 11 C.
(1) Parameter analysis of the linear fitting curve equation for the voltage plateau period.
The parameters of the linear fitting curve equation and the time ∆t used for the voltage plateau period are shown in Table 2. The coefficient of determination R2 is greater than 0.94 for the linear fitting of the voltage plateau period at each discharge rate. When the discharge rate is 1 C, the slope of the fitting is basically maintained at −2.322 × 10⁻⁷, the intercept is basically maintained at 4.017, and the voltage plateau period is maintained for a time ∆t of about 3056 s; when the discharge rate is 5 C, the slope of the fitting is basically maintained at −1.139 × 10⁻⁶, the intercept is basically maintained at 3.754, and the voltage plateau period is maintained for a time ∆t of about 592 s. The slope and intercept of the fitted line are decreasing with the increase in the discharge rate.
Table 2.
Parameters of the linear fitting curve equation for the voltage plateau period.
(2) Parameter analysis of the polynomial fitting curve equation for the voltage plateau period.
The parameters of the polynomial fit curve equation and the time used for the voltage plateau period, ∆t, are shown in Table 3. When the polynomial fitting was performed for the voltage plateau period at each discharge rate, the coefficient of determination R2 was greater than 0.995. When the discharge rate is 1 C, the fitted binomial B1 and monomial coefficients B2 are basically maintained at 5.592 × 10⁻¹⁴ and −3.958 × 10⁻⁷, respectively, with the intercept basically maintained at 4.091 and the voltage plateau maintained for a time ∆t of about 3056 s; when the discharge rate is 5 C, the fitted binomial and monomial coefficients are basically maintained at 1.656 × 10⁻¹² and −1.838 × 10⁻⁶, respectively, with the intercept basically maintained at 3.824 and the voltage plateau maintained for a time ∆t of about 592 s; when the discharge rate is 5 C, the binomial coefficient and one-term coefficient of the fitted curves are basically maintained at 1.656 × 10⁻¹² and −1.838 × 10⁻⁶, the intercept is basically maintained at 3.824, and the voltage plateau period is maintained at ∆t of 592 s; when the discharge rate is 9 C, the binomial coefficient and one-term coefficient of the fitted curves are basically maintained at 4.184 × 10⁻¹² and −3.120 × 10⁻⁶, the intercept is basically maintained at 3.571, and the voltage plateau period is maintained at ∆t of 306 s. The time of the voltage plateau is about 306 s; when the discharge rate is 11 C, the binomial coefficient and one-term coefficient of the fitted curves are basically maintained at 6.927 × 10⁻¹² and −3.730 × 10⁻⁶, the intercept is basically maintained at 3.449, and the voltage plateau period is maintained at ∆t of 245 s; it is evident that the binomial coefficient of the fitted curve ascends with the rise in discharge rate, while the monomial coefficient and intercept decline.
Table 3.
Parameters and time of the polynomial fitting curve equation for the voltage plateau period.
By comparing the linear fit and polynomial fit curve equation coefficient of determination R2 parameters, it can be found that the voltage–time polynomial fit curve equation decidability factor R2 is greater than the linear fitting linear equation coefficient of determination R2 at different discharge rates, and the polynomial fitting accuracy is higher than the linear fitting accuracy.
4.3. Analysis of Changes in Voltage and Capacity during the Voltage Plateau Period
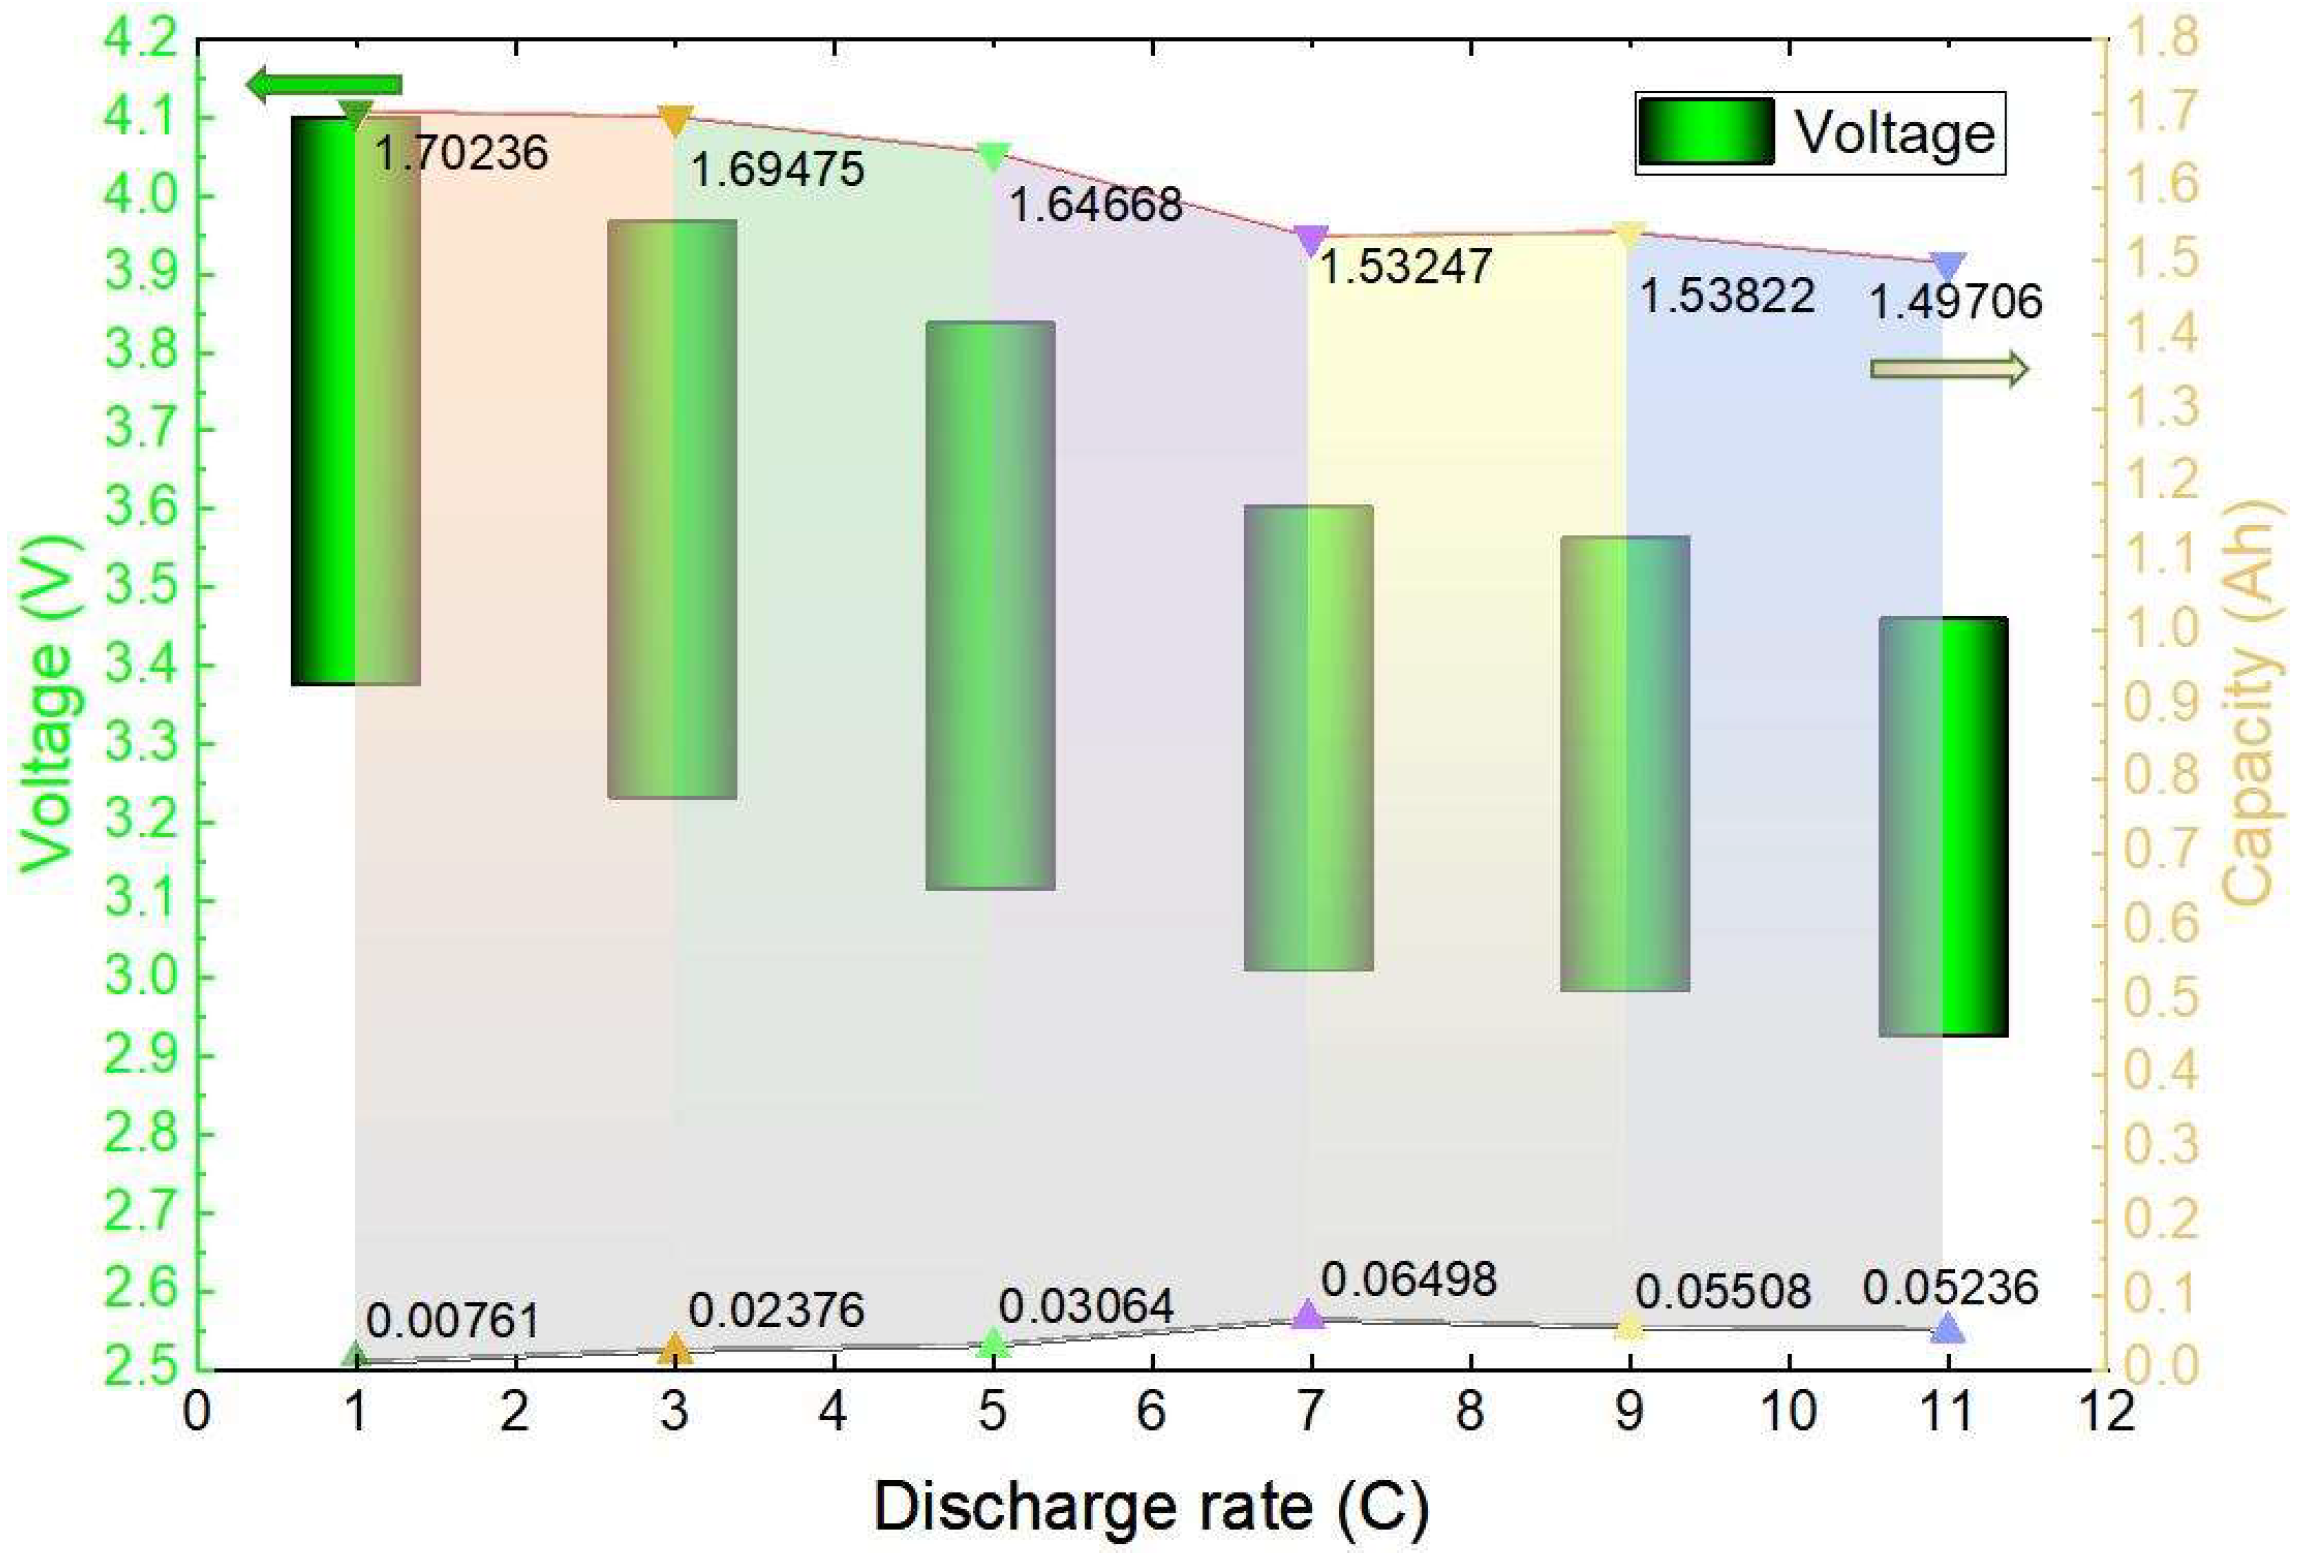
As shown in Figure 10, the voltage and capacity variation interval of the plateau period when the discharge is performed at different rates at an ambient temperature of 20 °C is plotted. When the 1 C discharge was performed, the voltage of the platform period dropped from 4.098 V to 3.373 V in the process, the battery capacity was discharged from 0.00761 Ah to 1.70236 Ah, and a total of 1.69475 Ah capacity was discharged, accounting for 86.45% of the total discharged capacity; when the 3 C discharge was performed, the voltage of the platform period dropped from 3.966 V to 3.228 V in the process, and the battery capacity was discharged from 0.02376 Ah to 1.66176 Ah, with a total capacity of 1.638 Ah, accounting for 84.11% of the total discharged capacity; when the same 5 C, 7 C, 9 C, and 11 C discharges were performed, the batteries discharged 1.64668 Ah, 1.53247 Ah, 1.53822 Ah, and 1.49706 Ah, respectively, accounting for 83.47%, 78.03%, 78.95%, and 78.42% of the total discharged capacity, respectively. The specific voltage change and capacity change during the voltage plateau period are illustrated in Figure 10. The green bar graph represents the voltage change, while the coloured portion illustrates the discharged capacity change. It is evident that with a lower discharge rate at the same temperature, a higher percentage of total capacity is discharged during the voltage plateau period. This results in less damage to the battery and ultimately extends its lifespan.
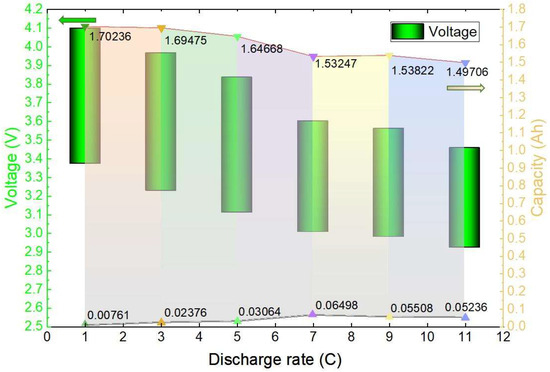
Figure 10.
Map of the voltage change and discharge capacity change areas during the voltage plateau period.
4.4. Comparative Analysis of Discharge Energy during the Voltage Plateau Period
Table 4 compares and analyses the phase discharge energy during the voltage plateau period at different ambient temperatures and judges the fitting accuracy by calculating the sample standard deviation σ of the experimental result and the fitting result . The equations for and are Equations (5) and (6):
where and are the discharge energy data derived from the experimental testbed at the beginning and end of the voltage plateau period, respectively.
Table 4.
Comparison of discharge energy during the voltage plateau period.
It can be observed that the polynomial fitting accuracy is above 95%, the fitting results have small errors, and the fitted equations have high confidence. In contrast, the sample standard deviation of the linear fitting results is larger and the accuracy is lower. The stage discharge energy of the voltage plateau period as a whole showed a decreasing trend with the increase in the discharge rate.
5. Conclusions
To gain a comprehensive understanding of the discharge performance of lithium batteries under various rates, cyclic charge/discharge experiments were conducted on cylindrical ternary lithium batteries. These experiments aimed to evaluate the end voltage, capacity, and temperature fluctuation patterns of lithium batteries, as well as the underlying mechanisms. Furthermore, the focus was on exploring the distinct characteristics of the voltage plateau phase during discharge at different rates. The following conclusions were drawn:
- (1)
- The overall discharge curve exhibits a consistent trend; however, the discharge rate significantly influences the maximum discharge capacity, energy output, discharge time, terminal voltage, and internal resistance of lithium batteries. Higher discharge rates result in shorter discharge times, lower battery voltage at the corresponding remaining capacity, and higher battery surface temperatures. At low ambient temperatures, limited heat dissipation leads to significant accumulation of Joule heat within the battery, which in turn reduces internal resistance and delays the time required to reach the discharge cut-off voltage. Consequently, within a certain range of discharge rates, the battery’s capacity does not decrease with an increase in the discharge rate.
- (2)
- During the voltage plateau period, the battery temperature increases gradually. Beyond the plateau period, there is a notable change in temperature, with more pronounced increases at higher discharge rates. The impact on battery lifespan is greater after discharging beyond the plateau period.
- (3)
- During the plateau phase, the time, capacity, and voltage used for discharging decrease as the discharge rate increases. At 1 C, 3 C, 5 C, 7 C, 9 C, and 11 C discharge rates, the battery voltage decreases from 4.098 V to 3.372 V, 3.966 V to 3.228 V, 3.835 V to 3.112 V, 3.600 V to 3.007 V, 3.561 V to 2.980 V, and 3.457 V to 2.923 V, respectively, with the discharged-capacity-to-total-capacity ratio decreasing from 86.45% to 78.42%. The variations in voltage and temperature during the plateau period are significantly reduced compared to the pre-discharge and post-discharge periods.
- (4)
- Polynomial and linear fittings were performed for the plateau period at different discharge rates, achieving fitting accuracies above 93%. Although polynomial fitting demonstrated higher accuracy, it is more susceptible to noise, whereas the linear model maintains accuracy while being computationally efficient.
To advance the study of battery performance under varying discharge rates, it is essential to broaden the comparison among diverse battery types, including cylindrical lithium-ion batteries. Conducting fitting analysis studies before and after the operational stage is crucial for investigating the charge and discharge behaviours at different stages, with the goal of refining the physical and chemical models of batteries. While the current research primarily focuses on cylindrical lithium-ion batteries, there are limitations since other battery types have not undergone extensive verification and refinement. Future research plans entail additional validation experiments using different battery samples. Despite the emphasis on this specific battery type, we are confident that expanding and validating our research will yield more universally applicable and scientifically valuable insights.
Author Contributions
Conceptualisation, X.W. and L.C.; methodology, software, and validation, Y.C. and S.L.; formal analysis, X.W. and L.C.; investigation, X.W. and Y.C.; resources, Y.Z.; data curation, S.L.; writing—original draft preparation, Y.C. and S.L.; writing—review and editing, X.W. and L.C.; visualisation, Y.C.; supervision, Y.Z.; project administration, Y.D.; funding acquisition, Y.D. All authors have read and agreed to the published version of the manuscript.
Funding
This research was funded by the National Natural Science Foundation of China (Grant No. 51905361); the Jiangsu Provincial Key Research and Development Program of China (Grant No. BE2021065); and the Natural Science Horizontal Research Project of Nantong University (Grant No. 22ZH643).
Data Availability Statement
The original contributions presented in the study are included in the article, further inquiries can be directed to the corresponding authors.
Acknowledgments
This research was supported by the Priority Academic Program Development of Jiangsu Higher Education Institutions (PAPD).
Conflicts of Interest
The authors declare no conflicts of interest.
References
- Liao, H.; Peng, S.; Li, L.; Zhu, Y. The role of governmental policy in game between traditional fuel and new energy vehicles. Comput. Ind. Eng. 2022, 169, 108292. [Google Scholar] [CrossRef]
- Wang, X.; Liu, S.; Zhang, Y.; Lv, S.; Ni, H.; Deng, Y.; Yuan, Y. A review of the power battery thermal management system with different cooling, heating and coupling system. Energies 2022, 15, 1963. [Google Scholar] [CrossRef]
- Zhou, P.; Zhu, L.; Fu, D.; Du, J.; Zhao, X.; Sun, B. Research on the Performance Improvement Method for Lithium-Ion Battery in High-Power Application Scenarios. Energies 2024, 17, 1746. [Google Scholar] [CrossRef]
- Wang, X.; Zhang, Y.; Deng, Y.; Yuan, Y.; Zhang, F.; Lv, S.; Zhu, Y.; Ni, H. Effects of Different Charging Currents and Temperatures on the Voltage Plateau Behavior of Li-Ion Batteries. Batteries 2023, 9, 42. [Google Scholar] [CrossRef]
- Sang, B.; Wu, Z.; Yang, B.; Wei, J.; Wan, Y. Joint Estimation of SOC and SOH for Lithium-Ion Batteries Based on Dual Adaptive Central Difference H-Infinity Filter. Energies 2024, 17, 1640. [Google Scholar] [CrossRef]
- Liu, Y.Q.; Lu, J.Y.; Li, X.P.; Song, J.L. Aging life characteristics of high-rate pulse discharged lithium battery. J. Nav. Univ. Eng. 2023, 35, 1–7. [Google Scholar]
- Wei, T.D. Research on Transmission System Parameters Matching and Optimization of Pure Electric Vehicle. Ph.D. Thesis, Jilin University, Changchun, China, 2023. (In Chinese). [Google Scholar]
- Li, K.; He, C.; Xie, L.; Liu, B.; Deng, S.S. Thermal management of 48_V soft-pack battery pack under high rate discharge condition. Energy Storage Sci. Technol. 2021, 10, 679–688. (In Chinese) [Google Scholar]
- Kim, Y.; Jacquet, Q.; Griffith, K.; Lee, J.; Dey, S.; Rinkel, B.L.; Grey, C.P. High rate lithium ion battery with niobium tungsten oxide anode. J. Electrochem. Soc. 2021, 168, 010525. [Google Scholar] [CrossRef]
- Yang, A.; Wang, Y.; Yang, F.; Wang, D.; Zi, Y.; Tsui, K.L.; Zhang, B. A comprehensive investigation of lithium-ion battery degradation performance at different discharge rates. J. Power Sources 2019, 443, 227108. [Google Scholar] [CrossRef]
- Naik, A.; Zhou, J.; Gao, C.; Liu, G.; Wang, L. Rapid and facile synthesis of Mn doped porous LiFePO4/C from iron carbonyl complex. J. Energy Inst. 2016, 89, 21–29. [Google Scholar] [CrossRef]
- Taleghani, S.T.; Marcos, B.; Zaghib, K.; Lantagne, G. A study on the effect of porosity and particles size distribution on Li-ion battery performance. J. Electrochem. Soc. 2017, 164, E3179. [Google Scholar] [CrossRef]
- Li, D.Q.; Zhang, Q.S.; Zheng, S.S. Influence of high rate charge and discharge cycle on the electronic performance and thermal safety of lithium ion battery. Lanzhou Univ. Technol. J. 2023, 49, 30–35. [Google Scholar]
- Yang, B.; Fan, L.P.; Gao, Y.H.; Chen, H.T.; Chen, S.K.; Yan, P. Study on the effect of discharge rate on capacity of high power lithium-ion battery. Machinery 2023, 61, 1–4. (In Chinese) [Google Scholar]
- Huang, Y.X.; Lai, H.X. Effects of discharge rate on electrochemical and thermal characteristics of LiFePO4/graphite battery. Appl. Therm. Eng. 2019, 157, 113744. [Google Scholar] [CrossRef]
- Daud, Z.H.C.; Chrenko, D.; Aglzim, E.H.; Keromnes, A.; LeMoyne, L. Experimental study of lithium-ion battery thermal behaviour for electric and hybrid electric vehicles. In Proceedings of the 2014 IEEE Vehicle Power and Propulsion Conference, Coimbra, Portugal, 27–30 October 2014; pp. 1–6. [Google Scholar]
- Ye, Y.; Shi, Y.; Cai, N.; Lee, J.; He, X. Electro-thermal modeling and experimental validation for lithium-ion battery. J. Power Sources 2012, 199, 227–238. [Google Scholar] [CrossRef]
- Wu, T.; Wang, C.; Hu, Y.; Liang, Z.; Fan, C. Research on electrochemical characteristics and heat generating properties of power battery based on multi-time scales. Energy 2023, 265, 126416. [Google Scholar] [CrossRef]
- Liu, J.; Zhang, Y.; Bai, J.; Zhou, L.; Wang, Z. Influence of lithium plating on lithium-ion battery aging at high temperature. Electrochimica 2023, 454, 142362. [Google Scholar] [CrossRef]
- Li, Y.; Hu, Y.; Liu, Q.G. Influence of discharge rate on cycling performance of lithium-ion battery. J. Power Sources 2006, 30, 488–491. [Google Scholar] [CrossRef]
- Jiang, C.N.; Li, H.; Luo, Y.T.; Xie, B.; He, X.C. Experimental study on the effect of temperature and discharge rate on battery performance. Sci. Technol. Eng. 2013, 13, 2496–2502. (In Chinese) [Google Scholar]
- Gang, N.; Bala, H.; Branko, N.P. Capacity fade study of lithium-ion batteries cycled at high discharge rates. J. Power Sources 2003, 117, 160–169. [Google Scholar]
- Wang, X.; Zhang, Y.; Ni, H.; Lv, S.; Zhang, F.; Zhu, Y.; Yuan, Y.; Deng, Y. Influence of Different Ambient Temperatures on the Discharge Performance of Square Ternary Lithium-Ion Batteries. Energies 2022, 15, 5348. [Google Scholar] [CrossRef]
- Mei, W.; Li, H.; Zhao, C.; Sun, J.; Wang, Q. Numerical study on thermal characteristics comparison between charge and discharge process for lithium ion battery. Heat Mass Transf. 2020, 162, 120319. [Google Scholar] [CrossRef]
- Wang, X.Y.; Wei, X.Z.; Zhu, J.G.; Dai, H.F.; Zheng, Y.J.; Xu, X.M.; Chen, Q.J. A review of modeling, acquisition, and application of lithium-ion battery impedance for onboard battery management. eTransportation 2021, 7, 100093. [Google Scholar] [CrossRef]
- Remmlinger, J.; Buchholz, M.; Meiler, M.; Bernreuter, P.; Dietmayer, K. State-of-health monitoring of lithium-ion batteries in electric vehicles by on-board internal resistance estimation. J. Power Sources 2011, 196, 5357–5363. [Google Scholar] [CrossRef]
- Chen, L.; Lv, Z.; Lin, W.; Li, J.; Pan, H. A new state-of-health estimation method for lithium-ion batteries through the intrinsic relationship between ohmic internal resistance and capacity. Measurement 2018, 116, 586–595. [Google Scholar] [CrossRef]
- Qiu, C.; He, G.; Shi, W.; Zou, M.; Liu, C. The polarization characteristics of lithium-ion batteries under cyclic charge and discharge. J. Solid State Electrochem. 2019, 23, 1887–1902. [Google Scholar] [CrossRef]
- Lou, T.T.; Zhang, W.G.; Guo, H.Y.; Wang, J.S. The internal resistance characteristics of lithium-ion battery based on HPPC method. In Advanced Materials Research; Trans Tech Publications Ltd.: Stafa-Zurich, Switzerland, 2012; Volume 455, pp. 246–251. [Google Scholar]
- Wei, X.; Zhu, B.; Xu, W. Internal resistance identification in vehicle power lithium-ion battery and application in lifetime evaluation. In Proceedings of the 2009 International Conference on Measuring Technology and Mechatronics Automation, Changchun, China, 9–12 August 2009; Volume 3, pp. 388–392. [Google Scholar]
- Huria, T.; Ceraolo, M.; Gazzarri, J.; Jackey, R. High fidelity electrical model with thermal dependence for characterization and simulation of high power lithium battery cells. In Proceedings of the 2012 IEEE International Electric Vehicle Conference, Greenville, NC, USA, 4–8 March 2012; pp. 1–8. [Google Scholar]
- Liang, X.M. Modeling and Output Performance of Aluminum Air Battery Based on DC Internal Resistance and AC Impedance. Ph.D. Thesis, Jiliang University, Hangzhou, China, 2021. (In Chinese). [Google Scholar]
- Zouhri, K.; Lee, S. Evaluation and optimization of the alkaline water electrolysis ohmic polarization: Exergy study. Int. J. Hydrogen Energy 2016, 41, 7253–7263. [Google Scholar] [CrossRef]
- Stolz, L.; Hochstadt, S.; Roser, S.; Hansen, M.R.; Winter, M.; Kasnatscheew, J. Single-ion versus dual-ion conducting electrolytes: The relevance of concentration polarization in solid-state batteries. ACS Appl. Mater. Interfaces 2022, 14, 11559–11566. [Google Scholar] [CrossRef]
- Eom, K.S.; Joshi, T.; Bordes, A.; Do, I.; Fuller, T.F. The design of a Li-ion full cell battery using a nano silicon and nano multi-layer graphene composite anode. J. Power Sources 2014, 249, 118–124. [Google Scholar] [CrossRef]
- Zhao, D.; Wei, C. Analysis of polarization and thermal characteristics in lithium-ion battery with various electrode thicknesses. J. Energy Storage 2023, 71, 108159. [Google Scholar] [CrossRef]
- Li, T.; Yuan, X.Z.; Zhang, L.; Song, D.; Shi, K.; Bock, C. Degradation Mechanisms and Mitigation Strategies of Nickel-Rich NMC-Based Lithium-Ion Batteries. Electrochem. Energy Rev. 2020, 3, 43–80. [Google Scholar] [CrossRef]
- Aurbach, D.; Markovsky, B.; Salitra, G.; Markevich, E.; Talyossef, Y.; Koltypin, M.; Nazar, L.; Ellis, B.; Kovacheva, D. Review on electrode–electrolyte solution interactions, related to cathode materials for Li-ion batteries. J. Power Sources 2007, 165, 491–499. [Google Scholar] [CrossRef]
- Barcellona, S.; Colnago, S.; Dotelli, G.; Latorrata, S.; Piegari, L. Aging effect on the variation of Li-ion battery resistance as function of temperature and state of charge. J. Energy Storage 2022, 50, 104658. [Google Scholar] [CrossRef]
- Chen, L.; Zhang, M.; Ding, Y.; Wu, S.; Li, Y.; Liang, G.; Li, H.; Pan, H. Estimation the internal resistance of lithium-ion-battery using a multi-factor dynamic internal resistance model with an error compensation strategy. Energy Rep. 2021, 7, 3050–3059. [Google Scholar] [CrossRef]
- Panchal, S.; Dincer, I.; Agelin-Chaab, M.; Fraser, R.; Fowler, M. Experimental and theoretical investigation of temperature distributions in a prismatic lithium-ion battery. Int. J. Therm. Sci. 2016, 99, 204–212. [Google Scholar] [CrossRef]


Disclaimer/Publisher’s Note: The statements, opinions and data contained in all publications are solely those of the individual author(s) and contributor(s) and not of MDPI and/or the editor(s). MDPI and/or the editor(s) disclaim responsibility for any injury to people or property resulting from any ideas, methods, instructions or products referred to in the content. |
© 2024 by the authors. Licensee MDPI, Basel, Switzerland. This article is an open access article distributed under the terms and conditions of the Creative Commons Attribution (CC BY) license (https://creativecommons.org/licenses/by/4.0/).