Article

Density-Driven CO2 Dissolution in Depleted Gas Reservoirs with Bottom Aquifers

1
State Key Laboratory of Shale Oil and Gas Enrichment Mechanisms and Effective Development, Beijing 102206, China
2
SINOPEC Key Laboratory of Carbon Capture, Utilization and Storage, Beijing 102206, China
3
SINOPEC Exploration & Production Research Institute, Beijing 102206, China
4
State Key Laboratory of Petroleum Resources and Prospecting, China University of Petroleum, Beijing 102249, China
*
Author to whom correspondence should be addressed.
Energies 2024, 17(14), 3491; https://doi.org/10.3390/en17143491
Submission received: 4 June 2024 / Revised: 11 July 2024 / Accepted: 12 July 2024 / Published: 16 July 2024

Abstract

:
Depleted gas reservoirs with bottom water show significant potential for long-term CO2 storage. The residual gas influences mass-transfer dynamics, further affecting CO2 dissolution and convection in porous media. In this study, we conducted a series of numerical simulations to explore how residual-gas mixtures impact CO2 dissolution trapping. Moreover, we analyzed the CO2 dissolution rate at various stages and delineated the initiation and decline of convection in relation to gas composition, thereby quantifying the influence of residual-gas mixtures. The findings elucidate that the temporal evolution of the Sherwood number observed in the synthetic model incorporating CTZ closely parallels that of the single-phase model, but the order of magnitude is markedly higher. The introduction of CTZ serves to augment gravity-induced convection and expedites the dissolution of CO2, whereas the presence of residual-gas mixtures exerts a deleterious impact on mass transfer. The escalation of residual gas content concomitantly diminishes the partial pressure and solubility of CO2. Consequently, there is an alleviation of the concentration and density differentials between saturated water and fresh water, resulting in the attenuation of the driving force governing CO2 diffusion and convection. This leads to a substantial reduction in the rate of CO2 dissolution, primarily governed by gravity-induced fingering, thereby manifesting as a delay in the onset and decay time of convection, accompanied by a pronounced decrement in the maximum Sherwood number. In the field-scale simulation, the injected CO2 improves the reservoir pressure, further pushing more gas to the producers. However, due to the presence of CH4 in the post-injection process, the capacity for CO2 dissolution is reduced.

1. Introduction

Human-made greenhouse gas emissions are the main driver of global warming and climate change [1]. Carbon geo-sequestration emerges as the most effective strategy to mitigate CO2 emissions and advance towards carbon neutrality [2,3]. Suitable locations for CO2 geological storage are identified as deep saline aquifers, depleted hydrocarbon reservoirs, and unmineable coal seams [4,5,6,7]. Among these, depleted gas reservoirs are notably cost-effective for CO2 sequestration, benefiting from existing transportation and injection infrastructure and the use of abandoned wells [8]. Additionally, extensive research over the years has thoroughly assessed the integrity of caprock, sealing capacity, and storage potential of these gas reservoirs, ensuring long-term isolation of CO2 from the atmosphere and reducing leakage risks [9].
The presence of formation water in depleted gas reservoirs provides the potential to enhance storage capacity and mitigate gas leakage risks for injecting CO2 [10,11]. This injection process, influenced by various forces and reactions, enables CO2 to be trapped in different forms: mobile and immobile, through structural, residual, solubility, and mineral trapping mechanisms [12]. Each mechanism is predominant at different stages of the injection and post-injection processes [13,14]. Enhancing solubility trapping, in particular, is essential to ensure the long-term storage of CO2 and guarantee the security of carbon sequestration. The dissolved CO2 ceases to exist as a distinct phase, thereby eliminating buoyancy-driven migration and minimizing the risk of leakage [15]. In addition, propelled by density variance, CO2-rich brine descends, inducing convection with ambient brine, thereby enhancing dissolution rates and expanding storage capacity [16]. Moreover, the dissolved CO2 may undergo geochemical reactions with cations in brine, such as calcium and magnesium, resulting in carbonate precipitates [17]. However, this reaction is typically a slow process spanning thousands of years [18], which falls beyond the scope of this work.
Due to the pivotal role of density-driven convection in solubility trapping and long-term carbon sequestration, a multitude of researchers have meticulously explored the intricacies of this mass transfer phenomenon [19,20,21]. By introducing dimensionless parameters like the Rayleigh number, onset time of convection, Sherwood number, and dissolution rate, it becomes possible to quantify the convective mixing process and assess the impact of associated influencing factors [22,23,24]. Previous studies have simplified theoretical models to single-phase and single-component, aiming to mitigate nonlinearity and enhance solution efficiency [25,26]. In contrast to the aforementioned models, the depleted gas reservoir stands out as multi-phase and multi-component due to the substantial presence of natural gas within the formation [27,28]. Furthermore, the considerable variation in gas saturation and composition, stemming from reservoir heterogeneity, significantly impacts both the height of the gas-water transition zone and the dynamics of CO2 dissolution [29]. Consequently, conventional models fail to precisely depict the intricate dynamics of solubility trapping at a small scale within the depleted gas reservoir. While certain researchers delve into investigating the impact of gas impurities [30,31,32], additional investigation into density-driven convection regarding residual gas and the capillary transition zone remains imperative.
Though some researchers focus on the effect of gas impurities on CO2 dissolution, a fixed boundary condition with single-phase flow is assumed. In addition, the complexity of accurately modeling the multiphase flow and mass transfer processes due to heterogeneous reservoir properties is still challenging. In this work, a sequence of numerical simulations was conducted to investigate the influence of gas mixtures and the capillary transition zone on solubility trapping dynamics within a depleted gas reservoir. Initially, a newly developed thermodynamic model, integrating modified cubic equations of state with an activity model, was introduced to accurately depict phase behavior. Subsequently, the Delft Advanced Research Terra Simulator (DARTS) was employed to efficiently and precisely model density-driven convection within the depleted gas reservoir by synthetic models and a realistic model. We focused on understanding the mass transport dynamics in the capillary transition zone, particularly under varying gas impurity conditions, using dimensionless parameters for analysis. Finally, our work was concluded by summarizing key findings derived from the numerical simulation results.

2. Materials and Methods

2.1. Conservation Equations

In this study, we consider the presence of both gas and liquid phases within a depleted gas reservoir. Specifically, these phases consist of three components: carbon dioxide (CO2), methane (CH4), and formation water. The main governing equations, along with the auxiliary equations, succinctly describe the dynamics of this two-phase, three-component isothermal flow system:
t ϕ s j = 1 n p x c j ρ j S j + d i v j = 1 n p x c j ρ j μ j + S j ρ j J c j + j = 1 n p x c j ρ j q ˜ j = 0 , c = 1 , 2 , n c ,
where, ϕ is porosity; xcj is the molar fraction of component c in phase j; ρj and sj are phase density and saturation, respectively; μj is the phase Darcy velocity; Dcj is the diffusion coefficient of component c. Jcj is the Fick’s diffusion flux of component c.
Darcy’s law, expressed by Equations (2)–(4), is implemented to describe two-phase flow in porous media:
v j = K s k r j μ j p j ρ j g D ,
p w = p n p c ,
j = 1 n p S j = 1 ,
J c j = ϕ D c j x c j ,
where K is the permeability tensor of the matrix, vj is the phase viscosity [mPa·s], and K r j is the phase relative permeability, p j , g and Dare phase pressure [bar], gravitational acceleration constant [m/s2] and the depth of the domain [m]. Capillary pressure pe, often expressed as a function of saturation, is the pressure difference between the non-wetting p v , and wetting phase p w , x is a mass fraction, D is diffusion coefficient.
Furthermore, the rock is compressible, reflecting the change of porosity with pressure through:
ϕ = ϕ 0 1 + c r p p r e f ,
where ϕ 0 , p r e f is the reference pressure and c r is the rock compressibility.

2.2. Thermodynamic Model

The presence of residual natural gas and high salinity brine can alter the dynamic and thermal properties of fluids, thereby influencing mass-transfer behavior and the capacity for CO2 sequestration. Central to understanding these effects is a thermodynamic model that delineates the equilibrium state between aqueous and non-aqueous phases. This model is fundamental for the accurate calculation of fluid properties and for performing reliable numerical simulations. It operates under the assumption that the thermodynamic properties of the phases are in a state of instantaneous local equilibrium. Specifically, for gas-liquid systems, the relevant aspects of the model are encapsulated in Equations (5)–(8):
z c V y c L x c = 0 , c = 1 , 2 , n c ,
f c V p , T , y c f c L p , T , x c = 0 , c = 1 , 2 , n c ,
i = 1 n c x c y c = 0 ,
V + L = 1 ,
where L and V are the mole fraction of the liquid and gas phases, respectively. z c is the overall composition. x c and y c are the mole fraction of component c in liquid and gas phases, respectively. f i v and f i l denote the fugacity of component c in gas and liquid phases, respectively.
Given the substantial influence of gas mixtures and salinity on the phase behavior of gas-liquid systems, we adopt the fugacity-activity model for solving thermodynamic equilibrium. This method enables the calculation of the phase-equilibrium constant for each component:
K c = y c x c = a c h c p ϕ ,
where h c and a c are Henry’s constant and activity coefficient of component c , respectively; ϕ c is the fugacity coefficient of component c in the gas phase.
The calculation of the phase-equilibrium constant for the water component can be effectively conducted using the model proposed by Spycher [33]:
K H 2 O = K H 2 O 0 ϕ H 2 O p exp ( p 1 ) V H 2 O R T ,
where K H 2 O 0 and V H 2 O represent the equilibrium constant of the water component at reference pressure (0.1 MPa) and the average partial molar volume of water. H 2 O denotes the fugacity coefficient; R and T are the ideal gas constant and temperature, respectively.
The thermodynamic model is iteratively solved using the Rachford-Rice equation, as delineated in Equations (11)–(13):
g V = i = 1 n c z i K i 1 V K i 1 + 1 = 0 ,
x j = z j 1 + V K i 1 ,
y i = K i x i .
The iterative calculation of phase molar fractions and component partitioning is achievable through multistage negative flash analysis. Utilizing the outcomes of these negative flash calculations, the corresponding thermophysical properties (e.g., viscosity, density) can be determined by applying relevant relationships [34,35,36,37].

2.3. Numerical Model and Characteristic Parameters

The simulation considers a porous medium with impermeable closed boundaries (rastered) and open boundaries (non-rastered), as depicted in Figure 1a. Above the formation water lies a stagnant capillary transition zone (CTZ), where the formation water is saturated with CO2 and methane, constituents of residual natural gas. Furthermore, to better understand the impact of the CTZ on density-driven convection, a single-phase model, maintaining a constant concentration of the dissolved gas at the top blocks, is used to serve as a basis for comparison (Figure 1b). To trigger CO2 fingers, the concentration is initially perturbed just below the CO2 emplacement with random values from a uniform distribution between 0 and a very small value (in this work, it’s 10−6 mol/mol).
The realistic model used in this work is a tight gas reservoir with 5100 m in length and 4400 m in width, located in the east of China (see Figure 1c,d). We use it to examine the impact of mixtures on CO2 dissolution. This reservoir has an average vertical thickness of 250 m, spanning depths from 1191 to 1432 m. The gas-water contact occurs at a depth of 1345 m. Permeability varies from 0.07 to 2.15 mD, while porosity ranges from 0.005 to 0.054. The field contains 22 production wells and 6 injection wells, including two horizontal wells situated at the center of the gas layer. We maintain a production-to-injection ratio of 1.0. A CO2 displacement process is conducted over 8 years, followed by 50 years of shut-in to monitor CO2 migration. The average daily gas injection rate is 6000 m3 for vertical wells and 15,000 m3 for horizontal wells. The reservoir is currently at an average pressure of 10.5 MPa, with the daily gas production rate per well decreasing swiftly. The numerical model grid comprises 128 × 109 × 40 = 558,080 total cells, with 299,240 active cells.
Here a Corey-type relative-permeability model [38] is applied for calculation of phase relative permeability and capillary pressure. Capillary pressure and relative permeability can be determined through effective water saturation, as defined:
S e = S w S w r 1 S w r ,
k r w = S e n w ,
k r g = k r g e S w r 1 S e 2 1 S e n g ,
p c = p e S e 1 / λ ,
where P e , λ and S e are entry pressure, pore-size distribution coefficient, and effective water saturation, respectively. S w r is connate water saturation. k r w and k r g denote water and gas relative permeability, respectively.
Detailed parameters for numerical models are summarized in Table 1. The corresponding relative-permeability and capillary-pressure curves are shown in Figure 2.
In this work, we present an analysis of the mass-transfer behavior during density-driven convection, focusing on two key metrics: the CO2 dissolution rate and the Sherwood number (Sh). The CO2 dissolution rate, F, is utilized to measure the mass flux of CO2 per unit area across the top boundary into the formation water.
F = H ϕ c ¯ t
where H is the thickness of pure-water zone, c ¯ is the average CO2 concentration in formation water.
The Sherwood number is characterized as the ratio of the dissolution rate to the rate of diffusive mass transport.
S h = R c + R d i f f R d i f f ,
where, Rc and Rdiff denote the mass transfer rate by convection and diffusion, respectively.
In addition, we incorporate two additional key parameters, onset and decay time, to delve into the nuances of density-driven convection across various phases. Owing to the lack of a universally accepted definition for these terms, we adopt the methodology proposed by Pau and Li [39]. We define onset time as the moment when the CO2 dissolution rate exceeds the diffusion-induced rate by 2%, and decay time as the point at which mass transport in formation water begins to diminish [39]. Utilizing these parameters in our numerical model, we simulate the density-driven convection process over 400 years. This simulation aims to explore the influence of CTZ and residual natural gas concentration on the efficiency of solubility trapping. To improve computational efficiency, the Delft Advanced Research Terra Simulator (DARTS) is used to perform all simulations. DARTS has been proven to be an efficient and accurate simulator through a series of benchmark studies related to various energy applications due to the application of the Operator-Based Linearization approach [26,40,41]. The OBL approach starts by grouping all physical properties fully defined by the thermodynamic state into state-dependent terms. The state-dependent terms are parameterized in physical space at the preprocessing stage or adaptively with a limited number of supporting points [42]. Then, in the course of a simulation, the physical terms in the current timestep are evaluated based on a multi-linear interpolation strategy [41,42].

3. Results

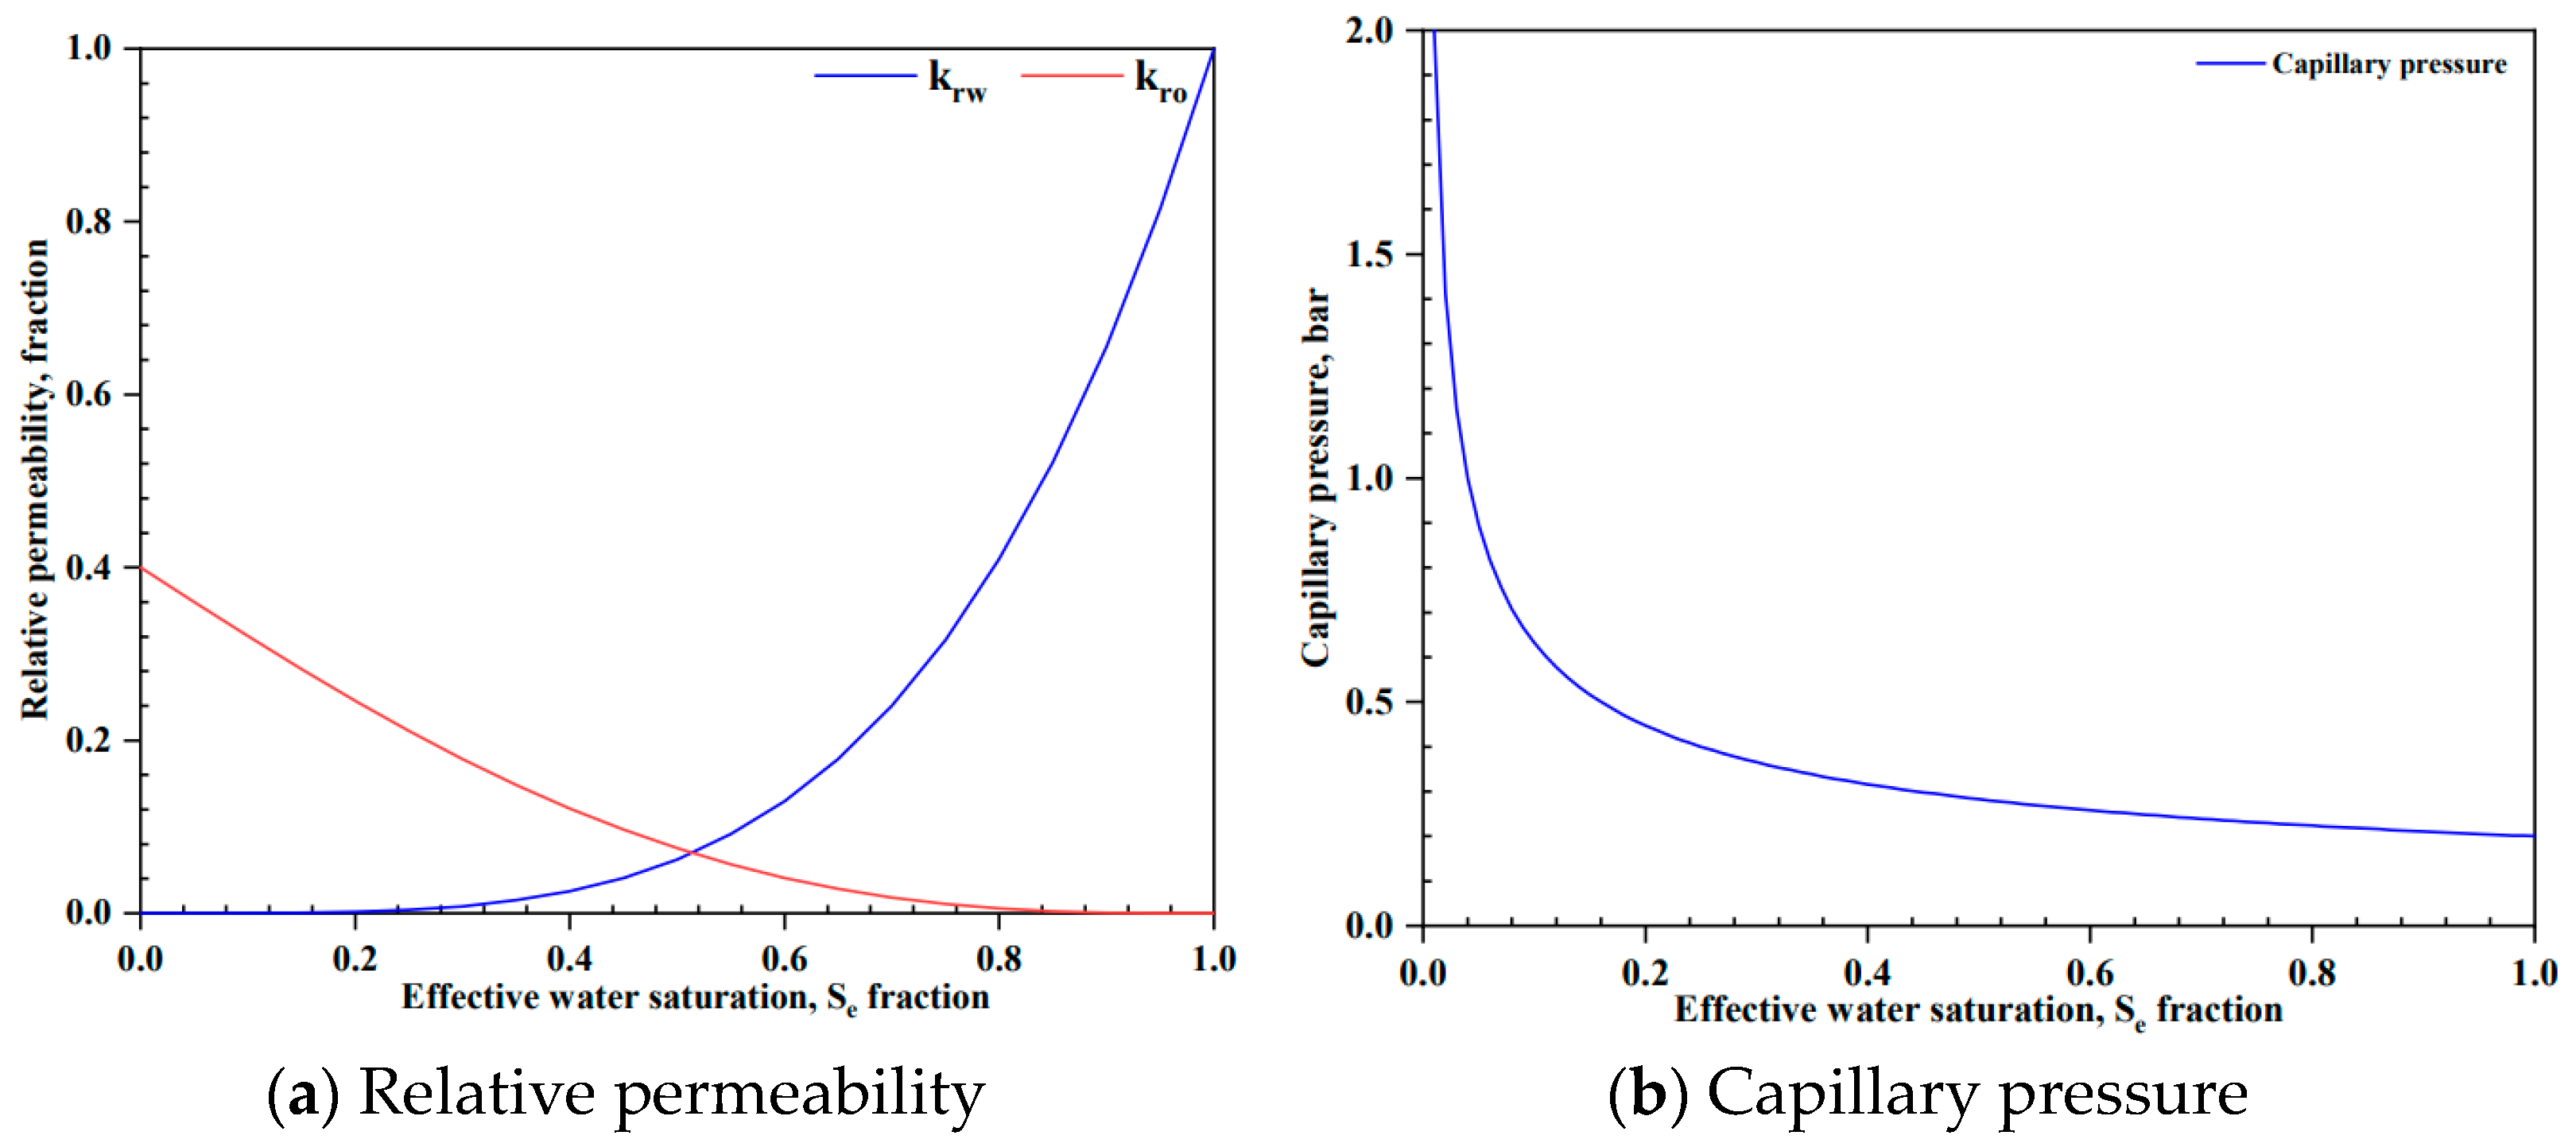
3.1. Effect of the Capillary Transition Zone

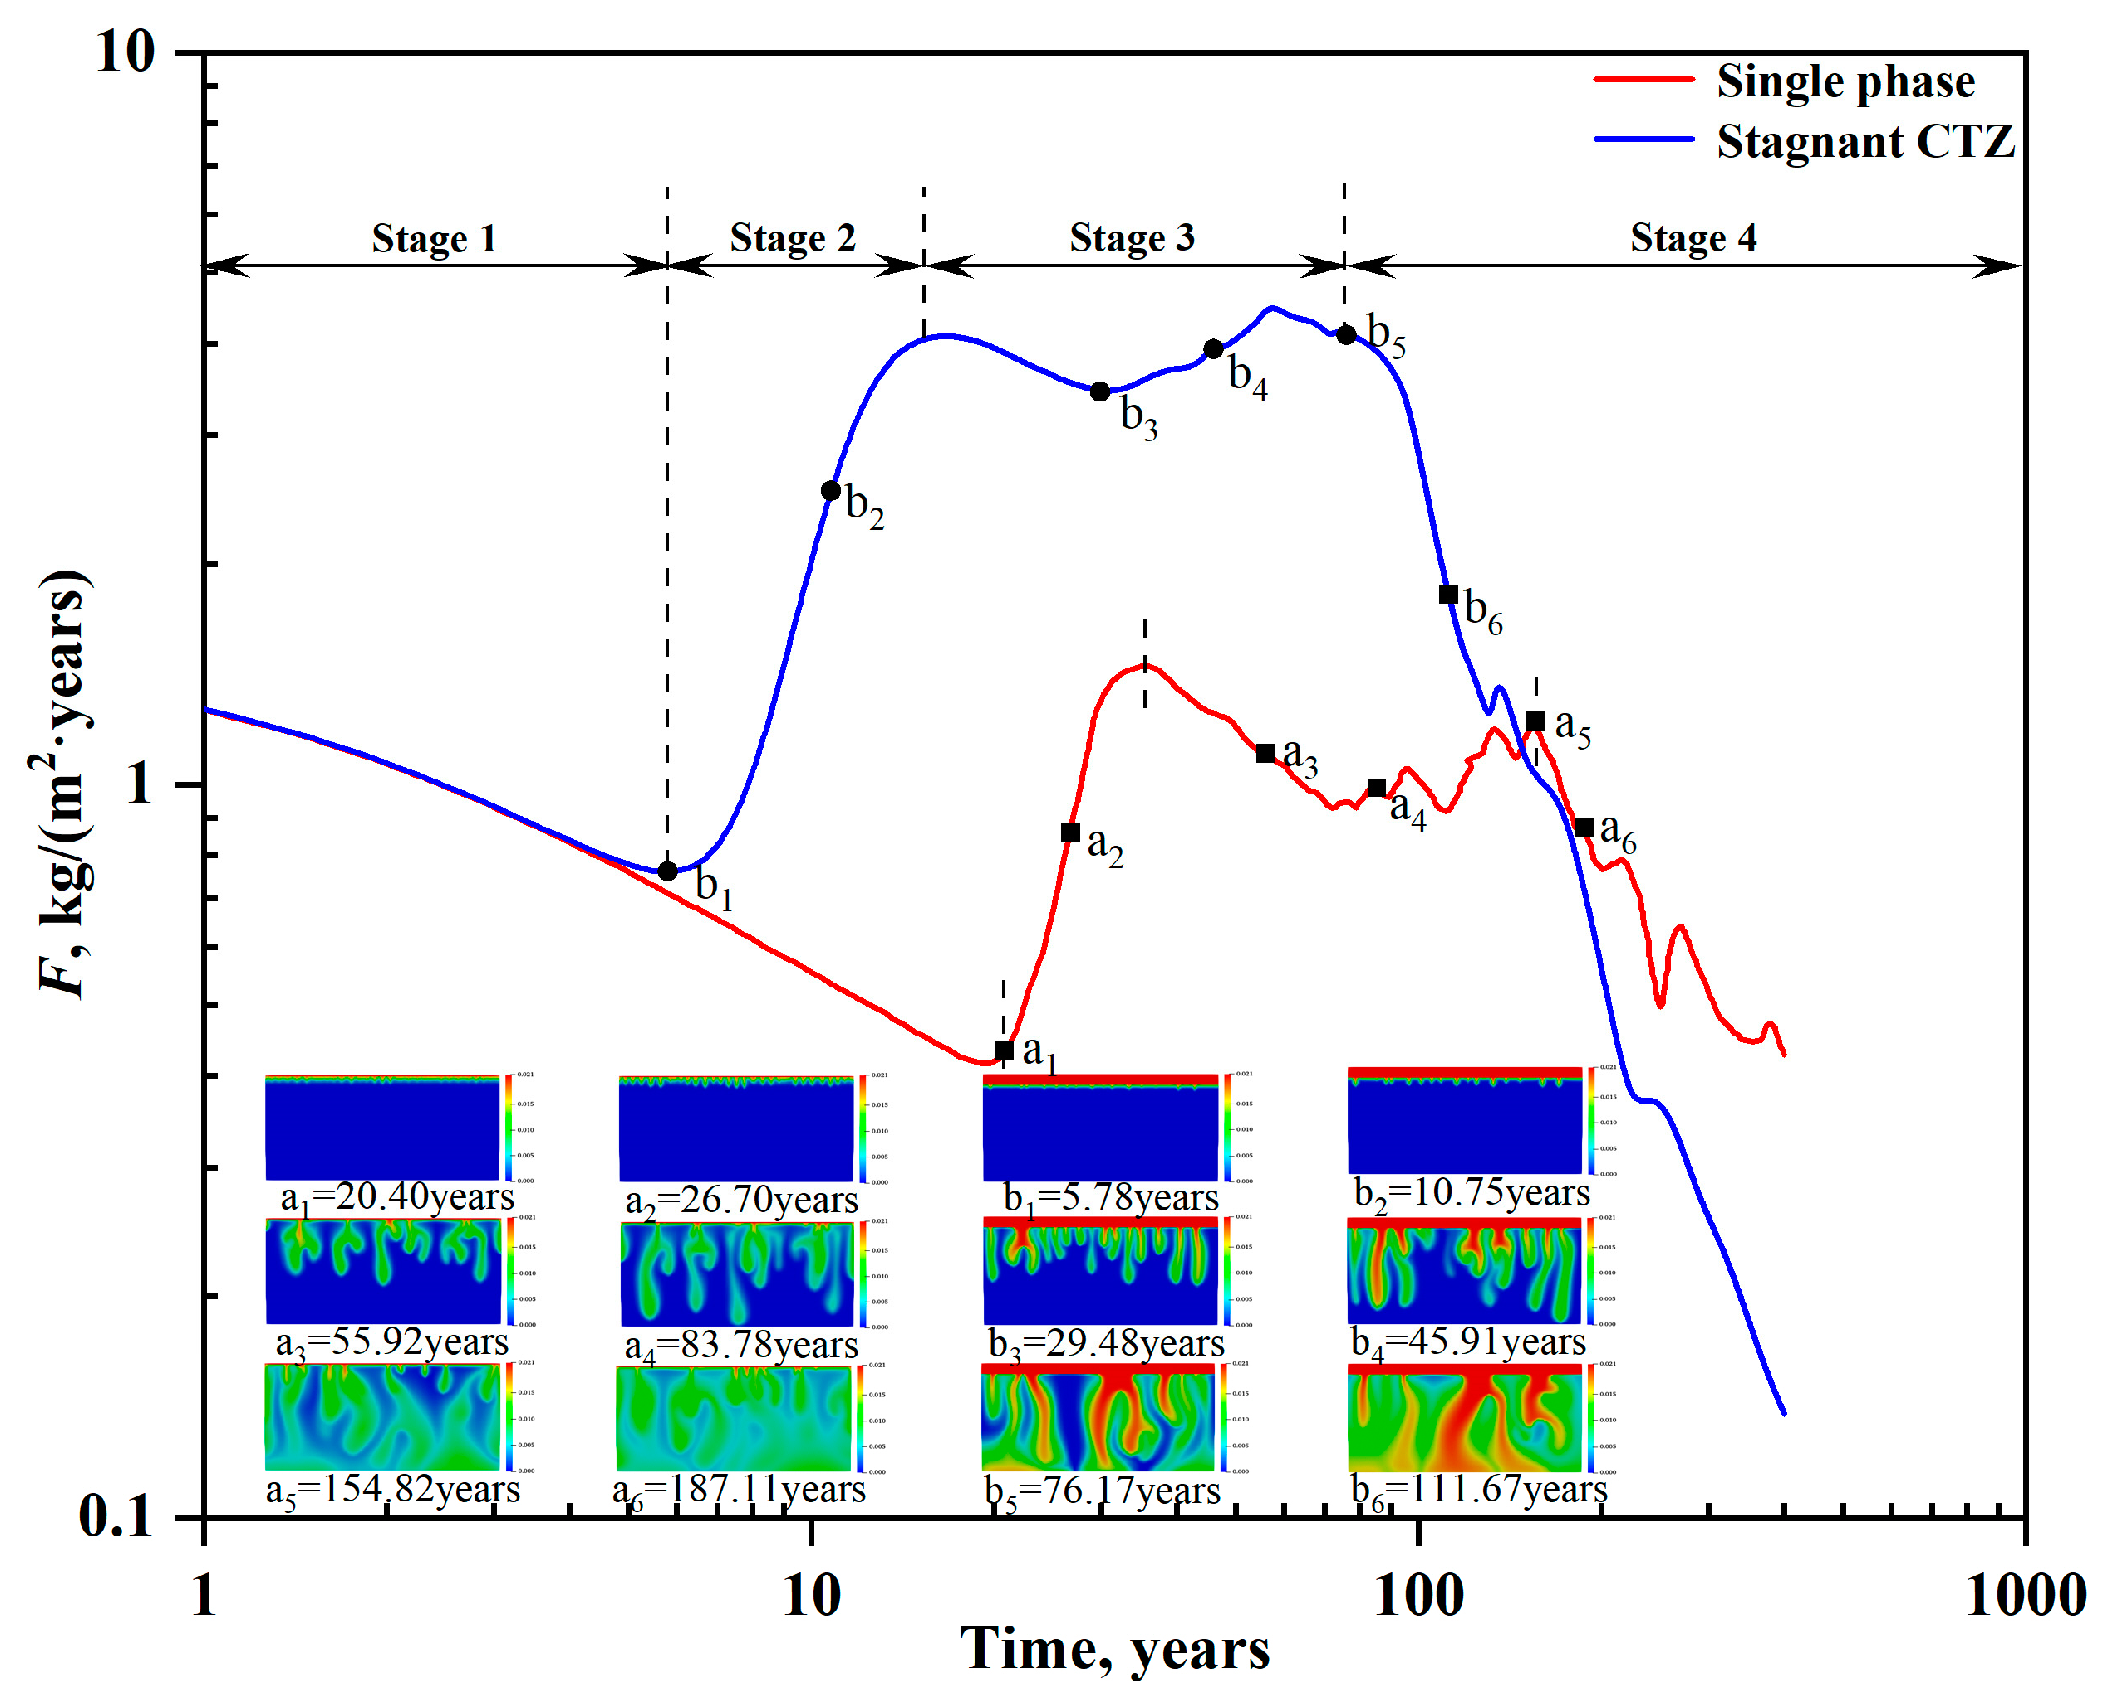
3.1.1. CO2 Dissolution Rate

We first compare the dissolution rate and distribution of dissolved CO2 in formation water to understand how CTZ affects density-driven convection. Figure 3 illustrates that CO2 dissolution with CTZ occurs in four stages: Diffusion (Stage 1), Convection-Strengthened (Stage 2, a2, b2), Convection-Dominated (Stage 3, a3, b3), and Convection-Decay (Stage 4, a6, b6). This result is similar to the one observed in single-phase simulations. In Stage 1, the CO2 dissolution rate is the same for both simulations because molecular diffusion predominantly drives mass transfer, showing minimal impact of stagnant CTZ on CO2 dissolution. The CTZ introduces a more pronounced disturbance to the concentration boundary compared to a single-phase, constant-concentration boundary. This is primarily due to the enhanced fluid mobilities associated with the CTZ, which leads to an earlier initiation of density-driven convection (bl). Additionally, there is a faster increase in the dissolution rate during Stage 2 and an elevated mass flux into the formation water during Stage 3. The ongoing dissolution process, driven by the stagnant CTZ, progressively impedes mass transport within the formation water. Consequently, the dissolution rate diminishes, transitioning to a convection-decay phase (Stage 4, b5) approximately 78 years earlier than predicted by the single-phase simulation. In summary, the CTZ significantly accelerates the dissolution of a substantial portion of the injected CO2 into the formation water over a relatively short period. Relying solely on the single-phase simulation could result in inaccurate assessments of convective mixing evolution and the extent of dissolution trapping in depleted gas reservoirs containing bottom water.

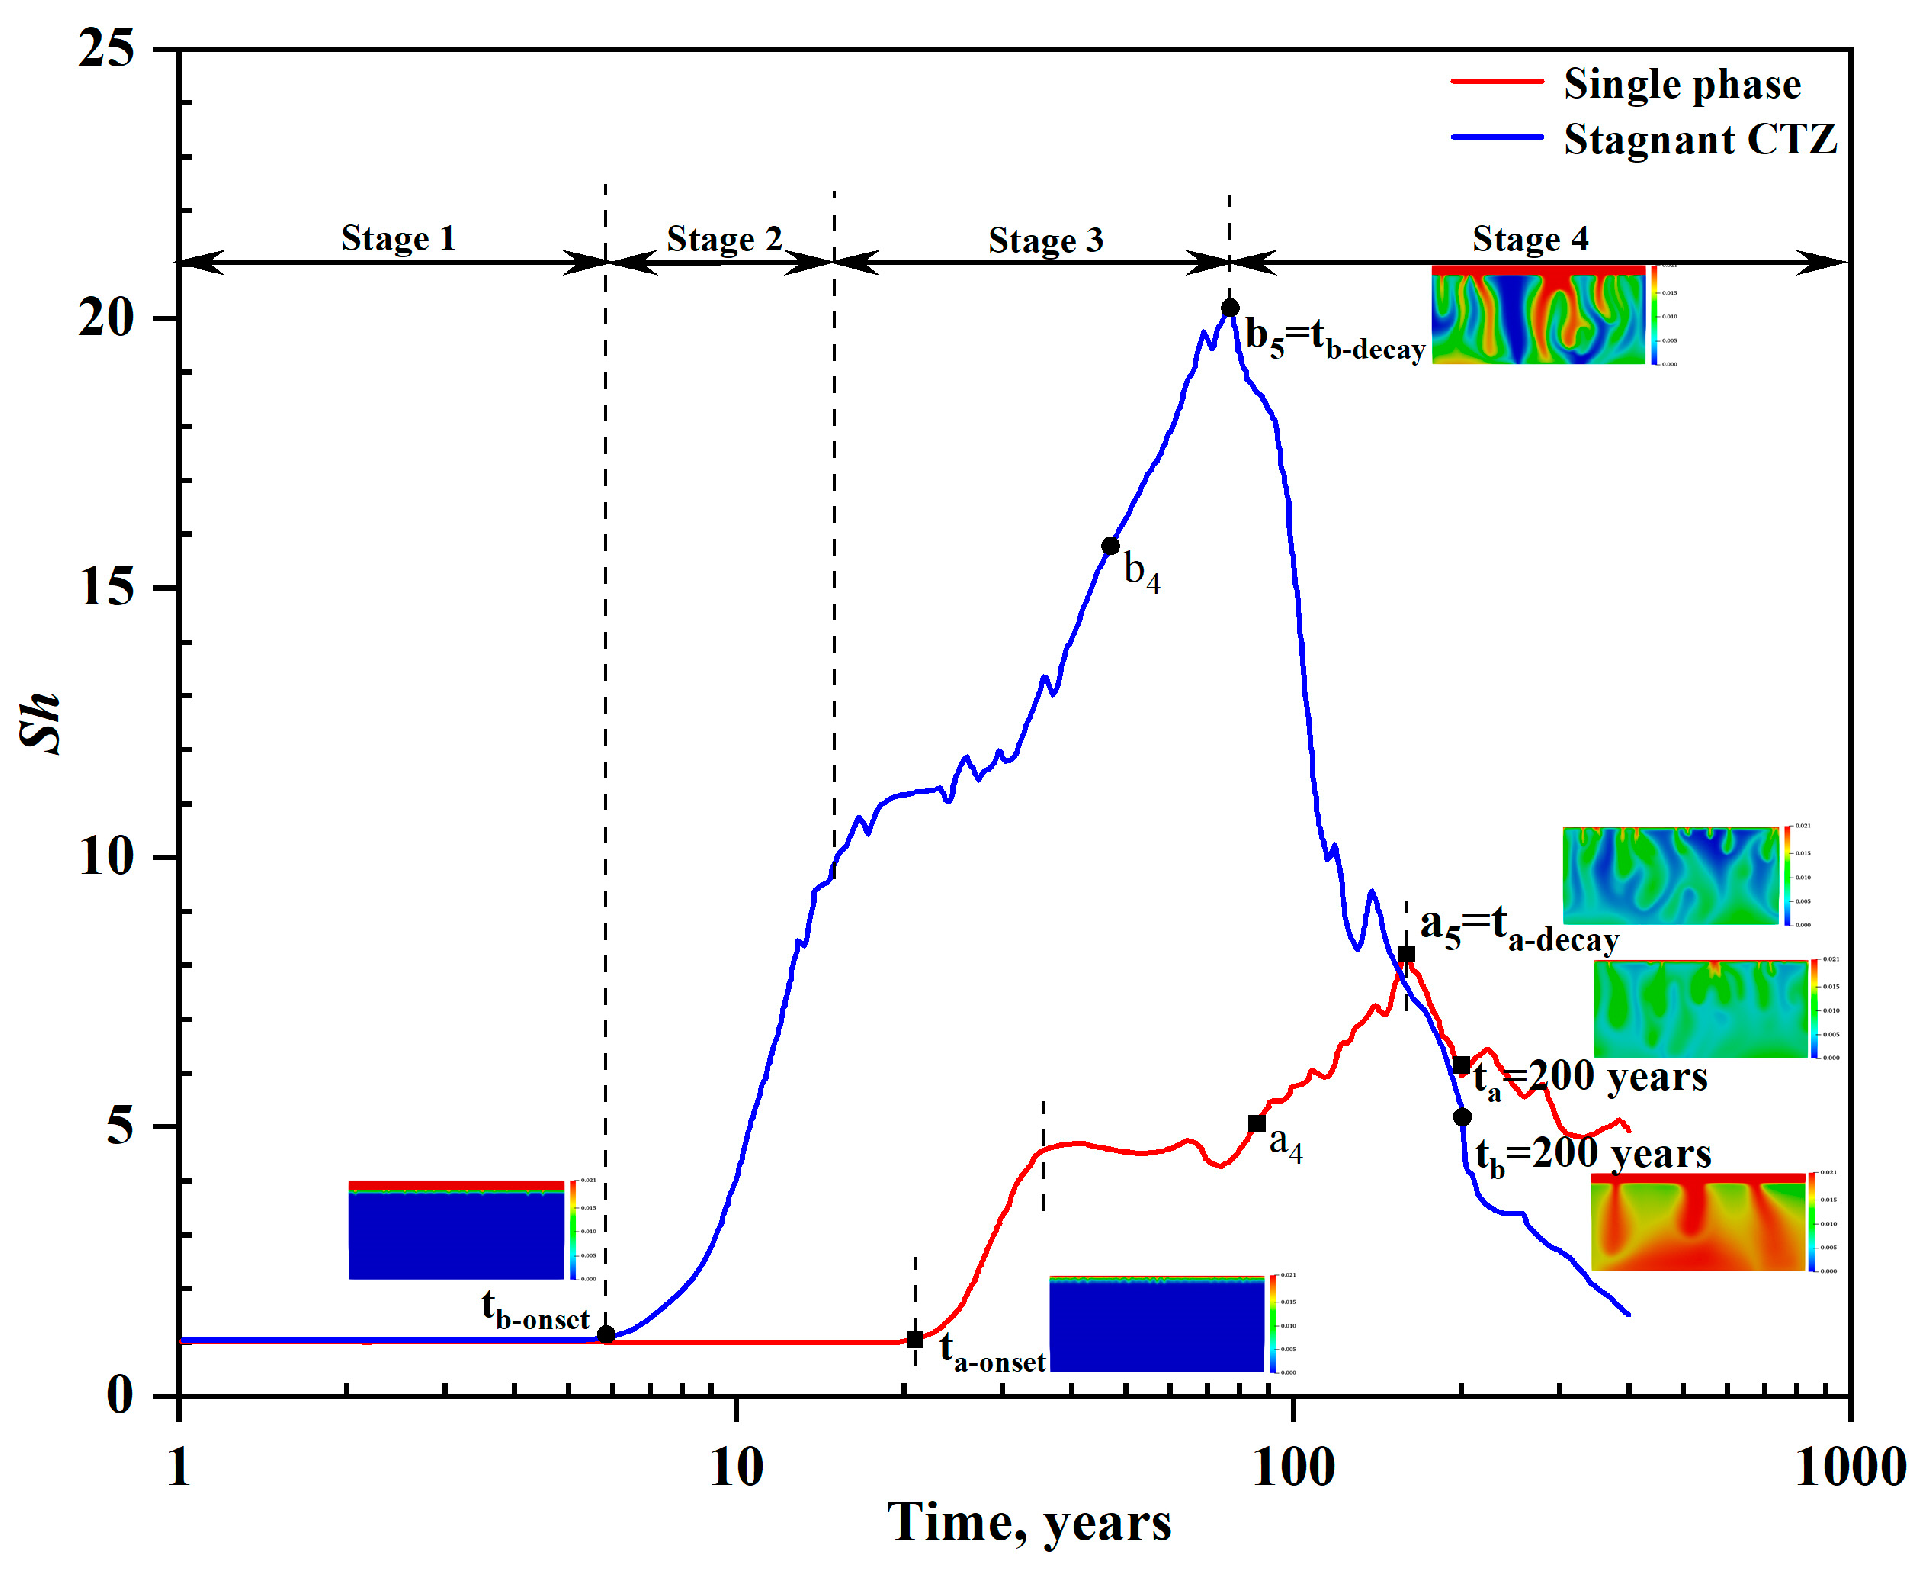
3.1.2. Sherwood Number

Figure 4 illustrates the progression of the Sherwood number in both single-phase and two-phase simulations. This progression, for both simulations, encompasses four stages, each aligning with changes in the dissolution rate. Notably, during Stages 2 and 3, the Sherwood number in the two-phase model is markedly higher than in the single-phase model, attributed to the vigorous perturbation and density-driven convection caused by the stagnant CTZ. The peak Sherwood number timing in both simulation types coincides well with the decay time depicted in Figure 3. However, it is important to note a discrepancy: the time at which convective fingers reach the bottom boundary (a4, b4) does not align with the decay time (a5, b5), diverging from findings in small-scale numerical simulations. The field-scale model, in contrast to its small-scale counterpart, exhibits lower permeability, significantly restricting the lateral expansion of CO2-rich brine. Furthermore, the larger dimensions of the field-scale model diminish the influence of leading fingers. Consequently, both the dissolution rate and the Sherwood number continue to rise until the concentration of dissolved CO2 reaches a certain threshold.

3.2. Effect of Residual Natural Gas Concentration

3.2.1. CO2 Dissolution Rate

Figure 5a illustrates the progression of the CO2 dissolution rate across varying concentrations of residual natural gas, spanning from 0% to 30%. The presence of gas mixtures adversely affects the initial three stages of solubility trapping. As the concentration of residual natural gas rises, it increasingly hinders the dissolution and mass transport of CO2 in brine. Consequently, the onset time of the process is prolonged, escalating from 5.78 years to 10.50 years, and the decay time also increases, from 76.17 years to 122.75 years. Despite the extension of the second and third stages due to increased gas mixtures, there is a marked reduction in the CO2 inventory, as shown in Figure 5b. This reduction significantly compromises the safety of carbon storage.

3.2.2. Sherwood Number

Figure 6 depicts how the Sherwood number changes with varying compositions of the gaseous phase. Initially, the Sherwood number remains constant at one, indicating the diffusion-dominated stage 1. The duration of Stage 1 extends as gas impurity increases, reflecting a reduction in CO2 diffusion efficiency and convective stability. As mass transfer progresses, the Sherwood number rises gradually. However, increased gas impurity leads to a decline in the maximum Sherwood number, falling from 20.18 to 12.75, due to hindered diffusion and impeded density-driven convection. This reduction in the maximum Sherwood number signifies a substantial decrease in convection intensity. During the convection-decay stage (Stage 4), there is a sharp decrease in the Sherwood number. Despite this, convection remains relatively intense in formation water with lower dissolved CO2 concentrations, especially in gas with higher impurity levels. Consequently, the Sherwood number for gases with higher residual natural gas concentration progressively exceeds that of gases with less impurity.

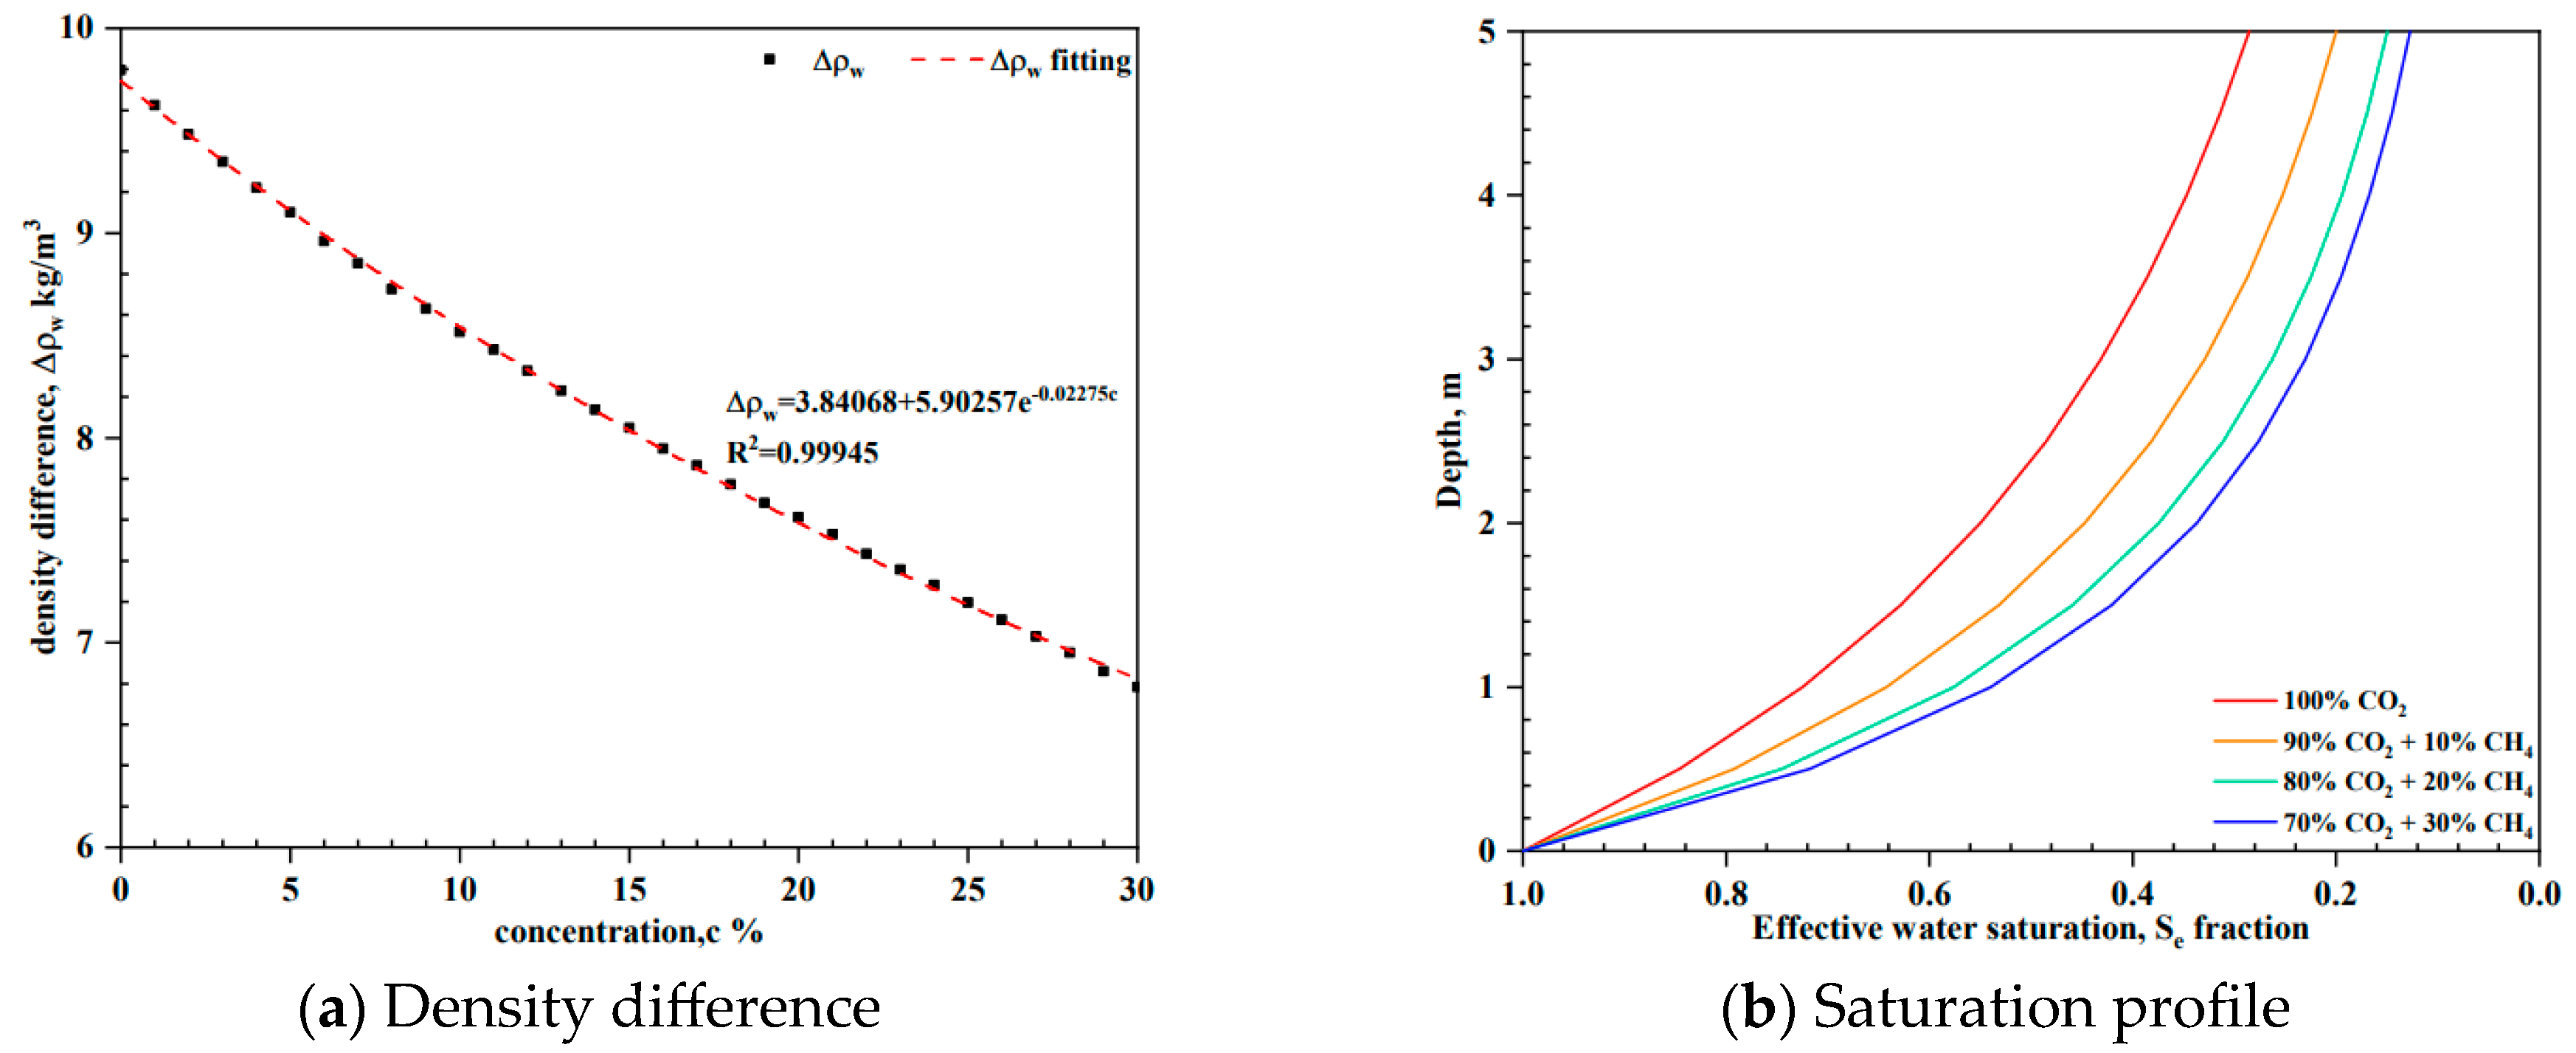
3.2.3. Density Difference and Saturation Profile

The variations in density between ambient brine and CO2-enriched brine, along with changes in the saturation profile within the stagnant CTZ, are illustrated in Figure 7. As gas mixtures increase, the density difference in the formation water gradually diminishes. This is attributed to the reduced partial pressure of CO2 and its subsequent solubility. Consequently, the diminishing density difference lessens the driving force of gravity-induced convection, thereby extending the duration of solubility trapping. Additionally, alterations in the residual natural gas concentration modify the saturation profile within the stagnant CTZ. An increase in gas mixtures leads to a decrease in water saturation in the CTZ, which in turn diminishes the flow capacity and the intensity of perturbations in the aqueous phase. The synergistic effect of these phenomena significantly hampers the mass transport of dissolved CO2.

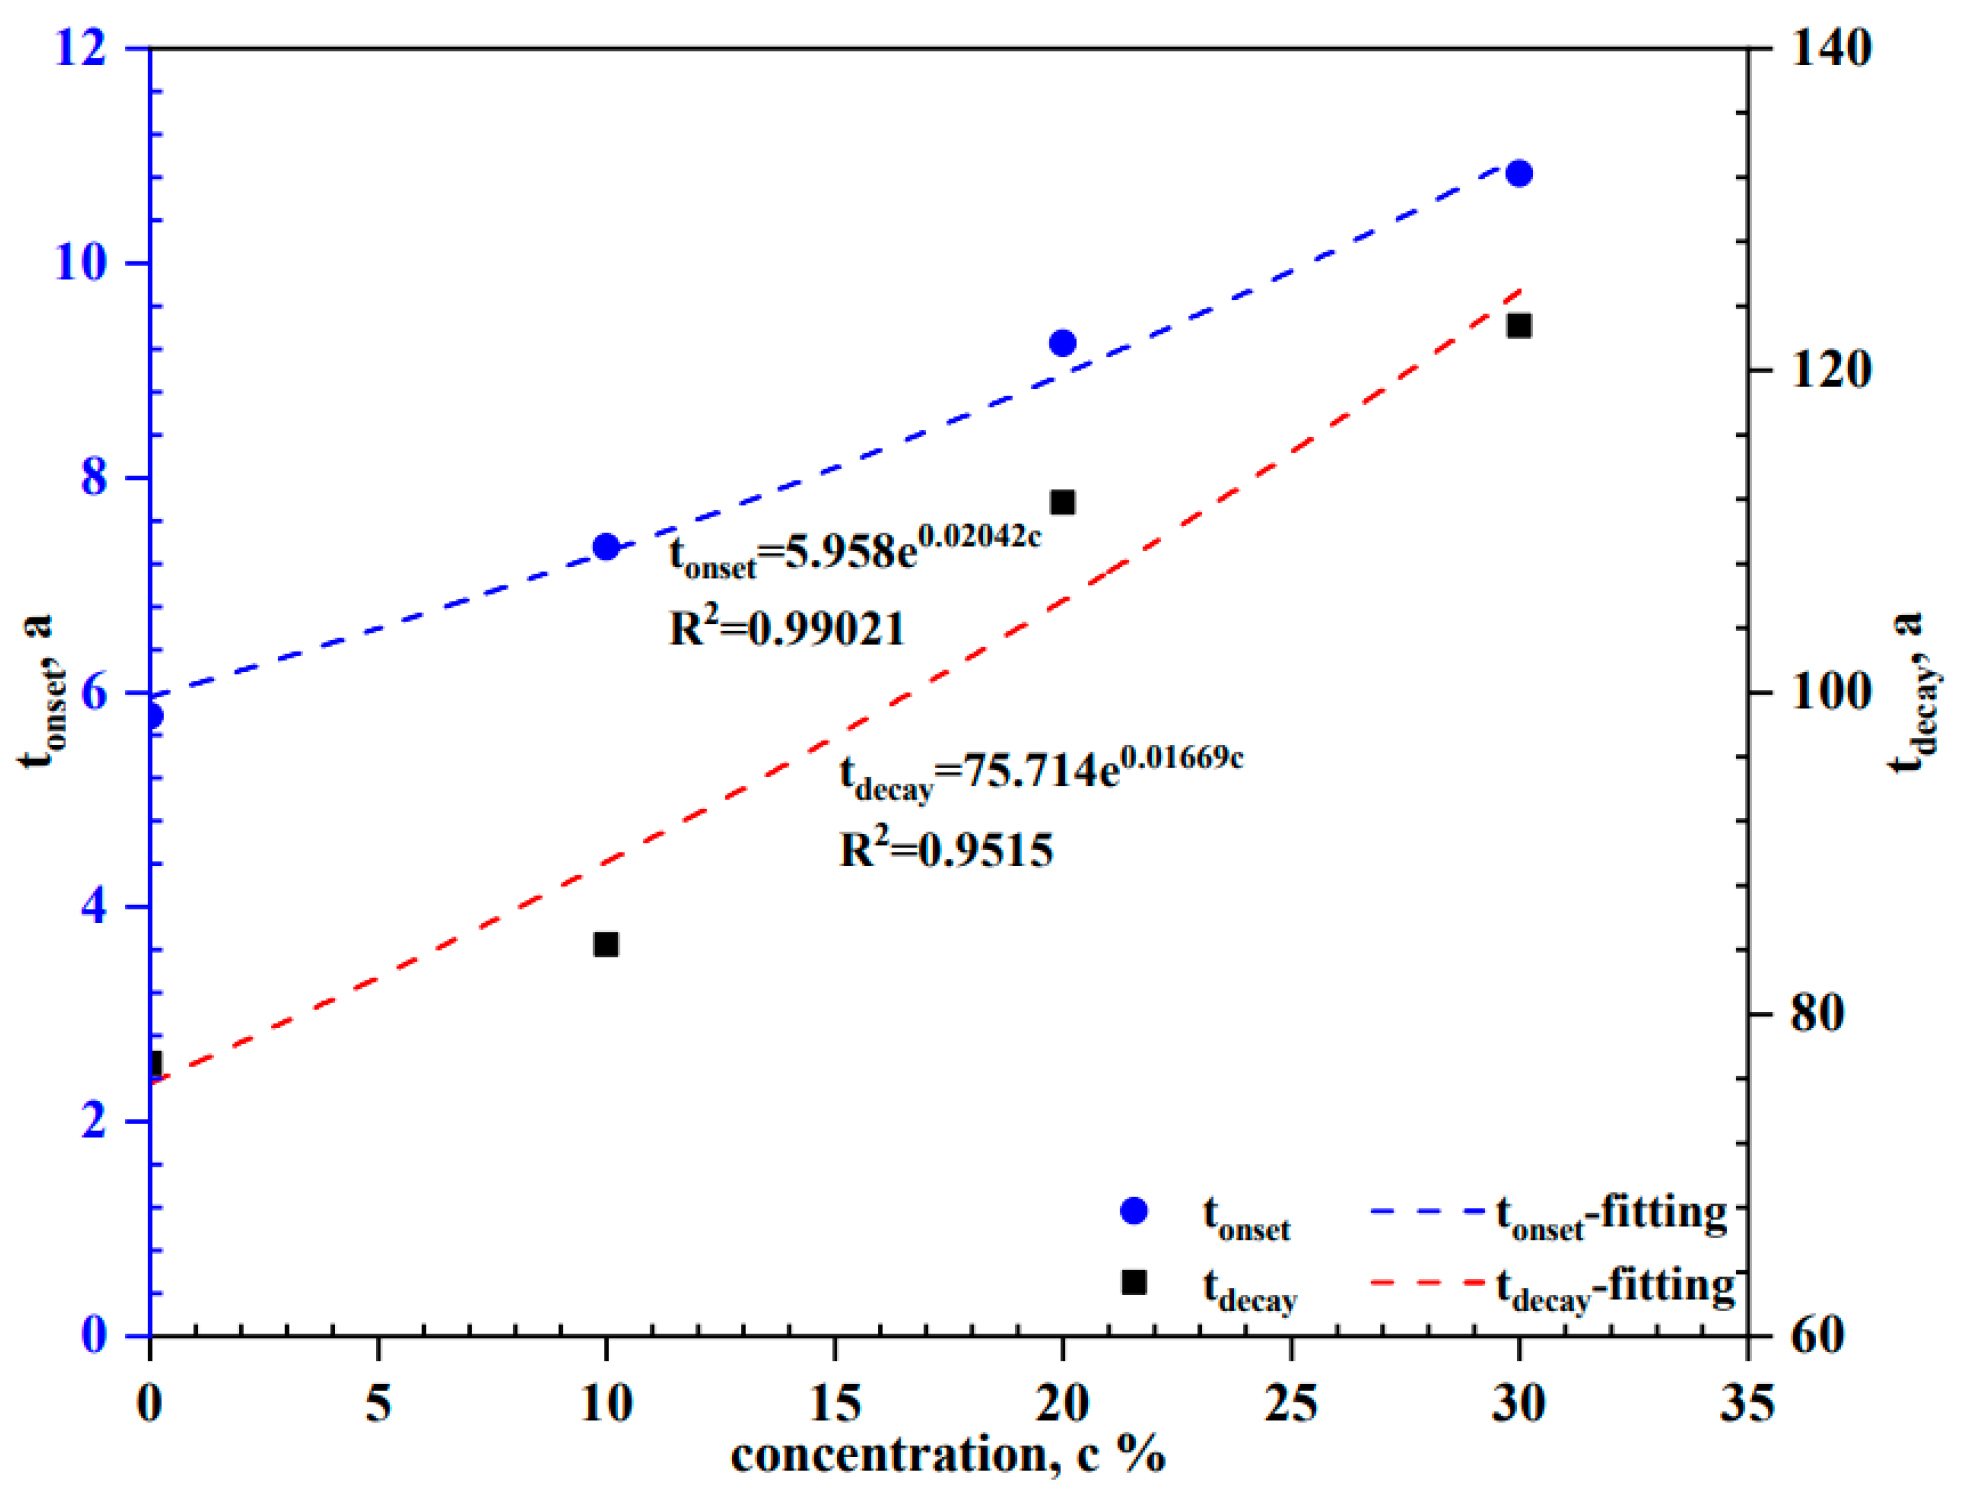
3.2.4. Onset Time and Decay Time

Figure 8 illustrates an exponential relationship between onset time, decay time, and gas impurity levels. The onset time is determined using the formula 5.958e0.02042c, where c represents the residual natural gas concentration. Similarly, the decay time follows the equation 75.714e0.01669c. This exponential correlation highlights the escalating influence of gas mixtures on mass transfer behavior as the concentration of residual natural gas increases.

3.3. Field-Scale Simulation for CO2 Injection and Storage

3.3.1. CO2 Injection Period

Figure 9, Figure 10 and Figure 11 illustrate the changes in reservoir pressure, CH4 mole fraction, and CO2 mole fraction following the cessation of CO2 injection. Figure 9 shows that as CO2 injection progresses, there is a steady increase in reservoir pressure, rising from an average of 10.5 MPa to 19.2 MPa. This increase enhances the extraction of the remaining gas due to the recovery of reservoir pressure. Figure 10 and Figure 11 depict the mole fraction distribution of CH4 and CO2 within the reservoir. During the post-injection process, the differing densities of CO2 and CH4 drive CO2 to migrate towards the lower sections, thereby pushing CH4 upwards. A comparison of the CH4/CO2 mole fraction distribution throughout the reservoir and near the horizontal wells indicates a notably higher concentration of CO2 near the injection wells, with CH4 primarily moving toward the production wells. The displacement of CO2 in horizontal wells is significantly more pronounced than in vertical wells. Additionally, the CH4 mole fraction at the bottom of the reservoir is slightly lower than at the top, suggesting a degree of gravitational segregation between the gases due to their density differences.
Figure 12 illustrates the temporal progression of CO2 production volumes, specifically the CO2 breakthrough times, across various wells. Well P16, strategically positioned between the vertical injection well I4 and the horizontal injection well IH5, witnessed an influx of CO2 into the production stream nine months subsequent to the commencement of CO2 injection. This event precipitated the simultaneous extraction of methane (CH4) and CO2. In contrast, Well P12, located amidst two horizontal injection wells and characterized by relatively superior reservoir properties, experienced CO2 breakthrough approximately thirty months following the injection. Additionally, Wells P2 and P18, situated at greater distances from the injection wells, demonstrated extended durations prior to CO2 breakthrough and notably lower CO2 production volumes in comparison.
Figure 13 illustrates the temporal alterations in cumulative gas production within the target area. In the absence of sufficient energy supply, a decline in single-well productivity is observed after five years of depletion development, resulting in a slow increase in cumulative gas production. After ten years of development, the cumulative gas production reaches approximately 88.0 × 10⁶ m3. Following CO2 injection, reservoir pressure gradually recovers, leading to a slow increase in cumulative gas production, predominantly governed by pressure at this stage. As the CO2 displacement process progresses, a significant amount of CH4 gas is driven into the production wells, causing an acceleration in the rate of increase in cumulative gas production (notably around three years post-CO2 injection). Once CO2 breakthrough occurs at the production wells, although the gas production capacity of individual wells remains relatively unchanged, the effective gas production volume decreases, adversely affecting economic benefits. By the end of the simulation period, the effective cumulative gas production increased by 16.71 × 10⁶ m3, marking an 18.9% increase compared to depletion development.

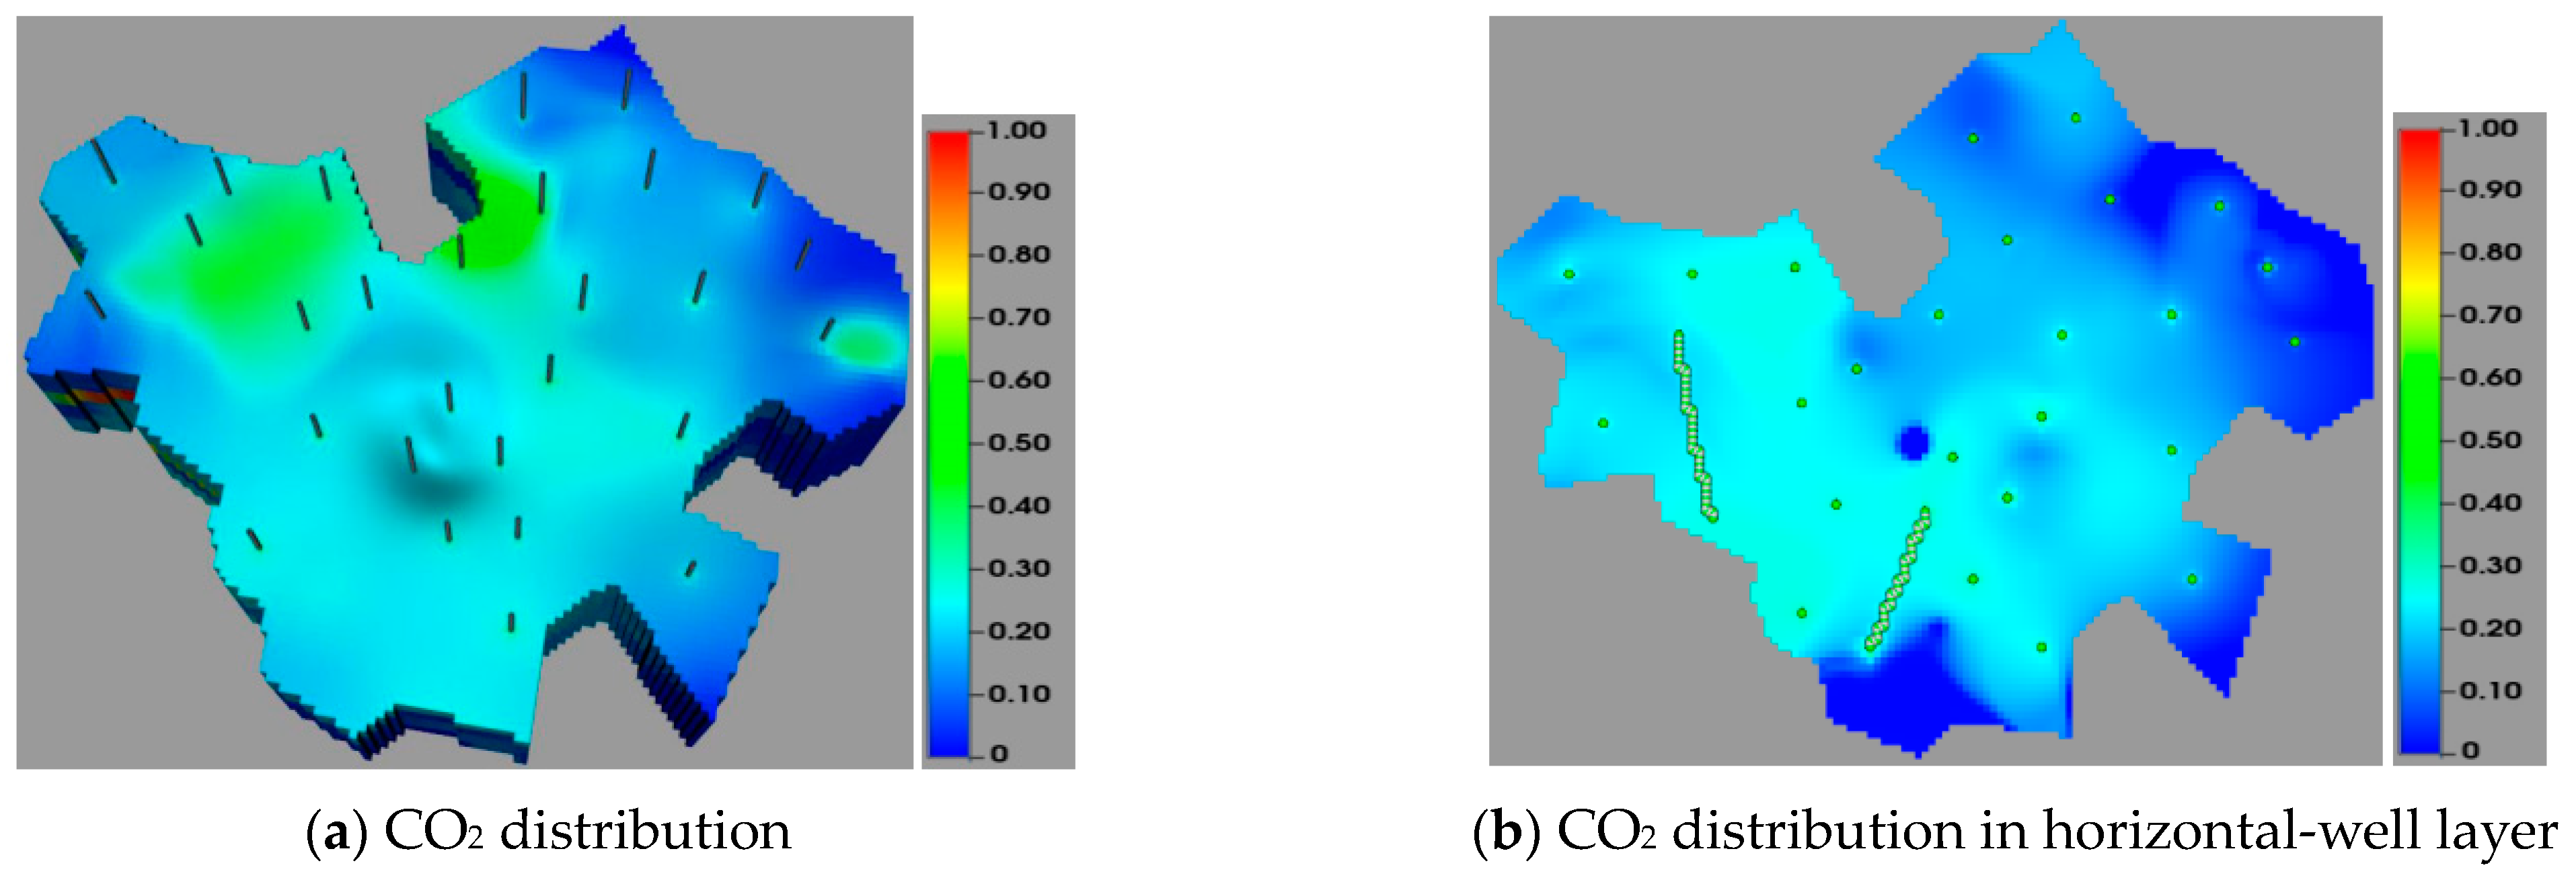
3.3.2. CO2 Post-Injection Period

Following the injection of CO2 into a reservoir, a portion of the injected CO2 is extracted along with CH4, while the rest remains within the reservoir, enabling the permanent sequestration of CO2 after the closure of wells. Figure 14, Figure 15 and Figure 16 illustrate the distribution of pressure, CH4 concentration, and CO2 concentration in the gas reservoir at the end of the simulation period. Figure 14 indicates that once the wells are closed, the reservoir pressure gradually stabilizes, with a slight reduction in average reservoir pressure (approximately 17.5 MPa). This decrease is primarily attributed to CO2 dissolution in water, leading to a reduced CO2 concentration in the gas phase and consequently lower pressure. Figure 15 and Figure 16 reveal that due to density differences, CO2 and CH4 undergo redistribution within the reservoir. CO2 tends to migrate towards the bottom, while CH4 moves upwards. However, the two fluids do not completely separate from each other.
Figure 17 illustrates the temporal variation of CO2 mass following the cessation of injection, with different forms. As the CO2 plume migrates, the gas sweep area gradually expands, resulting in an increased volume of residual gas. Concurrently, the increased contact area between CO2 and the formation water enhances the dissolution trapping. However, once the free gas is unable to diffuse further in the reservoir, meaning the contact area is constrained, the quantity of residual gas begins to decrease due to its dissolution in the formation water. This process leads to dissolution increasingly dominating the sequestration process over time. Consistent with the correlation delineated in the literature [43], the temporal evolution of the total contact area subsequent to the initiation of CO2 injection can be mathematically expressed as A(t) = 2t/3 × 106 m2, where t represents the elapsed time in years. The dissolution flux, as estimated in this model, amounts to 8.42 kg/(m2·year). However, this figure contrasts markedly with the field-scale simulation results, wherein the average dissolution flux is quantified at merely 3.36 kg/(m2·year). This notable underestimation is attributed primarily to the coarse resolution of the simulation grid. In addition, due to the presence of CH4, the capacity for CO2 dissolution is reduced. Typically, the attainment of a converged dissolution flux necessitates a finer grid resolution, albeit at the cost of increased computational time. While multi-scale modeling presents a viable solution to this challenge, it falls outside the purview of the current study. The details for this technique can be found in the related literature [44].

4. Conclusions

We conducted numerical simulations to examine how the stagnant CTZ and residual natural gas concentration affect the solubility trapping of CO2. The study involves a detailed analysis of CO2 dissolution in formation water, considering the influence of gas mixtures. The key findings are:
[1]
The stagnant capillary zone significantly disrupts the concentration boundary layer, enhancing solubility trapping. This is evidenced by higher Sherwood numbers and maximum values in two-phase simulations compared to single-phase ones, indicating stronger convection due to the capillary zone;
[2]
The increased residual natural gas concentration lowers the CO2 partial pressure and solubility, reducing the density contrast between ambient and CO2-enriched brine and weakening convective mass transport. In addition, changes in gas composition alter the saturation profile in the capillary zone, further reducing the intensity of perturbations. These combined effects significantly hinder mass transport, leading to lower dissolution rates and Sherwood numbers;
[3]
The onset and decay times of mass transfer processes have an exponential relationship with residual natural gas concentration, highlighting the increasing impact of gas mixtures with higher residual gas levels;
[4]
The effective cumulative gas production increased by 16.71 × 10⁶ m3, marking an 18.9% increase compared to depletion development. However, the presence of CH4 significantly reduces the amount of CO2 dissolution.

Author Contributions

Conceptualization, X.L.; methodology, X.L.; software, X.L., H.L. and J.W.; validation, F.C., X.S. and J.X.; investigation, R.W.; writing—original draft preparation, X.L., X.S. and J.X.; writing—review and editing, H.L., F.C. and J.W.; supervision, H.L. and R.W. All authors have read and agreed to the published version of the manuscript.

Funding

The funding support by SINOPEC Key Laboratory of Carbon Capture, Utilization and Storage and the National Natural Science Foundation of China (52304054).

Data Availability Statement

No new data were created or analyzed in this study. Data sharing is not applicable to this article.

Conflicts of Interest

The authors declare no conflict of interest.

References

  1. Bachu, S. CO2 storage in geological media: Role, means, status and barriers to deployment. Prog. Energy Combust. Sci. 2008, 34, 254–273. [Google Scholar] [CrossRef]
  2. Benson, S.M.; Cole, D.R. CO2 sequestration in deep sedimentary formations. Elements 2008, 4, 325–331. [Google Scholar] [CrossRef]
  3. Shukla, R.; Ranjith, P.; Haque, A.; Choi, X. A review of studies on CO2 sequestration and caprock integrity. Fuel 2010, 89, 2651–2664. [Google Scholar] [CrossRef]
  4. Bachu, S.; Shaw, C.; Pearson, R.M. Estimation of oil recovery and CO2 storage capacity in CO2 EOR incorporating the effect of underlying aquifers. In Proceedings of the SPE lmproved Oil Recovery Conference, Tulsa, OK, USA, 18–22 April 2004; p. SPE-89340. [Google Scholar] [CrossRef]
  5. Wang, F.; Xu, H.; Liu, Y.; Meng, X.; Liu, L. Mechanism of Low Chemical Agent Adsorption by High Pressure for Hydraulic Fracturing-Assisted Oil Displacement Technology: A Study of Molecular Dynamics Combined with Laboratory Experiments. Langmuir 2023, 39, 16628–16636. [Google Scholar] [CrossRef] [PubMed]
  6. Lyu, X.; Voskov, D.; Rossen, W.R. Numerical investigations of foam-assisted CO2 storage in saline aquifers. Int. J. Greenh. Gas Control 2021, 108, 103314. [Google Scholar] [CrossRef]
  7. Zhang, C.; Wang, E.; Li, B.; Kong, X.; Xu, J.; Peng, S.; Chen, Y. Laboratory experiments of CO2-enhanced coalbed methane recovery considering CO2 sequestration in a coal seam. Energy 2023, 262, 125473. [Google Scholar] [CrossRef]
  8. Mohagheghian, E.; Hassanzadeh, H.; Chen, Z. CO2 sequestration coupled with enhanced gas recovery in shale gas reservoirs. J. CO2 Util. 2019, 34, 646–655. [Google Scholar] [CrossRef]
  9. Li, Z.; Dong, M.; Li, S.; Huang, S. CO2 sequestration in depleted oil and gas reservoirs-caprock characterization and storage capacity. Energy Convers. Manag. 2006, 47, 1372–1382. [Google Scholar] [CrossRef]
  10. Gilfillan, S.M.; Lollar, B.S.; Holland, G.; Blagbumm, D.; Stevens, S.; Schoell, M.; Cassidy, M.; Ding, Z.; Zhou, Z.; Lacrampe-Couloume, G.; et al. Solubility trapping in formation water as dominant CO2 sink in natural gas felds. Nature 2009, 458, 614–618. [Google Scholar] [CrossRef]
  11. Abba, M.K.; Abbas, A.J.; Nasr, G.G.; Al-Otaibi, A.; Burby, M.; Saidu, B.; Suleiman, S.M. Solubility trapping asa potential secondary mechanism for CO2 sequestration during enhanced gas recovery by CO2 injection in conventional natural gas reservoirs: An experimental approach. J. Nat. Gas Sci. Eng. 2019, 71, 103002. [Google Scholar] [CrossRef]
  12. Zhang, X.; Wei, B.; Shang, J.; Gao, K.; Pu, W.; Xu, X.; Wood, C.; Sun, L. Alterations of geochemical properties of a tight sandstone reservoir caused by supercritical co2-brine-rock interactions in CO2-EOR and geosequestration. J. CO2 Util. 2018, 28, 408–418. [Google Scholar] [CrossRef]
  13. Al-Khdheeawi, E.A.; Vialle, S.; Barifcani, A.; Sarmadivaleh, M.; Iglauer, S. impact of reservoir wettability and heterogeneity on CO2-plume migration and trapping capacity. Int. J. Greenh. Gas Control 2017, 58, 142–158. [Google Scholar] [CrossRef]
  14. Wen, G.; Benson, S.M. CO2 plume migration and dissolution in layered reservoirs. Int. J. Greenh. Gas Control 2019, 87, 66–79. [Google Scholar] [CrossRef]
  15. Menad, N.A.; Hemmati-Sarapardeh, A.; Varamesh, A.; Shamshirband, S. Predicting solubility of CO2 in brine by advanced machine learning systems: Application to carbon capture and sequestration. J. CO2 Util. 2019, 33, 83–95. [Google Scholar] [CrossRef]
  16. Soltanian, M.R.; Amooie, M.A.; Gershenzon, N.; Dai, Z.; Ritzi, R.; Xiong, F.; Cole, D.; Moortgat, J. Dissolution trapping of carbon dioxide in heterogeneous aquifers. Environ. Sci. Technol. 2017, 51, 7732–7741. [Google Scholar] [CrossRef] [PubMed]
  17. Cui, G.; Wang, Y.; Rui, Z.; Chen, B.; Ren, S.; Zhang, L. Assessing the combined influence of fluid-rock interaction reservoir properties and injectivity during CO2 storage in saline aquifers. Energy 2018, 155, 281–296. [Google Scholar] [CrossRef]
  18. Tremosa, I.; Castillo, C.; Vong, C.O.; Kervévan, C.; Lassin, A.; Audigane, P. Long-term assessment of geochemical reactivity of CO2 storage in highly saline aquifers: Application to ketzin, in salah and snohvit storage sites. Int. J. Greenh. Gas Control 2014, 20, 2–26. [Google Scholar] [CrossRef]
  19. Kim, M.; Kim, K.-Y.; Han, W.S.; Oh, J.; Park, E. Density-driven convection in a fractured porous media: Implications for geological CO2 storage. Water Resour. Res. 2019, 55, 5852–5870. [Google Scholar] [CrossRef]
  20. Chang, C.; Kneafsey, T.J.; Wan, J.; Tokunaga, T.K.; Nakagawa, S. Impacts of mixed-wettability on brine drainage and supercritical CO2 storage efficiency in a 2.5-d heterogeneous micromodel. Water Resour. Res. 2020, 56, e2019WR026789. [Google Scholar] [CrossRef]
  21. Wang, Y.; Vuik, C.; Hajibeygi, H. Analysis of hydrodynamic trapping interactions during full-cycle injection and migration of CO2 in deep saline aquifers. Adv. Water Resour. 2022, 159, 104073. [Google Scholar] [CrossRef]
  22. Ranganathan, P.; Farajzadeh, R.; Bruining, H.; Zitha, P.L. Numerical simulation of natural convection in hetero-geneous porous media for CO2 geological storage. Transp. Porous Media 2012, 95, 25–54. [Google Scholar] [CrossRef]
  23. Kong, X.-Z.; Saar, M.O. Numerical study of the effects of permeability heterogeneity on density-driven convective mixing during CO2 dissolution storage. Int. J. Greenh. Gas Control 2013, 19, 160–173. [Google Scholar] [CrossRef]
  24. Mahyapour, R.; Mahmoodpour, S.; Singh, M.; Omrani, S. Effect of permeability heterogeneity on the dissolution process during carbon dioxide sequestration in saline aquifers: Two-and three-dimensional structures. Geomech. Geophys. Geo-Energy Geo-Resour. 2022, 8, 70. [Google Scholar] [CrossRef]
  25. Ajayi, T.; Gomes, J.S.; Bera, A. A review of CO2 storage in geological formations emphasizing modeling. monitoring and capacity estimation approaches. Pet. Sci. 2019, 16, 1028–1063. [Google Scholar] [CrossRef]
  26. Lyu, X.; Khait, M.; Voskov, D. Operator-based linearization approach for modeling of multiphase flow with buoyancy and capillarity. SPE J. 2021, 26, 1858–1875. [Google Scholar] [CrossRef]
  27. Hussein, A.; Hussein, I.A.; Al-Marri, M.; Mahmoud, M.; Shawabkeh, R.; Aparicio, S. CO2 enhanced gas recover and sequestration in depleted gas reservoirs: A review. J. Pet. Sci. Eng. 2021, 196, 107685. [Google Scholar]
  28. Shen, X.; Liu, H.; Mu, L.; Lyu, X.; Zhang, Y.; Zhang, W. A semi-analytical model for multi-well leakage in adepleted gas reservoir with irregular boundaries. Gas Sci. Eng. 2023, 114, 204979. [Google Scholar] [CrossRef]
  29. Yuan, S.L.L.; Liu, W.; Zhao, C.; Zhang, Y.; Song, Y. Study on the influence of various factors on dispersion during enhance natural gas recovery with co2 sequestration in depleted gas reservoir. J. Nat. Gas Sci. Eng. 2022, 103, 104644. [Google Scholar]
  30. Mu, L.; Liao, X.; Zhao, X.; Chen, Z.; Zhu, L.; Luo, B. Numerical analyses of the effect of the impurity in the gas on the solubility trapping in the CO2 sequestration. In Proceedings of the Carbon Management Technology Conference, CMTC2017, Houston, TX, USA, 17–20 July 2017; p. CMTC-486524. [Google Scholar] [CrossRef]
  31. Li, D.; Jiang, X. Numerical investigation of convective mixing in impure CO2 geological storage into deep saline aquifers. Int. J. Greenh. Gas Control 2020, 96, 103015. [Google Scholar] [CrossRef]
  32. Mahmoodpour, S.; Amooie, M.A.; Rostami, B.; Bahrami, F. Effect of gas impurity on the convective dissolution of CO2 in porous media. Energy 2020, 199, 117397. [Google Scholar] [CrossRef]
  33. Spycher, N.; Pruess, K.; Ennis-King, J. CO2-H2O mixtures in the geological sequestration of CO2. I. Assessment and calculation of mutual solubilities from 12 to 100 °C and up to 600 bar. Geochim. Cosmochim. Acta 2003, 67, 3015–3031. [Google Scholar] [CrossRef]
  34. Islam, A.W.; Carlson, E.S. Viscosity Models and Effects of Dissolved CO2. Energy Fuels 2012, 26, 5330–5336. [Google Scholar] [CrossRef]
  35. Elenius, M.T.; Voskov, D.V.; Tchelepi, H.A. Interactions between gravity currents and convective dissolution. Adv. Water Resour. 2015, 83, 77–88. [Google Scholar] [CrossRef]
  36. Spivey, J.P.; McCain, W.D., Jr. Estimating Density, Formation Volume Factor, Compressibility, Methane Solubility, and Viscosity for Oilfield Brines at Temperatures From 0 to 275 °C, Pressures to 200 MPa, and Salinities to 5.7 mole/kg; Technical Report; Schlumberger-Beijing Science Centre: Houston, TX, USA, 2004. [Google Scholar] [CrossRef]
  37. Mao, S.; Duan, Z. The viscosity of aqueous alkali-chloride solutions up to 623 K, 1000 bar, and high ionic strength. Int. J. Thermophys. 2009, 30, 1510–1523. [Google Scholar] [CrossRef]
  38. Brooks, R. and Corey, T. Hydraulic Properties of Porous Media; Hydrology Papers; Colorado State University: Fort Collins, CO, USA, 1964; 24:37. 18 of 25. [Google Scholar]
  39. Pau, G.S.; Bell, J.B.; Pruess, K.; Almgren, A.S.; Lijewski, M.J.; Zhang, K. High-resolution simulation and characterization of density-driven flow in CO2 storage in saline aquifers. Adv. Water Resour. 2010, 33, 443–455. [Google Scholar] [CrossRef]
  40. Khait, M.; Voskov, D. Adaptive parameterization for solving of thermal/compositional nonlinear flow and trans-port with buoyancy. SPE J. 2018, 23, 522–534. [Google Scholar] [CrossRef]
  41. Wang, Y.; Voskov, D.; Khait, M.; Bruhn, D. An efficient numerical simulator for geothermal simulation: Abenchmark study. Appl. Energy 2020, 264, 114693. [Google Scholar] [CrossRef]
  42. Voskov, D. Operator-based linearization approach for modeling of multiphase multi-component flow in porous media. J. Comput. Phys. 2017, 337, 275–288. [Google Scholar] [CrossRef]
  43. Elenius, T.; Nordbotten, J.M.; Kalisch, H. Convective mixing influenced by the capillary transition zone. Comput. Geosci. 2014, 18, 417–431. [Google Scholar] [CrossRef]
  44. Lyu, X.; Voskov, D. Advanced modeling of enhanced CO2 dissolution trapping in saline aquifers. Int. J. Greenh. Gas Control 2023, 127, 103907. [Google Scholar] [CrossRef]
Figure 1. Schematic diagrams of numerical models. To maintain a constant pressure and gas concentration at the boundary, a large pore volume is assumed along the top blocks in (a,b). Figures (c,d) are the realistic model.
Energies 17 03491 g001
Figure 2. Relative permeability and capillary pressure as functions of water saturation used in this work.
Energies 17 03491 g002
Figure 3. The rate of CO2 dissolution and the distribution of dissolved CO2 in both the single-phase and the two-phase models.
Energies 17 03491 g003
Figure 4. The evolution of the Sherwood number for the single-phase numerical model and the two-phase model with stagnant CTZ.
Energies 17 03491 g004
Figure 5. The CO2 dissolution rate and amount of dissolution mass with different natural gas concentrations.
Energies 17 03491 g005
Figure 6. Variation of the Sherwood number with different residual natural gas concentrations.
Energies 17 03491 g006
Figure 7. The density difference between the ambient and CO2-rich brine and saturation profile in CTZ with different residual natural gas concentrations.
Energies 17 03491 g007
Figure 8. The relationships between the onset time, decay time and the residual natural gas concentrations.
Energies 17 03491 g008
Figure 9. Pressure distribution after CO2 injection.
Energies 17 03491 g009
Figure 10. CH4 distribution after CO2 injection.
Energies 17 03491 g010
Figure 11. CO2 distribution after CO2 injection.
Energies 17 03491 g011
Figure 12. CO2 breakthrough time in different wells.
Energies 17 03491 g012
Figure 13. Cumulative gas production with time.
Energies 17 03491 g013
Figure 14. Pressure distribution by the end of the simulation.
Energies 17 03491 g014
Figure 15. CH4 distribution by the end of the simulation.
Energies 17 03491 g015
Figure 16. CO2 distribution by the end of the simulation.
Energies 17 03491 g016
Figure 17. Variation of CO2 mass in different forms.
Energies 17 03491 g017
Table 1. Parameters of the numerical model used in this work.
ParametersCase 1Case 2Case 3
Domain geometryTop depth, m15001191~1432
Thickness, m50181.8~291.7
Dimensions of model, -100 × 50128 × 109 × 40
Gridblock size, m0.5 × 0.5-
Fluid propertiesPhasesSingle-phaseTwo phasesTwo phases
CO2 density, kg/m3f (state)
Brine density, kg/m3f (state)
CO2 viscosity, mPa·sf (state)
Brine viscosity, mPa·sf (state)
Diffusion coefficient, m2/s2 × 10−9
Porous media propertiesPermeability, mD3000.07~2.15
Porosity, -0.250.005~0.054
Residual brine saturation, Swc0.2
Residual CO2 saturation, Sgr0
Salinity, ppm30,000
Gas end point relative permeability, krge1.0
Exponent of gas relative permeability, ng2
Exponent of water relative permeability, nw4
Capillary entry pressure, bar0.2
Disclaimer/Publisher’s Note: The statements, opinions and data contained in all publications are solely those of the individual author(s) and contributor(s) and not of MDPI and/or the editor(s). MDPI and/or the editor(s) disclaim responsibility for any injury to people or property resulting from any ideas, methods, instructions or products referred to in the content.

