Article

UAV Inspections of Power Transmission Networks with AI Technology: A Case Study of Lesvos Island in Greece

by
Georgios Chatzargyros
1,2,*,
Apostolos Papakonstantinou
3,4,
Vasiliki Kotoula
2,
Dimitrios Stimoniaris
1 and
Dimitrios Tsiamitros
1
1
Department of Electrical and Computer Engineering, University of Western Macedonia, 50100 Kozani, Greece
2
Renel I.K.E, 26th October 90 & Minotavrou 1st, 54627 Thessaloniki, Greece
3
SciDrones, P.O. Box 94 ELTA C.O., 81100 Mytilene, Greece
4
Department of Civil Engineering and Geomatics, School of Engineering and Technology, Cyprus University of Technology, 3036 Limassol, Cyprus
*
Author to whom correspondence should be addressed.
Energies 2024, 17(14), 3518; https://doi.org/10.3390/en17143518
Submission received: 29 March 2024 / Revised: 27 May 2024 / Accepted: 11 July 2024 / Published: 18 July 2024
(This article belongs to the Section F: Electrical Engineering)

Abstract

:
The inspection of overhead power transmission lines is of the utmost importance to ensure the power network’s uninterrupted, safe, and reliable operation. The increased demand for frequent inspections implementing efficient and cost-effective methods has emerged, since conventional manual inspections are highly inaccurate, time-consuming, and costly and have geographical and weather restrictions. Unmanned Aerial Vehicles are a promising solution for managing automatic inspections of power transmission networks. The project “ALTITUDE (Automatic Aerial Network Inspection using Drones and Machine Learning)” has been developed to automatically inspect the power transmission network of Lesvos Island in Greece. The project combines drones, 5G data transmission, and state-of-the-art machine learning algorithms to replicate the power transmission inspection process using high-resolution UAV data. This paper introduces the ALTITUDE platform, created within the frame of the ALTITUDE project. The platform is a web-based, responsive Geographic Information System (GIS) that allows registered users to upload bespoke drone imagery of medium-voltage structures fed into a deep learning algorithm for detecting defects, which can be either exported as report spreadsheets or viewed on a map. Multiple experiments have been carried out to train artificial intelligence (AI) algorithms to detect faults automatically.

1. Introduction

The safe and reliable operation of power transmission networks is linked to the optimal performance of their components, namely, their transmission power lines, poles and towers, insulators, balisor beacons, sag adjusters, and crossarms. The exposure of the grid infrastructure to harsh environments, such as catastrophic weather events, vegetation, extremely high voltage temperatures, and high mechanical pressure, necessitates periodic inspections throughout the year [1,2,3,4,5,6,7]. The traditional manual inspection method, commonly applied so far, brings considerable difficulties to fault detection. New methods are being investigated to meet the challenges of the rapid development of power grids [4,8,9]. Other methods, such as manned helicopter inspections [10] and automated flying and climbing robots [11], are far faster. However, they still lack accuracy, are highly expensive, and have limited practical use (especially the climbing robots) [11,12].
Visual inspections have been carried out so far in the Hellenic Electricity Network, where technical personnel observe the network from the ground to detect faults and defects that obstruct its optimal and uninterrupted performance. The inspections are carried out yearly regarding preventive maintenance and predictive actions, and corrective maintenance is performed in extreme weather conditions, such as fires and storms. Frequent power grid inspections are necessary in all conditions to secure the grid components’ continuous, safe, and efficient performance.
A widespread solution to these inspection difficulties is the development of Unmanned Aerial Vehicles (UAVs) or drones. Their performance at a safe distance from the transmission lines offers undeniable advantages as an inspection method, providing high efficiency, low costs, and high application potential. They ensure high accuracy when detecting the location of the fault, unaffected by the terrain variability and weather conditions [2,4,9,13].
Lately, the impressive developments in the field of computer vision and the widespread availability of UAVs at relatively low costs have provided the tools for the development of intelligent systems, which are capable of inspecting the electric grid efficiently and accurately, with minimal human intervention [3,4,8,14,15]. Object detection and classification is an essential task in computer vision and has many different applications, such as UAV inspection routing, intelligent drone surveillance, and aerial image processing [16,17,18,19]. Lately, object detection based on deep neural networks (DNNs), especially convolutional neural networks (CNNs), a type of artificial neural network within deep learning, has gained ground in the field of computer vision [16,17,19].
Over the past few years, a wide range of methodologies have been applied to detect several grid components and their associated defects. There has been extensive research in which various solutions have been proposed, combining UAV imagery with deep learning. Indicatively, the authors of [20] suggested the employment of edge AI to improve the IoT services related to UAVs. This method allows computations to be carried out close to or at the end device, where data are actually collected, and as a result, the autonomous navigation is enhanced. Moreover, it is a more reliable process with reduced data traffic loads. In [21], Siddiqui et al. propose an aerial power line inspection system that aims to detect insulators, splitters, damper weights, and conductors and to analyze them for potential defects in real time by processing drone videos with an embedded CNN-based detection system. In [22], the use of high-resolution UAV imagery combined with fine-tuned deep CNNs for automatic component inspection and fault detection in Nigeria’s electric power transmission network is explored. In [23], Tao et al. focus on detecting faulty insulators and propose a novel deep CNN cascading architecture. Similar to [21], their CNN combines insulator localization and fault detection in one pass. Another single-pass method for detecting broken insulators using UAV imagery and computer vision is presented by Huang et al. in [24], wherein a modified You Only Look Once (YOLO)v5 network is proposed. In [25], Zheng et al. address the detection of defective insulators with an improved YOLOv7 network. Specifically, two types of defects are targeted: pollution flashover and damage. Following a two-stage approach, Ling et al. [26] combined a faster region-based convolutional neural network (R-CNN) with U-Net to detect broken insulators. Firstly, the Faster R-CNN locates the insulator string. Then, the bounding box is cropped and inputted to the U-Net, which proceeds with precisely classifying the pixels and detecting damage. Zhao et al. [27] trained a Faster R-CNN model to detect insulators with infrared images. Another class of defects of the electric grid network, namely, damaged power distribution poles, is studied in [28], wherein the authors present a system for detecting fallen, burning, and arcing poles. In [29], a cascade ensemble learning (CEL) method, based on the wavelet neural network-based AdaBoost model and cascade synchronous strategy (CSS), is introduced as a solution to improve the computing accuracy and efficiency in the multi-level reliability analysis of complex structural systems in aero-engineering.
In a nutshell, UAV images are input into CNNs. The backbone extracts feature maps propagated to the region proposal network (RPN). The RPN generates proposals consisting of a region and an associated class. Proposals are filtered by the Region-of-Interest (ROI) pooling layer and are fed into the fully connected layers for classification and regression. Some authors break up the above process into two distinct steps: a main network is trained to extract the components from the image, and one or more secondary networks detect the faults in the cropped component images. The advantage of this approach is that networks can be finely tuned to perform their dedicated detection tasks. However, it requires many datasets, and the system cannot be trained as a whole. Data preprocessing appears to be an important step for the successful training of CNNs. Specifically, data augmentation has been widely used to address the small dataset size. Algorithms for the selection of anchor boxes have also been explored. Additionally, in most cases, the base network is pre-trained on a large dataset (e.g., ImageNet or Coco) and fine-tuned with the grid component data. Broken insulators are arguably the most commonly studied use case. However, the methods applied are applicable to other defective components as well. The present research introduces the ALTITUDE platform (system), which was developed by the authors and researchers in the frame of the ALTITUDE project. The system was tested and validated on the Greek Island of Lesvos and can be reached on the following url https://cmlo.aegean.gr/emerge_v2/?lang=en (accessed on 28 March 2024).

2. Materials and Methods

The ALTITUDE (Automatic Aerial Network Inspection using Drones and Machine Learning) project was developed to automate the power transmission network inspection on the island of Lesvos, Greece. The methodology aims to simulate the inspection of the power transmission network with the help of high-resolution UAV data obtained via drones, using 5G data transmission and cutting-edge machine learning algorithms. A schematic diagram of the principle architecture is presented in Figure 1.
Figure 1 depicts a flowchart illustrating the process and components of the ALTITUDE platform, which is part of the “ALTITUDE (Automatic Aerial Network Inspection using Drones and Machine Learning)” project for power transmission network inspection.
The process starts with a registered user uploading high-resolution UAV data to the ALTITUDE platform. The platform leverages 5G data transmission for efficient and fast data handling from the field to the system. State-of-the-art machine learning algorithms are utilized to improve and replicate the inspection process and identify faults within the electric grid. The machine learning algorithm is used to automatically process the uploaded high-resolution UAV data. The algorithm detects defects in the drone imagery, resulting in inspection results that can be (i) exported as report spreadsheets and (ii) viewed on a GIS map. The flowchart effectively outlines the workflow of the ALTITUDE platform, highlighting the key components and their interactions, from the initial upload of the drone imagery by the user to the final output of the inspection results.

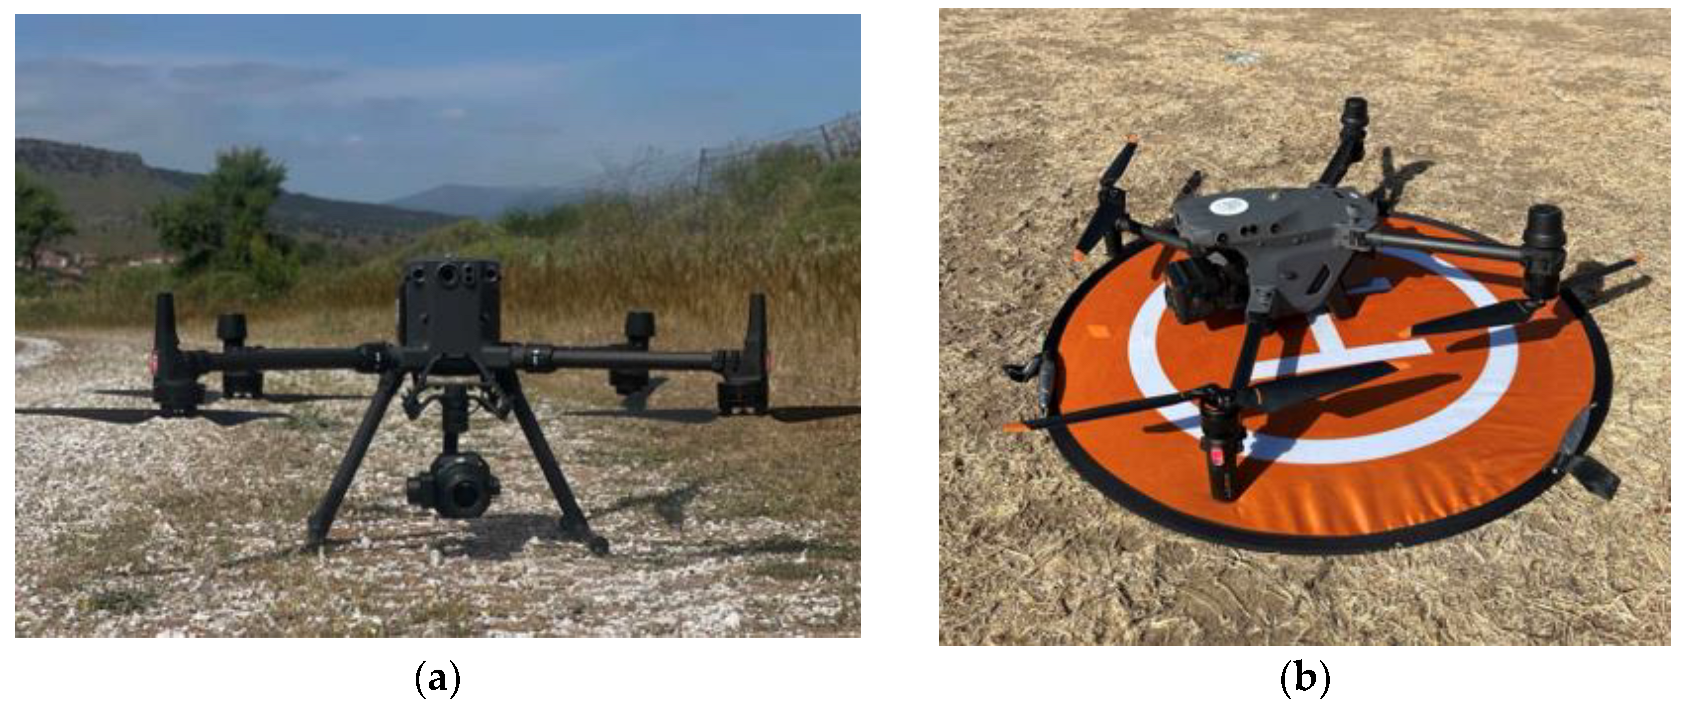
2.1. UAV and Sensors Used

The equipment used to implement the ALTITUDE system is shown in Figure 2. Two drone types manufactured by DJI, Shenzhen, China, the Matrice M30T and Matrice 300, are utilized within the ALTITUDE project to map and inspect the system. These drones are equipped with multi-sensors and cameras, and during the aerial inspection, they capture high-definition photos, which are transmitted to the main server in real time.
The Matrice M300 with the P1 Optical camera was used to collect the photos to create the orthomosaic. The Matrice 300 RTK offers up to 55 min of flight time with TB60 batteries combined. The airframe design of the Matrice 300 RTK gives the system an Ingress Protection (IP) rating of IP45. In contrast, its mechanical design with quick-release landing gear and folding arms makes the platform incredibly easy to transport, store, and prepare for flight. Batteries for the Matrice 300 RTK are charged and can be stored and transported in the DJI BS60 Battery Station, which can carry up to eight TB60 batteries [30].
The Matrice M30T was used to capture photos while performing the power line inspection. It integrates multiple sensors into one camera payload, is controlled with the DJI RC Plus Remote, and runs on DJI Pilot v2.5.1.10 software. The M30T also includes a 40 mm 640 × 512 30 fps thermal-imaging camera with a measurement accuracy of ±2 °C or ±2%. The M30T model integrates a 48-megapixel 1/2″ CMOS sensor zoom camera with 5×~16× optical and 200× digital zoom, a 12-megapixel wide-angle camera, 8 K photos, 4 K/30 fps video resolution, and a laser rangefinder, which can give the precise coordinates of objects up to 1200 m away. The DJI Matrice M30T flies up to 41 min and reaches a speed of up to 23 m/s. In addition, its IP55 protection allows drone flights from temperatures of −20 °C to 50 °C [31].
Two different types of control station software are used to operate the drones. These are DJI Pilot 2, DJI, Shenzhen, China, and UgCS, SPH Engineering, Riga, Latvia. DJI Pilot 2 is the official app for operating and flying both the Matrice M300 and Matrice M30T drones. This app’s user can perform manual flights or program and perform autonomous flying mapping missions. DJI Pilot 2 is easy to use and unlocks the majority of the M30T and M300 drone capabilities [32].
The UgCS software v.4.17 (2141) is a third party used to program autonomous flight missions in both drones. The UgCS software has more functionalities than the official DJI Pilot 2 app, allowing users to plan missions with extended capabilities, including the following: the user can pre-install or import more precise Digital Elevation Model (DEM) data to increase the accuracy and safety for missions with terrain following; the user can adjust the allowed flight range and No-Fly Zones to fly according to regulatory requirements; the user can plan and fly missions without an internet connection, even in desert areas, with an offline map-caching capability; the user can resume flights from a certain waypoint after battery change; the software has built-in photogrammetry and geotagging tools; the software allows for DEM and Keyhole Markup Language (KML) file import; the software comes with a UgCS feature mission planner with a Google Earth-like 3D interface for UAV mission planning, enabling the user to navigate the environment more easily [33].

2.2. Object Detection Systems

YOLO is a popular object detection algorithm in computer vision and deep learning. The YOLO algorithm is designed to perform real-time object detection in images and videos, identifying and locating multiple objects in a single pass through the neural network [17,34]. The key features of the YOLO include the following:
  • Single-pass detection: YOLO processes the entire image in a single forward pass through the neural network, as opposed to many traditional object detection methods that use region proposal networks and multiple passes;
  • Bounding-box prediction: YOLO divides the input image into a grid and predicts bounding boxes and class probabilities for each grid cell. This allows YOLO to detect objects of different sizes and aspect ratios efficiently;
  • High-speed and real-time performance: YOLO is known for its speed and efficiency, making it suitable for real-time applications. It has been widely used in various domains, including surveillance, autonomous vehicles, and robotics;
  • Versatility: YOLO can be adapted for different tasks, such as general object detection, person detection, vehicle detection, and more. The architecture is flexible and can be trained on custom datasets for specific applications.
The Mask R-CNN is a computer vision algorithm designed for instance segmentation. Instance segmentation involves the identification and delineation of the individual objects within an image, providing both object localization and pixel-level segmentation masks. It is an extension of the Faster R-CNN architecture, initially developed for object detection. The Mask R-CNN adds an additional branch to the Faster R-CNN framework to predict bounding boxes, class labels, and segmentation masks simultaneously for each object instance in an image [17,34,35]. Key features of the Mask R-CNN include the following:
  • RPN: Like the Faster R-CNN, the Mask R-CNN utilizes a region proposal network to propose candidate regions in the image that are likely to contain objects;
  • Bounding-box prediction: The Mask R-CNN predicts bounding boxes and class labels for each proposed region, similar to the Faster R-CNN;
  • Mask prediction: In addition to bounding boxes, the Mask R-CNN introduces a mask prediction branch that outputs segmentation masks for each identified object. This allows for pixel-level accuracy in delineating object boundaries;
  • ROI align: To accurately extract pixel-level information for mask prediction, the Mask R-CNN employs ROI Align, a technique that aligns the extracted feature maps with the input image pixels. This helps prevent information loss during the process.
The YOLOv8 and Mask R-CNN have been used in various applications, including medical image analysis, autonomous vehicles, and robotics [17,34,35,36,37]. With their segmentation capabilities, they provide more detailed information about object boundaries compared to other object detection algorithms, making them particularly useful in scenarios in which precise knowledge of an object’s shape is essential.

2.3. Defects of the Power Transmission Network

This subsection presents common types of defects in the electric power network, as reported by the Hellenic Electricity Distribution Network Operator (HEDNO). Monitoring the tilt of electric poles and crossarms is an important task for the uninterrupted operation of the electric grid. Failure to detect the onset of tilt can have significant consequences, impacting the system’s structural integrity, electrical reliability, and safety. Some potential consequences are as follows:
  • Electrical-line misalignment: Tilted crossarms can cause electrical-line and associated equipment misalignment. This may lead to issues such as sagging lines, increased conductor tension, and potential electrical faults;
  • Mechanical stress and fatigue: The tilt of the poles and crossarms can subject the components to uneven mechanical stress. Over time, this stress can lead to fatigue and accelerate the wear and tear of the materials, increasing the likelihood of structural failure;
  • Line clearance and safety hazards: Tilted structures may result in reduced line clearance, increasing the risk of electrical lines coming into contact with surrounding objects, vegetation, or the ground. This poses safety hazards for the public, wildlife, and utility workers;
  • Outages. if a pole collapses or lines become damaged due to misalignment, it can disrupt the electrical supply to businesses, homes, and critical infrastructure;
  • Increased maintenance costs: Tilted structures necessitate increased maintenance efforts and costs. Regular inspections, corrective actions, and potential replacements may be required to address structural issues and prevent further deterioration;
  • Regulatory compliance: Medium-voltage electric structures are subject to regulations and standards. Tilted poles and crossarms may lead to non-compliance with these regulations, inviting penalties or regulatory actions;
  • Fire hazards: If tilted structures come close enough to vegetation, there is an increased risk of sparking and fire hazards. This can pose a danger to the environment and nearby structures;
  • Environmental impact: the failure of medium-voltage electric structures can have environmental consequences, especially if there are spills of insulating oils or other hazardous materials.
Similarly, the tilting of the pin insulators is a common phenomenon that, if ignored, will result in an increased number of feeder breakdowns, damage to the conductor, increased outages and costs, the wastage of resources, the loss of person-hours, and dissatisfaction among consumers.
Missing disks in the lines of glass insulators can also have several adverse effects on the electrical-distribution system’s performance, safety, and reliability. Some of the most common methodologies are visual inspections by trained personnel, aerial surveys, thermal imaging, acoustic and vibration sensors, fiber-optic sensors, Light Detection and Ranging (LiDAR) technology, smart insulator technologies, and image processing. Recently, convolution networks have also been tried [38,39].
Finally, thermal inspection is a vital process for the health monitoring of medium-voltage (MV) structures. It can help identify potential issues related to overheating in the electrical components, which can be a sign of loose connections, imbalances in the load distribution, or other problems. It allows for preventive maintenance by identifying hotspots or abnormal temperature patterns. It can highlight faulty components, such as damaged insulation, defective circuit breakers, or malfunctioning transformers. Since overheating poses a fire risk, thermal inspection facilitates take proactive action to prevent fires and ensure the safety of the equipment. Finally, monitoring the thermal performance of MV structures can help optimize their energy efficiency and ensure their compliance with safety standards [40,41,42].

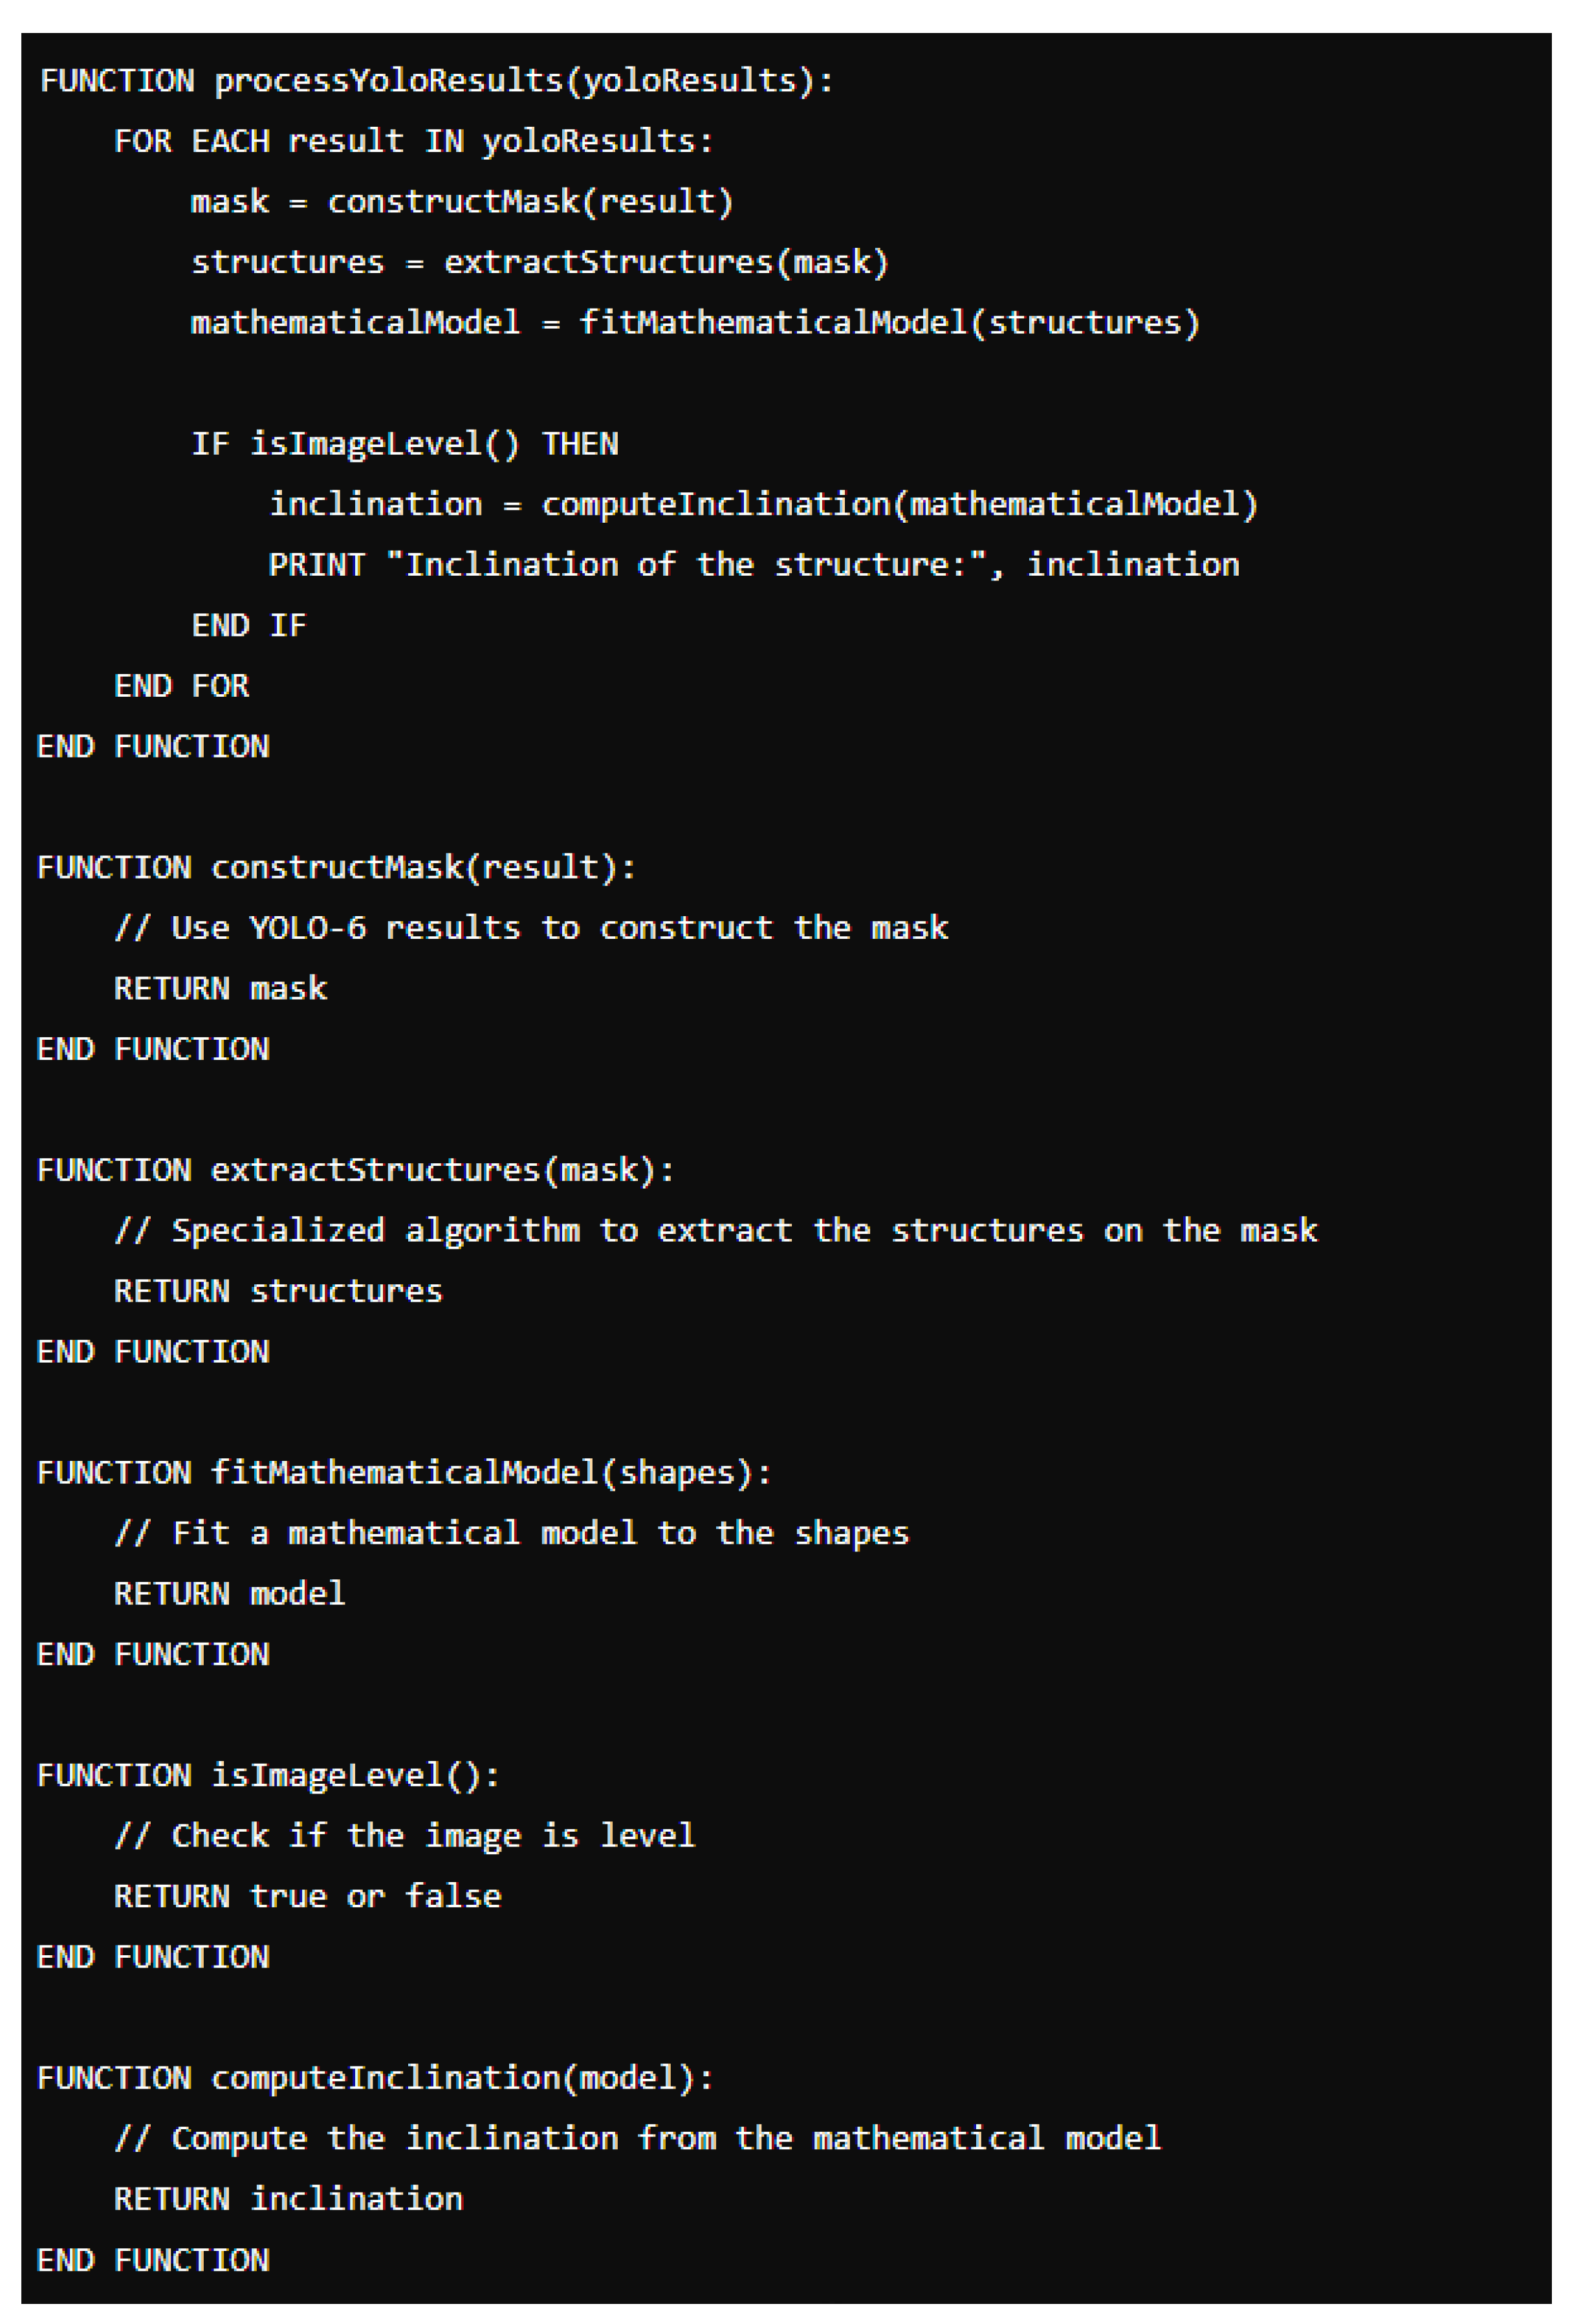
2.4. System Architecture

The ALTITUDE AI can detect five major defects in MV structures, namely, tilt angles in the poles, crossarms, and pin insulators, missing disks in glass-line insulators, and elevated temperatures in selected components. For this purpose, the two state-of-the-art object detection systems, YOLOv8 and the Mask R-CNN, were trained on a large dataset of defects. Experiments showed that the newer YOLOv8 architecture outperformed the older Mask R-CNN in almost all cases. In the frame of the ALTITUDE project, the AI training was carried out by labeling 1400 images with 12,700 objects of the following classes: pole (1000), crossarm (1400), insulator (4000), main structure (5800), and other (500). All 1400 images were collected during the project framework using the drones presented in Section 2.1.
Particularly, first, for the tilt of electric poles and crossarms, the YOLOv8 and Mask-RCNN segmentation networks were trained to detect electric poles and crossarms in drone images. The YOLOv8 results were used to construct the masks. A specialized algorithm was then applied to extract the structures on these masks, ideally forming a continuous shape that represents the pole or crossarm. Next, a mathematical model was fitted to these shapes to obtain the representation of the structure. Assuming the image is always level, the inclination of the structures was derived from a geometrical computation. Figure 3 illustrates a pseudocode that presents the algorithmic process.
An explanation of the above-presented code is as follows:
  • ProcessYoloResults: the main function that processes the YOLO-6 results:
    • Iterates through each YOLO-6 result;
    • Constructs a mask from the YOLO-6 result using constructMask;
    • Extracts the structures on the mask using extractStructures;
    • Fits a mathematical model to the structures using fitMathematicalModel;
    • Checks if the image is level using isImageLevel;
    • Computes the inclination of the structures from the mathematical model using computeInclination and prints it;
  • constructMask: function to construct the mask using YOLO-6 results;
  • extractStructures: function for the specialized algorithm to extract the structures on the mask;
  • fitMathematicalModel: function to fit a mathematical model to the shapes;
  • isImageLevel: function to check whether the image is level;
  • computeInclination: function to compute the inclination from the mathematical model.
The processing application is responsible for the following tasks: (a) upload analysis, wherein each UAV image is correlated to a digitized MV structure; (b) AI inference, wherein each image is analyzed for the trained defect classes; (c) inspection report generation, wherein the system creates spreadsheets of the findings related to an MV network part.

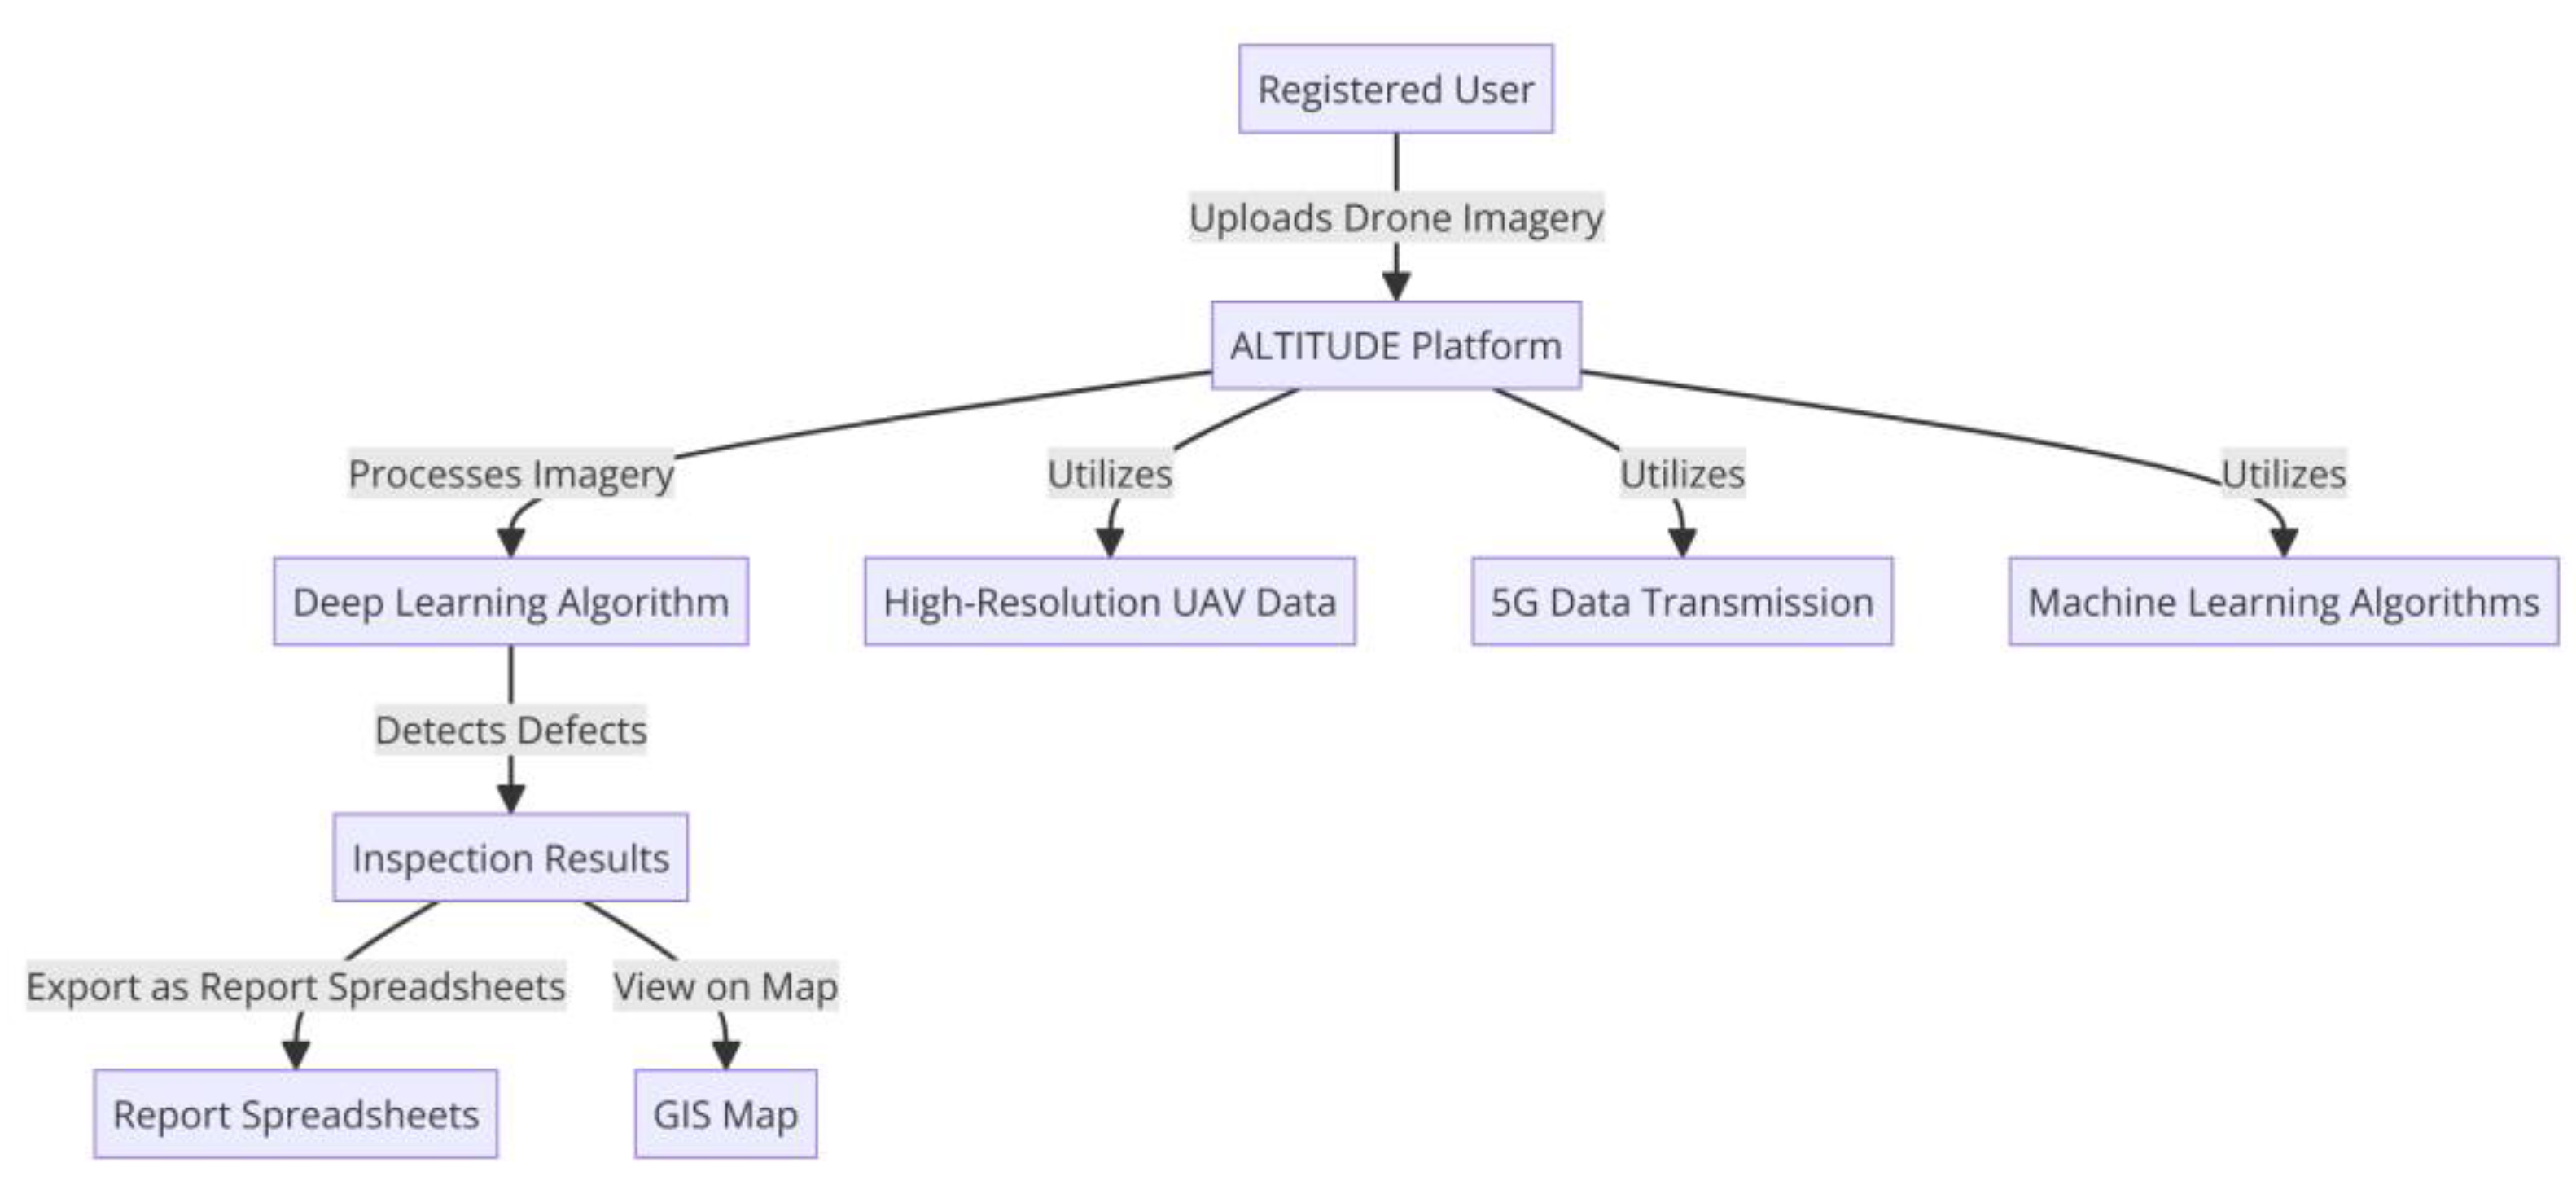
3. ALTITUDE Platform and Results

The ALTITUDE system is built on three main pillars: (a) an automatic drone-based process, (b) cloud-based architecture development, and (c) a web GIS modular application.
In the particular case study of Lesvos Island in Greece, the HEDNO is the pilot end-user used to validate the ALTITUDE system. The main defects that need to be detected in the MV transmission network are focused on poles, insulators, crossarms, and thermal defects that exceed the safety limits set by the HEDNO. To ensure the proper and accurate operation of the ALTITUDE system, the digitization of the under-study power network was initially performed, and a digital map of the power grid was created. The automatic detection of defects is accomplished via two methods: artificial intelligence and photo interpretation.
The ALTITUDE platform is a system that follows a typical client–server model wherein the end-users are the clients who interact with a web server, which, in turn, interacts with a map server, a database server, and the relevant file system. The rest of the system is responsible for the main processing tasks.
The system consists of the following parts:
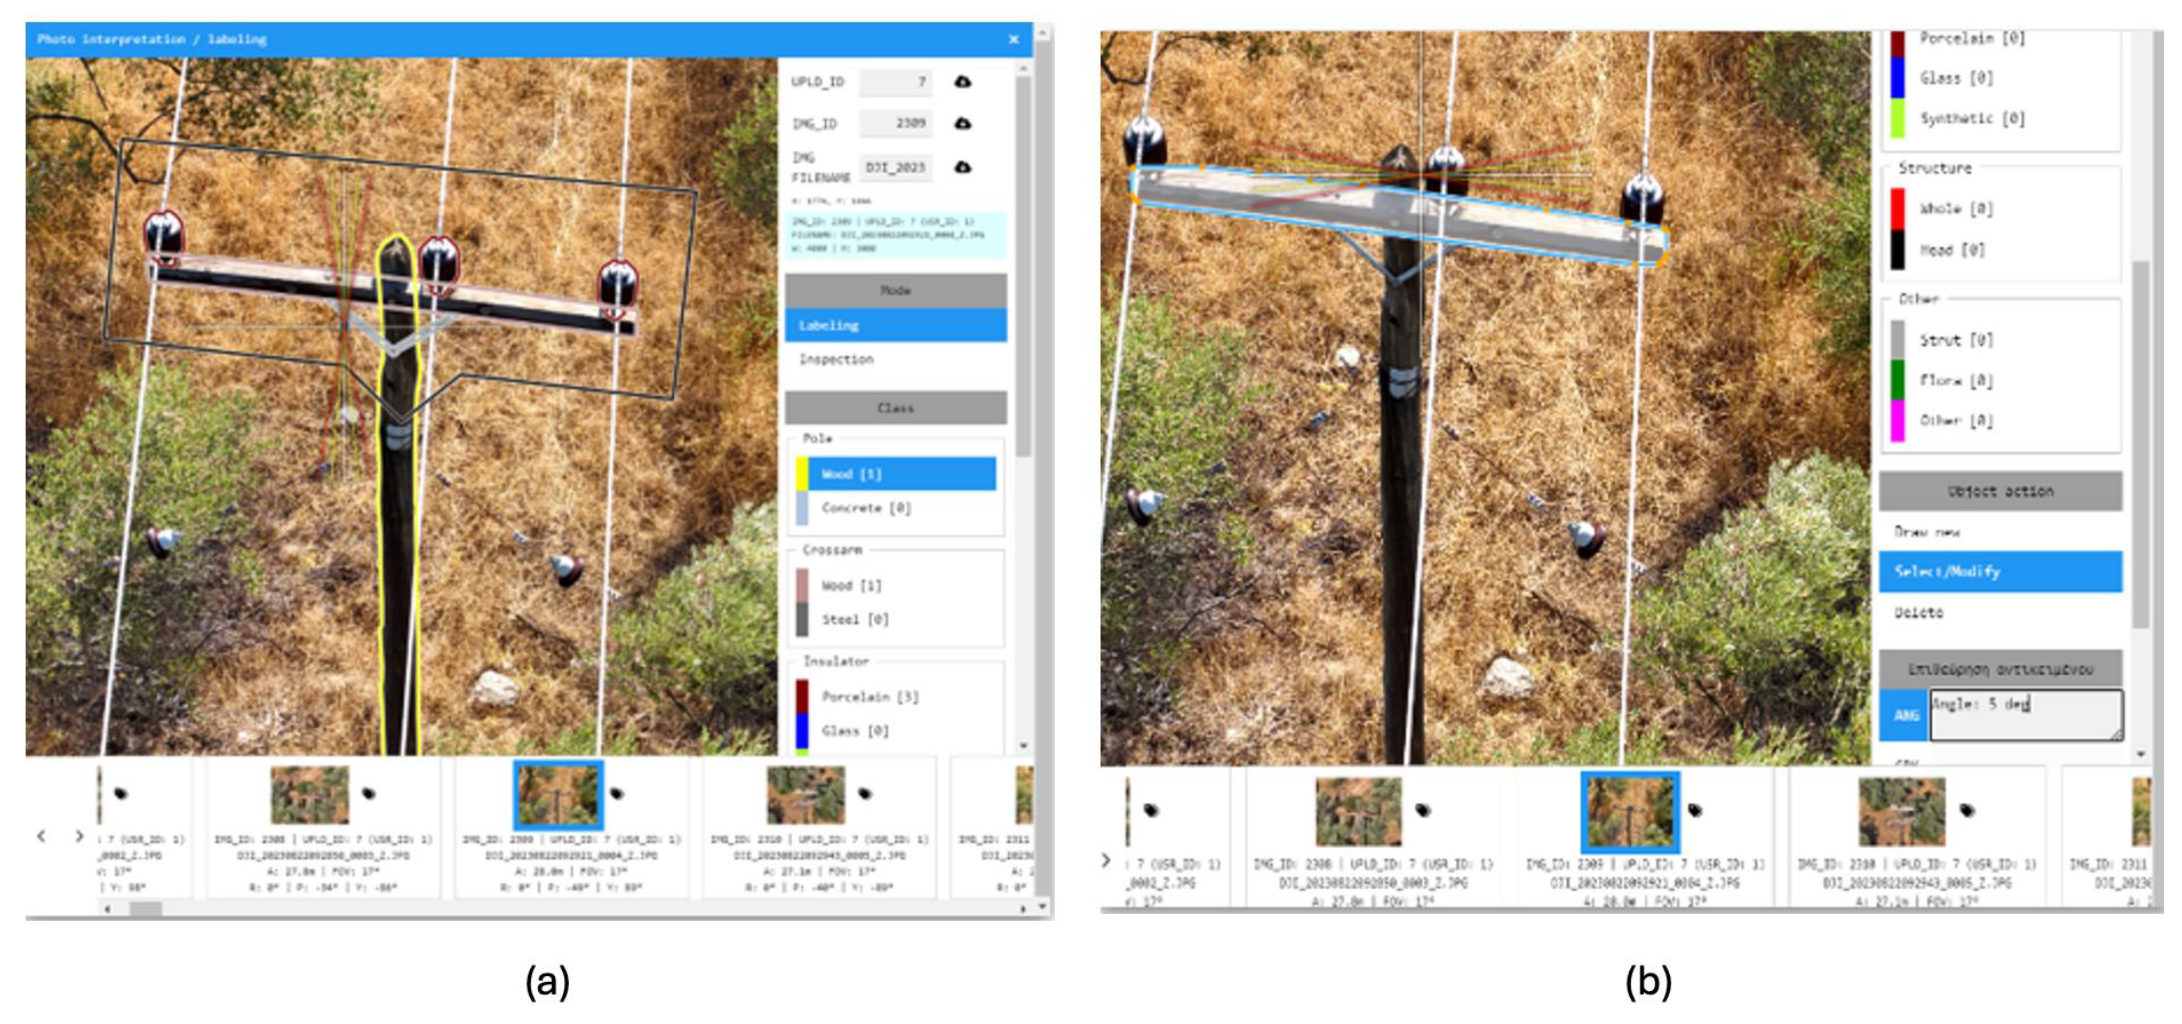
  • The ALTITUDE website, responsible for front-end tasks related to mapping, MV network digitization, imagery uploading, AI labeling, AI- or user-based photo interpretation, and inspection reporting;
  • The ALTITUDE processing application, responsible for imagery uploading, storage, analysis, and serving; AI training, invocation, storage, and the serving of the resulting findings; user-based photo interpretation and the serving of the resulting defects; and inspection reporting;
  • The ALTITUDE database, file system, and map server.
An open-source approach was followed, and the Apache HTTP Server (webserver) to host the website and provide front-end functionality via PHP scripts, the MapServer platform (map server), and a PostgreSQL/PostGIS database (database server) were selected. The rest of the system, which includes task scheduling, image analysis, inference, and reporting, was written in Python.
Each part of the system mentioned above is further analyzed in the following subsections.

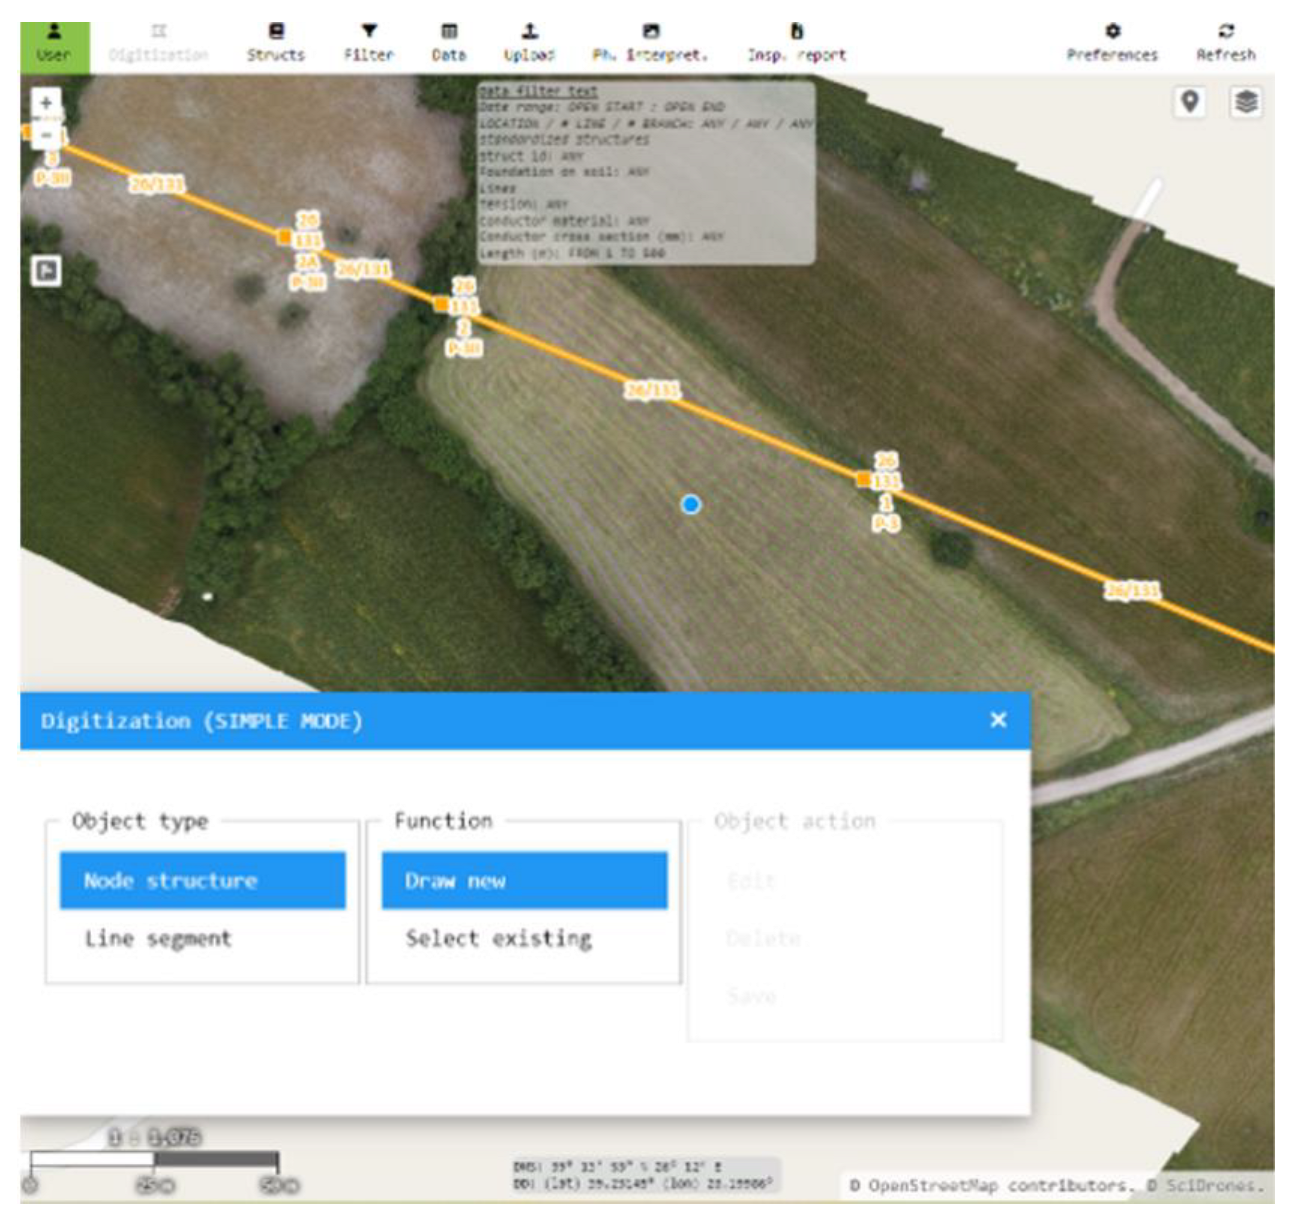
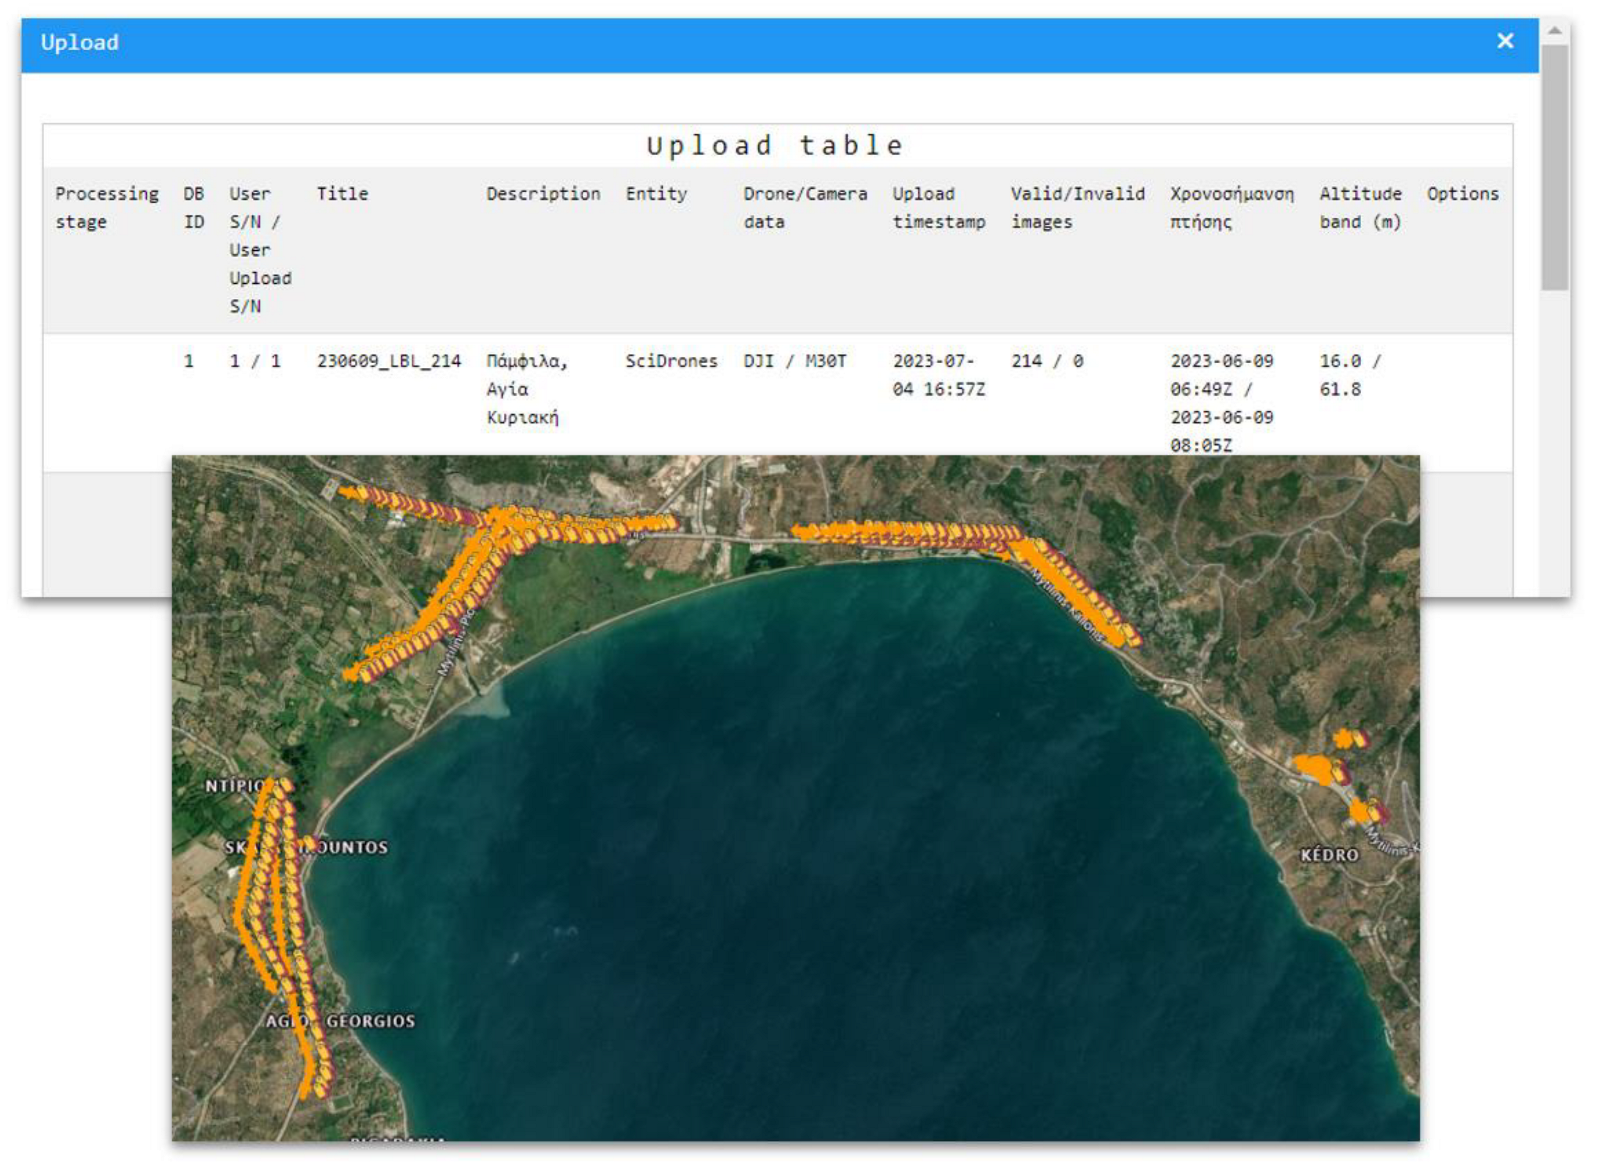
3.1. ALTITUDE Web GIS

The front end of the web GIS is written in vanilla JavaScript with the addition of the open-source mapping library OpenLayers and other open-source helper libraries. The website offers a cross-platform (responsive) user experience and allows users to perform the following main actions: (a) MV network map display, filtering, and query; (b) MV network digitization, where users digitize MV structures and lines to create a geo-temporal digital twin of the network (Figure 4); (c) UAV imagery upload (Figure 5); (d) AI labeling (used for training) (Figure 6); (e) image-finding validation, where the user can update AI results and manually insert new findings (Figure 7); (f) report generation (Figure 8).

3.2. ALTITUDE Defect Detection Capabilities

ALTITUDE is a powerful tool designed to enhance the monitoring and maintenance of medium-voltage (MV) structures. It can detect five significant types of defects, each of which can significantly impact the performance and safety of the electrical infrastructure:
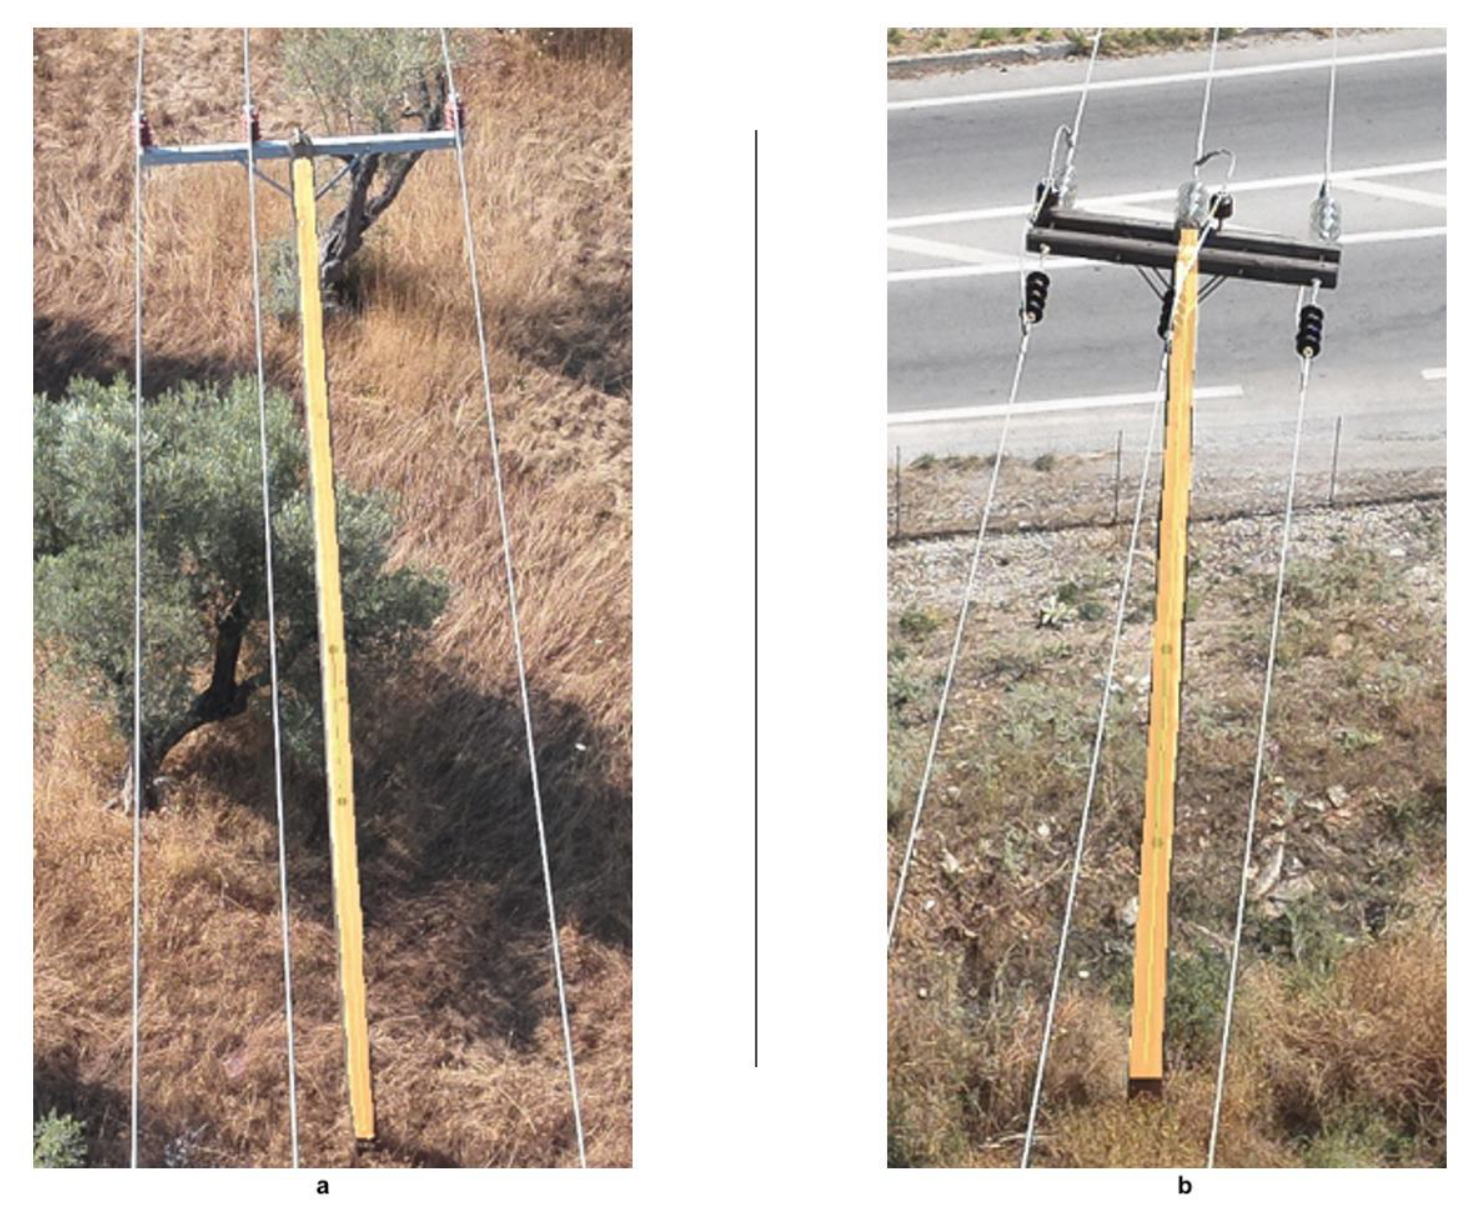
  • The tilt angles of poles: The system can accurately measure and identify any deviations in the tilt angles of poles. This is crucial because poles that are not perfectly vertical can compromise the structural integrity of the entire system and pose safety hazards;
  • The tilt angles of crossarms: The crossarms must maintain precise alignment, like the poles. The ALTITUDE system detects any misalignment or tilting in the crossarms, which are essential components that support the conductors and insulators;
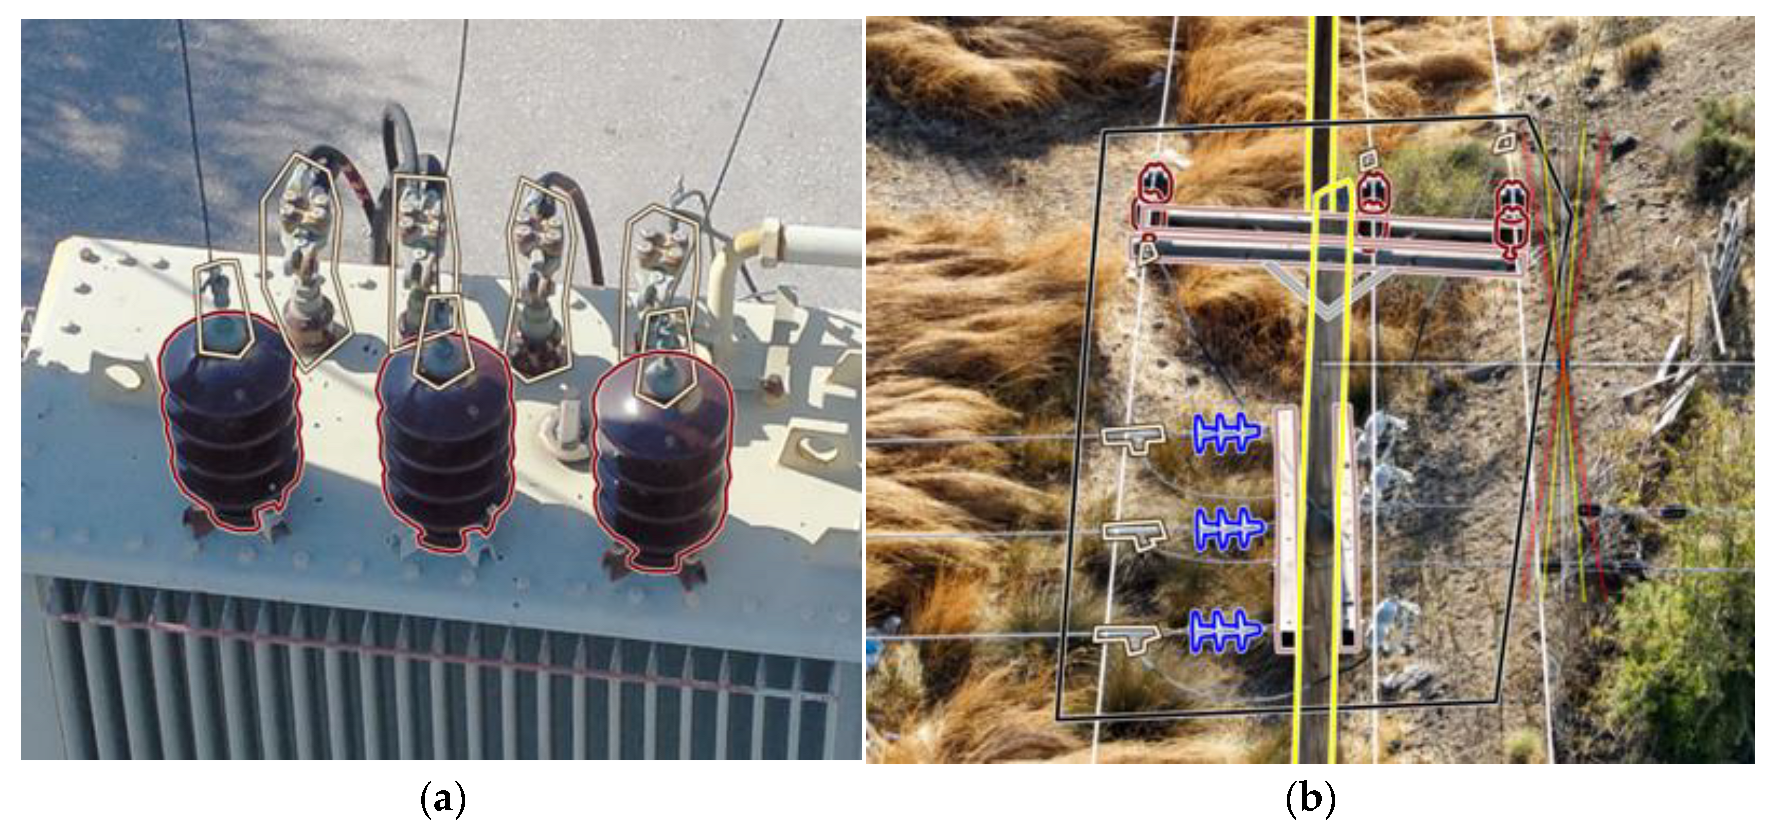
  • The tilt angles of pin insulators: the correct positioning of these insulators ensures proper electrical insulation and mechanical stability, and the system detects their tilt angles;
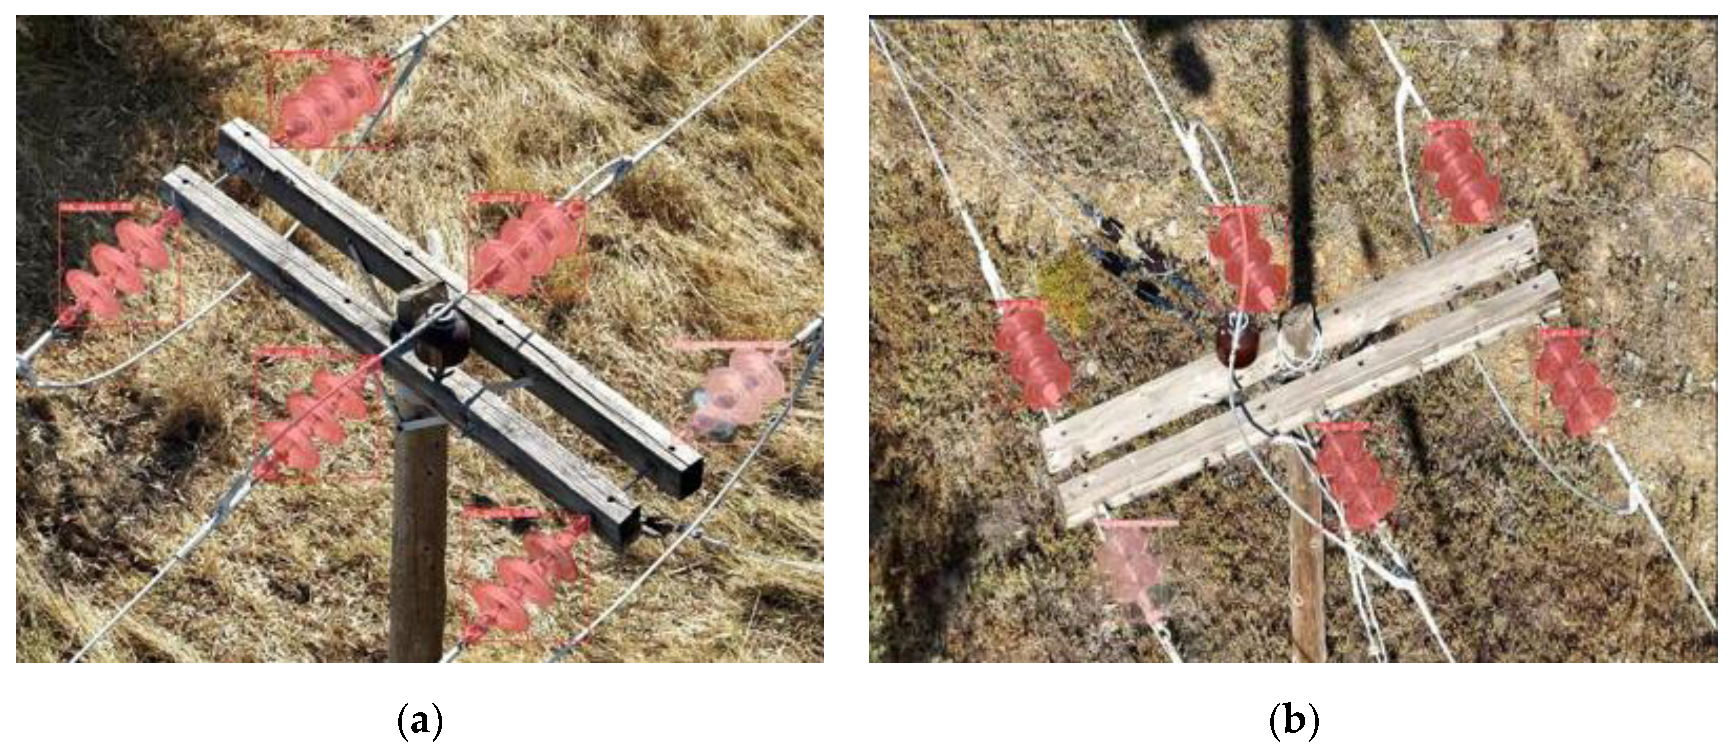
  • Missing disks in glass-line insulators: All disks in glass-line insulators are necessary for an optimal insulation performance. The ALTITUDE system can identify missing disks that could otherwise lead to potential failures in the line;
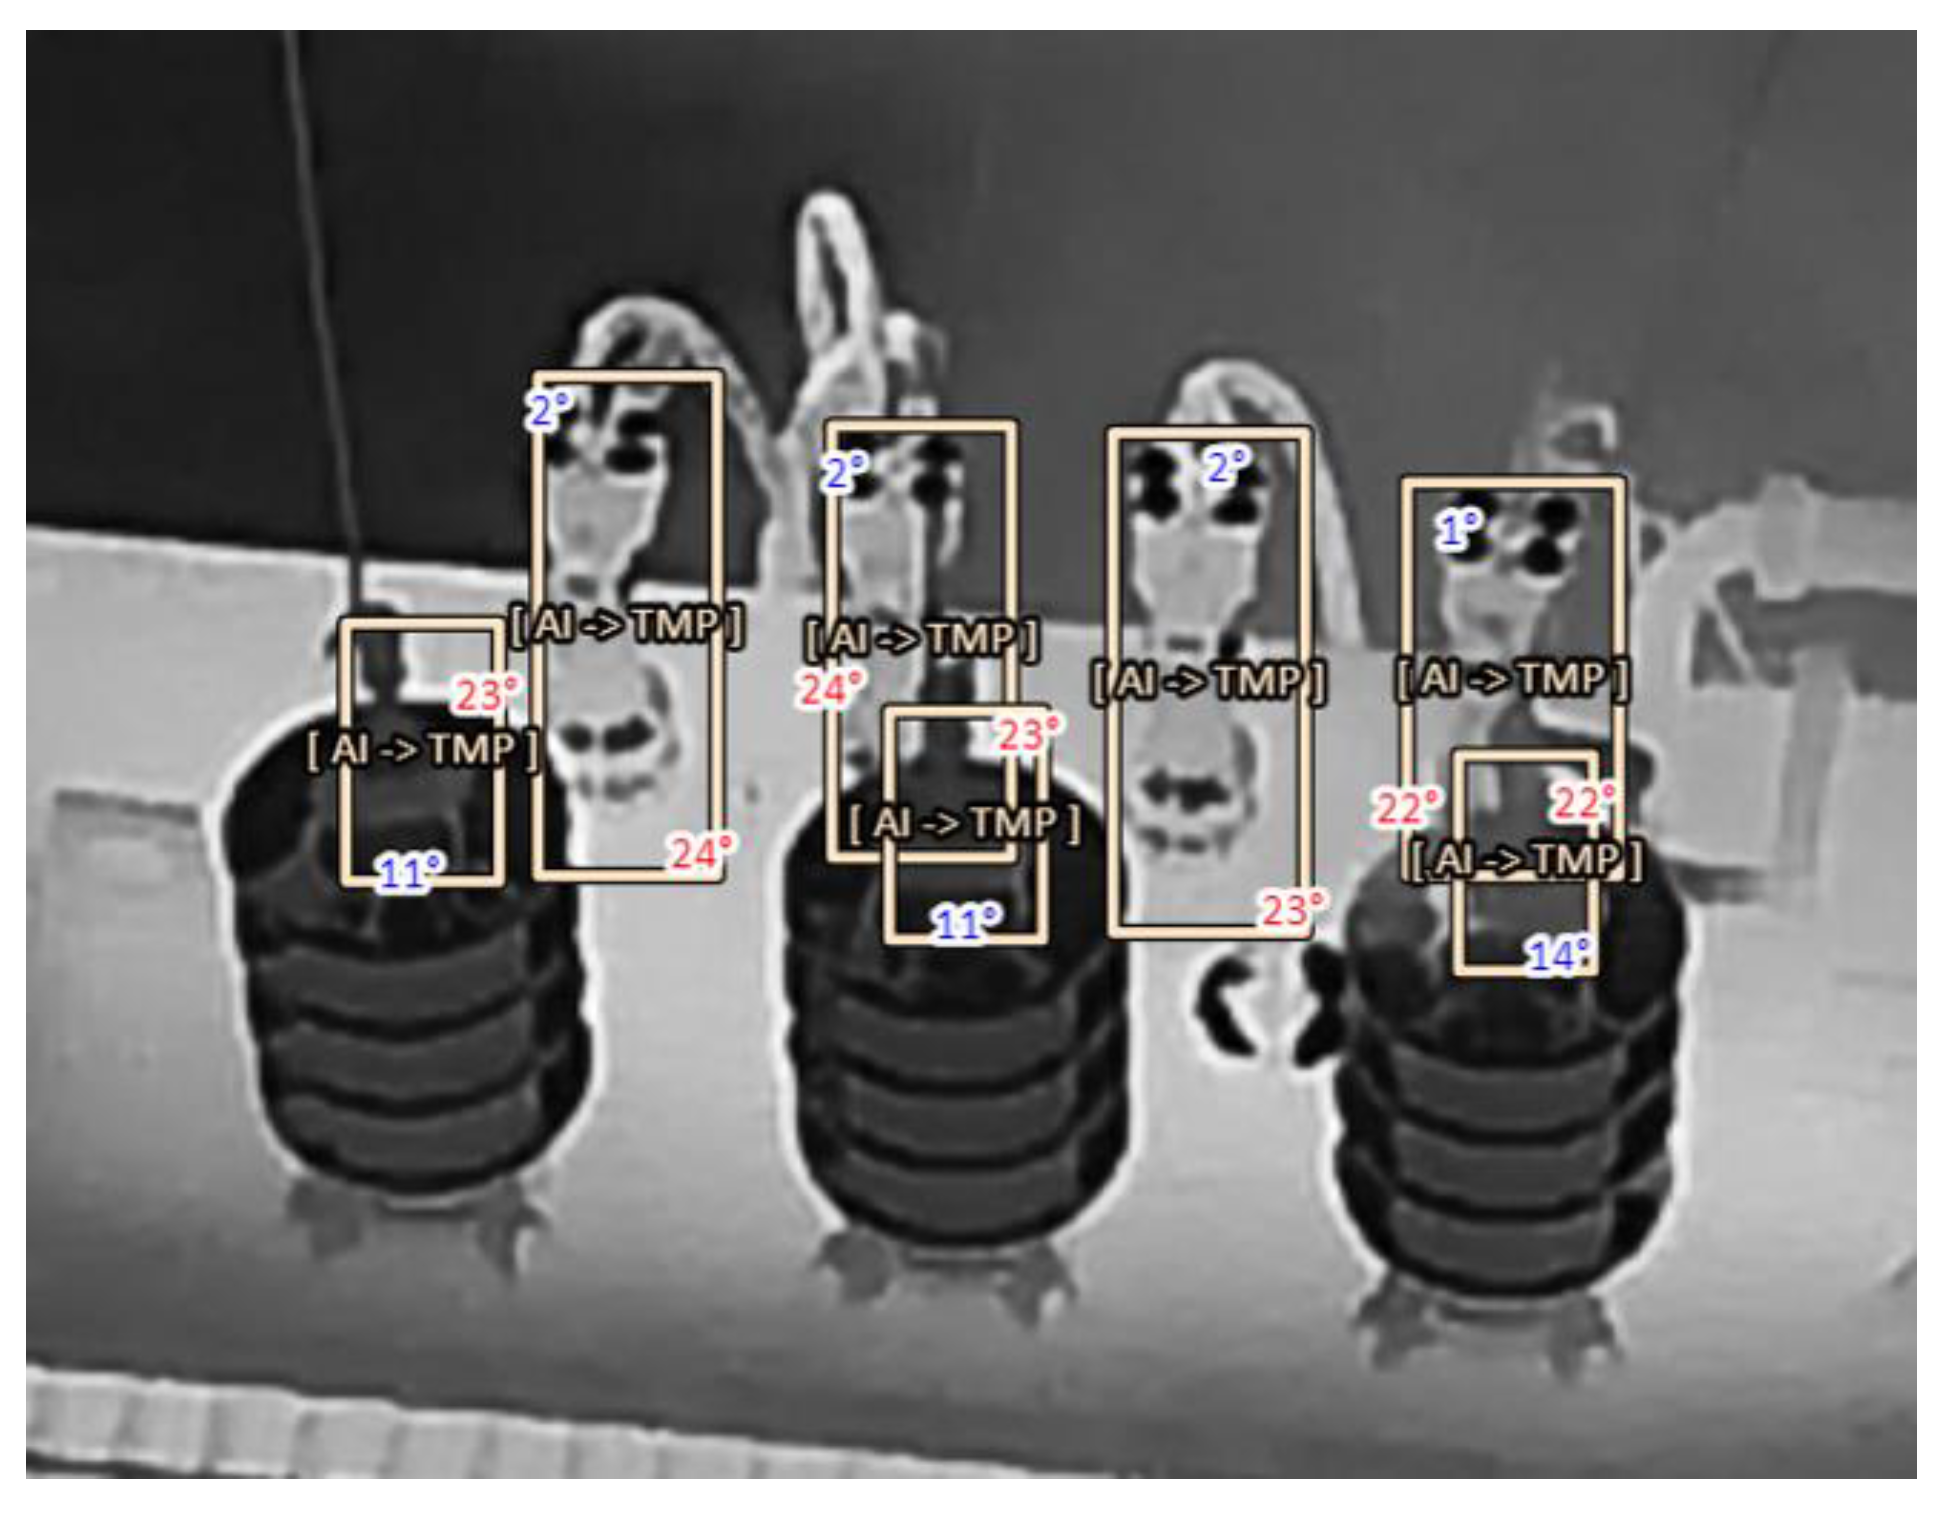
  • Overheated insulators: By detecting high temperatures in various components, the system helps identify overheating issues. Overheating can indicate underlying problems, such as excessive electrical loads, poor connections, or deteriorating equipment, which must be addressed promptly to prevent failures and ensure safety.
Through these capabilities, the ALTITUDE system provides the comprehensive monitoring and early detection of critical defects in MV structures, facilitating timely maintenance and enhancing the reliability and safety of the electrical infrastructure.
Figure 8a,b depict an example of the tilted electric poles in the power transmission grid of Lesvos Island, and Figure 9a,b depict tilted crossarms in the under-study system.
As for the tilting of the pin insulators, a large dataset of drone images depicting pin insulators on crossarms from various angles was used to train the systems. A similar algorithmic process was used to derive the tilt. Figure 10 illustrates the ALTITUDE training (i.e., labeling) of various network components in the under-study area.
To detect missing insulator disks and given the lack of sufficient real-life data depicting this defect, an artificial dataset was created with image processing and was used to train the two detection systems (Figure 11). The Mask R-CNN could not distinguish intact insulator lines from lines with missing disks. On the contrary, YOLOv8 successfully identified the defective components with extremely high accuracy without needing special post-processing. Therefore, YOLOv8 was the network of choice for the detection functionality in the ALTITUDE. Specifically, two YOLOv8 instances were trained:
  • Segment (mask) detection: the masks detected are translated into angles to find a possible defect based on the angle and the provided threshold. There is also a subclass used for binary existence, where applicable;
  • Bounding-box detection: the boxes detected are translated into thermal-image boxes to extract possible defects based on the provided threshold.
Figure 12 below depicts the accuracies achieved in the fault detection of various components in the network.
Figure 12 presents the performance metrics of the ALTITUDE machine learning detection model. It lists the detected classes and their corresponding performance scores. The scores represent the model’s accuracy for each class. A detailed breakdown of the segments is as follows:
  • pole_wood: 0.970: this class represents wooden poles with a performance score of 0.970;
  • ca_wood: 0.931: this class represents wooden crossarms with a performance score of 0.931;
  • ca_steel: 0.969: this class represents steel crossarms with a performance score of 0.969;
  • ins_porc: 0.983: this class represents porcelain insulators with a performance score of 0.983;
  • ins_glass: 0.994: this class represents glass insulators with a performance score of 0.994;
  • ins_glass_broken: 0.974: this class represents broken glass insulators with a performance score of 0.974;
  • ins_syn: 0.900: this class represents synthetic insulators with a performance score of 0.900;
  • other_strut: 0.900: this class represents other structural elements with a performance score of 0.900;
  • all classes: 0.953 0.953 [email protected]: this indicates that the model’s overall performance across all classes, with a mean Average Precision (mAP) threshold of 0.5, is 0.953.
A detailed breakdown of the YOLOs defined categories and accuracy is as follows. For the ms_joint category that represents joints, the algorithm has a performance score of 0.609. The model’s overall performance across all classes, with a mean Average Precision (mAP) of 0.5, is 0.609.
The presented scores suggest that the model performs very well, with high accuracy across all the specified categories and an excellent overall mean Average Precision.
For the segments, the scores suggest that the model’s performance for detecting the “ms_joint” category is moderate, with an overall mean Average Precision of 0.609. The lower score compared to the segment accuracy score implies that the model has more difficulty accurately detecting this specific type of object.
Regarding thermal inspection in the ALTITUDE system, pairs of visual and thermal images were utilized, and the process took place in two steps. Firstly, selected components of interest, such as insulators and joints, were identified on the visual image. Then, a mapping algorithm mapped the component regions onto the thermal image, and the temperatures inside these areas were inspected for abnormal values, as depicted in Figure 13.

4. Discussion

The present work analyzes the methodology followed to detect network faults within the ALTITUDE project. The system was tested and validated on Lesvos Island, Greece.
Extensive research was carried out to create a dedicated algorithm for the automatic monitoring of grid defects, such as the tilt of electric poles and insulators, from drone aerial images. Initially, a preliminary study in deep learning for the health monitoring of the selected electric grid components was conducted. The objective of this study was to review the existing literature regarding fault detection and the damage identification of components of the electricity transmission network using drone photography and trained convolutional neural networks. In addition, a second study on the automatic monitoring of the tilt of electric poles and insulators was also carried out. This work aimed to examine the feasibility of the automatic detection of tilt in electric poles based on UAV imagery. This was demonstrated and validated by images provided by the HEDNO. Finally, the dedicated algorithm was created after confirming the previous findings on the drone photos obtained. For this purpose, a pre-defined flight protocol for the health monitoring of the electric grid was followed. Overall, the detection algorithm demonstrated over 90% accuracy in calculating pole and insulator tilts.
Innovative approaches and specific experimental processes are essential for automatically inspecting power transmission networks. The proposed approach, which lies in the combination of state-of-the-art automated drone-based inspections with a machine learning algorithm for fault detection, compared to traditional manual inspections, reduces the inspection efficiency by five times. Key metrics such as the inspection time, fault detection accuracy, and cost efficiency were examined, and 25–45% reductions in all of the above steps were achieved. The results reveal that drones significantly reduce the inspection time and enhance the detection of faults in the electric grid that are often missed during manual inspections. The method, which follows ALTITUDE, capitalizes on integrating sophisticated technologies into standard inspection protocols, enhancing the accuracy of the inspection and the reliability and safety of power transmission networks.
The proposed work has future directions, and the inspection of power networks after natural disasters can be investigated further. In cases of fires or flooding phenomena, the UAV inspections of power networks can accelerate the restoration of the grid to secure its optimal operation, eventually benefiting the end-users.
In conclusion, the work described in the current paper is highly replicable. It can be implemented by regulatory bodies and all potential stakeholders to monitor small- and large-scale power networks worldwide. The developed system is competitive in efficiency and cost compared to all conventional techniques currently utilized for inspecting electrical grids.

Author Contributions

Conceptualization, G.C., V.K. and A.P.; methodology, G.C., V.K. and A.P.; software, A.P.; validation, A.P.; investigation, G.C., V.K. and A.P.; resources, G.C.; writing—original draft preparation, G.C., V.K. and A.P.; writing—review and editing, D.S., D.T. and A.P.; supervision, D.S. and D.T. All authors have read and agreed to the published version of the manuscript.

Funding

This research was supported by a grant from Iceland, Liechtenstein, and Norway through the EEA Financial Mechanism 2014–2021, in the frame of the program “Business Innovation Greece”. The APC was funded by the RENEL IKE company.

Data Availability Statement

The data presented in this study are available on request from the corresponding author.

Conflicts of Interest

Authors Georgios Chatzargyros and Vasiliki Kotoula were employed by the company Renel I.K.E. Author Apostolos Papakonstatinou was employed by the company SciDrones. The remaining authors declare that the research was conducted in the absence of any commercial or financial relationships that could be construed as a potential conflict of interest. The authors declare that this study received funding from RENEL IKE company. The funder was not involved in the study design, collection, analysis, interpretation of data, the writing of this article, or the decision to submit it for publication.

References

  1. Tsellou, A.; Livanos, G.; Ramnalis, D.; Polychronos, V.; Plokamakis, G.; Zervakis, M.; Moirogiorgou, K. A UAV Intelligent System for Greek Power Lines Monitoring. Sensors 2023, 23, 8441. [Google Scholar] [CrossRef]
  2. Zormpas, A.; Moirogiorgou, K.; Kalaitzakis, K.; Plokamakis, G.; Partsinevelos, P.; Giakos, G.; Zervakis, M. Power Transmission Lines Inspection using Properly Equipped Unmanned Aerial Vehicle (UAV). In Proceedings of the 2018 IEEE International Conference on Imaging Systems and Techniques (IST), Krakow, Poland, 16–18 October 2018; pp. 1–5. [Google Scholar] [CrossRef]
  3. Xu, B.; Zhao, Y.; Wang, T.; Chen, Q. Development of power transmission line detection technology based on unmanned aerial vehicle image vision. SN Appl. Sci. 2023, 5, 72. [Google Scholar] [CrossRef]
  4. Jalil, B.; Leone, G.R.; Martinelli, M.; Moroni, D.; Pascali, M.A.; Berton, A. Fault Detection in Power Equipment via an Unmanned Aerial System Using Multi Modal Data. Sensors 2019, 19, 3014. [Google Scholar] [CrossRef]
  5. Savva, A.; Zacharia, A.; Makrigiorgis, R.; Anastasiou, A.; Kyrkou, C.; Kolios, P.; Panayiotou, C.; Theocharides, T. ICARUS: Automatic Autonomous Power Infrastructure Inspection with UAVs. In Proceedings of the 2021 International Conference on Unmanned Aircraft Systems (ICUAS), Athens, Greece, 15–18 June 2021; pp. 918–926. [Google Scholar] [CrossRef]
  6. Yan, G.; Li, C.; Zhou, G.; Zhang, W.; Li, X. Automatic Extraction of Power Lines From Aerial Images. IEEE Geosci. Remote Sens. Lett. 2007, 4, 387–391. [Google Scholar] [CrossRef]
  7. Kim, S.; Kim, D.; Jeong, S.; Ham, J.-W.; Lee, J.-K.; Oh, K.-Y. Fault Diagnosis of Power Transmission Lines Using a UAV-Mounted Smart Inspection System. IEEE Access 2020, 8, 149999–150009. [Google Scholar] [CrossRef]
  8. Yang, L.; Fan, J.; Liu, Y.; Li, E.; Peng, J.; Liang, Z. A Review on State-of-the-Art Power Line Inspection Techniques. IEEE Trans. Instrum. Meas. 2020, 69, 9350–9365. [Google Scholar] [CrossRef]
  9. Surantha, N.; Iwao, T.; Ren, Z.; Morishita, H. Digital Transformation on Power Transmission Line Inspection using Autonomous Drone and Deep Learning. In Proceedings of the 2nd International Conference on Robotics, Automation and Artificial Intelligence (RAAI), Singapore, 9–11 December 2022; pp. 80–86. [Google Scholar] [CrossRef]
  10. Xie, X.; Liu, Z.; Xu, C.; Zhang, Y. A Multiple Sensors Platform Method for Power Line Inspection Based on a Large Unmanned Helicopter. Sensors 2017, 6, 1222. [Google Scholar] [CrossRef]
  11. Katrasnik, J.; Pernus, F.; Likar, B. A Survey of Mobile Robots for Distribution Power Line Inspection. IEEE Trans. Power Deliv. 2010, 25, 485–493. [Google Scholar] [CrossRef]
  12. Li, Z.; Liu, Y.; Walker, R.; Hayward, R.; Zhang, J. Towards automatic power line detection for a UAV surveillance system using pulse coupled neural filter and an improved Hough transform. Mach. Vis. Appl. 2010, 21, 677–686. [Google Scholar] [CrossRef]
  13. Li, X.; Li, Z.; Wang, H.; Li, W. Unmanned Aerial Vehicle for Transmission Line Inspection: Status, Standardization, and Perspectives. Front. Energy Res. 2021, 9, 713634. [Google Scholar] [CrossRef]
  14. Schofield, O.B.; Iversen, N.; Ebeid, E. Autonomous power line detection and tracking system using UAVs. Microprocess. Microsyst. 2022, 94, 104609. [Google Scholar] [CrossRef]
  15. Fan, B.; Li, Y.; Zhang, R.; Fu, Q. Review on the Technological Development and Application of UAV Systems. Chin. J. Electron. 2020, 29, 199–207. [Google Scholar] [CrossRef]
  16. Zhao, H.; Zhou, Y.; Zhang, L.; Hu, X.; Peng, H.; Cai, X. Mixed YOLOv3-LITE: A lightweight real-time object detection method. Sensors 2020, 7, 1861. [Google Scholar] [CrossRef]
  17. Liu, M.; Wang, X.; Zhou, A.; Fu, X.; Ma, Y.; Piao, C. UAV-YOLO: Small Object Detection on Unmanned Aerial Vehicle Perspective. Sensors 2020, 20, 2238. [Google Scholar] [CrossRef] [PubMed]
  18. Hoang, M.L. Smart Drone Surveillance System Based on AI and on IoT Communication in Case of Intrusion and Fire Accident. Drones 2023, 7, 694. [Google Scholar] [CrossRef]
  19. Rahaman, F.M. The Current Trends of Object Detection Algorithms: A Review. Available online: https://www.researchgate.net/publication/373392107_The_Current_Trends_of_Object_Detection_Algorithms_A_Review (accessed on 28 March 2024).
  20. McEnroe, P.; Wang, S.; Liyanage, M. A survey on the convergence of edge computing and AI for UAVs: Opportunities and challenges. IEEE Internet Things J. 2022, 9, 15435–15459. [Google Scholar] [CrossRef]
  21. Siddiqui, Z.A.; Park, U. A Drone Based Transmission Line Components Inspection System with Deep Learning Technique. Energies 2020, 13, 3348. [Google Scholar] [CrossRef]
  22. Maduako, I.; Igwe, C.F.; Abah, J.E.; Onwuasaanya, O.E.; Chukwu, G.A.; Ezeji, F.; Okeke, F.I. Deep learning for component fault detection in electricity transmission lines. J. Big Data 2022, 9, 81. [Google Scholar] [CrossRef]
  23. Tao, X.; Zhang, D.; Wang, Z.; Liu, X.; Zhang, H.; Xu, D. Detection of Power Line Insulator Defects Using Aerial Images Analyzed With Convolutional Neural Networks. IEEE Trans. Syst. Man Cybern. Syst. 2020, 50, 1486–1498. [Google Scholar] [CrossRef]
  24. Huang, Y.; Jiang, L.; Han, T.; Xu, S.; Liu, Y.; Fu, J. High-Accuracy Insulator Defect Detection for Overhead Transmission Lines Based on Improved YOLOv5. Appl. Sci. 2022, 12, 12682. [Google Scholar] [CrossRef]
  25. Zheng, J.; Wu, H.; Zhang, H.; Wang, Z.; Xu, W. Insulator-Defect Detection Algorithm Based on Improved YOLOv7. Sensors 2022, 22, 8801. [Google Scholar] [CrossRef]
  26. Ling, Z.; Zhang, D.; Qiu, R.C.; Jin, Z.; Zhang, Y.; He, X.; Liu, H. An accurate and real-time method of self-blast glass insulator location based on faster R-CNN and U-net with aerial images. CSEE J. Power Energy Syst. 2019, 5, 474–482. [Google Scholar] [CrossRef]
  27. Zhao, Z.; Zhen, Z.; Zhang, L.; Qi, Y.; Kong, Y.; Zhang, K. Insulator Detection Method in Inspection Image Based on Improved Faster R-CNN. Energies 2019, 12, 1204. [Google Scholar] [CrossRef]
  28. Hosseini, M.M.; Umunnakwe, A.; Parvania, M.; Tasdizen, T. Intelligent Damage Classification and Estimation in Power Distribution Poles Using Unmanned Aerial Vehicles and Convolutional Neural Networks. IEEE Trans. Smart Grid 2020, 11, 3325–3333. [Google Scholar] [CrossRef]
  29. Song, L.; Li, X.; Zhu, S.; Choy, Y. Cascade ensemble learning for multi-level reliability evaluation. Aerosp. Sci. Technol. 2024, 148, 109101. [Google Scholar] [CrossRef]
  30. DJI Enterprise. Available online: https://enterprise.dji.com/matrice-300 (accessed on 28 March 2024).
  31. DJI Enterprise. Available online: https://enterprise.dji.com/matrice-30 (accessed on 28 March 2024).
  32. DJI. Available online: https://www.dji.com/gr/downloads/djiapp/dji-pilot (accessed on 28 March 2024).
  33. SPH Engineering. Available online: https://www.sphengineering.com/flight-planning/ugcs (accessed on 28 March 2024).
  34. Diwan, T.; Anirudh, G.; Tembhurne, J.V. Object detection using YOLO: Challenges, architectural successors, datasets and applications. Multimed Tools Appl. 2023, 82, 9243–9275. [Google Scholar] [CrossRef] [PubMed]
  35. Fang, S.; Zhang, B.; Hu, J. Improved Mask R-CNN Multi-Target Detection and Segmentation for Autonomous Driving in Complex Scenes. Sensors 2023, 23, 3853. [Google Scholar] [CrossRef]
  36. Wang, G.; Chen, Y.; An, P.; Hong, H.; Hu, J.; Huang, T. UAV-YOLOv8: A Small-Object-Detection Model Based on Improved YOLOv8 for UAV Aerial Photography Scenarios. Sensors 2023, 23, 7190. [Google Scholar] [CrossRef]
  37. Afdhal, A.; Saddami, K.; Sugiarto, S.; Fuadi, Z.; Nasaruddin, N. Real-Time Object Detection Performance of YOLOv8 Models for Self-Driving Cars in a Mixed Traffic Environment. In Proceedings of the 2nd International Conference on Computer System, Information Technology, and Electrical Engineering (COSITE), Banda Aceh, Indonesia, 2–3 August 2023; pp. 260–265. [Google Scholar] [CrossRef]
  38. Oberweger, M.; Wendel, A.; Bischof, H. Visual recognition and fault detection for power line insulators. In Proceedings of the 19th Computer Vision Winter Workshop (CVWW), Křtiny, Czech Republic, 3–5 February 2014; pp. 81–88. [Google Scholar]
  39. Zhang, Z.; Huang, S.; Li, Y.; Li, H.; Hao, H. Image Detection of Insulator Defects Based on Morphological Processing and Deep Learning. Energies 2022, 15, 2465. [Google Scholar] [CrossRef]
  40. Díaz, M.W.; Cáceres, J.J. A novel application of drones: Thermal diagnosis of electrical and telecommunications infrastructure. In Proceedings of the 2018 IEEE 38th Central America and Panama Convention (CONCAPAN XXXVIII), San Salvador, El Salvador, 7–9 November 2018; pp. 1–6. [Google Scholar] [CrossRef]
  41. Zhang, J.; Yang, H.; Zhang, Z.; Zhao, K.; Chen, Y. An automatic diagnostic method of abnormal heat defect in transmission lines based on infrared video. In Proceedings of the 2016 IEEE PES 13th International Conference on Transmission & Distribution Construction, Operation & Live-Line Maintenance (ESMO), Columbus, OH, USA, 12–15 September 2016; pp. 1–4. [Google Scholar] [CrossRef]
  42. Taqi, A.; Beryozkina, S. Overhead Transmission Line Thermographic Inspection Using a Drone. In Proceedings of the 2019 IEEE 10th GCC Conference & Exhibition (GCC), Kuwait, Kuwait, 19–23 April 2019; pp. 1–6. [Google Scholar] [CrossRef]
Figure 1. Schematic diagram of the architecture of the proposed method.
Energies 17 03518 g001
Figure 2. Equipment for the implementation of the ALTITUDE platform: (a) DJIMatrice M30T, DJI, Shenzhen, China, used for mapping with the DJI P1 camera and inspections with the DJI H20T camera; (b) DJIMatrice M300, DJI, Shenzhen, China, used for inspection of the power transmission network.
Energies 17 03518 g002
Figure 3. A pseudo-code representation of the process followed to extract defects.
Energies 17 03518 g003
Figure 4. Digitization of MV network on Lesvos Island.
Energies 17 03518 g004
Figure 5. Web GIS: imagery upload from Pamila area.
Energies 17 03518 g005
Figure 6. Web GIS: (a) labeling and (b) photo interpretation.
Energies 17 03518 g006
Figure 7. Web GIS: (a) map query and (b) linked to photo interpretation/labeling panel.
Energies 17 03518 g007
Figure 8. (a,b) Tilted electric poles of the investigated power network on Lesvos Island.
Energies 17 03518 g008
Figure 9. (a,b) Tilted crossarms observed in the under-study network.
Energies 17 03518 g009
Figure 10. AI training: labeling (annotating) components of MV network: (a) pin insulators, and (b) poles, crossarms, and pin/glass insulators.
Energies 17 03518 g010
Figure 11. (a,b) AI inference: glass insulator masks, including faulty (i.e., broken) glass insulator (MRCNN).
Energies 17 03518 g011
Figure 12. The accuracies achieved in detecting various components: (a) YOLOv8 segments; (b) YOLOv8 boxes.
Energies 17 03518 g012
Figure 13. AI inference: thermal result extraction; temperature extremes and their locations (YOLOv8).
Energies 17 03518 g013
Disclaimer/Publisher’s Note: The statements, opinions and data contained in all publications are solely those of the individual author(s) and contributor(s) and not of MDPI and/or the editor(s). MDPI and/or the editor(s) disclaim responsibility for any injury to people or property resulting from any ideas, methods, instructions or products referred to in the content.

