

Analysis of the Impact of Wind Farm Construction on the Marine Environment

Maritime University of Szczecin, 70-500 Szczecin, Poland
Energies 2024, 17(14), 3523; https://doi.org/10.3390/en17143523
Submission received: 21 May 2024
/
Revised: 11 June 2024
/
Accepted: 8 July 2024
/
Published: 18 July 2024
(This article belongs to the Section B: Energy and Environment)
Abstract
:The development of offshore wind farms is an important step toward increasing the share of green energy in Poland’s energy mix, offering promising prospects for the energy industry. However, in addition to numerous benefits, such investments also carry potential risks for the marine environment, including the risk of spills of hazardous substances such as gear oils, hydraulic oils, and lubricants. This paper analyses the potential impact of oil spills from offshore wind farms on the marine ecosystems of the Baltic Sea, taking into account hydrometeorological factors, particularly protected areas (such as Natura 2000 sites) and the intensity of ship traffic in the area of the planned farms. Simulations of spill scenarios are also presented to assess the potential extent of pollution and its impact on the environment. This paper emphasises the importance of advanced monitoring and safety systems in minimising the risk of accidents and responding quickly to possible incidents. The development of offshore wind farms in Poland presents itself as a key element in a sustainable energy development strategy, combining advanced technology with environmental concerns.
1. Introduction
The development of offshore wind farms in the Baltic Sea is opening up new prospects for the Polish energy industry, offering a significant increase in the share of green energy in national energy production. Despite the undoubted benefits of operating offshore wind turbines, it is important to simultaneously pay attention to potential environmental risks, among which oil spills appear to be one of the most critical aspects. Offshore wind farms, being high-tech structures, require the use of a variety of chemicals, including gear oils, hydraulic oils, and lubricating oils [1], which can lead to water pollution in the event of failure [2]. Offshore oil spills pose a serious challenge to marine ecosystems, especially in the fragile environment of the Baltic Sea. It is also critical to consider the protection of specially protected areas, such as the Natura 2000 sites, when planning the location of offshore wind farms.
Numerous risks that can cause serious harm are present with offshore wind turbines. The most dangerous possibilities include corrosion, structural cracks, fires, and accidents with ships [3].
Ship collisions with wind turbines are one of the most dangerous threats to these structures. Collisions between ships and offshore wind turbine foundations pose a significant safety and structural integrity issue. The research indicates that such collisions can have severe consequences for both the wind turbines and the ships. Bela et al. (2017) conducted a detailed analysis of ship collisions with the monopile foundations of wind turbines, demonstrating that the impact forces can lead to significant structural damage [4]. Jia et al. (2020) examined the impact of ship collisions on the structural load of wind turbines, finding that these loads can significantly exceed the design values, necessitating specialised analyses and protective measures [5]. Damage analysis from ship collisions with wind turbine foundations conducted by Moulas et al. (2017) confirmed that such collisions can lead to significant damage, especially in the case of large vessels, highlighting the need for effective protection strategies [6]. In response to these challenges, Liu et al. (2015) developed and optimised a crashworthy device aimed at protecting the monopile foundations of offshore wind turbines from ship impacts, demonstrating the effectiveness of such technologies in real-world conditions [7].
Dynamic analyses show that the vessel’s mass, speed, and impact angle all have a significant impact on the consequences of accidents. For instance, collisions with larger ships, particularly when involving monopiles and truss constructions, can seriously destroy the foundations of turbines [8]. The research employing non-linear finite element analysis (NLFEA) demonstrates that depending on the circumstances of the event, ship collisions with wind turbine foundations can result in different levels of damage. For example, depending on the type of foundation (truss or monopile), collisions with support vessels in shallow and deep sea have varied impacts [6]. Dynamic simulations have shown that even at low collision speeds, the mortar joints in turbines supported by monopiles can suffer severe damage [9].
Significant corrosion issues arise when wind turbine structures are used in severe maritime locations. The structural integrity requires the use of corrosion prevention methods, such as galvanic anodes and organic coatings. If these systems are not adequately maintained, they may also bring pollutants into the marine environment [10].
Despite limited data on fire damage, fire safety is a key element of wind turbine design [11,12]. This requires the installation of effective fire-fighting systems and the use of heat- and flame-resistant materials.
Structural fractures, often caused by extreme weather conditions [5] or mechanical malfunctions, might pose a major risk to a turbine’s stability. For the purpose of preventing catastrophic failures, early fracture diagnosis and repair depend on routine maintenance and sophisticated monitoring systems [13].
This article will discuss the potential impacts of oil spills on marine ecosystems.
2. Materials and Methods
2.1. Offshore Wind Farms in Poland
The development of offshore wind farms in the Polish Exclusive Economic Zone of the Baltic Sea is planned in the area defined in the offshore development plan in the areas of Słupsk Bank, Ławica Środkowa, and Ławica Odrzana. In order to protect the landscape of coastal tourist destinations, these farms will be located at least 22 km from the coastline, thus minimising their impact on the landscape [14]. In addition, these locations have been chosen outside key areas for the national fishery.
By 2030, offshore wind farms (Figure 1, Table 1) will provide 13% of electricity, and by 2040, this share will increase to 19%. The first such farms in the Baltic Sea, in the Polish economic zone, will already start supplying energy in 2026.
The Baltica offshore wind farm (OWF) [15] will be built in the Polish part of the Baltic Sea between Łeba and Ustka. The distance from the nearest wind turbines to the shore will be at least 25 km. The onshore infrastructure necessary for the operation of the Baltica offshore wind farm will be located in the Choczewo commune.
PGE (Polish Energy Group) Group’s offshore programme includes the construction of the following three wind farms [15,16]:
- Baltica-1 wind power plant with a capacity of up to 896 MW (by 2030);
- Baltica-2 wind power plant, with a capacity of up to 1498 MW (by 2030);
- Baltica-3 wind power plant with a capacity of up to 1045 MW (after 2030).
Their total maximum capacity will be about 3500 MW (3.5 GW), which will make PGE the leader in the emerging offshore industry in Poland [15].
Offshore wind farm Baltic Power [17] is a key part of the transformation of ORLEN Group and Northland Power. This farm is scheduled to be commissioned in 2026, will have a capacity of almost 1.2 GW, and will be located approximately 23 km from the coast at Choczewa and Łeba. In the Baltic Power farm’s 130 km2 area, there will be 76 wind turbines, each with a generating capacity of 15 MW.
BC-Wind farm [18], located 23 km from the coastline north of the municipalities of Krokowa and Choczewo, is an offshore energy project with a capacity of up to 399 MW. It covers an area of 90.94 km2 and plans to install 31 turbines with a unit capacity of 13 MW.
BC-Wind is part of Ocean Winds, which is one of the five largest offshore energy developers in the world. The company is recognising the potential of the Baltic Sea and is developing the region’s first offshore wind farm project. Ocean Winds plans to start the commercial operation of the BC-Wind farm in 2027 [18].
The OWF Baltic II project is being developed in the Polish part of the Baltic Sea in an area of approximately 41 km2 at a distance of approximately 50 km from the shore and at a depth of 30–50 m underwater. With a capacity of 350 MW, the wind farm will be able to provide clean energy to around 350,000 households [19].
The Bałtyk II and III offshore wind farms are planned offshore wind farms with a total capacity of 1440 MW to be located in the Baltic Sea, approximately 27 km and 40 km from the port of Leba. Construction is scheduled to start in 2026/2027 [20,21].
The offshore wind farm OWF Bałtyk I is at an early stage of construction. The Bałtyk I offshore wind farm project is expected to reach a capacity of 1560 MW and is located on the border of the Polish exclusive economic zone about 81 kilometres from the coastline at the level of the Łeba Municipality [22].
2.2. Area of Study
2.2.1. Hydrometeorological Conditions
Selected hydrometeorological and hydrological conditions affecting operations in the study areas include:
- winds;
- currents;
- visibility and fog;
- flooding.
Wind
The distribution of winds depends mainly on atmospheric circulation. In the coastal zone, their speed and direction are influenced by local conditions. The basic hourly average wind speed at a height of 10 m is 7.5 m/s. Extreme wind speeds at 10 m above sea level range from 16.1 to 31.1 m/s, depending on the wind direction and the time interval for which the average wind speed was calculated.
Verification of the wind speed and direction for the multi-year study was conducted based on observations made by the Institute of Meteorology and Water Management—National Research Institute between 2000 and 2020 (10 min averages). The distribution of the frequency of occurrence of specific wind directions does not differ significantly from the multi-year study. The data for the multi-year period 2000–2020 present a wind rose (direction and speed) for Łeba (Figure 2).
Figure 3 presents the frequency and direction of winds occurring in Łeba between 2000 and 2020.
Sea Currents and Wave Action
When the weather is stable and the winds are light, steady Baltic currents, i.e., counterclockwise water circulation, are observed. This means that there are currents flowing in an easterly direction at the southern shores, but their strength generally does not exceed 0.1 m/s [23].
The speed of the current can increase due to strong winds occurring during a storm. The system of surface currents is affected when strong winds occur. In open waters, the direction of the current is then directly related to the direction of the wind and deviates from that direction by approximately 20–30 degrees to the right. In coastal areas, current directions are further modified by the shape of the shoreline.
Due to the strong influence of local and current meteorological conditions, a precise representation of the distribution of directions and values of surface currents in the area in question is difficult, but during good and stable weather there are generally weak currents in an easterly direction with speeds of approximately 0.05–0.15 m/s and occasionally they may reach higher speeds (up to 1 m/s). The occurrence of stronger winds results in a rapid change in current direction. During strong storm winds, the current may reach speeds of 0.5–1 m/s [24].
In the deep-water areas of the Baltic Sea during strong winds and moderate storms, wave heights vary from 3 to 8 m, and during very strong storms they can reach heights from 9 (summer) to 12 m (winter) [25].
In the Polish coastal zone, mostly small waves occur (summer and the month of October). Waves of intermediate and large sizes occur most frequently in late autumn and winter. The occurrence of large waves depends primarily on the duration of the storm and the strength and direction of the wind (most often they occur with winds blowing inland).
Visibility
During the year, an average of 55 days with reduced visibility are recorded around Leba. An increase in the number of days with fog is recorded especially in autumn, winter, and early spring [23].
Visual visibility at the Polish coast above 5 nautical miles occurs on about 60% of days in winter, on 70–80% of days in spring and autumn, and on more than 80% in summer. Limited visibility (0.5–2 nautical miles) due to, e.g., fog, vapour, snow, or heavy rain occurs on about 5–9% of days in October–April and 3–4% of days in May–September.
Flooding
Ice phenomena off the coast of the open sea are rare. Incipient ice formations and winding are most often observed here. In open areas, ice phenomena do not occur in 75–90% of all winters. With a warming climate, the total disappearance of ice phenomena is expected to slow.
During harsh winters, navigation may be hampered between December and April. Then, in the Polish coastal zone, there may be a problem with large amounts of ice drifting and the formation of ice accumulations on the coast or on the coastal shoals. In the event of a change in the direction of the current and wind, such ice formations may drift towards the open sea.
The 2015–2020 winter seasons on the Polish coast showed mild (seasons 2015–2017, 2018–2020) or moderate (2017/18) winters. In these seasons, ice appeared in the coastal zone of the open sea only near Świnoujście. Ice in the Polish coastal zone during the ice season did not cause navigational difficulties [26,27,28,29,30].
The temperature, pressure, water density and other hydrometeorological data are shown in Table 2.
2.2.2. Specially Protected Areas
The following forms of nature conservation occur in the vicinity of the planned OWFs according to the Nature Conservation Act:
- areas of Natura 2000;
- nature reserves;
- landscape parks;
- protected landscape areas;
- national parks.
Most of the nature conservation areas listed here are located on land. However, for the purposes of this study and sensitivity assessment, those forms have been singled out that are adjacent to, or near, the shoreline for which the effects of marine oil spill incidents are likely to cause, albeit at a minimum, a negative impact (Table 3).
Considering the distance of the area from the OWFs, the most important areas especially protected and designated within the European Ecological Network Natura 2000 [36] located in the area of the planned investment are the areas of special habitat protection and special bird protection. These include the following areas:
- PLC 990,001 Slupsk Bank;
- PLB 990,002 The coastal waters of the Baltic Sea;
- PLB 220,003 Slovenian coast.
The ranges of these areas are shown in Figure 4.
Slupsk Bank
The “Ławica Słupska” (Eng. Slupsk Bank) (Natura 2000 area (PLC 990001) was established by the Regulation of the Minister of Environment of 12 January 2011 on the Natura 2000 special bird protection areas (Journal of Laws of 2011, No. 25, item 133) as a special bird protection area and approved by the European Commission Decision as a special habitat protection area. Its location is determined by the course of the 20 m isobath and its area is, according to the SDF (Standard Data Form), 80050.25 ha, with the central point defined by the coordinates 54.9390° N and 16.7651° E.
The Słupsk shoal is in the central part of the Polish maritime areas in the Polish exclusive economic zone. It is an area with a strongly diversified bottom, with numerous hills and depressions. The Slupsk shoal Natura 2000 area is a bird sanctuary of European rank E79.
The objects of conservation (for which the site was designated), i.e., species and habitats, are indicated in the Standard Data Form (SDF):
- Habitats:
- ○
- submarine sandbanks (code 1110);
- ○
- rocky and stony seabed, reefs (code 1170).
- Bird species:
- ○
- black guillemot (Cepphus grylle), (code A202);
- ○
- long-tailed duck (Clangula hyemalis), (code A064);
- ○
- red-throated Loon (Gavia stellata), (code A001);
- ○
- black-throated Loon (Gavia arctica), (code A002).
There are no bird species from Annex I of the Council Directive 79/409/EEC.
Shoals are inhabited by numerous invertebrates that serve as a food base for flocks of water and wetland birds stopping here in autumn and wintering in this area. It is also the habitat of the red alga Delesseria sanguinea, which has been considered extinct in the proper Baltic Sea area.
Coastal Waters of the Baltic Sea
Information regarding this protected area is contained in the Standard Data Form for the Natura 2000 area marked PLB990002.
The area covers 211,741.2 ha. It includes a strip of coastal waters of the Baltic Sea about 15 km wide and with depths ranging from 0 to 20 m. It stretches over a 200 km section, starting from the base of the Hel Peninsula to the border with the Pomeranian Bay nature reserve, running perpendicular to the western ends of Bukowo Lake (Łazy). The seabed is uneven, with bottom level variations reaching up to 3 m.
The benthic fauna is dominated by small crustaceans. Marine mammals such as grey and ringed seals, as well as porpoises, are rarely observed. The area serves as a bird sanctuary of European significance, E80. Two bird species from Annex I of the Bird Directive winter in significant numbers in the area: the black-throated loon and the red-throated loon. Populations of the long-tailed duck, black guillemot, and common scoter are also of particular importance [38].
Słowińskie Coast
Information regarding this protected area is included in the Standard Data Form for the Natura 2000 area marked PLB220003.
The Słowińskie Coast area encompasses the Gardno-Łeba Spit, the two largest brackish coastal lakes, Łebsko and Gardno, along with adjacent meadows, peatlands, forests, and swampy woodlands. The area includes the main complex of the Słowiński National Park along with the marine waters incorporated into the park in 2004 [36].
It is an important bird sanctuary of European significance, E09 (Słowiński National Park). The area is listed in the Ramsar Convention areas; it is also within the Słowiński Biosphere Reserve. There are at least 25 species of birds from Annex I of the Birds Directive and 15 species from the Polish Red Book (PCK). During the breeding season, the area is inhabited by at least 1% of the national population (C3 and C6) of the following bird species: white-tailed eagle (PCK), greater spotted eagle (PCK), osprey (PCK), eagle owl (PCK), dunlin (schinzii) (PCK), ringed plover (PCK); additionally, the marsh harrier and the great cormorant appear in relatively high densities (C7). During migration, at least 1% of the population of the migratory route (C2 and C3) of the following bird species is present: little gull (about 2%), crane (>3%), bean goose (>4%), and barnacle goose; in relatively large densities (C7), the white-fronted goose and the whooper swan are also present [39].
It is also a habitat for migrating birds: the whooper swan, geese, barnacle goose, and the silver gull. The area protects a landscape of diverse morphological forms observed on the Gardno-Łeba Spit, including unique coastal dunes (up to 40 m a.s.l.) that migrate at a rate of 3–10 m per year, and the two largest brackish coastal lakes: Łebsko and Gardno, along with adjacent meadows, peatlands, forests, and swampy woodlands.
2.2.3. Ship Traffic in the Area
TSS Słupska Bank
The traffic separation system consists of three parts:
- Western part:
- ○
- two traffic lanes, each 1.75 miles wide;
- ○
- a separation zone 0.5 miles wide.
- Central part:
- ○
- two traffic lanes, each 1.6 miles wide;
- ○
- a traffic separation zone 0.4 miles wide on the western side and 0.8 miles wide on the eastern side;
- ○
- a coastal traffic zone.
- Eastern part:
- ○
- two traffic lanes of variable width;
- ○
- a traffic separation zone of variable shape and width;
- ○
- a coastal traffic zone.
The supervision of ship traffic in the TSS Ławica Słupska area is conducted by the VTS Ławica Słupska Traffic Control Service, performing the following tasks:
- conducting the control and management of ship traffic through issuing instructions, recommendations, and orders, especially when, in the VTS operator’s assessment, the situation may lead to a threat to navigation safety;
- overseeing compliance with traffic regulations and other rules applicable to designated transit routes and in the traffic separation system;
- utilising available radar systems, communication devices, and the Automatic Identification System (AIS) to provide an information service in the area.
Traffic on Shipping Routes
The main factor determining the traffic in the studied waters are the nearby seaports, including Gdańsk and Gdańsk North Port, the ports of Gdynia, Kaliningrad, Klaipėda, as well as smaller ports such as Liepāja, Władysławowo, and Łeba. Based on data from statistical offices and port statistics, the traffic from 2010 to 2020 was determined (Table 4). Data from Polish statistical yearbooks [Statistical Yearbook of Maritime Economy GUS. 2020, 2016, and 2013], the website of the port in Klaipėda [https://www.portofklaipeda.lt/uosto-statistika (accessed on 4 July 2022)], the website of the port in Kaliningrad [https://www.kscport.ru/index.php/en/ (accessed on 4 July 2022)], and the Russian maritime economy statistical yearbook for 2019 [Pocmopпopt 2019 available at https://www.rosmorport.ru (accessed on 4 July 2022)] were utilised.
The ship traffic along the Polish coast is illustrated in Figure 5.
2.3. Hazardous Substances in Offshore Wind Farms
Operational exploitation of offshore wind farms (OWFs) is conducted using specialised crew transfer vessels (CTV), whose main task is to perform temporary maintenance services for wind turbines. These are units ranging in length from 20 m to 30 m, usually catamarans with high seaworthiness, speed, and fuel efficiency.
One of the most environmentally hazardous maintenance operations is the replacement of the gearbox oil. Such replacements occur every 8 to 16 months, depending on the manufacturer’s specifications (work is currently underway on oils that provide long-term durability, even equal to the entire usage period of the turbine). Some turbines are made to be gearless, thus not requiring oil replacement. This process is carried out by pumping the oil under pressure using flexible hoses from the deck of the service ship. An example of a gearbox oil replacement system is the Ship-to-Turbine™. The system is placed in a 20TEU container, which contains pumps, hoses, and two tanks with a capacity of 1500 L and one with a capacity of 450 L. The manufacturing company claims that during 10 years of operation and the transfer of 60 billion litres of oil, no accidents or incidents involving its spillage have been recorded.
2.3.1. Hazardous Substances in Offshore Wind Turbines
The chemical substances used in the turbine include:
- a cooling fluid to prevent the cooling system from freezing;
- gear oil for lubricating the gearbox and all bearings of the drive system (including generator bearings and main bearings);
- hydraulic oil for blade pitch control, brake operation, service lift, and rotational gearbox;
- oil in the high-voltage (HV) transformer;
- gas in the high-voltage switchgear;
- lithium iron phosphate (LiFePO4) batteries used for energy storage to maintain power supply.
Currently, turbines are designed in such a way to minimise leaks of hazardous materials within the turbine. Leak management in the nacelle and hub involves capturing pollutants near their source, for example:
- Gear oil, hydraulic oil, or coolant leaking within the nacelle are captured at the bottom of the nacelle cover;
- Hydraulic oil leaking inside the hub is captured within the hub;
- Hydraulic oil leaking beyond the hub plate is captured by the blade shaft;
- Coolant leaking from the upper part of the radiator may not be secured against entering the environment. This issue is mitigated by selecting the type of coolant;
- Oil from the HV transformer is captured in the lower part of the nacelle cover;
- Grease for the external pitch system gearbox will be collected in the pitch interface section.
Most modern offshore wind turbines are produced with dry-type transformers, which do not contain transformer oil. This is primarily due to fire safety reasons, as dry-type transformers are less prone to ignition. In the case of using oil-cooled transformers, they can contain up to 1000–2000 L of transformer oil per turbine.
Etkin [1] estimated that approximately 37,800 L of electrical insulating oil and approximately 950 L of diesel and other oils are stored and used in the OSS, and approximately 750 L of turbine oil and other lubricating oils will be contained in the gearboxes of each wind turbine. The total content of oil and hazardous substances will therefore depend on the number of OSS stations and wind turbines on the farm.
The same publication suggested a list of hazardous substances found in wind turbines.
In total, each wind turbine can contain approximately 830 L of ethylene and/or propylene glycol, 809 L of diesel, 1340 L of biodegradable ester oil, 340 L of hydraulic oil, and 830 L of gear oil (Table 6). It should be noted that the dielectric insulating fluid used in electrostatic precipitators and wind turbines is usually mineral oil, but natural vegetable-oil-based ester oil (e.g., soybean oil-based) can also be used.
2.3.2. Potential for Spills Due to Structural Failure
The following are the most impactful accident scenarios during the operation of the OWF:
- striking a vessel in drift or en route into the base of a wind turbine and damaging the hull resulting in the spillage of marine fuel;
- an oil tanker striking the base of a wind turbine while adrift or en route and causing hull damage resulting in spillage of the tanker’s cargo;
- an oil tanker striking a turbine and causing the nacelle to fall onto the tanker and cause a fire resulting in a spillage of oil;
- turbine gear oil spill while being replaced;
- turbine fire and contaminant spill;
- contaminant spill into the sea during construction and servicing operations;
- structural failure.
Although there are no definitive data on structural damage to wind turbine components due to cracking per se, there is an extensive body of work in the literature on condition monitoring for wind turbines, i.e., [40,41,42]
The structural failure of a wind turbine can occur due to corrosion or cracking of the wind turbine or substation components as a result of bad weather conditions (storms, very strong winds). On average, there are 10 failures per wind turbine per year (including 6.2 minor failures and 1.1 major failures) [43,44].
Another risk resulting in environmental pollution can be a turbine fire. Turbine fires occur with a frequency of per year for a single turbine [11]. This study also found using a statistical sample that only 10% of fires are reported. This figure was 11.7 fires, which for the 2013 statistics gives 117 fires per year. Taking the number of wind turbines at that time as 200,000, a probability of a fire accident was obtained. For an offshore wind farm with 70 wind turbines, the probability of a turbine fire per year is , giving a time between successive fires of 24.4 years. This is a high value compared to other risks.
A collision between a ship and a wind turbine can have the most serious consequences. Ship collisions with offshore wind turbines pose a serious environmental risk. It should be considered that in the event of a collision, parts of the ship’s structure may be damaged. The spillage of bunker or cargo transported by the vessel (e.g., oil or chemicals) is then possible. In a worst-case scenario, the ship may even sink [45].
2.4. Methodology
The potential incident simulation, control, and evaluation system (PISCES II) simulator is designed for planning and executing rescue operations. Based on the mathematical modelling of oil spills and their interactions with geographic constraints, environmental phenomena, and spill containment efforts, the program delves deeply into the environmental data. By monitoring the processes occurring during the interaction between oil, sea water, and air, the PISCES II simulator is used to forecast how an oil spill will behave as it spreads across the sea surface. Additionally, simulators are used to coordinate training and rescue efforts in the event of an oil spill.
PISCES II, originally created by Transas Marine for the U.S. Coast Guard, allows for modelling the spread of oil spills in various geographic locations, which helps to test and enhance response strategies, as well as decision-making and teamwork during spill incidents. By integrating with bridge simulators, the program provides professionals and students with an extensive, multipurpose training environment.
Despite its numerous advantages, PISCES II has certain limitations. One obvious drawback is that it requires accurate and current input data to produce reliable simulations. Inaccurate data regarding environmental conditions, spill characteristics, or response resources can lead to suboptimal simulation results.
The mathematical model of the simulator is described in more detail in [46].
3. Results
3.1. Simulations
Depending on the number of substations and the number of windmills at the offshore wind farm, in an extremely unlikely scenario, the following could be released into the sea:
- for a wind farm with one substation and 25 wind turbines: 57,500 litres of oil;
- for a wind farm with two substations and 100 wind turbines: 152,500 litres of oil.
These simulations were carried out on the example of the Baltica 3 wind farm (two substations, 80 wind turbines)
A series of 16 simulations were carried out using the PISCES II simulator to determine the potential area of possible contamination following an emergency oil spill from a substation. The spill scenario analysis carried out in the study is based on the assumption that the tank containing the oil will spill completely. In reality, the contents may not flow out completely. In the case of a tank rupture caused by a storm, corrosion, or ship impact, factors such as the type of impact, the extent of damage to the tank, the size of the resulting hole, and the time that elapses before the damage is detected and repaired, as well as the physical and chemical properties of the substance—in particular its viscosity in relation to the ambient temperature—will affect the extent and speed of the outflow of the oil substance.
The scenarios present a so-called ‘Worst Case Scenario’. To carry them out, it was assumed that the substation could contain around 150 t of oil and be completely destroyed; therefore, the spill volumes were assumed as 150 t of lubricating oil with a density of 0.874 g/cm3. Other oil data are presented in Figure 6.
Two groups of simulations (A and B) were run (Table 7). For the A group, the wind speed was set at 30 m/s and the current at 0.15 m/s. For the B group of simulations, the wind speed was set at 7 m/s and the current at 0.1 m/s. In both groups, simulations were carried out consecutively for wind directions changing by 45° (N, NE, E, etc.).
During the running of the simulation, the footprint of the oil slick and the point at which it disappeared or reached the shore were recorded (Figure 7, Table 8). The geographical coordinates of where the slick disappeared were also recorded (residual oil remained on the water and the thickness of the slick fell below 1 mm), as well as the geographical coordinates where the oil settled on the shore.
In the case of strong winds, the oil substance is quickly dispersed (up to 3.5 h (Figure 8)) in the water and the risk of oil pollution on land is almost non-existent. However, high winds and stormy weather do not allow for effective pollution control—the operational restrictions of the largest Polish oil spill response vessel (MS Kapitan Poinc) include a sea state of up to 3 (wind speed: 6.5–9.0 m/s) on the Beaufort scale and an air temperature not exceeding −5 °C. These conditions significantly impact the effectiveness of activities relating to monitoring and removing oil pollution.
In the case of medium wind speeds, the simulation duration is considerably longer (up to 60 h) than at maximum wind speed (Figure 9). The process of dispersion of the substance in the water is also prolonged. In this case, there is a risk that the oil pollution will reach the shore, provided that the pollution control action is not taken. If the relevant services and the wind farm operator are mobilised quickly, there is a good chance of limiting the negative effects of such a spill. The mobilisation time for oil spill response units is 2 h, and the estimated time to reach the site of the operation is approximately 5 h [47].
Figure 10 shows where the oil slick disappeared and where it reached land. These simulations indicate that the oil will reach the shore in the event that no action is taken to combat the contamination. If an abatement action is taken, the area of contamination should be significantly reduced and the slick should not reach land. This, in turn, will reduce the cost of the clean-up operation, as it is the shoreline clean-up operation that generates the largest costs [48].
3.2. Limitations
This study has several important limitations that must be taken into account when interpreting the results. The effectiveness of the PISCES II simulator is highly dependent on the accuracy and timeliness of the data entered. Inaccurate information on environmental conditions, spill characteristics, or response resources can lead to suboptimal simulation results. In addition, spill scenario analysis assumes a complete spill of tank contents, which may not always be the case. The extent and speed of the spill can vary depending on the type of impact, the degree of damage, and the physical and chemical properties of the substance.
Strong winds and stormy weather significantly affect the effectiveness of pollution control efforts, limiting the operational capabilities of emergency units, which can hinder effective monitoring and removal of oil contamination. Although modern wind farms are designed to minimise risks, incidents and accidents can still happen. Simulations performed are based on worst-case scenarios that do not always reflect typical or most likely outcomes, which can lead to the overestimation of potential impacts and the incomplete capture of more common, less serious incidents.
4. Discussion
The development of offshore wind farms in Poland, particularly in the Baltic Sea area, is a significant step towards a sustainable and environmentally friendly future energy model for the country. They bring many benefits to both the environment and the economy, as well as local communities. By 2030, offshore wind farms are expected to supply 13% of Poland’s electricity, and by 2040, this share is expected to rise to 19%. The first farms will start supplying energy as early as 2026, which is a key step towards increasing the share of green energy in the national energy mix.
The wind farms are designed and sited to minimise their impact on the landscape and marine ecosystems. The locations have been selected outside key areas for fisheries and are at least 22 km from the coastline, reducing their visibility and impact on coastal tourism. Protection of specially protected areas such as Natura 2000, national parks, and nature reserves has been taken into account when planning the locations of wind farms.
Wind farms are equipped with advanced monitoring and safety systems that minimise the risk of failure and respond quickly to possible incidents. Regular maintenance checks and continuous monitoring of the marine environment ensure a high level of operational safety.
On wind farms, as in any industry using advanced technology and machinery, incidents and accidents sometimes occur [49]. Wind turbines and substations, which are key components of wind farms, contain oil gears in their mechanisms that can become a source of oil spillage in the event of an accident. Such spills, although usually less significant than those in the oil industry, can affect the local environment and require a rapid response and effective methods to recover the spilled oil. The simulations carried out can help prepare and optimise emergency response plans and assess the potential environmental impacts associated with such events.
As part of a study on the impact of wind farm incidents on the marine environment, oil spill simulations were carried out assuming wind speeds of 30 m/s and 7 m/s. The simulation results for 30 m/s show that the oil remained on the water surface for a maximum time of 3.5 h. The amount of evaporated oil is negligible, suggesting its relatively short interaction time with the aquatic environment in strong wind conditions. The oil dispersion data, recorded at half-hourly intervals, showed a progressive increase in the amount of dispersed substance, from no dispersion (0 kg) to a maximum recorded value of almost 150 t, indicating a significant spread of oil over time. The highest observed oil patch thickness was 4.5 mm and was recorded 1.5 h after the start of the spill. The largest size of the patch was 8397 m2.
The experiment also examined the effect of a 7 m/s wind on the behaviour of the oil substance on the water surface. The maximum amount of the substance recorded on the surface was almost 147 t. The analyses show that of the total amount of the substance, 0.3 t evaporated, while as much as 135 tons dispersed due to the wind. In addition, the interaction of oil with water led to a concoction of almost 200 tons. The observations also showed that the maximum thickness of the oil patch reached 10.6 mm, and its maximum spreading area was 505,258 m2. These results underscore the significant influence of wind on the spread of oil substances on the water surface. In this case, the persistence time of the oil on the surface increased significantly and was about 80 h. During this time, almost 3 tons of oil substance reached the shore zone. The long duration of the slick’s persistence on the water surface makes it possible to take emergency action to protect the shore zone.
Despite concerns about potential environmental hazards such as oil substance spills, modern wind farms are designed to minimise risks. Emergency systems, such as the safe storage and management of oil substances, protect against spills.
In conclusion, the development of offshore wind farms in Poland offers a promising perspective for the country’s energy future, combining advanced technology and environmental concerns. Both the positive economic and environmental aspects, as well as the high level of operational safety, make them a key element of sustainable development.
Funding
This research received no external funding.
Data Availability Statement
Data are contained within the article.
Conflicts of Interest
The authors declare no conflict of interest.
References
- Bejarano, A.C.; Michel, J.; Rowe, J.; Li, Z.; McCay, D.F.; McStay, L.; Etkin, D.S. Environmental Risks, Fate, and Effects of Chemicals Associated with Wind Turbines on the Atlantic Outer Continental Shelf; OCS Study BOEM; US Department of the Interior, Bureau of Ocean Energy Management, Office of Renewable Energy Programs: Herndon, VA, USA, 2013; p. 213.
- Gunter, C.T. Potential Impacts from a Worst Case Discharge from an United States Offshore Wind Farm. Int. Oil Spill Conf. Proc. 2014, 2014, 869–877. [Google Scholar] [CrossRef]
- Etkin, D.S. Oil Spill Risk Analysis for Cape Wind Energy Project. Int. Oil Spill Conf. Proc. 2008, 2008, 571–579. [Google Scholar] [CrossRef]
- Bela, A.; Le Sourne, H.; Buldgen, L.; Rigo, P. Ship Collision Analysis on Offshore Wind Turbine Monopile Foundations. Mar. Struct. 2017, 51, 220–241. [Google Scholar] [CrossRef]
- Chen, X.; Xu, J.Z. Structural Failure Analysis of Wind Turbines Impacted by Super Typhoon Usagi. Eng. Fail. Anal. 2016, 60, 391–404. [Google Scholar] [CrossRef]
- Moulas, D.; Shafiee, M.; Mehmanparast, A. Damage Analysis of Ship Collisions with Offshore Wind Turbine Foundations. Ocean Eng. 2017, 143, 149–162. [Google Scholar] [CrossRef]
- Liu, C.; Hao, E.; Zhang, S. Optimization and Application of a Crashworthy Device for the Monopile Offshore Wind Turbine against Ship Impact. Appl. Ocean Res. 2015, 51, 129–137. [Google Scholar] [CrossRef]
- Cho, B.I.; Kim, D.H. Fragility Assessment of Offshore Wind Turbine by Ship Collision. J. Korean Soc. Coast. Ocean Eng. 2013, 25, 236–243. [Google Scholar] [CrossRef]
- Mo, R.; Li, M.; Kang, H. Transient Behaviour of Grouted Connections of Offshore Wind Turbines Subject to Ship Impact. Appl. Ocean Res. 2018, 76, 159–173. [Google Scholar] [CrossRef]
- Kirchgeorg, T.; Weinberg, I.; Hörnig, M.; Baier, R.; Schmid, M.J.; Brockmeyer, B. Emissions from Corrosion Protection Systems of Offshore Wind Farms: Evaluation of the Potential Impact on the Marine Environment. Mar. Pollut. Bull. 2018, 136, 257–268. [Google Scholar] [CrossRef] [PubMed]
- Uadiale, S.; Urbán, E.; Carvel, R.; Lange, D.; Rein, G. Overview of Problems and Solutions in Fire Protection Engineering of Wind Turbines. Fire Saf. Sci. 2014, 11, 983–995. [Google Scholar] [CrossRef]
- Rengel, B.; Pastor, E.; Hermida, D.; Gómez, E.; Molinelli, L.; Planas, E. Computational Analysis of Fire Dynamics Inside a Wind Turbine. Fire Technol. 2017, 53, 1933–1942. [Google Scholar] [CrossRef]
- Barkley, W.C.; Jacobs, L.D.; Rutherford, M.C. Structural Health Monitoring of Wind Turbine Blades. In Proceedings of the ASME 2009 3rd International Conference on Energy Sustainability Collocated with the Heat Transfer and InterPACK09 Conferences, San Francisco, CA, USA, 19–23 July 2009; pp. 1047–1058. [Google Scholar]
- Program Rozwoju Morskich Farm Wiatrowych—Morska Energetyka Wiatrowa—Portal Gov.pl. Available online: https://www.gov.pl/web/morska-energetyka-wiatrowa/program-rozwoju-morskich-farm-wiatrowych (accessed on 2 November 2023).
- PGE Polish Energy Group. Morska Farma Wiatrowa Baltica 1 z Warunkami Przyłączenia do Sieci Przesyłowej. Available online: https://www.gkpge.pl/grupa-pge/dla-mediow/komunikaty-prasowe/korporacyjne/morska-farma-wiatrowa-baltica-1-z-warunkami-przylaczenia-do-sieci-przesylowej (accessed on 15 November 2023).
- Baltica 2+3. Available online: https://baltica.energy/pl-pl/baltica-two-and-three (accessed on 26 February 2024).
- Baltic Power. Available online: https://balticpower.pl/o-projekcie/ (accessed on 2 November 2023).
- Ocean Winds—Generujemy Przyszłość Morskiej Energii Wiatrowej. Available online: https://www.bc-wind.pl/ (accessed on 15 November 2023).
- FEW Baltic II. Available online: https://fewbalticii.rwe.com/pl-PL (accessed on 2 November 2023).
- MFW Bałtyk II. Available online: https://www.baltyk2.pl/ (accessed on 15 November 2023).
- MFW Bałtyk III. Available online: https://www.baltyk3.pl/ (accessed on 15 November 2023).
- MFW Bałtyk I. Available online: https://www.mfwbaltyk1.pl/ (accessed on 2 November 2023).
- UK Hydrographic Office. Baltic Pilot Vol II NP19; United Kingdom Hydrographic Office: Taunton, UK, 2005; Volume II.
- UK Hydrographic Office. Baltic Pilot Volume I NP18, 13th ed.; United Kingdom Hydrographic Office: Taunton, UK, 2004.
- Sulisz, W.; Paprota, M.; Reda, A. Extreme Waves in the Southern Baltic Sea. Cienc. Mar. 2016, 42, 123–137. [Google Scholar] [CrossRef]
- Ida Stanisławczyk The Ice Winter 2015/2016 on the Polish Baltic Sea Coast; IMGW. Available online: https://baltyk.imgw.pl//index.php?page=22&subpage=90 (accessed on 2 November 2023).
- Ida Stanisławczyk The Ice Winter 2016/17 on the Polish Baltic Sea Coast; IMGW. Available online: https://baltyk.imgw.pl//index.php?page=22&subpage=90 (accessed on 2 November 2023).
- Ida Stanisławczyk The Ice Winter 2017/18 on the Polish Baltic Sea Coast; IMGW. Available online: https://baltyk.imgw.pl//index.php?page=22&subpage=90 (accessed on 2 November 2023).
- Ida Stanisławczyk The Ice Winter 2018/19 on the Polish Baltic Sea Coast; IMGW. Available online: https://baltyk.imgw.pl//index.php?page=22&subpage=90 (accessed on 2 November 2023).
- Ida Stanisławczyk The Ice Winter 2019/2020 on the Polish Baltic Sea Coast; IMGW. Available online: https://baltyk.imgw.pl//index.php?page=22&subpage=90 (accessed on 2 November 2023).
- Hydrologia | Nasz Bałtyk. Available online: https://naszbaltyk.pl/hydrologia/ (accessed on 2 November 2023).
- What You Should Know about the Baltic Sea. Available online: https://naturalniebaltyckie.pl/en/education/what-you-should-know-about-the-baltic-sea (accessed on 19 March 2024).
- Wibig, J.; Jakusik, E. (Eds.) Warunki Klimatyczne i Oceanograficzne w Polsce i na Bałtyku Południowym: Spodziewane Zmiany i Wytyczne do Opracowania Strategii Adaptacyjnych w Gospodarce Krajowej; Wpływ zmian klimatu na środowisko, gospodarkę i społeczeństwo: Zmiany, skutki i sposoby ich ograniczenia, wnioski dla nauki, praktyki inżynierskiej i planowania gospodarczego; Instytut Meteorologii i Gospodarki Wodnej—Państwowy Instytut Badawczy: Warszawa, Poland, 2012; ISBN 978-83-61102-65-6. [Google Scholar]
- Klimat w Polsce—Portal Klimat IMGW-PiB. Available online: https://klimat.imgw.pl/ (accessed on 19 March 2024).
- Water Temperature in Baltic Sea Today. Available online: https://seatemperature.info/baltic-sea-water-temperature.html (accessed on 19 March 2024).
- Obszary Natura 2000. Available online: http://ine.eko.org.pl/index_areas.php?rek=33 (accessed on 19 March 2024).
- European Atlas of the Seas. Available online: https://ec.europa.eu/maritimeaffairs/atlas/maritime_atlas/#lang=EN;p=w;bkgd=5;theme=913:0.75;c=1920397.1042340684,7485207.929468844;z=7 (accessed on 17 May 2024).
- Obszary Natura 2000. Available online: http://www.ine.eko.org.pl/index_areas.php?rek=63 (accessed on 19 March 2024).
- Słowiński Park Narodowy. Available online: https://spn.gov.pl/# (accessed on 19 March 2024).
- Tchakoua, P.; Wamkeue, R.; Ouhrouche, M.; Slaoui-Hasnaoui, F.; Tameghe, T.; Ekemb, G. Wind Turbine Condition Monitoring: State-of-the-Art Review, New Trends, and Future Challenges. Energies 2014, 7, 2595–2630. [Google Scholar] [CrossRef]
- Tchakoua, P.; Wamkeue, R.; Tameghe, T.A.; Ekemb, G. A Review of Concepts and Methods for Wind Turbines Condition Monitoring. In Proceedings of the 2013 World Congress on Computer and Information Technology (WCCIT), Sousse, Tunisia, 22–24 June 2013; pp. 1–9. [Google Scholar]
- Amirat, Y.; Benbouzid, M.; Bensaker, B.; Wamkeue, R. Condition Monitoring and Fault Diagnosis in Wind Energy Conversion Systems: A Review. In Proceedings of the 2007 IEEE International Electric Machines & Drives Conference, Antalya, Turkey, 3–5 May 2007. [Google Scholar]
- Anderson, F.; Dawid, R.; McMillan, D.; Cava, D.G. On the Sensitivity of Wind Turbine Failure Rate Estimates to Failure Definitions. J. Phys. Conf. Ser. 2023, 2626, 012025. [Google Scholar] [CrossRef]
- Carroll, J.; McDonald, A.; McMillan, D. Failure Rate, Repair Time and Unscheduled O&M Cost Analysis of Offshore Wind Turbines. Wind Energy 2016, 19, 1107–1119. [Google Scholar] [CrossRef]
- Koeller, J.; Koeppel, J.; Peters, W. (Eds.) Offshore Wind Energy: Research on Environmental Impacts, 1st ed.; Springer: New York, NY, USA, 2006; ISBN 978-3-540-34676-0. [Google Scholar]
- Łazuga, K. Testing of an Oil Spill Mathematical Model Contained in PISCES II Simulator. Zesz. Nauk. Akad. Morska Szczecinie 2012, 32, 105–109. [Google Scholar]
- Morska Służba Poszukiwania i Ratownictwa. Krajowy Plan Zwalczania Zagrożeń i Zanieczyszczeń Środowiska Morskiego. 2005. Available online: https://sar.gov.pl/uploads/media/Akty_prawne/0001/05/40c62989359842013a679bb02558d842b440a030.pdf (accessed on 19 March 2024).
- Łazuga, K.; Gucma, L.; Perkovic, M. Optimal Allocation of Response Resources Model Verification on the Example of Oil Spill on the Pomeranian Bay. In Towards Green Marine Technology and Transport: Proceedings of the 16th International Congress of the International Maritime Association of the Mediterranean (IMAM 2015), Pula, Croatia, 21–24 September 2015; CRC Press: Boca Raton, FL, USA, 2015; ISBN 978-1-315-64349-6. [Google Scholar]
- Mentes, A.; Turan, O. A New Resilient Risk Management Model for Offshore Wind Turbine Maintenance. Saf. Sci. 2019, 119, 360–374. [Google Scholar] [CrossRef]
Figure 1.
Planned offshore wind farms in Poland—overview map (not to scale) [14].
Figure 1.
Planned offshore wind farms in Poland—overview map (not to scale) [14].

Figure 2.
Average values of mean wind (10 min averages) from specific directions in Łeba (2000–2020) [own elaboration based on data from the Institute of Meteorology and Water Management—National Research Institute].
Figure 2.
Average values of mean wind (10 min averages) from specific directions in Łeba (2000–2020) [own elaboration based on data from the Institute of Meteorology and Water Management—National Research Institute].
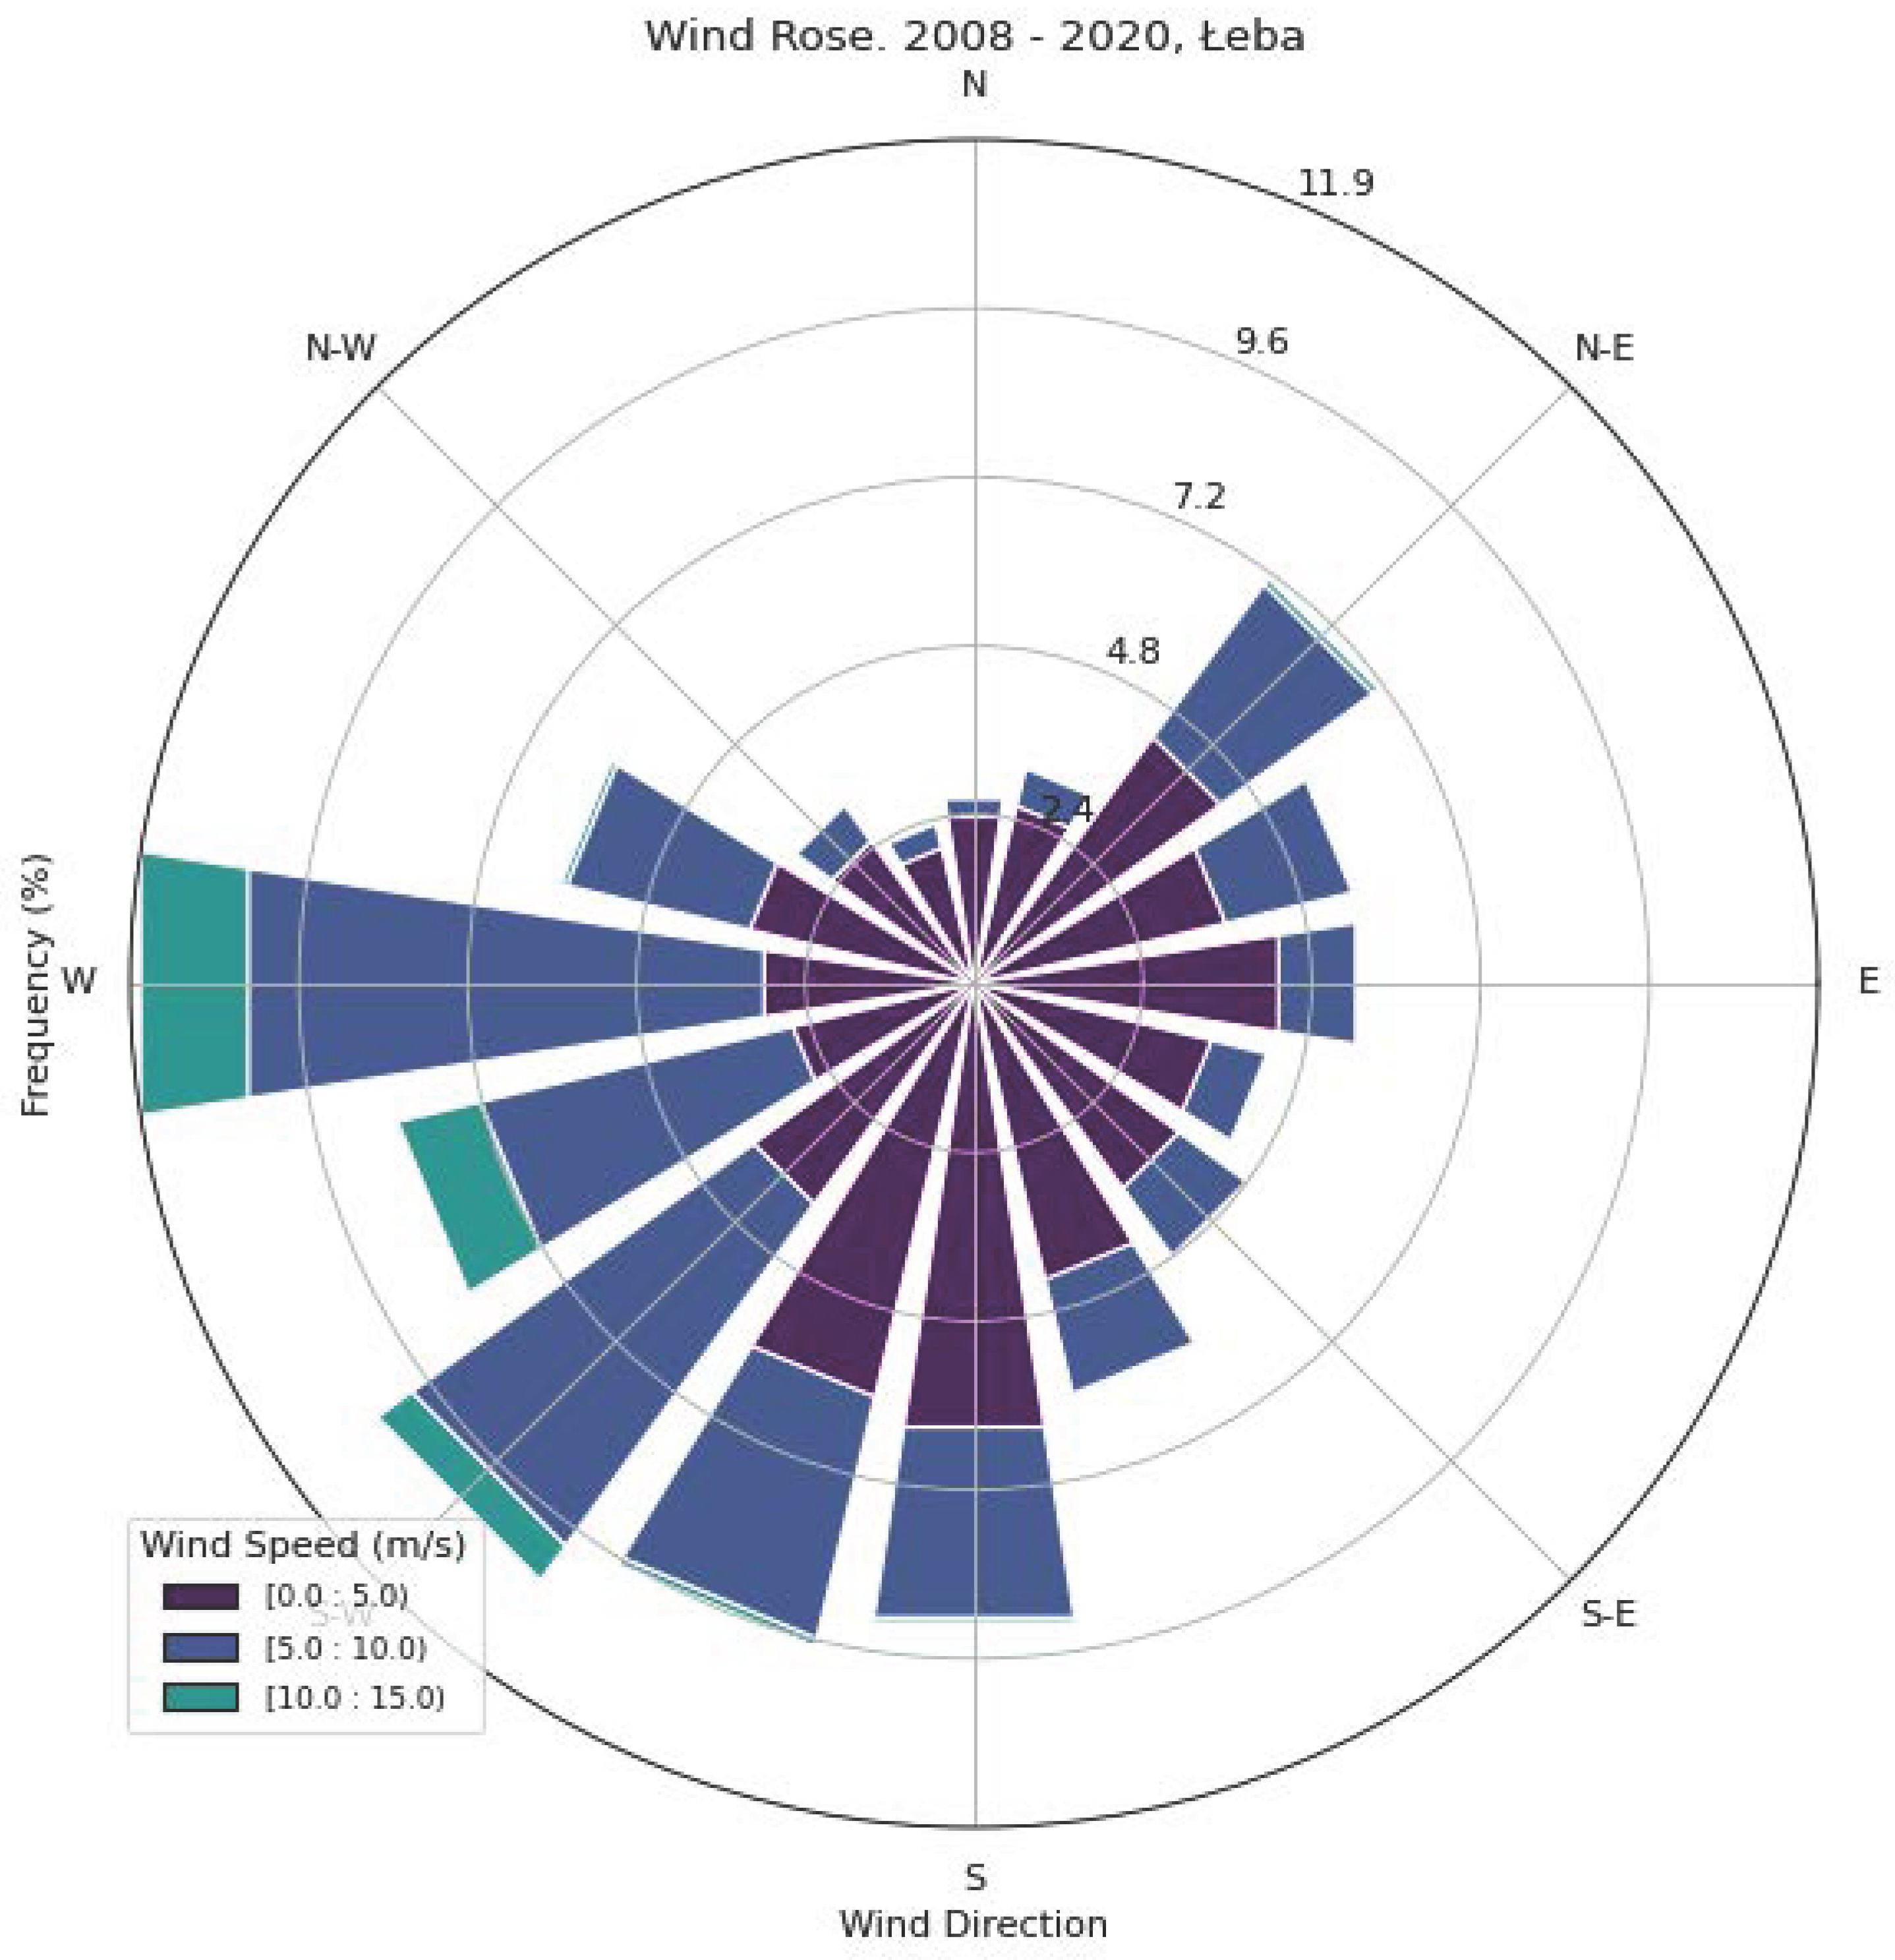
Figure 3.
Frequency of particular wind directions in Leba (2000–2020) [own elaboration based on data from the Institute of Meteorology and Water Management—National Research Institute].
Figure 3.
Frequency of particular wind directions in Leba (2000–2020) [own elaboration based on data from the Institute of Meteorology and Water Management—National Research Institute].

Figure 4.
Ranges of Natura 2000 areas in the OWF area [37].
Figure 4.
Ranges of Natura 2000 areas in the OWF area [37].
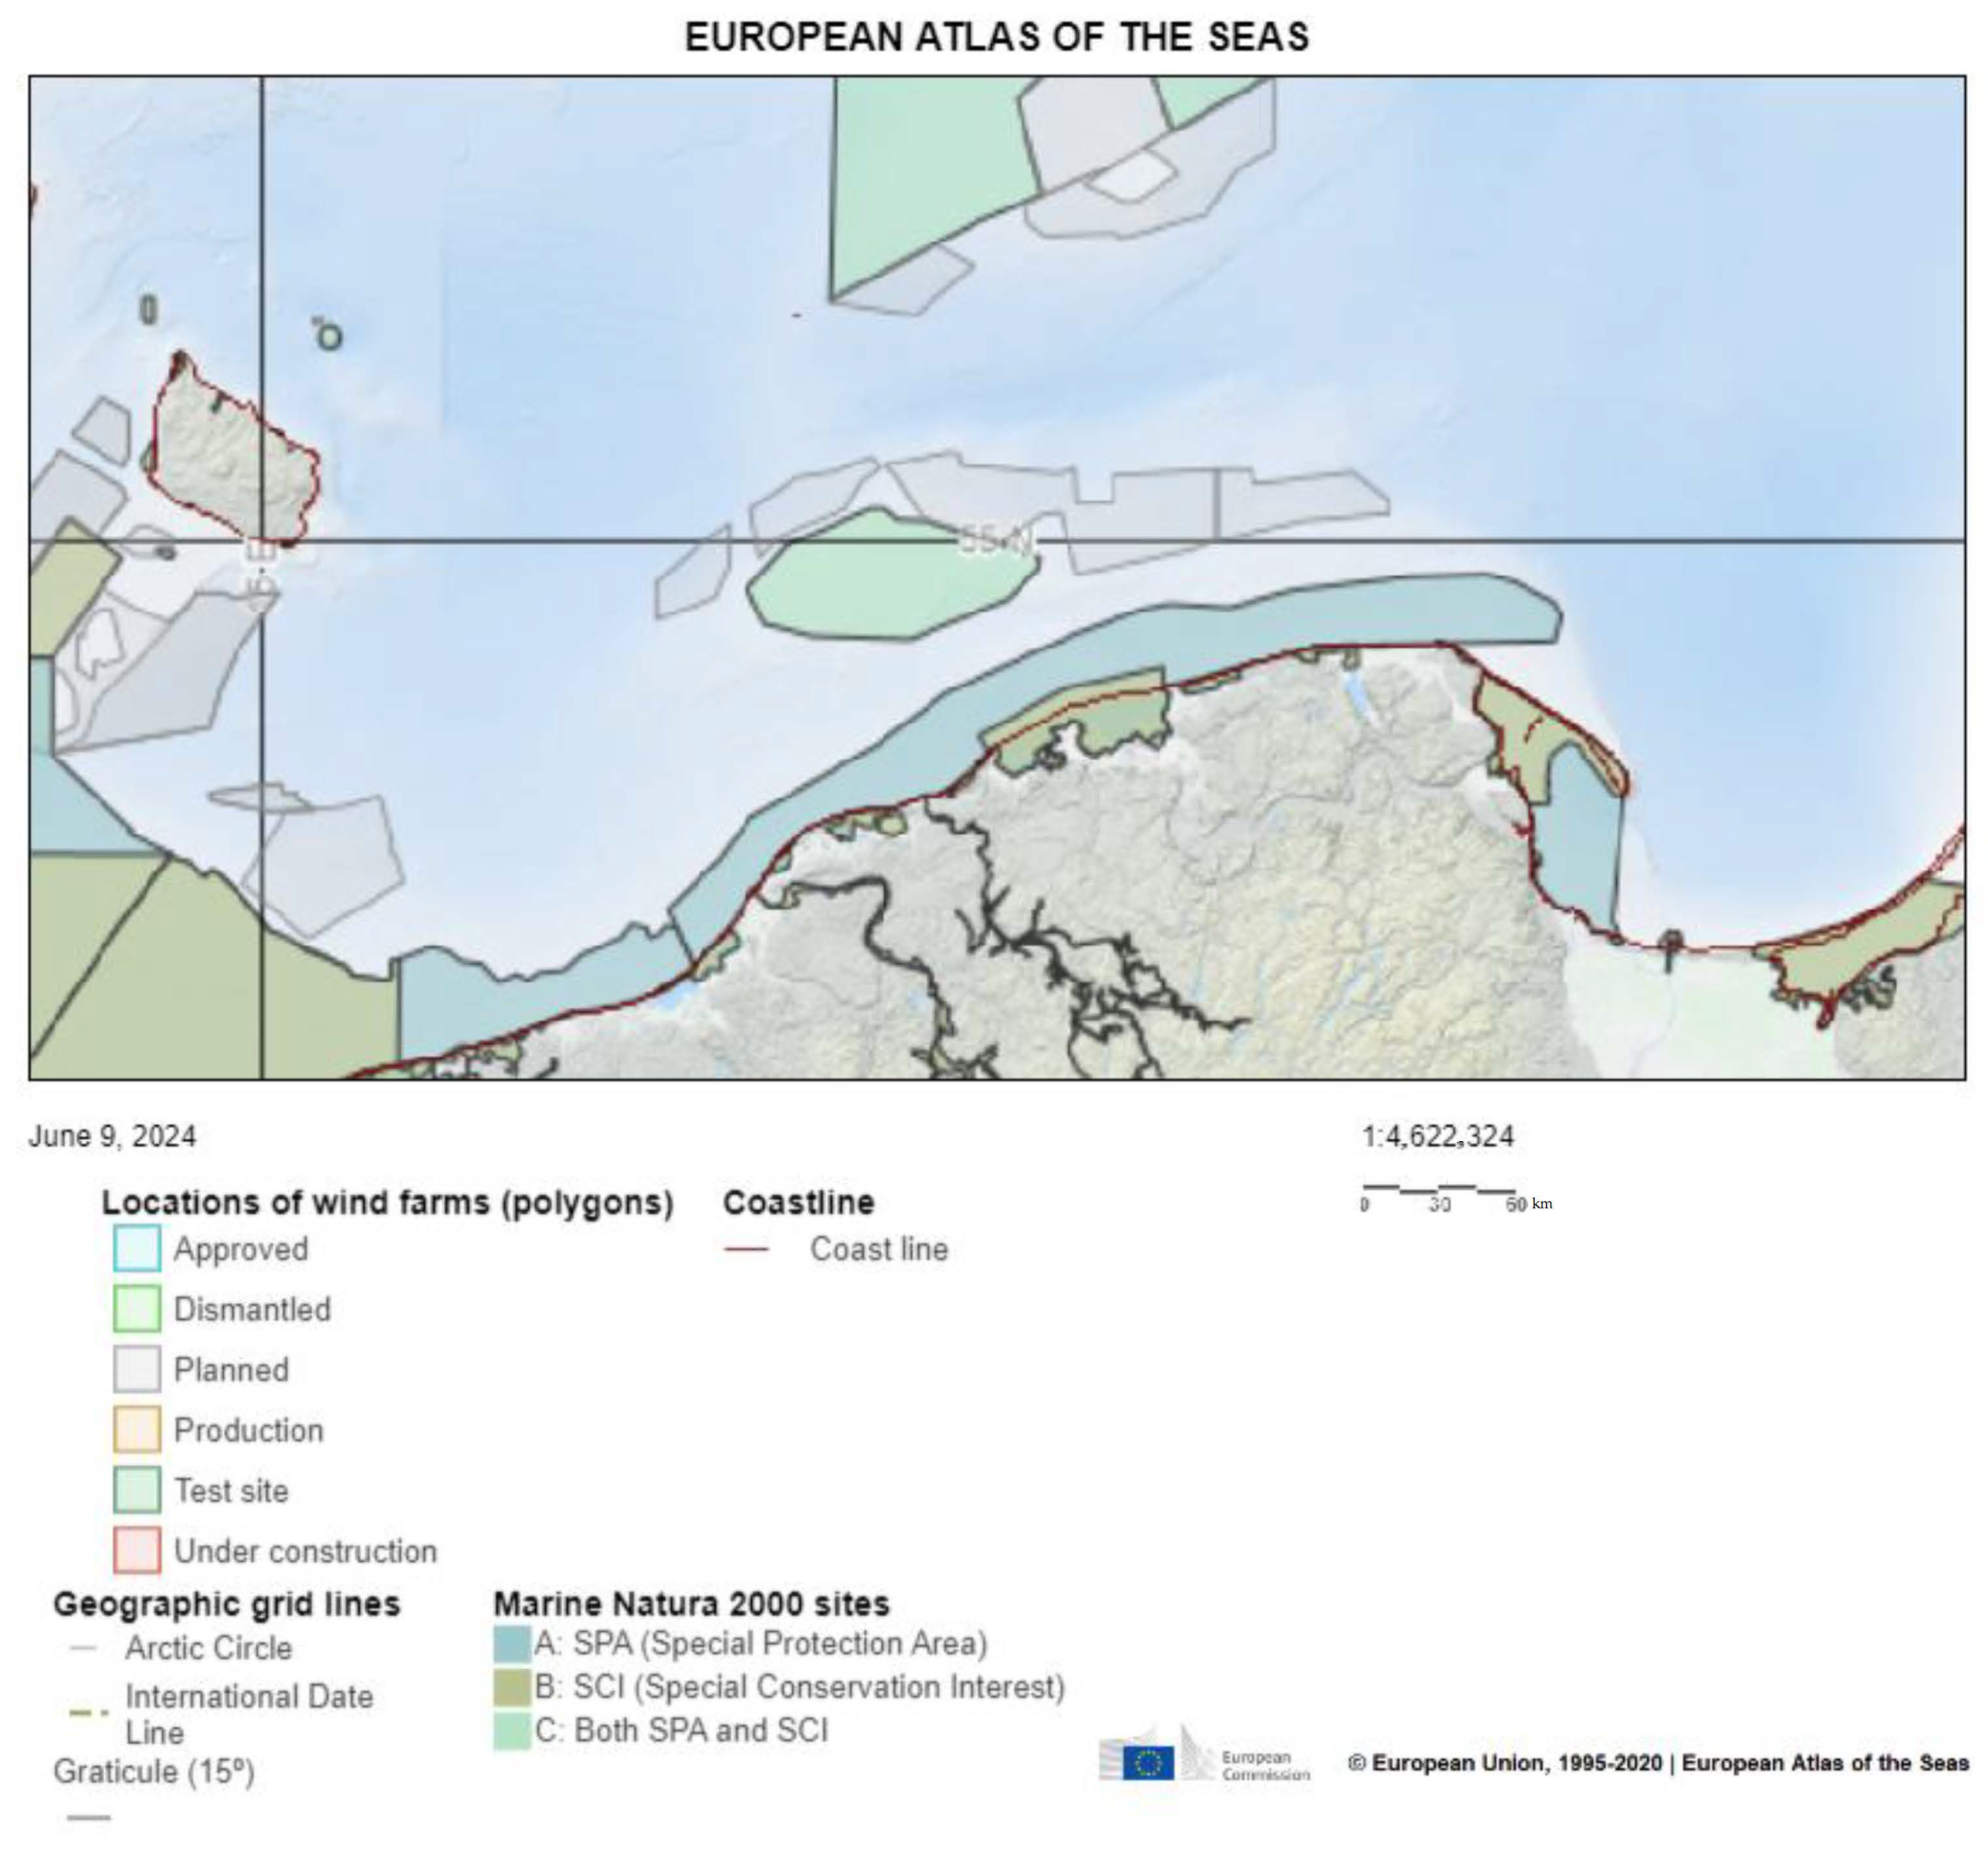
Figure 5.
Traffic intensity in the Baltic Sea region in 2021 [37].
Figure 5.
Traffic intensity in the Baltic Sea region in 2021 [37].
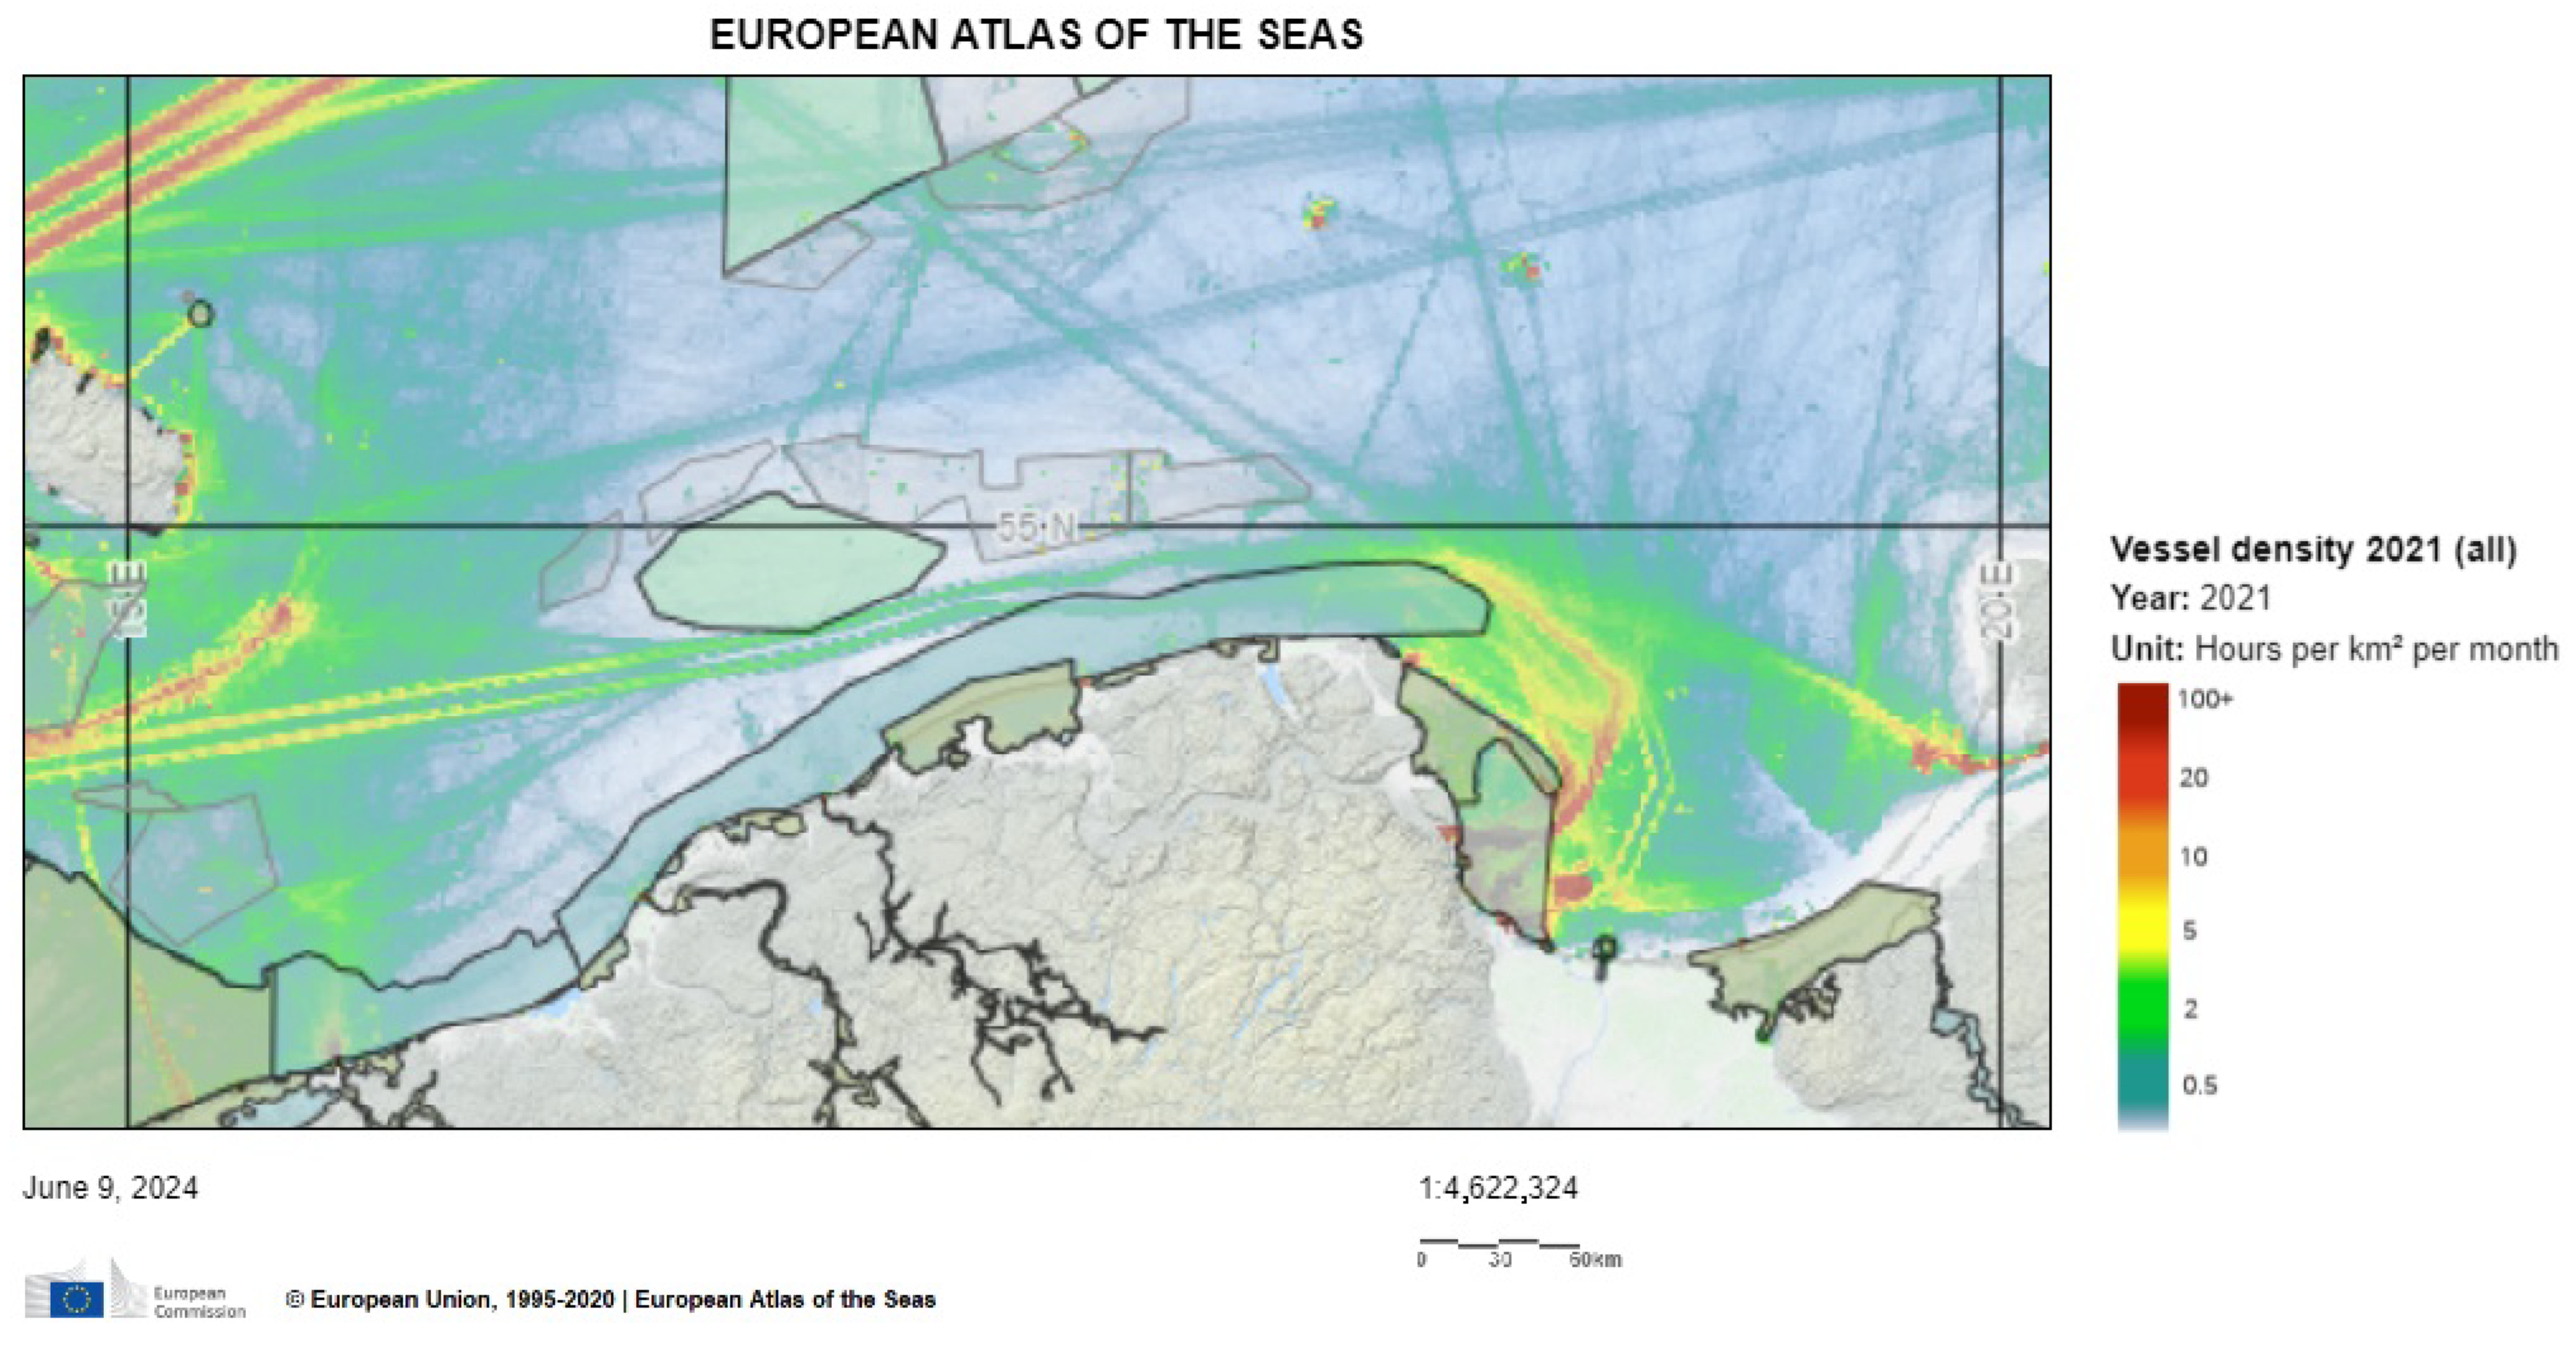
Figure 6.
Data of the pollutant used during the simulation for scenario S [PISCES II programme].
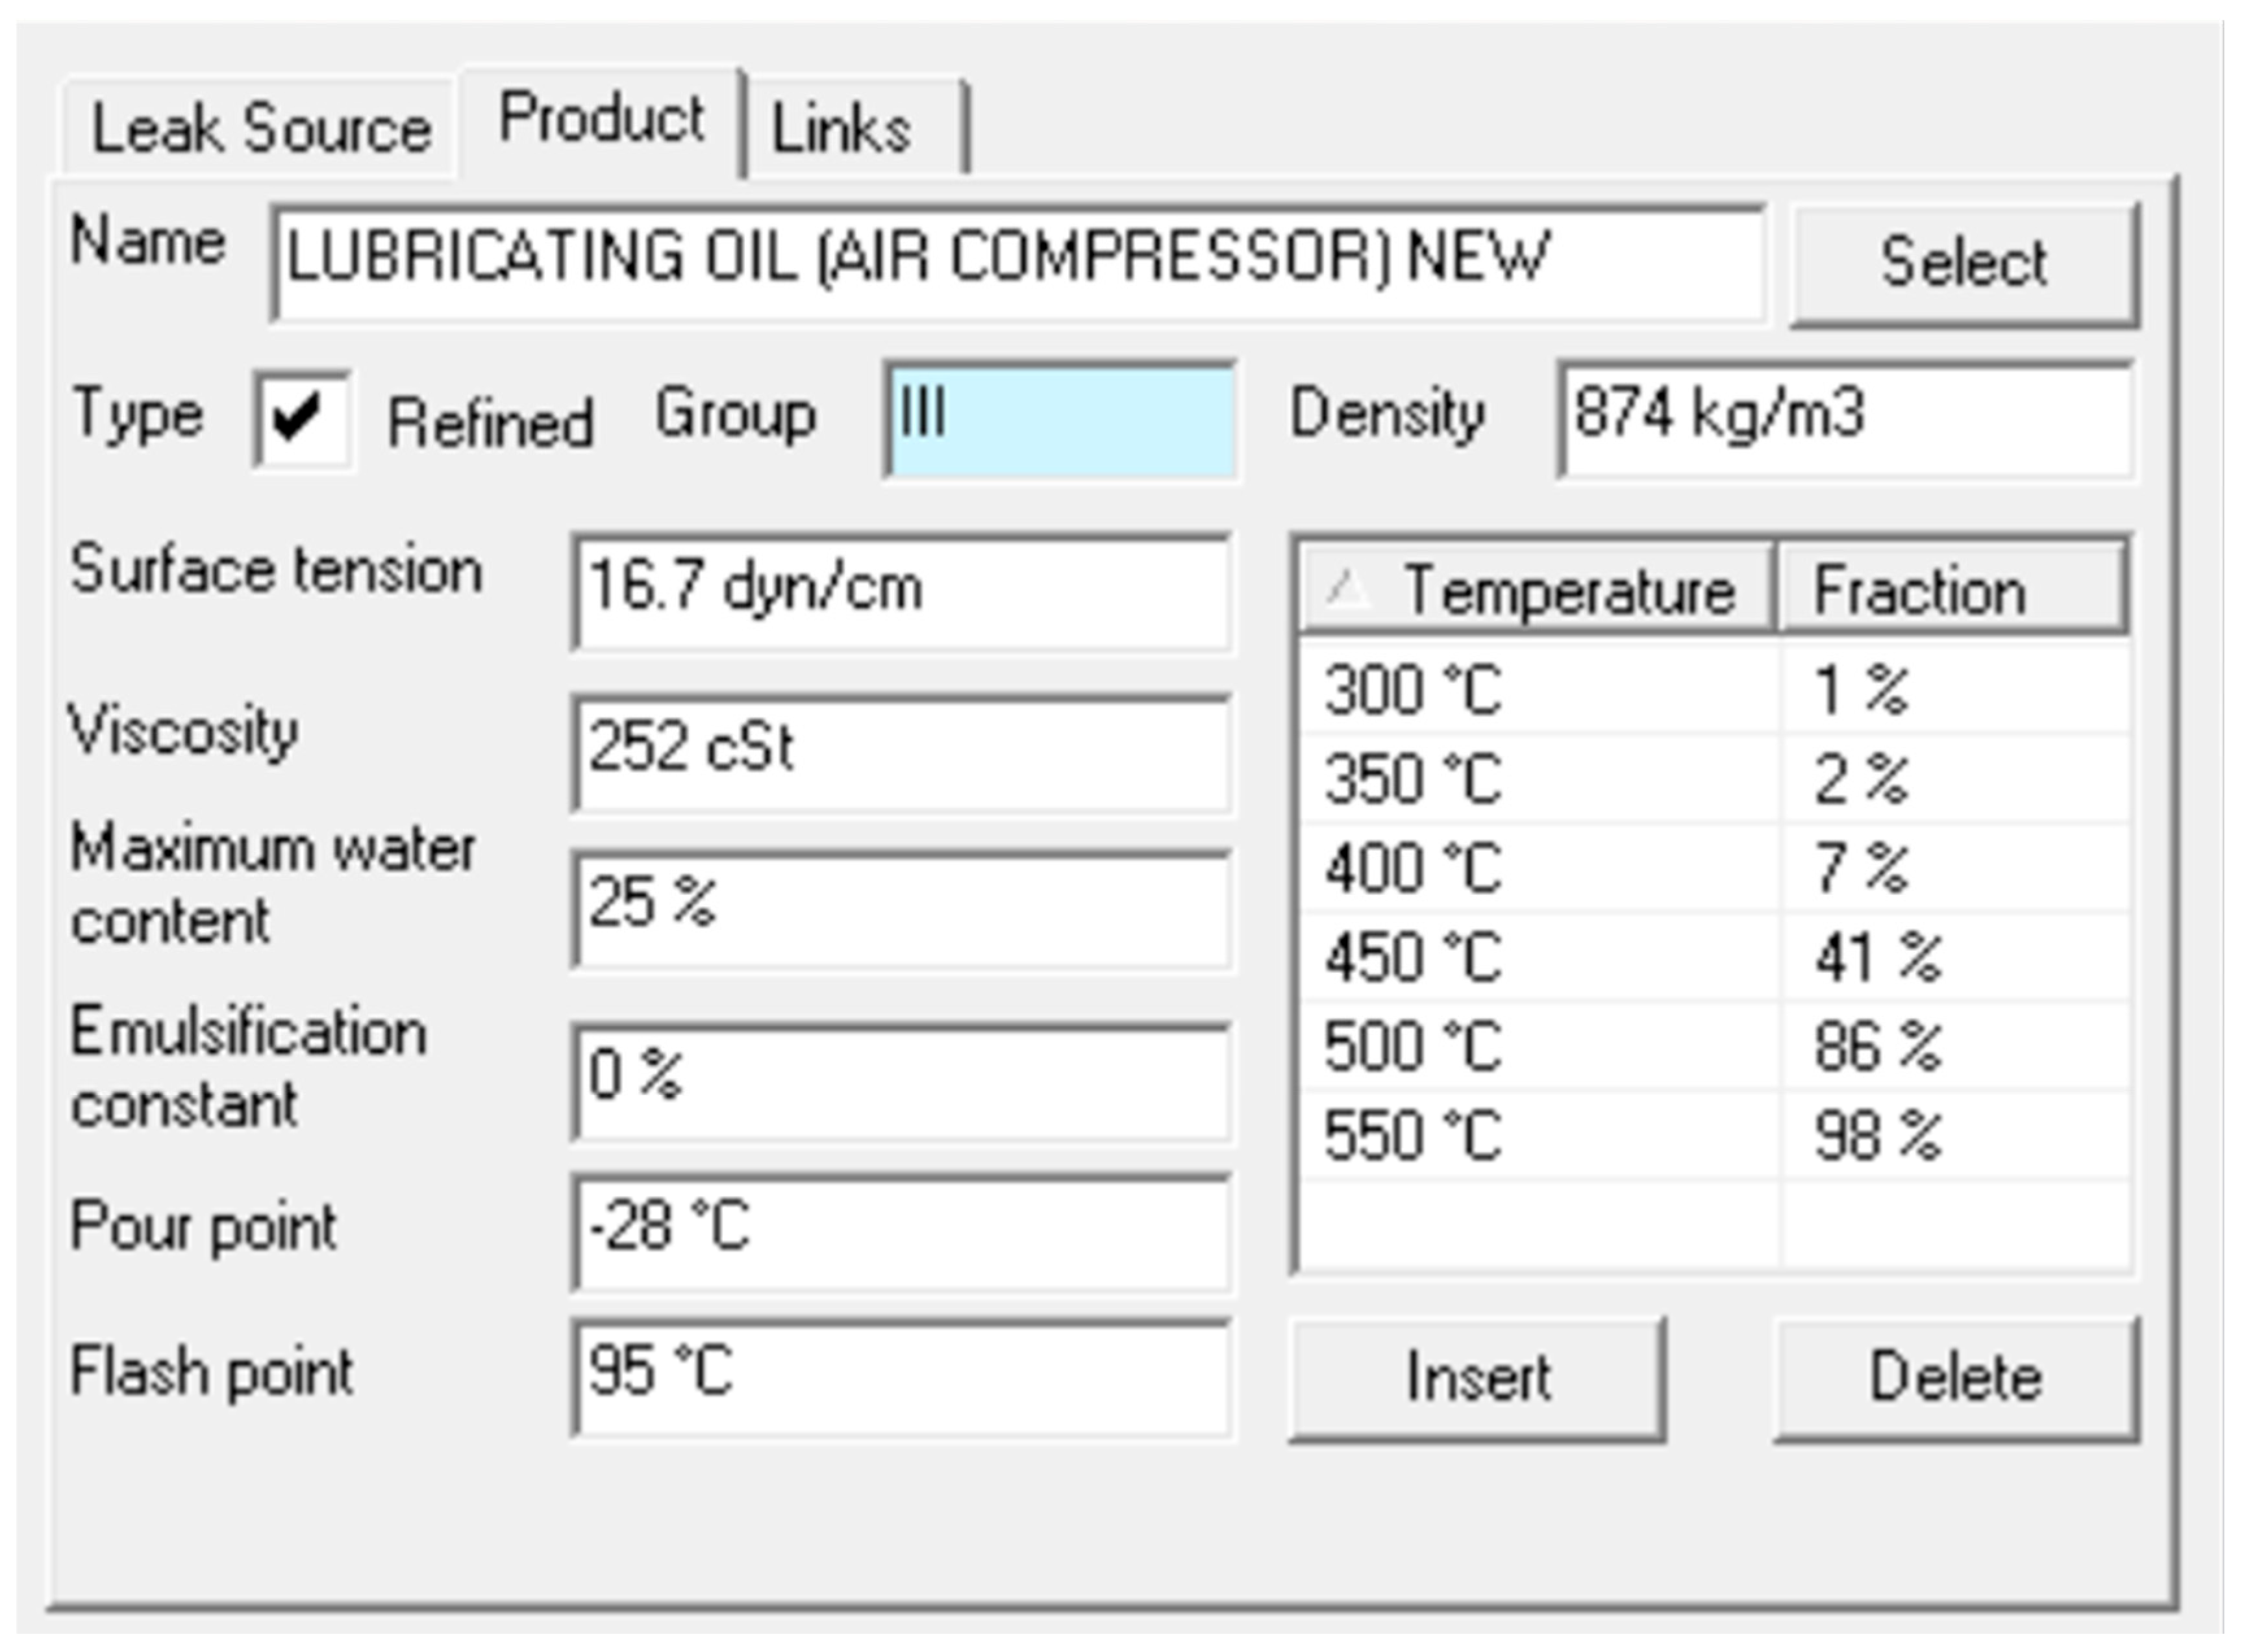
Figure 7.
Movement of the oil slick during simulation in PISCES II.

Figure 8.
Amount of oil floating on the water over time during simulation (max wind).
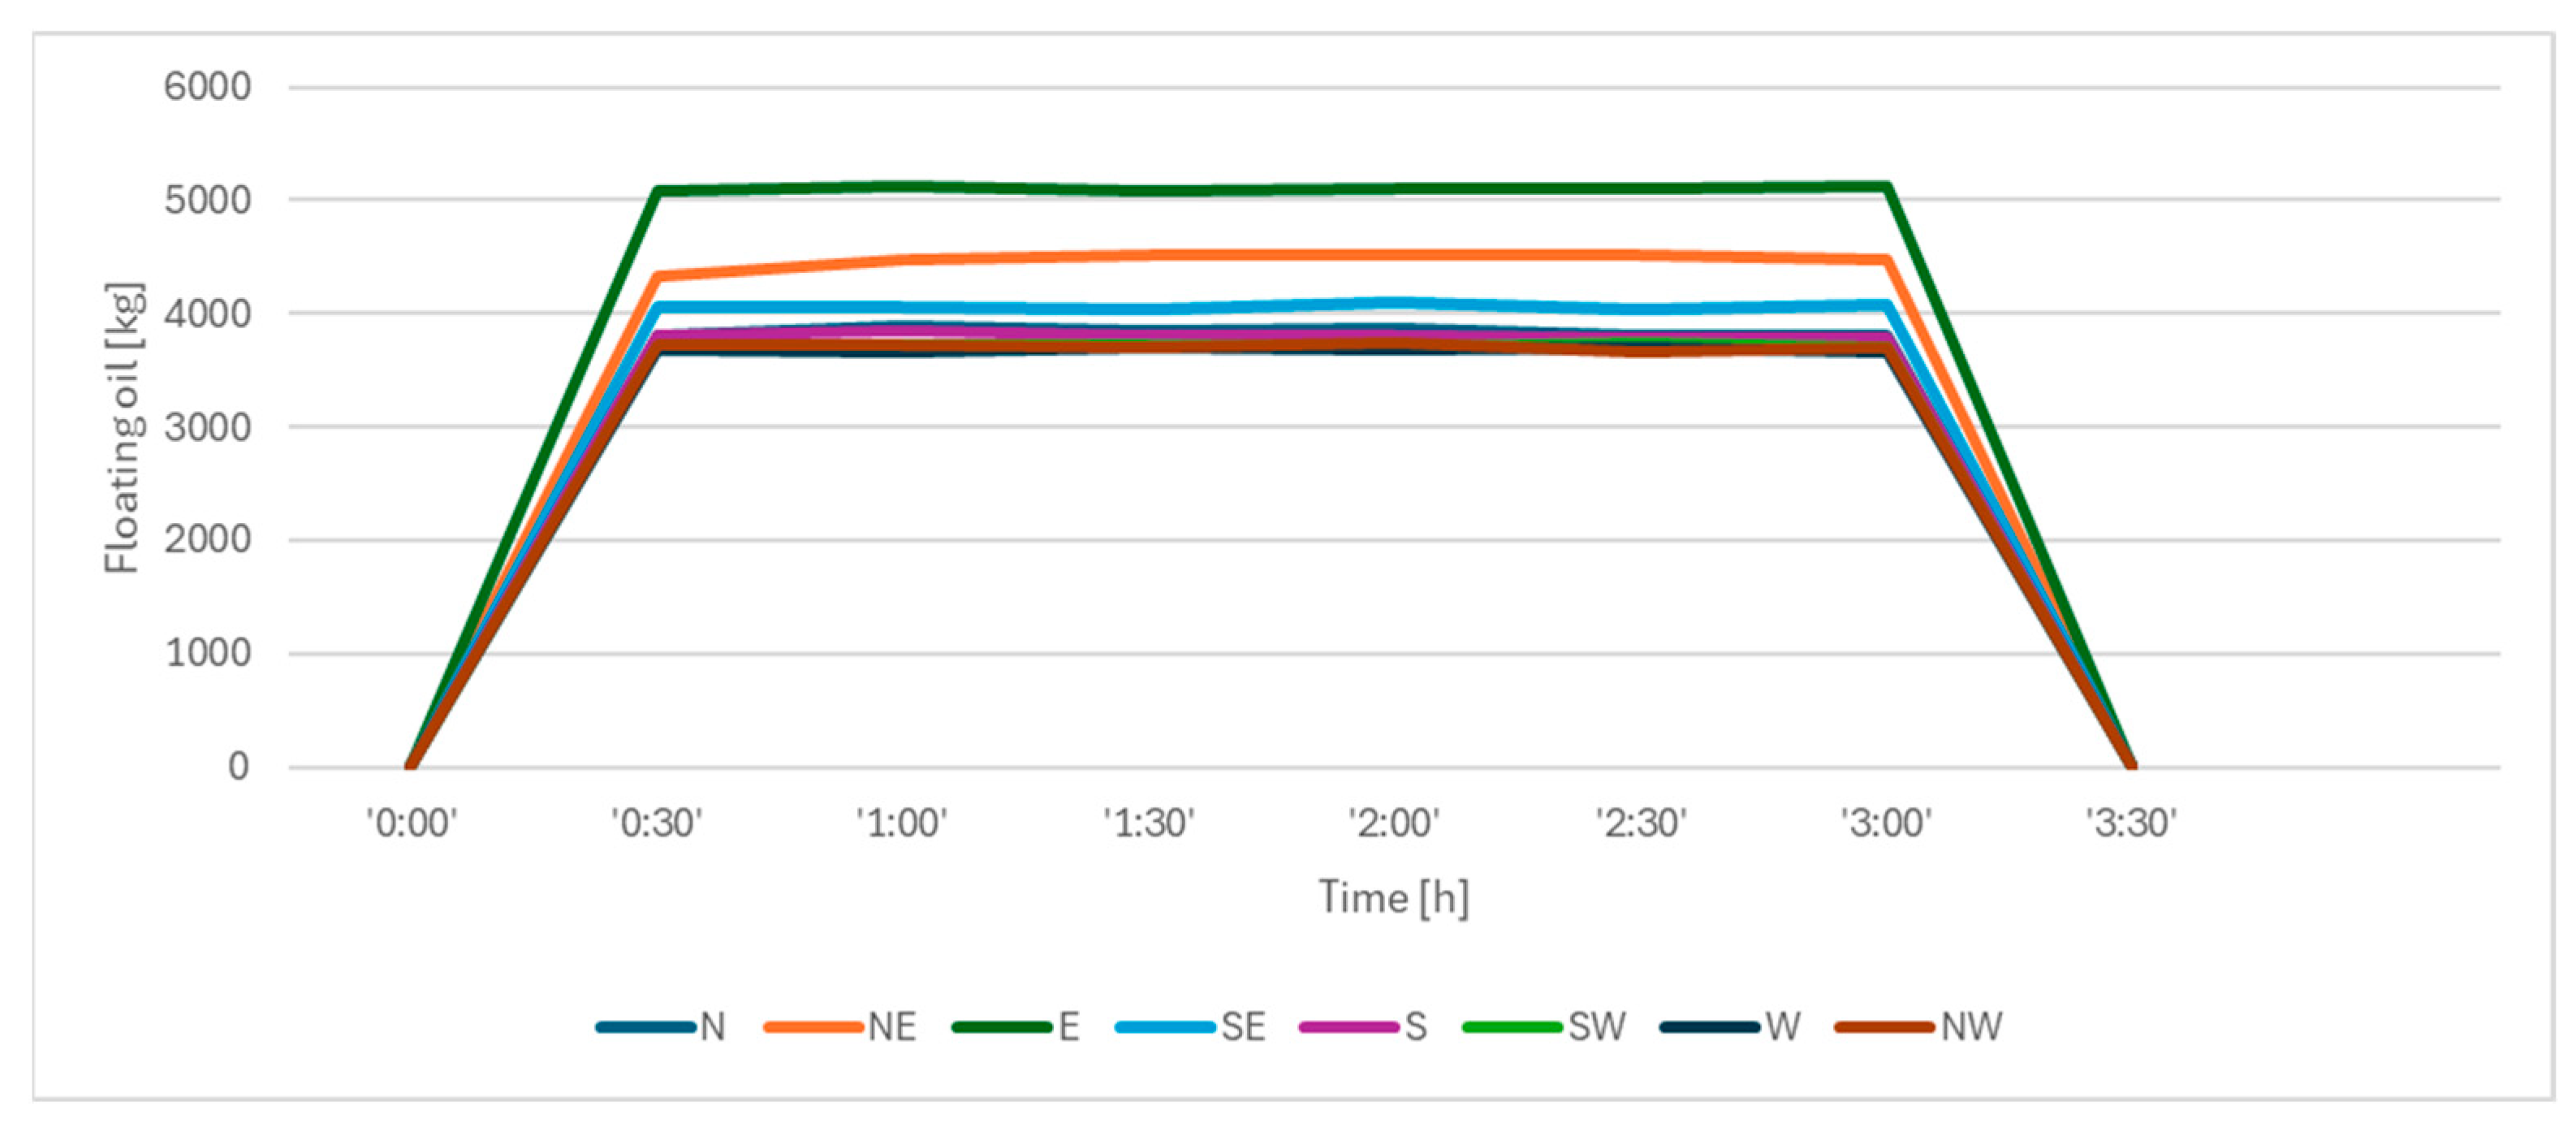
Figure 9.
Amount of oil floating on the water over time during simulation (mean wind).
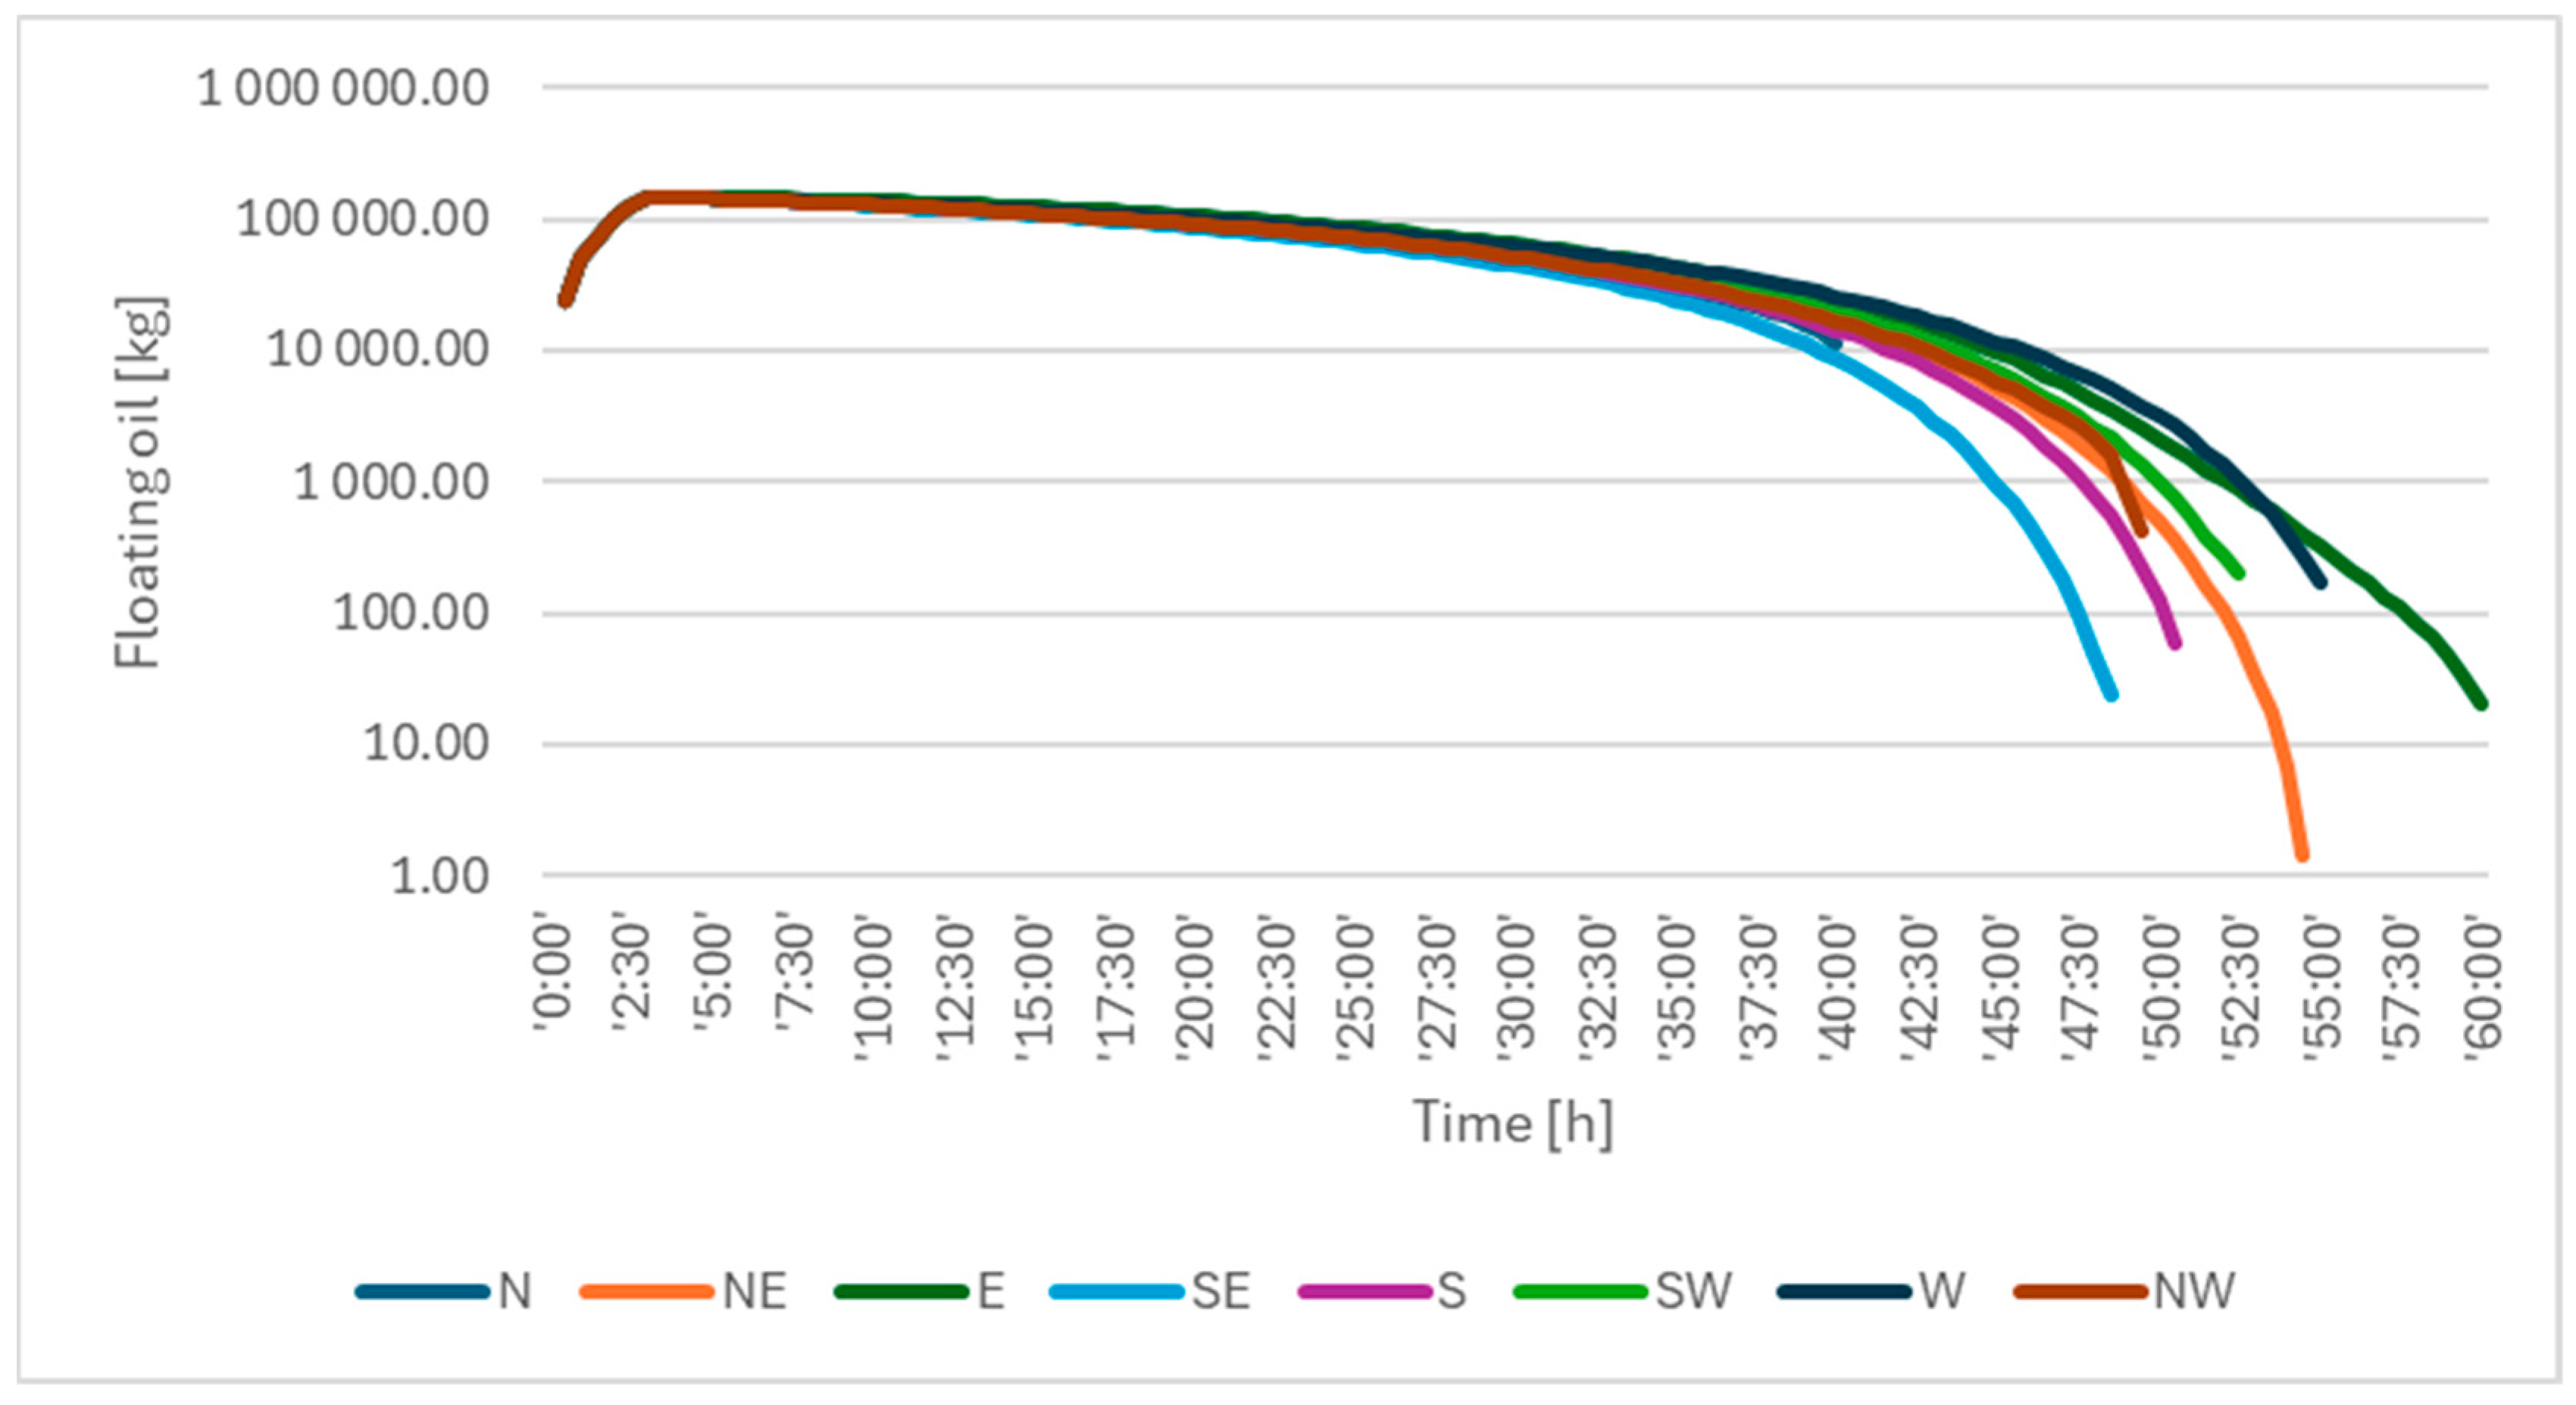
Figure 10.
Area at risk of oil pollution.


Table 1.
Planned offshore wind farms [14].
Table 1.
Planned offshore wind farms [14].
| Lp. | Name of Project and Project Company | Investors | Technical Conditions for Grid Connection to (WTP) | Number of Wind Power Plants | Number of Offshore Substations |
|---|---|---|---|---|---|
| 1 | Baltica 3 Elektrownia Wiatrowa Baltica 3 sp. z o.o. (Warsaw, Poland) | PGE Baltica/Orsted | 1045.5 MW | 80 | 2 |
| 2 | Baltica 2 Elektrownia Wiatrowa Baltica 2 sp. z o.o. (Warsaw, Poland) | PGE Baltica/Orsted | 1498 MW | 100 | 2 |
| 3 | Baltic Power (Warsaw, Poland) | PKN Orlen (Baltic Power sp. z o.o.) | 1200 MW | 76 | 2 |
| 4 | BC-Wind C-Wind Polska sp. z o.o. (Warsaw, Poland) | Ocean Winds | 399 MW | nd | |
| 5 | FEW Baltic II Baltic Trade and Invest sp. z o.o. (Słupsk, Poland) | RWE Renewables | 350 MW | 25 | nd |
| 6 | MFW Bałtyk II MFW Bałtyk II sp. z o.o. (Warsaw, Poland) | Polenergia/Equinor | 720 MW | 60 | 1 |
| 7 | MFW Bałtyk III MFW Bałtyk III sp. z o.o. (Warsaw, Poland) | Polenergia/Equinor | 720 MW | 60 | 1 |
| 8 | Baltica 1 Elektrownia Wiatrowa Baltica-1 sp z o.o. (Warsaw, Poland) | PGE Baltica | 896 MW | nd | nd |
| Minimum | Average | Maximum | |
|---|---|---|---|
| Temperature [°C] | 0.0 | 9.6 | 25.0 |
| Salinity [PSU] | 5.6 | 7.3 | 8.4 |
| Density [kg/m3] | 1002.6 | 1005.3 | 1006.7 |
| Air temp. [°C] | −9.9 | 8.7 | 28.3 |
| Air pressure [Pa] | 96,455 | 101,424 | 104,910 |
| Air density [kg/m3] | 1165 | 1254 | 1379 |
| Relative humidity [%] | 41.3 | 80.8 | 100 |
| LW Solar radiation [W/m2] | 180.0 | 307.5 | 415.2 |
| SW Solar radiation [W/m2] | 0 | 136.8 | 846.1 |
| Hourly precipitation [mm] | 0.0 | 0.1 | 6.9 |
Table 3.
Forms of nature conservation in the vicinity of the OWFs.
| Lp. | Name of the Area | Type | Location | Area [km2] |
|---|---|---|---|---|
| 1. | Slowinski National Park (Pobrzeze Slowinskie) | National park | Land/sea | 322.8 |
| 2. | Enclosure of the Słowiński National Park | National park enclosure | Land | 284.7 |
| 3. | Babnica Nature Reserve | Reserve | Land | 0.6 |
| 4. | Bialogóra reserve | Reserve | Land | 2.1 |
| 5. | Sarbska Spit Nature Reserve | Reserve | Land | 5.7 |
| 6. | Cape Rozewski Nature Reserve | Reserve | Land | 0.1 |
| 7. | Widovo reserve | Reserve | Land | 1.0 |
| 8. | Seaside Landscape Park | Landscape park | Land | 178.3 |
| 9. | Maritime Protected Landscape Area | Protected landscape area | Land | 142.1 |
| 10. | Białogóra | Natura 2000 area | Land | 11.3 |
| 11. | Kashubian Cliffs | Natura 2000 area | Land | 2.3 |
| 12. | Slupsk Shoal | Natura 2000 area | Sea | 800.5 |
| 13. | Sarbska Spit | Natura 2000 area | Land | 18.8 |
| 14. | Ostoja Słowińska | Natura 2000 area | Land/sea | 329.6 |
| 15. | Piasnica Meadows | Natura 2000 area | Land | 10.8 |
| 16. | Coastal waters of the Baltic Sea | Natura 2000 area | Sea | 1946.3 |
| 17. | Widowo | Natura 2000 area | Land | 1.0 |
Table 4.
Traffic (number of ships) in the ports of the region and its dynamics.
| Port/Year | 2010 | 2011 | 2012 | 2013 | 2014 | 2015 | 2016 | 2017 | 2018 | 2019 | 2020 |
| Gdańsk | 3299 | 3252 | 3127 | 2948 | 2869 | 3106 | 3274 | 3465 | 4432 | 3927 | 3490 |
| Gdynia | 4175 | 3864 | 3578 | 3618 | 3754 | 3678 | 3956 | 3966 | 4650 | 4283 | 2566 |
| Władysławowo | 194 | 175 | 165 | 174 | 80 | 78 | 81 | 76 | 98 | 66 | 90 |
| Kłajpeda | 6949 | 7063 | 7329 | 6919 | 6964 | 7058 | 6998 | 6571 | 7081 | 6776 | 6453 |
| Kaliningrad | 5993 | 7098 | 6478 | 7929 | 6566 | 5432 | 5600 | 7128 | 6927 | 4641 | 3848 |
| Sum | 20,610 | 21,452 | 20,677 | 21,588 | 20,233 | 19,352 | 19,909 | 21,206 | 23,188 | 19,693 | 16,447 |
| % in relation to 2010 | 0.0 | 4.1 | 0.3 | 4.7 | −1.8 | −6.1 | −3.4 | 2.9 | 12.5 | −4.5 | −20.2 |
| % year-on-year | 0.0 | 4.1 | −3.6 | 4.4 | −6.3 | −4.4 | 2.9 | 6.5 | 9.3 | −15.1 | −16.5 |
For Gdańsk, the 2020 estimates were based on half-year data. For Władysławowo, the 2020 estimates were based on AIS data.
Table 6.
Examples of substances contained in a wind turbine.
| No | Location | Substance | Volume [L] | Toxicity (Based on SDS-Safety Data Sheets) |
|---|---|---|---|---|
| NACELLE | ||||
| 1 | Yaw pinion lubrication system | Lubricant oil | 40 | Harmful to aquatic organisms, may cause long-term adverse effects in the aquatic environment. |
| 2 | Swivel gear | Gear oil | 12 × 20 | No known significant effects or critical risks. |
| 3 | Lubrication system for main bearings | Smar | 270 | Harmful to aquatic organisms. |
| 4 | Transformator | Ester oil | 6500 | This product is not classified as hazardous. |
| 5 | Coolant | Water/glycol | 1800 | There is a high probability that the product is not seriously harmful to aquatic organisms. |
| SHAFT (GENERATOR) | ||||
| 6 | Hydraulic system | Hydraulic oil | 500 | It is expected to be biodegradable. Bioaccumulation of this product in food chains in the environment is not expected. |
| HUB | ||||
| 7 | Lubrication system for the turbine blade bearings. | Lubricant | 180 | It is expected to be practically non-toxic. |
| 8 | Pitch system hydraulic accumulators | Hydraulic oil | 350 | As above (No. 6). |
| 9 | Pitch system hydraulic accumulators (at 1bar abs) | Azot (Nitrogen) | 63,000 | Hazardous material. |
| TOWER | ||||
| 10 | Damping Liquid | Water/Glycol | 1400 | As above (No. 5). |
Table 7.
Simulation assumptions.
| No | Spill Volume [t] | Wind | Current | |
|---|---|---|---|---|
| Direction | Speed [m/s] | Speed [m/s] | ||
| A1 | 150 | N | 30 | 0.15 |
| A2 | 150 | NE | 30 | 0.15 |
| A3 | 150 | E | 30 | 0.15 |
| A4 | 150 | SE | 30 | 0.15 |
| A5 | 150 | S | 30 | 0.15 |
| A6 | 150 | SW | 30 | 0.15 |
| A7 | 150 | W | 30 | 0.15 |
| A8 | 150 | NW | 30 | 0.15 |
| B1 | 150 | N | 7 | 0.1 |
| B2 | 150 | NE | 7 | 0.1 |
| B3 | 150 | E | 7 | 0.1 |
| B4 | 150 | SE | 7 | 0.1 |
| B5 | 150 | S | 7 | 0.1 |
| B6 | 150 | SW | 7 | 0.1 |
| B7 | 150 | W | 7 | 0.1 |
| B8 | 150 | NW | 7 | 0.1 |
Table 8.
Result of an example simulation in the PISCES II simulator—summary of oil distribution and its properties during the incident.
Table 8.
Result of an example simulation in the PISCES II simulator—summary of oil distribution and its properties during the incident.
| # | Time | Amount Spilled [kg] | Amount Floating [kg] | Amount Evaporated [kg] | Amount Dispersed [kg] | Amount Stranded [kg] | Amount Sunk [kg] | Amount Floating Mixture [kg] | Amount Recovered Mixture [kg] | Max Thickness [mm] | Slick Area [m2] | Viscosity [cSt] |
|---|---|---|---|---|---|---|---|---|---|---|---|---|
| 1 | ‘0:00’ | 0 | 0 | 0 | 0 | 0 | 0 | 0 | 0 | 0 | 0 | |
| 2 | ‘0:30’ | 24,597 | 3808 | 0 | 20,789 | 0 | 0 | 4700 | 0 | 5 | 8473 | 212 |
| 3 | ‘1:00’ | 49,597 | 3894 | 1 | 45,703 | 0 | 0 | 4815 | 0 | 4 | 8521 | 213 |
| 4 | ‘1:30’ | 74,597 | 3851 | 1 | 70,745 | 0 | 0 | 4758 | 0 | 4 | 8662 | 212 |
| 5 | ‘2:00’ | 99,597 | 3875 | 1 | 95,721 | 0 | 0 | 4789 | 0 | 4 | 8380 | 213 |
| 6 | ‘2:30’ | 124,597 | 3801 | 2 | 120,794 | 0 | 0 | 4690 | 0 | 4 | 8537 | 212 |
| 7 | ‘3:00’ | 149,597 | 3797 | 2 | 145,798 | 0 | 0 | 4684 | 0 | 3 | 8377 | 212 |
| 8 | ‘3:30’ | 150,000 | 0 | 2 | 149,998 | 0 | 0 | 0 | 0 | 0 | 0 |
Disclaimer/Publisher’s Note: The statements, opinions and data contained in all publications are solely those of the individual author(s) and contributor(s) and not of MDPI and/or the editor(s). MDPI and/or the editor(s) disclaim responsibility for any injury to people or property resulting from any ideas, methods, instructions or products referred to in the content. |
© 2024 by the author. Licensee MDPI, Basel, Switzerland. This article is an open access article distributed under the terms and conditions of the Creative Commons Attribution (CC BY) license (https://creativecommons.org/licenses/by/4.0/).
Share and Cite
MDPI and ACS Style
Łazuga, K. Analysis of the Impact of Wind Farm Construction on the Marine Environment. Energies 2024, 17, 3523. https://doi.org/10.3390/en17143523
AMA Style
Łazuga K. Analysis of the Impact of Wind Farm Construction on the Marine Environment. Energies. 2024; 17(14):3523. https://doi.org/10.3390/en17143523
Chicago/Turabian StyleŁazuga, Kinga. 2024. "Analysis of the Impact of Wind Farm Construction on the Marine Environment" Energies 17, no. 14: 3523. https://doi.org/10.3390/en17143523
Note that from the first issue of 2016, this journal uses article numbers instead of page numbers. See further details here.