Article

Simulation of a Continuous Pyrolysis Reactor for a Heat Self-Sufficient Process and Liquid Fuel Production

by
Antonio Chavando
1,2,3,
Valter Bruno Silva
1,2,*,
Luís A. C. Tarelho
1,
João Sousa Cardoso
2,3 and
Daniela Eusebio
2
1
Department of Environment and Planning and Centre for Environmental and Marine Studies, University of Aveiro, 3810-193 Aveiro, Portugal
2
Superior School of Technology and Management, Polytechnic Institute of Portalegre, 7300-110 Portalegre, Portugal
3
Department of Mechanical Engineering, Instituto Superior Técnico, Universidade de Lisboa, 1049-001 Lisboa, Portugal
*
Author to whom correspondence should be addressed.
Energies 2024, 17(14), 3526; https://doi.org/10.3390/en17143526
Submission received: 28 May 2024 / Revised: 12 July 2024 / Accepted: 16 July 2024 / Published: 18 July 2024
(This article belongs to the Special Issue Renewable Fuels for Internal Combustion Engines: 2nd Edition)

Abstract

:
This study investigates the potential of utilizing pyrolysis byproducts, including char and non-condensable gases, as an energy source to promote autothermal pyrolysis. A total of six pyrolysis experiments were conducted at three distinct cracking temperatures, namely, 450 °C, 500 °C, and 550 °C. The experiments utilized two types of biomasses, i.e., 100% pine chips and 75% pine chips mixed with 25% refuse-derived fuels (RDF). The findings from the experiments were subsequently incorporated into a process simulation conducted on Aspen Plus for an energy balance and a techno-economic analysis. The results of the experiments revealed that the energy produced by the byproducts utilizing only pine chips is 1.453 kW/kg, which is enough to fulfill the energy demand of the pyrolysis reactor (1.298 kW/kg). However, when 25% of RDF is added, the energy demand of the reactor decreases to 1.220 kW/kg, and the produced energy increases to 1.750 kW/kg. Furthermore, adding RDF increases bio-oil’s lower heating value (LHV). The techno-economic study proposed three scenarios: optimistic, conservative, and tragic. The optimistic has a payback period (PBP) of 7.5 years and a positive net present value (NPV). However, the other two scenarios were unfavorable, resulting in unfeasibility.

1. Introduction

The use of fossil fuels has emerged as a substantial contributor to the release of greenhouse gases (GHG), constituting around 78% of worldwide emissions [1]. The combustion of coal, oil, and gas to generate energy for heating, cooling, electricity, and transportation has emerged as the predominant factor responsible for the escalating levels of carbon dioxide (CO2), methane (CH4), and other greenhouse gases inside the Earth’s atmosphere [2]. The emissions being released result in notable alterations to our climate, which in turn are contributing to severe weather phenomena, the escalation of sea levels, and the degradation of our ecosystems.
In conjunction with the issue of greenhouse gas emissions, municipal solid waste (MSW) also plays a role in the degradation of ecosystems [3]. As urban areas experience expansion, there is a corresponding rise in the volume of garbage produced, with a significant portion disposed of in landfills and incinerators or burned in open fields [4]. The generation of this waste produces methane, a potent greenhouse gas that contributes to climate change [3]. Furthermore, the dumping of garbage in landfills has the potential to cause the contamination of groundwater and soil, resulting in detrimental effects on ecosystems and the depletion of biodiversity. Simultaneously, open burning results in the emission of a substantial quantity of CO2.
Recent statistics [5] indicate that almost 500 million metric tons of MSW annually are not collected worldwide, representing 24% of municipal solid waste generated. This number is astonishing and is equal to the weight of more than 80,000 Eiffel Towers. In addition, even when waste is collected, an additional 27% of the waste is improperly managed [5]. Consequently, inadequate treatment results in environmental contamination and poses risks to public health, where a considerable proportion of the waste is disposed of through open burning, emitting harmful gases into the atmosphere such as nitrogen oxides (NOx), furans, and Particulate Matter PM2.5 and PM10 [6] Open burning is widespread in low- and middle-income countries since the methods of collecting and disposing waste are usually insufficient or nonexistent [5]. According to C. Wiedinmyer et al. [6], 0.62 billion tons of the global MSW is burned openly at the residential level, and an additional 0.35 billion tons is burned at dump sites. This figure is equivalent to 1.413 billion tons of CO2 emission from the 37.15 billion tons of CO2 emitted globally [7], representing 3.8% of the global CO2 emissions.
The problem of MSW has been a concern for governments and environmentalists alike. While the amount of MSW generated annually is already alarming, the rate at which it is increasing is even more concerning. According to recent studies, the amount of MSW generated globally will increase significantly in the following years, as depicted in Figure 1 [8].
This trend has significant implications given that the disposal and management of MSW presents numerous environmental, health, and economic challenges. To begin with, waste accumulation in landfills is an essential contributor to greenhouse gas emissions, exacerbating climate change. Moreover, MSW’s soil and groundwater contamination in landfills can contribute to additional environmental degradation. Furthermore, managing and disposing MSW has become a significant burden on local governments, leading to higher taxes and reduced public services.
To tackle both issues, people, corporations, and governments must collaborate to shift towards more environmentally friendly energy sources and curtail garbage production. This entails allocating resources towards developing and using renewable energy sources, such as solar, wind, and hydropower, and implementing sustainable waste management strategies, including recycling and composting. By implementing proactive measures in the present, we may effectively alleviate the adverse impacts of climate change and save our ecosystems for the benefit of future generations [9] For example, utilizing biomass as an energy source can address both issues simultaneously. According to Directive (EU) 2018/2001 of the European Parliament and the Council [10], biomass is the biodegradable part of products, waste, and residues from biological agriculture (including plants and animals), forestry, and related industries like fisheries and aquaculture, as well as the biodegradable part of industrial and municipal waste. Therefore, biomass comprises numerous materials, which can be blended to avoid a shortage of raw materials [11].
The agricultural sector is crucial in providing biomass from the organic matter generated by crops and cattle. Nevertheless, the presence of biomass is susceptible to seasonal variations, leading to substantial costs for agricultural enterprises [12]. Maintaining inventory to guarantee a steady supply of raw materials can be expensive, and fluctuations in supply can influence decisions on delivery and the design of supply chain systems. Hence, it is imperative to establish a reliable network design that considers the possibility of disruptions to optimize supply chains and guarantee the efficient gathering and processing of biomass. Here, refuse-derived fuels (RDF) are an available raw material for addressing seasonality issues. The effective execution of this task necessitates meticulous strategizing and the formulation of backup measures to minimize the repercussions of disruptions to the supply chain. By implementing this strategy, businesses may enhance the dependability of their supply chains and mitigate the potential for disruptions that may adversely affect their operations.
Utilizing MSW via RDF and other biomasses has become increasingly crucial in searching for sustainable and renewable energy sources [13]. These materials can be converted into energy vectors through various thermochemical technologies, including combustion, gasification, and pyrolysis [14]. Combustion involves combusting waste materials at high temperatures, producing heat and electricity. It is a well-established method for waste disposal and energy generation [15]. Still, it has come under scrutiny due to the potential release of harmful pollutants such as dioxins and heavy metals [16].
On the other hand, gasification involves the partial oxidation of waste materials to produce a gas mixture mainly containing carbon monoxide, hydrogen, and methane [17]. This gas mixture can then be used to generate electricity or fuel vehicles. Gasification has the advantage of producing a cleaner fuel compared to combustion, but it requires more advanced technology and can be more expensive [18]. Pyrolysis is another thermochemical technology that involves decomposing waste materials without oxygen to produce solid, liquid, and gaseous products. The solid product, known as biochar, can be used as a soil amendment [19], while the liquid and gaseous products can be used as fuels [2]. As we delve deeper into thermochemical technologies, we must weigh each technology’s pros and cons. In this regard, Table 1 is a valuable resource, as it provides a comprehensive list of the advantages and disadvantages and the technology readiness level (TRL).
The TRL of pyrolysis falls between levels 6 and 9, a testament to the maturity of the conventional pyrolysis of wood and coal [22]. However, the pyrolysis of MSW or RDF is relatively recent. Some efforts have been made in this field, such as those of I. Gandidi et al. [23], who pyrolyzed MSW at 400 °C for 60 min using zeolite as a catalyst. They found that simple pyrolysis produced 15.2 wt.% of bio-oil, and catalyst pyrolysis produced 21.4 wt.%.
Furthermore, catalytic pyrolysis produces a more energetic bio-oil without water. M. Guo et al. [24] conducted pyrolysis studies on RDF, excluding plastics. They discovered that the pyrolysis occurred within a temperature range of 90–410 °C, producing a biochar with a higher heating value (HHV) of 7698 ± 91 KJ/kg. However, the pyrolysis of biomass blended with RDF is still in the early stages of development and has not yet been widely adopted. A. Chavando et al. undertook a series of experimental investigations to examine the influence of the cracking temperature, the heating rate, and the RDF on pyrolysis yields [2].
The research landscape regarding the pyrolysis of Refuse-Derived Fuel (RDF) remains relatively unexplored. However, some studies have investigated the pyrolysis of individual RDF fractions, such as plastics. These investigations have revealed their unique challenges, with the excessive formation of waxes being a notable issue because it can clog the condensation system [2]. Zheng Zhang et al. [25] have attempted to mitigate this problem by using catalysts such as aluminum oxide, silicon/aluminum, and zeolites, which have had favorable results. Furthermore, it was observed that the cracking temperature was reduced to 250–350 °C.
In contrast, without a catalyst, the pyrolysis of polypropylene and polyethylene at temperatures ranging from 500 to 600 °C primarily yields solid wax-like C20+ hydrocarbons at ambient temperature [26]. Waxes can also be reduced by increasing the temperature to 700 °C [26]. This information is essential for the pyrolysis of RDF since these materials are heterogeneous, and some RDF pellets can have higher amounts of plastic than others. Therefore, if RDF has a considerable number of plastics, the waxes will form, and it will be necessary to consider a catalyst or a temperature increase, which can serve as an obstacle to autothermal pyrolysis.
Ruihan Dong et al. [27] revealed that blending grape stems with plastic waste can create a promising form of RDF to be pyrolyzed. They found that adding plastics to the pyrolysis process of grape stems significantly enhances the oil’s aromatic hydrocarbon content, increasing it from a mere 10% in grape stems alone to a remarkable 65.08%. This significant boost in aromatic compounds can improve the fuel’s energy density and combustion characteristics. Furthermore, the researchers observed a 3.8% improvement in the activation energy of the blended material compared to that of grape stems alone. This suggests that the combined feedstock is more reactive and efficient during pyrolysis, potentially leading to higher energy yields. These findings highlight the value of utilizing agricultural waste and repurposing plastic waste to create a sustainable and potentially more energy-dense RDF by harnessing the synergistic effects of these diverse materials.
Other researchers are also exploring the synergistic effects of blending materials for pyrolysis. Jie Liu et al. [28] explored the potential benefits of blending chrome-tanned leather shavings with wheat straw. Their findings suggest a synergetic effect: This combination effectively inhibits the formation of hexavalent chromium in the solid residue produced by the pyrolysis of leather shavings alone. The researchers recognize the significance of this discovery but also emphasize the importance of evaluating the process from an economic perspective. This additional assessment will help determine the overall feasibility of this innovative approach.
While the pyrolysis of the entire RDF mixture remains an area that requires further exploration, the insights gained from the research on RDF fractions provide a valuable foundation for future investigations, highlighting the techno-economic assessment. As the potential of using RDF combined with biomass to generate energy vectors is explored, it is essential to keep a close eye on the energy balance of the process. This is because the pyrolysis process requires significant energy to maintain the required temperature range of 450–550 °C for thermal cracking. If it relied on the combustion of fossil fuels to acquire this energy, the long-term viability of the procedure would be at stake. That is why a more sustainable solution is needed. This paper proposes using the byproducts of pyrolysis—namely, char and gases—as viable energy sources to create a self-sustaining autothermal process. Doing so can reduce reliance on fossil fuels and provide an ecologically sustainable alternative for energy production. Considering the experimental information, a process simulation using Aspen Plus was conducted to achieve this. The objective is to optimize the process parameters and find the best way to use the byproducts to attain a sustainable autothermal process. By doing so, we hope to contribute meaningfully to creating a greener, more sustainable future.

2. Materials and Methods

2.1. Experimental Setup

In this study, the pyrolysis process was carried out in a fixed-bed reactor attached to a condensate system, which separates the non-condensable gases from the condensable ones. Figure 2 depicts the process.
The reactor is loaded with 10 g of biomass under two different situations. The first situation involved using 100 wt.% pine chips, while the second involved using 25 wt.% RDF and 75 wt.% pine chips.
The fixed bed reactor was heated to three different cracking temperatures, namely, 450, 500, and 550 °C. The char produced during the process remained in the reactor, while the gases were allowed to exit through the right end of the reactor. Then, a heat exchanger separated the non-condensable gases from the condensable ones.
The fixed bed reactor was weighed before and after pyrolysis to determine the amount of char produced. The disparity between these measurements represents the quantity of solid matter produced, including char and ash. Similarly, the condensation system was weighed at the commencement and conclusion of the pyrolysis process, and the difference between these measurements represents the amount of liquids produced, including both bio-oil and water. Finally, the amount of non-condensable gases can be calculated as the difference between the biomass used and the combined mass of the solid and liquid phases produced. The following equations illustrate the methodology employed.
m s o l i d = m r e a c t o r ,   f m r e a c t o r , i
m l i q u i d = m c o n d e n s e r ,   f   m c o n d e n s e r ,   i
m g a s = m b i o m a s s m s o l i d m l i q u i d  
These operating conditions are executed in six experiments, each named with an “E” and two digits to determine the experiment number; for example, E01 corresponds to experiment 1. Then, the process temperature is established, which can be 450, 500, or 550, and finally, the wt.% of RDF is specified, which can be RDF0% or RDF25%. Therefore, experiment E01-450°C-RDF0% describes the first experiment, carried out at 450 °C and with 0% RDF. The six experiments were performed three times each to determine the standard deviation.
The trials will provide findings on the char yield, bio-oil, and gases, the composition and lower heating value (LHV) of the gases, and the proximate analysis of the char. The results will be displayed later.

2.2. Biomass Characterization

A local company, Madeca-Madeiras de Caxarias Lda, generously provided the pine chips. The waste management entities in Portugal supplied the RDF pellets. These row materials were utilized in this paper and characterized in previous studies about thermochemical processes performed at the University of Aveiro [29], where a manual screening process was conducted using a sieve with a square mesh size smaller than 10 mm to ensure the smooth feeding of the pine chips into the reactor.
After collecting and preparing the pine chips and RDF pellets, an extensive characterization was conducted to analyze their properties. The proximate analysis of the pine chips and RDF pellets was performed to assess their moisture, ash, volatile matter, and fixed carbon content. This analysis followed well-established standards, such as CEN/TS 14774-1:2004 [30] and BS EN 15414-3:2011 [31] for moisture, CEN/TS 14775:2004 [32] and BS EN 15403:2011 [33] for ash content, CEN/TS 15148:2006 [34] and BS EN 15402:2011 [35] for volatile matter, and by difference for fixed carbon. The ultimate analysis was conducted using Fisons Instruments’ EA1108 equipment, revealing the elemental composition of carbon, hydrogen, oxygen, nitrogen, and sulfur, with the oxygen content determined by difference. The results of these analyses are presented in Table 2.

2.3. Aspen Plus Schematics

The experimental data obtained in the described experiments were analyzed and used in the Aspen Plus simulation to understand the autothermal pyrolysis process better. The simulation was performed as described in Figure 3; further details are provided later.

2.3.1. Aspen Simulation Properties

To accurately simulate the autothermal pyrolysis process, a wide range of conventional and non-conventional components must be considered. The conventional components that were considered in the Aspen Plus Simulation included C, H2, O2, N2, H2O, CO, CO2, CH4, C2H4, C2H6, C3H8, C5H6O2, C6H6, and C7H16. The properties of these components are found in the Aspen Plus database.
In addition to these conventional components, the simulation considered several non-conventional components. They included RDF, pine chips, char, and ash, further defined by proximate and elemental analysis using the ULTANAL and PROXANAL models within Aspen Plus. The HCOALGEN model was employed to determine the system’s enthalpy accurately. This model provides various correlations for computing heat capacity, combustion heat, and formation heat. Finally, the DCOALIGT model was utilized to calculate the density of the components [36].

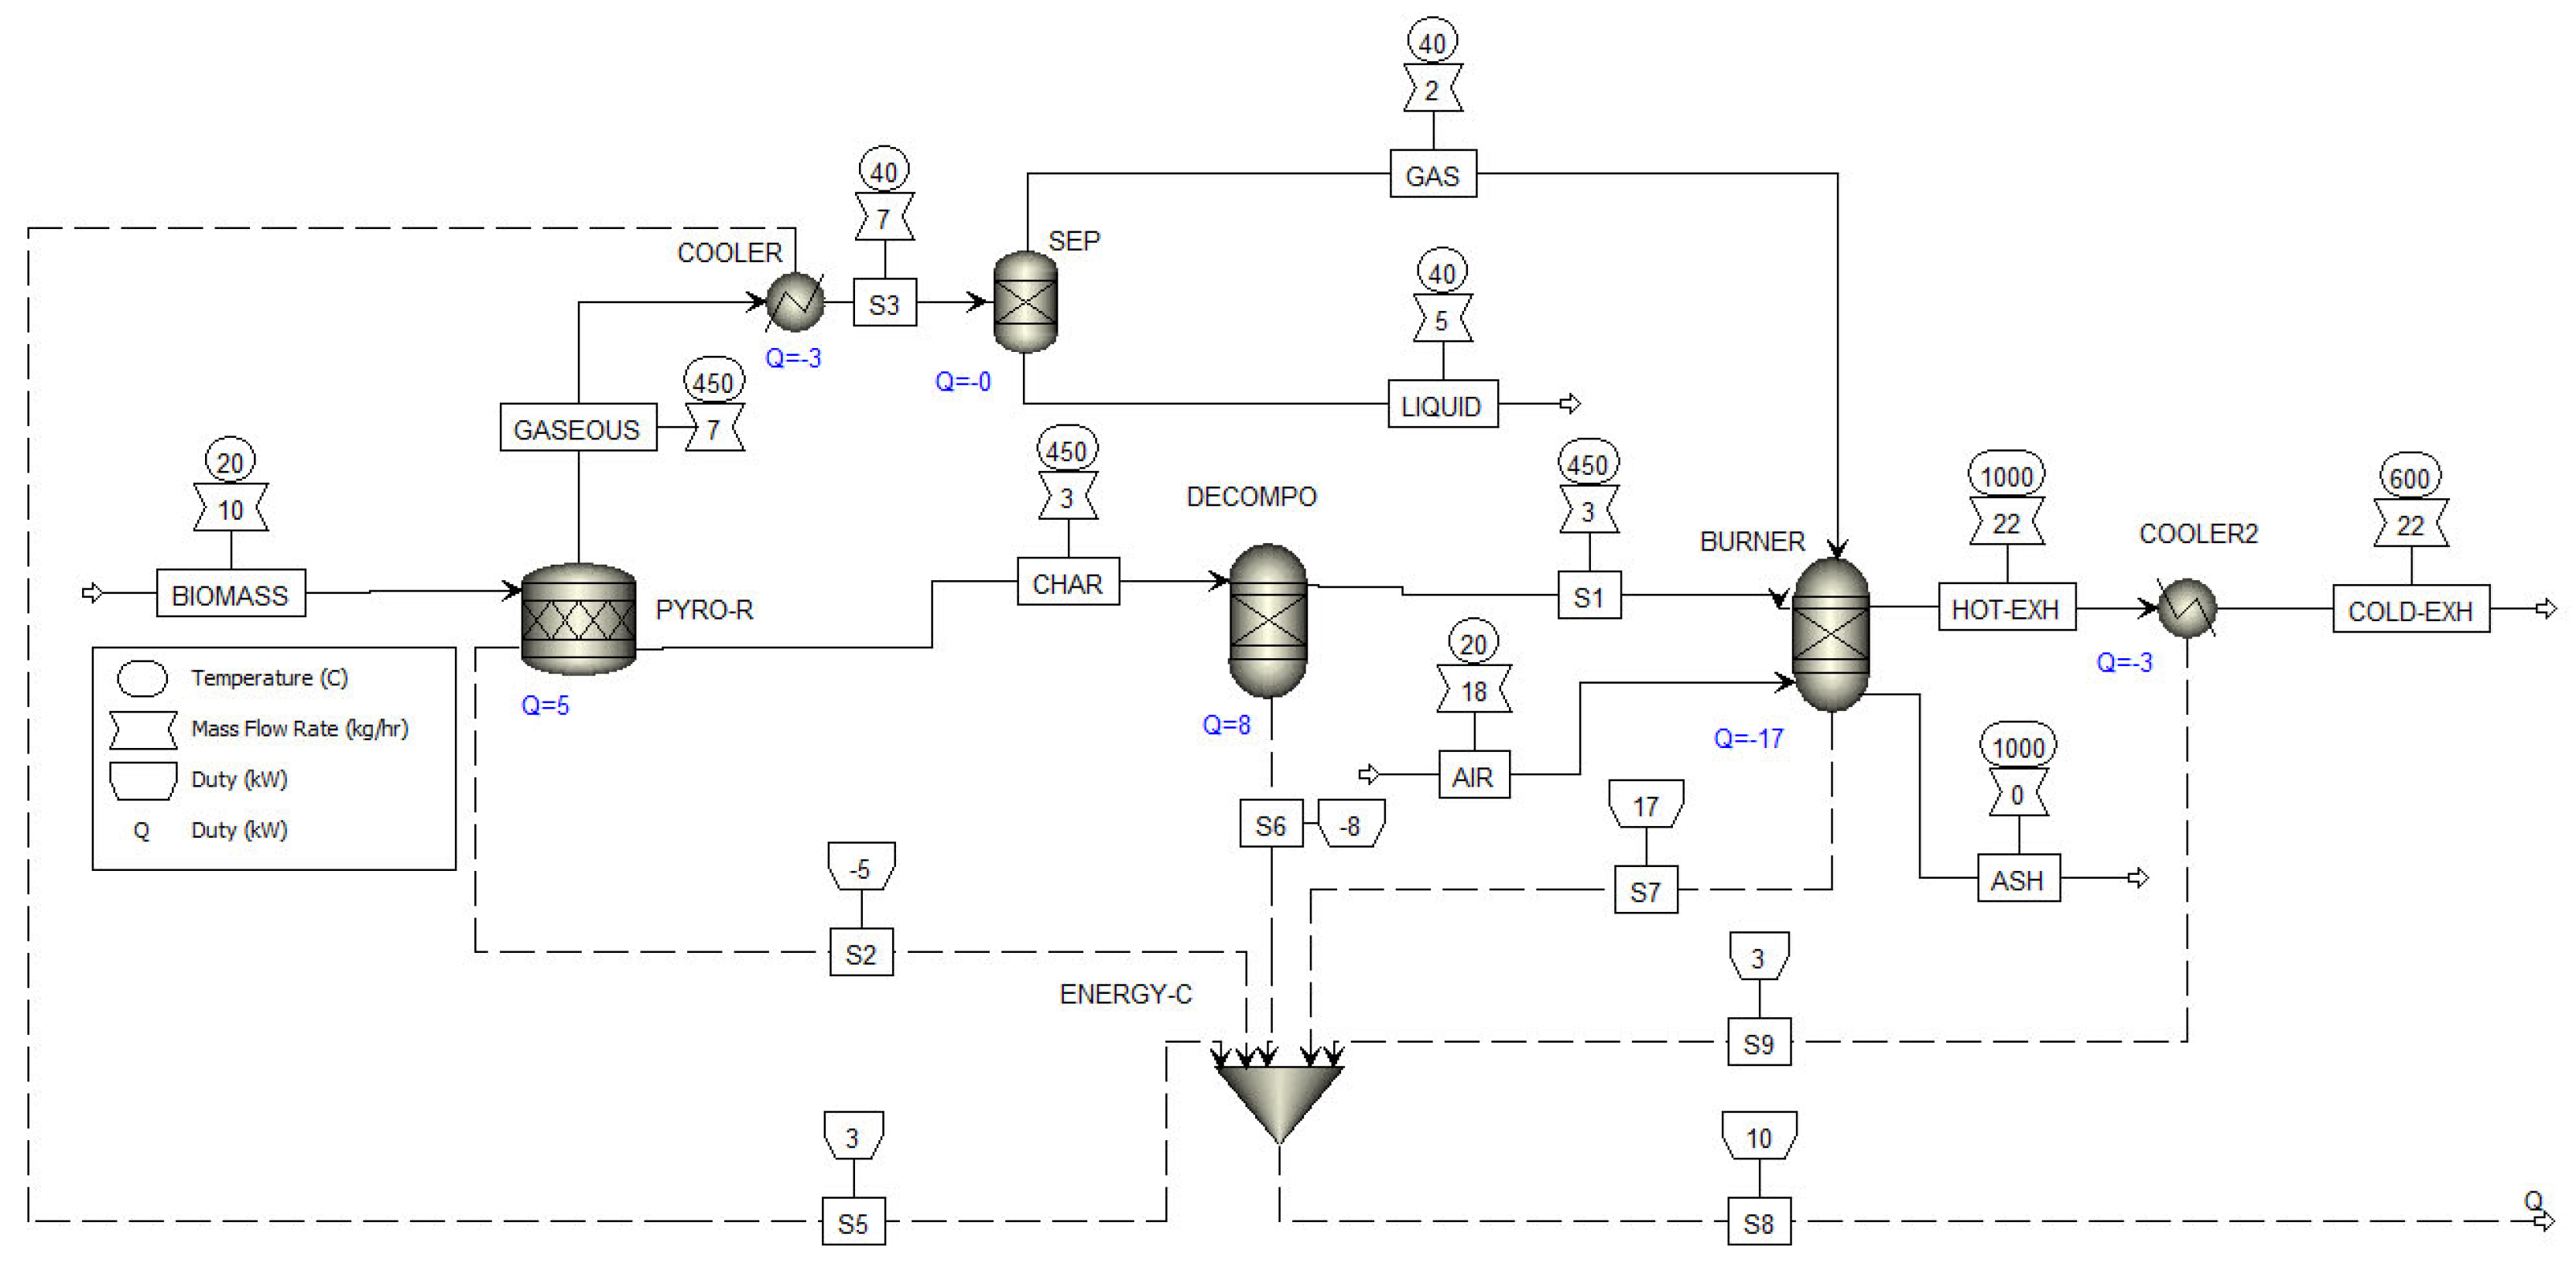
2.3.2. Aspen Flow Sheet

Figure 4 depicts the auto-thermal pyrolysis process, which consists of a stoichiometric reactor (Pyro-R) supplemented by an external MS-Excel® subroutine. This subroutine determines the quantity and composition of char, gas, and bio-oil based on the obtained experimental data and a mass balance. This reactor is fed by 10 kg/h of biomass, producing char and non-condensable gases. The non-condensable gases go through a heat exchanger (COOLER1) to separate the condensable gases from the non-condensable ones. Then, the char is decomposed in C, H, O, and N, and the non-condensable gases and the decomposed char enter a burner, providing heat for the pyrolysis reactor.
The description of equipment utilized in the simulation is described in Table 3.

2.3.3. External MS Excel Subroutine

An external MS-Excel 365® subroutine was utilized in Aspen Plus to facilitate the precise modeling of the pyrolysis process to determine the yield and composition of the primary components of char and bio-oil. This subroutine calculates the C, H, and O atomic mass balance, considering the following general mass balance equations.
m b i o m a s s ˙ = m b i o m a s s ˙ Y g a s + m b i o m a s s ˙ Y b i o o i l + m b i o m a s s ˙ Y c h a r
C b i o m a s s = C g a s + C b i o o i l + C c h a r
H b i o m a s s = H g a s + H b i o o i l + H c h a r
O b i o m a s s = O g a s + O b i o o i l + O c h a r

Atomic Carbon Mass Balance

The atomic carbon in the gas phase ( C g a s ) can be calculated with the experimental data and the following equation:
C g a s = m C H 4 ˙   M W C     M W C + 4   M W H + m C O ˙   M W C     M W C +   M W O + m C O 2 ˙   M W C     M W C + 2   M W O + m C 2 H 4 ˙   M W C     2 M W C +   4 M W H + m C 2 H 6 ˙   M W C     2 M W C +   6 M W H + m C 3 H 8 ˙   M W C     3 M W C +   8 M W H
On the other hand, to determine the carbon content of the bio-oil ( C b i o o i l ), it must first be considered to ascertain the water content of the bio-oil. The original feedstock’s moisture content and the dehydration process during the production and storage of bio-oil impact this water content. It is often found between 15 and 35 wt.% [37]. This simulation assumes the highest value of water, so the bio-oil without water represents 65 wt.%, depicted in the following equation.
Y b i o o i l w a t e r = 0.65  
The Van Krevelen diagram is used to identify the composition of bio-oil, as it was not determined experimentally. This graphic provides an estimation of the atomic ratios of oxygen to carbon (O/C) and hydrogen to carbon (H/C) in fossil materials, biomass, and pyrolysis oils [38]. This simulation uses the values of 0.30 and 1.35, respectively. Further details can be found elsewhere [37,38]. Hence, the carbon concentration in the bio-oil can be determined by utilizing Equation (10).
C b i o o i l =   ( M W C / ( M W C + A H / C M W H + A O / C M W O ) m b i o m a s s ˙ Y b i o o i l 0.65
Finally, the char content can be calculated by the difference using Equation (11).
C c h a r = C b i o m a s s C g a s C b i o o i l

Hydrogen Mass Balance

The calculation of atomic hydrogen of the different pyrolysis products is similar to that of atomic carbon. The following equation is to calculate the atomic hydrogen in the gas stream.
H g a s = m H ˙ + m C H 4 ˙   4 M W H     M W C + 4   M W H + m C 2 H 4 ˙   4 M W H     2 M W C +   4 M W H + m C 2 H 6 ˙   6 M W H     2 M W C +   6 M W H + m C 3 H 8 ˙   8 M W H     3 M W C +   8 M W H
The atomic hydrogen in the bio-oil stream is calculated as follows:
H b i o o i l =   ( M W H A H / C / ( M W C + A H / C M W H + A O / C M W O ) m b i o m a s s ˙ Y b i o o i l 0.65
Finally, the hydrogen in the char stream is calculated by difference.
H c h a r = H b i o m a s s H g a s H b i o o i l

Oxygen Mass Balance

In the same way as the calculation of carbon and hydrogen, the elemental oxygen from the different streams is calculated, where the O g a s is described in the following equation:
O g a s = m C O ˙   M W O     M W C +   M W O + m C O 2 ˙   2 M W C     M W C + 2   M W O
The atomic oxygen in the bio-oil stream is calculated as follows:
O b i o o i l = ( M W O A O / C / ( M W C + A H / C M W H + A O / C M W O ) m b i o m a s s ˙ Y b i o o i l 0.65
Finally, the oxygen in the char stream is calculated by difference.
O c h a r = O b i o m a s s O g a s O b i o o i l

Bio-Composition

The composition of the bio-oil could not be determined experimentally. However, the simulation provides a composition, assuming that the bio-oil consists of C6H6, C6H6O, C10H8, and H2O [39]. The proportion of each was estimated based on the quantity of C, H, and O calculated before, as well as a Ryield reactor, which determines the quantity of each based on an equilibrium model.

3. Results and Discussion

3.1. Experimental Results

Regrettably, the experimental findings lack information regarding the specific makeup of the bio-oil or char. Nevertheless, the experimental results offer information regarding the yield of each phase (see Table 4).
When RDF is added to the pyrolysis reactor, the solid phase increases from 2% to 3% compared to pyrolysis with only pine chips. This is because RDF contains more ash (14% dry basis) than pine chips (0.34%). Interestingly, the gas phase increases in mixtures with RDF, which can be attributed to RDF’s higher volatile matter content, particularly the plastics it contains.
On the other hand, more liquid is observed in mixtures without RDF. This is likely due to pine chips having a higher moisture content than RDF. However, it is essential to note that these changes in the relative amounts of the different phases do not necessarily indicate whether a particular phase has a higher or lower LHV. This information is crucial in determining the feasibility of autothermal pyrolysis. The composition of these phases will be described in more detail later, providing further insights into the implications of the observed phase changes.
The analysis of the gas phase reveals some intriguing insights. Table 5 showcases the composition of the gases produced with and without RDF. A remarkable observation is that the mixtures incorporating RDF generate a significantly higher amount of hydrogen, particularly at 500 °C, where the hydrogen production is 83% higher than that without RDF. Furthermore, the RDF-containing mixtures exhibit increased concentrations of various hydrocarbons, such as C2H4, C2H6, and C3H8. Conversely, these mixtures demonstrate a decrease in the levels of CO and CO2, suggesting that the addition of RDF can enhance the calorific value of the produced gases. Some researchers [39,40] attribute this phenomenon to a synergistic effect, where ash in the RDF-enriched mixtures generates gases with a more impressive calorific value. This finding highlights the potential benefits of incorporating RDF into the fuel mixture, which can produce gases with improved energy content.
The solid phase is the next element to be experimentally analyzed. The data in Table 6 suggest that the char obtained from RDF has a lower moisture content than the char produced using pine chips. However, the RDF-derived char contains a higher amount of ash. These variables are crucial determinants of the resulting char’s LHV, which will be further explored in the simulation section.

3.2. Model Validation

Based on the earlier experimental results, the simulation described in the methodology was used to determine the char and the bio-oil composition. However, the experimental results must first be compared with the simulation results to validate the simulation model. As shown in Table 7, the results were highly comparable, indicating a remarkable similarity between the two approaches.
This similarity can be attributed to the fact that the experimental data were directly used in the simulation. There was only a slight variation in the mass percentage of the solid, liquid, and gas products produced from RDF mixtures. This discrepancy can be explained by the simulation’s objective of achieving convergence in the mass balance of the three components when integrating the liquid and solid constituents into the Aspen Model.
Despite this minor discrepancy, it can confidently be concluded that the outcomes from the experimental and simulation approaches exhibit high similarity, validating the effectiveness and reliability of the simulation model.
The following section presents results that were not experimentally obtained but were instead obtained through Aspen simulation using the experimental data and assumptions outlined in Section 2.

3.3. Aspen Plus Results

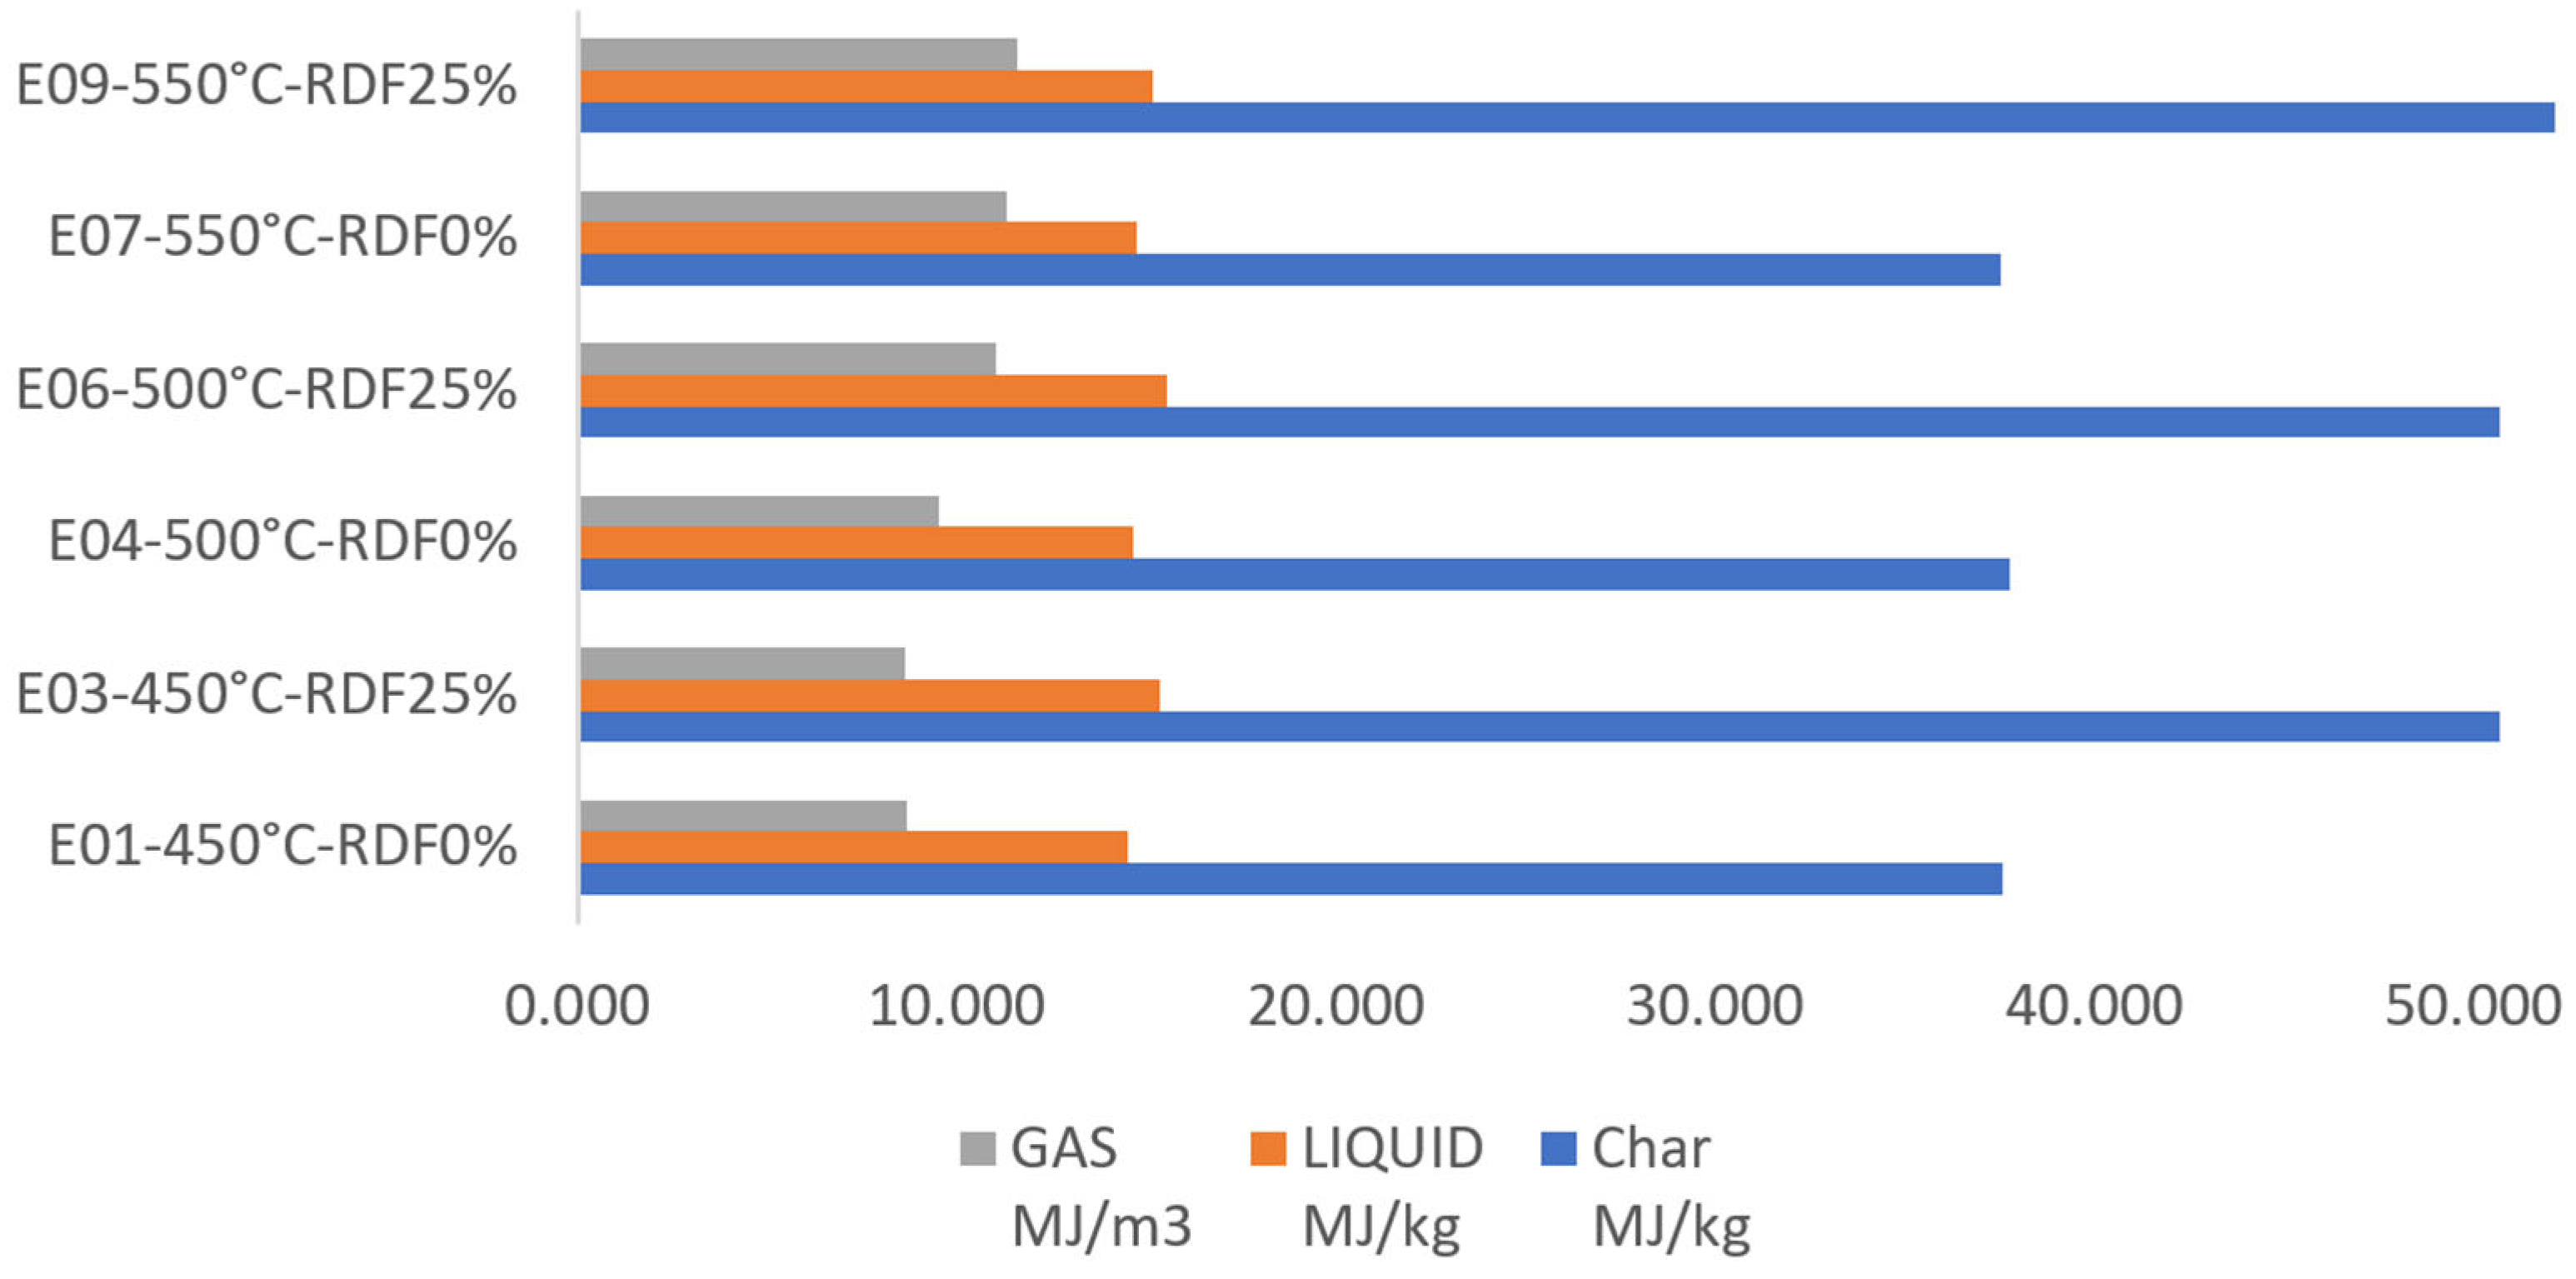
3.3.1. Char Composition

Char is a substance predominantly comprising carbon, volatile components, moisture, and ashes. The fixed carbon content of char is of particular significance due to its role in contributing to the material’s elevated carbon content and its capacity to combust at elevated temperatures. In contrast, volatile matter pertains to the gaseous components and other compounds emitted during the char heating. Moisture is a significant char constituent, influencing the material’s characteristics and combustibility. Excessive moisture levels can potentially diminish the thermal output generated by the char, but insufficient moisture levels can pose challenges in terms of ignition [41]. Ashes are the residual substances that remain following the combustion of char. The utilization of char and ashes encompasses a diverse range of applications, such as their potential as a source of fertilizer, construction materials, and even as an ingredient in soap production. However, this paper uses char as an energy source to promote an autothermal process. So, the char composition and its LHV are essential. Table 8 presents the char composition and its LHV.
The data demonstrate that mixtures including RDF have a considerable ash content, yet their LHV is substantially greater than that without RDF. The leading causes of this phenomenon are the elevated carbon content and reduced oxygen levels in RDF (as shown in Table 2). The chemical composition of RDF is advantageous for energy generation, rendering it an appealing choice for diverse businesses.

3.3.2. Bio-Oil Composition

Bio-oil is a heterogeneous blend consisting primarily of macromolecules and a substantial amount of oxygen. It is a distinctive and adaptable chemical encompassing various oxygen-containing organic compounds, such as esters, ethers, aldehydes, ketones, phenols, carboxylic acids, and alcohols [42]. The composition of the bio-oil could not be determined experimentally. However, the simulation provides a composition, assuming that the bio-oil consists of C6H6, C6H6O, C10H8, and water [43]. Table 9 presents the simulation results highlighting the LHV of the bio-oil.
According to studies by Ilyin et al. [41], bio-oil has an LHV range of 15 to 29 MJ/kg. This means that bio-oil is an energy-dense fuel that can be used in various industrial applications. While the simulation results showed slightly lower LHV values than Ilyin’s findings because it contains water, it is worth noting that adding RDF to the blend improves the bio-oil LHV.
Bio-oil production is a promising avenue in the realm of biofuels. It is a liquid fuel derived from biomass that can replace traditional fossil fuels. However, producing bio-oil poses several challenges. One significant obstacle is the high water content in the end product [44], as shown in Table 10. The bio-oil’s water mass fraction ranges from 0.33 to 0.35, and mixtures without RDF tend to yield bio-oil with an even higher water content. This elevated water and oxygen content can diminish the bio-oil’s calorific value, ultimately reducing fuel efficiency [44].
Another challenge that needs to be addressed is the heightened viscosity and density of bio-oil, which surpass those of conventional fuels. During experimentation, it was noted that the blending of RDF results in increased viscosity and density, which can lead to suboptimal fuel atomization, ineffective ignition, and combustion.
Despite these obstacles, bio-oil production as a fuel source holds significant potential for the future of sustainable energy. With ongoing research and development, it can overcome these challenges and unlock the full potential of bio-oil as a viable alternative to traditional fossil fuels.

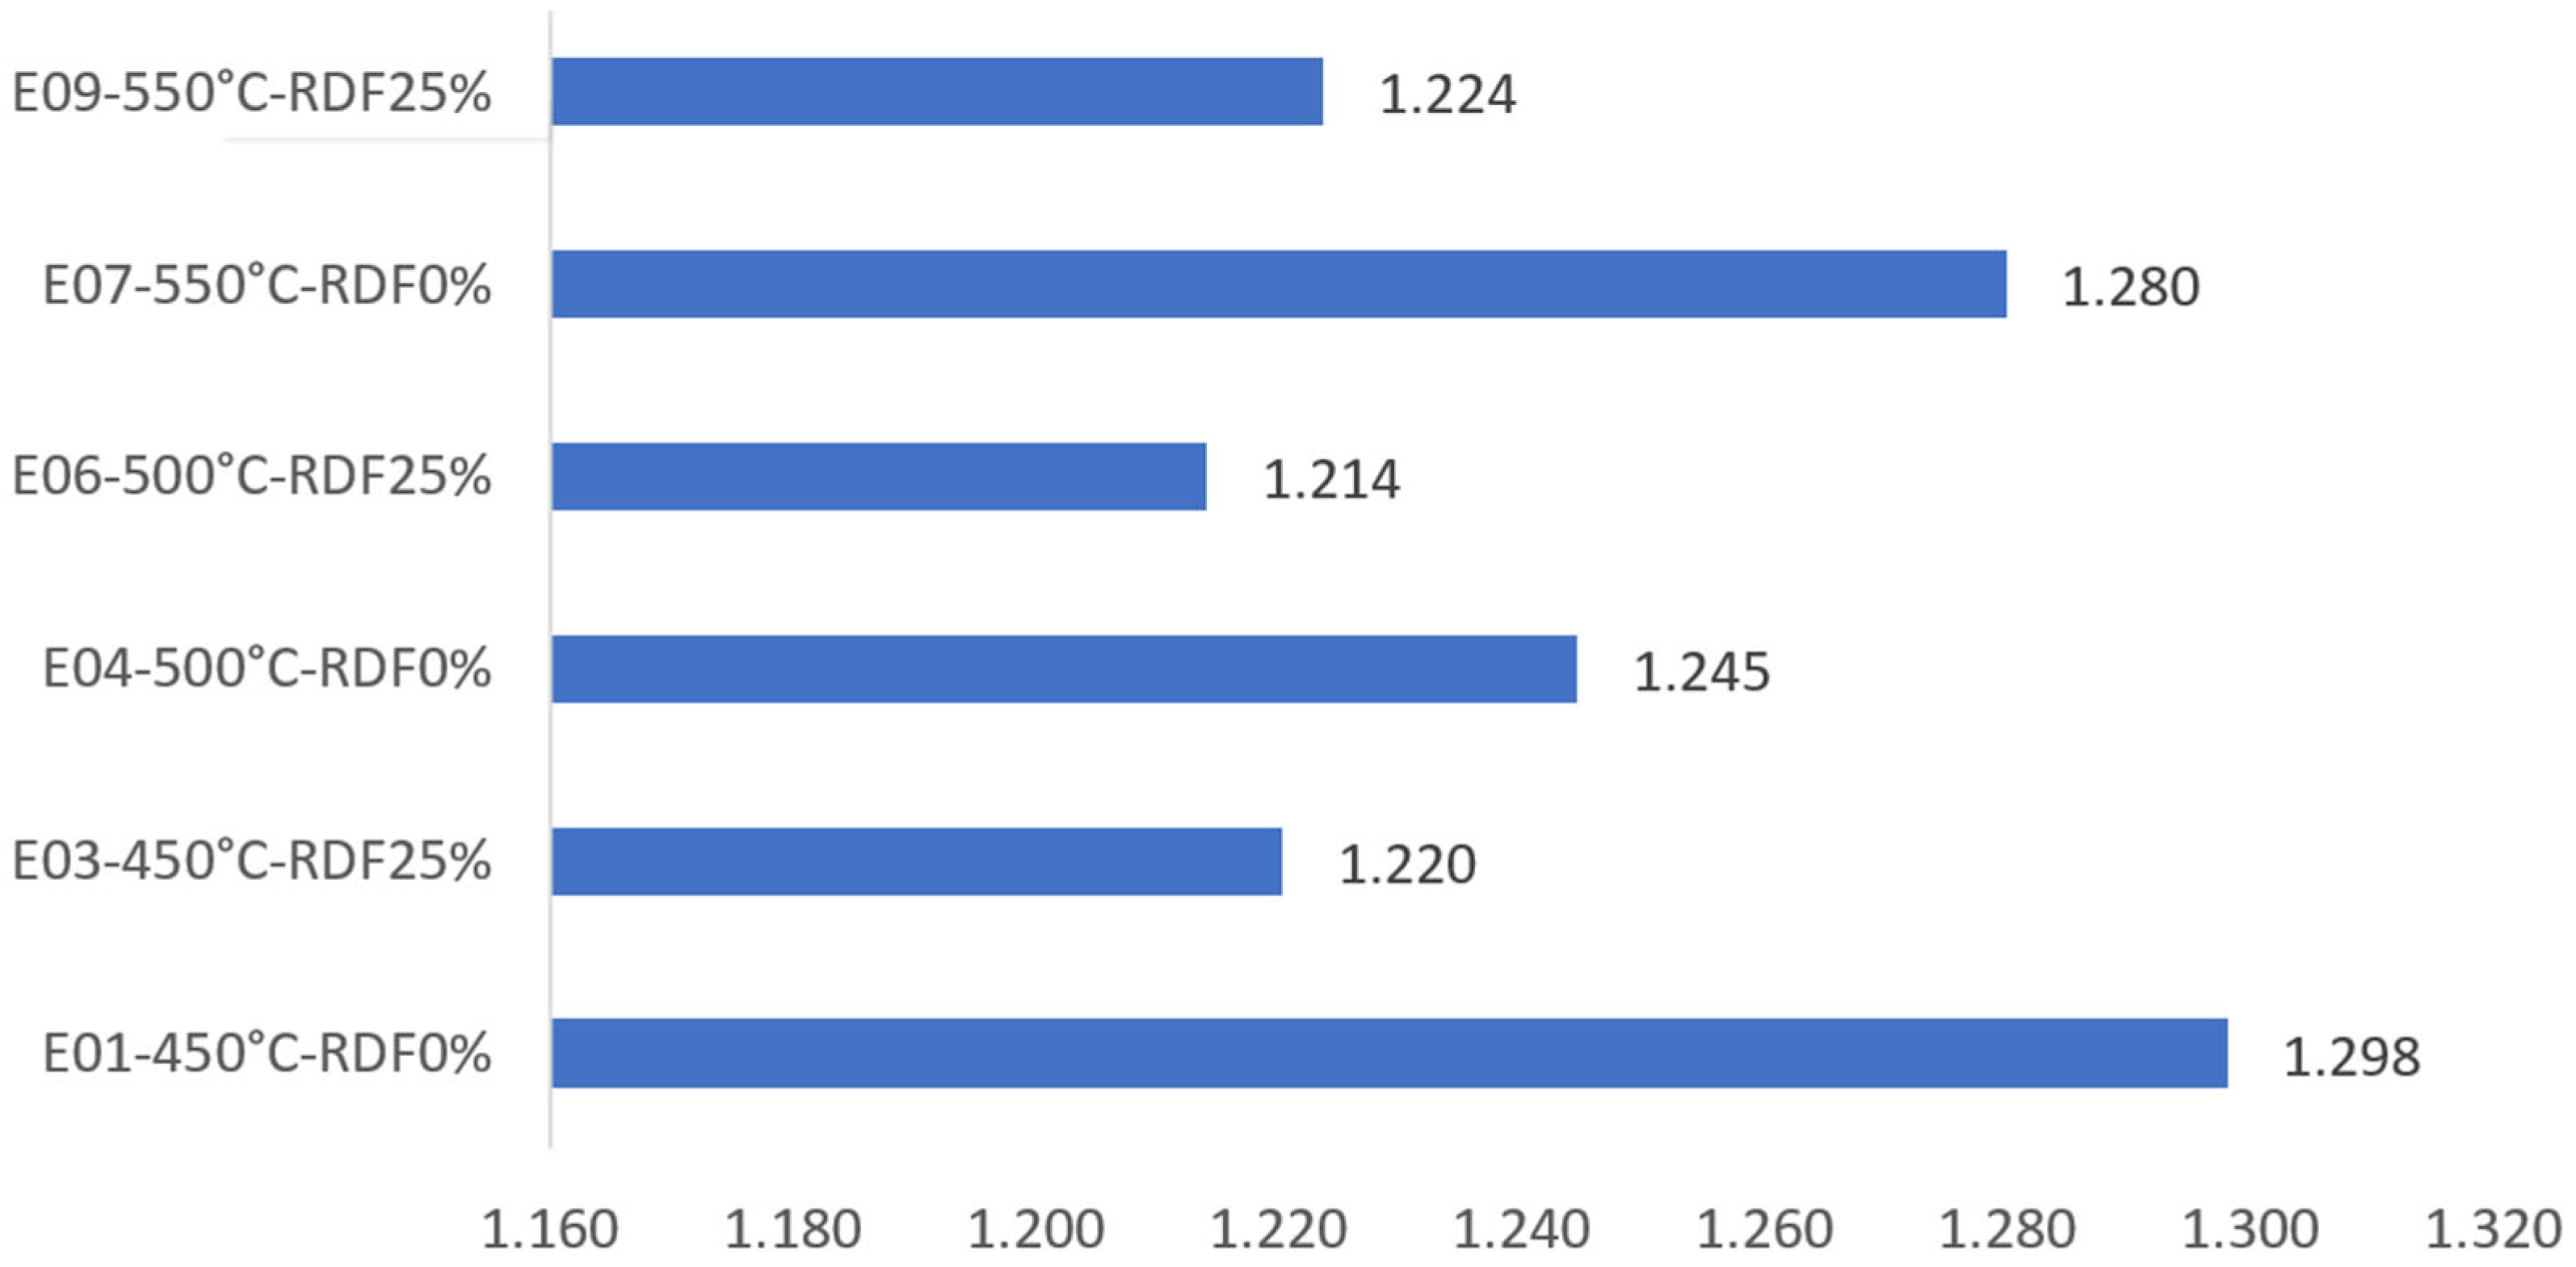
4. Process Energy Balance

In addition to the technical challenges of the pyrolysis of RDF mixtures with biomass, there are economic and environmental challenges. For example, in ecological terms, the pyrolysis process requires large amounts of energy since the raw material must raise its ambient temperature to 450–550 °C and maintain it throughout the process. If the power used to operate the pyrolysis process comes from non-renewable sources, the sustainability of this technology would be compromised. This paper has proposed an autothermic pyrolysis process, which means utilizing the energy of gases and char as a source of energy.
Figure 5 illustrates the lower heating value of each product obtained through the pyrolysis process in the Aspen Plus simulation. Figure 5 demonstrates that char exhibits the largest LHV, nearly double that of the liquid product. Furthermore, it is observed that blending with RDF produces a better char in terms of LHV.
The energy demand of the pyrolysis process is contingent upon various elements, including the specific biomass employed and the cracking temperature. The cracking temperature refers to the specific temperature at which the complex organic molecules in the biomass decompose, resulting in simpler molecules. As the cracking temperature increases, more energy is needed to start and maintain the pyrolysis reaction.
The pyrolysis reactor in the Aspen Plus simulation is divided into two parts: the PYRO-R reactor and the DECOMPO reactor, both of which are energy consumers. Aspen Plus calculates the energy required to pyrolyze the input mass flow (10 kh/h) for both pieces of equipment, and the following equation calculates the total energy required to pyrolyze a kilogram of biomass under the previously established experimental conditions.
Q P y r o l y s i s = ( Q P Y R O R + Q D E C O M P ) /   m b i o m a s s ˙
In this regard, Figure 6 presents the total energy needed to pyrolyze one kilogram of biomass from the different experiments.
As can be seen in Figure 5, blends with RDF require less energy for pyrolysis. This situation can be explained by RDF’s lower moisture content and its greater concentration of volatile matter. Therefore, RDF enhances processes demanding less energy than pyrolysis without RDF.
On the other hand, the burner is an energy producer, where a combustion reaction of the char and non-condensable gases occurs. The heat produced is utilized to heat the pyrolysis process. It is assumed that the burner efficiency is 85%. Then, the energy balance is calculated using the following equation:
Q T o t a l = Q B U R N E R + ( Q P Y R O R + Q D E C O M P )
Table 10 presents the heat energy balance of the pyrolysis process considering the energy consumers and producers.
The data indicate that the heat generated by the burner exceeds the heating needed for pyrolysis, even when accounting for 85% of efficiency.
It can also be seen that the pyrolysis process with mixtures with RDF has a greater energy excess than mixtures without RDF at the same cracking temperature. For example, a mixture without RDF pyrolyzed at 450 °C produces excess energy of −1.55 kW, while a mixture containing 25% RFD pyrolyzed at 450 °C produces excess energy of −5.4 kW. This energy difference is because blends with RDF produce products with a higher LHV than blends without RDF. This finding is consistent with the content presented by Wenfei Cai et al. [45].
This surplus heat duty may be effectively utilized. It can produce electricity, which can subsequently be utilized to operate the functions of the pyrolysis procedure as the condensation loop. Implementing this method is a highly effective approach to enhancing the energy efficiency of the pyrolysis process, minimizing its total carbon emissions, and promoting its sustainability. However, the process needs to evaluate not only the energy efficiency and carbon emissions but also the feasibility of the pyrolysis process from an economic point of view. The following chapter delves into the techno-economic analysis.

5. Techno-Economic Analysis

Project evaluation is crucial in determining which projects should be pursued and implemented. Depending on the nature of the project, various methodologies can be employed. In this particular instance, we will utilize a payback period (PBP) technique, determining the years during which the investment is recovered.
P B P = C o s t   o f   I n v e s t m e n t   A n n u a l   r e v e n u e
Another approach that can be employed is the net present value (NPV) methodology. This involves discounting all future cash flows to their present value to determine whether the net present value is positive or negative. The outcome of this analysis is dependent on the income and expenses associated with the initiative. Incomes may include revenue generated from bio-oil sales, as well as cost savings resulting from the avoidance of landfill disposal. However, these incomes may be subject to country-specific taxes. Conversely, expenses may include capital expenditures (CAPEX) and operating expenses (OpEx). If the present value of positive and negative cash flows is calculated and the outcome is positive, the project or initiative will be considered financially viable.
N P V = t = 0 n R t ( 1 i ) t
It is important to note that the net present value methodology is primarily employed to assess various initiatives, particularly when examining and comparing different thermochemical technologies and raw material utilization. This approach is beneficial in determining the financial feasibility of initiatives that generate cash flows over an extended period.
Another approach is the Internal Rate of Return (IRR) methodology. IRR is the rate when the NPV is zero. This methodology determines the rate at which an investment is expected to generate cash flows. The IRR is calculated by determining the discount rate that equates the present value of the expected cash flows with the initial investment. If the IRR is greater than the required rate of return, the investment is considered financially viable.
0 = N P V = t = 1 T C t ( 1 + I R R ) t C 0
To calculate PBP, NPV, and IRR, it is essential to clearly understand the sources of income generated throughout the project’s execution, the expenses for operating the project, the economic parameters, and the production parameters. Table 11 presents these parameters considering optimistic, conservative, and tragic scenarios. Further detail is given in the following subsections.

5.1. Incomes

In the case of autothermal pyrolysis, char and non-condensable gases will serve as heat sources. Therefore, bio-oil sales will be the primary revenue driver. This revenue stream must be carefully analyzed to determine the financial parameters. It is necessary to consider additional potential income sources in addition to bio-oil sales revenue. For example, many countries have taxes on municipal MSW sent to landfills. By utilizing autothermal pyrolysis, reducing the amount of MSW sent to landfills may be possible, thereby reducing the tax burden. These savings can be considered income and should be factored into the overall PBP, NPV, and IRR calculations. Another potential source of income is reducing CO2 emissions. However, this parameter is not considered in this paper.
Overall, it is essential to consider all potential sources of income when evaluating a project’s success. By taking a holistic approach and considering all revenue streams, the PBP, NPV, and IRR can be accurately determined, and informed decisions about the project’s future can be made.

5.1.1. Bio-Oil Cost

The price trend for pyrolysis oil has been discussed in the international market. It fluctuated in the second half of 2023 due to the availability of combustible waste materials. Pyrolysis oil is obtained through the thermolysis of waste materials at higher temperatures, and it can be used as fuel or as raw material for producing other chemicals. However, the availability of such waste materials is not consistent, leading to fluctuations in the price trend [47].
In the first half of 2023, the international market witnessed a fuel and oil price surge due to limited commercial outputs by OPEC+ [48]. This led to a rise in the cost of pyrolysis oil as well. However, as inventories increased, the price trend turned downward. A global supply disruption worsened this situation by forcing suppliers to lower prices to maintain stock movement.
The Netherlands’ pyrolysis oil market experienced a significant depreciation of about 12% in H2’23, dropping from USD 900/ton (EUR 818/ton) to USD 786/ton (EUR 715/ton) [47]. This was mainly due to the global supply outage, which led to a price drop to maintain stock movement. The American market for pyrolysis oil also experienced a downward price trend, which differed significantly from its Asian and European counterparts. The rise in upstream costs and a dull demand pattern drove the price downward [47].
The Asia-Pacific market for pyrolysis oil showed mixed trends in the first half of 2023. Indonesia banned exports, leading to decreased supply, while other importing nations obtained oil from Malaysia at compromised prices. In the second quarter, prices declined due to low purchasing potential and a slowdown in downstream sectors. The vital supply of pyrolysis oil in the markets also pushed the price downward [47].
Overall, the availability of combustible waste material, OPEC+’s limited commercial outputs, and the global supply disruption were the main factors influencing the price trend for pyrolysis oil in the second half of 2023. The mixed trends in different regions highlight the complex nature of the pyrolysis oil market and the need for a robust supply chain to ensure consistent availability and stable prices [47].
When calculating the financial parameters, three scenarios are considered: an optimistic scenario with a value of EUR 818/ton, a medium scenario with a value of EUR 715/ton, and a pessimistic scenario with a value of EUR 500/ton, chosen arbitrarily.

5.1.2. MSW Landfilled Tax

MSW handling encompasses multiple actions that are associated with substantial costs. The expenses associated with waste management encompass waste collection, the operation of transfer stations, the transport of waste from transfer stations to waste management facilities, waste processing, disposal at waste management facilities, and any sale of byproducts. This last activity is related to the MSW pathways [49].
MSW pathways are intersecting elements of the solid waste system, and each path possesses distinct benefits and drawbacks. The four primary methods of managing solid waste are recycling, composting, waste-to-energy (primarily by incineration), and landfilling [49]. Recycling is the conversion of waste materials into new goods, and it is often regarded as the most sustainable method of waste management. Composting is the decomposition of organic waste to produce fertile soil beneficial for gardening and farming. Waste-to-energy is a process that utilizes mainly incineration to produce energy or heat by burning waste items. Landfilling refers to depositing waste in designated landfills, which is the predominant approach to waste management on a global scale. Nevertheless, it is also the most ecologically detrimental, as it leads to the release of greenhouse gases and the contamination of land and water.
Germany is the leading producer of MSW in the European Union, accounting for 23.28% of the total waste generated. Nevertheless, 67% of this waste undergoes recycling, while the remaining 33% is sent to incineration. Conversely, Malta and Greece are at the forefront regarding the amount of waste disposed of in landfills. However, their generation accounts for 0.13% and 2.48% of the total MSW generated in the EU. Regarding the MSW per capita, Denmark is in first place, so a Danish person generates almost three times more residues than a Polish person. The cumulative MSW disposed of in landfills across all EU countries amounts to 53.7 million tons annually. This figure shows significant work that must be accomplished in the MSW handling. Furthermore, as already mentioned, incineration also presents notable environmental drawbacks. Table 12 provides further information about the taxes for waste landfilled and the utilization of MSW in the European Union.
This parameter is evaluated in three scenarios: an optimistic scenario where waste is landfilled for EUR 79/ton, a medium scenario where waste is landfilled for EUR 25/ton, and a pessimistic situation where waste is landfilled for EUR 11/ton.

5.2. Expenses

The pyrolysis process requires significant CAPEX and OPEX. The CAPEX includes the cost of building and equipping the pyrolysis plant, including biomass preparation equipment and storage facilities, quench and tankage systems, utilities, buildings, instrumentation and control systems, and contingencies. These costs can vary significantly depending on the size and complexity of the plant, the type of feedstock used, and the desired output.
On the other hand, the OPEX includes the costs associated with operating the plant, such as maintenance, general business expenses, electricity, consumables, ash disposal, and personnel costs. These ongoing costs can also vary depending on the size and complexity of the plant and the type of feedstock used.
The process of determining CAPEX and OPEX for the treatment of materials and the pyrolysis process is a complex and multi-disciplinary task that requires the expertise of a team of engineers. These engineers must work collaboratively to develop both basic and detailed engineering plans that will ultimately inform the procurement team’s purchasing decisions and assessments of the OPEX and CAPEX. One approach is the study conducted by Frank Riedewald et al. [46]. This study estimates that the CAPEX for treating 40,000 tons of biomass per year amounts to EUR 20,190,000, with an annual OPEX of EUR 3,425,414. It is worth noting, the final costs of the pyrolysis process will depend on a range of factors beyond the amount of material being treated, the complexity of the process, and the availability of resources and labor in the local market, which will all impact the final costs. However, these figures are used in this paper.
Another significant expense in the pyrolysis process is the cost of raw materials. In this case, pine chips are considered 75% and 25% in RDF as raw materials. Mixing materials helps prevent raw material shortages and allows for the utilization of problematic materials such as MSW via RDF. Doing this adds value to a material that would otherwise end up in landfills. The price of pine chips can vary significantly depending on several factors, including supply and demand, transportation costs, and the overall economic climate. In an optimistic scenario, the price of pine chips could be as low as EUR 40 per ton [51]. However, this price could increase to EUR 50 or even EUR 60 per ton in less favorable scenarios.

5.3. Economic Parameters

The discount rate is a crucial factor that plays a significant role in determining the returns on investment for banks and other financial institutions in a certain period. It is essentially the interest rate that a bank or investment firm offers to its investors, and it varies depending on the type of financial instrument and the level of risk that the investor is willing to assume.
Calculating a real discount rate is essential in the autothermal pyrolysis process, which involves converting biomass into bio-oil using char and gases as heat sources. This is because the pyrolysis process represents a long-term investment that requires significant capital and resources to implement successfully.
As such, the discount rate for the pyrolysis process must be carefully evaluated and considered to ensure that the investment is profitable and sustainable. In this article, the discount rate for the pyrolysis process is set at 15% in 20 years, reflecting the level of risk and return associated with this type of investment. It is worth noting that the discount rate can significantly impact the overall success of an investment project. A higher discount rate may indicate a higher level of risk, so investors may demand a higher return on their investment to compensate for this risk. On the other hand, a lower discount rate may indicate a lower level of risk, and the returns on investment may also be lower.
Therefore, it is crucial to carefully evaluate the discount rate for any investment project, including the pyrolysis process, to ensure that it is appropriate and reflects the level of risk and return associated with the investment. With the correct discount rate and a well-executed investment strategy, the pyrolysis process can be a profitable and sustainable investment that significantly benefits the environment and the economy.

5.4. Production Parameters

The production of bio-oil is a critical aspect of any biomass-processing operation. As such, the bio-oil production parameters are of utmost importance in determining the overall efficiency and profitability of the process. Bio-oil production involves converting biomass into a liquid fuel that can be used in various applications.
It is worth noting that bio-oil production typically represents a significant portion of the overall product output. Bio-oil production accounts for 35.2% of the products generated in this particular operation. This means that 352 kg of bio-oil can be obtained for each ton of biomass processed.
The bio-oil produced can be sold as a valuable commodity, adding to the operation’s overall income. This can be particularly beneficial in situations where the cost of production is high and the margins are tight. Maximizing the bio-oil yield can significantly increase the operation’s profitability.
Table 13 serves as a comprehensive summary of the various parameters defined to calculate the financial indicators NPV, PBP, and IRR. These financial indicators are considered in three scenarios: optimistic, conservative, and tragic.
In the optimistic scenario, the highest cost of bio-oil is considered, along with the most significant savings in MSW landfill taxes and the lowest cost of pine chips. This scenario results in exceedingly positive numbers, with a PBP of 7.5 years.
Conversely, the conservative scenario assumes average bio-oil and MSW landfill tax costs, along with higher costs of pine chips. This scenario results in a significant loss of NPV of EUR −5,390,865.8, indicating that the investment may not recover in 20 years.
Unfortunately, the tragic scenario results in a loss, too, with the investment not being recovered. This scenario considers the lowest cost of bio-oil, the lowest savings in MSW landfill taxes, and the highest price of pine chips. The low cost of bio-oil and low MSW landfill tax considered in this scenario are the primary reasons for the investment’s failure to recover.
The evaluation of a project is significantly influenced by its NPV and PBP, mainly when dealing with biomass and RDF, which can be utilized in other projects. For instance, J. Cardoso et al. [52] conducted a techno-economic analysis to produce green ammonia from biomass gasification, which resulted in a PBP of 4.6 years and an NPV of EUR 3,714,630 at a discount rate of 10%. It must be said that this discount rate is not highly encouraging, as there are financial instruments that offer better returns and lower risks.
If the gasification project is comparable with the autothermal pyrolysis optimistic scenario, which has an NPV of EUR 8,944,505.51 and a PBP of 7.6, considering a discount rate of 15%, then the autothermal pyrolysis is a more attractive project. However, gasification to produce green ammonia appears more favorable than the other two pyrolysis scenarios. It must be noted that the other two scenarios are less likely to occur due to climate change, global environmental commitments, the upward trend of the cost of bio-oil, and the preference for renewable energies. Therefore, the optimistic scenario is expected to become more prevalent.

6. Conclusions

Pyrolysis, a promising method for transforming waste biomass into valuable products like biochar, bio-oil, and syngas, has long faced a significant challenge: the high temperatures required for the chemical reactions demand a substantial energy input. Traditionally, this energy has been supplied by burning fossil fuels, a practice that increases carbon emissions and undermines the process’s sustainability.
However, researchers have been exploring a more sustainable solution: harnessing the pyrolysis byproducts—namely, char and non-condensable gases to heat the process. This approach, known as autothermal pyrolysis, has the potential to make the process more energy-efficient, cost-effective, and environmentally friendly.
The experimental and simulated results presented in this article demonstrate the viability of autothermal pyrolysis. When the char and gases are burned, they release enough energy to maintain the reactor’s temperature and sustain the pyrolysis process without relying on external energy sources like fossil fuels. Furthermore, the study found that adding RDF to the biomass mixture can further enhance the energy efficiency of the process and the product quality since the LHV of the liquid product of RDF blends was 50.703 MJ/kg, while that of blends without RDF was 37.587.
This innovative approach represents a significant step in making pyrolysis a more sustainable and practical solution for converting waste biomass into valuable products. By leveraging the process’s byproducts as an energy source, researchers have found a way to reduce carbon emissions by not utilizing energy from fossil fuels but instead using an autothermal process.
It was found that at a temperature of 550 °C and with 25% RDF, the process required only 1.22 kW/kg of biomass, representing a significant improvement over the 1.28 kW/kg required for pine chips alone. Moreover, the energy produced by burning the char and gases generated from 10 kg of a mixture containing 25% RDF stood at a remarkable 17.50 kW, surpassing the 14.53 kW generated by 100% pine chips.
Further research is undoubtedly needed to optimize the process parameters and scale it up for commercial applications. However, this study’s results present a compelling case for the game-changing capabilities of autothermal pyrolysis in the bioenergy field.
On the other hand, the techno-economic study explored three scenarios for the autothermal pyrolysis process: optimistic, conservative, and tragic. The optimistic scenario, featuring the best possible conditions, yielded a positive net present value (NPV) of EUR 8,944,505.51 and a feasible payback period (PBP) of 7.5 years. Conversely, the conservative and tragic scenarios were not possible, as the costs of bio-oil and taxes in municipal solid waste (MSW) landfills were lower than those in reality, resulting in a negative NPV and an unattainable PBP.
The researchers concluded that the autothermal pyrolysis process is economically viable despite the possibility of specific scenarios with minimal probability due to the current trend of increasing costs and stricter environmental regulations. Furthermore, the autothermal pyrolysis process serves as an essential means of sanitation, reducing the negative impacts of waste on public health and the environment. Therefore, autothermal pyrolysis has the potential to be a valuable tool for addressing the challenges of waste management and energy production.

Author Contributions

A.C.: Methodology, Investigation, Validation, Formal analysis, Writing—original draft, Writing—review and editing, Visualization. V.B.S.: Conceptualization, Methodology, Investigation, Formal analysis, Writing—review and editing, Supervision, Project administration. L.A.C.T.: Conceptualization, Methodology, Investigation, Formal analysis, Writing—review and editing, Supervision, Project administration. J.S.C.: Investigation. D.E.: Methodology, Investigation. All authors have read and agreed to the published version of the manuscript.

Funding

This research was funded by the Portuguese Foundation for Science and Technology through the following project: PTDC/EME-REN/4124/2021.

Data Availability Statement

Data will be available in a suitable repository.

Acknowledgments

The authors would like to express their gratitude to the Portuguese Foundation for Science and Technology (FCT) for the grant 2022.12220.BD and also for the contract 2021.02603.CEECIND/CP1659/CT0014 (https://doi.org/10.54499/2021.02603.CEECIND/CP1659/CT0014) and the projects SAICTALT/39486/2018 (http://doi.org/10.54499/SAICT-ALT/39486/2018) and PTDC/EME-REN/4124/2021. Thanks are due to the Portuguese Foundation for Science and Technology (FCT)/Ministry of Science, Technology and Higher Education (MCTES), Portugal, for the financial support to CESAM (UIDP/50017/2020+UIDB/50017/2020+LA/P/0094/2020) through national funds. The financial support from Project BioValChar—Sustainable valorisation of residual biomass for biochar, PCIF-GVB-0034-2019, http://doi.org/10.54499/PCIF/GVB/0034/2019, funded by the Portuguese Foundation for Science and Technology (FCT), is acknowledged.Energies 17 03526 i001

Conflicts of Interest

The authors declare no conflicts of interest.

Nomenclature

SymbolUnitDescription
A O / C -Van Krevelen atomic ratio of O/C
A H / C -Van Krevelen atomic ratio of H/C
C b i o m a s s kg/hCarbon contained in the biomass
C b i o o i l kg/hCarbon contained in the bio-oil
C c h a r kg/hCarbon contained in the char
C g a s kg/hCarbon contained in the gas
C t Net cash inflow during the period.
C 0 Total initial investment cost.
H b i o m a s s kg/hHydrogen contained in the biomass
H b i o o i l kg/hHydrogen contained in the bio-oil
H c h a r kg/hHydrogen contained in the char
H g a s kg/hHydrogen contained in the gas
i%Discount rate or return that could be earned in an alternative investment.
IRR%Internal Rate of Return
N P V %Net Present Value
m b i o m a s s kgMass of the biomass in the fix-bed reactor
m c o n d e n s e r ,   i kgMass of the condenser at the beginning of the pyrolysis
m c o n d e n s e r ,   f   kgMass of the condenser at the end of the pyrolysis
m g a s kgMass of the non-condensable gases in the experimentation
m l i q u i d kgMass of the bio-oil and water in the experimentation
m r e a c t o r , i kgMass of the reactor at the beginning of the pyrolysis
m r e a c t o r ,   f kgMass of the reactor at the end of the pyrolysis
m s o l i d kgMass of the char and ashes in the experimentation
m b i o m a s s ˙ kg/hBiomass flow rate = 10
m C H 4 ˙ kg/hCH4 mass flow rate of a given stream
m C O ˙ kg/hCO mass flow rate of a given stream
m C O 2 ˙ kg/hCO2 mass flow rate of a given stream
m C 2 H 4 ˙ kg/hC2H4 mass flow rate of a given stream
m C 2 H 6 ˙ kg/hC2H6 mass flow rate of a given stream
m C 3 H 8 ˙ kg/hC3H8 mass flow rate of a given stream
m H ˙ kg/hH mass flow rate of a given stream
M W C kg/kmolMolecular weight of carbon
M W H kg/kmolMolecular weight of hydrogen
M W O kg/kmolMolecular weight of oxygen
O b i o m a s s kg/hOxygen contained in the biomass
O b i o o i l kg/hOxygen contained in the bio-oil
O c h a r kg/hOxygen contained in the char
O g a s kg/hOxygen contained in the gas
P B P YearsPayback period
Q B U R N E R kWHeat duty produced by the burner
Q D E C O M P kWHeat duty required for the DECOMP block
Q P Y R O L Y S I S kWHeat duty required for the pyrolysis process
Q P Y R O R kWHeat duty required for the PYRO-R block
Q T o t a l kWTotal Heat duty
RtNet cash inflow minus outflows during a single period.
t Number of periods.
Y b i o o i l -Mass fraction of the produced bio-oil (including water)
Y b i o o i l w a t e r -Mass fraction of the produced bio-oil (without water)
Y c h a r -Mass fraction of the produced char
Y g a s -Mass fraction of the produced gas

References

  1. EPA. Global Greenhouse Gas Emissions Data. Available online: https://www.epa.gov/ghgemissions/global-greenhouse-gas-emissions-data (accessed on 17 July 2023).
  2. Chavando, J.A.M.; de Matos, E.C.J.; Silva, V.B.; Tarelho, L.A.; Cardoso, J.S. Pyrolysis characteristics of RDF and HPDE blends with biomass. Int. J. Hydrogen Energy 2021, 47, 19901–19915. [Google Scholar] [CrossRef]
  3. Kaza, S.; Yao, L.C.; Bhada-Tata, P.; Van Woerden, F. What a Waste 2.0: A Global Snapshot of Solid Waste Management to 2050; Urban Development Series; World Bank: Washington, DC, USA, 2018. [Google Scholar]
  4. Kaur, S. Public preferences for setting up a biomass power plant to combat open-field burning of rice crop residues: A case study of district Sangrur, Punjab, India. Biomass Bioenergy 2020, 138, 105577. [Google Scholar] [CrossRef]
  5. University of Leeds. Open Burning of Solid Waste Is a Global Threat to Human Health and Safety That Requires Urgent Action. Available online: https://phys.org/news/2021-01-solid-global-threat-human-health.html (accessed on 19 April 2024).
  6. Wiedinmyer, C.; Yokelson, R.J.; Gullett, B.K. Global emissions of trace gases, particulate matter, and hazardous air pollutants from open burning of domestic waste. Environ. Sci. Technol. 2014, 48, 9523–9530. [Google Scholar] [CrossRef] [PubMed]
  7. Our World in Data. CO2 Emissions. Available online: https://ourworldindata.org/co2-emissions (accessed on 19 April 2024).
  8. The World Bank Group. Trends in Solid Waste Management. Available online: https://datatopics.worldbank.org/what-a-waste/trends_in_solid_waste_management.html (accessed on 8 July 2024).
  9. Li, P.; Wang, B.; Hu, J.; Zhang, Y.; Chen, W.; Chang, C.; Pang, S. Research on the kinetics of catalyst coke formation during biomass catalytic pyrolysis: A mini review. J. Energy Inst. 2023, 110, 101315. [Google Scholar] [CrossRef]
  10. EUR-Lex. Consolidated Text: Directive (EU) 2018/2001 of the European Parliament and of the Council of 11 December 2018 on the Promotion of the Use of Energy from Renewable Sources. Available online: https://eur-lex.europa.eu/legal-content/EN/TXT/?uri=uriserv:OJ.L_.2018.328.01.0082.01.ENG (accessed on 17 May 2024).
  11. Pacheco-López, A.; Lechtenberg, F.; Somoza-Tornos, A.; Graells, M.; Espuña, A. Economic and Environmental Assessment of Plastic Waste Pyrolysis Products and Biofuels as Substitutes for Fossil-Based Fuels. Front. Energy Res. 2021, 9, 676233. [Google Scholar] [CrossRef]
  12. Liu, Z.; Wang, S.; Ouyang, Y. Reliable Biomass Supply Chain Design under Feedstock Seasonality and Probabilistic Facility Disruptions. Energies 2017, 10, 1895. [Google Scholar] [CrossRef]
  13. Mateus, M.M.; Cecílio, D.; Fernandes, M.C.; Correia, M.J.N. Refuse derived fuels as an immediate strategy for the energy transition, circular economy, and sustainability. Bus. Strat. Environ. 2023, 32, 3915–3926. [Google Scholar] [CrossRef]
  14. Shahbaz, M.; AlNouss, A.; Ghiat, I.; Mckay, G.; Mackey, H.; Elkhalifa, S.; Al-Ansari, T. A comprehensive review of biomass based thermochemical conversion technologies integrated with CO2 capture and utilisation within BECCS networks. Resour. Conserv. Recycl. 2021, 173, 105734. [Google Scholar] [CrossRef]
  15. IEA Bioenergy. Review of Waste to Energy Policies in South Africa and International Comparisons. Available online: https://www.ieabioenergy.com/wp-content/uploads/2023/05/Task-36-Waste-to-Energy-Policy-Review_2023final-2.pdf (accessed on 4 May 2024).
  16. Livingston, W.R.; Babcock, M. Technical and Economic Assessment of Energy Conversion Technologies for MSW; U.S. Department of Energy Office of Scientific and Technical Information: Oak Ridge, TN, USA, 2002. [Google Scholar]
  17. Ramos, A.; Monteiro, E.; Silva, V.; Rouboa, A. Co-gasification and recent developments on waste-to-energy conversion: A review. Renew. Sustain. Energy Rev. 2018, 81, 380–398. [Google Scholar] [CrossRef]
  18. Shah, H.H.; Amin, M.; Iqbal, A.; Nadeem, I.; Kalin, M.; Soomar, A.M.; Galal, A.M. A review on gasification and pyrolysis of waste plastics. Front. Chem. 2023, 10, 960894. [Google Scholar] [CrossRef]
  19. Rawat, J.; Saxena, J.; Sanwal, P. Biochar: A Sustainable Approach for Improving Plant Growth and Soil Properties. In Biochar—An Imperative Amendment for Soil and the Environment; IntechOpen: London, UK, 2019. [Google Scholar] [CrossRef]
  20. Santos, S.M.; Assis, A.C.; Gomes, L.; Nobre, C.; Brito, P. Waste Gasification Technologies: A Brief Overview. Waste 2022, 1, 140–165. [Google Scholar] [CrossRef]
  21. Solis, M.; Silveira, S. Technologies for chemical recycling of household plastics—A technical review and TRL assessment. Waste Manag. 2020, 105, 128–138. [Google Scholar] [CrossRef] [PubMed]
  22. Fahmy, T.Y.A.; Fahmy, Y.; Mobarak, F.; El-Sakhawy, M.; Abou-Zeid, R.E. Biomass pyrolysis: Past, present, and future. Environ. Dev. Sustain. 2020, 22, 17–32. [Google Scholar] [CrossRef]
  23. Gandidi, I.M.; Susila, M.D.; Mustofa, A.; Pambudi, N.A. Thermal—Catalytic cracking of real MSW into Bio-Crude Oil. J. Energy Inst. 2018, 91, 304–310. [Google Scholar] [CrossRef]
  24. Guo, M.; Wang, K.; Bing, X.; Cheng, J.; Zhang, Y.; Sun, X.; Guan, B.; Yu, J. Pyrolysis of plastics-free refuse derived fuel derived from municipal solid waste and combustion of the char products in lab and pilot scales: A comparative study. Fuel 2024, 359, 130335. [Google Scholar] [CrossRef]
  25. Zhang, Z.; Gora-Marek, K.; Watson, J.S.; Tian, J.; Ryder, M.R.; Tarach, K.A.; López-Pérez, L.; Martínez-Triguero, J.; Melián-Cabrera, I. Recovering waste plastics using shape-selective nano-scale reactors as catalysts. Nat. Sustain. 2019, 2, 39–42. [Google Scholar] [CrossRef]
  26. Elordi, G.; Olazar, M.; Lopez, G.; Artetxe, M.; Bilbao, J. Product yields and compositions in the continuous pyrolysis of high-density polyethylene in a conical spouted bed reactor. Ind. Eng. Chem. Res. 2011, 50, 6650–6659. [Google Scholar] [CrossRef]
  27. Dong, R.; Tang, Z.; Song, H.; Chen, Y.; Wang, X.; Yang, H.; Chen, H. Co-pyrolysis of vineyards biomass waste and plastic waste: Thermal behavior, pyrolytic characteristic, kinetics, and thermodynamics analysis. J. Anal. Appl. Pyrolysis 2024, 179, 106506. [Google Scholar] [CrossRef]
  28. Liu, J.; Zhang, Z.; Zhang, M.; Kaya, M.G.A.; Wang, F.; Tang, K. Co-pyrolysis of chrome-tanned leather shavings with wheat straw: Thermal behavior, kinetics and pyrolysis products. Energy 2024, 301, 131733. [Google Scholar] [CrossRef]
  29. Pio, D.; Tarelho, L.; Tavares, A.; Matos, M.; Silva, V. Co-gasification of refused derived fuel and biomass in a pilot-scale bubbling fluidized bed reactor. Energy Convers. Manag. 2020, 206, 112476. [Google Scholar] [CrossRef]
  30. Global Specs. CEN-EN 14774-1. Available online: https://standards.globalspec.com/std/1216262/en-14774-1 (accessed on 17 May 2024).
  31. Global Specs. BSI-BS EN 15414-3. Available online: https://standards.globalspec.com/std/1312754/bs-en-15414-3 (accessed on 17 May 2024).
  32. Global Specs. BSI-BS DD CEN/TS 14775. Available online: https://standards.globalspec.com/std/799079/bs-dd-cen-ts-14775 (accessed on 17 May 2024).
  33. Global Specs. BSI-BS EN 15403. Available online: https://standards.globalspec.com/std/1308310/bs-en-15403 (accessed on 17 May 2024).
  34. Global Specs. DIN CEN/TS 15148. Available online: https://standards.globalspec.com/std/1323516/din-cen-ts-15148 (accessed on 17 May 2024).
  35. Global Specs. BSI-BS EN 15402. Available online: https://standards.globalspec.com/std/1307862/bs-en-15402 (accessed on 17 May 2024).
  36. Haydary, J. Chemical Process Design and Aspen Plus and Aspen HYSYS Applications; General Procedure for Process Simulation; John Wiley & Sons: Hoboken, NJ, USA, 2019; pp. 15–58. [Google Scholar]
  37. Wang, S.; Wang, Y.; Shi, Z.; Sun, K.; Wen, Y.; Niedzwiecki, L.; Pan, R.; Xu, Y.; Zaini, I.N.; Jagodzińska, K.; et al. Van Krevelen diagrams based on machine learning visualize feedstock-product relationships in thermal conversion processes. Commun. Chem. 2023, 6, 273. [Google Scholar] [CrossRef] [PubMed]
  38. Ben, H.; Wu, F.; Wu, Z.; Han, G.; Jiang, W.; Ragauskas, A.J. A Comprehensive Characterization of Pyrolysis Oil from Softwood Barks. Polymers 2019, 11, 1387. [Google Scholar] [CrossRef] [PubMed]
  39. Lin, X.; Kong, L.; Cai, H.; Zhang, Q.; Bi, D.; Yi, W. Effects of alkali and alkaline earth metals on the co-pyrolysis of cellulose and high density polyethylene using TGA and Py-GC/MS. Fuel Process. Technol. 2019, 191, 71–78. [Google Scholar] [CrossRef]
  40. Voima, V. Pioneer of Biofuel Plants, Producer of Combined Heat and Power. Available online: https://www.vv.fi/wp-content/uploads/sites/8/2017/03/Vaskiluodon_Voima_ENG_FINAL.pdf (accessed on 17 May 2024).
  41. Li, L.; Bai, X.; Qu, C.; Zhou, K.; Sun, Y. Effects of Moisture on the Ignition and Combustion Characteristics of Lignite Particles: Modeling and Experimental Study. ACS Omega 2022, 7, 34912–34920. [Google Scholar] [CrossRef] [PubMed]
  42. Lestinsky, P.; Palit, A. Wood Pyrolysis Using Aspen Plus Simulation and Industrially Applicable Model. Geosci. Eng. 2016, 62, 11–16. [Google Scholar] [CrossRef]
  43. Puig-Gamero, M.; Pio, D.; Tarelho, L.; Sánchez, P.; Sanchez-Silva, L. Simulation of biomass gasification in bubbling fluidized bed reactor using aspen plus®. Energy Convers. Manag. 2021, 235, 113981. [Google Scholar] [CrossRef]
  44. No, S.Y. Bio-oil and pyrolytic oil. Green Energy Technol. 2019, 181–219. [Google Scholar] [CrossRef]
  45. Cai, W.; Wang, X.; Zhu, Z.; Kumar, R.; Amaniampong, P.N.; Zhao, J.; Hu, Z.-T. Synergetic effects in the co-pyrolysis of lignocellulosic biomass and plastic waste for renewable fuels and chemicals. Fuel 2023, 353, 129210. [Google Scholar] [CrossRef]
  46. Riedewald, F.; Patel, Y.; Wilson, E.; Santos, S.; Sousa-Gallagher, M. Economic assessment of a 40,000 t/y mixed plastic waste pyrolysis plant using direct heat treatment with molten metal: A case study of a plant located in Belgium. Waste Manag. 2021, 120, 698–707. [Google Scholar] [CrossRef]
  47. Procurement Resource. Pyrolysis Oil Prices: Latest Price, Pricing, Chart, Market Analysis. Available online: https://www.procurementresource.com/resource-center/pyrolysis-oil-price-trends (accessed on 1 May 2024).
  48. OPEC. OPEC Monthly Oil Market Report. 2023. Available online: https://www.opec.org/opec_web/static_files_project/media/downloads/publications/OPEC_MOMR_June_2023.pdf (accessed on 1 May 2024).
  49. EPA. Full Cost Accounting for Municipal Solid Waste Management: A Handbook; EPA: Washington, DC, USA, 1997. [Google Scholar]
  50. EEA. Early Warning Assessment Related to the 2025 Targets for Municipal Waste and Packaging Waste. June 2022. Available online: https://www.eea.europa.eu/publications/many-eu-member-states/early-warning-assessment-related-to (accessed on 2 January 2024).
  51. Statista. U.S. Biomass Feedstock Prices by Product 2023. Available online: https://www.statista.com/statistics/856660/biomass-feedstock-prices-in-the-us-by-product/ (accessed on 4 May 2024).
  52. Cardoso, J.S.; Silva, V.; Chavando, J.A.M.; Eusébio, D.; Hall, M.J.; Costa, M. Small-Scale Biomass Gasification for Green Ammonia Production in Portugal: A Techno-Economic Study. Energy Fuels 2021, 35, 13847–13862. [Google Scholar] [CrossRef]
Figure 1. MSW generation forecast [8].
Energies 17 03526 g001
Figure 2. Pyrolysis experimental setup.
Energies 17 03526 g002
Figure 3. Aspen Plus schematics.
Energies 17 03526 g003
Figure 4. Heat self—sufficient pyrolysis process.
Energies 17 03526 g004
Figure 5. Products’ LHV.
Energies 17 03526 g005
Figure 6. Pyrolysis energy consumption.
Energies 17 03526 g006
Table 1. Thermochemical technologies and TRL.
TechnologyT °CAdvantagesDisadvantagesTRLREF
Combustion1000–1300
  • Well-known process
  • Cheaper than other thermochemical processes
  • High-efficiency gas-phase incineration requires a secondary combustion chamber, a heat recovery boiler, and significant investment in back-end equipment.
  • Concerns about solid residue disposal and dioxin releases from conventional incineration plants persist.
9[16]
Gasification700–1200
  • Detailed polymer breakdown to hydrogen and methane, etc.
  • Established tech.
  • Pure oxygen gasification produces syngas that is practically nitrogen-free.
  • The product gas requires improvement in quality before it is further used.
  • Requires high feedstock volumes to be feasible.
  • Tars and char in product gas
  • Pure oxygen gasification requires oxygen separation from air, which is very cost-intensive
6–9[20]
Pyrolysis300–700
  • Suitable for hard-to-depolymerize waste plastics.
  • Complex Reactions
  • High energy needs
  • Low PVC tolerance
  • Frequently upgraded products
6–9[21]
Table 2. Biomass specification [29].
DescriptionRDF PelletsPine Chips
Proximate Analysis
Moisture (wt.%, wet basis)4.3011.00
Volatile Matter (wt.%, wet basis)75.2077.90
Fixed Carbon (wt.%, wet basis)7.1010.80
Ash (wt.%, wet basis)13.400.30
Moisture (wt.%, dry basis)4.3011.00
Volatile Matter (wt.%, dry basis)78.5887.53
Fixed Carbon (wt.%, dry basis)7.4212.13
Ash (wt.%, dry basis)14.000.34
Ultimate Analysis
Ash (wt.%, dry basis)14.000.34
C (wt.%, dry basis)54.0046.40
H (wt.%, dry basis)7.406.60
N (wt.%, dry basis)0.500.20
O (wt.%, dry basis)24.1046.46
Table 3. Equipment description.
EquipmentTypeReactor
PYRO-RStoichiometric reactorIt is a stochiometric reactor that decomposed biomass into pyrolytic compounds using an Excel subroutine based on the obtained experimental data and a mass balance. Depending on the simulation, it operated at 450, 500, or 550 °C and 1 bar.
DECOMPRyield reactorIt decomposes the char in their elemental components C, H, O, and N.
BURNERRGibbsIt produces a combustion reaction of the non-condensable gases and the decomposed char. This reactor solves its model by minimizing Gibbs free energy.
COOLER 1Heat exchangerIt reduces the temperature of the gases to be further separated into the non-condensable and condensable gases.
COOLER 2Heat exchangerIt reduces the temperature of hot gases produced in the combustion.
SEPSeparatorIt separate the non-condensable gases from the condensable ones
ENERGY-CMixerIt combines energy streams to provide an energy balance
Table 4. Input experimental mass yields.
RunSolidLiquidGasσ
Solid
σ
Liquid
σ
Gas
E01-450°C-RDF0%27.91%54.40%17.69%0.71.21.8
E03-450°C-RDF25%29.52%50.98%19.50%1.01.01.9
E04-500°C-RDF0%24.73%58.16%17.11%0.62.31.9
E06-500°C-RDF25%27.11%53.43%19.46%0.71.81.4
E07-550°C-RDF0%24.57%56.98%18.46%0.91.01.1
E09-550°C-RDF25%26.67%51.44%21.89%0.71.01.0
Table 5. Input experimental gas composition (% vol).
RunH2CH4COCO2C2H4C2H6C3H8
E01-450°C-RDF0%0.67%7.70%40.89%49.01%0.59%0.85%0.29%
E03-450°C-RDF25%0.84%7.27%34.37%54.55%0.94%1.25%0.77%
E04-500°C-RDF0%1.20%9.44%40.04%47.15%0.71%1.10%0.36%
E06-500°C-RDF25%2.20%11.54%35.38%46.87%1.26%1.81%0.95%
E07-550°C-RDF0%3.55%13.41%39.33%41.06%0.82%1.42%0.40%
E09-550°C-RDF25%3.37%13.01%38.51%41.69%1.20%1.55%0.67%
Table 6. Input experimental data of the proximate analysis of char.
ExperimentMoistureVMFCAshes
E01-450°C-RDF0%3.05%29.81%69.11%1.07%
E03-450°C-RDF25%2.53%28.51%60.51%10.98%
E04-500°C-RDF0%2.25%27.92%70.80%1.27%
E06-500°C-RDF25%2.45%22.93%63.93%13.14%
E07-550°C-RDF0%2.65%15.73%82.82%1.45%
E09-550°C-RDF25%2.66%19.95%68.49%11.56%
Table 7. Experimental results vs. simulation results.
ExperimentalSimulation
RunSolid *Liquid *Gas *Gas lhv
MJ/m3
Solid *Liquid *Gas *Gas LHV
MJ/m3
E01-450°C-RDF0%27.91%54.40%17.69%8.4327.91%54.40%17.69%9.51
E03-450°C-RDF25%30.10%50.01%19.89%8.3929.52%50.98%19.50%8.64
E04-500°C-RDF0%24.73%58.16%17.11%9.2324.73%58.16%17.11%9.51
E06-500°C-RDF25%27.89%52.09%20.02%10.7127.11%53.43%19.46%11.03
E07-550°C-RDF0%24.57%56.98%18.46%10.9824.57%56.98%18.46%11.31
E09-550°C-RDF25%27.03%50.78%22.19%11.2426.67%51.44%21.89%11.58
* Mass.
Table 8. Char Elemental Composition Aspen Plus (mass fraction).
ExperimentCHONAshLHV
MJ/kg
E01-450°C-RDF0%0.4210.0760.4870.0060.01137.587
E03-450°C-RDF25%0.5500.0830.2400.0080.11950.703
E04-500°C-RDF0%0.4320.0700.4780.0070.01237.761
E06-500°C-RDF25%0.5540.0760.2330.0090.12850.703
E07-550°C-RDF0%0.4320.0680.4800.0070.01237.547
E09-550°C-RDF25%0.5410.0800.2370.0090.13252.703
Table 9. Liquid composition.
ExperimentH2OC5H6O2C6H6C7H16LHV (MJ/kg)
E01-450°C-RDF0%0.3500.5260.0440.08014.52
E03-450°C-RDF25%0.3370.5630.0000.10015.34
E04-500°C-RDF0%0.3500.5510.0170.08214.66
E06-500°C-RDF25%0.3320.5650.0000.10315.57
E07-550°C-RDF0%0.3500.5630.0040.08314.73
E09-550°C-RDF25%0.3410.5580.0000.10115.15
Table 10. Energy balance.
Experiments *Heat Duty
Required by the Pyrolysis Process
kW
Heat Duty **
Produced by the Burner.
kW
Q T o t a l
kW
Energy Excess
kW/kg
E01-450°C-RDF0%12.98−14.53−1.55−0.155
E03-450°C-RDF25%12.20−17.50−5.30−0.530
E04-500°C-RDF0%12.45−13.21−0.76−0.076
E06-500°C-RDF25%12.14−16.57−4.43−0.443
E07-550°C-RDF0%12.80−13.75−0.95−0.095
E09-550°C-RDF25%12.24−17.03−4.79−0.479
* Mass flowrate = 10 kg/h, ** Considering 85% of efficiency.
Table 11. Scenarios for the economic analysis.
ParameterDescriptionScenario 1
Optimistic
Scenario 2
Conservative
Scenario 3
Tragic
IncomeBio-Oil price (€/ton)818715500
MSW Landfilled Tax (€/ton)792511
ExpensesCAPEX [46]€20,190,000.00 €20,190,000.00 €20,190,000.00
OPEX (per year) [46]€3,425,414.00 €3,425,414.00 €3,425,414.00
Biomass cost (€/ton)405060
Amortization (€/year)3,028,5003,028,5003,028,500
Economic parametersDiscount rate151515
Evaluation period (years)202020
ProductionPlant production (€/ton)40,000 40,000 40,000
Bio-Oil Yield (Without water) 0.3520.3520.352
Table 12. EU MSW assessment [50].
EU Country Tax (€/ton Waste Landfilled)MSW Generation 2020
Lower LevelUpper LevelAnnual MSW Generation
(Million Tons)
Annual
kg/Person
Landfilled
%
Incinerated
%
Recycled, Composted/Digested
%
Denmark79795.0 8450.945.253.9
Luxemburg000.5 7903.843.253.0
Malta000.3 64382.50.010.5
Germany0052.66320.033.067.0
Cyprus000.5 609671.531.5
Finland70703.0 5960.557.941.6
Austria **30305.2 5882.03858.0
Ireland ***75752.755531.836.731.5
Czechia40405.8 54347.712.639.7
France254236.1 53718.138.142.7
Netherlands37379.0 5341.441.856.8
Greece **25255.652477.71.321.0
Portugal25255.3 5134719.034.0
Italy **52630.0 50320.920.059.1
Lithuania50501.3548316.325.957.8
Latvia95950.9 47852.83.044.2
Slovenia11111.0 4576.713.173.7
Spain304021.5 45552.012.036.0
Slovakia11332.443349.77.942.2
Sweden55554.6 4311.053.046.0
Croatia001.741855.70.044.3
Belgium631145.0 41643.01.056.0
Bulgaria *50502.9 407617.032.0
Hungary17173.940354.00.046.0
Estonia30300.5 38314.742.842.5
Poland156013.134639.821.538.7
EU Average 505
* Information from 2018, ** 2019 *** estimated.
Table 13. Economic analysis scenarios.
Financial ParametersScenario 1
Optimistic
Scenario 2
Conservative
Scenario 3
Tragic
PBP7.5--
NPVEUR 8,944,505.51EUR −5,390,865.80EUR −27,093,219.89
IRR22.67%9.96%-
Disclaimer/Publisher’s Note: The statements, opinions and data contained in all publications are solely those of the individual author(s) and contributor(s) and not of MDPI and/or the editor(s). MDPI and/or the editor(s) disclaim responsibility for any injury to people or property resulting from any ideas, methods, instructions or products referred to in the content.

