Abstract
The increasing global water pollution leads to the need for urgent development of rapid and accurate water quality monitoring methods. Microbial fuel cells (MFCs) have emerged as real-time biosensors for biochemical oxygen demand (BOD), but they grapple with several challenges, including issues related to reproducibility, operational stability, and cost-effectiveness. These challenges are substantially shaped by the selection of an appropriate air-breathing cathode. Previous studies indicated a critical influence of the cathode on both the enduring electrochemical performance of MFCs and the taxonomic diversity at the electroactive anode. However, the effect of different gas diffusion electrodes (GDE) on 3D-printed single-chamber MFCs for BOD biosensing application and its effect on the bioelectroactive anode was not investigated before. Our study focuses on comparing GDE cathode materials to enhance MFC performance for precise and rapid BOD analysis in wastewater. We examined for over 120 days two Pt-coated air-breathing cathodes with distinct carbonaceous gas diffusion layers (GDLs) and catalyst layers (CLs): cost-effective carbon paper (CP) with hand-coated CL and more expensive woven carbon cloth (CC) with CL pre-applied by the supplier. The results show significant differences in electrochemical characteristics and anodic biofilm composition between MFCs with CP and CC GDE cathodes. CP-MFCs exhibited lower sensitivity (16.6 C L mg−1 m−2) and a narrower dynamic range (25 to 600 mg L−1), attributed to biofouling-related degradation of the GDE. In contrast, CC-MFCs demonstrated superior performance with higher sensitivity (37.6 C L mg−1 m−2) and a broader dynamic range (25 to 800 mg L−1). In conclusion, our study underscores the pivotal role of cathode selection in 3D-printed MFC biosensors, influencing anodic biofilm enrichment time and overall BOD assessment performance. We recommend the use of cost-effective CP GDL with hand-coated CL for short-term MFC biosensor applications, while advocating for CC GDL supplied with CL as the preferred choice for long-term sensing implementations with enduring reliability.
1. Introduction
Water scarcity is a global challenge that affects 10% of the world’s population. Water use has increased and is globally driven by population growth and socioeconomic development, accelerating climate change and water pollution [1]. To alleviate water stress, wastewater treatment presents an efficient solution for purifying wastewater and recycling the treated effluent. The effective monitoring of wastewater treatment plant performance hinges on the measurement of the concentration of total organic biodegradable pollutants within the wastewater, known as biochemical oxygen demand (BOD). However, the current gold standard BOD measurement method, the BOD5 test, is a time-consuming and complex analysis that cannot be implemented for real-time process monitoring [2]. As a result, there is a growing need for reliable and real-time BOD measurement methods. This advancement would significantly optimize wastewater treatment processes, enabling the timely detection of potential contamination spikes within the plant and serving as a validation tool, confirming the proper execution of the treatment process [3]. Microbial fuel cell (MFC)-based biosensors have emerged as real-time, self-powered and easy-to-use systems for BOD measurement in wastewater, displaying excellent operation stability and performance for more than five years with minimal maintenance [4,5,6,7,8,9]. In recent years, substantial advancements have been achieved in the primary components of biosensors, including the anode, cathode, and overall architecture. These efforts have concentrated on optimizing sensitivity, lowering the detection limits, and improving user-friendliness to facilitate the early detection of organic pollutants [10,11,12]. Among all the MFC configurations, single-chamber configuration is the most used for its simplicity and the absence of a constant catholyte supply [13,14]. Figure 1 shows a schematic representation of single-chamber MFC, consisting of the following components: (i) A bioanode electrode placed inside the main reactor compartment. This electrode hosts an electroactive bacteria community on its surface that acts as a catalyst for the oxidation of organic biodegradable pollutants in wastewater. For example, when acetate is oxidized at the anode, the reaction is 2HCO3− + 9H+ + 8e− → CH3COO− + 4H2O, E° = −0.296 V, pH = 7 [15]. (ii) An air-diffusion cathode electrode, located on one of the sides of the reactor and exposed to air. In this electrode, the gaseous oxygen coming from the air is used as the electron acceptor. It reacts with the protons in the electrolyte and is reduced to water in the so-called “oxygen reduction reaction” (ORR). When the main compartment (the anodic chamber) is fed with solutions containing biodegradable compounds (such as wastewater), a potential difference proportional to the amount of biodegradable molecules oxidized by the electroactive biofilm arises between both electrodes. By connecting an external load between the electrodes, an electric current can flow. This electrical signal serves as an indirect measurement of the presence of organic pollutants in the wastewater. In essence, the MFC’s ability to generate electricity is influenced by the level of organic pollutants present in the wastewater being treated [5].
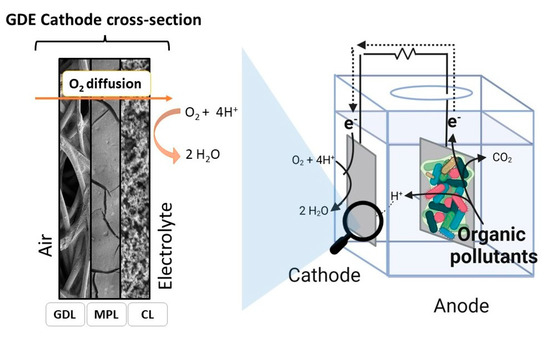
Figure 1.
Schematic representation of the configuration of the single-chamber microbial fuel cell (MFC)-based biosensor used in this study. The figure includes a zoomed-in cross-sectional view of the gas diffusion electrode (GDE) cathode, which comprises three layers: the gas diffusion layer (GDL), microporous layer (MPL), and catalyst layer (CL).
The gas diffusion electrode (GDE) is an electrode where ORR occurs (i.e., O2 + 2H2O + 4e− → 4OH−, E° = 0.815 V, pH = 7). GDE cathodes have a significant impact on MFC systems’ performance because ORR kinetics are a limiting factor for current generation in MFCs [14,16]. However, owing to their superior environmental performance compared to two-chamber MFCs, attributed to the elimination of the need for catholyte supply and replacement, there has been a concerted effort to advance air cathodes. The objective is to optimize ORR performance, encompassing swift ORR kinetics, effective electrolyte–air contact, long-term operational stability, and cost-efficiency [17,18]. GDE usually consists of several layers of different materials:
- A catalyst layer (CL) in contact with the electrolyte, usually made of precious metals such as Pt, which decreases the activation energy of ORR.
- A microporous layer (MPL) is usually made of conductive ink, which acts as a microporous support for the CL, preventing flooding and biofilm penetration [19].
- A gas diffusion layer (GDL), which is the scaffolding of the electrode, is placed in direct contact with the air. It is generally made of conductive carbon-based materials with a hydrophobic treatment, which ensures oxygen diffusion without the electrolyte leaking through to the air-facing side of the GDE [19]. The most used carbonaceous GDLs for MFC-biosensing applications are carbon paper (CP) [20,21,22,23] and carbon cloth (CC) [9,24,25,26,27] due to their wide availability, reasonable cost, mechanical strength, thermal stability, and easiness of CL coating. [19,28,29,30].
In general, the main environmental factors that affect air cathode performance (i.e., ORR kinetics) are the solution pH and the oxygen concentration at the catalyst surfaces [31]. The pH of the electrolyte (in this case wastewater) depends on the type of GDE used. A slow ORR performance leads to a pH gradient in the main chamber since the protons generated from the metabolism of microorganisms are not consumed in the ORR; this pH gradient can influence the development of the anodic microbial community [32]. The concentration of dissolved oxygen that permeates through the GDE (or the case of the reactor) influences the balance of aerobic to anaerobic bacteria [33]. This balance is crucial for catalyzing the substrate at the anode. Excess oxygen could compete with the anode as an electron acceptor, resulting in a decrease in the coulombic efficiency of the system [34]. Furthermore, the higher catalytic efficiency of the cathode increases the current production and cell open circuit potential (OCP), which creates a more favorable electrochemical gradient and encourages bacteria to increase the extracellular electron transfer (EET). This effect on the anode surface modulates the microbial community formation [35,36]. Cathode performance can therefore significantly influence the anodic microbial composition of the catalytic biofilm that culminates in a distinct electrical output and the internal resistance of the MFC [37]. Recent research has consistently aimed to enhance the materials and designs employed in MFC-based technologies, primarily targeting power generation [24,38,39,40,41,42]. Nonetheless, there is a significant lack of insight into how GDE cathodes influence 3D-printed MFC-based biosensors, specifically regarding their effect on the system’s biosensing performance, including sensitivity and dynamic range. Additionally, the impact of various GDEs on the development and composition of the electroactive microbial community at the anode remains an unexplored area in the field of biosensing applications. Moreover, while there have been numerous studies focusing on MFC-based biosensors with commercial Pt/C-based GDE cathodes [9,20,21,22,23,24,25,26], making direct comparisons between these studies is challenging due to the multitude of variables affecting MFC performance. These variables encompass the type of feedstock used, the nature of the anodic microbial biofilm, its metabolic processes and EET mechanism involved, the geometric design and shape of the electrodes, the materials used for cell construction including the type of membrane, and the external resistance used to discharge the MFC [43,44,45].
The objective of this research is to conduct a comprehensive comparison of the effects of different GDE materials (commercial CC with a CL pre-applied by the supplier and CP with a hand-coated CL) on the performance of 3D-printed MFC-based biosensors for monitoring the BOD of wastewater. This study is divided into two main phases: the first phase is focused on attaining stability in the current signal, which is the primary output of the biosensor, during the maturation of the anodic biofilm, while the second phase centers on the biosensing capabilities and operational stability of the MFCs. Throughout both phases, there was an emphasis on evaluating the performance of the air-cathode and its influence on both the signal stability and the biosensing efficacy of the system. Three different approaches were used to study the effect of CC and CP GDEs: (i) an examination of the electrochemical performance of the MFCs via chronoamperometry, polarization curve, and cyclic voltammetry techniques; (ii) an evaluation of GDE’s influence on the development and composition of the electroactive community at the anode; and (iii) air-cathode surface analyses through scanning electron microscopy (SEM) before and after the 120-day study period. The findings from this study are expected to offer valuable insights into the selection of GDE cathodes for future research in the field of MFC-based biosensing, contributing to advancements in this promising technology.
2. Materials and Methods
Unless otherwise stated, all the reagents were purchased from Fischer Scientific (Loughborough, UK) or Sigma-Aldrich (Gillingham, UK). All experiments were conducted at a temperature of 21 ± 2 °C.
2.1. Set-Up and Operation Mode of the 3D-Printed MFC-Based Biosensor
Ten single-chamber MFCs with air-breathing cathodes were built to carry out this experiment. The MFCs consisted of a cube (5 × 5 × 5 cm) with a 30 mL cylindrical chamber positioned in the middle of the cubic chamber and two plates to close the ends of the reactor, one filled and the other with a circular hole (3 cm diameter) in the center for the air-cathode side (Figure S1). The reactor was assembled by adding custom-made silicon gaskets in between the plates and the main body of the reactor to avoid leaks. The external chassis of the reactor was made of Co-Polyester + (Ultimaker, Utrecht, The Netherlands) and built using a 3D printer (Ultimaker 3, Ultimaker B.V, Utrecht, The Netherlands). The anode was prepared using a 2 × 3 cm piece of carbon felt (6.35 mm thick, 99.0%, Alfa Aesar, Lancashire, UK) connected to a titanium wire (The CrazyWire Company, Warrington, UK), which was used to connect the circuit to an external load (REx) of 1 kΩ [8,26,41,46]. The selected resistance is lower than the internal resistance (discussion in Section 3.3), ensuring high current production without being low enough to induce signal noise or voltage reversal [8,47]. GDE cathodes consist of three layers: a catalyst layer, a microporous layer, and a catalyst layer, as illustrated in Figure 1. The GDEs were either a CC electrode (W1S1011) supplied with 0.5 mgPt cm−2 loading (Pt(60% w/w)/Vulcan-C) (FuelCell Store, Bryan, USA) or CP electrode (Freudenberg H23C6) (FuelCell Store, TX, USA) hand-coated with 0.5 mgPt cm−2 (Pt(10% w/w)/activated carbon ca. 50% moisture purchased from Thermo Fisher Scientific, Paisley, UK). Both were equipped with MPL. The CL of the CP GDE was prepared as reported in previous studies, mixing 0.83 µL of DI water, 6.67 µL of Nafion ionomer, and 3.3 µL of isopropanol per 1 mg of Pt/C [14]. The CP-GDE exhibits a lower thickness of the GDL and MPL (250 μm), compared to CC-GDE (410 μm). The thickness of the CL was measured using scanning electron microscopy as described in paragraph 2.6, revealing that the CL of CP-GDL (~96 μm) is significantly thicker than that of CC-GDL (~3 μm). Of the 10 reactors, 5 were built with CP and 5 with the CC GDE cathode. In both sets of MFCs, 4 were inoculated with electroactive bacteria and considered replicates and 1 was a sterile control. The anolyte consisted of sterile minimal medium (1 g L−1 NH4Cl; 0.2 g L−1 MgSO4.7H2O; 0.001 g L−1 FeSO4.7H2O; 0.001 g L−1 CaCl2; 0.5 g L−1 K2HPO4; 0.005 g L−1 yeast extract) containing various concentrations of Na-acetate (pH = 7.2 ± 0.2, conductivity = 1.0 ± 0.2 mS cm−1) [48]. The concentration of Na-acetate was used to modulate the BOD of the feedstock. The experiment was conducted in fed-batch mode, with the anolyte fully replaced with fresh media at every batch. This procedure was performed inside an anaerobic chamber to maintain anaerobic conditions during the feeding. Oxygen diffusion through the reactor was measured by quantifying the amount of dissolved oxygen in the electrolyte over time by using a Fiber-Optic Oxygen Meter (FireSting O2, PyroScience, Aachen, Germany) and a Pyro Oxygen Logger Software v. 3.31.9 (PyroScience, Aachen, Germany).
2.2. Electroactive Biofilm Formation
The inoculum used in this study was sourced from an acetate-fed MFC, which had been in operation for more than a year and was initially inoculated with sediment from the campus pond (University of Surrey, Guildford, UK), which collects run-off water and has a moderate population of wildfowl and fish. Post collection, the inoculum was centrifuged for 10 min at 4000 rpm (Accuspin 3R, Pendragon Scientific Ltd., Bucks, UK) and resuspended in minimal medium containing 0.6 g L−1 of Na-acetate. The optical density (OD600) was determined with a spectrophotometer (Ultrospec 2000, Pendragon Scientific Ltd., UK) at a wavelength of 600 nm. The final OD600 of the inoculum was 0.5. The MFCs were inoculated with 10% v/v inoculum in minimal medium containing Na-acetate at a concentration of 0.6 g L−1. The anolyte was replaced in its entirety with fresh minimal medium every time the substrate was completely depleted (ca. 1–4 days). The biofilm was considered fully developed when the maximum current produced by the MFCs measured across the 1 kΩ external resistor reached a stable value after three consecutive anolyte replacements. A permissible variation of ±10 μA was allowed between the three measured current values.
2.3. Biosensing Performance
The potential of each MFC was monitored by measuring the voltage across the external resistor of the MFC with a data logger (Keysight 34972A LXI Data Acquisition Switch Unit, Keysight, Wokingham, UK) every 2 min. The oxidation of the Na-acetate at the anode causes an increase in the measured voltage, which is followed by a reduction when Na-acetate is depleted. A correlation between the concentration of substrate in the anolyte and the charge produced was used to build the calibration curve of the biosensor. When calibrating the biosensor, the detection of a specific amount of Na-acetate was tested 3 times in each replicate. Na-acetate concentrations in the anolyte were determined with High Performance Liquid Chromatography (HPLC). Samples were filtered through a 0.22 μm filter and injected in the system Vanquish Core HPLC (Thermo Fisher Scientific Inc., UK) with an Aminex HPX-87H column (300 mm length × 7.8 mm diameter, 9 μm particles size) (Bio-Rad Laboratories Inc., Watford, UK) and a UV detector operating at a wavelength of 210 nm. An isocratic flow of H2SO4 5 mM at a flow rate of 0.3 mL min−1 at 35 °C was used. A calibration curve with ultrapure water and known concentrations of Na-acetate standard was created (R2 > 0.99). The electrical charge, sensitivity, and coulombic efficiency were determined as previously reported by Spurr et al. [49].
2.4. Electrochemical Analysis
The anode, cathode, and cell voltage were measured using Ag/AgCl (3M KCl) as a reference electrode in all reactors using a multimeter (RS Components Ltd., Corby, UK) after replacing the anolyte with fresh minimal media containing 0.6 g L−1 of Na-acetate and leaving the MFCs in OCP for 3 h. The reference electrode was positioned between the anode and cathode in the hole located at the top of the reactor, as shown in Figure S1. The power and polarization curves of the cell were obtained using a potentiostat (PalmSense4, PalmSens, Houten, NL) connected in the two-electrode mode (i.e., anode as working electrode, and cathode as counter electrode and reference electrode) at a scan rate of 0.5 mV s−1. The current density, power density, and internal resistance (RInt) were calculated as previously reported by Logan et al. [15]. The cyclic voltammograms of the anode were obtained in the presence and absence of Na-acetate in the medium. The two conditions are referred to as the turnover and non-turnover mode, respectively. The anode acted as the working electrode, Ag/AgCl (3.5 M aqueous KCl internal solution) as the reference electrode, and the cathode as the counter electrode, at a scan rate of 0.5 mV s−1 for a total of 3 scans.
2.5. Taxonomic Analysis of the Biofilm
Carbon felt fibers were collected from the top and the bottom part of the anode for a total of 50 ± 10 mg and put in a sterile 10 mL tube with 1 mL of Phosphate Buffer Saline (PBS) (8 g L−1 NaCl; 0.2 g L−1 KCl; 1.44 g L−1 Na2HPO4; 0.14 g L−1 H2PO4; pH = 7.4), vortexed for 1 min, centrifuged at 4000 rpm for 5 min (Accuspin 3R, Pendragon Scientific Ltd., Granborough, UK), and resuspended in 500 μL of PBS. The DNA was then extracted using the DNeasy Power Soil Pro Kit (Qiagen, Manchester, UK), quantified using the Nanodrop ND-1000 spectrophotometer (Thermo Fischer Scientific, UK), and submitted to paired-end amplicon sequencing of the 16S rRNA gene’s V3-V4 regions (primers 341F and 806R) with the Illumina NovaSeq 6000 platform (Novogene, Cambridge, UK). The dada2 pipeline v. 1.28 was used to process the data and create Amplicon Sequence Variants (ASV) [50,51]. Diversity analyses (alpha diversity calculation and principal coordinates analysis with weighted unifrac distance) were carried out using the R v. 4.3.3 package phyloseq [52]. Phylogenetic tree construction for unifrac distance calculation was carried out using RaxML-NG v. 1.2.
2.6. Surface Material Analysis
A Hitachi S-3200N SEM operated at 2 kV and 0.1 Na, equipped with an Everhart–Thornley detector (ETD) (Hitachi High-Tech Corporation, Tokyo, Japan) at a working distance of 10 mm, was used to examine the anode electrode’s surface. Anode and cathode samples (0.5 × 0.5 cm) were rinsed with fresh minimal media before being fixed for 15 min with 2 mL of 2.5% glutaraldehyde in PBS. The samples were dehydrated by immersing them in a series of 2 mL of acetone aqueous solutions of increasing concentration of acetone (50%, 70%, 90%, and 100%) for 30 min each before being rinsed three times with Milli-Q water (2 mL). The dehydrated samples were air-dried overnight at 30 °C and coated with 0.3 nm gold particles [53].
3. Results and Discussions
3.1. Correlation of Electroactive Biofilm Formation Time and Type of GDE Cathode
Following the initial inoculation of the microbial fuel cell (MFC) on day 0, the development of the electroactive biofilm was facilitated by consistently feeding the MFC with a minimal medium containing 0.6 mg mL−1 of Na-acetate. The progress of biofilm formation on the anodes in both carbon cloth (CC) and carbon paper (CP) MFCs was tracked by periodically measuring the open circuit potential (OCP) of the anode at various time points (Figure 2), as well as observing the evolution of the current peaks produced by the MFCs after each batch cycle (i.e., upon media replacement). The MFC-based biosensor was deemed stable when it consistently reached a stable peak current output following three consecutive replacements of the anolyte in all experimental replicates (Figure S2). The stabilization of the current peaks is crucial for ensuring the reproducible biosensor’s readings.
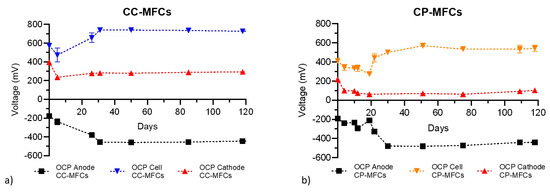
Figure 2.
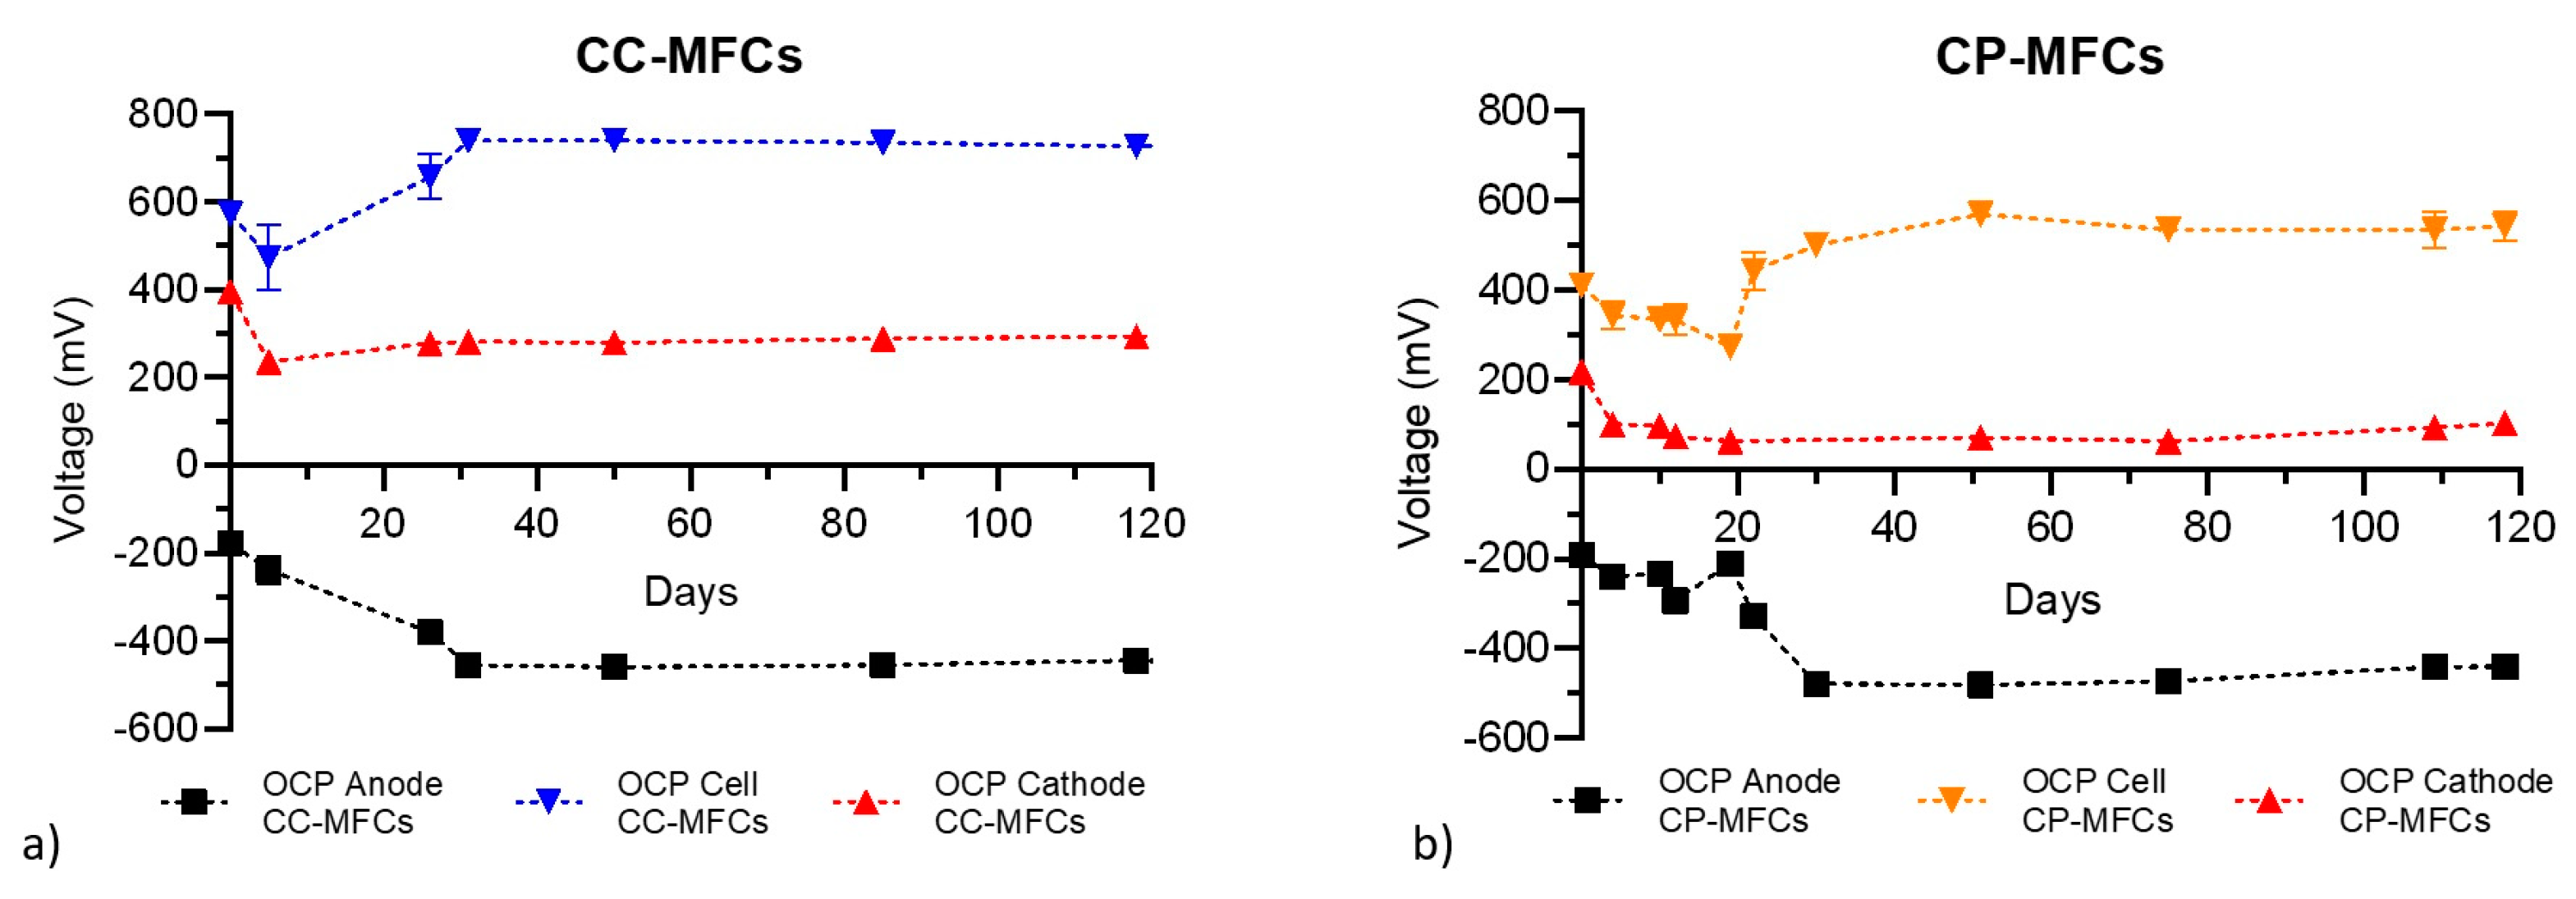
Voltage of the anode (black) and cathode (red) vs. Ag/AgCl RE and cell voltage (blue and orange) over time for (a) CC-MFC and (b) CP-MFC. The measurements are represented as mean of 4 replicates ± Standard Error of the Mean.
The anodic OCP decreased over the first month, during the development of the anodic electroactive biofilm, from −193 ± 2 mV (day 0) to −479 ± 2 mV (day 30) in CC-MFCs and from −177 ± 3 mV (day 0) to −454 ± 4 mV (day 26) in CC-MFCs. These anodic OCP values are within the typical range for a formed and electroactive biofilm in MFCs [34]. The time required for anode OCP stabilization, which is indicative of electroactive biofilm maturation, is comparably similar between CC and CP-MFCs. However, in terms of the current peaks observed with the MFCs connected to a 1 kΩ resistor when maintaining a constant Na-acetate concentration in the media, stable current production was reached on day 55 for the CC-MFCs and on day 34 for the CP-MFCs (Figure S2). This observation indicates that after anode OCP stabilization, current production increased at every batch in both CC and CP-MFCs, suggesting the existence of additional factors that impact current generation, such as the better acclimatization of the biofilm to the operational conditions, resulting in improved microbial metabolic activity and electron transfer efficiency, ultimately leading to an increased current generation, despite a constant anodic OCP [54]. Previous studies on a similar MFC configuration have documented similar outcomes in terms of the maximum current produced across the external resistance and biofilm formation time, as shown in Table 1. The difference in the stabilization time of anodic OCP observed between MFCs equipped with different cathodes (CC and CP GDE) can be attributed to diverse biofilm development and composition (discussion in Section 3.5), which was also observed in previous studies focused on MFC for power production [35,36,37]. Such differences are attributed to variations in the environmental conditions within the MFC; the GDE cathode influences crucial factors such as pH levels and the concentration of dissolved oxygen in the electrolyte, which are dependent on the type and kinetics of the oxygen reduction reaction (ORR) at the cathode [31]. However, our observations showed no significant differences in the pH values of the electrolyte solution at the end of each batch (stable at 7.3 ± 0.5 in both CC and CP-MFCs). Also, the measured amount of dissolved O2 in the anolyte showed no significant differences between CP and CC-MFCs (Figure S3). The percentage of dissolved O2 in the anolyte reached approximately 80% after 24 h, indicating the substantial permeation of O2 through the 3D-printed reactors. This suggests that the sole variable distinguishing the two sets of experiments and, therefore, having an effect on the anodic biofilm development was the performance of the cathode, which varied between the CP and CC-MFCs, as discussed in Section 3.3. Enhanced cathode performance leads to a greater electrochemical potential difference between the anode and cathode. A greater potential gradient has been observed to affect biofilm activity and composition in dual manners: it motivates bacteria to oxidize organic matter and enhances EET and drives the selection of electroactive bacterial species [35,55].

Table 1.
Performance comparison of MFC biosensors for BOD with similar architecture.
Variations in the stabilization of the maximum current peak are attributed not only to differences in biofilm development and composition but also to cathodic electrochemical constraints, as detailed in the electrochemical analyses section. These limitations restrict the peak current in CP-MFCs to 130 ± 6 μA (108 ± 9 mA m−2), in contrast to 365 ± 13 μA (304 ± 11 mA m−2) in CC-MFCs. Consequently, the CP-MFCs only required achieving a lower maximum current peak compared to CC-MFCs, potentially explaining the quicker stabilization of the maximum current peak in CP-MFCs. The measured initial cathode potentials were 210 ± 3 mV in CP-MFCs and 395 ± 4 mV in CC-MFCs four hours post-inoculation, which then declined to 101 ± 1 mV and 236 ± 5 mV, respectively, after four days and remained stable thereafter. Further electrochemical analyses were conducted to evaluate the long-term performance of the MFC-biosensor and to elucidate the limitations imposed by the cathode.
3.2. Biosensing Performance
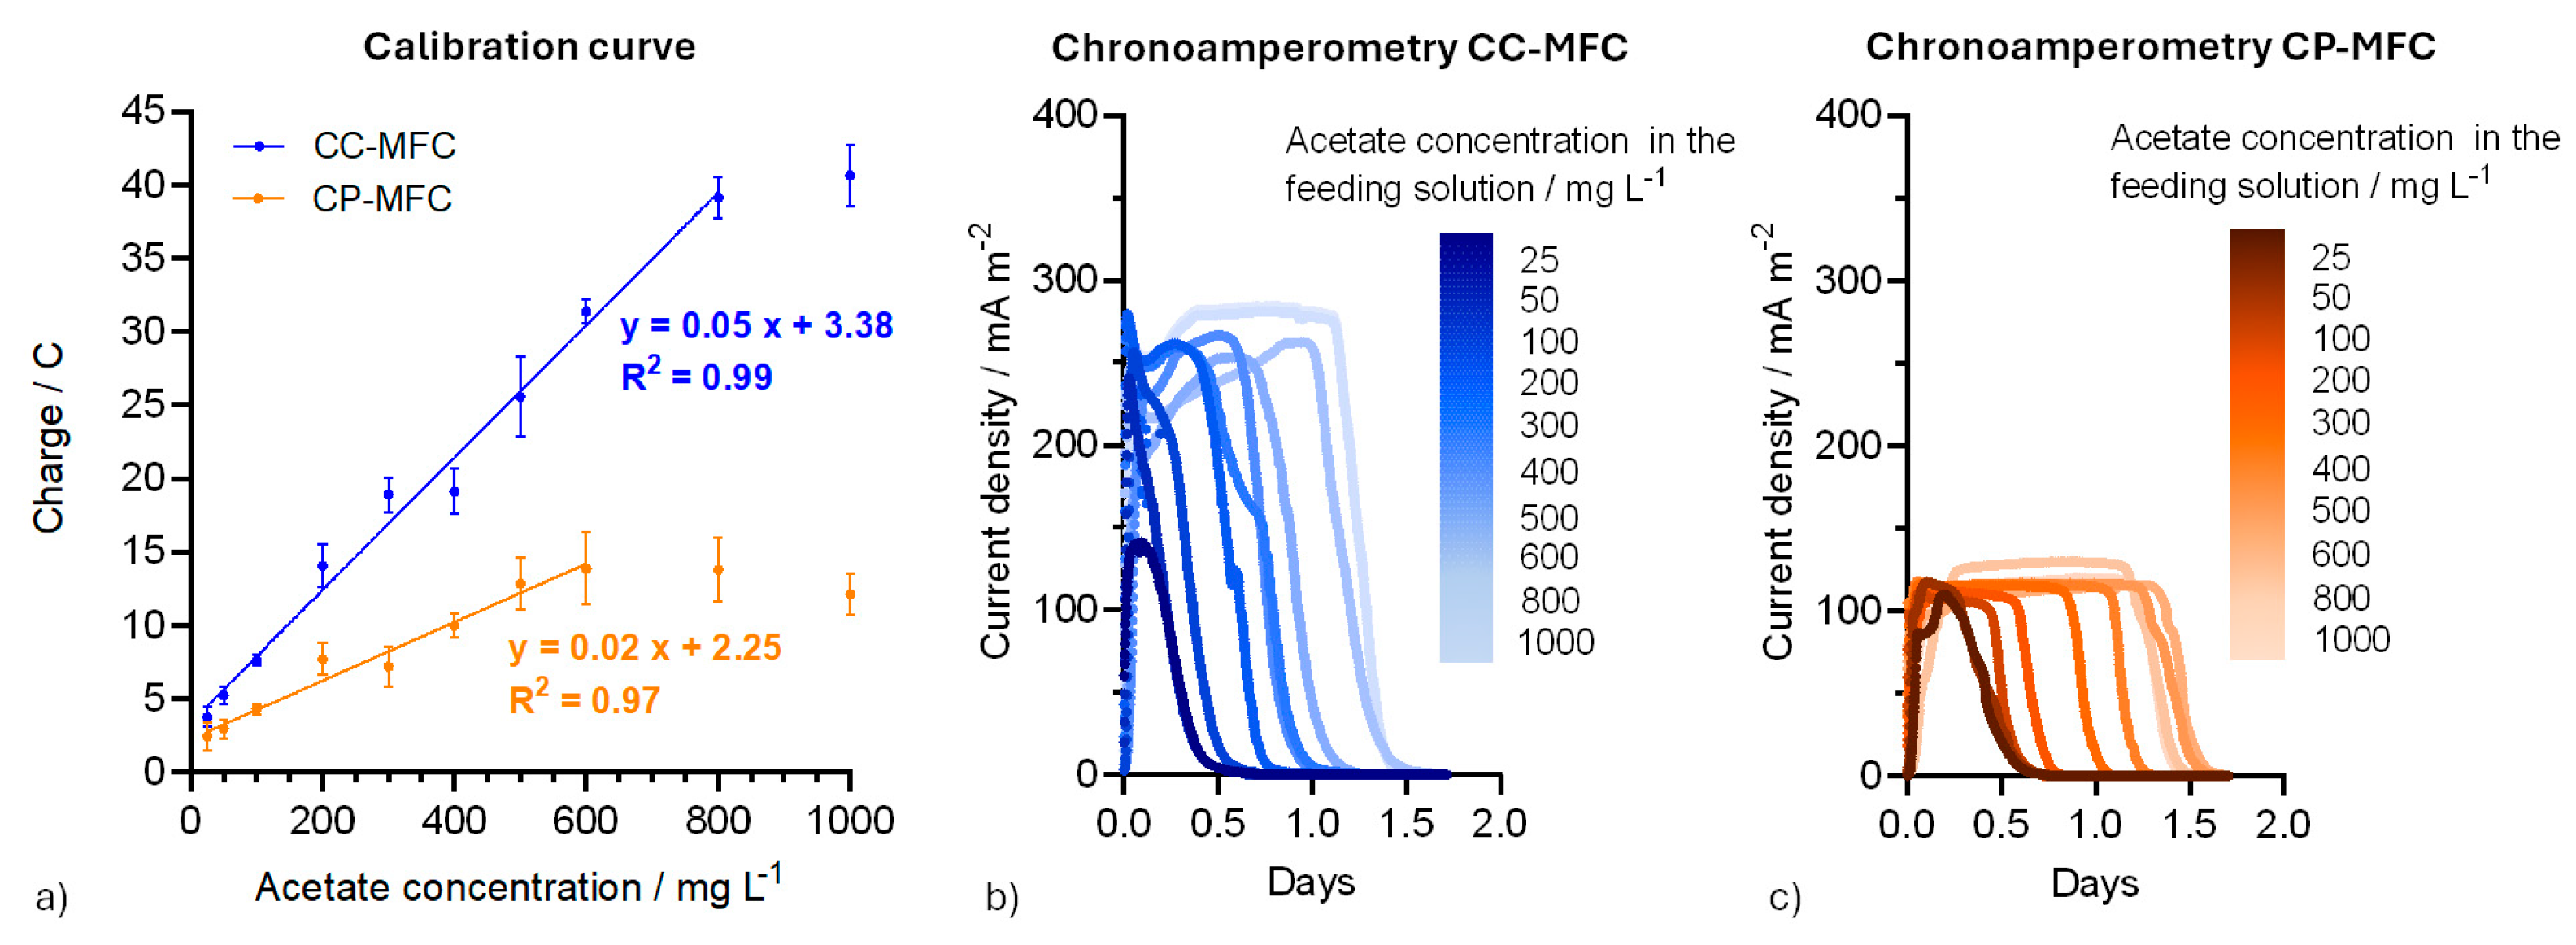
Both the CC-MFC and CP-MFC configurations demonstrated linear correlations between the charge generated during each anolyte replacement, as calculated using a previously reported method [56], and a broad spectrum of acetate substrate concentrations. Figure 3a visually represents the described relationship, and Figure S4 offers an extensive visualization of the chronoamperometric data over 120 days, showing the current generation at each batch interval in correlation with the corresponding Na-acetate concentration in the medium. The linear regression analysis of the linear dynamic range (excluding the plateau regions at high concentrations) yielded high R2 values of 0.97 for CP-MFCs and 0.99 for CC-MFCs. The linear dynamic range of CC-MFC (25–800 mg L−1) was larger than that of CP-MFC (25–600 mg L−1). The sensitivity, determined by normalizing the slope of the linear regression to the projected geometric area of the anode, was 37.6 C L mg−1 m−2 for CC-MFC and 16.6 C L mg−1 m−2 for CP-MFC. CP-MFCs exhibited lower coulombic efficiency (ranging from 0.49 ± 0.03% to 19.1 ±1.6%) compared to CC-MFCs (ranging from 0.10 ± 0.03% to 11.0 ± 1.4%). Furthermore, the coulombic efficiency decreased as the Na-acetate concentration in the electrolyte increased, as shown in Figure S5. The response time of the MFC-based biosensor increased with higher substrate concentrations (Figure S6). CC-MFCs had a response time ranging from 8.3 ± 1.1 h to 19.1 ± 1.6 h, while CP-MFCs ranged from 13.1 ± 0.5 h to 33.4 ± 1.5 h. The decrease in coulombic efficiency at higher Na-acetate concentrations is attributed to the extended substrate oxidation time by electroactive bacteria at elevated BOD levels, compared to lower concentrations (Figure S3). This decline in CE results from increased dissolved O2 levels in the MFC over time, which aerobic bacteria use without generating electricity, and a rise in planktonic cell density, which competes with the electroactive biofilm for substrate degradation [57,58,59]. It is well known that the performance of an MFC biosensor in water monitoring is closely related to the strength of its electric signal output, which elucidates why CC-MFCs exhibit superior performance characteristics [60]. The lower dynamic range, sensitivity, coulombic efficiency, and longer response time in CP-MFCs are attributed to a high internal resistance that hampers efficient current production. Figure 3b shows that the current peaks do not exceed approximately 110 μA m−2, and an increase in Na-acetate concentration in the feedstock only results in increased charge production, indicating the presence of a limiting factor for current production. Further electrochemical analyses were conducted to investigate the cause of these limitations.
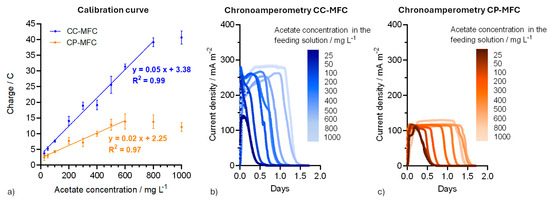
Figure 3.
(a) Correlation between the charge produced by two types of MFCs, CC-MFC (shown in blue) and CP-MFC (shown in orange), with respect to the acetate concentration in the feeding solution. Four individual MFCs were used as replicates, and each reactor underwent three separate feedings for each acetate concentration. The charge produced by each reactor during these three feedings was averaged. The graph displays the average of the four resulting data points for each acetate concentration ± Standard Error of the Mean. (b) Current peaks obtained from CP-MFCs and from (c) CC-MFCs when supplied with minimal medium containing varying concentrations of Na-acetate (pH = 7.4 ± 0.2, conductivity = 1.0 ± 0.2 mS cm−1) to modulate the BOD. The data presented in the figures were obtained from a single MFC reactor that underwent three separate feedings for each Na-acetate concentration tested. The results are presented as the mean current values obtained from these three feedings.
3.3. Electrochemical Analyses
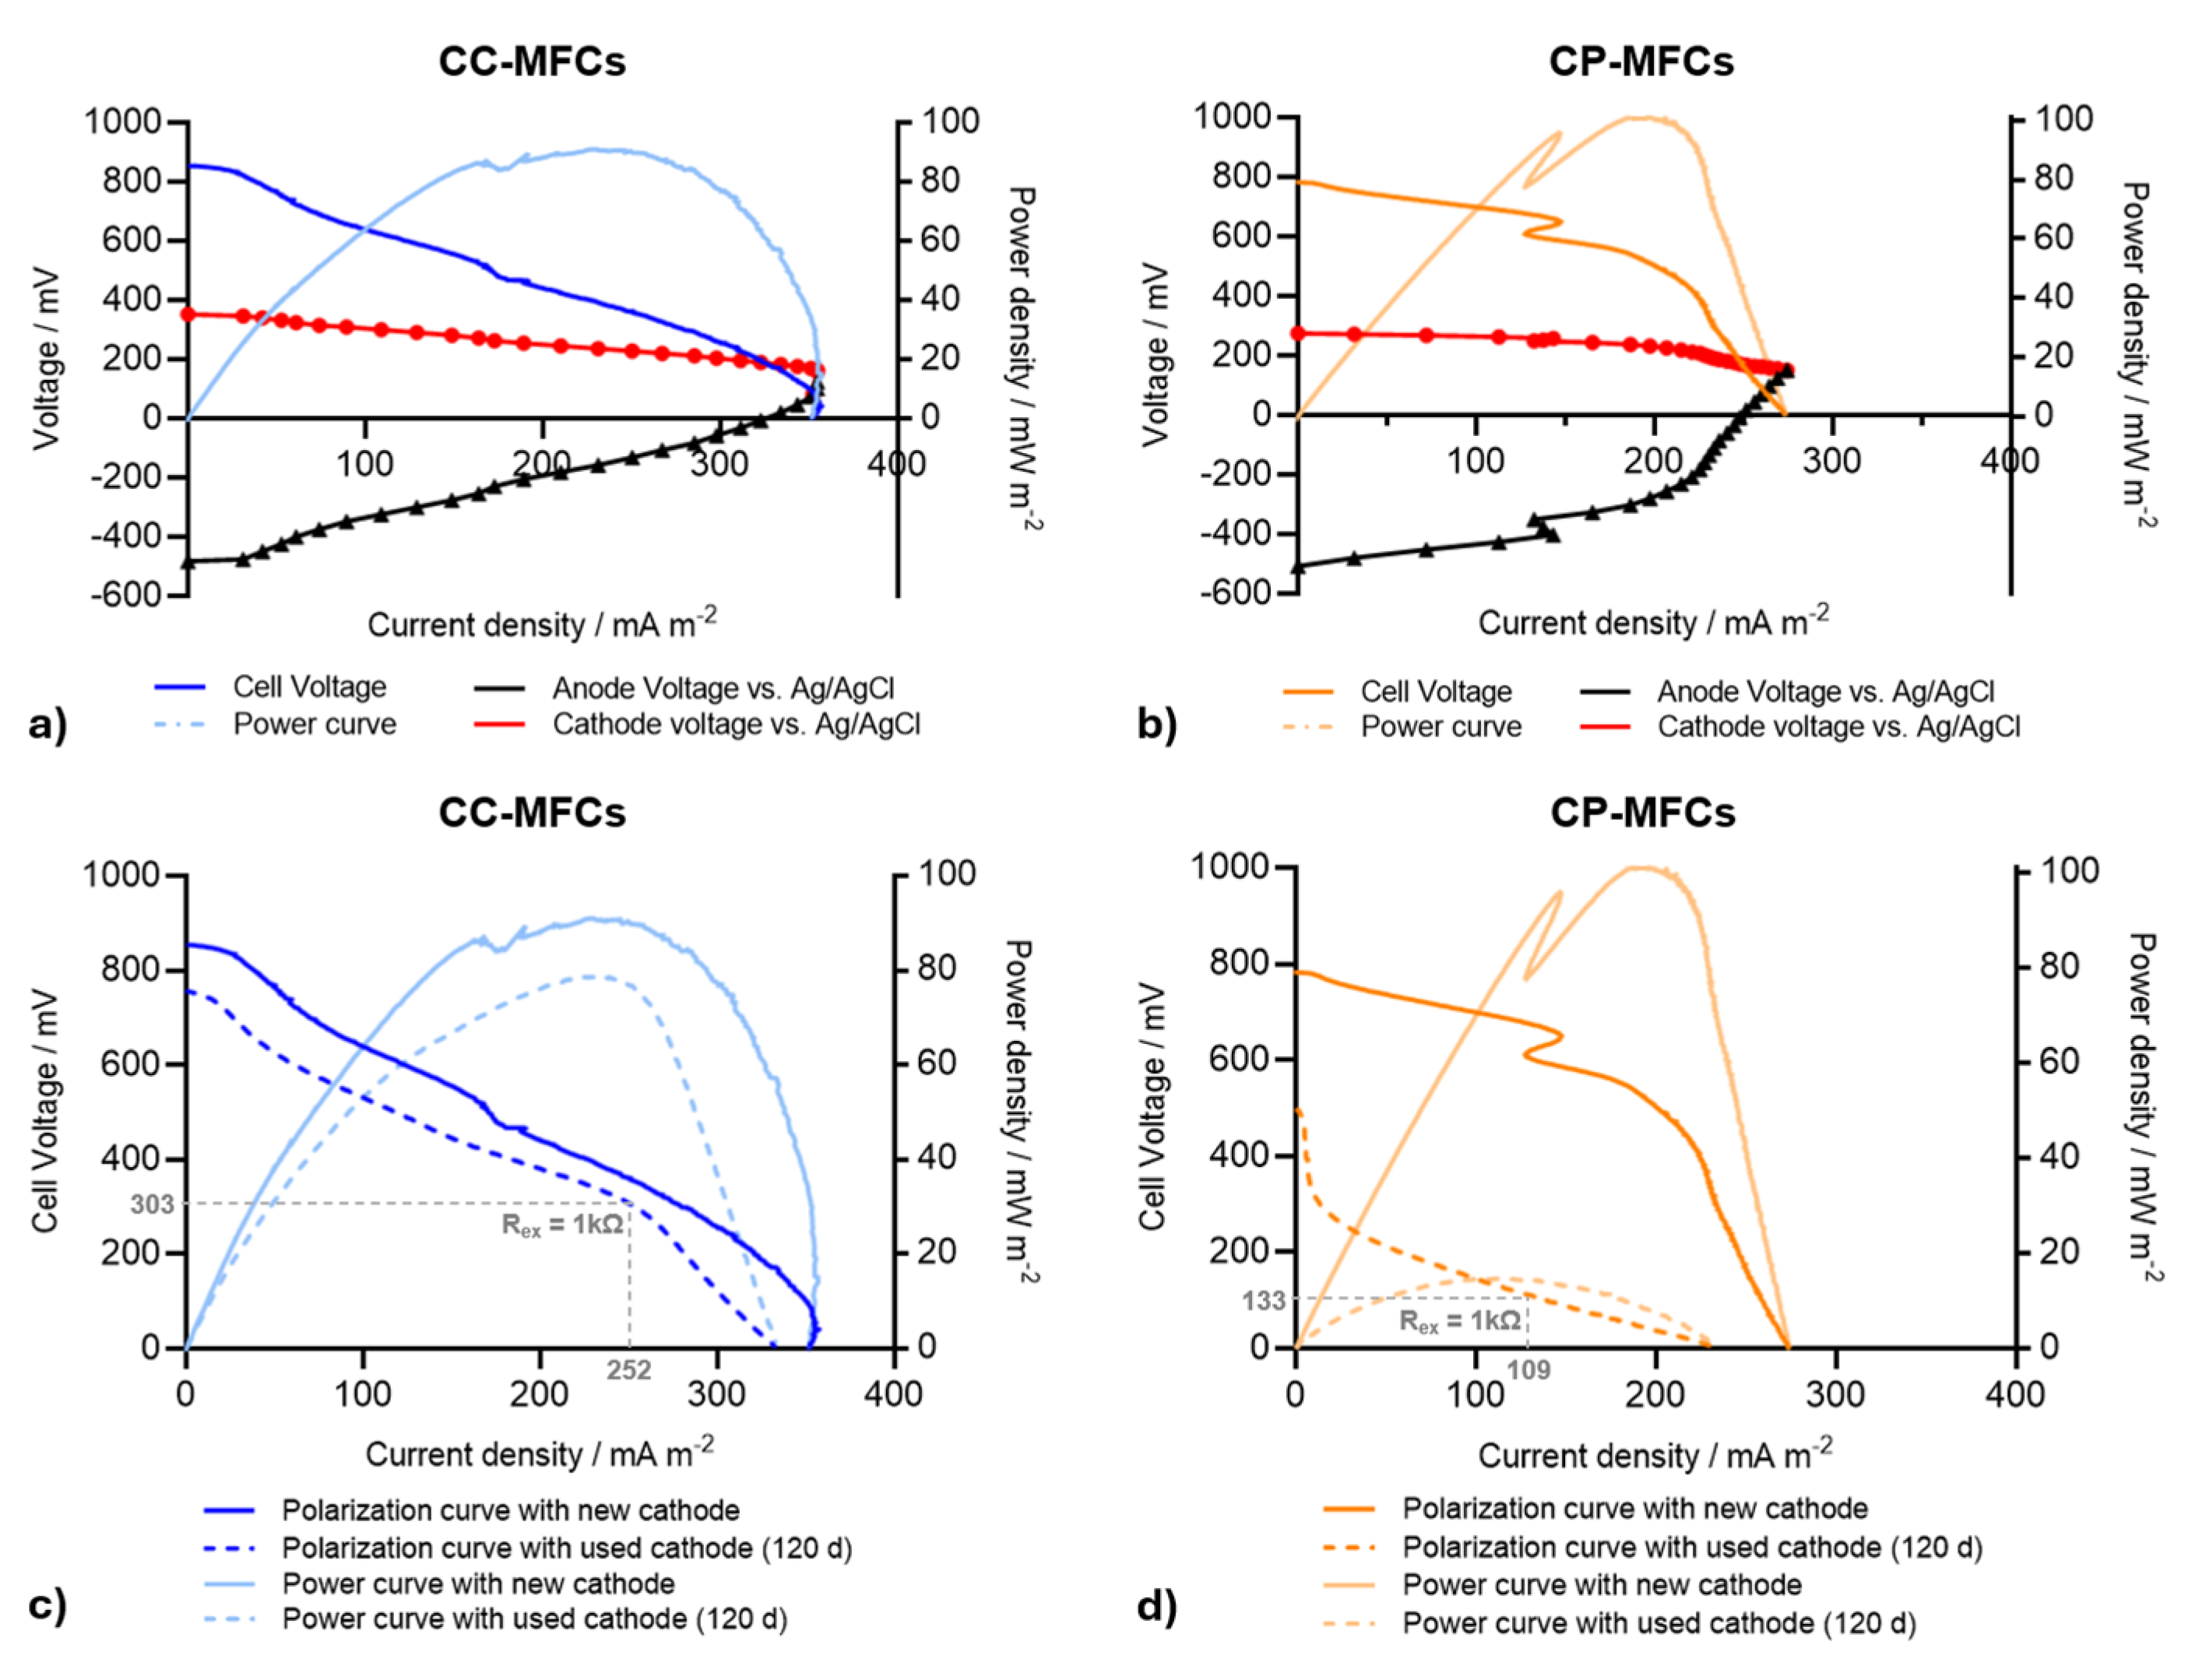
On day 120, polarization and power curves were generated using two different cathodes: one that had been used throughout the experiment and another a pristine cathode. The objective was to determine which electrode is limiting current production. Figure 4a,b show the polarization curves of the cell, anode, and cathode, featuring a fully developed catalytic biofilm at the anode and a pristine cathode. Notably, both the CP and CC cathodes exhibited minimal voltage drops at high current densities, indicating that neither the GDE electrodes, when undamaged, restrict current production in the MFC. Instead, the limitation arises from the anode, as its voltage becomes positive at high current densities, indicating significant overpotential that is not observed in the cathode [15]. The CC-MFC achieved a maximum current of 352 mA m−2, while the CP-MFC reached 274 mA m−2. The calculated internal resistance (RInt) of the MFCs, which corresponded to the external resistance (REx) applied when obtaining the maximum power, resulted in 1432 Ω for CC-MFC and 2294 Ω for CP-MFC. Figure 4c,d illustrate a comparison between the polarization curves of the whole cell after 120 days. The experiment was conducted using an MFC with a cathode that had been in use for 120 days, as well as a pristine cathode within the same MFC on the same day, in order to compare the cathode performance before and after usage. In both the CP and CC-MFC set-ups, a decline in performance is observed attributed to cathode degradation, specifically in terms of a decrease in the initial open circuit potential (OCP) and maximum current density. However, this decline is more pronounced in CP-MFC, where the maximum current dropped from 274 to 231 mA m−2, while the OCP decreased from 782 to 500 mV. The slope of the initial segment of the polarization curve, indicative of activation losses at low current densities, becomes significantly steeper with prolonged use of the GDE cathode. Activation losses, also known as activation overpotentials, are one of the three major types of losses in fuel cells (the others being ohmic and concentration losses) and they occur due to the energy barrier that must be overcome to initiate the electrochemical reactions at the electrode surfaces [15]. This suggests a decrease in the ORR catalytic efficiency of the CP GDE cathode over time. On the other hand, CC-MFC exhibited less noticeable cathode deterioration, with a decrease in OCP from 854 to 764 mV and current density from 352 to 333 mA m−2. Such degradation can also be observed in Figure 2, which shows the voltage of the anode, cathode, and cell in OCP over time. As highlighted in the polarization curves of Figure 4c,d, at 1 kΩ and with 0.6 g L−1 of Na-acetate, the current produced by CC-MFC and CP-MFC was 252 and 109 mA m−2, respectively, which matches the values of the maximum current peak produced by CC and CP-MFCs when fed with the same Na-acetate concentration during the calibration phase (Figure 3b,c). This implies that the calibration of the biosensor was conducted when the cathode performance had already decreased (and the electroactive biofilm was fully formed). The observed reduction in the performance of CP and CC cathodes over 120 days, especially notable in CP cathodes, corroborates findings from prior research, primarily attributing this decline to biofouling at the cathode, which acts as a barrier to proton transfer and oxygen diffusion [61,62]. Several investigations have documented that cathodic biofilms obstruct the GDE, leading to an increase in both activation and diffusion losses. Specifically, Zhang et al. identified the decrease in the cathode’s performance as a result of the occlusion of micropores within the CL caused by biofilm growth [62]. Li et al. reported that biofouling affected not only the surface of the CL but also penetrated the inner layers of the GDE, which significantly reduced oxygen permeability, conductivity, and the contact of the oxygen with the reaction sites [63]. Consequently, the kinetic activity of the cathode was impaired, and the activation losses increased, as observed in the present study. Another known cause of cathode degradation is the poisoning of the ionomer by anions in the electrolyte, which reduces ORR kinetics by obstructing O2 adsorption. Both CC and CP-GDEs employed Nafion as the ionomer. Although the exact Nafion loading for the premade CC-GDE is not provided by the manufacturer, it is highly likely that there is a variation in Nafion content between the two types of GDEs, potentially influencing the degree of ionomer poisoning. The greater activation losses in CP GDE, in comparison to CC GDE, may be linked to the distinct surface morphology characteristics of the two types of air-cathodes, such as surface roughness, porosity, pore size, and the thickness of the GDL, MPL, and CL, which are recognized factors influencing cathode performance and biofilm development [30,64,65]. To further investigate the surface morphology of the GDE cathodes and understand the severity of biofouling, SEM analyses were conducted. Additional research is essential to fully understand how each of these specific composition and surface characteristics individually influences the cathodic biofilm composition and its impact on cathode degradation and on the performance of an MFC-based biosensor.
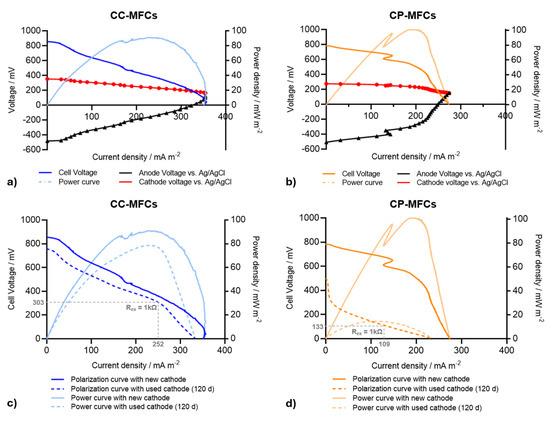
Figure 4.
(a) Polarization and power curves of CC-MFC and (b) CP-MFC after 120 days of operation with a mature biofilm at the anode and with freshly replaced cathodes (non-fouled). (c) Comparison of polarization and power curves of MFC-CC and (d) MFC-CP (day 120) with the cathode used during the experiment (dotted line) and with a freshly replaced cathode (continuous line). The polarization curves were performed using 0.6 g L−1 Na-acetate in minimal medium as electrolyte with a PalmSense4 potentiostat connected in a two-configuration mode at 0.5 mV s−1. The voltage of the anode (black triangles) and cathode (red dots) (vs. Ag/AgCl RE) was measured every 20 s during the LSV with a multimeter. The power (P) was calculated as P = I ECell. The correlation between the potential of the cell, anode, and cathode is represented by the equation ECell = ECat − EAn − I RInt, where ECell, ECat, and EAn are the empirically measured potential of the cell, cathode, and anode, respectively [15].
3.4. Material Surface Analyses
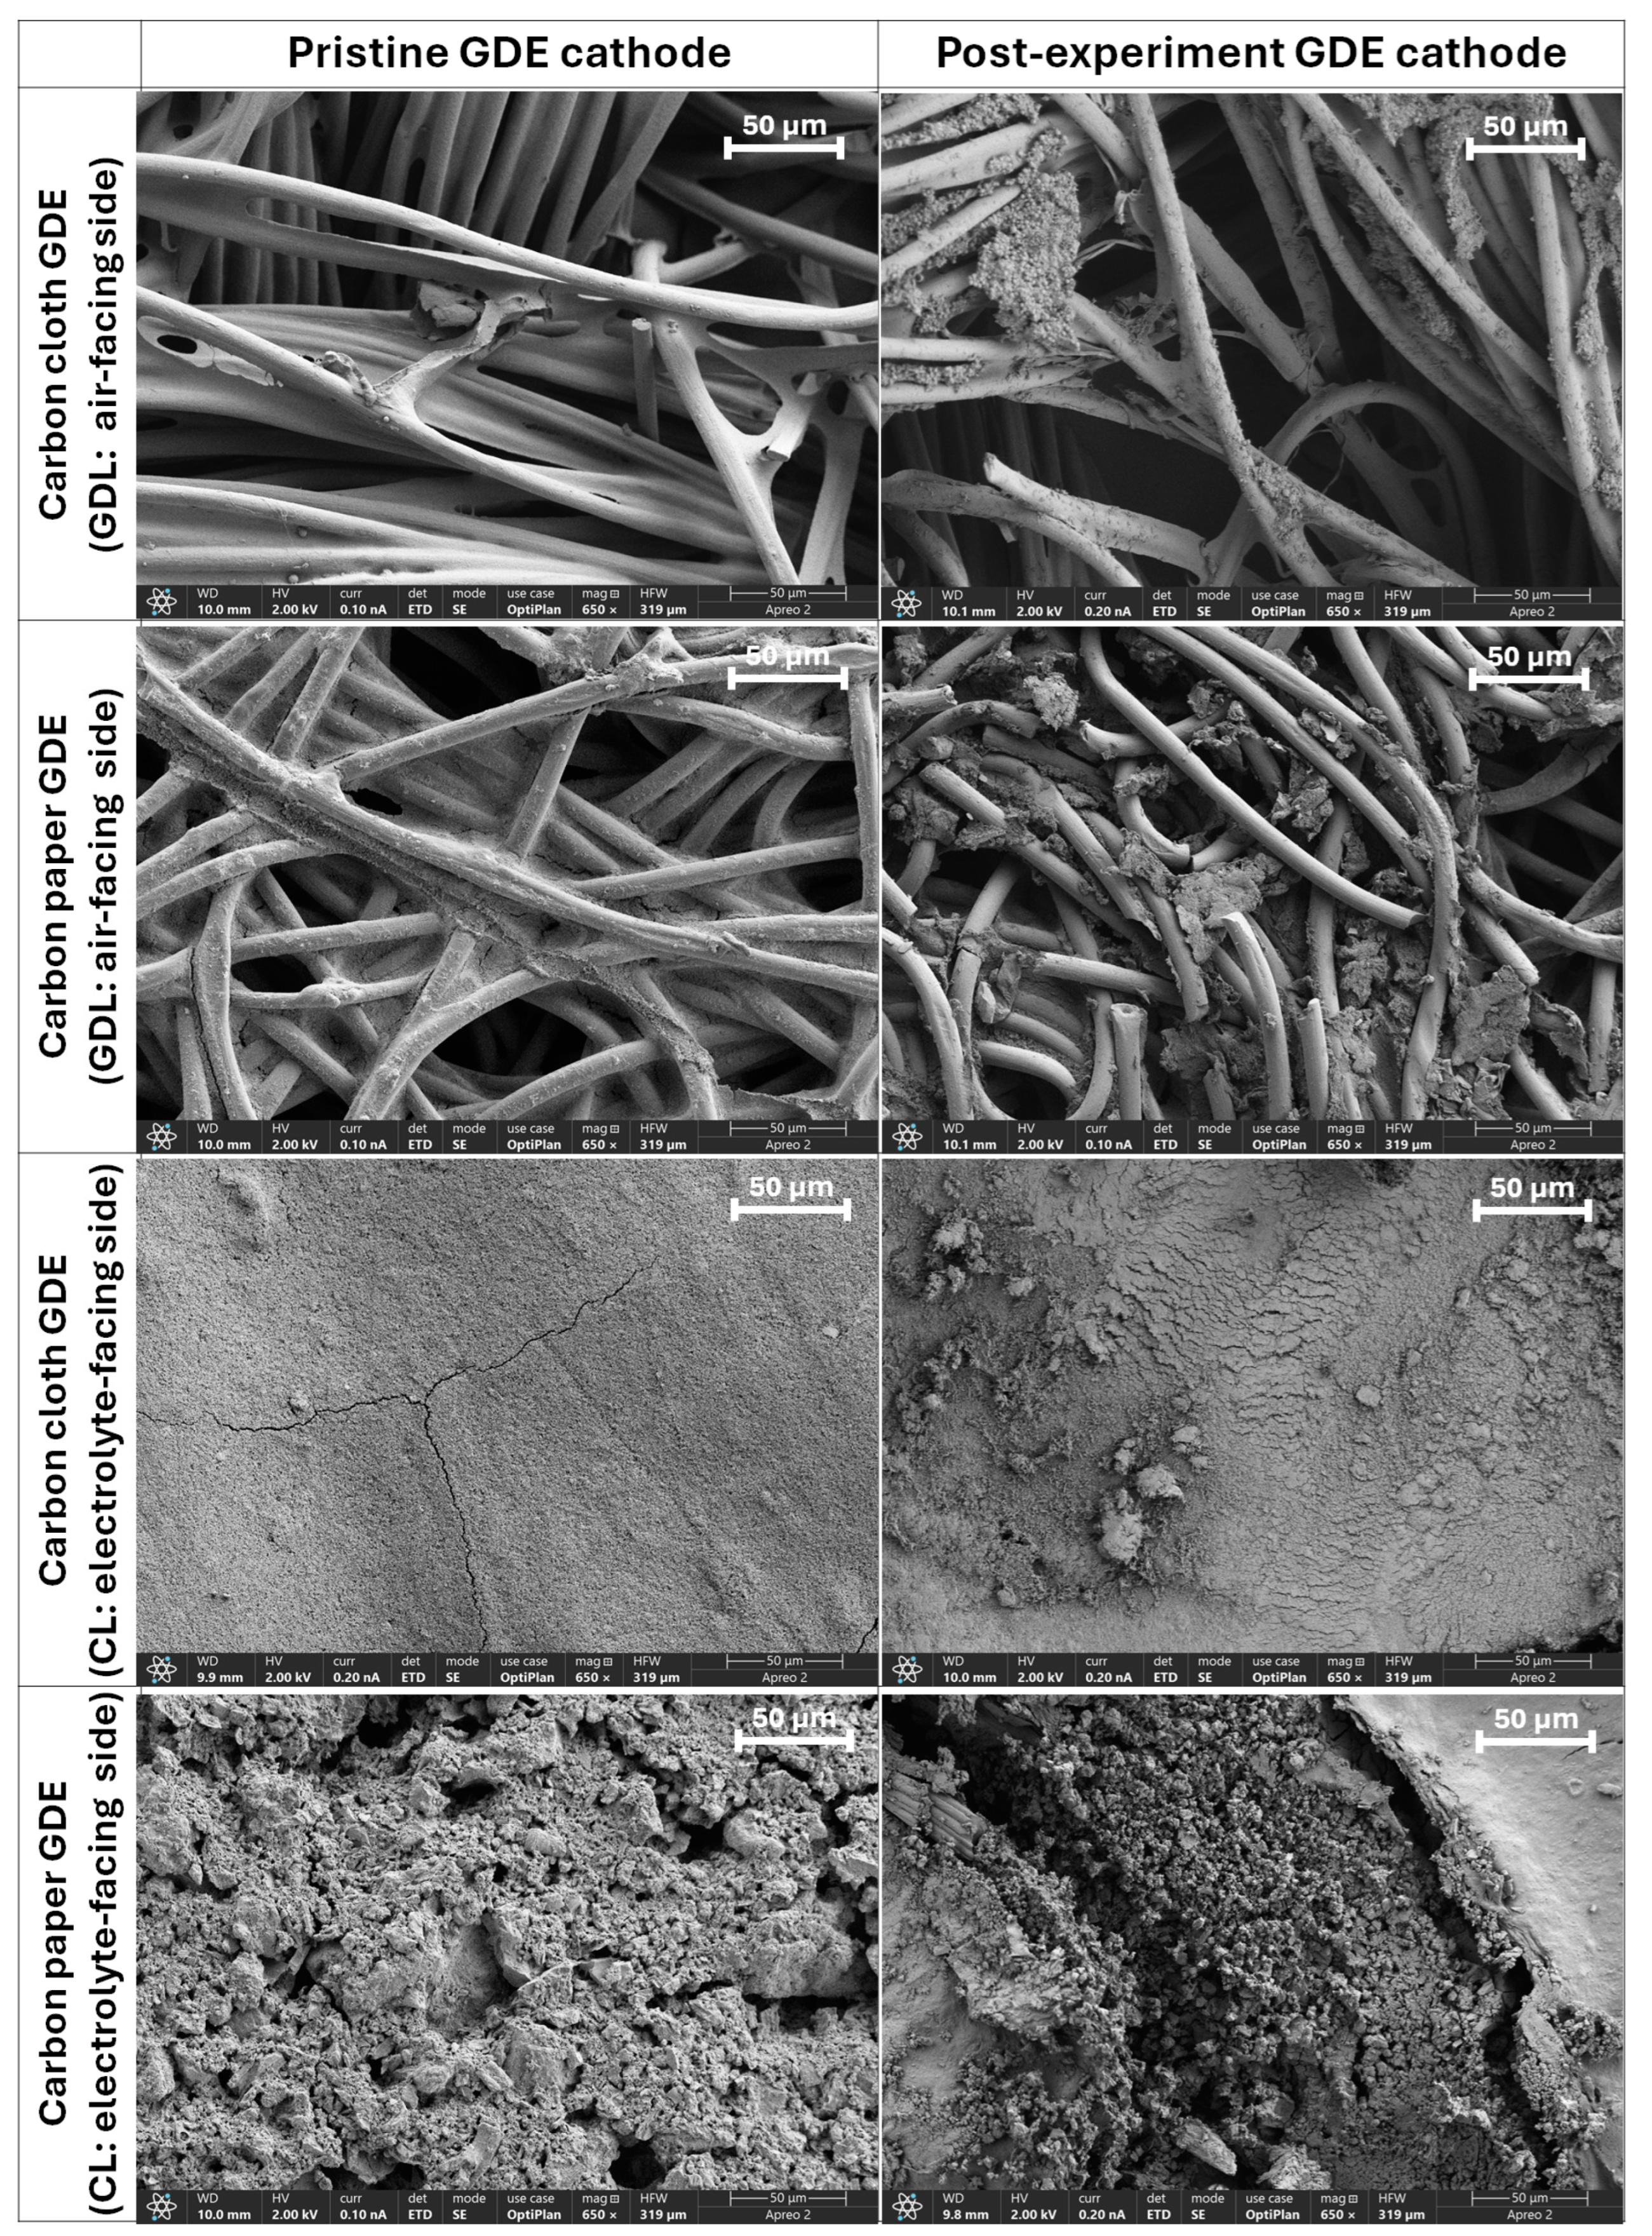
The SEM images (Figure 5) include visualizations of the GDEs in their pristine condition as well as after 120 days of continuous usage. By examining these images, we aim to assess the morphological differences and potential degradation that may have occurred in the GDEs over the course of the experiment, which provides further evidence to support the electrochemical findings. The results indicate a significantly different morphology of the GDL (air-facing side) and CL (electrolyte-facing side) of both CC and CP cathodes before and after the experiment, with the CP cathodes exhibiting more pronounced biofouling after 120 days of operation. The pristine CL of the CP cathode showcases a highly porous heterogeneous and rough surface, likely due to the manual application of the catalyst. In contrast, the CL of CC cathodes, pre-coated by the manufacturer, presents a more uniform surface. On the GDL side, the CP structure is compact, with less open space visible between the fibers compared to CC GDL, where the surface appears smoother and uniform, with some fibers overlapping. Previous studies on polymer electrolyte fuel cells have demonstrated that the CC GDL, characterized by reduced tortuosity and enhanced porosity, outperforms the CP GDL because CC GDL facilitates efficient oxygen transport, which could explain the better performance and operational stability of the CC-MFCs observed in this study [30]. Both types of commercial cathodes are also equipped with MPL. A recent investigation by Chen et al. revealed that the MPL of the commercial material used for CP GDL has a porosity of 61 ± 0% with an overall lower thickness of the GDL and MPL of 250 μm compared to CC GDE, which has a porosity of 54 ± 3% and higher thickness (410 μm) [66]. Santoro et al. showed that thicker GDE structures with MPL prevented biofilm penetration into the cathode, leading to the better performance of MFC [19]. This observation could explain the heightened biofouling noted in the thinner CP cathodes. After 120 days in operation within MFCs, both CP and CC cathodes exhibit visible biofilm formation within the CL and GDL, more extensively on CP. On the GDL side, CC cathodes display a network of carbon fibers that retain much of their original structure with signs of biofilm presence. Meanwhile, the CP GDL image reveals a more drastic alteration with significant biofilm development. The fibers are heavily coated with biofilm, which appears as an accumulation of material that obscures the original fiber structure. On the CL side, both the CC and CP cathodes exhibited the presence of biological material. Biological residues were visible on the CL side of the post-experiment CC cathode, which were also visible to the naked eye when the cathode was removed after the experiment concluded (see Figure S7). In the case of the CP cathode, the CL appears to have an even more pronounced biofilm presence, with a thick, uneven layer that almost completely obscures the underlying structure of the electrode. The biofilm here is rugged and heterogeneous, with large clumps and debris, suggesting heavy colonization and possibly higher biofouling when compared to the CC GDE.
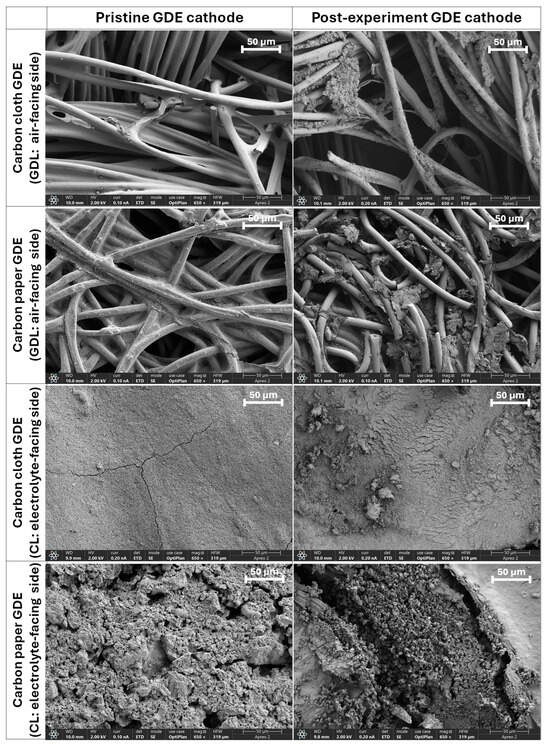
Figure 5.
SEM images comparing the gas diffusion layers (GDLs) and catalyst layers (CLs) of pristine and post-usage conditions in both CC and CP cathodes. The left column of images displays the GDLs in their pristine form, while the right column showcases the GDLs after an extended usage period of 120 days. Images were taken with Hitachi S-3200N scanning electron microscope (SEM) operated at 2 kV and 0.1 Na, equipped with an Everhart–Thornley detector (ETD) at a magnification of 650×.
The CP cathodes, characterized by a more porous catalyst layer and a thinner, denser gas diffusion layer, showed a higher presence of biological material. This biofouling extended from the catalyst layer’s surface deep into the electrode, severely blocking the gas diffusion layer. Such extensive clogging was associated with a significant drop in the electrochemical performance of the CP cathodes.
3.5. Effect of GDE Cathodes on the Anodic Biofilm Composition
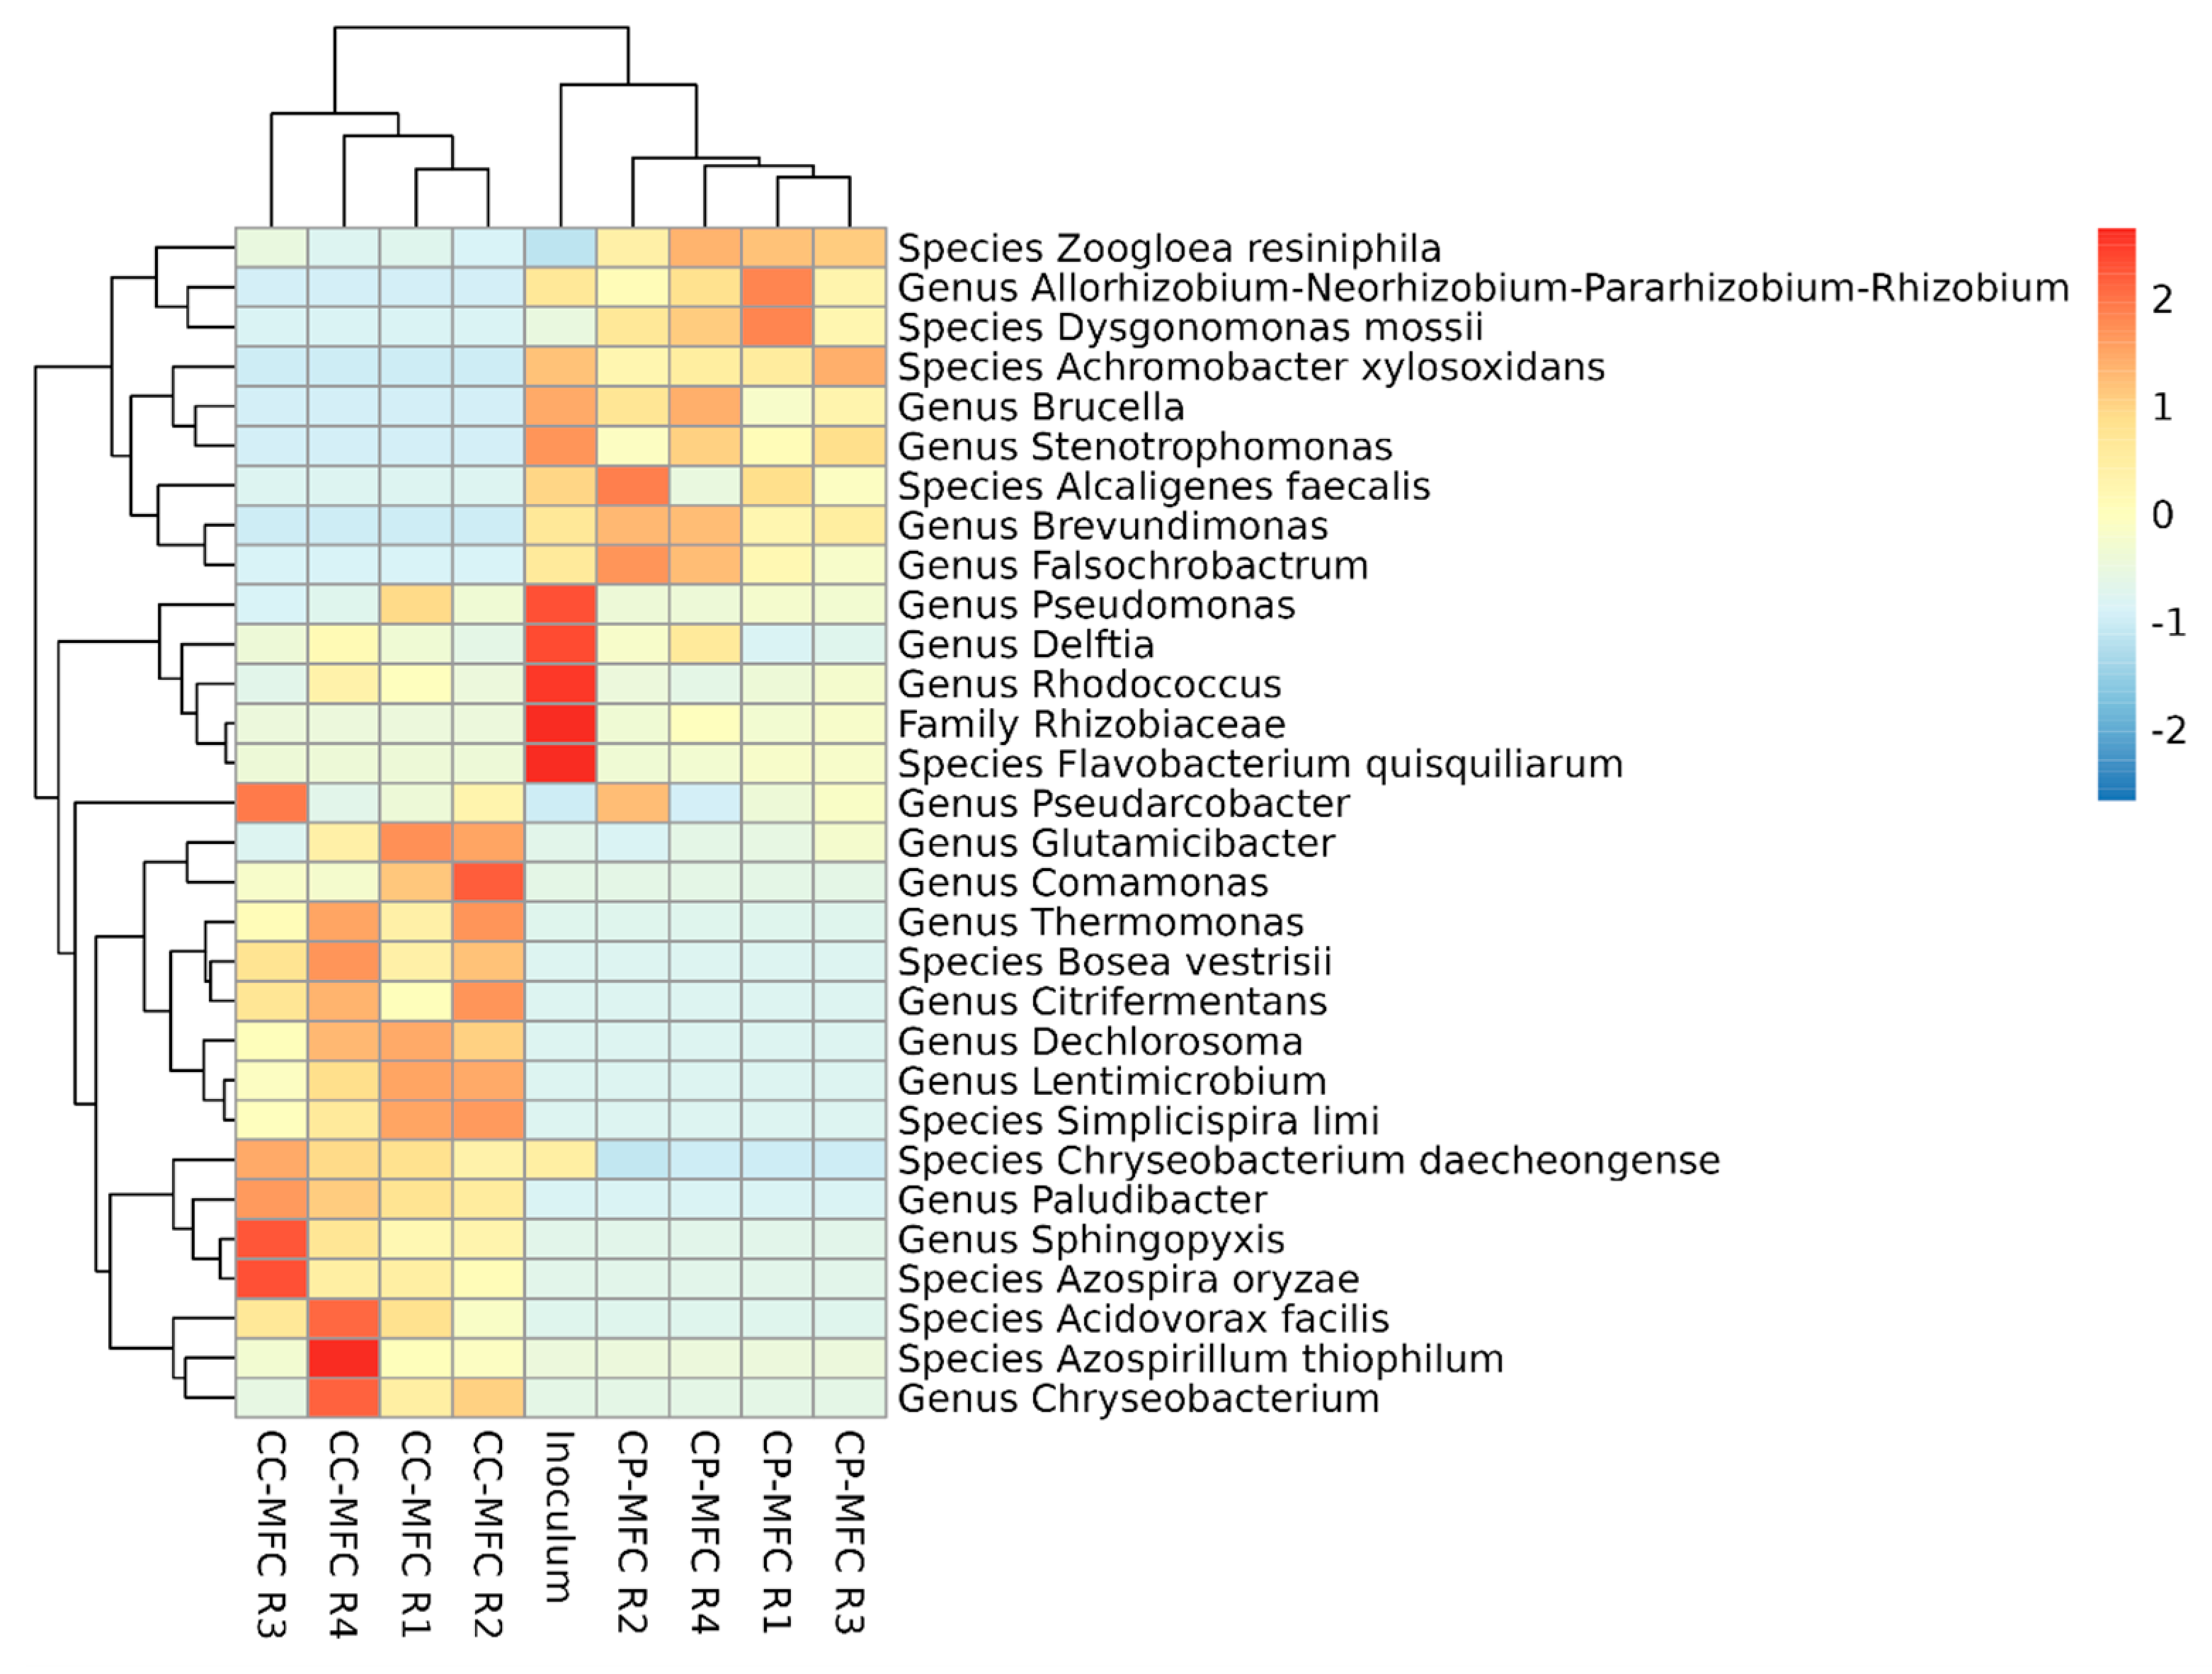
Analysis of anode polarization curves and OCP values revealed differences in the anodic catalytic activity between MFCs with CC or CP air-cathodes, likely due to varied electroactive biofilm compositions, despite identical inoculum. Consequently, a taxonomic analysis of the anode was conducted to investigate the microbial community differences potentially causing these variations. The taxonomic analysis of the inoculum and the four MFC reactors (biological replicates) equipped with CC and CP-MFCs (Figure 6) reveals distinct biofilm development between the CC-MFCs and CP-MFCs, both differing from the initial inoculum. The variation in biofilm composition could account for the distinct electrochemical behavior of the biofilm, with CC MFCs producing a higher current compared to CP MFCs (Figure 4a,b).
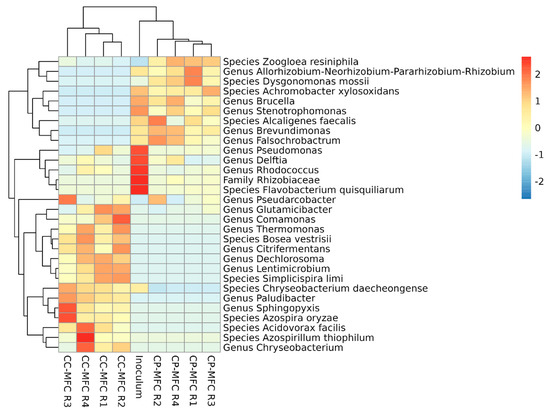
Figure 6.
Heatmap showing the species and genera found in the initial inoculum and in four replicates of CC-MFCs and CPMFCs. The taxa were filtered above 0.025%. Phylogenetic tree construction for unifrac distance calculation was carried out using RaxML-NG.
Principal Coordinate Analysis (PCoA) highlighted similarity among the replicates and a closer similarity of the inoculum to the microbial community of CC-MFCs (Figure S8). In CP-MFCs, a few genera dominated the microbial population, comprising up to >60%: Zooglea (48 ± 4.4%), Pseudarcobacter (10 ± 3.9%), Pseudomonas (3.7 ± 0.1%), Alcaligenes (1.5 ± 0.7%), and Delftia (2.2 ± 1.1%). These genera are also present in CC-MFCs but in lesser proportions. In the best-performing CC-MFCs, ten additional genera are found in >2% relative abundance, including Citrifermentas, Comamonas, Dechlorosoma, Rhodococcus, Paludibacter, Chriseobacterium, Lentimicrobium, Azospirillum, Glutamicibacter, and Thermomonas. The coexistence of both aerobic and anaerobic bacteria at the anode of both types of MFC confirms the presence of oxygen within the reactor (Figure S3) and indicates complex microbial dynamics, wherein aerobic bacteria likely consume oxygen, thereby protecting anaerobic bacteria [33]. The results indicate a colonization of the anode by a more diverse set of taxa in CC-MFCs compared to CP-MFCs. Such higher diversity in CC-MFCs is confirmed by alpha diversity analysis (Figure S9). Zhang et al. have previously observed that the cathode significantly affects the microbial composition of the bioanode [36]. This influence is likely due to the impact of different cathodes on the internal resistance of MFCs, which modulates both the electron flow through the circuit and the anode’s electron acceptor availability. Previous studies have demonstrated that adjusting these parameters via the REx exerts selective pressure on the composition of electroactive bacteria within the bioanode [67,68].
Cyclic voltammetry experiments, with and without Na-acetate, were performed to identify EET sites capable of regulating bioelectrochemical anodic processes. The two conditions in the presence and absence of Na-acetate are referred to as the turnover and non-turnover mode, respectively. As shown in Figure S10a, in a non-turnover cyclic voltammogram of the anode of a CC-MFC, it is possible to observe three oxidation and three reduction peaks. The three calculated midpoints might correspond to the standard electrochemical potential of the redox couples SO32−/HS− (E° = −120 mV, pH = 7), ubiquinone ox/red (E° = 111 mV, pH = 7), and ½ O2/H2O (E° = 820 mV, pH = 7), respectively (all vs. Ag/AgCl RE) [69]. The comparison of the non-turnover with turnover voltammogram reveals that the redox couples SO32−/HS− is the main EET site responsible for acetate oxidation. Interestingly, similar peaks can be seen in the non-turnover and turnover voltammogram of a CP-MFC (Figure S10b), even though a lower current is produced. These results suggest that the EET mechanism is similar in the two types of MFC (with CC and CP cathode), regardless of the differences in the relative abundance of bacterial genera. The cyclic voltammograms show that the current produced by CP-MFCs is lower than the one produced by CC-MFCs. This difference may be attributed to the prevalence of Zooglea resiniphila, a commonly found species in anaerobic sludge, within all the replicates of CP-MFCs. Z. resiniphila has been observed to form dense biofilms, particularly in the presence of conductive materials. However, the specific electroactivity of Z. resiniphila has not been extensively studied, suggesting that it may not be classified among the bacteria with the highest degree of electroactivity. Nonetheless, despite its unconfirmed electroactivity, Z. resiniphila could still contribute to the formation of biofilms owing to its ability to produce substantial quantities of exopolysaccharides. Further research is required to elucidate the precise electrochemical role of Z. resiniphila in CP-MFCs [70]. Furthermore, among the identified bacteria, Pseudarcobacter was also found to be abundant in both CP and CC-MFCs and is known to exhibit electroactivity, although further research is needed to investigate the specific electroactive metabolic pathways employed by this bacterium [71,72]. Notably, certain species of Pseudomonas, such as P. aeruginosa and P. putida, have been extensively investigated for their ability to form biofilms on electrodes and engage in EET processes [73,74]. Other genera, including Alcaligenes [75], Delftia [76], Citrifermentans [77], Comamonas [78,79], Dechlorosoma [80], Rhodococcus [81], Paludibacter [82], Chriseobacterium [83], Lentimicrobium [84], Azospirillum [85], and Thermomonas [86], are known to develop in bioelectrochemical systems and they are able to use the anode as an external electron acceptor, either directly or through the use of shuttle molecules. Glutamicibacter has been previously reported to colonize GDE cathodes in SC-MFCs. Its presence in the anode of CC-MFCs might be due to the anode bacteria that might migrate from one electrode to the other; it is known to be able to adapt to different environments [29,87].
The cyclic voltammograms reveal that sulfur might act as an electron shuttle, and it could be the main EET mechanism during Na-acetate oxidation in both CP and CC-MFCs. Among the genera found in the anodic biofilm of both types of MFCs, Pseudomonas [88], Comamonas [89], and Rhodococcus [90] are known to include species that are capable of sulfur reduction for EET processes. It is well known that bacteria can use sulfur as a final electron acceptor, producing sulfide. The latter is then spontaneously reoxidized to its original form when the anode has a suitable potential, which makes sulfur a shuttle molecule for mediated EET [91].
4. Conclusions
This study elucidates the pivotal role that the choice of a gas diffusion electrode (GDE) cathode plays in the performance of 3D-printed single-chamber MFC-based biosensors. The findings highlight how cathode selection significantly influences critical factors such as the time required for current signal stabilization, the overall biosensor performance in analyzing biological oxygen demand (BOD), and key sensing parameters, including linear dynamic range, sensitivity, and response time. From a practical standpoint, cost-effective carbon paper (CP) GDEs with a hand-coated CL emerge as favorable options for short-term biosensor applications, while carbon cloth (CC) GDEs supplied with the CL exhibit superior performance for long-term sensing purposes. This delineation will guide researchers and practitioners in selecting the most appropriate cathode materials for their specific MFC biosensor objectives. Looking forward, this study paves the way for future investigations focused on optimizing cathode materials and design. Future studies should also aim to elucidate the effects of more complex substrates or real wastewater on the performance of MFC-biosensors and assess their applicability in real-world scenarios. Addressing challenges such as biofouling and degradation through innovative strategies has the potential to significantly enhance the sustained performance and stability of MFC biosensors, thus advancing their utility in environmental monitoring and beyond. Such endeavors will continue to be pivotal in the evolution of this promising technology.
Supplementary Materials
The following supporting information can be downloaded at: https://www.mdpi.com/article/10.3390/en17143574/s1, Figure S1: (a) MFC reactor utilized during the study; (b) schematic representation of the structure of a SC MFC with an air cathode, and (c) open reactor displaying the different components. Figure S2: Current produced during the biofilm formation time in a) CC-MFC and b) CP-MFC with external resistor of 1000 Ω. The arrows indicate the anolyte replacement, which contains 0.6 mg L−1 Na-acetate. Data are shown as mean of 4 replicates ± Standard Error of the Mean. Figure S3: Concentration of dissolved oxygen in the electrolyte of MFC reactors equipped with CC- and CP cathode over time. Time 0 h corresponds to replacing of the anolyte inside the aerobic chamber. Over time, O2 diffused inside the reactor, and the concentration of dissolved O2 in the anolyte increased and it was measured with a Fiber-Optic Oxygen Meter and a Pyro Oxygen Logger Software (FireSting O2, Aachen, Germany). Data are presented as mean of 2 replicates ± SD. Figure S4: Current produced during the calibration of the biosensor with different Na-acetate concentrations in (a) CC-MFC and (b) CP-MFC with external resistor of 1000 Ω. The anolyte replacement is marked by arrows, with each arrow’s color representing a different Na-acetate concentration in the media, as annotated in the graph. Each Na-acetate concentration underwent three tests to evaluate the reproducibility of the biosensor. Data are shown as mean of 4 replicates ± Standard Error of the Mean. Figure S5: Correlation between the coulombic efficiency produced by the CC-MFC (blue) and CP-MFC (orange) and the acetate concentration of the feeding solution. Data are shown as mean of 4 replicates ± Standard Error of the Mean. Figure S6: Correlation between the response time of CC-MFC (blue) and CP-MFC (orange) biosensors and the acetate concentration of the feeding solution. Data are shown as mean of 4 replicates ± Standard Error of the Mean. Figure S7: Inner surface of (a) CP GDE cathode at the end of the experiment and of (b) CC GDE cathode at the end of the experiment. Figure S8: Principal Coordinate Analysis of four replicates of CC-MFCs, CP-MFCs, and the initial inoculum. The analysis, performed with the R package “phyloseq”, is supplemented with weighted UniFrac distance assessment. The taxa were filtered above 0.025%. Figure S9: Alpha diversity analysis results using Shannon and Simpson indices for four replicates of CC-MFCs, CP-MFCs, and the initial inoculum. The analysis, performed with the R package “phyloseq”, is supplemented with weighted UniFrac distance assessment. Figure S10: Cyclic voltammograms of (a) CC-MFC and (b) CP-MFC at the end of the experiment with 0.6 g L−1 Na-acetate in minimal medium (TO conditions, dotted line) and acetate-free minimal medium (NTO conditions, continuous line).
Author Contributions
A.S.: Conceptualization, Methodology, Investigation, Data Curation, Formal Analysis, Writing—original draft, Writing—review and editing, Visualization; D.F.: Conceptualization, Methodology, Software, Writing—review and editing; M.R.-M.: Methodology, Writing—review and editing; C.A.R.: Supervision, Resources, Writing—review and editing; J.R.V.: Supervision, Resources, Writing—review and editing; S.G.: Supervision, Resources, Writing—review and editing. All authors have read and agreed to the published version of the manuscript.
Funding
This work was funded by the Natural Environment Research Council (NERC) UK project grant: NE/W003627/1.
Data Availability Statement
The original contributions presented in the study are included in the article/Supplementary Materials, further inquiries can be directed to the corresponding author/s.
Acknowledgments
We extend our acknowledgment to Thomas Chamberlain (School of Chemistry and Chemical Engineering, University of Surrey, Guildford, UK) for his invaluable assistance in the fabrication of the reactors.
Conflicts of Interest
The authors declare no conflicts of interest.
References
- World Health Organization. Drinking-Water. Available online: https://www.who.int/news-room/fact-sheets/detail/drinking-water (accessed on 13 October 2023).
- Zhang, W.; Tooker, N.B.; Mueller, A.V. Enabling Wastewater Treatment Process Automation: Leveraging Innovations in Real-Time Sensing, Data Analysis, and Online Controls. Environ. Sci. 2020, 6, 2973–2992. [Google Scholar] [CrossRef]
- Emaminejad, S.A.; Morgan, V.L.; Kumar, K.; Kavathekar, A.; Ragush, C.; Shuai, W.; Jia, Z.; Huffaker, R.; Wells, G.; Cusick, R.D. Statistical and Microbial Analysis of Bio-Electrochemical Sensors Used for Carbon Monitoring at Water Resource Recovery Facilities. Environ. Sci. 2022, 8, 2052–2064. [Google Scholar] [CrossRef]
- Chang, I.S.; Jang, J.K.; Gil, G.C.; Kim, M.; Kim, H.J.; Cho, B.W.; Kim, B.H. Continuous Determination of Biochemical Oxygen Demand Using Microbial Fuel Cell Type Biosensor. Biosens. Bioelectron. 2004, 19, 607–613. [Google Scholar] [CrossRef] [PubMed]
- Di Lorenzo, M.; Curtis, T.P.; Head, I.M.; Velasquez-Orta, S.B.; Scott, K. A Single Chamber Packed Bed Microbial Fuel Cell Biosensor for Measuring Organic Content of Wastewater. Water Sci. Technol. 2009, 60, 2879–2887. [Google Scholar] [CrossRef]
- Pasternak, G.; Greenman, J.; Ieropoulos, I. Self-Powered, Autonomous Biological Oxygen Demand Biosensor for Online Water Quality Monitoring. Sens. Actuators B Chem. 2017, 244, 815–822. [Google Scholar] [CrossRef]
- Spurr, M.W.A.; Yu, E.H.; Scott, K.; Head, I.M. A Microbial Fuel Cell Sensor for Unambiguous Measurement of Organic Loading and Definitive Identification of Toxic Influents. Environ. Sci. 2020, 6, 612–621. [Google Scholar] [CrossRef]
- Spurr, M.W.; Yu, E.H.; Scott, K.; Head, I.M. No Re-Calibration Required? Stability of a Bioelectrochemical Sensor for Biodegradable Organic Matter over 800 Days. Biosens. Bioelectron. 2021, 190, 113392. [Google Scholar] [CrossRef]
- Di Lorenzo, M.; Scott, K.; Curtis, T.P.; Head, I.M. Effect of Increasing Anode Surface Area on the Performance of a Single Chamber Microbial Fuel Cell. Chem. Eng. J. 2010, 156, 40–48. [Google Scholar] [CrossRef]
- Wang, C.; Yin, L.; Wang, S.; Jin, X.; Yang, J.; Liu, H. Role Played by the Physical Structure of Carbon Anode Materials in MFC Biosensor for BOD Measurement. Sci. Total Environ. 2023, 856, 158848. [Google Scholar] [CrossRef]
- Wang, Z.; Liao, C.; Zhong, Z.; Liu, S.; Li, M.; Wang, X. Design, Optimization and Application of a Highly Sensitive Microbial Electrolytic Cell-Based BOD Biosensor. Environ. Res. 2023, 216, 114533. [Google Scholar] [CrossRef]
- Nakamoto, T.; Nakamoto, D.; Taguchi, K. Stand-Alone Floating Microbial Fuel Cell-Based Biosensor for Tracking Organic Pollution Influx. Biochem. Eng. J. 2023, 200, 109087. [Google Scholar] [CrossRef]
- Vilas Boas, J.; Oliveira, V.B.; Marcon, L.R.C.; Simões, M.; Pinto, A.M.F.R. Optimization of a Single Chamber Microbial Fuel Cell Using Lactobacillus Pentosus: Influence of Design and Operating Parameters. Sci. Total Environ. 2019, 648, 263–270. [Google Scholar] [CrossRef]
- Cheng, S.; Liu, H.; Logan, B.E. Increased Performance of Single-Chamber Microbial Fuel Cells Using an Improved Cathode Structure. Electrochem. Commun. 2006, 8, 489–494. [Google Scholar] [CrossRef]
- Logan, B.E.; Hamelers, B.; Rozendal, R.; Schröder, U.; Keller, J.; Freguia, S.; Aelterman, P.; Verstraete, W.; Rabaey, K. Microbial Fuel Cells: Methodology and Technology. Environ. Sci. Technol. 2006, 40, 5181–5192. [Google Scholar] [CrossRef] [PubMed]
- Gil, G.C.; Chang, I.S.; Kim, B.H.; Kim, M.; Jang, J.K.; Park, H.S.; Kim, H.J. Operational Parameters Affecting the Performannce of a Mediator-Less Microbial Fuel Cell. Biosens. Bioelectron. 2003, 18, 327–334. [Google Scholar] [CrossRef] [PubMed]
- Freguia, S.; Rabaey, K.; Yuan, Z.; Keller, J. Electron and Carbon Balances in Microbial Fuel Cells Reveal Temporary Bacterial Storage Behavior during Electricity Generation. Environ. Sci. Technol. 2007, 41, 2915–2921. [Google Scholar] [CrossRef] [PubMed]
- Lu, M.; Li, S.F.Y. Cathode Reactions and Applications in Microbial Fuel Cells: A Review. Crit. Rev. Environ. Sci. Technol. 2012, 42, 2504–2525. [Google Scholar] [CrossRef]
- Santoro, C.; Agrios, A.; Pasaogullari, U.; Li, B. Effects of Gas Diffusion Layer (GDL) and Micro Porous Layer (MPL) on Cathode Performance in Microbial Fuel Cells (MFCs). Int. J. Hydrogen Energy 2011, 36, 13096–13104. [Google Scholar] [CrossRef]
- Modin, O.; Wilén, B.M. A Novel Bioelectrochemical BOD Sensor Operating with Voltage Input. Water Res. 2012, 46, 6113–6120. [Google Scholar] [CrossRef]
- Winfield, J.; Greenman, J.; Ieropoulos, I. Response of Ceramic Microbial Fuel Cells to Direct Anodic Airflow and Novel Hydrogel Cathodes. Int. J. Hydrogen Energy 2019, 44, 15344–15354. [Google Scholar] [CrossRef]
- Yi, Y.; Xie, B.; Zhao, T.; Liu, H. Comparative Analysis of Microbial Fuel Cell Based Biosensors Developed with a Mixed Culture and Shewanella Loihica PV-4 and Underlying Biological Mechanism. Bioresour. Technol. 2018, 265, 415–421. [Google Scholar] [CrossRef] [PubMed]
- Quaglio, M.; Massaglia, G.; Vasile, N.; Margaria, V.; Chiodoni, A.; Salvador, G.P.; Marasso, S.L.; Cocuzza, M.; Saracco, G.; Pirri, F.C. A Fluid Dynamics Perspective on Material Selection in Microbial Fuel Cell-Based Biosensors. Int. J. Hydrogen Energy 2019, 44, 4533–4542. [Google Scholar] [CrossRef]
- Di Lorenzo, M.; Thomson, A.R.; Schneider, K.; Cameron, P.J.; Ieropoulos, I. A Small-Scale Air-Cathode Microbial Fuel Cell for on-Line Monitoring of Water Quality. Biosens. Bioelectron. 2014, 62, 182–188. [Google Scholar] [CrossRef]
- Lóránt, B.; László, K.; Tardy, G.M. Improving the Performance of Microbial Fuel Cells with Modified Carbon Aerogel Based Cathode Catalysts. Period. Polytech. Chem. Eng. 2022, 66, 1–9. [Google Scholar] [CrossRef]
- Wang, Y.; Liu, X.; Wang, M.; Zhang, P.; Zong, Y.; Zhang, Q. A Single-Chamber Microbial Fuel Cell for Rapid Determination of Biochemical Oxygen Demand Using Low-Cost Activated Carbon as Cathode Catalyst. Environ. Technol. 2018, 39, 3228–3237. [Google Scholar] [CrossRef] [PubMed]
- Zeng, L.; Li, X.; Shi, Y.; Qi, Y.; Huang, D.; Tadé, M.; Wang, S.; Liu, S. FePO4 Based Single Chamber Air-Cathode Microbial Fuel Cell for Online Monitoring Levofloxacin. Biosens. Bioelectron. 2017, 91, 367–373. [Google Scholar] [CrossRef]
- Sánchez-Peña, P.; Rodriguez, J.; Montes, R.; Baeza, J.A.; Gabriel, D.; Baeza, M.; Guisasola, A. Less Is More: A Comprehensive Study on the Effects of the Number of Gas Diffusion Layers on Air–Cathode Microbial Fuel Cells. ChemElectroChem 2021, 8, 3416–3426. [Google Scholar] [CrossRef]
- Jia, L.; Jiang, B.; Huang, F.; Hu, X. Nitrogen Removal Mechanism and Microbial Community Changes of Bioaugmentation Subsurface Wastewater Infiltration System. Bioresour. Technol. 2019, 294, 122140. [Google Scholar] [CrossRef]
- Wang, Y.; Wang, C.Y.; Chen, K.S. Elucidating Differences between Carbon Paper and Carbon Cloth in Polymer Electrolyte Fuel Cells. Electrochim. Acta 2007, 52, 3965–3975. [Google Scholar] [CrossRef]
- Zhao, F.; Harnisch, F.; Schröder, U.; Scholz, F.; Bogdanoff, P.; Herrmann, I. Challenges and Constraints of Using Oxygen Cathodes in Microbial Fuel Cells. Environ. Sci. Technol. 2006, 40, 5193–5199. [Google Scholar] [CrossRef]
- Córdova-Bautista, Y.; Paraguay-Delgado, F.; Pérez Hernández, B.; Pérez Hernández, G.; Martínez Pereyra, G.; Ramírez Morales, E. Influence of External Resistance and Anodic PH on Power Density in Microbial Fuel Cell Operated with B. Subtilis BSC-2 Strain. Appl. Ecol. Environ. Res. 2018, 16, 1983–1997. [Google Scholar] [CrossRef]
- Cristiani, P.; Carvalho, M.L.; Guerrini, E.; Daghio, M.; Santoro, C.; Li, B. Cathodic and Anodic Biofilms in Single Chamber Microbial Fuel Cells. Bioelectrochemistry 2013, 92, 6–13. [Google Scholar] [CrossRef]
- Logan, B.E.; Rossi, R.; Ragab, A.; Saikaly, P.E. Electroactive Microorganisms in Bioelectrochemical Systems. Nat. Rev. Microbiol. 2019, 17, 307–319. [Google Scholar] [CrossRef] [PubMed]
- Almatouq, A.; Babatunde, A.O.; Khajah, M.; Webster, G.; Alfodari, M. Microbial Community Structure of Anode Electrodes in Microbial Fuel Cells and Microbial Electrolysis Cells. J. Water Process Eng. 2020, 34, 101140. [Google Scholar] [CrossRef]
- Zhang, G.; Wang, K.; Zhao, Q.; Jiao, Y.; Lee, D.J. Effect of Cathode Types on Long-Term Performance and Anode Bacterial Communities in Microbial Fuel Cells. Bioresour. Technol. 2012, 118, 249–256. [Google Scholar] [CrossRef]
- Kiely, P.D.; Rader, G.; Regan, J.M.; Logan, B.E. Long-Term Cathode Performance and the Microbial Communities That Develop in Microbial Fuel Cells Fed Different Fermentation Endproducts. Bioresour. Technol. 2011, 102, 361–366. [Google Scholar] [CrossRef]
- Dávila, D.; Esquivel, J.P.; Sabaté, N.; Mas, J. Silicon-Based Microfabricated Microbial Fuel Cell Toxicity Sensor. Biosens. Bioelectron. 2011, 26, 2426–2430. [Google Scholar] [CrossRef] [PubMed]
- Janicek, A.; Gao, N.; Fan, Y.; Liu, H. High Performance Activated Carbon/Carbon Cloth Cathodes for Microbial Fuel Cells. Fuel Cells 2015, 15, 855–861. [Google Scholar] [CrossRef]
- Li, B.; Zhou, J.; Zhou, X.; Wang, X.; Li, B.; Santoro, C.; Grattieri, M.; Babanova, S.; Artyushkova, K.; Atanassov, P.; et al. Surface Modification of Microbial Fuel Cells Anodes: Approaches to Practical Design. Electrochim. Acta 2014, 134, 116–126. [Google Scholar] [CrossRef]
- López-Hincapié, J.D.; Picos-Benítez, A.R.; Cercado, B.; Rodríguez, F.; Rodríguez-García, A. Improving the Configuration and Architecture of a Small-Scale Air-Cathode Single Chamber Microbial Fuel Cell (MFC) for Biosensing Organic Matter in Wastewater Samples. J. Water Process Eng. 2020, 38, 101671. [Google Scholar] [CrossRef]
- Yaqoob, A.A.; Ibrahim, M.N.M.; Rafatullah, M.; Chua, Y.S.; Ahmad, A.; Umar, K. Recent Advances in Anodes for Microbial Fuel Cells: An Overview. Materials 2020, 13, 2078. [Google Scholar] [CrossRef] [PubMed]
- Aghababaie, M.; Farhadian, M.; Jeihanipour, A.; Biria, D. Effective Factors on the Performance of Microbial Fuel Cells in Wastewater Treatment—A Review. Environ. Technol. Rev. 2015, 4, 71–89. [Google Scholar] [CrossRef]
- González del Campo, A.; Cañizares, P.; Lobato, J.; Rodrigo, M.; Fernandez Morales, F.J. Effects of External Resistance on Microbial Fuel Cell’s Performance. In The Handbook of Environmental Chemistry; Springer: Cham, Switzerland, 2014; pp. 175–197. [Google Scholar]
- Stein, N.E.; Hamelers, H.V.M.; Buisman, C.N.J. Stabilizing the Baseline Current of a Microbial Fuel Cell-Based Biosensor through Overpotential Control under Non-Toxic Conditions. Bioelectrochemistry 2010, 78, 87–91. [Google Scholar] [CrossRef] [PubMed]
- Liu, H.; Ramnarayanan, R.; Logan, B.E. Production of Electricity during Wastewater Treatment Using a Single Chamber Microbial Fuel Cell. Environ. Sci. Technol. 2004, 38, 2281–2285. [Google Scholar] [CrossRef] [PubMed]
- Ren, L.; Ahn, Y.; Hou, H.; Zhang, F.; Logan, B.E. Electrochemical Study of Multi-Electrode Microbial Fuel Cells under Fed-Batch and Continuous Flow Conditions. J. Power Sources 2014, 257, 454–460. [Google Scholar] [CrossRef]
- Ma, L.; Chen, N.; Feng, C.; Hu, Y.; Li, M.; Liu, T. Feasibility and Mechanism of Microbial-Phosphorus Minerals-Alginate Immobilized Particles in Bioreduction of Hexavalent Chromium and Synchronous Removal of Trivalent Chromium. Bioresour. Technol. 2019, 294, 122213. [Google Scholar] [CrossRef] [PubMed]
- Spurr, M.W.A. Microbial Fuel Cell-Based Biosensors for Estimation of Biochemical Oxygen Demand and Detection of Toxicity. Ph.D. Thesis, Newcastle University, Newcastle upon Tyne, UK, 2017. [Google Scholar]
- Callahan, B.J.; McMurdie, P.J.; Rosen, M.J.; Han, A.W.; Johnson, A.J.A.; Holmes, S.P. DADA2: High-Resolution Sample Inference from Illumina Amplicon Data. Nat. Methods 2016, 13, 581–583. [Google Scholar] [CrossRef] [PubMed]
- Martinez, S.M.; Di Lorenzo, M. Electricity Generation from Untreated Fresh Digestate with a Cost-Effective Array of Floating Microbial Fuel Cells. Chem. Eng. Sci. 2019, 198, 108–116. [Google Scholar] [CrossRef]
- McMurdie, P.J.; Holmes, S. Phyloseq: An R Package for Reproducible Interactive Analysis and Graphics of Microbiome Census Data. PLoS ONE 2013, 8, e61217. [Google Scholar] [CrossRef]
- Zhu, T.J.; Lin, C.W.; Liu, S.H. Sensitivity and Reusability of a Simple Microbial Fuel Cell-Based Sensor for Detecting Bisphenol A in Wastewater. Chemosphere 2023, 320, 138082. [Google Scholar] [CrossRef]
- Juang, D.F.; Yang, P.C.; Chou, H.Y.; Chiu, L.J. Effects of Microbial Species, Organic Loading and Substrate Degradation Rate on the Power Generation Capability of Microbial Fuel Cells. Biotechnol. Lett. 2011, 33, 2147–2160. [Google Scholar] [CrossRef] [PubMed]
- Ding, A.; Yang, Y.; Sun, G.; Wu, D. Impact of Applied Voltage on Methane Generation and Microbial Activities in an Anaerobic Microbial Electrolysis Cell (MEC). Chem. Eng. J. 2016, 283, 260–265. [Google Scholar] [CrossRef]
- Tardy, G.M.; Lóránt, B.; Gyalai-Korpos, M.; Bakos, V.; Simpson, D.; Goryanin, I. Microbial Fuel Cell Biosensor for the Determination of Biochemical Oxygen Demand of Wastewater Samples Containing Readily and Slowly Biodegradable Organics. Biotechnol. Lett. 2021, 43, 445–454. [Google Scholar] [CrossRef]
- Ayyaru, S.; Dharmalingam, S. Enhanced Response of Microbial Fuel Cell Using Sulfonated Poly Ether Ether Ketone Membrane as a Biochemical Oxygen Demand Sensor. Anal. Chim. Acta 2014, 818, 15–22. [Google Scholar] [CrossRef]
- Xiao, N.; Selvaganapathy, P.R.; Wu, R.; Huang, J.J. Influence of Wastewater Microbial Community on the Performance of Miniaturized Microbial Fuel Cell Biosensor. Bioresour. Technol. 2020, 302, 122777. [Google Scholar] [CrossRef]
- Salvian, A.; Farkas, D.; Ramirez-Moreno, M.; Torruella-Salas, D.; Berná, A.; Avignone-Rossa, C.; Varcoe, J.R.; Esteve- Núñez, A.; Gadkari, S. Resilience of Anodic Biofilm in Microbial Fuel Cell Biosensor for BOD Monitoring of Urban Wastewater. npj Clean. Water 2024, 7, 53. [Google Scholar] [CrossRef]
- Jiang, Y.; Liang, P.; Liu, P.; Miao, B.; Bian, Y.; Zhang, H.; Huang, X. Enhancement of the Sensitivity of a Microbial Fuel Cell Sensor by Transient-State Operation. Environ. Sci. 2017, 3, 472–479. [Google Scholar] [CrossRef]
- Kolajo, O.O.; Pandit, C.; Thapa, B.S.; Pandit, S.; Mathuriya, A.S.; Gupta, P.K.; Jadhav, D.A.; Lahiri, D.; Nag, M.; Upadhye, V.J. Impact of Cathode Biofouling in Microbial Fuel Cells and Mitigation Techniques. Biocatal. Agric. Biotechnol. 2022, 43, 102408. [Google Scholar] [CrossRef]
- Zhang, F.; Pant, D.; Logan, B.E. Long-Term Performance of Activated Carbon Air Cathodes with Different Diffusion Layer Porosities in Microbial Fuel Cells. Biosens. Bioelectron. 2011, 30, 49–55. [Google Scholar] [CrossRef]
- Li, D.; Liu, J.; Qu, Y.; Wang, H.; Feng, Y. Analysis of the Effect of Biofouling Distribution on Electricity Output in Microbial Fuel Cells. RSC Adv. 2016, 6, 27494–27500. [Google Scholar] [CrossRef]
- Al-Amshawee, S.; Yunus, M.Y.B.M.; Lynam, J.G.; Lee, W.H.; Dai, F.; Dakhil, I.H. Roughness and Wettability of Biofilm Carriers: A Systematic Review. Environ. Technol. Innov. 2021, 21, 101233. [Google Scholar] [CrossRef]
- Shafahi, M.; Vafai, K. Biofilm Affected Characteristics of Porous Structures. Int. J. Heat. Mass. Transf. 2009, 52, 574–581. [Google Scholar] [CrossRef]
- Chen, Y.C.; Karageorgiou, C.; Eller, J.; Schmidt, T.J.; Büchi, F.N. Determination of the Porosity and Its Heterogeneity of Fuel Cell Microporous Layers by X-Ray Tomographic Microscopy. J. Power Sources 2022, 539, 231612. [Google Scholar] [CrossRef]
- Vilajeliu-Pons, A.; Bañeras, L.; Puig, S.; Molognoni, D.; Vilà-Rovira, A.; Hernández-del Amo, E.; Balaguer, M.D.; Colprim, J. External Resistances Applied to MFC Affect Core Microbiome and Swine Manure Treatment Efficiencies. PLoS ONE 2016, 11, e0164044. [Google Scholar] [CrossRef] [PubMed]
- Jung, S.; Regan, J.M. Influence of External Resistance on Electrogenesis, Methanogenesis, and Anode Prokaryotic Communities in Microbial Fuel Cells. Appl. Environ. Microbiol. 2011, 77, 564–571. [Google Scholar] [CrossRef] [PubMed]
- Madigan, M.; Bender, K.; Buckley, D.; Sattley, W.; Stahl, D. The Foundation of Microbiology. In Brock Biology of Microorganisms; Pearson Education, Limited: London, UK, 2018; pp. 37–172. [Google Scholar]
- Choi, T.S.; Song, Y.C.; Joicy, A. Influence of Conductive Material on the Bioelectrochemical Removal of Organic Matter and Nitrogen from Low Strength Wastewater. Bioresour. Technol. 2018, 259, 407–413. [Google Scholar] [CrossRef] [PubMed]
- Li, X.; Wang, X.; Zhang, Y.; Gao, N.; Li, D.; Zhou, Q. Effects of Catalyst Layer and Gas Diffusion Layer Thickness on the Performance of Activated Carbon Air-Cathode for Microbial Fuel Cells. Int. J. Electrochem. Sci. 2015, 10, 5086–5100. [Google Scholar] [CrossRef]
- Luo, D.; Zhang, K.; Song, T.; Xie, J. Enhancing Microbial Electrosynthesis by Releasing Extracellular Polymeric Substances: Novel Strategy through Extracellular Electron Transfer Improvement. Biochem. Eng. J. 2022, 184, 108496. [Google Scholar] [CrossRef]
- Boyd, A.; Chakrabarty, A.M. Pseudomonas Aeruginosa Biofilms: Role of the Alginate Exopolysaccharide. J. Ind. Microbiol. 1995, 15, 162–168. [Google Scholar] [CrossRef]
- Pham, T.H.; Boon, N.; Aelterman, P.; Clauwaert, P.; De Schamphelaire, L.; Vanhaecke, L.; De Maeyer, K.; Höfte, M.; Verstraete, W.; Rabaey, K. Metabolites Produced by Pseudomonas Sp. Enable a Gram-Positive Bacterium to Achieve Extracellular Electron Transfer. Appl. Microbiol. Biotechnol. 2008, 77, 1119–1129. [Google Scholar] [CrossRef]
- Jian, M.; Xue, P.; Shi, K.; Li, R.; Ma, L.; Li, P. Efficient Degradation of Indole by Microbial Fuel Cell Based Fe2O3-Polyaniline-Dopamine Hybrid Composite Modified Carbon Felt Anode. J. Hazard. Mater. 2020, 388, 122123. [Google Scholar] [CrossRef]
- Jangir, Y.; French, S.; Momper, L.M.; Moser, D.P.; Amend, J.P.; El-Naggar, M.Y. Isolation and Characterization of Electrochemically Active Subsurface Delftia and Azonexus Species. Front. Microbiol. 2016, 7, 756. [Google Scholar] [CrossRef]
- Meng, L.; Xie, L.; Hirose, Y.; Nishiuchi, T.; Yoshida, N. Reduced Graphene Oxide Increases Cells with Enlarged Outer Membrane of Citrifermentans Bremense and Exopolysaccharides Secretion. Biosens. Bioelectron. 2022, 218, 114754. [Google Scholar] [CrossRef]
- Guo, N.; Ma, X.; Ren, S.; Wang, S.; Wang, Y. Mechanisms of Metabolic Performance Enhancement during Electrically Assisted Anaerobic Treatment of Chloramphenicol Wastewater. Water Res. 2019, 156, 199–207. [Google Scholar] [CrossRef]
- Shi, Y.; Liu, T.; Chen, S.; Quan, X. Accelerating Anaerobic Hydrolysis Acidification of Dairy Wastewater in Integrated Floating-Film and Activated Sludge (IFFAS) by Using Zero-Valent Iron (ZVI) Composite Carriers. Biochem. Eng. J. 2022, 177, 108226. [Google Scholar] [CrossRef]
- Qiu, S.; Wang, L.; Zhang, Y.; Yu, Y. Microbial Fuel Cell-Based Biosensor for Simultaneous Test of Sodium Acetate and Glucose in a Mixed Solution. Int. J. Environ. Res. Public Health 2022, 19, 12297. [Google Scholar] [CrossRef]
- Cheng, P.; Shan, R.; Yuan, H.R.; Deng, L.F.; Chen, Y. Enhanced Rhodococcus Pyridinivorans HR-1 Anode Performance by Adding Trehalose Lipid in Microbial Fuel Cell. Bioresour. Technol. 2018, 267, 774–777. [Google Scholar] [CrossRef]
- Nath, D.; Ghangrekar, M.M. Plant Secondary Metabolites Induced Electron Flux in Microbial Fuel Cell: Investigation from Laboratory-to-Field Scale. Sci. Rep. 2020, 10, 17185. [Google Scholar] [CrossRef]
- Yang, Z.; Li, H.; Li, N.; Sardar, M.F.; Song, T.; Zhu, H.; Xing, X.; Zhu, C. Dynamics of a Bacterial Community in the Anode and Cathode of Microbial Fuel Cells under Sulfadiazine Pressure. Int. J. Environ. Res. Public Health 2022, 19, 6253. [Google Scholar] [CrossRef]
- Zhu, K.; Wang, S.; Liu, H.; Liu, S.; Zhang, J.; Yuan, J.; Fu, W.; Dang, W.; Xu, Y.; Yang, X.; et al. Heteroatom-Doped Porous Carbon Nanoparticle-Decorated Carbon Cloth (HPCN/CC) as Efficient Anode Electrode for Microbial Fuel Cells (MFCs). J. Clean. Prod. 2022, 336, 130374. [Google Scholar] [CrossRef]
- Garbini, G.L.; Barra Caracciolo, A.; Grenni, P. Electroactive Bacteria in Natural Ecosystems and Their Applications in Microbial Fuel Cells for Bioremediation: A Review. Microorganisms 2023, 11, 1255. [Google Scholar] [CrossRef]
- He, J.; Xin, X.; Pei, Z.; Chen, L.; Chu, Z.; Zhao, M.; Wu, X.; Li, B.; Tang, X.; Xiao, X. Microbial Profiles Associated Improving Bioelectricity Generation from Sludge Fermentation Liquid via Microbial Fuel Cells with Adding Fruit Waste Extracts. Bioresour. Technol. 2021, 337, 125452. [Google Scholar] [CrossRef] [PubMed]
- Santos, R.G.; Hurtado, R.; Gomes, L.G.R.; Profeta, R.; Rifici, C.; Attili, A.R.; Spier, S.J.; Giuseppe, M.; Morais-Rodrigues, F.; Gomide, A.C.P.; et al. Complete Genome Analysis of Glutamicibacter Creatinolyticus from Mare Abscess and Comparative Genomics Provide Insight of Diversity and Adaptation for Glutamicibacter. Gene 2020, 741, 144566. [Google Scholar] [CrossRef]
- Lee, C.Y.; Ho, K.L.; Lee, D.J.; Su, A.; Chang, J.S. Electricity Harvest from Nitrate/Sulfide-Containing Wastewaters Using Microbial Fuel Cell with Autotrophic Denitrifier, Pseudomonas Sp. C27. Int. J. Hydrogen Energy 2012, 37, 15827–15832. [Google Scholar] [CrossRef]
- Xing, D.; Cheng, S.; Logan, B.E.; Regan, J.M. Isolation of the Exoelectrogenic Denitrifying Bacterium Comamonas Denitrificans Based on Dilution to Extinction. Appl. Microbiol. Biotechnol. 2010, 85, 1575–1587. [Google Scholar] [CrossRef]
- Hou, J.; Deng, H.-K.; Liu, Z.-X.; Xu, P.; Wang, L.-J. Sulfur Metabolism in Rhodococcus Species and Their Application in Desulfurization of Fossil Fuels. J. Appl. Microbiol. 2023, 134, lxad048. [Google Scholar] [CrossRef]
- Dutta, K.; Kundu, P.P. A Review on Aromatic Conducting Polymers-Based Catalyst Supporting Matrices for Application in Microbial Fuel Cells. Polym. Rev. 2014, 54, 401–435. [Google Scholar] [CrossRef]

Disclaimer/Publisher’s Note: The statements, opinions and data contained in all publications are solely those of the individual author(s) and contributor(s) and not of MDPI and/or the editor(s). MDPI and/or the editor(s) disclaim responsibility for any injury to people or property resulting from any ideas, methods, instructions or products referred to in the content. |
© 2024 by the authors. Licensee MDPI, Basel, Switzerland. This article is an open access article distributed under the terms and conditions of the Creative Commons Attribution (CC BY) license (https://creativecommons.org/licenses/by/4.0/).