Abstract
In the West African Monetary and Economic Union (UEMOA), information on the characteristics of the users and patterns of electricity end-uses remains hard to find. This study aims to contribute to reducing the gap in research on domestic electricity consumption in the region by unveiling the ownership rates, patterns of use and electricity consumption of domestic appliances in urban households through a city-wide survey. Three categories of urban users were investigated including high, medium and low consumers. Findings demonstrated various ownership rates for appliances, ranging from 100% for lighting fixtures to 0% for washing machines depending on user category. Domestic electricity demonstrated patterns consisting of three peak demand periods, with the main ones occurring in the evening (19:00 to 20:00) and the night (22:00). Other demand characteristics include an average daily electricity use ranging from 0.50 to 6.42 kWh per household, a maximum power demand of between 0.19 and 0.70 kW and a daily load factor between 35 and 58%. Finally, the appliances contributing the most to domestic electricity use include air-conditioners, fans, fridges and freezers, televisions and lighting fixtures, with contributions differing from one category of user to another. Policy implications including review of the appliances’ importations framework and policies, and incentives for purchasing efficient appliances, design of more tailored policies, considering the different backgrounds of the users, education enhancement on energy behaviours for increasing energy efficiency/conservation, and implementation of DSM programs including load levelling, load shifting and load reducing depending on the type of appliance for energy conservation in the domestic buildings were derived. Overall, a large range of stakeholders of the electricity sector, not only in the West African Economic and Monetary Union (UEMOA), but also in other regions and countries sharing common characteristics should be interested in the results of this study.
1. Introduction
Demand and supply of electrical energy occur simultaneously most of the time [1]. This requires accurate knowledge of either the characteristics of the demand at the moment of use or in advance for the prediction of the supply. In such a context, accurate and extensive knowledge on users’ characteristics and patterns of use is of upmost importance. Indeed, achieving accurate energy planning in on-grid/off-grid areas and sustainable use of electricity require reliable, adequate and accurate data on patterns of use.
The residential sector is one of the sectors which uses the most electricity in the worldwide, and especially in Africa [2]. In residential buildings, the purposes of electricity use mainly include lighting, space ventilation, heating and cooling, cooking and preserving food, entertainment and communication, and home working [3,4]. On the one hand, the direct drivers domestic electricity use are, therefore, recognised as appliances’ patterns of use, power and ownership [5]. On the other hand, users’ behaviours and characteristics are known to have a consistent (indirect) effect on electricity consumption [5]. For example, different background and economic levels will not only lead to different ownership rates of domestic appliances, but also different use behaviours [4,6]. Such features make the residential sector a key target for energy efficiency/conservation and play an important role in the transition to the sustainable use of electricity, especially for the African region [7].
Occupants’ behaviours alone are estimated to have an energy saving potential of 10–25% within residential buildings [8]. However, such potential remains particularly theoretical in Sub-Saharan Africa, and especially in the West African region, as they are still unexploited [9]. Among other things, the lack of accurate information about the users, their behaviours and lifestyle, as well as the characteristics of the demand (patterns of use, most contributing end-uses, etc.), limits the implementation of accurate policies and strategies for the good management of electricity use in the region. It remains difficult to find research on the characteristics of domestic electricity use and the implementation of DSM/EE strategies for the optimisation of electricity use in the domestic residential sector.
While extensive literature exists on the three main aspects of domestic electricity use (i. the understanding of its driving factors, ii. the analysis of its characteristics, and iii. the interventions and strategies implemented for its management), in developed countries [10,11,12,13,14,15,16,17,18,19], it remains hard to find a consistent body of literature on domestic electricity use in developing countries, especially in the Sub-Saharan Africa region. Instead, one of the most investigated fields in the literature about electricity in West Africa is about “increasing access to electricity”, as like many other developing regions, it is amongst the least electrified. Either through policy [20,21,22], strategies [23,24,25] or specific systems implementation [26,27,28], the increase in access has been widely investigated in the electricity literature in West Africa. However, for the same region, previous literature has also demonstrated that relying only on increasing access to electricity does not guarantee the sustainable future that all the electricity sector’s actors desire [29,30].
In short, it appears that good management of the use of electricity is of great importance in West Africa, as first, good management could potentially avoid investing large amounts of money in electricity generation projects. For example, de la Rue du Can et al. [31] demonstrated that good implementation of energy efficiency can help offset 442 MW of generation-level demand, and therefore help guarantee energy access for an additional 6 million rural customers. In addition, as electricity demand keeps increasing, good management is indispensable to guarantee a sustainable future for the sector. Cleaner production methods and efficient consumption are essential to limit the use of fossils fuels, which are the main generating sources and are responsible for many environmental issues.
Finally, powering new consumers requires a design phase of the grid, especially in remote areas, where the national grid is absent, making building mini-grids necessary. Therefore, accurate information on the users’ patterns and behaviours is of great importance to estimate, for example, the initial load, which is a critical task [32]. In fact, overestimating the load profile will eventually jeopardise the profitability of the project due to extra costs, while underestimating the demand will lead to issues regarding the reliability of provided services and leaves the customers dissatisfied [32,33,34,35].
Overall, for the West African region, the few studies that are found on the characteristics of electricity demand are concentrated in Ghana [36,37,38,39] and Nigeria [40,41,42]. For example, a bottom-up approach (based on a technological-based top-down approach and stock accounting model) was adopted by Diawuo et al. [37] to characterise and disaggregate residential electricity use in Ghana. A total of 21 appliances were included in the study, with 9 scenarios investigated and tested from 2015 (the base year) and 2050. Findings suggested that the individual consumptions (per household) in the residential sector will range from 588 to 1170 kWh per annum in Ghana by 2050. Appliances including lighting fixtures (CFL), fridges and freezers, air-conditioners, fans, televisions, electric irons and washing machines, which accounted for 93% of the electricity demand in the Ghanaian residential sector in 2015, will maintain their dominance in the electricity demand by 2050 (they will still share 90% of the demand), with fridges expected to be the most consuming end-use.
Furthermore, the same authors [38] combined survey and end-use monitoring data from 80 households to assess the demand response (DR) potential of the domestic residential sector in Ghana. Again, a bottom-up approach was used, but this time to develop aggregated hourly load curves based on a modified end-use model. Through such a methodology, the potential for peak demand reduction was investigated from 2018 to 2050, and the findings showed that the potential for peak demand reduction varies between 65 and 406 MW, which corresponds to 2–14% of the demand. As a consequence, economic viability for investment in DR was retained, with a net value ranging between 28 and 645 million USD. Also, Adeoye and Spataru [43] used information including household appliance stock, weather conditions, type of day, available daylight hours and electrification rates to model hourly electricity demand for 14 West African countries by 2030. Findings demonstrated higher use of electricity during dry seasons compared to wet seasons. Also, the authors found that electricity demand will increase by 5 fold in 2030 compared to that in 2016.
With such a summary of the literature, it appears that information on the actual characteristics of domestic electricity use, and more specifically on patterns of use, is quasi-inexistent in the West African region, especially in the West African Monetary and Economic Union (UEMOA), either for the electricity utilities or in the scientific literature. Therefore, the purpose of this study is to contribute to reducing the gap in research on domestic electricity consumption in the region by unveiling the ownership rates, patterns of use and electricity consumption of domestic appliances in urban households.
By addressing the following crucial research questions, this study not only bridges the gap in current research but also provides invaluable assistance in decision making for electricity sector actors. These questions are pivotal in predicting electricity demand in domestic buildings, designing and implementing renewable energy systems, and tailoring policies for energy efficiency in the residential sector:
- What are the different types of electric appliances and end-uses found in the urban households of the UEMOA?
- What are electric appliances’ patterns of use, and to what extent do they and their end-uses contribute to the urban domestic electricity demand in the UEMOA?
- What are the characteristics of the domestic residential electricity demand (load profiles and total electricity consumption), and what are the effects of the seasonal variation on them?
The structure of this paper is designed to deliver practical insights. Section 2 presents this study’s materials and methods, providing a clear understanding of the research process. Section 3 presents the results, while Section 4 discusses them in terms of comparison with other studies, policy implications, and applications for future research. The conclusions succinctly summarise the research’s critical findings, offering actionable recommendations for the electricity sector in the UEMOA.
2. Materials and Methods
2.1. Study Area
Only one UEMOA country was chosen due to the available resources for the research project, of which this study is a part. The country of Burkina Faso was chosen following a previous analysis by the authors [30] of the level of electricity security within the UEMOA countries, which are believed to share common characteristics [44]. Indeed, such an analysis revealed many challenges in the electricity sector in Burkina Faso including high electricity intensity, low affordability of electricity services and increasing dependence from exports [30]. In addition, along with Niger, Burkina Faso is in the top 20 countries with the lowest electrification rates [45], meaning that the need of effective strategies and policies for increasing access to electricity and ensuring its good management are key initial steps for the country.
Also, in line with the context of the UEMOA, the residential sector represents the second most consuming sector of the country (36% of the total electricity used). Furthermore, according to the National Energy Efficiency Action Plan (PANEE) of Burkina Faso, the building sector was identified as the sector with the highest energy efficiency (EE) potential, accounting for 61% of the total identified potential for the country [46]. Domestic buildings represent 37% of the EE potential for the overall buildings sector, meaning the sector accounts for 23% of the total identified EE potential in Burkina Faso. Finally, regarding the contribution of specific appliances, air-conditioners and refrigerators represent 9% and 11% of the EE potential, respectively [46].
Burkina Faso was therefore chosen for its representativeness of the challenges within the electricity sector in the UEMOA. Priority was given to urban areas that use 74% of the total electricity used in the country [47] despite representing only 26.4% of the total population. More specifically, the city of Ouagadougou, the capital and largest city of the country was chosen because of its country’s urban areas representativeness of the urban areas of the country. Also, it bears a variety of socio-economic, cultural and environmental backgrounds. Indeed, Ouagadougou is home to 2,453,496 inhabitants, which corresponds to a share of 45.4% with respect to the population in urban areas of the country [48]. Located in the central region of the country, Ouagadougou consists of 12 districts and 55 sectors (Figure 1). This location places the city in a zone in which the climate is of the Sudano-Sahelian type, giving the atmosphere, a mainly dry and hot character. Three seasons can be distinguished throughout the year: (i) the dry and cold season covering December to February, (ii) the rainy season running from July to October, and finally the (iii) the dry and hot season covering November and March to June [49]. The main characteristics of the climate include an average relative humidity of 48.5%, rainfall varying between less than 50 mm and 200 mm and average monthly temperatures between 25 °C and 33 °C [49].
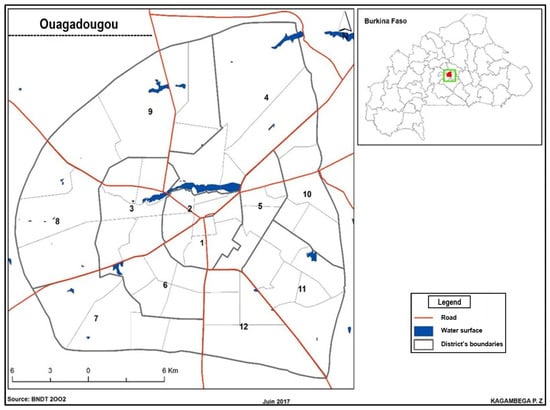
Figure 1.
Map of Ouagadougou and its 12 districts (adapted from [50]).
2.2. Research Design and Data Collected
A consistent body of literature exists on Residential Electricity Consumption (REC) worldwide. Data collection methods that support the studies conducted in this sense are, most of the time, either survey based or monitoring based [51]. This research tries to be more accurate by combining the two methods. Data were provided, therefore, from a city-wide survey conducted within households in Ouagadougou, and were then supplemented with measured consumptions regarding domestic residential electricity. In this sense, meaningful analyses could be provided.
The residential electricity end-use survey was designed after a consistent review of the literature on REC [51,52,53,54], as well as guides for conducting REC studies [55] and the nationally available references for comparison [56,57,58]. So far, this is the first large-scale city-wide household electricity consumption study undertaken, according to the authors, in Burkina Faso.
2.2.1. Research Design
One widely acknowledged definition of research design is “plans and the procedures for research that span the decisions from broad assumptions to detailed methods of data collection and analysis” [59]. Three types of design are most often employed in research: qualitative, quantitative, and mixed-methods research. Quantitative and qualitative tend to be seen as opposites or dichotomies. However, they should not, as they represent different ends on a continuum [60]. In this sense, mixed-methods research originates from the middle of this continuum as it consists of elements of both qualitative and quantitative approaches [59].
A mixed-methods design was conducted to bridge the gap in current research on domestic electricity in the UEMOA by yielding a comprehensive analysis of city-scale electricity end-uses in Burkina Faso. A mixed-methods design is proper when either the quantitative or qualitative approach is inadequate to understand best a research problem or the strengths of both quantitative and qualitative research can provide the best understanding [59], which is in our case here. Table 1 explains the design process and the reasons for choosing the data collection methods.

Table 1.
Framework of the research design: data needed for addressing the research questions and methods/techniques used for its collection.
The research sample size, a crucial aspect of our study, was meticulously calculated as 384. This calculation took into account a 50% proportion (p), a margin of error (e), and an interval of confidence (CI) of 5% and 95%, respectively. The number 384 was derived from a thoughtful combination of the sample sizes from the 12 districts, with a proportional relationship established between the total number of households in the districts and the number of surveyed households in them.
For a comprehensive understanding of our research area, we employed a variety of data collection methods. Questionnaires, due to their suitability for data gathering [61], and their wide use in the REC studies [62], were the main method used. This included administered and self-reported surveys, as well as unstructured interviews (See Table 1).
To ensure an equal chance of selection for each household, random sampling was used during the survey. However, the willingness and readiness of households were also factors on which the participation of households depended. An effort was also made to ensure that the sampling bears households demonstrating various economic levels and backgrounds. Indeed, selection proceeded in the corresponding area of investigation (each district) after a first screening to capture the backgrounds of the households present in the area. Approbation from householders was subject to the following considerations: presentation of an information sheet to participants (description of the content, scope and objectives of the survey), obtaining permission from the participants, presentation of an ID of the hosting institute to the participants by the researchers before starting interviews, keeping confidential and securely storing the personal data of the participants.
After a survey pilot test in August 2021, 522 households were approached from September 2021 to February. A total of 387 accurate responses were recorded, leaving 135 rejections and incomplete reports. This 74.1% participation rate is close to the 77.6% obtained on average in in-person interviews [62]. Indeed, 357 accurate responses were obtained during the administered survey, while 30 were obtained through self-report surveys.
2.2.2. Data Collected
Figure 2 helps illustrate the structure of the data collected. Overall, the research was designed to collect data, including household, dwelling, socio-economic characteristics, appliance features, user behaviour, households’ daily life activities and other elements. These elements were chosen as they characterise households’ behaviours and lifestyles regarding the use of electrical energy. In addition, the electricity bills were collected from the households for 2021 and were used to calculate the annual electricity use of the households that participated in the survey.
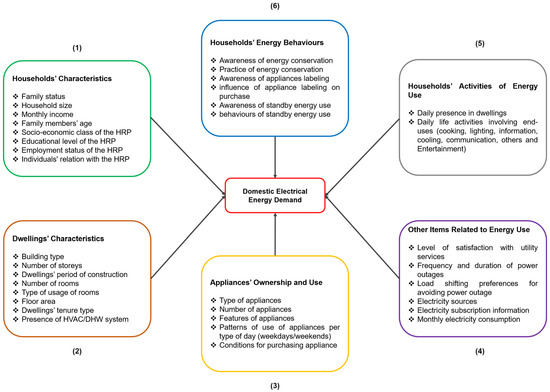
Figure 2.
Structure of the data covered by the survey.
As can be seen in Table 2, surveyed households were mostly couples and families with dependent children (61.5%), showing an average size of 6 people and mainly living in owner-occupied (65.4%) and detached houses (57.6%), with an average of five rooms per houses, demonstrating an average floor area of 101.5 m². Households showed monthly incomes of up to 400,000 FCFA (662 USD), with responsible people (HRP) demonstrated to be mostly 40 or older, working as full-time employees or in a personal business.
Table 2.
Electricity use-activities conducted in the surveyed households and corresponding appliances.
Finally, households demonstrated an average presence in the dwelling of 12 h during the day (24 h) for the living room, with a daytime presence of 6 h. For the bedrooms, an average daily presence of 12 h was recorded, with a reported 2 h on average hours presence in bedrooms for activities other than sleeping.
2.3. Data Processing and Methodology
Instead of trying to predict the periodical behaviour of electricity demand, characterisation describes its use patterns [1]. In this study, the dataset created from the survey’s results was used to yield a comprehensive analysis of the patterns of use and electricity consumption of domestic appliances. Energy monitoring is widely recognised as the most accurate solution for energy consumption; however, its costly implementation and complexity make it challenging to do so with large sample sizes [55,61]. Therefore, to identify patterns of use and computing electricity consumption, this study uses more traditional survey methods, which have also demonstrated effectiveness [63].
The general methodology used for conducting this study is given in Figure 3. From the figure, it can be seen that use is first made of the survey to create a database of households’ energy behaviours, appliance stock, appliance use patterns and related activities (step 1). A quantitative analysis of the data generated was (step 2) to define the type of appliances, to identify their power, daily use periods and time of use, their unitary consumption cycle and their standby features (power and households’ behaviours regarding standby consumption) where applicable. The subsequent data are then used to generate a load curve for a typical appliance in a household. This procedure is then continued for the n appliance end-uses, which generate a household’s disaggregated total load profile (step 3). The previous (step 3) is then repeated for the n households of the sample. It gives the disaggregated pattern of use (load profile) of the domestic electricity demand as well as the disaggregated total electricity consumption (TEC) for the overall sample (step 4). Following these steps, the typical TEC of the end-uses were derived, and the breakdown of the sample’s TEC was given per appliance (step 5).
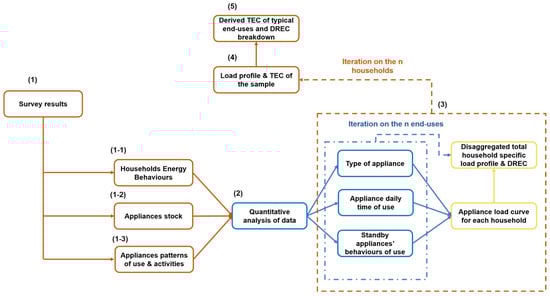
Figure 3.
General methodology of this study.
Numerous typical appliances were revealed in the survey conducted within the households and were therefore included in this study (See Table A1). To investigate appliance ownership in the households, two characteristics of the appliances were defined namely saturation and ownership. Appliance saturation corresponds to the number of a typical appliance per household, while appliance ownership (Equation (1)) refers to the share of household that possess at least one of the typical appliance [51,64,65].
With referring to the ownership rate of an appliance i, to the saturation of an appliance i, to the total number of the appliance I, to the number of households owing one or more appliances i, and to the total number of households in the sample.
As in situ recordings were not possible, the product-based measurements [42] was used for the appliances features: based on the recorded appliances’ characteristics in the survey (age, model, capacity, size and brand), features and power ratings of the appliances were measured in retail stores or collected from standard products in the market [53].
For the patterns of use of appliances, period of use of each appliance recorded in the households were recorded from the participants for each of the three seasons of the year indicated previously (dry and hot, rainy and dry and cold). Patterns of occupancy and activities conducted within different periods of the day were also determined based on discussion with the participants. As it can be seen in Figure 4, this helped to define in the context of this study, six types or categories of appliances that correspond to households’ daily life activities: lighting, information, communication and entertainment (ICE), cooling, cooking and preserving food, standby use and others.
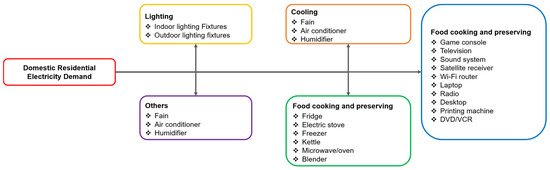
Figure 4.
End-uses or daily life activities involving electrical appliances.
From the obtained patterns of use of the electricity demand (load profiles), four characterising electrical parameters were used [15]: the maximum demand (DMD) and its occurring period (ToU), the daily load factor (DLF) and the total electricity consumption (TEC).
- The TEC
As given in Equation (3). The TEC corresponds to a defined period electricity consumption [1]. Such information is of great importance as it is the one widely used for computing domestic users’ electricity bills.
- The DMD
From the load profile, the DMD which is given in Equation (4), is a measure of the average maximum value that the demand (kW) can reach over a defined period. Such a parameter, which is of great importance for both users and utility services, helps to characterise the load profiles’ shape. The DMD is very good, not only for load forecasting, but also for demand-side management programs including demand response-based ones.
- The DLF
From the load profile, the DLF is given in Equation (5). Such a parameter assesses the ratio between the maximum and mean demands. As a characteristic of the shape of the load profile, the DLF is a measure of the “Peakiness” of the load profile [15]. Large values of DLF imply great use of electricity in short periods during the day, while small values correspond to a more balanced use of electricity. Again, this parameter is of great importance for the DSM programs implementation.
- The ToU
From the load profile, the ToU is given in Equation (6). It indicates the period of the day at which the maximum regularly occurs. Such a parameter reflects the period at which households tend or will use the most electricity [15]. It is therefore an important parameter for both the utility services and the users and for the implementation of DSM programs.
For Equations (3)–(6), n refers to the corresponding number of days for which the demand is computed, and for a day, m is the number of periods and is the hourly averaged demand (kW).
Using these parameters, patterns of use of the investigated appliances and the overall demand were given and analysed by type of day (weekends and weekdays) for the three aforementioned seasons. Breakdown of the overall electricity demand by type of appliance and type of activity were also given for the three investigated seasons and overall.
Finally, as a result of analyses of the existing relations between households’ electricity consumption and their behaviours and characteristics, the literature on domestic electricity use have demonstrated the possibility of categorising or segmenting customers, with respect to their characteristics and behaviours. Both quantitative [10,13,66,67,68] and qualitative [67,69,70] approaches were demonstrated to be possibly used depending on the purpose of the studies. In this study, use was made of the “thirds” method consisting of using the sorted (in ascending order) electricity demand (the TEC) of the households to group them into three categories of consumers namely the thirds. Such a method is common to a very wide range of previous studies [12,13,71,72] and was therefore, used in our study for having (among other things) elements of comparison with previous literature. The first group of consumers was named the “low consumers”, the second as the “medium consumers”, and the last as the “high consumers”. In this study, the sizes of the groups were 129 households.
The objective of studying the users by category was to unveil characteristics of the domestic electricity use that may be hidden behind studying that of the whole day, given the size of the surveyed sample. Different groups of users were expected to imply different backgrounds, different characteristics and behaviours, and therefore different patterns of use for the domestic electricity use, that are necessary for design and implementation of more adapted and accurate policies based on the results of the research in the UEMOA.
3. Results
3.1. Groups of Consumers
Table 3 shows the annual electricity consumptions of the three user groups as well as the overall sample. On average the medium consumers used more than twice the electricity used by the low consumers, while the high consumers used more than twice the electricity used by the medium consumers and slightly less than 5-fold more than the low consumers. For the overall sample, it is evident that electricity consumption (mean and standard deviation) is primarily driven by the high consumers. This confirms the relevance of forming such groups of consumers for the analysis.
Table 3.
Descriptive statistics of electricity consumption for the three groups of consumers and the overall sample.
3.2. Characteristics of the Households’ Appliance Stock
Table 4 gives the ownership and saturation rates of appliances. A total of 23 appliances were found as the average appliance stock of the participant households. The most common appliances were lighting fixtures for all user groups, followed by fans and television sets. Fans had ownership rates of between 95% for low consumers and 100% for high consumers, with an average of 2.29 fans per household. Furthermore, the saturation of fans is high for all user groups. Televisions also had high ownership with 91% of the users owning at least one television. Satellite receivers, which are primarily used simultaneously with TVs had the highest ownership (96%) among high consumers, while low consumers demonstrated the lowest rates. Fridges had ownership rates of more than 50% for all groups of users. Appliances such as laptops, freezers and air-conditioners showed various ownership and saturation rates depending on the consumer group.
Table 4.
Appliance ownership and saturation rates for the three groups of consumers.
3.3. Patterns of Use of Domestic Appliances
Households were asked to indicate for each season the daily period of use of each appliance in their home, the activity conducted, and their occupancy patterns. These data were used to generate patterns of use of domestic appliances for the households.
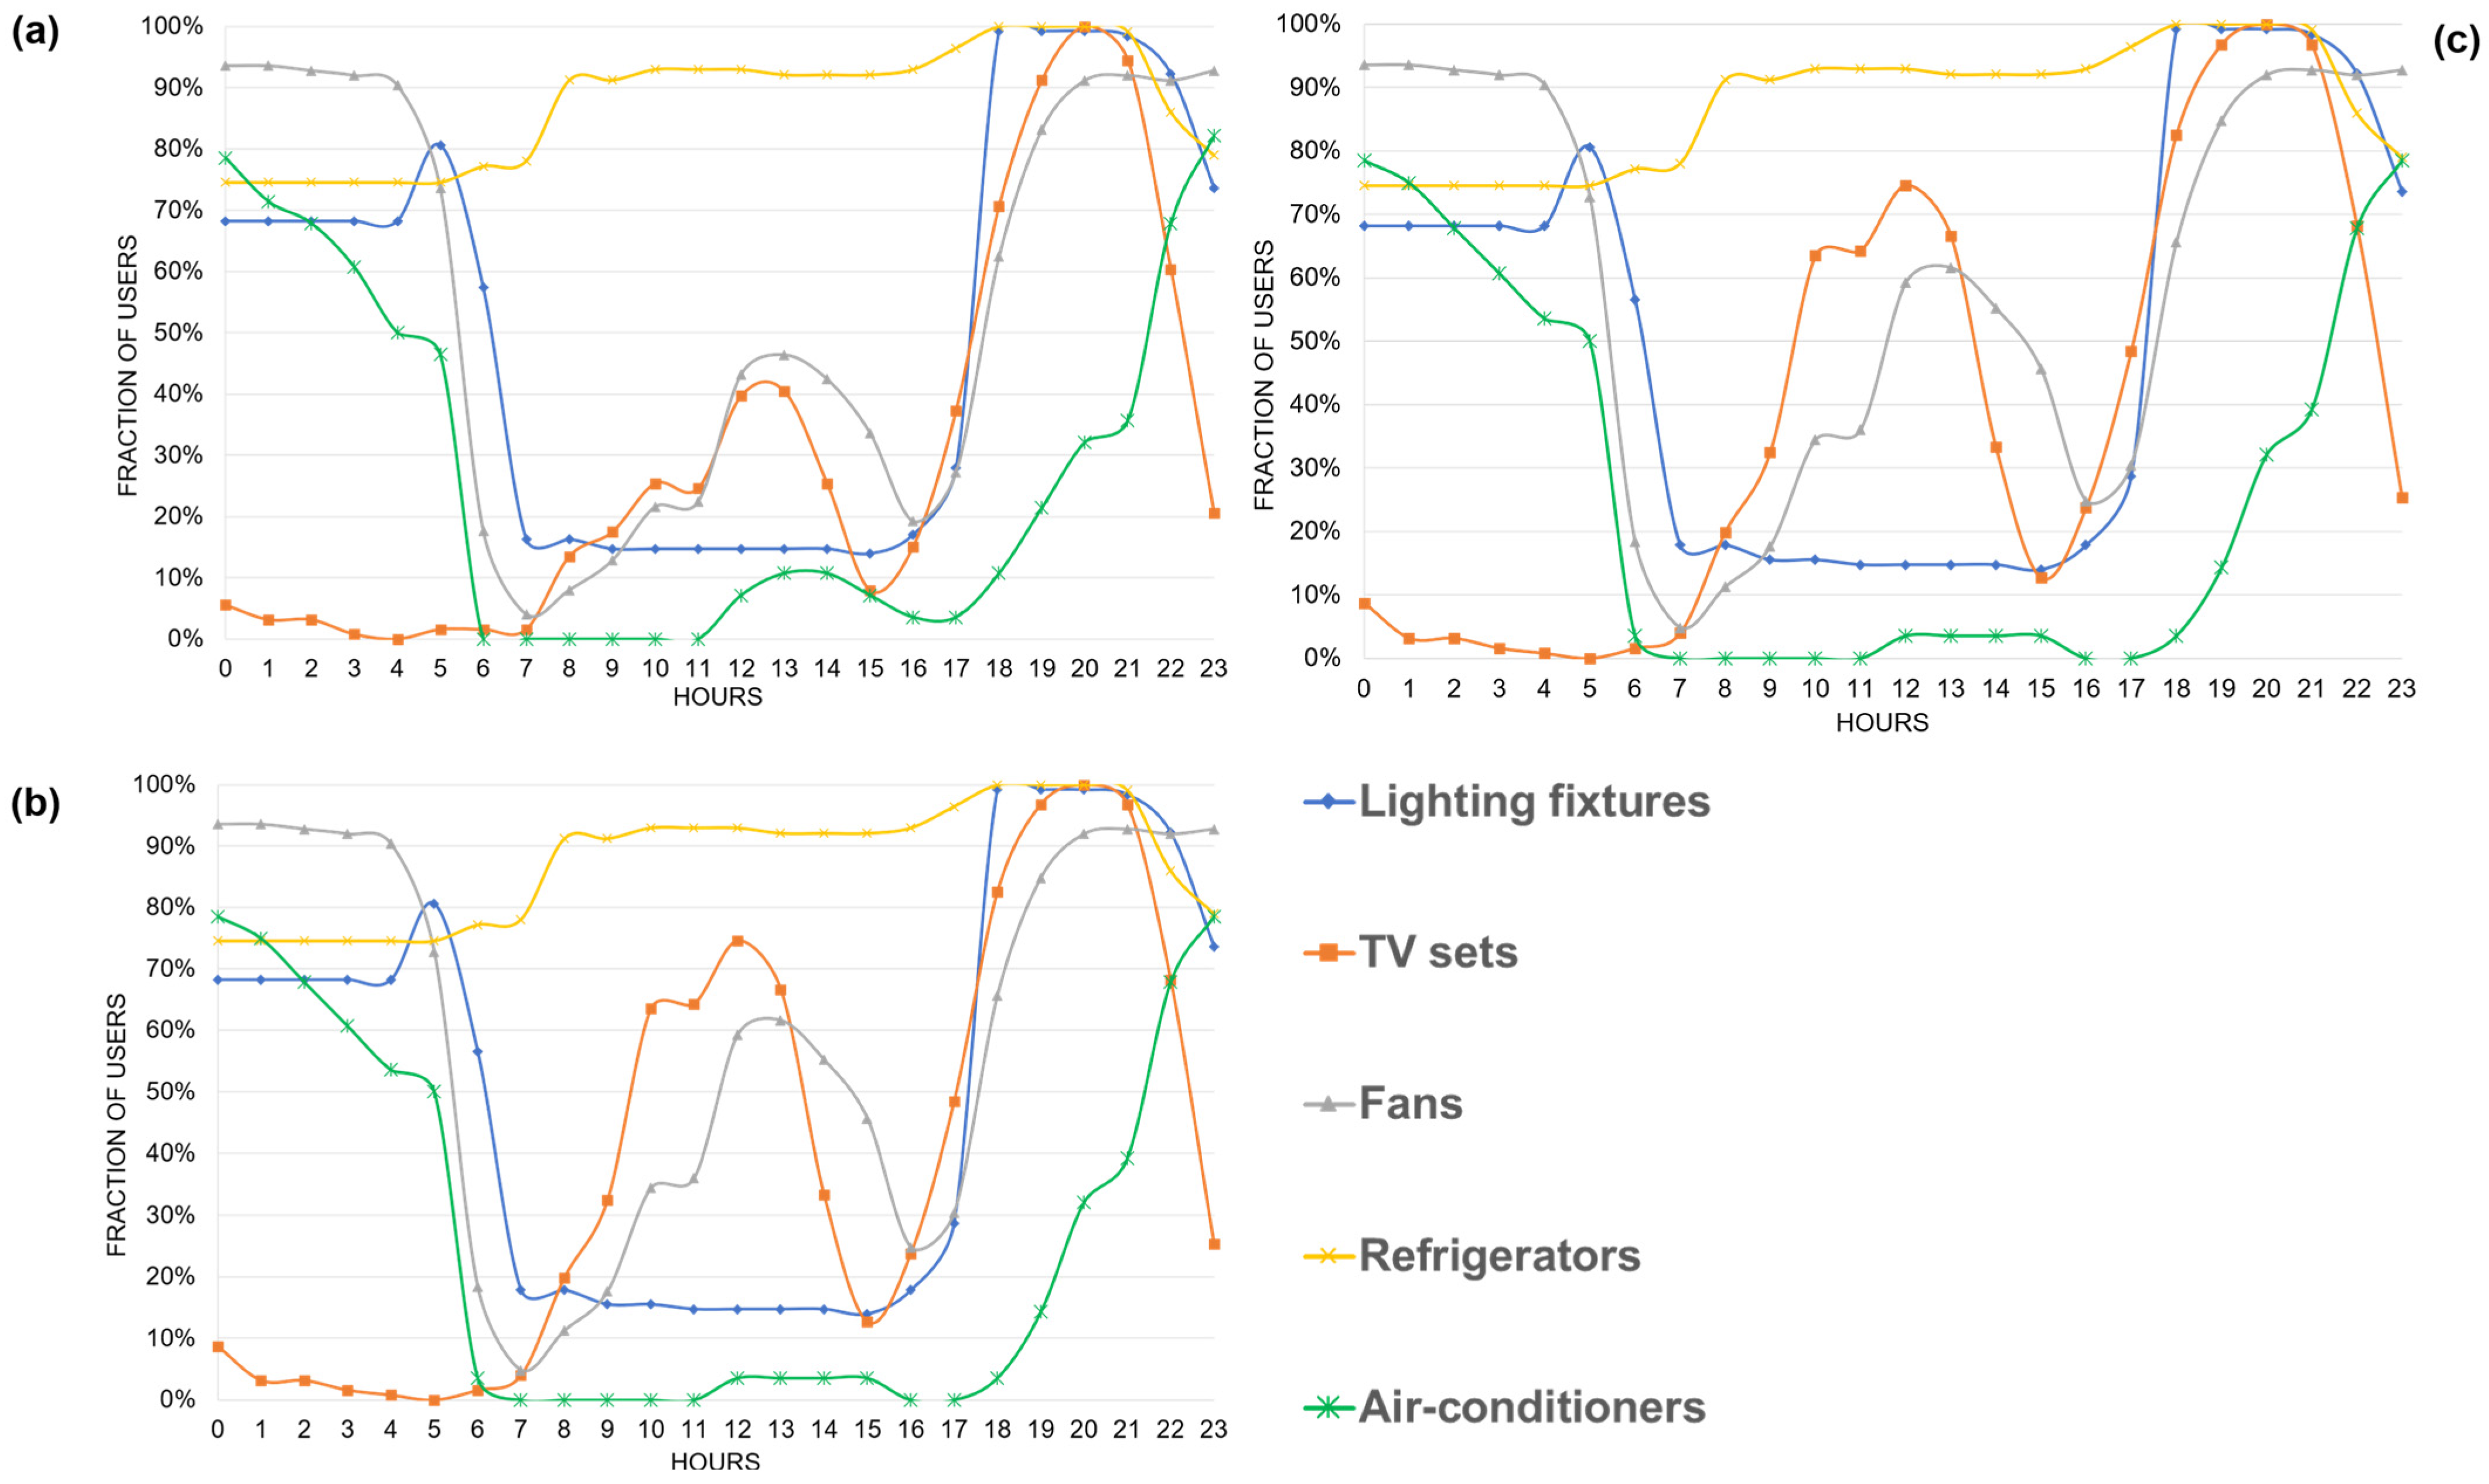
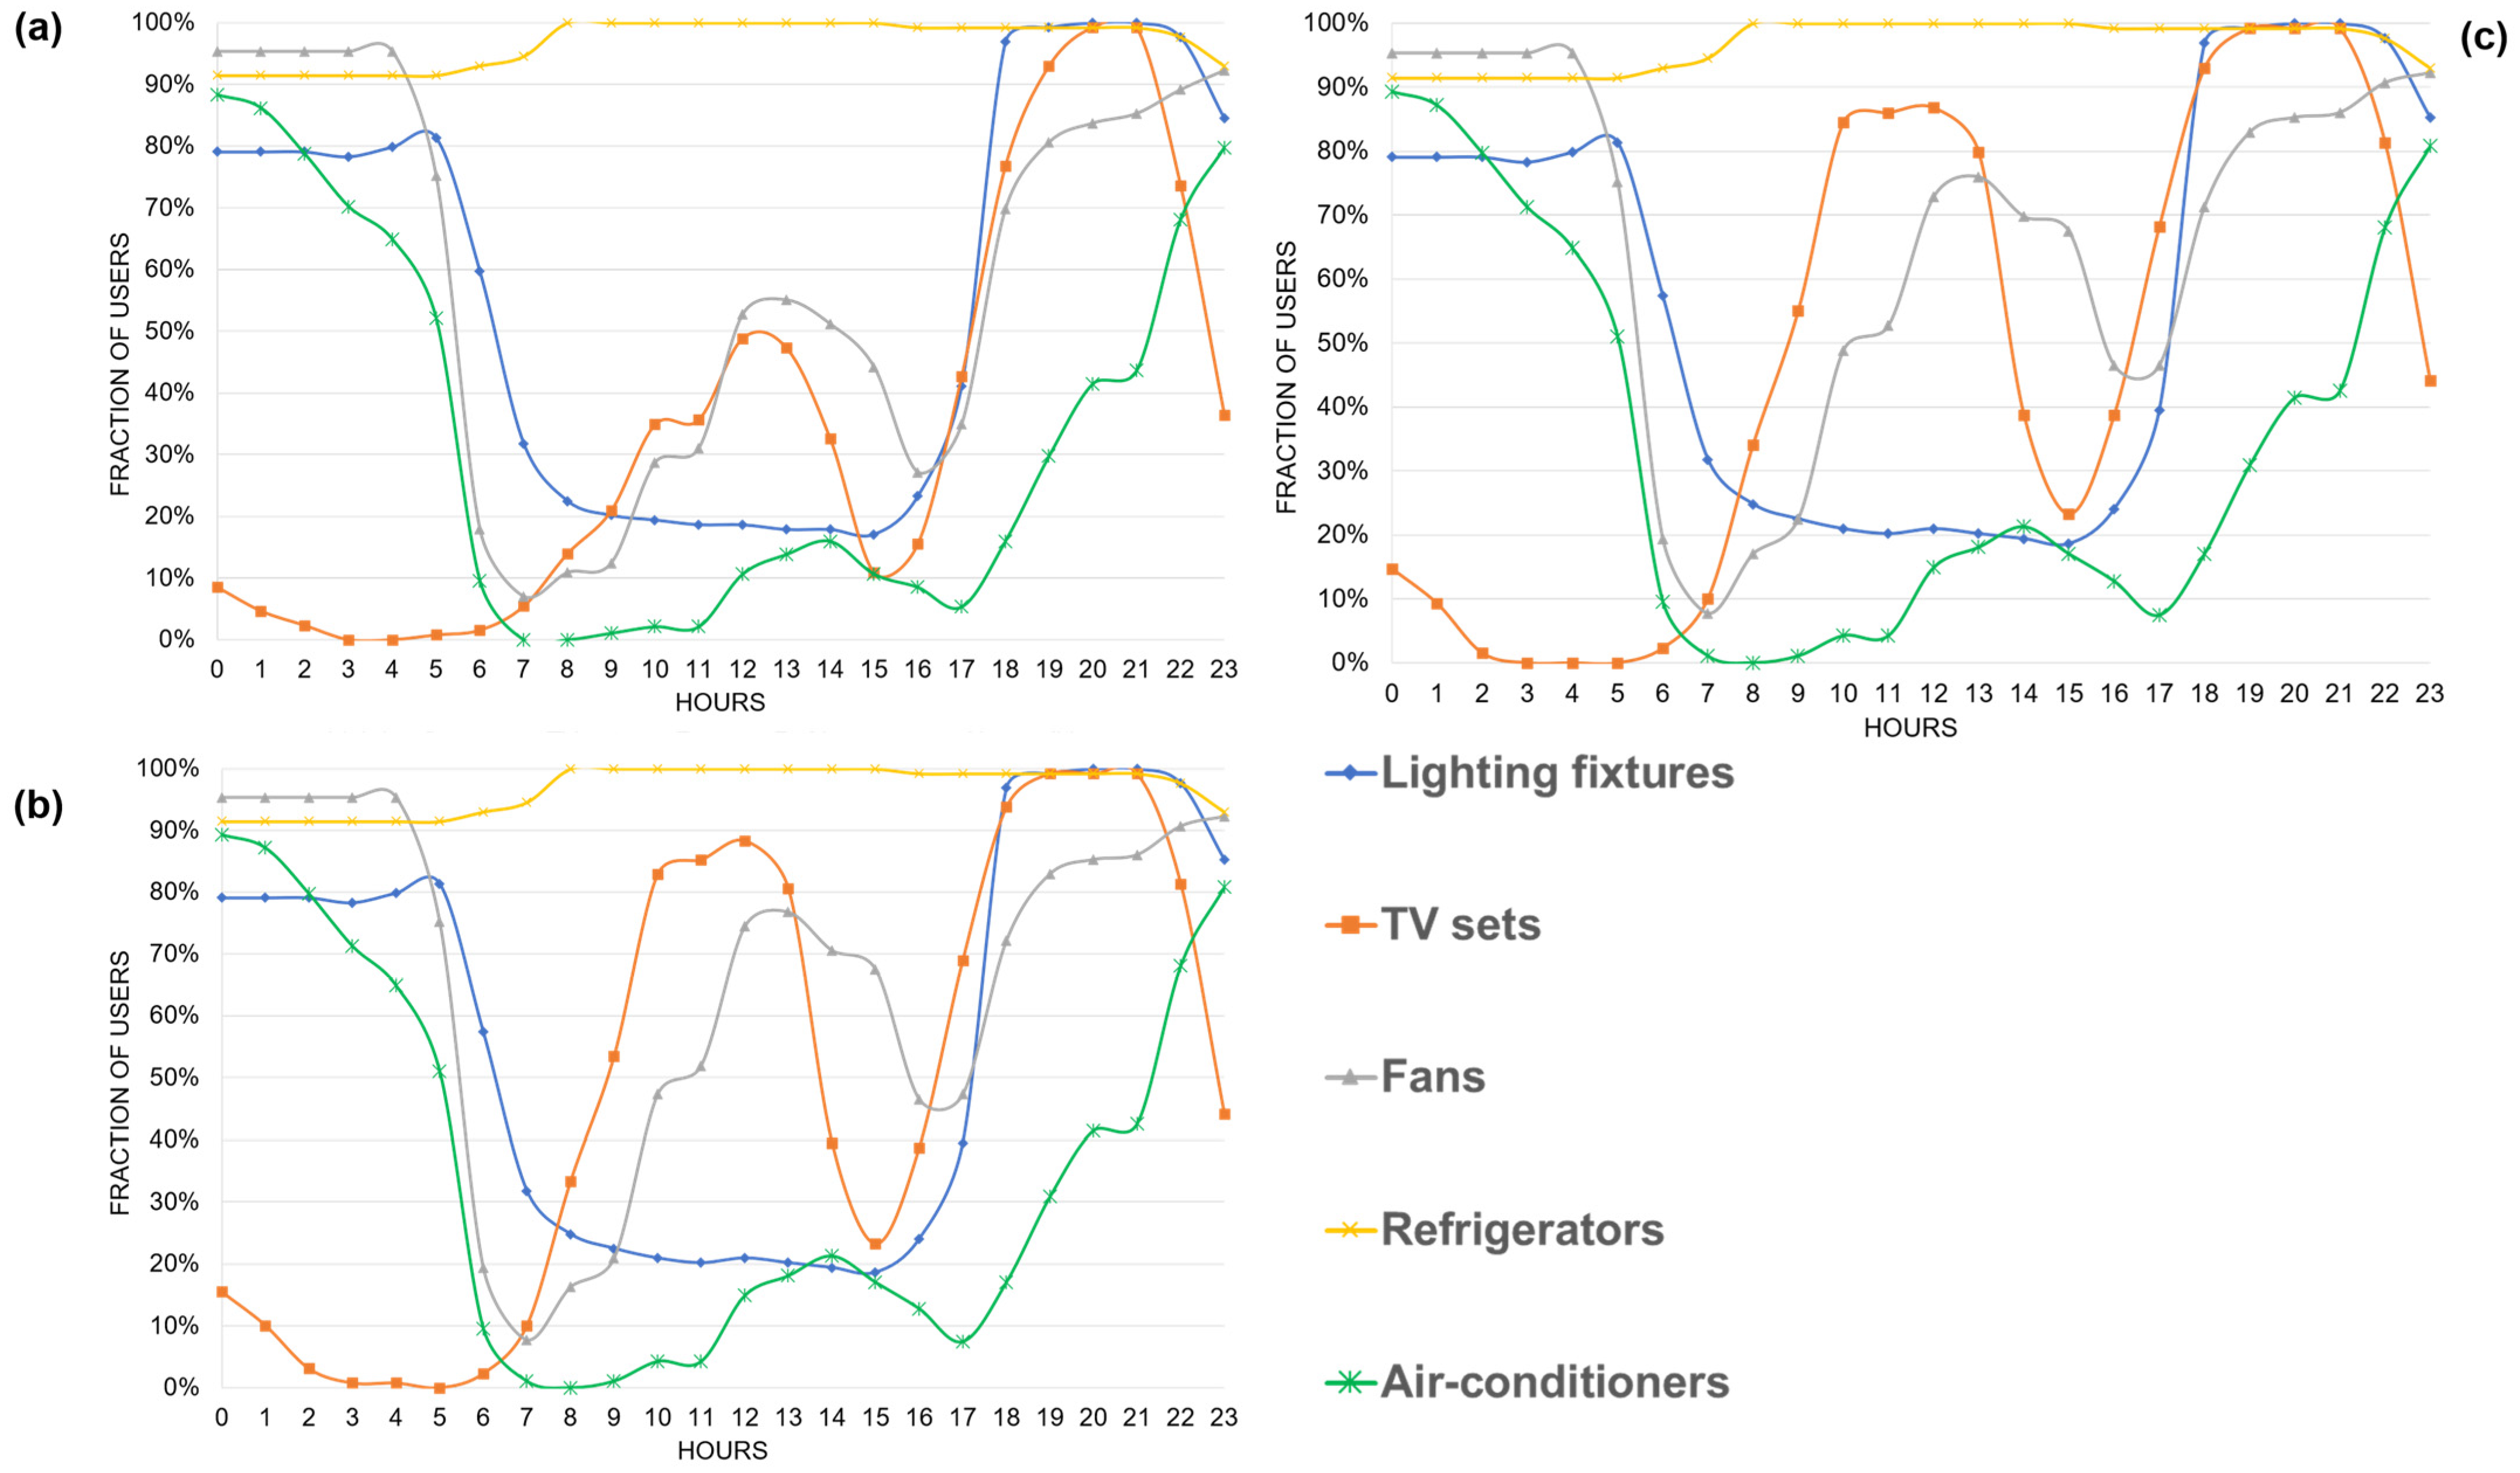
Figure 5, Figure 6 and Figure 7 show the patterns of use (during high use periods) for the most commonly owned appliances. Patterns of use for other appliances are not presented in the figures but are discussed below.
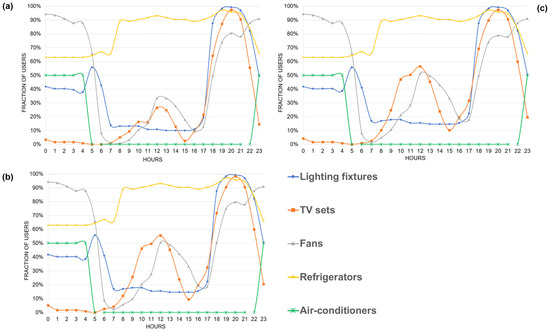
Figure 5.
Weekdays (a) and weekend (Saturday (b) and Sunday (c)) patterns of use of most common appliances for the low consumers.
From Figure 5a, Figure 6a and Figure 7a for the weekday patterns of use, it is evident that lighting use demonstrates two peaks, with the first occurring at 05:00, corresponding with the period at which people wake up for preparing to go to their activities (work or school). After that, indoor light use stabilises at approximately slightly less than 20% up to 16:00. This percentage likely reflects households that want to avoid the penetration of dust in their rooms and therefore close blinds/curtains and keep on their indoor lights. After 16:00, lighting use increases corresponding with the progressive return of people to their homes. Most schools, private and public offices and businesses close between 16:00 and 18:00. Use keeps increasing until a second peak period between 18:00 and 20:00. During this period of time, people are at home, performing various evening activities in many rooms. Finally, lighting use starts dropping after 20:00 with people starting to go to bed. It is notable that a significant proportion of households keep their lights on during the night until 05:00. An almost identical pattern of use can be observed during the weekend (Figure 5b,c, Figure 6b,c and Figure 7b,c), with a generally higher use amongst the high consumers.
Patterns of use of fans during weekdays (Figure 5a, Figure 6a and Figure 7a) demonstrated two peaks. The first peak occurs from 12:00 to 14:00 depending on the group of users, which corresponds with a period at which some householders who stay home during the daytime, and/or who return home for midday breaks turn on fans due to the very hot temperatures during the dry and cold seasons. The second peak occurs from 23:00 to 01:00 following a consistent increase during the evening when most householders are home, and some already starting to go to bed with fans turned on. During the night period (23:00 to 05:00), fan use stabilises at approximately 90% as householders leave them on to sleep due to the high temperatures. The same patterns are evident during the weekend (Figure 5b,c, Figure 6b,c and Figure 7b,c); however, the proportion of use is greater due to more people being at home. Air-conditioners displayed an almost identical use pattern as fans, albeit with fewer users at the operating times for the high consumers (Figure 7a–c). Low consumers demonstrated an almost exclusive night use of air-conditioners (Figure 5a–c), while for medium consumers (Figure 6a–c), air-conditioning use peaks at midnight after a very low use during the daytime.
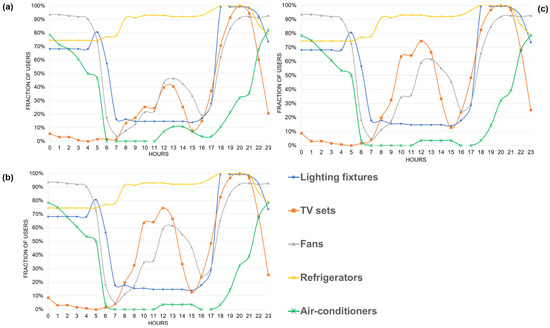
Figure 6.
Weekdays (a) and weekend (Saturday (b) and Sunday (c)) patterns of use of most common appliances for the medium consumers.
Figure 6.
Weekdays (a) and weekend (Saturday (b) and Sunday (c)) patterns of use of most common appliances for the medium consumers.
Use of televisions on weekdays and weekends also had two peaks for all consumer groups. The first peak occurs at approximately 12:00 to 14:00, which relates to the use of TV sets by home living users or those coming from a break at midday. Between 19:00 and 21:00, a period at which most occupants are home watching TV programs, the second peak is recorded. During the night, with people going to sleep, the fraction of users drops considerably until approximately 08:00 as people watch TV whilst doing their morning chores. The same patterns are recorded during the weekend, although with an increased number of users as presence at home and willingness of using the televisions are higher during this type of period.
Patterns of use of refrigerators indicate a commonly unceasing use for all types of days and groups of users (Figure 5, Figure 6 and Figure 7). At least 60% of users leave their refrigerators on during the night. This proportion increases in the morning at approximately 07:00, with a stable shape until 16:00 and a slight increase until 20:00. This can be explained by households turning on their fridges for dinner purposes. For the high consumers refrigerators are on almost continuously for all households. At night, some households turn off their refrigerator as some people prefer to only use them when needed and also think that they will save some energy by doing so.
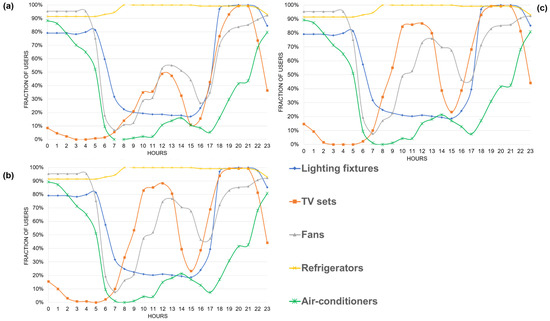
Figure 7.
Weekdays (a) and weekend (Saturday (b) and Sunday (c)) patterns of use of most common appliances for the high consumers.
Figure 7.
Weekdays (a) and weekend (Saturday (b) and Sunday (c)) patterns of use of most common appliances for the high consumers.
The variety existing among the behaviours of the users was the main influencing factor of the other appliance usage patterns. For instance, while some households prefer a once-a-week frequency of use for the iron (for preparing all the clothes for use during the week), some prefer a daily use: use it in the morning for preparing the daily clothes before going to their activities. Microwaves and stoves are used exclusively to cook: not only in the morning for example for re-heating yesterday’s food, but also in the evening for cooking dinners. Kettles are used mostly during morning activities for making tea/coffee. However, kettles are also used in the evening for cooking purposes and making hot drinks. Desktop computers demonstrated almost the same patterns of use as laptops. Most of the participants owning a washing machine prefer to use it at a once-a-week frequency. Wi-Fi-routers had an almost unceasing use throughout the day. DVD/VCR, sound systems, radios and game consoles demonstrated higher use during weekends. Overall, daily appliance use increases at weekends primarily the result of more people being at home. Finally, a range of other appliances, referred to in this paper as “others”, for example, working machines (tailoring machines, wood piercers), sports devices and electronic pianos, demonstrated an average time of use of 3.8 h/day.
3.4. Characteristics of Domestic Electricity Demand and Contributions of End-Uses
3.4.1. Electricity Demand in the Dry and Hot Season
Figure 8, Figure 9 and Figure 10 present the households’ disaggregated electricity demand for weekdays, Saturday and Sunday in the dry and hot season. Two main peak demand periods emerge for the weekday electricity demand (Figure 8a, Figure 9a and Figure 10a). The first occurs at approximately midday (12:00–14:00) for the three groups of users, while the second occurs in the evening (19:00–20:00) for the low and medium consumers and late in the evening for the high consumers (22:00). The demand of the second peak is approximately 3-fold higher than the first. The same patterns are mostly evident for the electricity demand on Saturday and Sunday (Figure 8b,c, Figure 9b,c and Figure 10b,c).
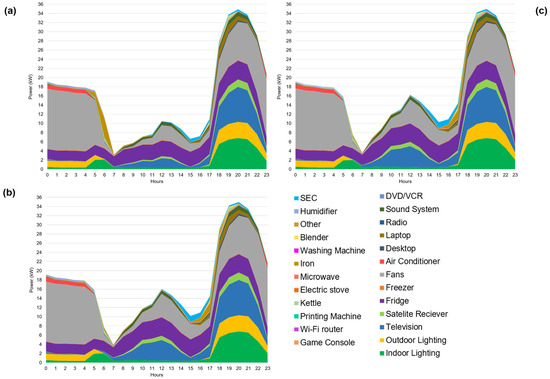
Figure 8.
Disaggregated electricity demand of the low consumers in the dry and hot season (weekdays (a), Saturday (b) and Sunday (c)).
From the patterns, it can be seen that cooling appliances account for the most significant proportion of the daily electricity demand, especially for the high consumers. This is understandable as during the dry and hot season, daytime temperatures reach values higher than 40 °C and 30 °C in the evening and night. It can be seen that fans and ACs are used mostly in the evening and throughout the night, but also from midday to early afternoon. The two cooling appliances together also account for the largest contribution to demand during the recorded peak periods. For example, on average fans and ACs represent approximately 24% of the demand for low and medium consumers and approximately 65% for high consumers during the main peak period. However, the night period (0:00–5:00) is the period of the highest contributions from the cooling loads. At night, ACs and fans share, on average, 82% of the demand for high consumers and 71% and 75% for the low and medium consumers. The contribution of AC is higher than fans for high consumers, whilst the opposite is true for low and medium consumers.
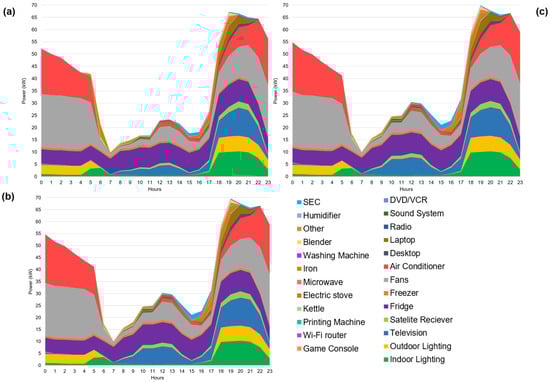
Figure 9.
Disaggregated electricity demand of the medium consumers in the dry and hot season (weekdays (a), Saturday (b) and Sunday (c)).
Figure 9.
Disaggregated electricity demand of the medium consumers in the dry and hot season (weekdays (a), Saturday (b) and Sunday (c)).
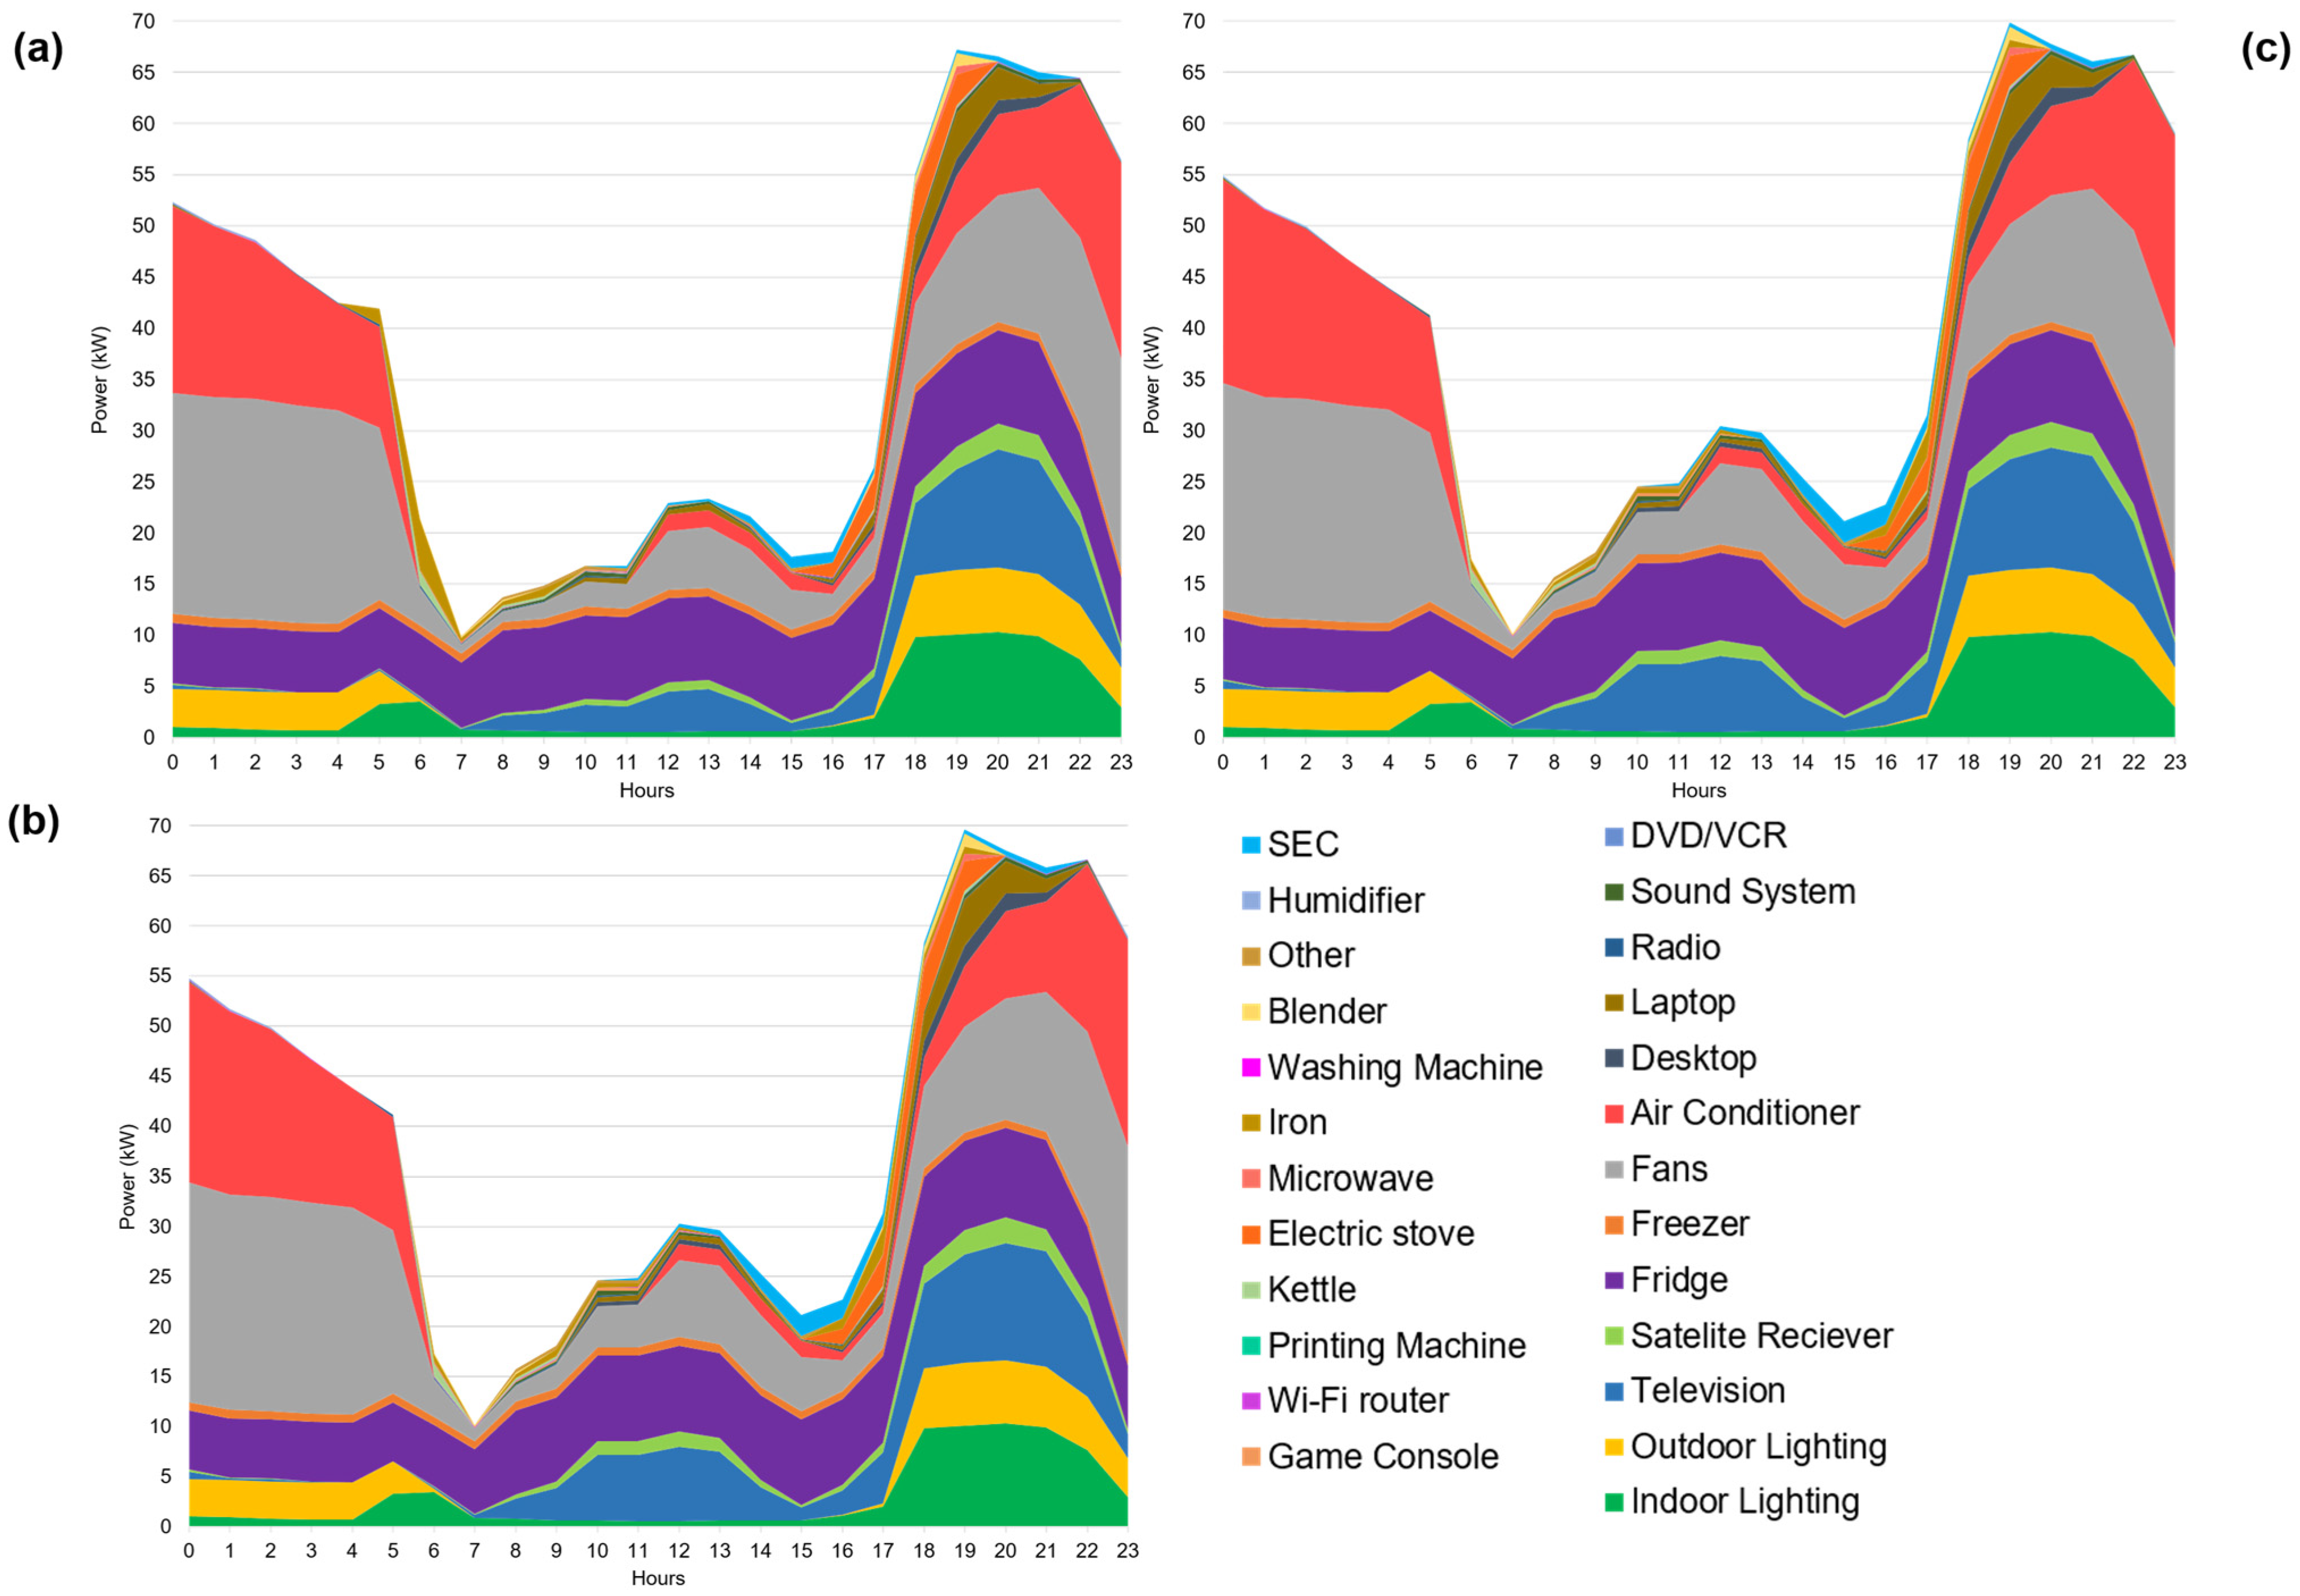
Other major loads in the dry and hot season include TV sets, food-preserving appliances (fridges and freezers) and lighting. The evening peak (19:00–20:00) demand second main contributors for the high consumers, and the first for the low and medium consumers are the lighting fixtures and TV sets. Second major contributors of the (12:00–14:00) first peak demand period for all groups are the food-preserving appliances, with TV sets dominating the load at this period for low and medium consumers and cooling loads dominating for the high consumers. The maximum contribution of food-preserving appliances to overall demand occurs in the morning to midday period with a share up to 60%, 65% and 70% for three groups, respectively. This time period corresponds to when most householders are absent or not doing activities involving many appliances, and therefore continuously on appliances, such as food-preserving appliances, account for a greater amount of the total demand.
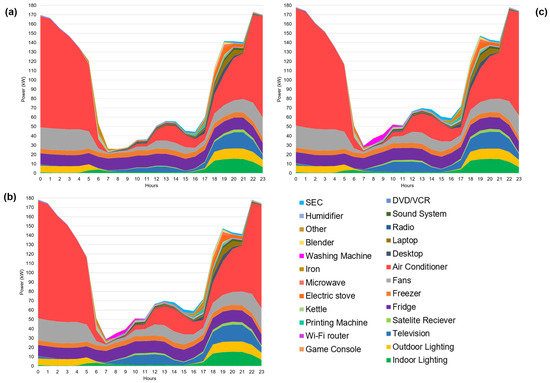
Figure 10.
Disaggregated electricity demand of the high consumers in the dry and hot season (weekdays (a), Saturday (b) and Sunday (c)).
Figure 10.
Disaggregated electricity demand of the high consumers in the dry and hot season (weekdays (a), Saturday (b) and Sunday (c)).
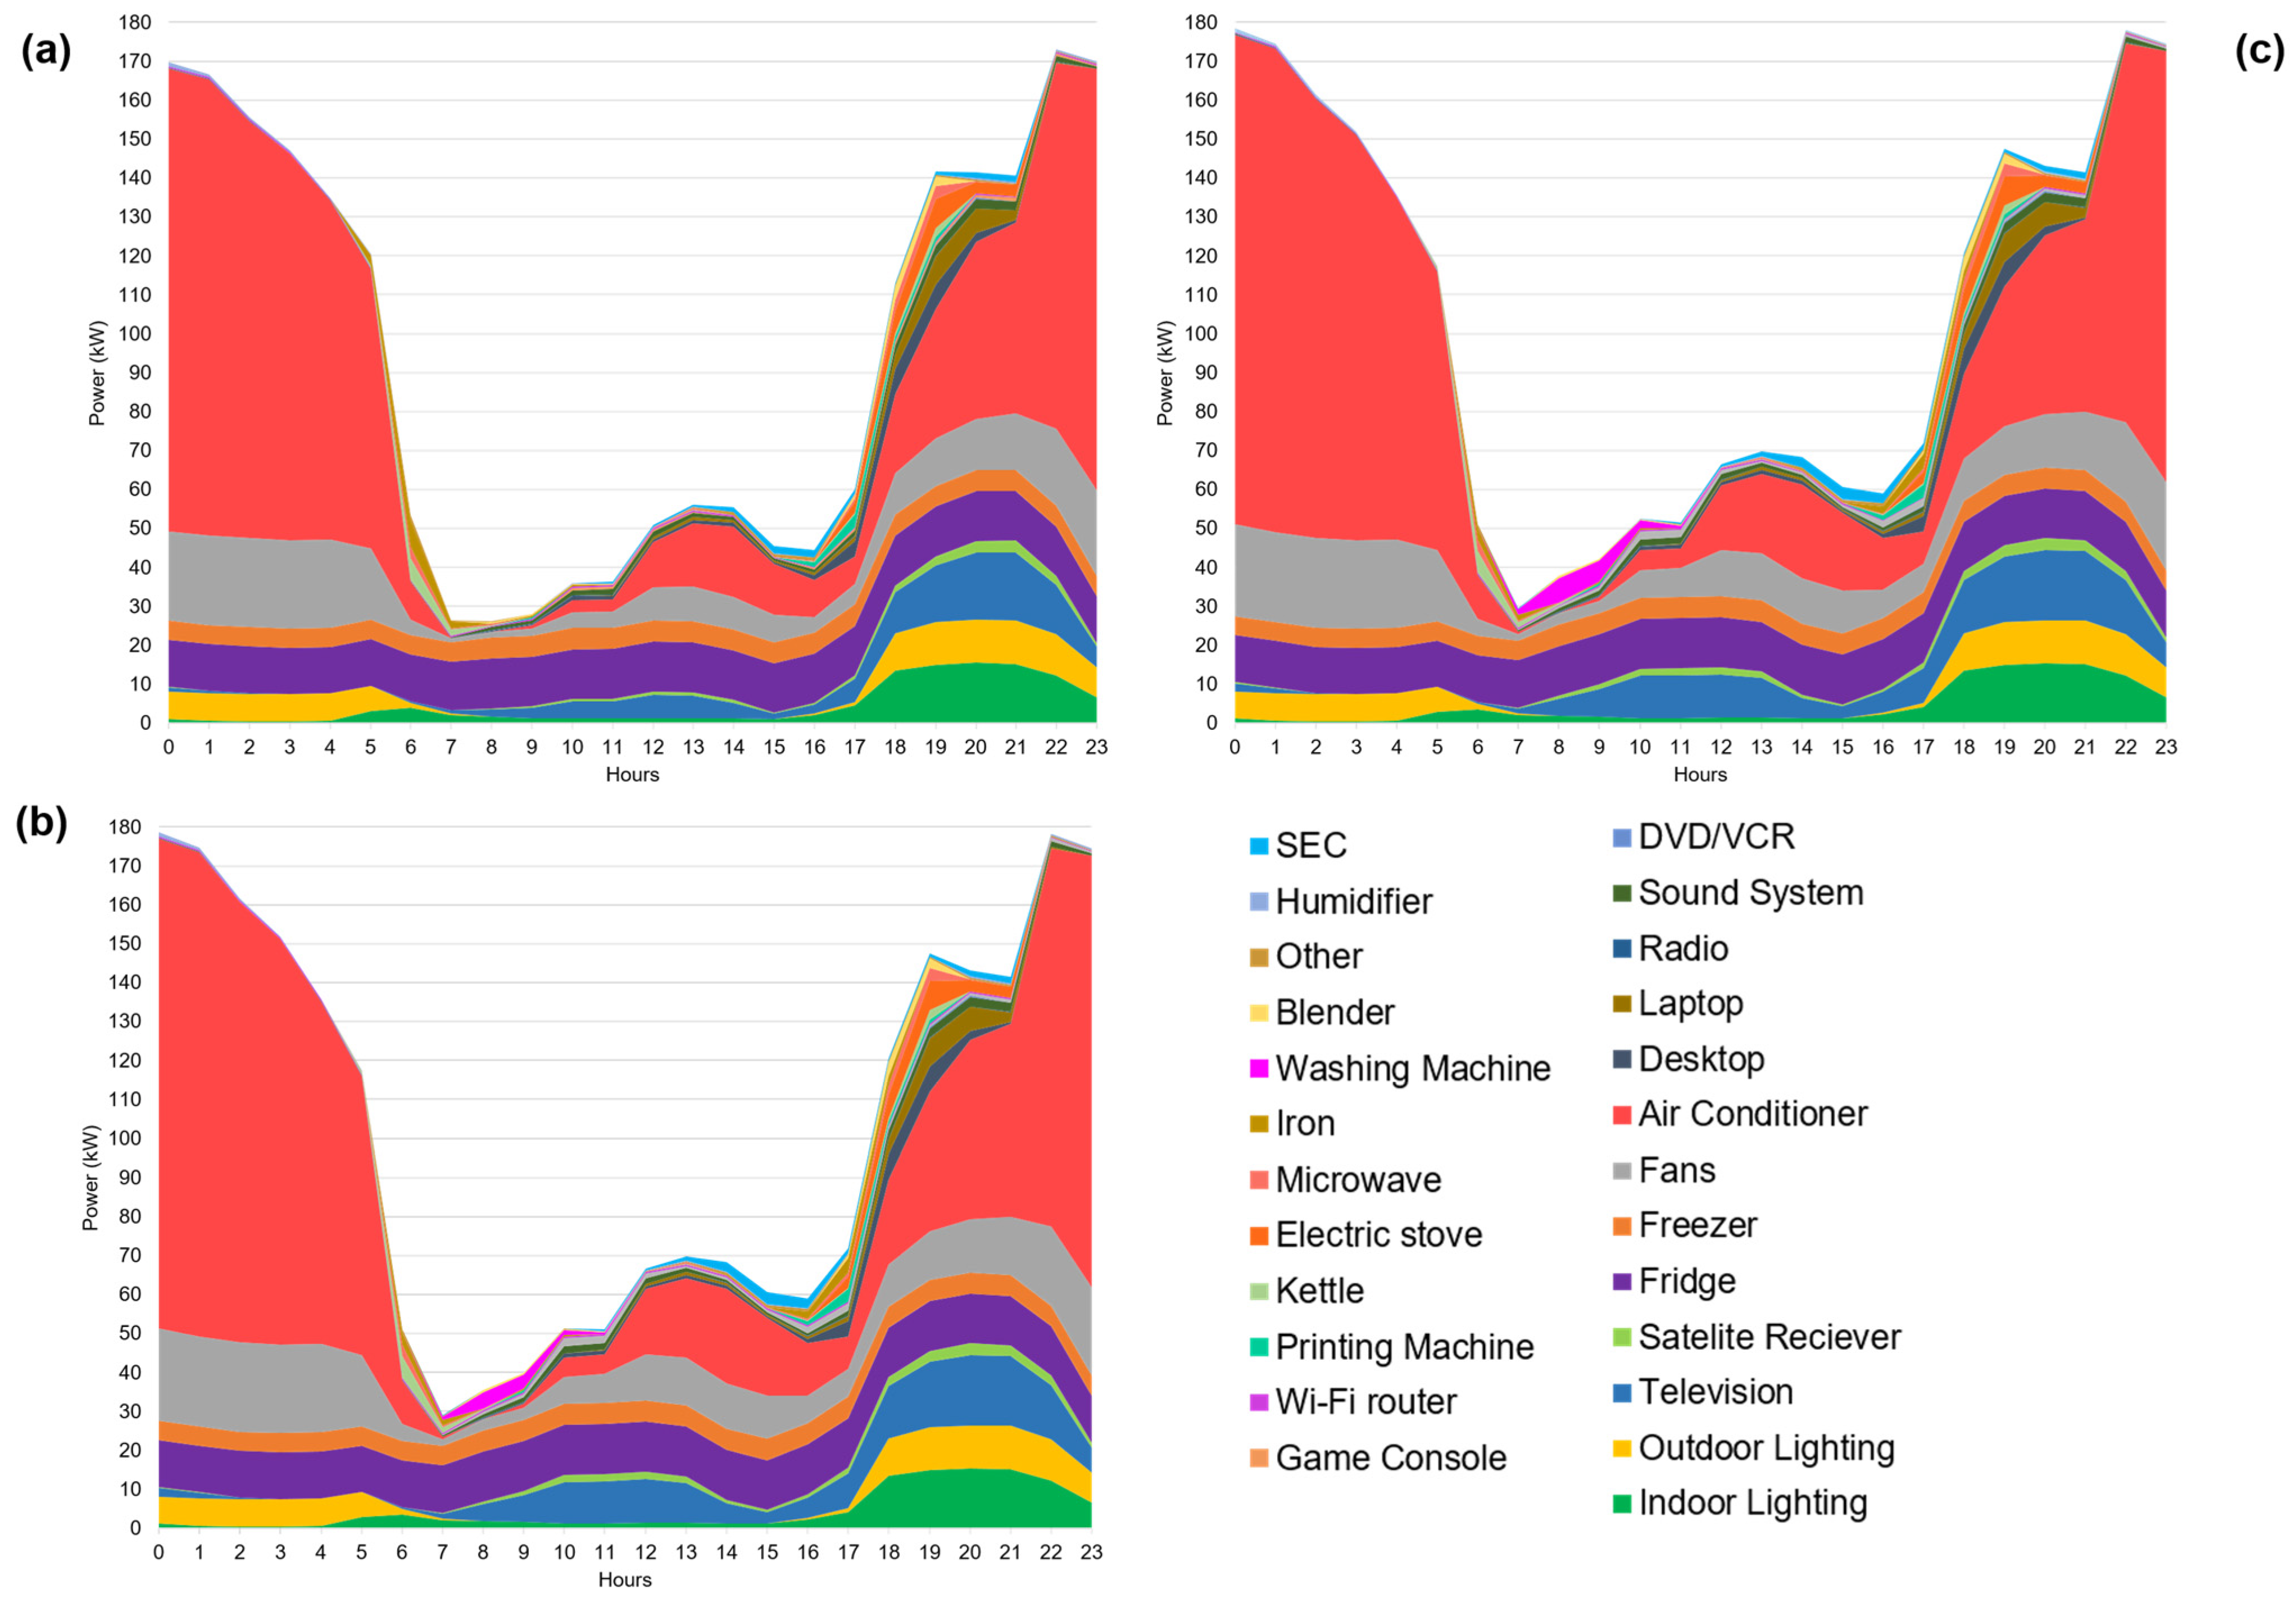
Table 5 gives the demand-characterising parameters for the dry and hot season for both the overall sample and the normalised demand for the three groups of consumers. (The overall demand is divided by the total number of households in the sample for having a picture of the average consumption per household in a scenario of each home having the studied appliances.) It can be noticed that for all groups of consumers, the DMD, DLF and TEC demonstrated higher values during the weekend. The ToU as previously analysed, showed various values depending on the group of consumers. Finally, the DLF was 46% to 50% for the low consumers, and much higher for the medium and high consumers, suggesting that potential for energy conservation/DSM is higher for low consumers.
Table 5.
Dry and hot season electricity demand-characterising parameters for the three groups of consumers.
3.4.2. Electricity Demand in the Rainy Season
Figure 11, Figure 12 and Figure 13 display the three groups of consumers’ electricity demand patterns for the rainy season. Three main peak demand periods can be identified for each group. The first occurs early in the morning, the second at midday, and the last early in the evening. On weekdays (Figure 11a, Figure 12a and Figure 13a), the first peak occurs during the 05:00–06:00 period depending on the group of consumers. The second peak occurs at approximately 12:00–13:00, with a greater load than the first peak by up to 8% on weekdays and 55% during the weekend, depending on the group of consumers. The last peak occurs early in the evening (19:00–20:00), with the load being up to 3-fold higher than that of the two first peak loads. Patterns recorded on the weekends (Figure 11b,c, Figure 12b,c and Figure 13b,c) are almost the same; however, the demand is higher due to more people being at home using appliances.
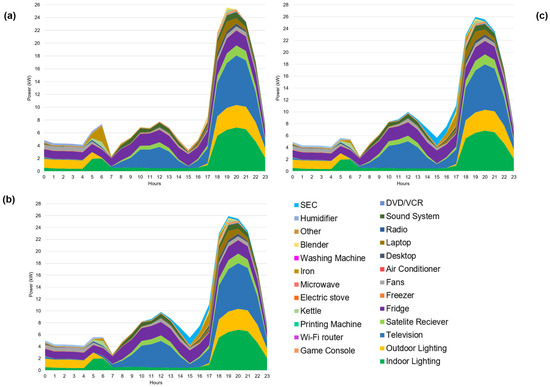
Figure 11.
Disaggregated electricity demand of the low consumers in the rainy season (weekdays (a), Saturday (b) and Sunday (c)).
In the rainy season, cooling appliances do not account for the majority electricity demand, especially for low and medium consumers. The daily contribution to demand drops considerably (on average by up to 15 fold) compared to the dry and hot season. However, high consumers’ daily demand primary contributors were still the cooling appliances, especially in the night (00:00 to 05:00), representing, on average, up to 61% of the nocturne load. The reduction in cooling loads is understandable as during the rainy season, temperatures are generally less, between 20 °C and 36 °C.
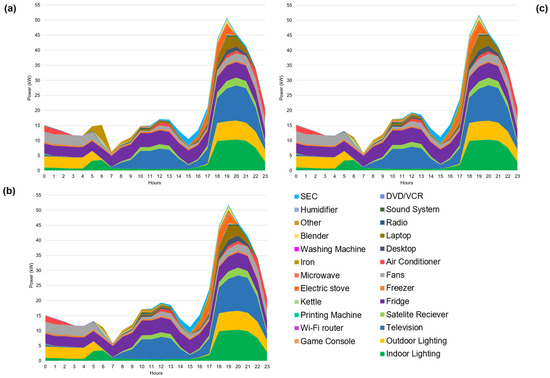
Figure 12.
Disaggregated electricity demand of the medium consumers in the rainy season (weekdays (a), Saturday (b) and Sunday (c)).
Figure 12.
Disaggregated electricity demand of the medium consumers in the rainy season (weekdays (a), Saturday (b) and Sunday (c)).

TV sets and lighting fixtures consist of the three peak periods’ major contributors. Lighting fixtures are the low and medium consumers’ first (05:00–06:00) peak demand period highest contributors, and account for up to 45% of the demand. Cooling loads were the highest load for high consumers. Lighting was followed by food-preserving (26%) and cooling appliances (18%) for medium consumers, whilst this was food-processing appliances and other appliances like irons for low consumers.
Lighting, with a share of up to 39% of the demand, was the major load of the third peak during both weekdays and weekend for all consumer groups. In addition, lighting was the highest load during evenings (18:00 to 00:00), accounting for an average of up to 43% of the demand. In evenings and during the third peak periods, TVs shared up to 33% of the electricity demand. TVs consumed up to 45% of the demand in low consumers’ households during the second peak. TV sets are followed both on weekdays and weekends by food-preserving and cooling appliances, which shared up to 30% of the demand.
Another notable contribution to end-use electricity demand was the standby electricity consumption (SEC). SEC had its highest values of electricity demand during the early afternoon until early evening (14:00 to 18:00). During this period, SEC accounted for 23%, 24% and 13% of the three groups’ demands. During this time period, householders are typically either away from home or doing activities, including naps. As a result, households that are not aware of SEC tend to leave their appliances in standby mode. It should be noted that this behaviour of leaving appliances on standby has also been observed among 78.5% of households who say they are aware of SEC [73].
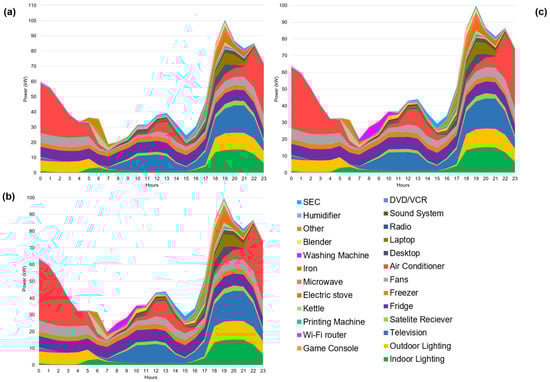
Figure 13.
Disaggregated electricity demand of the high consumers in the rainy season (weekdays (a), Saturday (b) and Sunday (c)).
Figure 13.
Disaggregated electricity demand of the high consumers in the rainy season (weekdays (a), Saturday (b) and Sunday (c)).
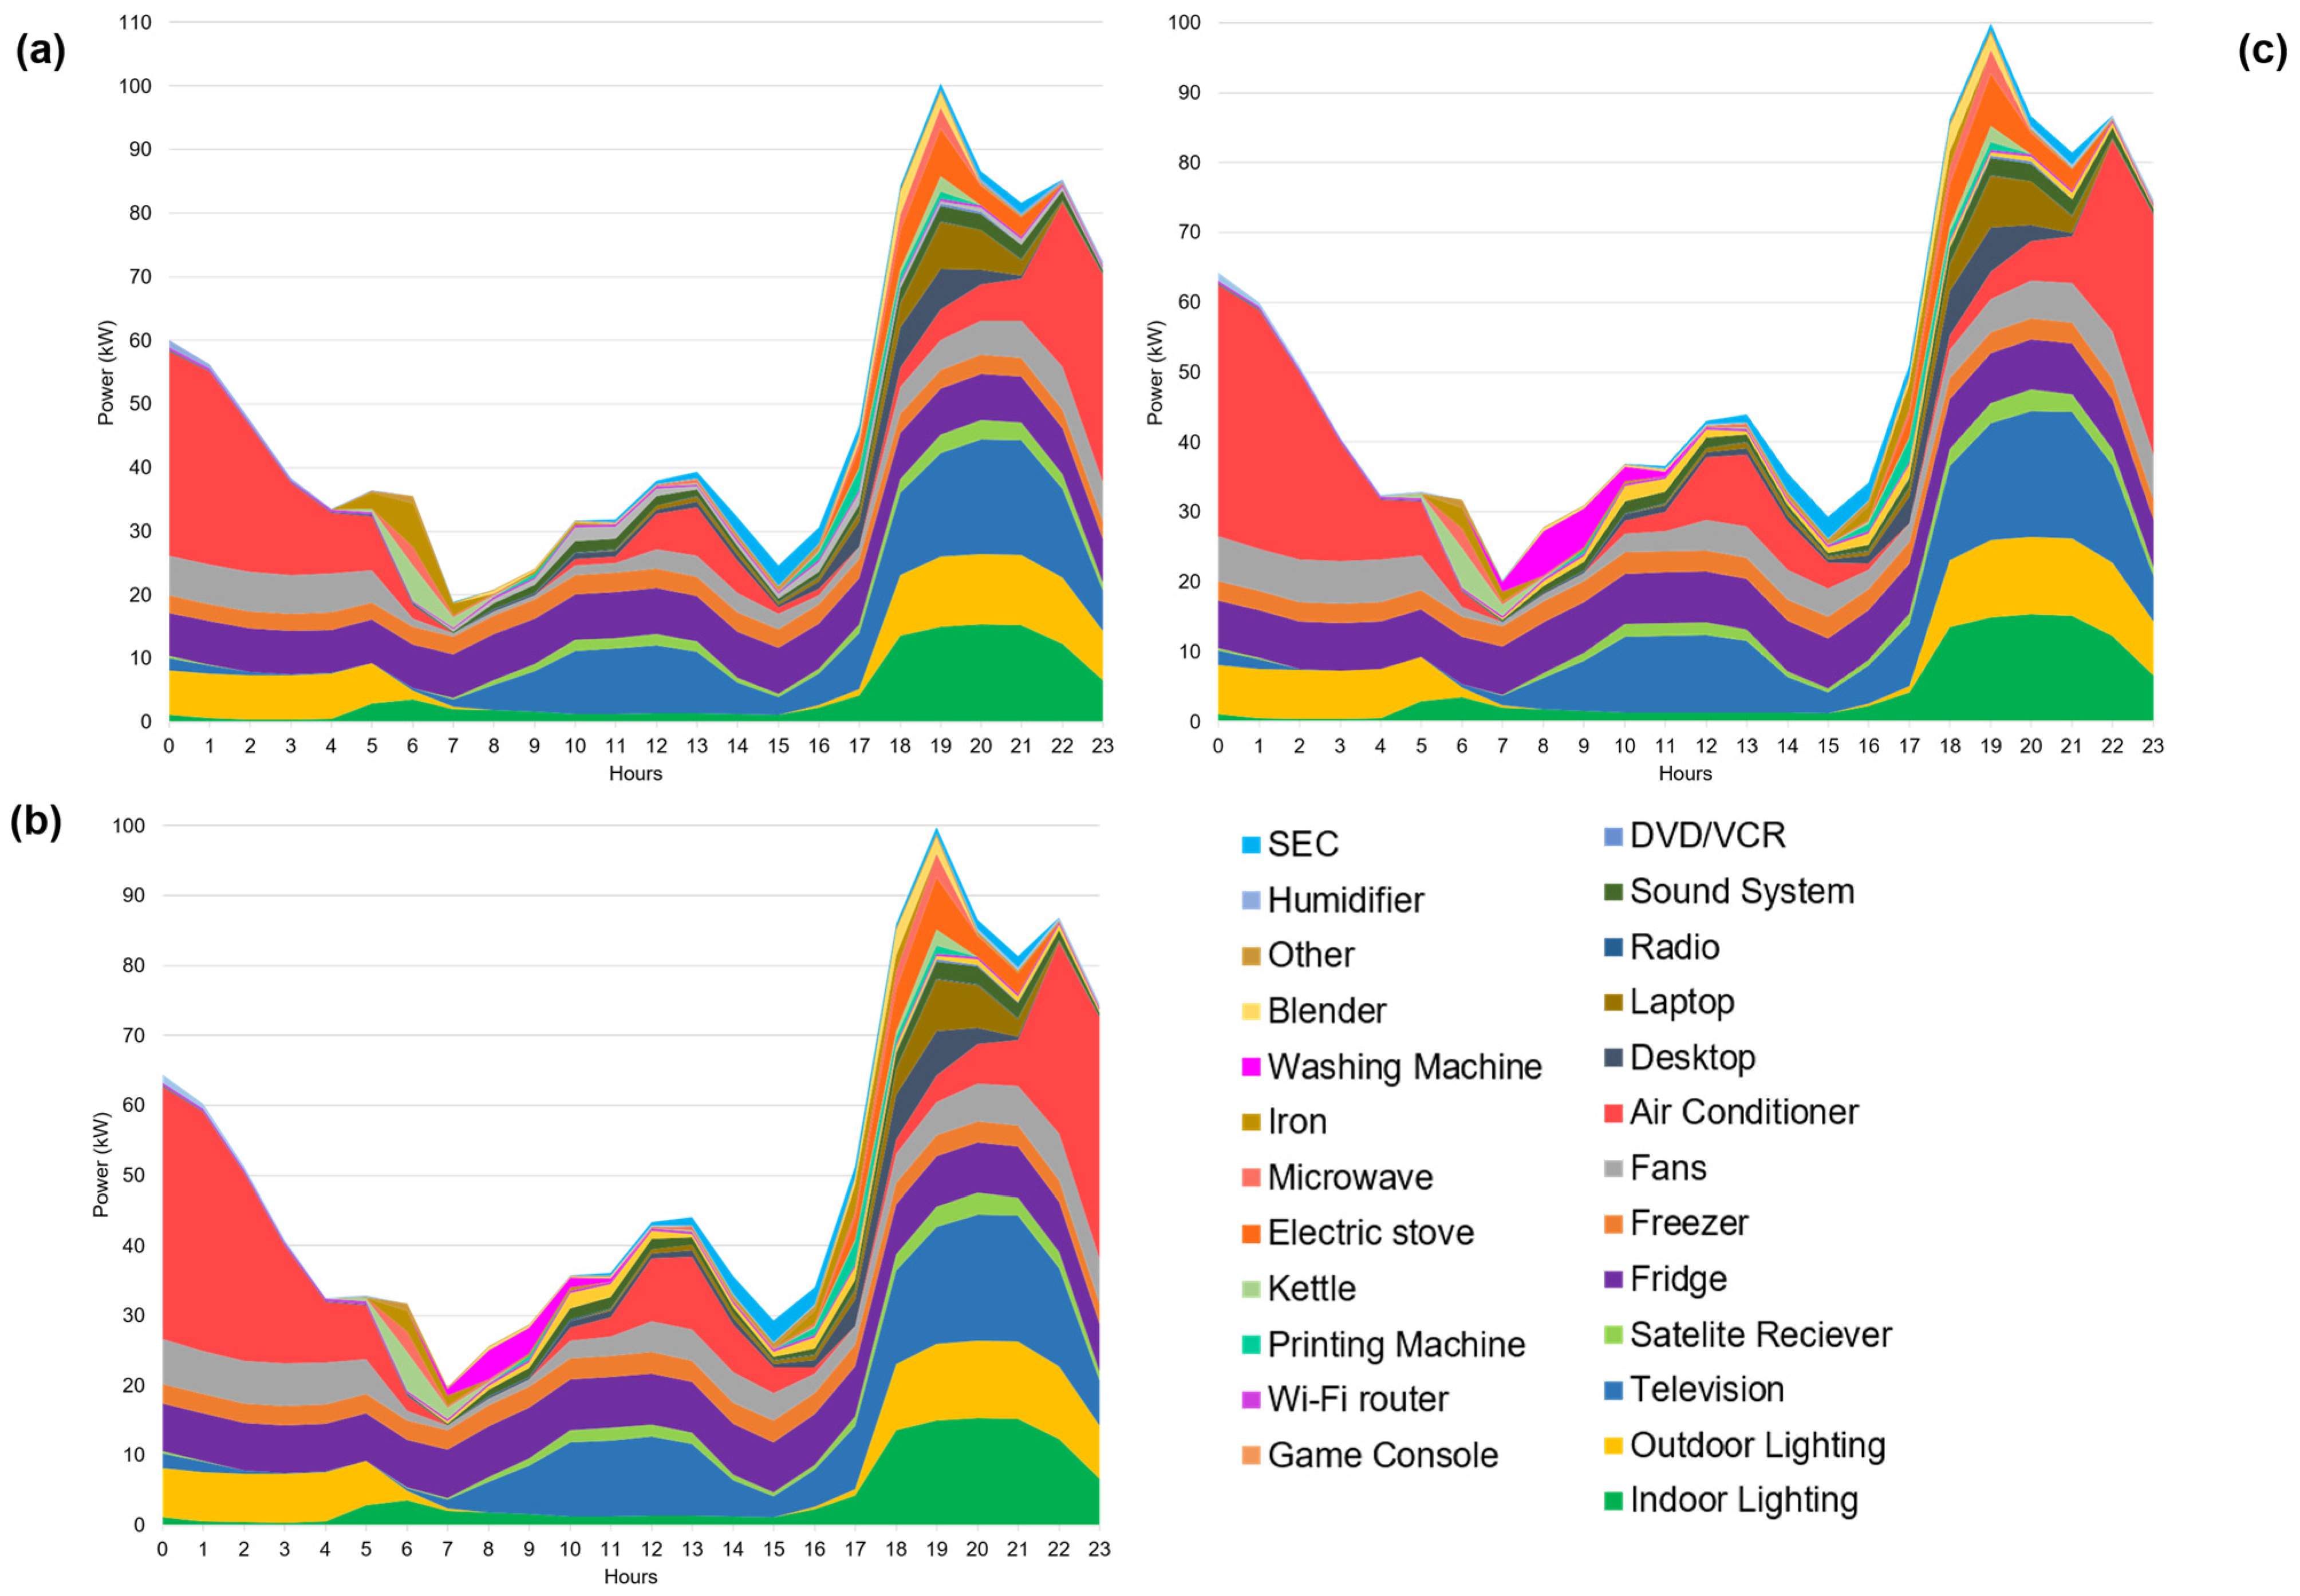
Table 6 gives the demand-characterising parameters for the rainy season. DMD and TEC recorded slight increases during the weekend with respect to weekdays. For all the three parameters, DLF, TEC and DMD, lower values were recorded with respect to that of the dry and hot season. The same ToU (19:00) was, however, recorded for all days. Finally, the smaller DLF, with respect to the dry and hot season suggests the presence of more small intervals with high electricity, and therefore a greater potential for DSM implementation.
Table 6.
Rainy season electricity demand-characterising parameters for the three groups of consumers.
3.4.3. Electricity Demand in the Dry and Cold Season
Figure 14, Figure 15 and Figure 16 present the dry and cold season electricity demand patterns of use. Three peak demand periods were recorded, with the first occurring early in the morning (06:00–07:00). This peak is more visible due to the very low cooling load during this season. Compared to the dry and hot and rainy seasons, the demand in the dry and cold season is up 2-fold lower for all three consumer groups. In addition, the average night-time load that was driven by the use of cooling appliances, drops by 2 and 5 fold compared to the rainy and dry and hot seasons for both the weekdays and weekends. The second peak occurs at midday (13:00–14:00). The third peak occurs early in the night (19:00 to 20:00), with a load 4-fold higher than the previous two peaks. The third or evening peak therefore characterises the residential sector’s peak load.
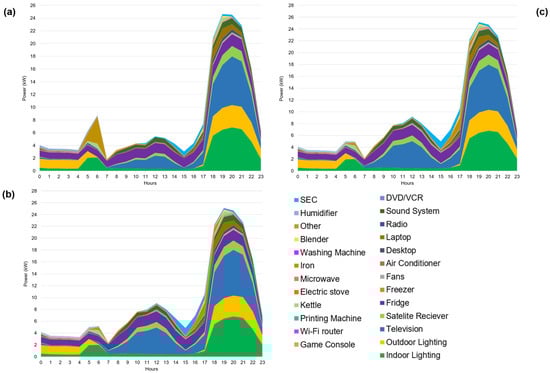
Figure 14.
Dry and cold season’s disaggregated electricity demand of the low consumers (weekdays (a), Saturday (b) and Sunday (c)).
In the dry and cold season, the major loads of the peak periods were food-preserving appliances, TVs and lighting. Lighting accounted on average for 42%, 50% and 54% of the electricity demand for the high, low and medium consumers, respectively, at the first peak (05:00–06:00). This is followed by food-preserving appliances which also had a high share of the demand up to 17%, 25% and 34% for the three groups, respectively. For the second peak (12:00 to 13:00), TVs were the main load for the low and medium consumers contributing, on average, for up to 45% of the demand for all types of days. For high consumers, food-preserving appliances were the highest load, with a share of approximately 37%, followed by TVs, which share 27% of the demand. For all groups of consumers, lighting dominated the third peak load (19:00–20:00), accounting for 40%, 36% and 29% of the average demand in low, medium and high consuming households for the two types of days. This was followed by TVs, with a share of demand up to 34%, for the low consumers demonstrating a higher use of TVs compared to the two other groups of consumers.
Other loads showed variety in the contributions to electricity demand (between 0% and 33%), with microwaves kettles and irons dominating other appliances. With respect to the rainy season, SEC accounted for a higher share of total demand, reaching its maximum contribution of up to 26% in the middle of the afternoon (15:00–16:00) on the weekends. Low consumers demonstrated the highest shares overall for the SEC.

Figure 15.
Disaggregated electricity demand of the medium consumers in the dry and cold (weekdays (a), Saturday (b) and Sunday (c)).
Figure 15.
Disaggregated electricity demand of the medium consumers in the dry and cold (weekdays (a), Saturday (b) and Sunday (c)).
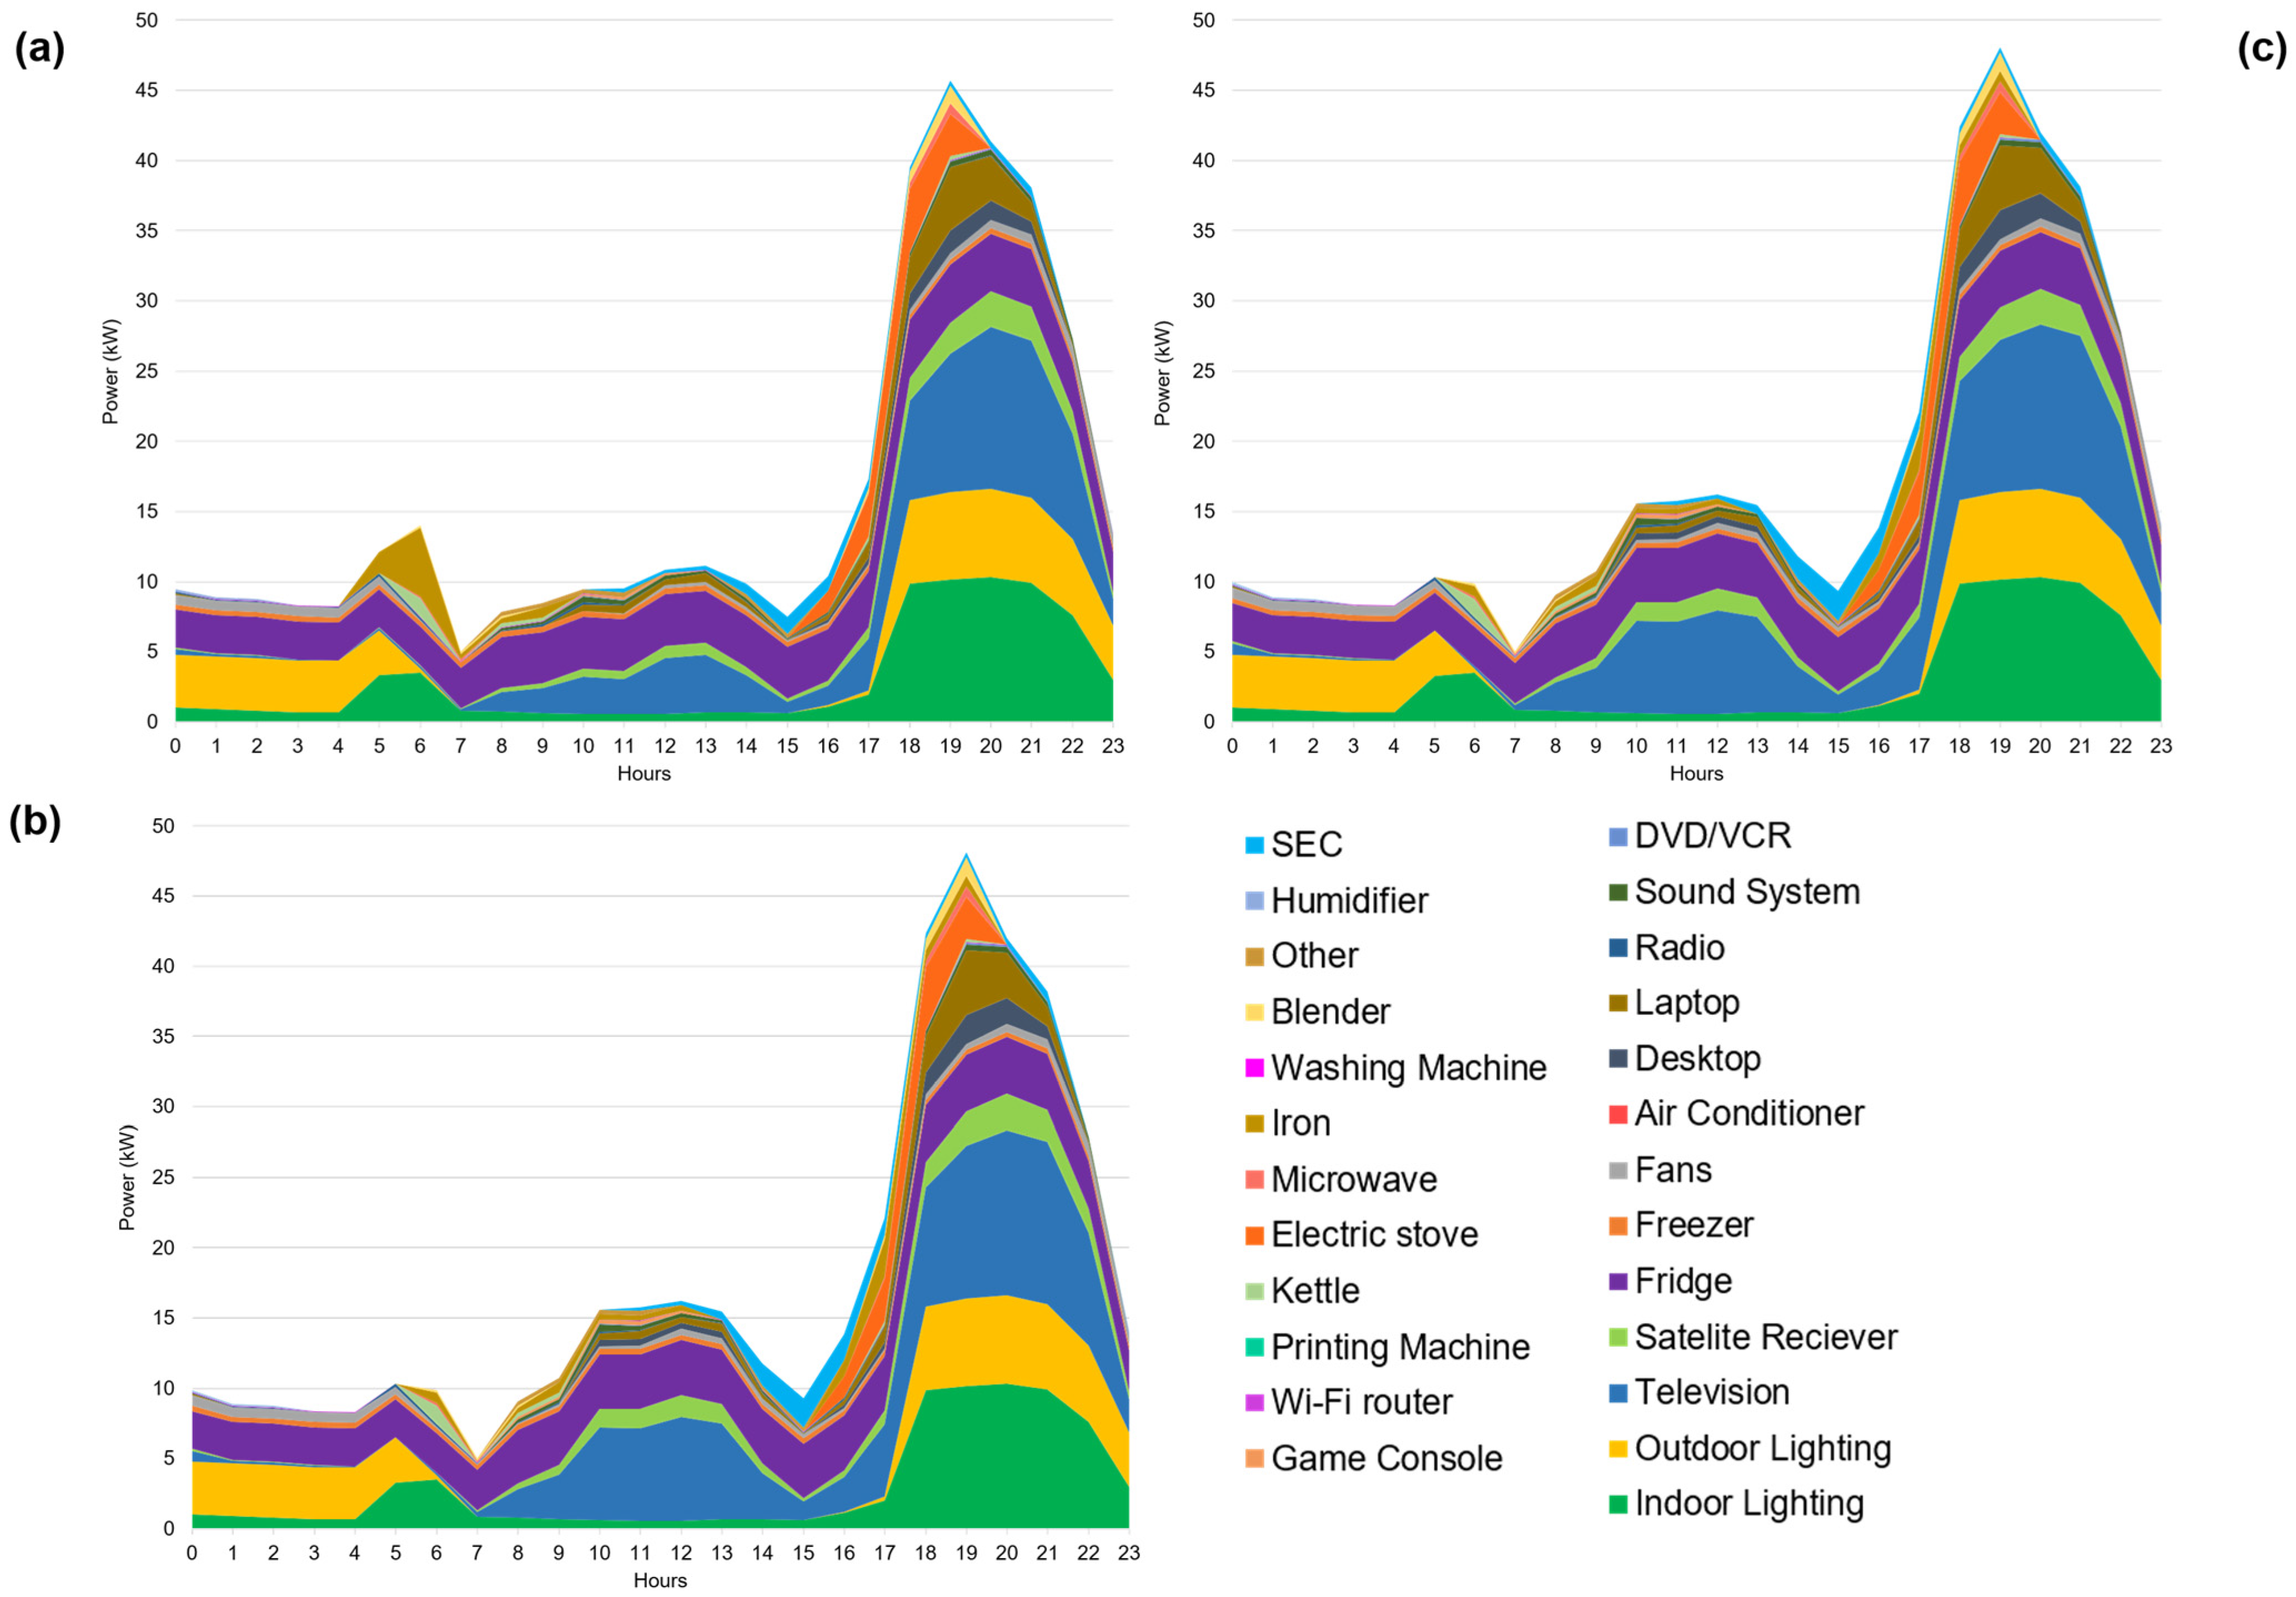
Table 7 gives the electricity demand-characterising parameters. With respect to the dry and hot and rainy seasons, the ToU remained almost the same (19:00 to 20:00), while both the TEC and DMD had lower values.
Table 7.
Dry and cold season electricity demand-characterising parameters for the three groups of consumers.
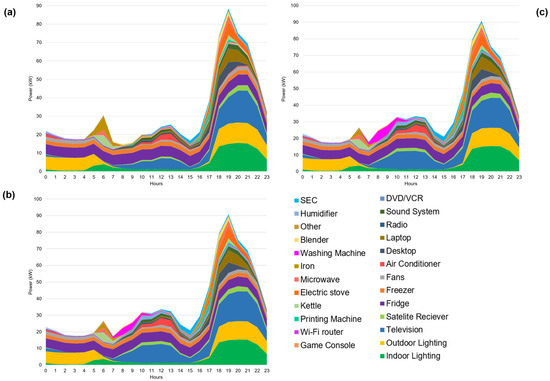
Figure 16.
Disaggregated electricity demand of the high consumers in the dry and cold season (weekdays (a), Saturday (b) and Sunday (c)).
Figure 16.
Disaggregated electricity demand of the high consumers in the dry and cold season (weekdays (a), Saturday (b) and Sunday (c)).

Finally, the DLF, which was up to 36% and 40% on weekdays and weekends, respectively, suggests the presence of more small intervals with high electricity use in the dry and cold season than in the two other seasons, and therefore a greater potential for DSM implementation.
3.5. Appliance Electricity Consumption and Residential Electricity Breakdown
Descriptive statistics of the recorded annual electricity consumption from bills (TECR) compared to the theoretical annual electricity consumption (TECT) are given in Table A4. It was found that for individual households, TECT, in some cases, was underestimated and others overestimated. This can be explained by differences between actual and reported values for average use times and because appliances are usually not operated at their total load capacity. The highest difference between TECT and TECR was 8.8%, for the medium consumers, which was considered acceptable to undertake the electricity breakdown. To confirm the insignificance of the differences found, a One-Way ANOVA was performed between the two consumptions as given in Table A5 and Table A6. Finally, all the statistical test were performed in the data supporting this study in [5].
Table 8 presents individual appliances’ average annual electricity for each consumer group. Two type of annual electricity consumption were calculated for the appliances. The first (TEC1) corresponds to the average electricity consumption when considering the total number of households in the group, while the second (TEC2) was computed considering only the number of households owning the corresponding appliance. This way, the real intensity of use of the studied appliances could be assessed accurately.
Table 8.
Annual electricity consumption of the domestic appliances.
The main consuming appliance for the high consumers was AC with an electricity consumption of 1490 kWh per annum, followed by fridges, fans, TVs, indoor and outdoor lighting and freezers. For the medium consumers, fridges were the most consuming appliance with an average annual electricity use of 369 kWh, followed closely by fans (346 kWh) and then TVs, indoor lighting, AC and outdoor lighting. A similar picture was noticed for the low consumers, except that the most consuming appliances were fans and AC had a much lower electricity use compared to medium and high consumers. Standby consumption accounted for 10.2 kWh, 22.9 kWh and 39.8 kWh per annum in low, medium and high consuming households.
A similar tendency emerged, when considering only the number of households owning a specific appliance (TEC2). However, appliances such as electric stoves, humidifiers, desktops, printing machines, game consoles and sound systems emerged as being used more intensively in reality than what is showed when considering all the number of households in the group.
In the following analyses, the breakdown of annual TEC is given by appliance type, activity and season. The breakdown consists of the following appliances: ACs, fans, TVs sets (televisions and satellite receivers), refrigerators (fridges and freezers), and lighting fixtures (indoor and outdoor) as they were identified as the main contributors to domestic electricity use.
Table 9 shows the three groups seasonal and yearly TEC breakdowns. For the dry and cold season, ACs (45%) in high consuming and fans (37.2% and 27.9%) in low and medium consuming households account for the highest demand. Following these appliances are refrigerators for all consumer groups and then the lighting fixtures for low and medium consumers and fans for the high consumers. As a consequence, cooling, with a share of 58% of the demand, is the most electricity consuming activity of the dry and hot season. Following are the cooking and preserving food (up to 24.4%) for all groups of consumers. Other activities showed shared between 0.6% for SEC and 20.2% for ICE.
Table 9.
Consumers groups seasonal and yearly TEC breakdowns (%).
During the rainy season, lighting closely followed by TVs are the most consuming appliances for the low and medium consumers. Refrigerators followed by ACs share the biggest percentages of the demand for high consumers. The ICE activity was demonstrated to be the highest demand activity for both low and medium consumers. For high consumers, cooling remained as the most consuming activity, followed by ICE and cooking and preserving food. SEC raised to 2% of total electricity demand for the medium consumers.
Lighting was the main appliance demand in the dry and cold season for all consumer groups, with a share of up to 34.1% of the demand. For the two first consumers, TVs (up to 29.8% of the demand) followed lighting, while for high consumers, refrigerators were the second most consuming appliance. ICE and lighting were therefore the most consuming activities during the dry and cold season. An increase in SEC was observed in this season with a share of up to 2.2%.
Finally, for the overall annual breakdown of TEC, cooling dominated other activities within the high and medium consumers, accounting alone for 44% and 30.2%, respectively. ICE, with a share of 28.4% was the highest consuming activity for low consumers. For the two last consumers, cooking and preserving food (up to 25.7% of the demand) was the second greatest consuming activity, whereas for low consumers this was lighting. Other activities accounted for up to 2.4% of the demand and SEC for approximately 1% for all consumer groups.
4. Discussion and Policy Implications
4.1. Comparison with Other Studies
4.1.1. Appliance Ownership and Time of Use
Table 10 and Table 11 give a comparison between this study and other studies in the literature on urban areas in terms of appliance ownership and saturations. On the one hand, as for this study (Burkina Faso), high ownerships rates can be noticed for indoor and outdoor lighting, fans, television, and fridges (Table 10) in developed countries such as the United States (U.S.) and in developing ones such as Ghana, India, Malaysia and Pakistan. Only Colombian households demonstrated very little ownership of cooling appliances including fans and AC. These appliances can, therefore, be considered the basics for the appliances stock of urban households. On the other hand, appliances like laptop, iron and freezer demonstrated lower ownership within urban households of Burkina Faso and Ghana (except for the iron) with respect to the other countries, while appliances including washing machines are almost rare within Burkina Faso households.
Table 10.
Ownership rates (%) of common appliances in comparison with other urban survey studies.
Table 11.
Saturations rates (%) of common appliances in comparison with other urban survey studies.
Surveyed households demonstrated higher values for the saturation of outdoor lighting than the urban Ghanian households (Table 11), while indoor lighting showed the opposite tendency. Fans, televisions, and satellite receivers also demonstrated higher values, with at least 1 unit per household for the urban residences of this study. The same results were found for fans, fridges and televisions in other countries such as Malaysia, Indonesia, Libya, Ghana and the U.S. Some other appliances like microwaves, rice cookers, irons, and blenders showed a saturation of close to one within the U.S. and Indonesian households, respectively. The other appliances showed varied and minimal values for the saturations in this study as well as in this study.
In terms of studies that involve classification into groups of consumers, Table 12 shows the comparison between this study’s results and results on Colombian households. On the one hand, ownership of lighting, televisions, and fridges/freezers revealed similarities between households belonging to the three groups of consumers, except a much less ownership of fridges within the group of low consumers in this study (Burkina Faso). On the other hand, ownership of cooling appliances demonstrated much lower rates within all the three groups of consumers for Colombian households, while Burkina Faso households showed much lower rates for appliances including blenders sound systems, irons and washing machines.
For the appliances’ daily usage, the findings of this study for essential appliances like televisions, fridges, fans and A.C.s are similar to some of the other studies. Figure 17 shows that fridges are operated all day within urban households in Vietnam [53] and al-most all day (23.3 h) in Indonesia [52]. For this study, the daily usage of fridges is close to those values (21.7). On the other hand, daily use of weather-related appliances such as fans and A.C.s is higher in Burkina Faso urban residences than in Indonesia, while A.C.s are used more in Vietnam. Television is used for at least almost 6 h in the three countries, with more significant usage in Indonesia (9.3) than in Burkina Faso (7.7) and Vietnam (5.8). For the other appliances, laptops are used slightly higher in Vietnam, while electric stoves, desktops and DVD/VCD devices are used more in Burkina Faso, and iron is higher in Indonesia.
Table 12.
Ownership rates (%) of common appliances among groups of consumers in comparison with that of groups of consumers formed within Colombian households.
Table 12.
Ownership rates (%) of common appliances among groups of consumers in comparison with that of groups of consumers formed within Colombian households.
| Appliances | Low Consumers | Medium Consumers | High Consumers | |||
|---|---|---|---|---|---|---|
| Burkina Faso | Colombia [4] | Burkina Faso | Colombia [4] | Burkina Faso | Colombia [4] | |
| Lighting | 100 | 100 | 100 | 100 | 100 | 100 |
| Fridge/Freezer | 57.0 | 96.3 | 85.0 | 98.8 | 94.0 | 99.0 |
| Televisions | 91.0 | 75.7 | 98.0 | 94.6 | 100 | 90.6 |
| Blender | 5.0 | 79.0 | 14.0 | 85.9 | 33.0 | 90.6 |
| Sound system | 14.0 | 63.9 | 11.0 | 83.9 | 29.0 | 73.0 |
| Iron | 16.0 | 44.3 | 23.0 | 59.7 | 45.0 | 61.1 |
| Washing machine | 0.0 | 29.7 | 1.0 | 42.3 | 7.0 | 37.9 |
| Fan | 95.0 | 19.6 | 97.0 | 37.4 | 100 | 36.9 |
| Computer | 2.0 | 2.7 | 9.0 | 8.2 | 29.0 | 12.9 |
| AC | 2.0 | 2.0 | 22.0 | 7.9 | 73.0 | 12.1 |
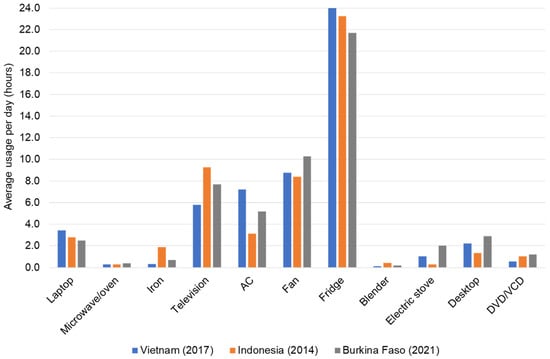
Figure 17.
Average daily time of use of common appliances compared to other survey studies.
Figure 17.
Average daily time of use of common appliances compared to other survey studies.

4.1.2. Electricity Demand Patterns of Use and Characteristics
Findings for the domestic electricity demand patterns of use demonstrated two peaks for the dry and hot season and three peaks for the rainy and dry and cold seasons. During the dry and hot season, the first peak occurs at approximately 12:00 to 13:00 depending on the group of consumers, with cooling appliances, namely fans and ACs contributing the most (up to 43%) of the demand. The second peak, which corresponds to the main peak load of the overall residential sector, occurs from 19:00 to 20:00, especially for the low and medium consumers. Again, cooling loads contribute most of the demand (up to 34%). However, households with AC, primarily the high consumers, showed a notable particularity of having their main peak in demand at midnight, when the cooling appliances were most in use. During the night, cooling loads dominated the electricity demands for all groups. Two daily Peaks period were also recorded in the summer season by Trotta et al. [79] who formed four clusters of Denmark households. However, peaks were recorded in the morning (07:00–08:00) and late in the afternoon (16:00–17:00). The same patterns were recorded by Sun et al. [80] for the weekday electricity demand of Irish households clustered into five groups, with the main peak of the two occurring early in the evening (18:00–19:00).
Daily TEC of this study demonstrated values ranging from 1.0 to 6.42 kWh, which are lower than that found by Trotta et al. [79] for the Danish households. However, DMDs of between 190 and 1380 W that were recorded, with values generally higher during the weekends, are higher than that (280–800 W) for the studied Danish households [79]. The DLF demonstrated values ranging from 46% for the low consumers to 58% for the high consumers. Notably, the low consumers had the lowest values for the DLF, therefore suggesting more potential for the implementation of DSM/EE initiatives.
During the rainy season, three peaks were recorded in the hourly load profiles regardless of the type of day and group of consumers. The first peak occurs at approximately 05:00 to 6:00 depending on the group of users, with lighting appliances (up to 41% of the load), and more specifically indoor lighting, accounting for the majority of the demand. Lighting fixtures were followed by either cooling or food-preserving appliances depending on the group of consumers. The second peak occurs, during the 12:00 to 13:00 period, with this time TV sets (up to 50%) and food-preserving appliances (up to 29%) dominating the load. Finally, the third peak, occurs at 19:00. At this time, the most contributing end-uses were the lighting appliances (up to 38%) and TV sets (up to 34%). For the characteristics of the demand, mean daily TEC of between 0.56 and 3.15 kWh were calculated for the groups of consumers, with a mean DMD of up to 770 W and a DLF of up to 51%, suggesting more potential for demand reduction compared to the dry and hot season.
Such findings are similar to those of Sakah et al. [51] for Ghanaian households, who found that peaks occur in domestic electricity demand at 05:00 and 20:00, respectively, with the peak in the evening being the main peak load of the residential electricity sector. Furthermore, for the contributions of the loads, they also found that lighting fixtures were the main contributors for the two peaks, as they shared, respectively, up to 25% and 26% of the total demand during the two peaks. Trotta et al. also find three peaks for the electricity demand in Danish households, with the first occurring in the morning (07:00–08:00), the second at almost midday (10:00–11:00), and the third very late in the afternoon (17:00–18:00). However, values recorded for the daily TEC were 4-fold higher than that of this study.
The dry and cold season showed very similar patterns of use as the rainy season, with three peaks occurring at approximately 05:00 to 06:00, 12:00 to 13:00 and 19:00. During the periods of the three peaks, the same main contributors were almost recorded, as lighting fixtures demonstrated the greatest share for the first (up to 63%) and third (up to 40%) peaks, while TV sets (up to 54%) were found as the main contributors of the second peak. For the characteristics of the demand, mean daily TEC of between 0.19 and 2.25 kWh were computed for the three groups of consumers, with a mean DMD of up to 700 W and a DLF of up to 40%, suggesting more potential for demand reduction compared to the two previous seasons for all groups of consumers.
4.1.3. Appliance Electricity Consumption and Contribution to Electricity Demand
The annual electricity demand was estimated for each of the three groups of consumers as 822.47 kWh, 1802.58 kWh and 4459.97 kWh, respectively, for the low, medium and high consumers. Comparison of the current results with those in the literature is shown in Table A3. It can be seen that electricity consumption in previous studies is generally 2-fold greater than that in the current study. On the seasonal consumption, Table 13 also shows higher values for Indian urban households in comparison with those of this study. Low consumers among Indian households using 2- to 4-fold higher amounts of electricity that those of Burkina Faso households, with the rainy and the dry and cold seasons demonstrating larger differences. The same tendency was also found among the medium consumers. However, high consumers demonstrated higher values for this study during the summer season, due most likely to the extensive use of cooling appliances.
Table 13.
Yearly and seasonal total electricity consumptions (TEC) compared to that of the Indian urban households.
These computed annual electricity consumptions were up to 8.78% higher than that recorded from the bills, with the values of the medium consumers showing this highest difference. A breakdown of the demands was performed to understand the most contributing appliances and activities throughout the year. Air-conditioners (33.4%) emerged as the most contributing appliances to the overall annual demand for the high consumers, followed by food-preserving appliances (19.4%), lighting fixtures (13.4%), others (12%), TV sets (10.7%) and fans (10.2%). For the low and medium consumers, the most consuming appliances were lighting fixtures (24%) and food-preserving appliances (22.7%). Finally, standby electricity consumption (SEC), if it was an appliance or an activity, was found to account for 1% of the demand, suggesting an opportunity for demand reduction.
As a consequence of the high contributions of fans and ACs to electricity demand, the most consuming activity within the medium and high consumers was cooling with a share of up to 44% of the annual electricity consumption. This was followed mainly by cooking and food-preserving (up to 26%), information–communication–entertainment (ICE: up to 21.4%) and lighting (up to 24%) activities. Such findings are in line with those of Le and Pitts [53] who found that cooling consisted of the primary end-use of Vietnamese households (43%), followed by food-preserving and cooking (23%) and lighting (11%) activities. However, other activities (16%) demonstrated a higher contribution than ICE (8%). Also, Sakah et al. [51] found cooling to be the primary activity for Ghanaian households, with a share of 33%. However, lighting emerged as the second consuming activity in their study with a 23% share of TEC, followed by food-preserving and cooking (19%). ICE and other activities accounted for 13% of TEC. Furthermore, Amber et al. [75] also found an average electricity consumption of 2 487 kWh per annum for the urban households in Pakistan, with AC (up to 41%) and fans (up to 22%) making cooling the most consuming activity. Lighting (up to 15%), televisions (up to 7%) and Fridge (up to 14%), were the second main contributors of the demand, in line with the findings of this study. Finally, our findings are also in line with those of Diawuo et al. [37] who found that the major appliance end-uses in the Ghanian electricity demand were lighting fixtures (CFL), fridges and freezers, air-conditioners, fans, televisions, electric irons and washing machines.
4.2. Policy Implications and Applications for Research
This study unveiled ownership rates, patterns of use and electricity consumption of appliances in urban households of Burkina Faso in the West African Monetary Union. Three types of consumers were investigated including low, medium and high consumers. Results revealed high ownership of appliances including televisions, lighting fixtures, fans, fridges and laptops within urban households of Burkina Faso, which can be considered as basic appliances of the households in such a country. Appliances including irons, desktop, AC, microwaves, demonstrated lower ownership and saturation, while other lasting including washing machines, electric stoves, printing machines were almost rare, specially within low consumers. Indeed, the purchasing power of households in such a country, due to the economic level, is low. Such lower purchasing power is even combined with the characteristics of the actual appliances present in the households. Indeed, old and low energy performances and high-power type of these appliances are still present, and in combination to high electricity prices of the electricity, such situation do not encourage household with higher economic capabilities to purchase these types of appliances. Review of the appliances’ importations framework and policies, and incentives for purchasing efficient appliances can be implemented to start addressing such low ownership.
Also, findings underline therefore the diversity in characteristics and behaviours of the users of domestic electricity and their influence on its patterns of use. This implies the need of designing more tailored policies, considering the different backgrounds of the users. Education on energy behaviours should also be enhanced for increasing energy efficiency/conservation. As this study demonstrated that medium and high consumers are more “comfort” oriented, while low consumers are more “essential (lighting) and entertainment” oriented, these end-uses could be targeted for maximum impact. For example, education and information could be enhanced to avoid increasing SEC in future for the low consumers, while DSM programs including load levelling could be implemented as a priority for high consumers.
As for the overall sample, the findings for the different types of users suggest lower use of electricity among households in Burkina Faso compared to other households in the world. The main contributors of such a demand were revealed, which are important information for the implementation of strategies or programs aiming at load peak and overall demand reduction. Indeed, results show that the main consuming appliances of the domestic electricity sector include ACs, fans, TV sets, fridges and freezers and lighting appliances while main consuming end-uses/activities include cooling, cooking and food-preserving, information–communication–entertainment and lighting. While DSM programs including load levelling, load shifting and load reducing could be implemented depending on the type of appliance for energy conservation in the domestic buildings, other specific strategies could be used for typical appliances including the cooling appliances, when planning for future increases in electricity demand and opportunities for energy efficiency. Alternatives including enhancement of the building’s envelopes’ performances through a reduction in heat can be considered. However, to date, it remains hard for people to afford the proposed solution, especially for low-economic-level people who share a big amount within the population. Added to this are the considerations of people about the materials and technologies, the low elements of research on their effectiveness [81,82]. Also, the government has initiated incentive policies to increase the integration of renewable energy systems, such as solar domestic hot water or photovoltaic systems, as an alternative to fulfil the energy consumption needs of households. However, their saturation is still limited, despite the considerable potential that Burkina Faso has for using such technologies. This low uptake may be explained by issues of affordability and consumers’ trust in the systems’ performance. Further policies and initiatives, possibly including incentives, need, therefore, to be considered and implemented by the government.
Overall, a large range of stakeholders of the electricity sector, not only in the West African Economic and Monetary Union (UEMOA), but also in other regions and countries sharing common characteristics should be interested in the results of this study. It should significantly help to understand current patterns of use of the residential electricity demand. In this sense, such findings should interest the utility services for not only the planning of the demand on existing electrical networks, but also planning the creation of new networks. Furthermore, implementation of DSM strategies such as demand response programs, as well as the integration of renewable sources, which are currently considered as unstable on the grid, can be enhanced due to the improved knowledge of the patterns of the demand. Also, patterns of use revealed by this study could be used by renewable systems designers for designing systems like wind/PV systems where applicable for households in the region. Finally, data unveiled could be the entry data for new demand-side solutions: rooftop distributed photovoltaics, and peer-to-peer trading, which show great potential not only for deep decarbonisation in the residential sector, but also for a reduction in household electricity bills [83,84].
4.3. Limitations of This Study and Future Research
To contribute to reducing the gap in research on domestic electricity consumption in the West African region, this study unveiled information on the characteristics of the domestic residential electricity demand. However, the findings are limited by some constraints given as follows:
First, the sample size remains low despite the computed number reached. Indeed, such a number was computed as a compromise between the resource available and precision. As a result, this leads to low sub-sample sizes used for the identification of the type of consumers of domestic electricity use. This can raise some concern about the representativeness of the findings. Future research should consider bigger sample sizes to not only to assess the results of this study but also enhance the scale of the research by including rural areas of the region.
Second, reported information by households is subjected to potential biases. Indeed, as the unveiled patterns and electricity demand characteristics were given relying on the reported information by the households, underestimation and overestimation could have been observed in the calculations of patterns of use, appliance characteristics and operation modes, etc. Also, even after giving their permission to participate in the survey, some households may have felt observed, leading to a difference between reported and real usage patterns and behaviours. Future research should, therefore, proceed to in situ measurements as much as possible, starting with the presence of individual appliance patterns of use and consumption in dwellings.
Finally, despite the underlined limitations of this study, its findings still stand. First, this study consists of a benchmark or forthcoming studies in terms of the information provided. Valuable insights are provided on the stock of domestic appliances, their patterns of use, and electricity consumption, and the policy implications as well as research applications for a large range of stakeholders of the electricity sector in the West African region.
5. Conclusions
In this study, data collected from 387 households in Ouagadougou, Burkina Faso were used to provide insights into the patterns of use and electricity consumption of domestic appliances in the West African Economic and Monetary Union. The key findings of this study and the responses to the research questions can be synthesised as follows:
- Research question 1: What are the different types of electric appliances and end-uses found in the urban households of the UEMOA?
To answer this research question, this study makes use of the results of city-scale study in the city of Ouagadougou, Burkina Faso. The survey revealed the existence of 23 main appliances in the stock of appliances of the urban households of Burkina Faso. These appliances include lighting fixtures, televisions, satellite receivers, desktops, laptops, radios, DVD/VCR, sound systems, game consoles, Wi-Fi routers, printing machines, fridges, freezers, kettles, blenders, microwaves/ovens, irons, washing machines, electric stoves, humidifiers, air-conditioners, fans and others which include various working and housekeeping appliances. With such appliances, five end-uses were created based on the activities of the households and their use of electrical appliances: lighting, cooking and preserving food, cooling, others, information–communication–entertainment (ICE). Appliances like lighting fixtures, televisions, fans, fridges and laptop demonstrated much higher ownership and saturation. They were, therefore, identified as the basic appliances in urban households. Other appliances including freezers, ACs, desktop, irons, microwaves, blenders and kettles demonstrated lower ownership and saturation, while those like washing machines, electric stoves, DVD/VCRs, and printers were almost rare, most likely due to the economic level of the households. Findings were found in line other studies in the literature on residential electricity use, especially in the global south.
- Research question 2: What are electric appliances’ patterns of use, and to what extent do they and their end-uses contribute to the urban domestic electricity demand in the UEMOA?
To answer this research question, this study makes use of the database created from the survey results on the appliances, their reported characteristics and patterns of use, and the characteristics and behaviours of the users. Findings demonstrated that fridges and fridges are operated at an almost unceasing rate (21.1 h/day), while other common appliances like fans (10 h/day), televisions (8 h/day), and lighting fixtures (8 h/day) also demonstrated varied but high use within the day. Except from the humidifiers, desktop and laptops, other appliances showed short operating times, with use of less than 1 h/day. Periods of operations of the appliances depended on the behaviours of the users, which were varied. However, basic appliances had similar operating periods for all consumers, with lighting from the evening to the next morning, televisions mainly in the evening and ACs and fans during the evening and the night. Contributions of end-uses to the total electricity consumption (TEC) demonstrated that depending on the user and the season of the year, the main electricity consuming appliances in the domestic electricity sector were ACs (up to 45.3%), fans (up to 37.2%), TV sets (up to 29.9%), fridges and freezers (up to 24.3%) and lighting appliances (up to 34.1%), while the main consuming activities include cooling (up to 58%), cooking and preserving food (up to 30.7%), information–communication–entertainment (up to 39.2%) and lighting (up to 34.1%).
- Research question 3: What are the characteristics of the domestic residential electricity demand (load profiles and total electricity consumption), and what are the effects of the seasonal variation on them?
Three groups of consumers, namely low, medium and high consumers, were created based on their level of electricity use. The group of low consumers consist of households using a mean of 891 kWh per annum, the medium consumers using 1976 kWh per annum, and high consumers using 4339 kWh per annum. Patterns of use of domestic electricity were investigated for the whole year and three seasons—the dry and cold, the dry and hot and the rainy seasons. They revealed three general peaks in demand for the three groups, one occurring in the morning at approximately 05:00 and 06:00, depending on the season, the second occurring at approximately midday (12:00 to 13:00), and the third, which corresponds to the main peak domestic electricity demand, at approximately 19:00 in the evening. Four parameters, namely the total electricity consumption (TEC), the daily maximum demand (DMD), the daily load factor (DLF), and the maximum demand period (ToU), were used to characterise the domestic electricity demand. Results showed that depending on the user group and season of the year, the average TEC per household ranges from 0.50 to 6.42 kWh, the average DMD from 0.19 to 1.38 kW, and the DLF from 35 to 58% with the dry and cold season demonstrating the highest potential for DSM/EE implementation.
Author Contributions
Conceptualisation, K.H.S.T. and Y.M.S.; methodology, K.H.S.T., Y.M.S. and R.V.J.; software, K.H.S.T. and D.A.N.; validation, Y.M.S. and R.V.J.; formal analysis, R.V.J. and Y.M.S.; investigation, K.H.S.T., Y.M.S. and D.A.N.; resources, Y.M.S.; data curation, K.H.S.T. and D.A.N.; writing—original draft preparation, K.H.S.T.; writing—review and editing, Y.M.S. and R.V.J.; supervision, Y.M.S. and R.V.J.; project administration, Y.M.S.; funding acquisition, Y.M.S. All authors have read and agreed to the published version of the manuscript.
Funding
This work was supported by the World Bank through the Africa Centres of Excellence Project (ACE), especially the Engineering College Project (CoE-2iE) [Grant numbers: IDA 6388-BF/D443-BF].
Data Availability Statement
The data that support the findings of this study are openly available on request. Information cannot be made public because it was a point of agreement between participants and the authors during the survey.
Conflicts of Interest
The authors declare no conflict of interest.
Abbreviations
| AC | Air-Conditioner |
| DLF | Daily Load Factor |
| DMD | Daily Maximum Demand |
| DSM | Demand-Side Management |
| HVAC | Heating, Ventilation and Air-Conditioning |
| ICE | Information, Communication and Entertainment |
| REC | Residential Electricity Consumption |
| SEC | Standby Electricity Consumption |
| Std. Dev | Standard Deviation |
| TEC | Total Electricity Consumption |
| ToU | Time of maximum demand Use |
| TV | Television |
Appendix A
Table A1 and Table A2 give the characteristics of the appliance stock as well as the recorded nominal power of the investigated appliances.
Table A1.
Characteristics of the appliance stock (number) of the households investigated in this study.
Table A1.
Characteristics of the appliance stock (number) of the households investigated in this study.
| Appliances Ownership | Minimum | Mean | Maximum | Std. Dev |
|---|---|---|---|---|
| Indoor lighting | 1 | 8.70 | 40 | 5.96 |
| Outdoor lighting | 0 | 2.51 | 12 | 1.85 |
| Fans | 0 | 4.34 | 24 | 3.03 |
| Television | 0 | 1.39 | 8 | 0.89 |
| Satellite receiver | 0 | 1.12 | 8 | 0.80 |
| Fridge | 0 | 0.93 | 4 | 0.66 |
| Laptop | 0 | 0.96 | 8 | 1.17 |
| Air-conditioner | 0 | 0.63 | 9 | 1.23 |
| Irons | 0 | 0.30 | 3 | 0.51 |
| Radio | 0 | 0.23 | 3 | 0.49 |
| Sound system | 0 | 0.21 | 4 | 0.49 |
| Blender | 0 | 0.18 | 2 | 0.39 |
| Microwave/oven | 0 | 0.19 | 2 | 0.43 |
| Freezer | 0 | 0.17 | 2 | 0.41 |
| Desktop | 0 | 0.17 | 4 | 0.49 |
| Kettle | 0 | 0.12 | 3 | 0.34 |
| Wi-Fi router | 0 | 0.10 | 3 | 0.32 |
| Game consoles | 0 | 0.10 | 3 | 0.36 |
| DVD/VCR player | 0 | 0.08 | 2 | 0.31 |
| Printing machine | 0 | 0.04 | 2 | 0.20 |
| Humidifiers | 0 | 0.03 | 1 | 0.17 |
| Washing machines | 0 | 0.03 | 1 | 0.16 |
| Electric stoves | 0 | 0.04 | 6 | 0.34 |
| Others * | 0 | 0.04 | 3 | 0.25 |
*: other appliances found in the houses including piano, piercer, tayloring machine etc.
Table A2.
Nominal power of the investigated appliances.
Table A2.
Nominal power of the investigated appliances.
| Name of the Appliance | Options | Unitary Power of Use (W) | Unitary Standby Power (W) |
|---|---|---|---|
| Television | Screen size ≤ 32” | 52 | 8 |
| 32” < Screen size ≤ 40” | 93 | 8 | |
| 40” < Screen size ≤ 65” | 125 | 5 | |
| Screen size > 40” | 196 | 5 | |
| Satellite receiver | Type 1 | 18 | 16 |
| Type 2 | 20 | 4 | |
| Type 3 | 6 | 0.15 | |
| Ballast fluorescent lighting fixtures | 0.6 m | 25 | - |
| 1.2 m | 45 | - | |
| Compact fluorescent lighting fixtures | - | 28 | - |
| LED lighting fixtures | 0.6 m | 9 | - |
| 1.2 m | 18 | - | |
| Bulb | 15 | - | |
| Others lighting fixtures | - | 75 | - |
| Fridge | Capacity ≤ 100 L | 64 | 0.6 |
| 100 L < capacity ≤ 200 L | 96 | 0.6 | |
| 100 L < capacity ≤ 300 L | 111 | 1.0 | |
| Capacity > 300 L | 121 | 1.0 | |
| Freezer | Capacity ≤ 100 L | 68 | 0.6 |
| 100 L < capacity ≤ 200 L | 125 | 1.0 | |
| 100 L < capacity ≤ 300 L | 162 | 1.0 | |
| Capacity > 300 L | 305 | 1.0 | |
| Fan | Ceiling | 42–70 * | - |
| Movable | 42 | - | |
| Air-conditioner | Type 1 | 656 | - |
| Type 2 | 921 | - | |
| Type 3 | 1302 | - | |
| Type 4 | 1828 | - | |
| Type 5 | 2220 | - | |
| Desktop | - | 200 | 25 |
| Laptop | - | 60 | 2 |
| Radio | - | 15 | 6 |
| DVD/VCR | - | 43 | 4 |
| Sound system | - | 57 | 8 |
| Wi-Fi router | - | 11 | 5 |
| Game console | - | 150 | 7 |
| Printing machine | - | 400 | 10 |
| Irons | - | 200 | - |
| Blender | - | 125 | - |
| Kettle | - | 1500 | 2 |
| Humidifier | - | 150 | - |
| Microwave/oven | - | 980 | 1 |
| Washing machine | - | 800 | 3 |
| Electric stove | - | 1500 | - |
* Depends on the speed at which the fan is used.
Appendix B
Table A3 presents the results of established groups of consumers of this study in comparison with other similar studies groups of consumers, while Table A4 shows comparison between recorded and theoretically computed annual electricity use for the three groups of consumers.
Table A3.
Comparison of this study’s three electrical demand groups formed with those in previously reported studies.
Table A3.
Comparison of this study’s three electrical demand groups formed with those in previously reported studies.
| Location | Sample Size | Demand Group | Range of Values (kWh) | Mean Values (kWh) | |
|---|---|---|---|---|---|
| Min | Max | ||||
| Hyderabad and Jaipur (India: 2023) [72] | 41 | Low | - | - | 2169 |
| Medium | - | - | 3870 | ||
| High | - | - | 5618 | ||
| National Census (UK: DECC 2011) [85] | 20,851,507 | Low | 10 | 2480 | 1568 |
| Medium | 2481 | 4310 | 3339 | ||
| High | 4311 | 25,000 | 6850 | ||
| Leicester (UK: 2009) [13] | 315 | Low | 259 | 2543 | 1735 |
| Medium | 2554 | 4041 | 3232 | ||
| High | 4048 | 25,587 | 6588 | ||
| This study: Ouagadougou 2021 (Burkina Faso) | 387 | Low | 181 | 1250 | 870 |
| Medium | 1252 | 2862 | 1976 | ||
| High | 2862 | 10,188 | 4339 | ||
Table A4.
Comparison between the recorded (obtained from the bills) annual electricity consumption (TECR) and the theoretical annual electricity consumption (TECT).
Table A4.
Comparison between the recorded (obtained from the bills) annual electricity consumption (TECR) and the theoretical annual electricity consumption (TECT).
| Statistics | TECR (kWh) | TECT (kWh) | Difference * (%) |
|---|---|---|---|
| Low consumers | 870 | 822 | 5.45 |
| Medium consumers | 1976 | 1803 | 8.78 |
| High consumers | 4339 | 4460 | 2.79 |
*: The differences are given without signs (+/−) consideration.
Table A5.
Results of the Levene, Welch and Brown–Forsythe (robust) tests for assessment of the homogeneity of variance between the TECT and the TECR.
Table A5.
Results of the Levene, Welch and Brown–Forsythe (robust) tests for assessment of the homogeneity of variance between the TECT and the TECR.
| Test | Statistics | Df1 | Df2 | Significancy |
|---|---|---|---|---|
| Levene | 12.672 | 1 | 772 | 0.000 |
| Welch | 0.253 | 1 | 715 | 0.615 |
| Brown–Forsythe | 0.253 | 1 | 715 | 0.615 |
Table A6.
Results of one-way ANOVA test for assessment of significance differences between the TECT and the TECR.
Table A6.
Results of one-way ANOVA test for assessment of significance differences between the TECT and the TECR.
| Sum of Squares | Df | Mean Square | F-Statistic | Significancy | |||
|---|---|---|---|---|---|---|---|
| Between groups | Combined | 10.056 × 10⁶ | 1 | 10.056 × 10⁶ | 0.253 | 0.615 | |
| Linera term | Contrast | 10.056 × 10⁶ | 1 | 10.056 × 10⁶ | 0.253 | 0.615 | |
| Within groups | 30.681 × 10⁸ | 772 | 39.742 × 10⁵ | - | - | ||
| Total | 30.691 × 10⁸ | 773 | - | - |
References
- Mcloughlin, F. Characterising Domestic Electricity Demand for Customer Load Profile Segmentation. Ph.D. Thesis, Technological University Dublin, Dublin, Ireland, 2013. [Google Scholar] [CrossRef]
- IEA. Countries & Regions—IEA. 2023. Available online: https://www.iea.org/countries (accessed on 22 September 2023).
- Romero-Jordán, D.; del Río, P. Analysing the drivers of the efficiency of households in electricity consumption. Energy Policy 2022, 164, 112828. [Google Scholar] [CrossRef]
- Garcia-Miranda, D.S.; Santamaria, F.; Trujillo, C.L.; Rojas-Cubides, H.E.; Riaño, W.A. Factors Influencing Electricity Consumption in Rural Households. Energies 2024, 17, 1392. [Google Scholar] [CrossRef]
- Tete, K.H.S.; Soro, Y.M.; Coulibaly, S.F.A.; Jones, R.V.; Sidibé, S.D.S. Determinants of Urban Residential Electricity Consumption in Burkina Faso: A Study of Dwelling, Household, Socio-Economic and Appliance-Related Factors. Buildings 2024, 14, 683. [Google Scholar] [CrossRef]
- Xia, X.; Sun, H.; Yang, Z.; Yuan, W.; Ma, D. Decoupling Analysis of Rural Population Change and Rural Electricity Consumption Change in China. Int. J. Environ. Res. Public Health 2022, 19, 6676. [Google Scholar] [CrossRef]
- Ahmed, A.; Gasparatos, A. Multi-dimensional energy poverty patterns around industrial crop projects in Ghana: Enhancing the energy poverty alleviation potential of rural development strategies. Energy Policy 2020, 137, 111123. [Google Scholar] [CrossRef]
- Zhang, Y.; Bai, X.; Mills, F.P.; Pezzey, J.C. Rethinking the role of occupant behavior in building energy performance: A review. Energy Build. 2018, 172, 279–294. [Google Scholar] [CrossRef]
- IFDD; UEMOA. Étiquetage des Appareils Electroménagers et Code D’éfficacité Energétique des Bâtiments Neufs au Sein de L’uemoa et Moderation. 2020. Available online: https://formation.ifdd.francophonie.org/wp-content/uploads/2020/09/SEL-IFDD-EE-UEMOA-24-septembre-2020.pdf (accessed on 1 October 2021).
- Bedir, M.; Kara, E.C. Behavioral patterns and profiles of electricity consumption in dutch dwellings. Energy Build. 2017, 150, 339–352. [Google Scholar] [CrossRef]
- Bedir, M.; Hasselaar, E.; Itard, L. Determinants of electricity consumption in Dutch dwellings. Energy Build. 2013, 58, 194–207. [Google Scholar] [CrossRef]
- Jones, R.V.; Lomas, K.J. Determinants of high electrical energy demand in UK homes: Socio-economic and dwelling characteristics. Energy Build. 2015, 101, 24–34. [Google Scholar] [CrossRef]
- Jones, R.V.; Lomas, K.J. Determinants of high electrical energy demand in UK homes: Appliance ownership and use. Energy Build. 2016, 117, 71–82. [Google Scholar] [CrossRef]
- Grottera, C.; Barbier, C.; Sanches-Pereira, A.; de Abreu, M.W.; Uchôa, C.; Tudeschini, L.G.; Cayla, J.-M.; Nadaud, F.; Pereira, A.O., Jr.; Cohen, C.; et al. Linking electricity consumption of home appliances and standard of living: A comparison between Brazilian and French households. Renew. Sustain. Energy Rev. 2018, 94, 877–888. [Google Scholar] [CrossRef]
- McLoughlin, F.; Duffy, A.; Conlon, M. Characterising domestic electricity consumption patterns by dwelling and occupant socio-economic variables: An Irish case study. Energy Build. 2012, 48, 240–248. [Google Scholar] [CrossRef]
- Grandjean, A. Introduction de non Linéarités et non Stationnarités dans les Modèles de Représentation de la Demande Électrique Résidentie; École Nationale Supérieure des Mines de Paris: Paris, France, 2013. [Google Scholar]
- de Almeida, A.; Fonseca, P.; Schlomann, B.; Feilberg, N. Characterization of the household electricity consumption in the EU, potential energy savings and specific policy recommendations. Energy Build. 2011, 43, 1884–1894. [Google Scholar] [CrossRef]
- Tam, V.W.Y.; Almeida, L.; Le, K. Energy-Related Occupant Behaviour and Its Implications in Energy Use: A Chronological Review. Sustainability 2018, 10, 2635. [Google Scholar] [CrossRef]
- Economidou, M.; Todeschi, V.; Bertoldi, P.; D’Agostino, D.; Zangheri, P.; Castellazzi, L. Review of 50 years of EU energy efficiency policies for buildings. Energy Build. 2020, 225, 110322. [Google Scholar] [CrossRef]
- Malgas, I.; Eberhard, A. Hybrid power markets in Africa: Generation planning, procurement and contracting challenges. Energy Policy 2011, 39, 3191–3198. [Google Scholar] [CrossRef]
- Peprah, F.; Gyamfi, S.; Effah-Donyina, E.; Amo-Boateng, M. The pathway for electricity prosumption in Ghana. Energy Policy 2023, 177, 113582. [Google Scholar] [CrossRef]
- Onyeji, I.; Bazilian, M.; Nussbaumer, P. Contextualizing electricity access in sub-Saharan Africa. Energy Sustain. Dev. 2012, 16, 520–527. [Google Scholar] [CrossRef]
- Zebra, E.I.C.; van der Windt, H.J.; Olubayo, B.; Nhumaio, G.; Faaij, A.P. Scaling up the electricity access and addressing best strategies for a sustainable operation of an existing solar PV mini-grid: A case study of Mavumira village in Mozambique. Energy Sustain. Dev. 2023, 72, 58–82. [Google Scholar] [CrossRef]
- Moner-Girona, M.; Bódis, K.; Morrissey, J.; Kougias, I.; Hankins, M.; Huld, T.; Szabó, S. Decentralized rural electrification in Kenya: Speeding up universal energy access. Energy Sustain. Dev. 2019, 52, 128–146. [Google Scholar] [CrossRef]
- Moner-Girona, M.; Bódis, K.; Huld, T.; Kougias, I.; Szabó, S. Universal access to electricity in Burkina Faso: Scaling-up renewable energy technologies. Environ. Res. Lett. 2016, 11, 084010. [Google Scholar] [CrossRef]
- Adaramola, M.S.; Paul, S.S.; Oyewola, O.M. Assessment of decentralized hybrid PV solar-diesel power system for applications in Northern part of Nigeria. Energy Sustain. Dev. 2014, 19, 72–82. [Google Scholar] [CrossRef]
- Ogunjuyigbe, A.; Ayodele, T.; Monyei, C. An intelligent load manager for PV powered off-grid residential houses. Energy Sustain. Dev. 2015, 26, 34–42. [Google Scholar] [CrossRef]
- Odou, O.D.T.; Bhandari, R.; Adamou, R. Hybrid off-grid renewable power system for sustainable rural electrification in Benin. Renew. Energy 2020, 145, 1266–1279. [Google Scholar] [CrossRef]
- Tarekegne, B.; Sidortsov, R. Evaluating sub-Saharan Africa’s electrification progress: Guiding principles for pro-poor strategies. Energy Res. Soc. Sci. 2021, 75, 102045. [Google Scholar] [CrossRef]
- Tete, K.H.; Soro, Y.; Sidibé, S.; Jones, R.V. Assessing energy security within the electricity sector in the West African economic and monetary union: Inter-country performances and trends analysis with policy implications. Energy Policy 2023, 173, 113336. [Google Scholar] [CrossRef]
- de la Rue du Can, S.; Pudleiner, D.; Pielli, K. Energy efficiency as a means to expand energy access: A Uganda roadmap. Energy Policy 2018, 120, 354–364. [Google Scholar] [CrossRef]
- Lorenzoni, L.; Cherubini, P.; Fioriti, D.; Poli, D.; Micangeli, A.; Giglioli, R. Classification and modeling of load profiles of isolated mini-grids in developing countries: A data-driven approach. Energy Sustain. Dev. 2020, 59, 208–225. [Google Scholar] [CrossRef]
- Muhoza, C.; Johnson, O.W. Exploring household energy transitions in rural Zambia from the user perspective. Energy Policy 2018, 121, 25–34. [Google Scholar] [CrossRef]
- Blechinger, P.; Papadis, E.; Baart, M.; Telep, P.; Simonsen, F. What Size Shall It Be? 2016. Available online: https://www.giz.de/en (accessed on 15 June 2023).
- Blodgett, C.; Dauenhauer, P.; Louie, H.; Kickham, L. Accuracy of energy-use surveys in predicting rural mini-grid user consumption. Energy Sustain. Dev. 2017, 41, 88–105. [Google Scholar] [CrossRef]
- Sarkodie, S.A. Estimating Ghana’s electricity consumption by 2030: An ARIMA forecast. Energy Sources Part B Econ. Plan. Policy 2017, 12, 936–944. [Google Scholar] [CrossRef]
- Diawuo, F.A.; Sakah, M.; Pina, A.; Baptista, P.C.; Silva, C.A. Disaggregation and characterization of residential electricity use: Analysis for Ghana. Sustain. Cities Soc. 2019, 48, 101586. [Google Scholar] [CrossRef]
- Diawuo, F.A.; Sakah, M.; de la Rue du Can, S.; Baptista, P.C.; Silva, C.A. Assessment of multiple-based demand response actions for peak residential electricity reduction in Ghana. Sustain. Cities Soc. 2020, 59, 102235. [Google Scholar] [CrossRef]
- Gyamfi, S.; Diawuo, F.A.; Kumi, E.N.; Sika, F.; Modjinou, M. The energy efficiency situation in Ghana. Renew. Sustain. Energy Rev. 2018, 82, 1415–1423. [Google Scholar] [CrossRef]
- Oluwole, O.; Collin, A.J.; van der Weijde, A.H.; Kiprakis, A.E.; Harrison, G.P. A bottom-up weather-sensitive residential demand model for developing countries. A case study of Abuja, Nigeria. Energy Sustain. Dev. 2020, 58, 138–149. [Google Scholar] [CrossRef]
- Akinbulire, T.O.; Oluseyi, P.O.; Babatunde, O.M. Techno-economic and environmental evaluation of demand side management techniques for rural electrification in Ibadan, Nigeria. Int. J. Energy Environ. Eng. 2014, 5, 375–385. [Google Scholar] [CrossRef]
- Olatunji, O.O.; Akinlabi, S.A.; Madushele, N.; Adedeji, P.A.; Ishola, F.; Ayo, O.O. Wastage amidst shortage: Strategies for the mitigation of standby electricity in residential sector in Nigeria. J. Phys. Conf. Ser. 2019, 1378, 042062. [Google Scholar] [CrossRef]
- Adeoye, O.; Spataru, C. Modelling and forecasting hourly electricity demand in West African countries. Appl. Energy 2019, 242, 311–333. [Google Scholar] [CrossRef]
- UEMOA. Présentation de L’uemoa|Union Economique et Monétaire Ouest Africaine. 2021. Available online: https://www.uemoa.int/presentation (accessed on 22 September 2021).
- UNSD; IRENA; IEA; World Bank; WHO. Tracking SDG 7: The Energy Progress Report 2022. Available online: https://www.worldbank.org/en/topic/energy/publication/tracking-sdg-7-the-energy-progress-report-2022 (accessed on 21 December 2022).
- ECREEE. Plan D’Action National D’Efficacité Energétique (PANEE—Burkina Faso). 2015. Available online: http://documents.worldbank.org/curated/en/2015/07/24819836/eeea-enhancing-world-bank?s-energy-access-investments-through-energy-efficiency (accessed on 19 August 2021).
- MEMC/BF. Tableau de Bord 2020 du Ministère de L’Energie, des Mines et des Carrières. 2020. Available online: http://cns.bf/IMG/pdf/tableau_de_bord_2020_memc.pdf (accessed on 12 October 2022).
- INSD-BF. Résultats Préliminaires du Cinquième Recensement Général de la Population et de l’Habitation du Burkina Faso (RGPH 5). 2020. Available online: http://cns.bf/IMG/pdf/rapport_preliminaire_rgph_2019.pdf (accessed on 6 February 2023).
- Kabore, S.B.; Kam, O.; Germain Wende Pouire, B. Dieudonné Joseph, Etude de l’evolution climatique au Burkina Faso de 1983 à 2012: Cas des villes de Bobo Dioulasso, Ouagadougou et Dori. Arab. J. Earth Sci. 2017, 4, 70–80. Available online: https://www.researchgate.net/publication/323068909_ (accessed on 6 February 2023).
- Massieke, A.A.R.S.; Tapsoba, F.W.-B.; Kabore, D.; Seogo, I.; Tankoano, A.; Dicko, M.H.; Toguyeni, A.; Sawadogo-Lingani, H. Etude sur la capacité de production, du circuit de commercialisation et de la consommation du zoom-koom vendu dans la ville de Ouagadougou au Burkina Faso. Int. J. Biol. Chem. Sci. 2018, 11, 2294. [Google Scholar] [CrossRef]
- Sakah, M.; de la Rue du Can, S.; Diawuo, F.A.; Sedzro, M.D.; Kuhn, C. A study of appliance ownership and electricity consumption determinants in urban Ghanaian households. Sustain. Cities Soc. 2019, 44, 559–581. [Google Scholar] [CrossRef]
- Sukarno, I.; Matsumoto, H.; Susanti, L. Household lifestyle effect on residential electrical energy consumption in Indonesia: On-site measurement methods. Urban Clim. 2017, 20, 20–32. [Google Scholar] [CrossRef]
- Le, V.T.; Pitts, A. A survey on electrical appliance use and energy consumption in Vietnamese households: Case study of Tuy Hoa city. Energy Build. 2019, 197, 229–241. [Google Scholar] [CrossRef]
- Mohamed, A.M.; Al-Habaibeh, A.; Abdo, H.; Elabar, S.; Mohammed, O. Towards exporting renewable energy from MENA region to Europe: An investigation into domestic energy use and householders’ energy behaviour in Libya. Appl. Energy 2015, 146, 247–262. [Google Scholar] [CrossRef]
- European Commission; Eurostat. Manual for Statistics on Energy Consumption in Households; European Commission Publications Office: Luxembourg, 2013. [Google Scholar] [CrossRef]
- INSD-BF. Rapport D’enquête Régionale Intégrée sur L’Emploi et le Secteur Informel (ERI-ESI). 2019. Available online: https://www.insd.bf/sites/default/files/2021-12/Burkina%20%20%20%20Faso_ERI-ESI_SyntheseVF.pdf (accessed on 23 February 2021).
- INSD-BF. Cinquième Recensement Général de la Population et de L’habitation du Burkina Faso (5e RGPH): Synthèse des Résultats Définitifs. 2022. Available online: https://www.insd.bf/fr/file-download/download/public/2071 (accessed on 6 February 2023).
- INSD-BF. Annuaire Statistique 2019, Ouagadougou. 2020. Available online: https://www.insd.bf/fr/statistiques/autres-statitiques/annuaires-statitiques-nationales (accessed on 23 February 2021).
- Cresswell, J.F. Research design—Qualitative Quantitative and Mixed Methods Approaches. Organ. Res. Methods 2009, 12, 801–804. [Google Scholar] [CrossRef]
- Newman, I.; Ridenour, C. Qualitative-Quantitative Research Methodology: Exploring the Interactive Continuum. Educational Leadership Faculty Publications. 1998. Available online: https://ecommons.udayton.edu/eda_fac_pub/122 (accessed on 16 February 2023).
- Hong, T.; Yan, D.; D’Oca, S.; Chen, C.-F. Ten questions concerning occupant behavior in buildings: The big picture. J. Affect. Disord. 2017, 114, 518–530. [Google Scholar] [CrossRef]
- Carpino, C.; Mora, D.; De Simone, M. On the use of questionnaire in residential buildings. A review of collected data, methodologies and objectives. Energy Build. 2019, 186, 297–318. [Google Scholar] [CrossRef]
- Surahman, U.; Hartono, D.; Setyowati, E.; Jurizat, A. Investigation on household energy consumption of urban residential buildings in major cities of Indonesia during COVID-19 pandemic. Energy Build. 2022, 261, 111956. [Google Scholar] [CrossRef] [PubMed]
- Rosas-Flores, J.A.; Rosas-Flores, D.; Gálvez, D.M. Saturation, energy consumption, CO2 emission and energy efficiency from urban and rural households appliances in Mexico. Energy Build. 2011, 43, 10–18. [Google Scholar] [CrossRef]
- McNeil, M.A.; Letschert, V.E. Modeling diffusion of electrical appliances in the residential sector. Energy Build. 2010, 42, 783–790. [Google Scholar] [CrossRef]
- Ren, G.; Sunikka-Blank, M.; Zhang, X. Young urban households in Shanghai, China: Characteristics of energy use and attitudes. Sustain. Cities Soc. 2020, 60, 102174. [Google Scholar] [CrossRef]
- Barjak, F.; Lindeque, J.; Koch, J.; Soland, M. Segmenting household electricity customers with quantitative and qualitative approaches. Renew. Sustain. Energy Rev. 2022, 157, 112014. [Google Scholar] [CrossRef]
- Abreu, J.M.; Pereira, F.C.; Ferrão, P. Using pattern recognition to identify habitual behavior in residential electricity consumption. Energy Build. 2012, 49, 479–487. [Google Scholar] [CrossRef]
- Mohammad, A.; Shrestha, P.; Kumar, S. Urban residential energy use in Kandahar, Afghanistan. Cities 2013, 32, 135–142. [Google Scholar] [CrossRef]
- Manjunath, M.; Singh, P.; Mandal, A.; Parihar, G.S. Consumer Behaviour towards Electricity–A Field Study. Energy Procedia 2014, 54, 541–548. [Google Scholar] [CrossRef]
- Summerfield, A.J.; Pathan, A.; Lowe, R.J.; Oreszczyn, T. Changes in energy demand from low-energy homes. Build. Res. Inf. 2010, 38, 42–49. [Google Scholar] [CrossRef]
- Firth, S.; Lomas, K.; Wright, A.; Wall, R. Identifying trends in the use of domestic appliances from household electricity consumption measurements. Energy Build. 2008, 40, 926–936. [Google Scholar] [CrossRef]
- Tete, K.H.; Soro, Y.; Sidibé, S.; Jones, R.V. Urban domestic electricity consumption in relation to households’ lifestyles and energy behaviours in Burkina Faso: Findings from a large-scale, city-wide household survey. Energy Build. 2023, 285, 112914. [Google Scholar] [CrossRef]
- U.S. Energy Information Administration (EIA); Energy Information Administration. Residential Energy Consumption Survey (RECS). 2020. Available online: https://www.eia.gov/consumption/residential/ (accessed on 10 August 2022).
- Amber, K.P.; Ahmad, R.; Farmanbar, M.; Bashir, M.A.; Mehmood, S.; Khan, M.S.; Saeed, M.U. Unlocking Household Electricity Consumption in Pakistan. Buildings 2021, 11, 566. [Google Scholar] [CrossRef]
- Gupta, R.; Antony, A.; Garg, V.; Mathur, J. Examining the magnitude and causes of variation in electricity use in a sample of Indian dwellings with and without air conditioning. J. Asian Arch. Build. Eng. 2024, 1–17. [Google Scholar] [CrossRef]
- Sena, B.; Zaki, S.A.; Rijal, H.B.; Ardila-Rey, J.A.; Yusoff, N.M.; Yakub, F.; Ridwan, M.K.; Muhammad-Sukki, F. Determinant Factors of Electricity Consumption for a Malaysian Household Based on a Field Survey. Sustainability 2021, 13, 818. [Google Scholar] [CrossRef]
- Ali, S.S.S.; Razman, M.R.; Awang, A.; Asyraf, M.R.M.; Ishak, M.R.; Ilyas, R.A.; Lawrence, R.J. Critical Determinants of Household Electricity Consumption in a Rapidly Growing City. Sustainability 2021, 13, 4441. [Google Scholar] [CrossRef]
- Trotta, G.; Gram-Hanssen, K.; Jørgensen, P.L. Heterogeneity of Electricity Consumption Patterns in Vulnerable Households. Energies 2020, 13, 4713. [Google Scholar] [CrossRef]
- Sun, L.; Zhou, K.; Yang, S. An ensemble clustering based framework for household load profiling and driven factors identification. Sustain. Cities Soc. 2020, 53, 101958. [Google Scholar] [CrossRef]
- Hema, C.M.; Van Moeseke, G.; Evrad, A.; Courard, L.; Messan, A. Vernacular housing practices in Burkina Faso: Representative models of construction in Ouagadougou and walls hygrothermal efficiency. Energy Procedia 2017, 122, 535–540. [Google Scholar] [CrossRef]
- Zoungrana, O.; Bologo-Traoré, M.; Messan, A.; Nshimiyimana, P.; Pirotte, G. The Paradox around the Social Representations of Compressed Earth Block Building Material in Burkina Faso: The Material for the Poor or the Luxury Material? Open J. Soc. Sci. 2021, 9, 50–65. [Google Scholar] [CrossRef]
- Xia, Y.; Xu, Q.; Li, Y.; Fu, H.; Shi, L.; Lin, K.; Wu, F. Peer-to-peer energy trading participating in ancillary service market as federated power plants. Int. J. Electr. Power Energy Syst. 2024, 157, 109859. [Google Scholar] [CrossRef]
- Cai, Q.; Qing, J.; Xu, Q.; Shi, G.; Liang, Q.-M. Techno-economic impact of electricity price mechanism and demand response on residential rooftop photovoltaic integration. Renew. Sustain. Energy Rev. 2024, 189, 113964. [Google Scholar] [CrossRef]
- Jones, R.V. An Investigation of the Socio-Economic, Technical and APPLIANCE Related Factors Affecting High Electrical Energy Demand in UK Homes. Ph.D. Thesis, Loughborough University, Loughborough, UK, 2013. Available online: https://dspace.lboro.ac.uk/dspace-jspui/bitstream/2134/14477/3/Thesis-2013-Jones.pdf (accessed on 22 April 2021).
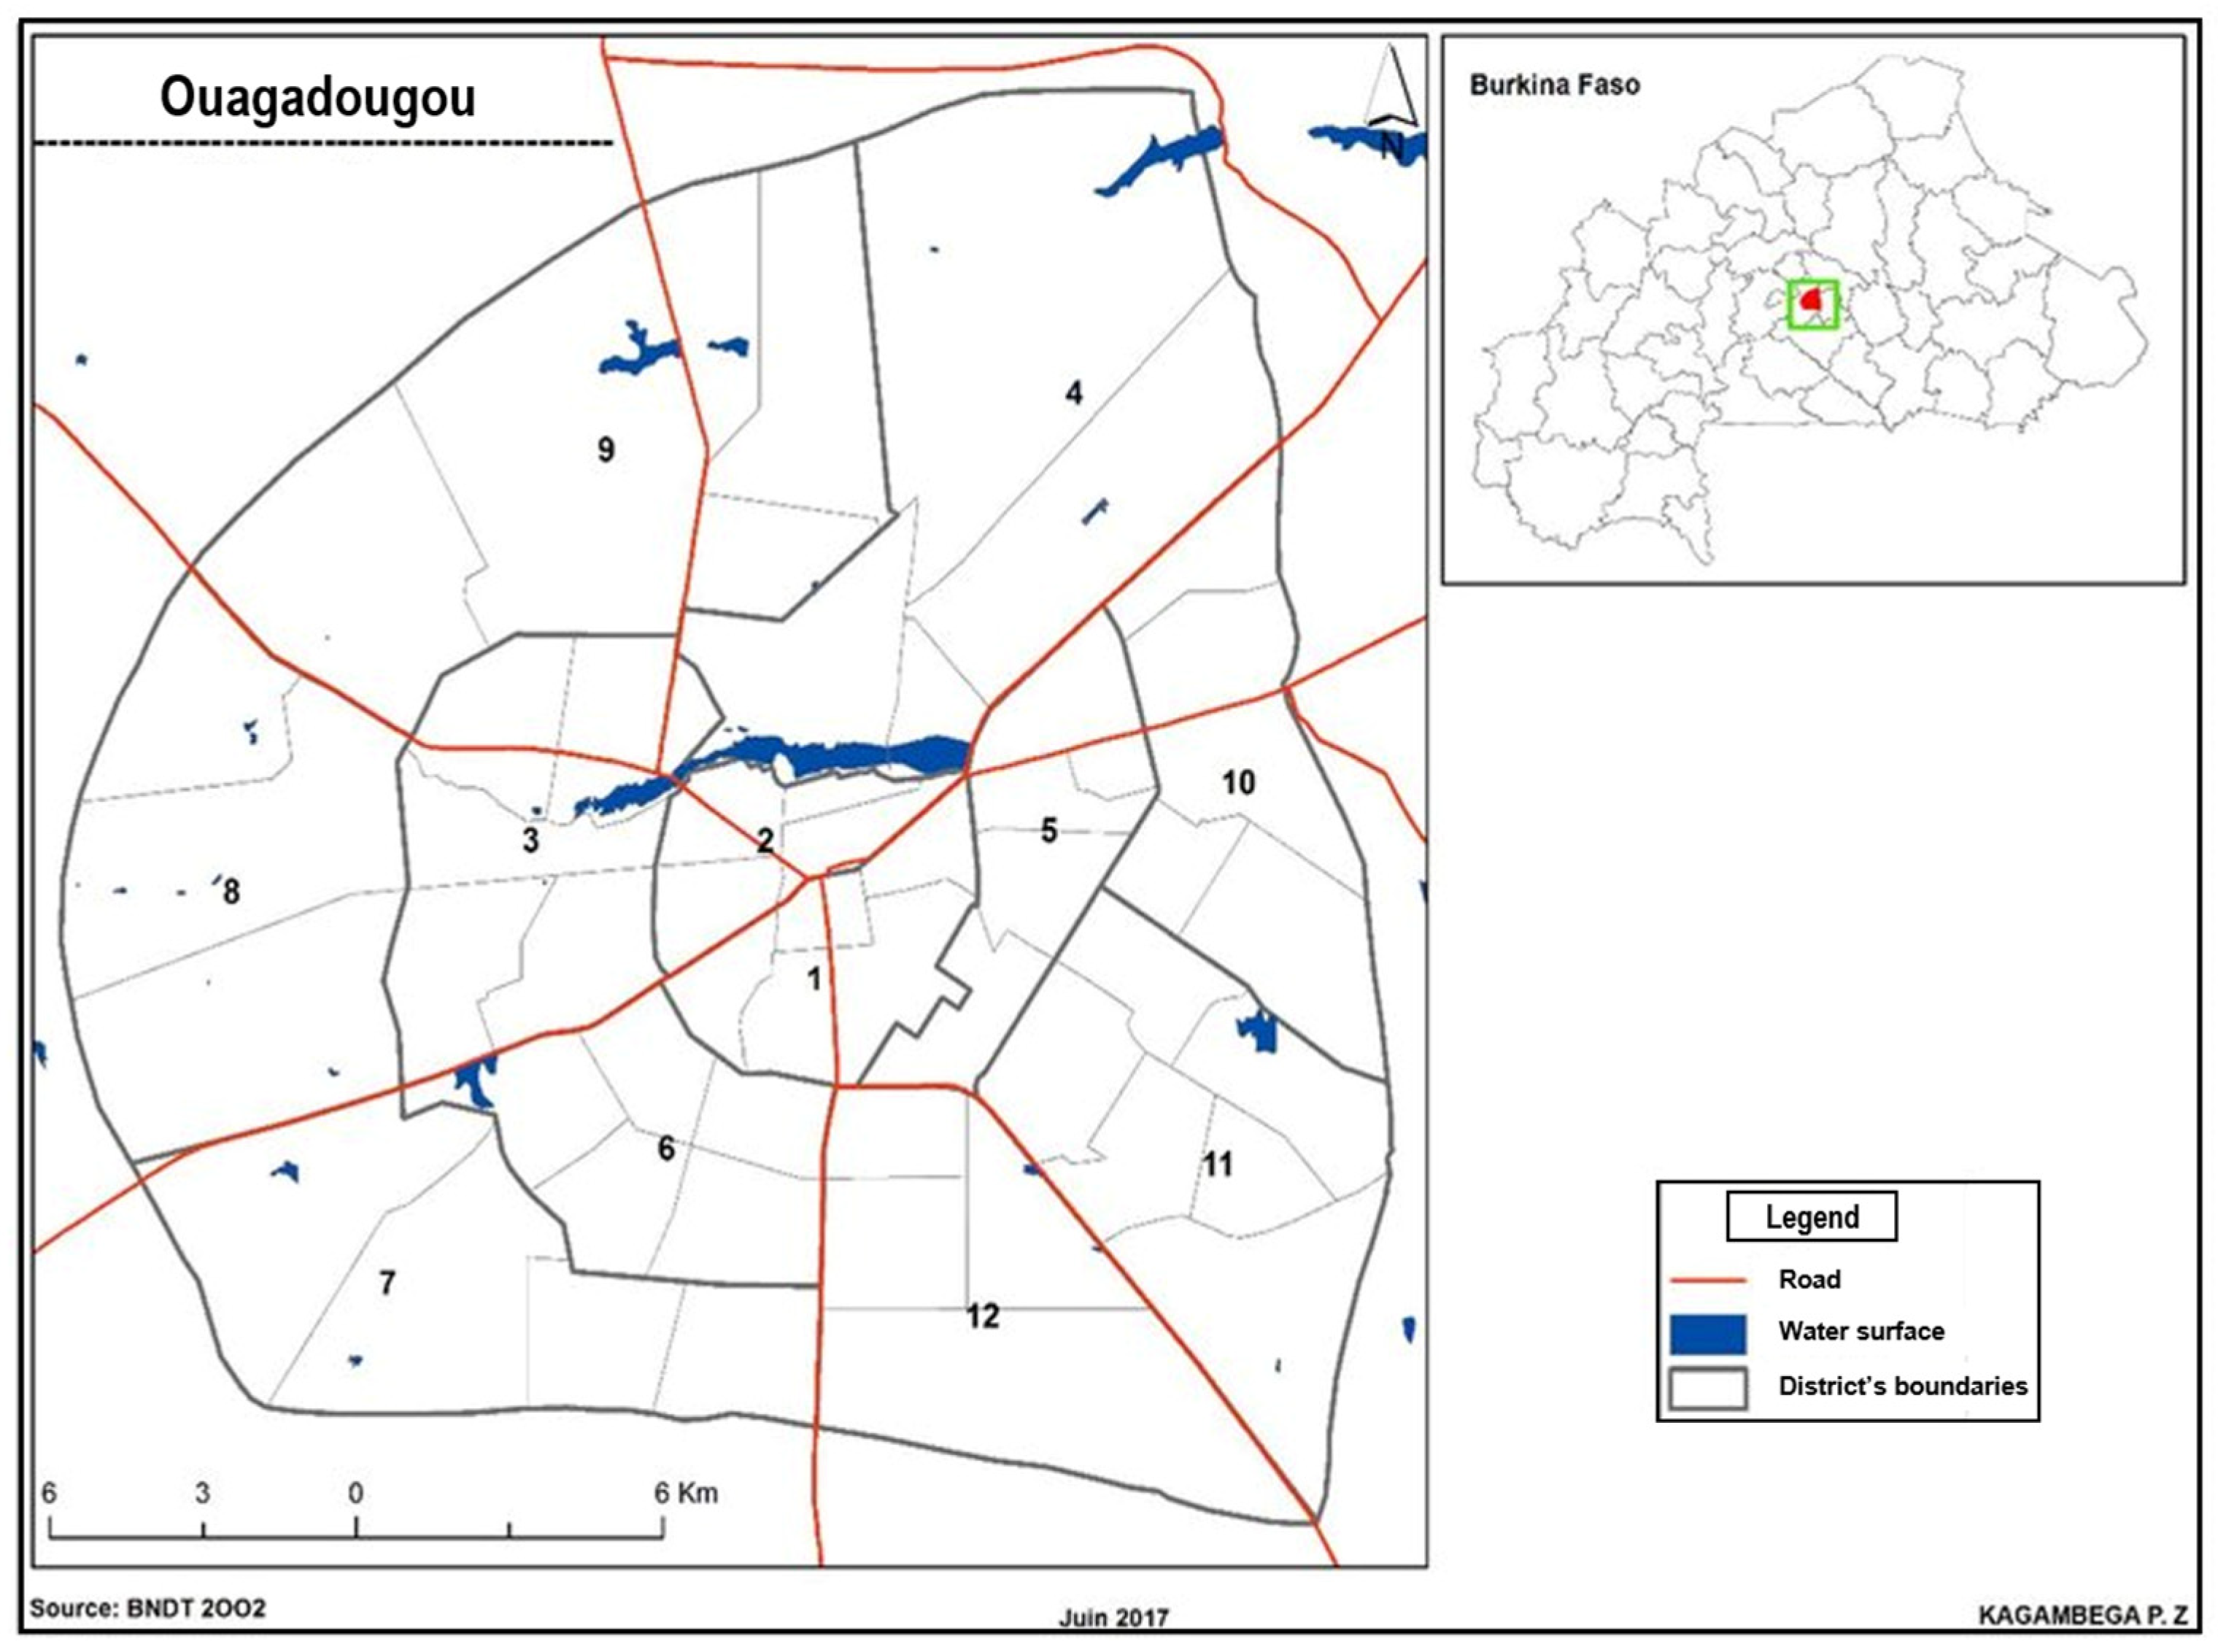
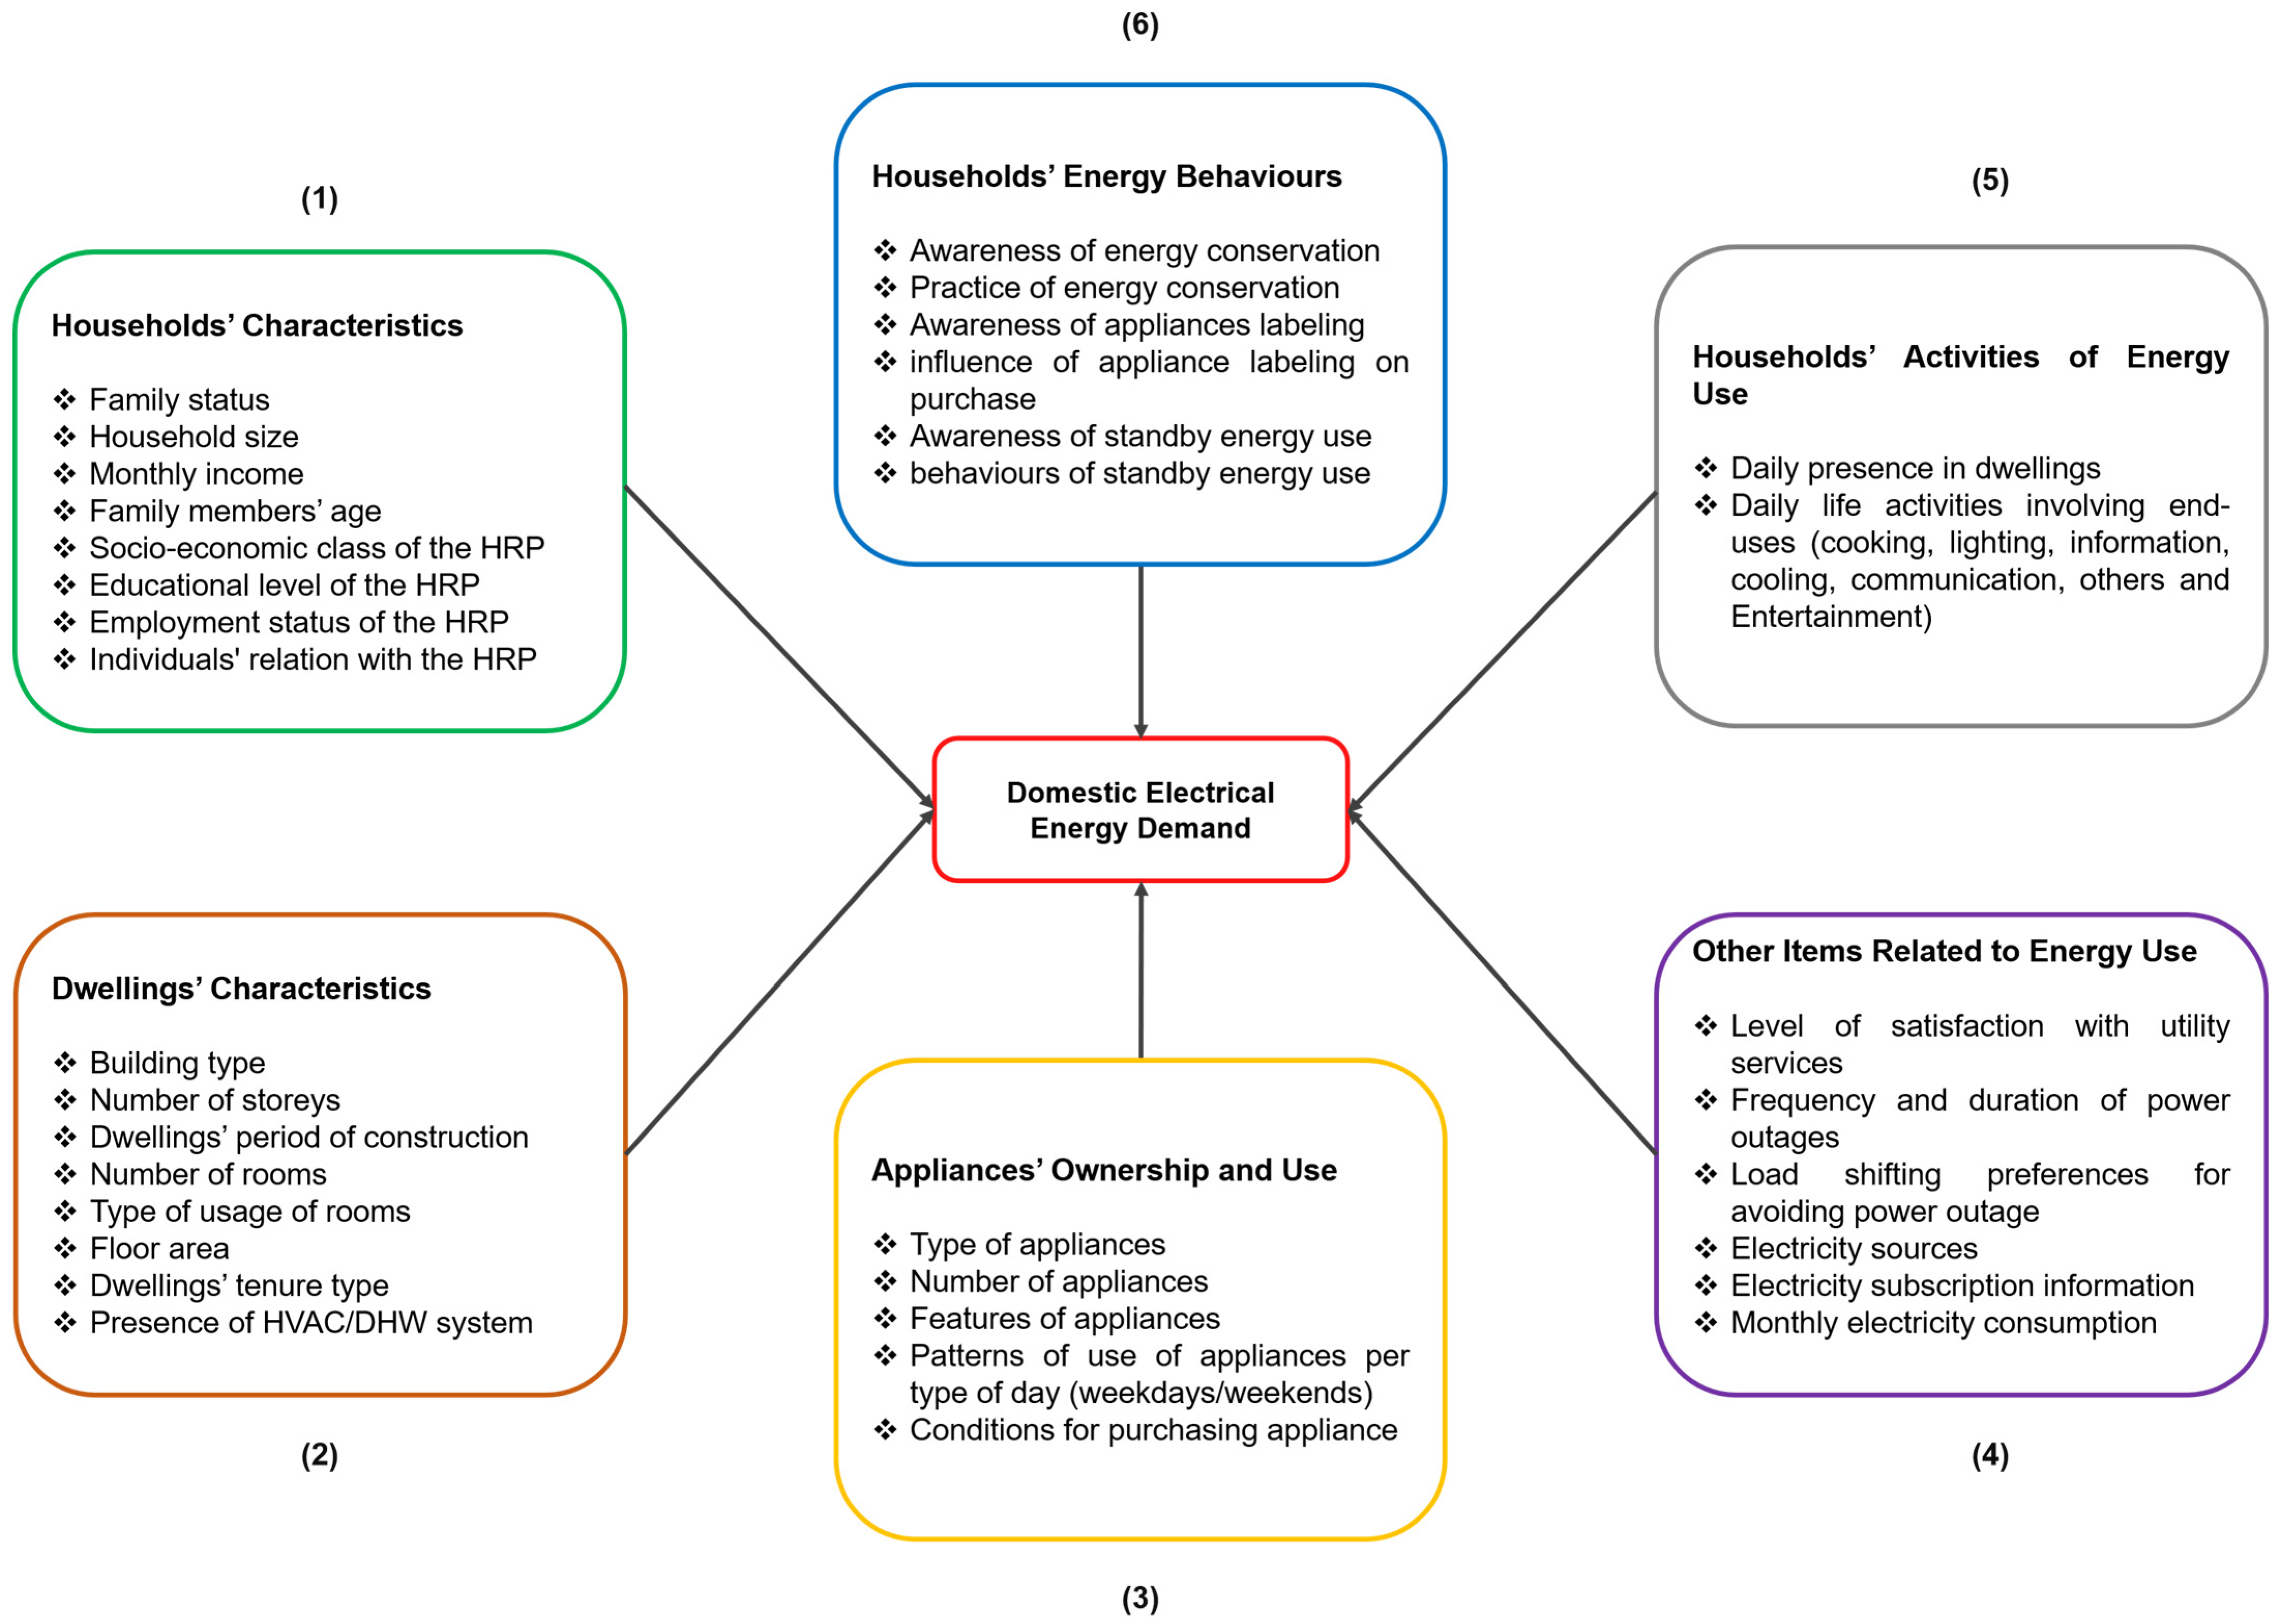
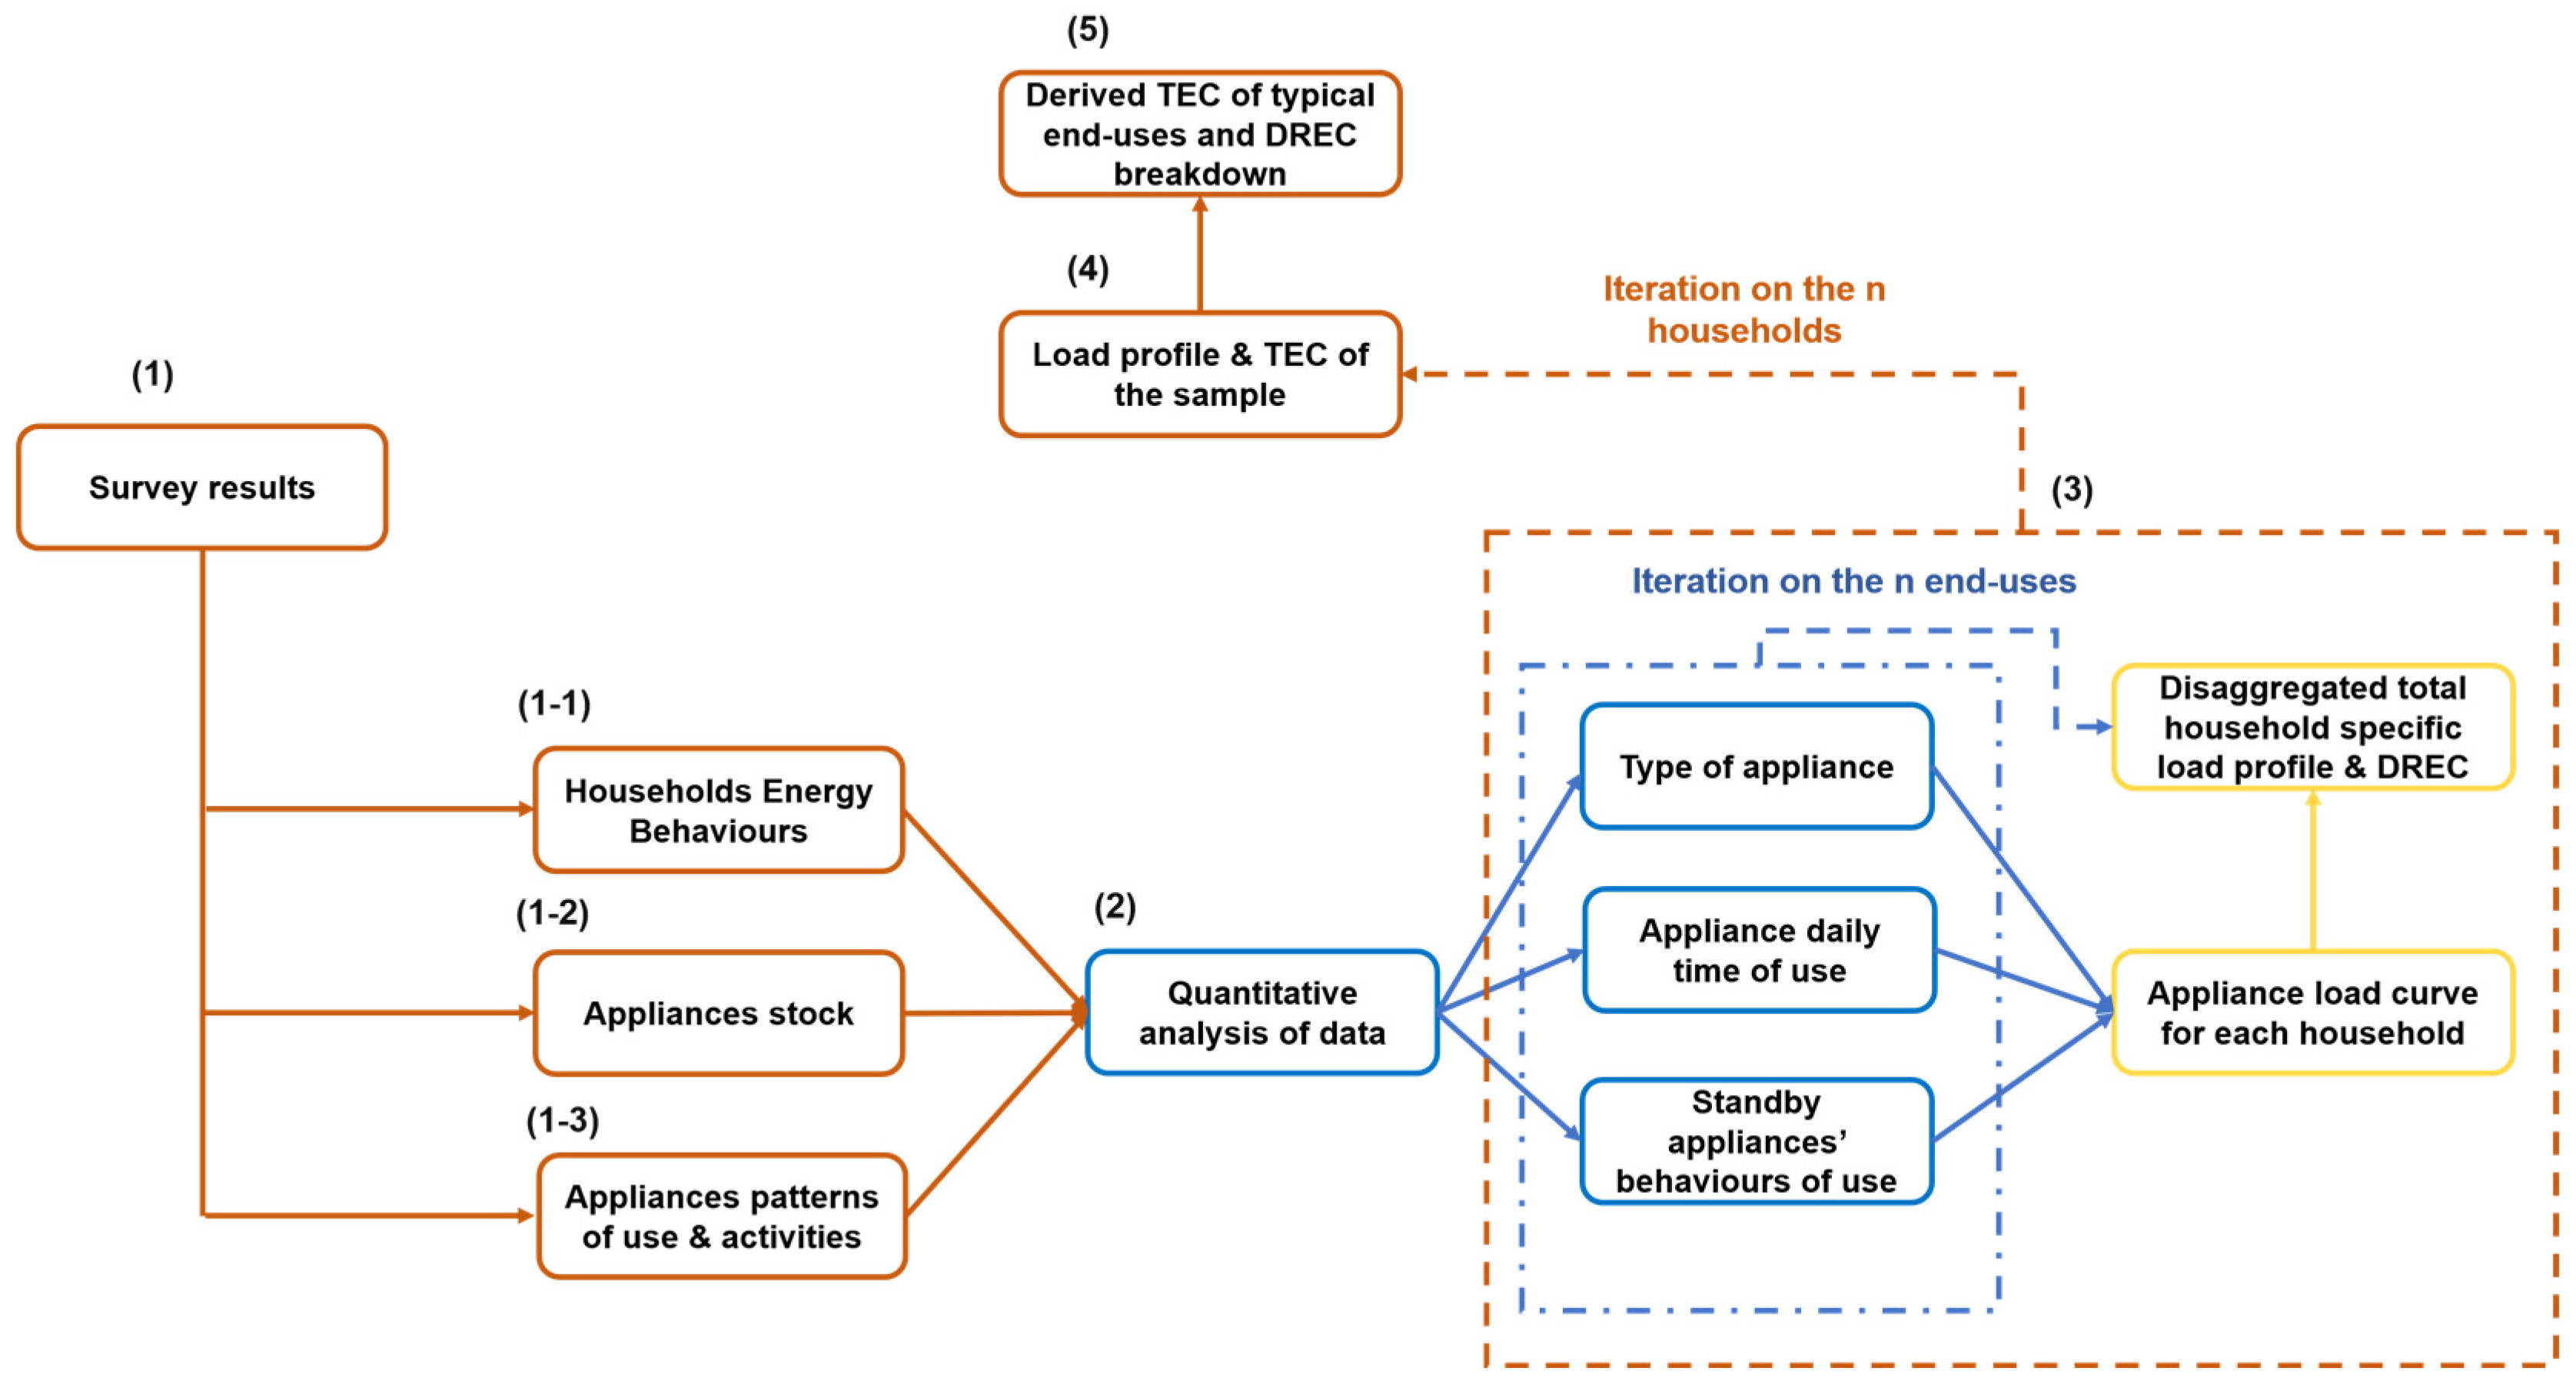
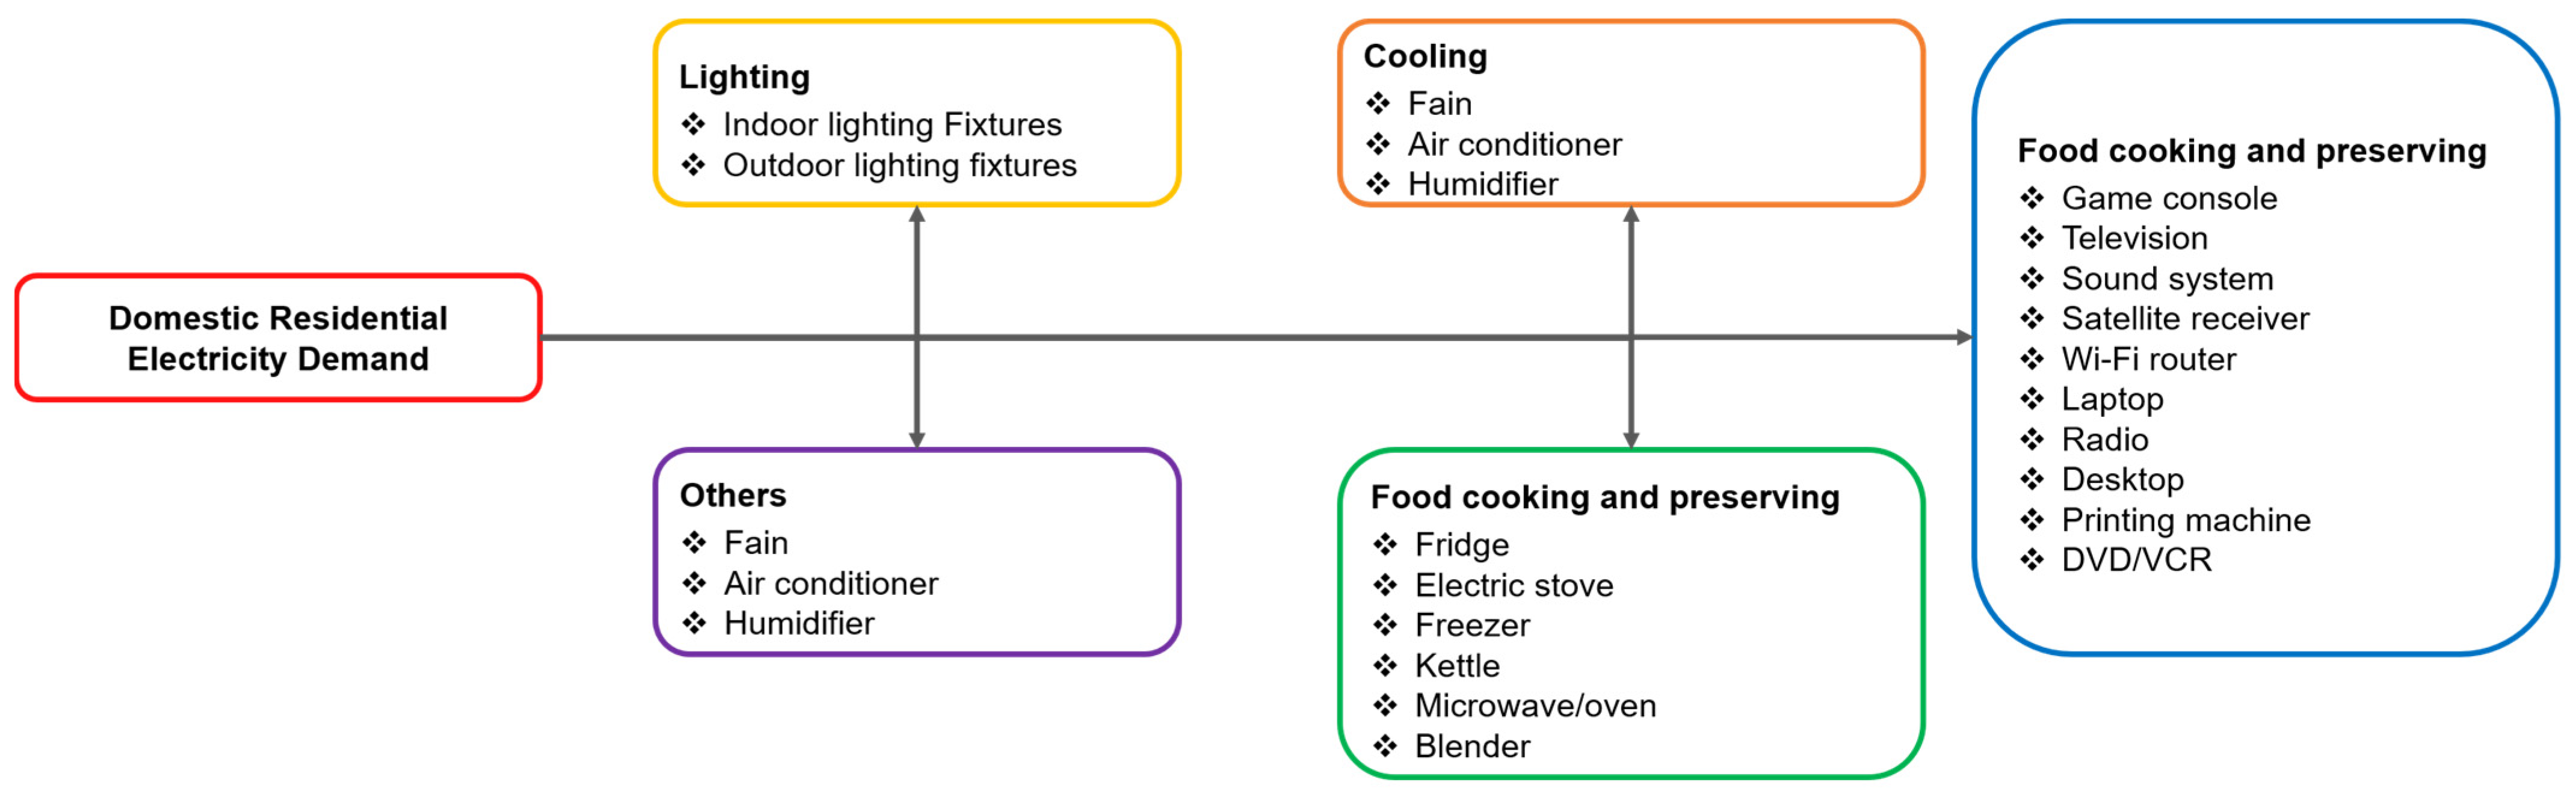
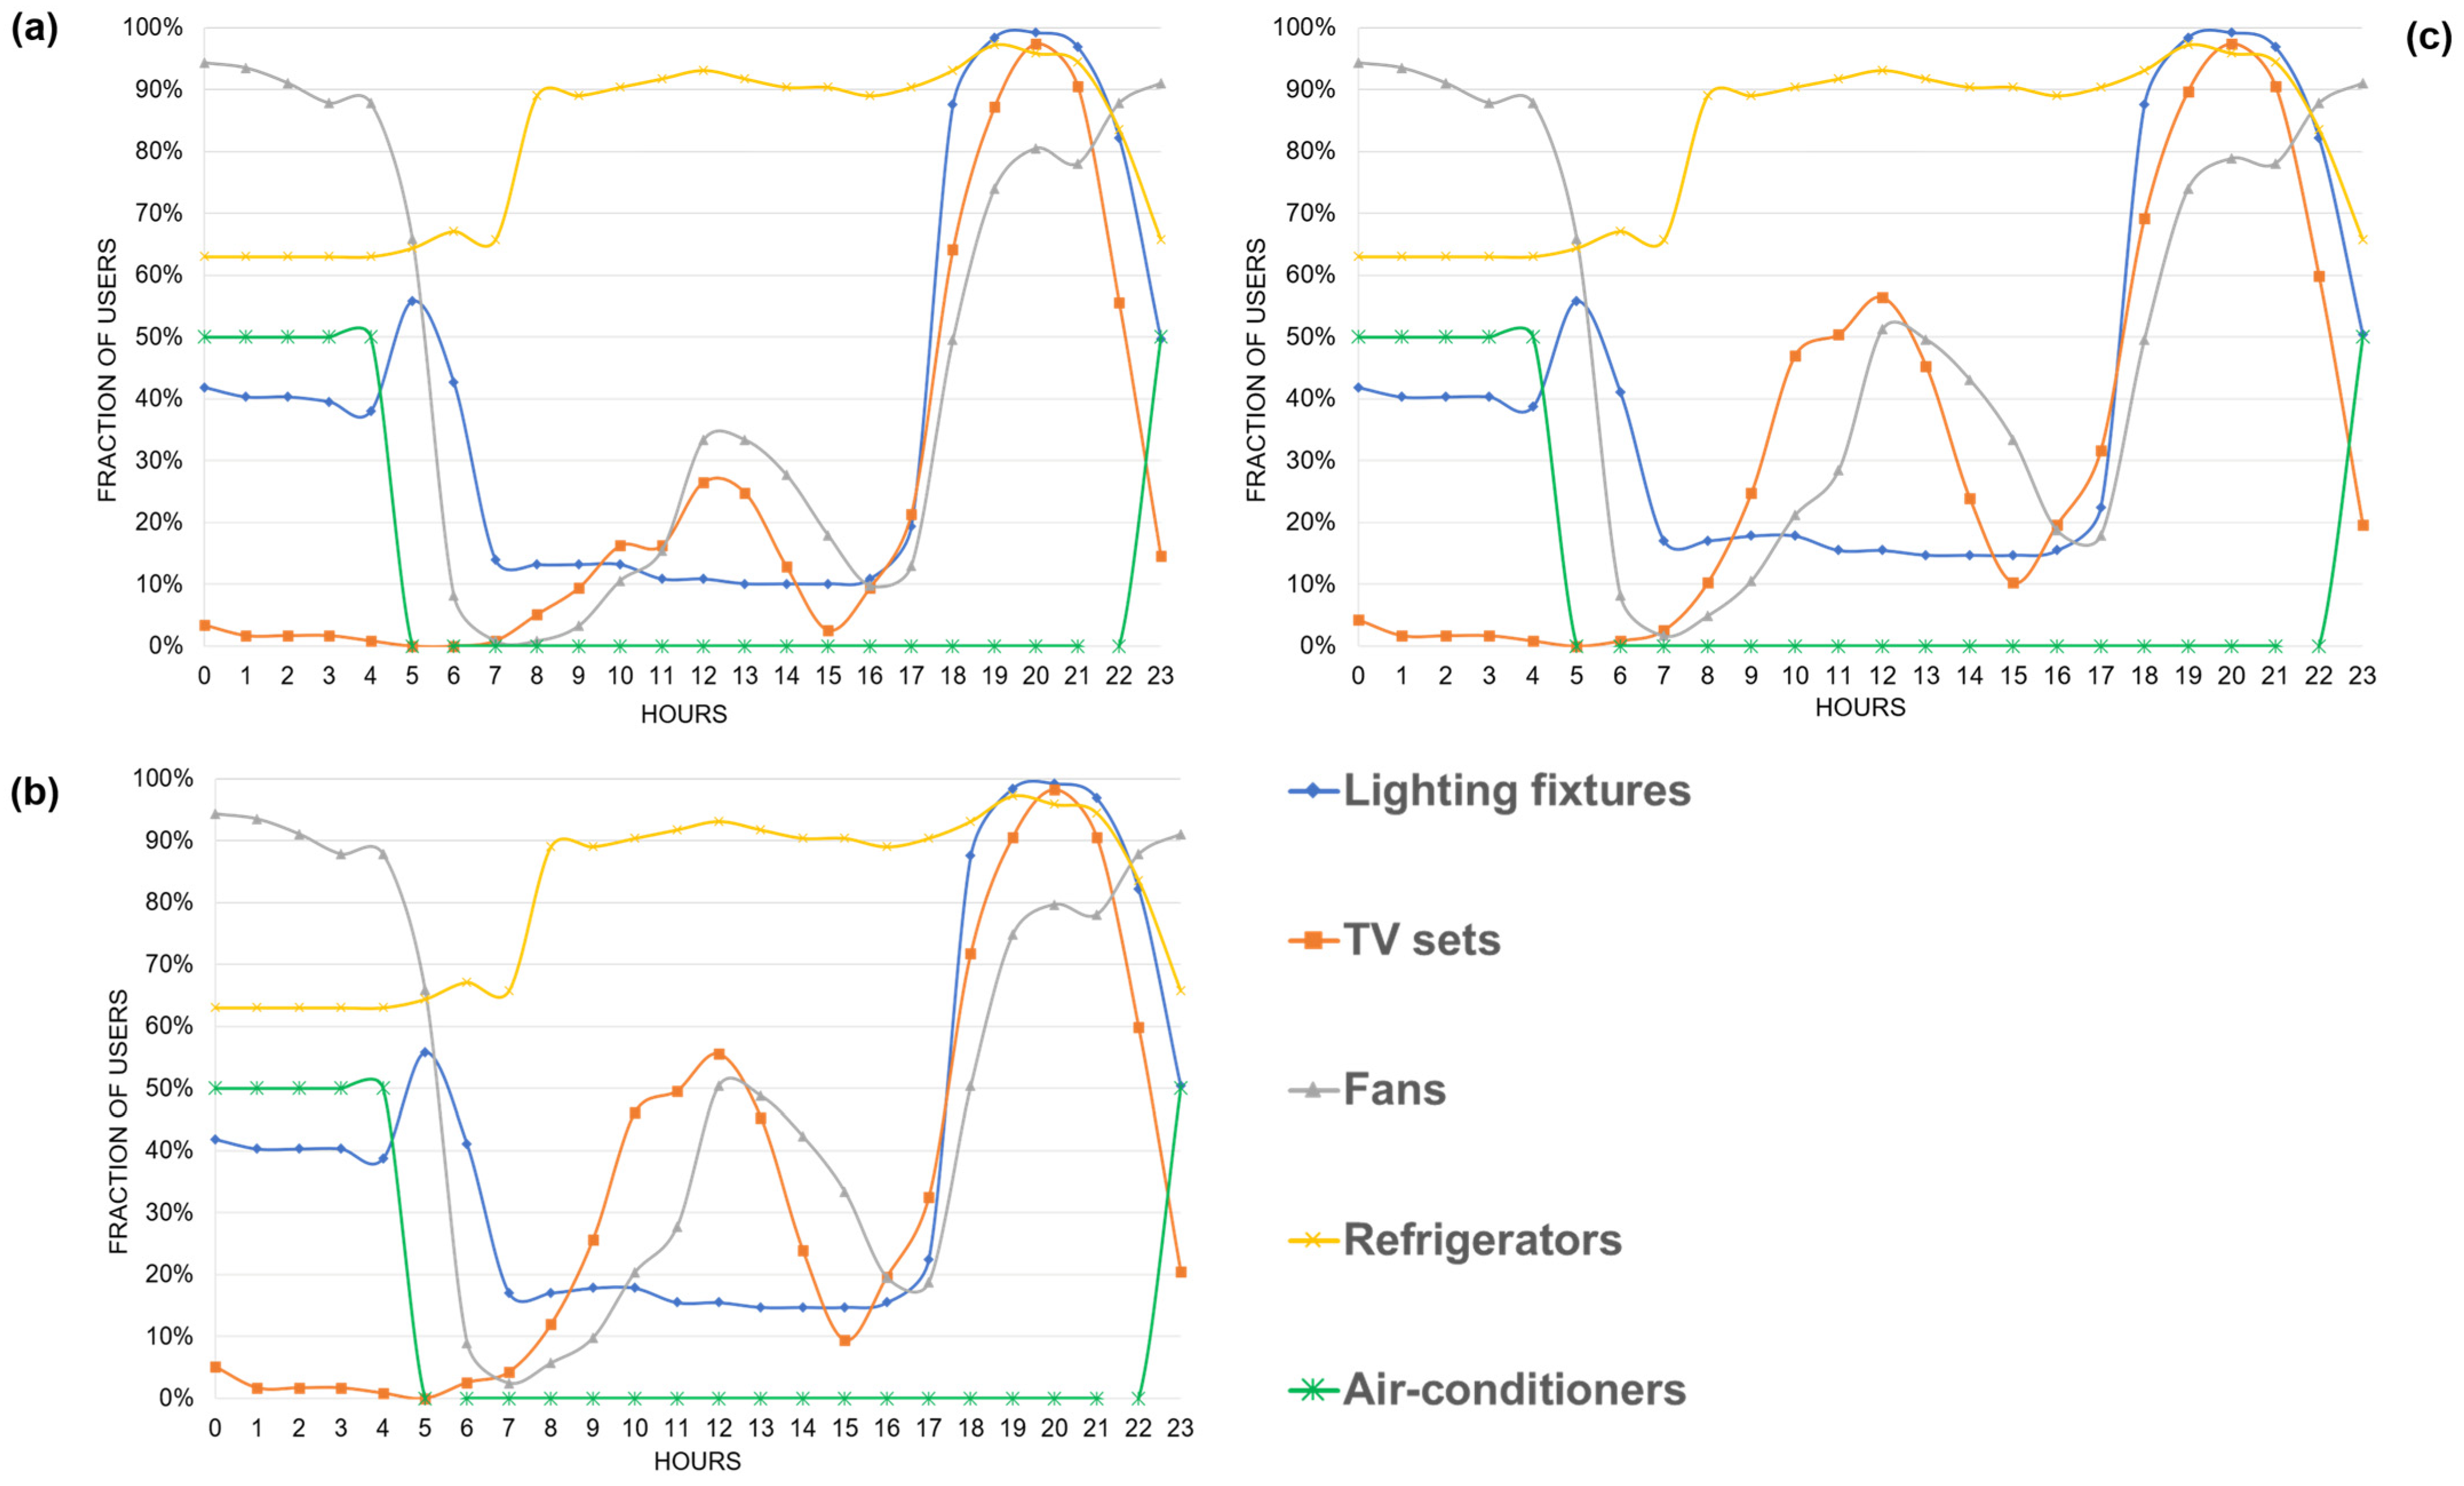
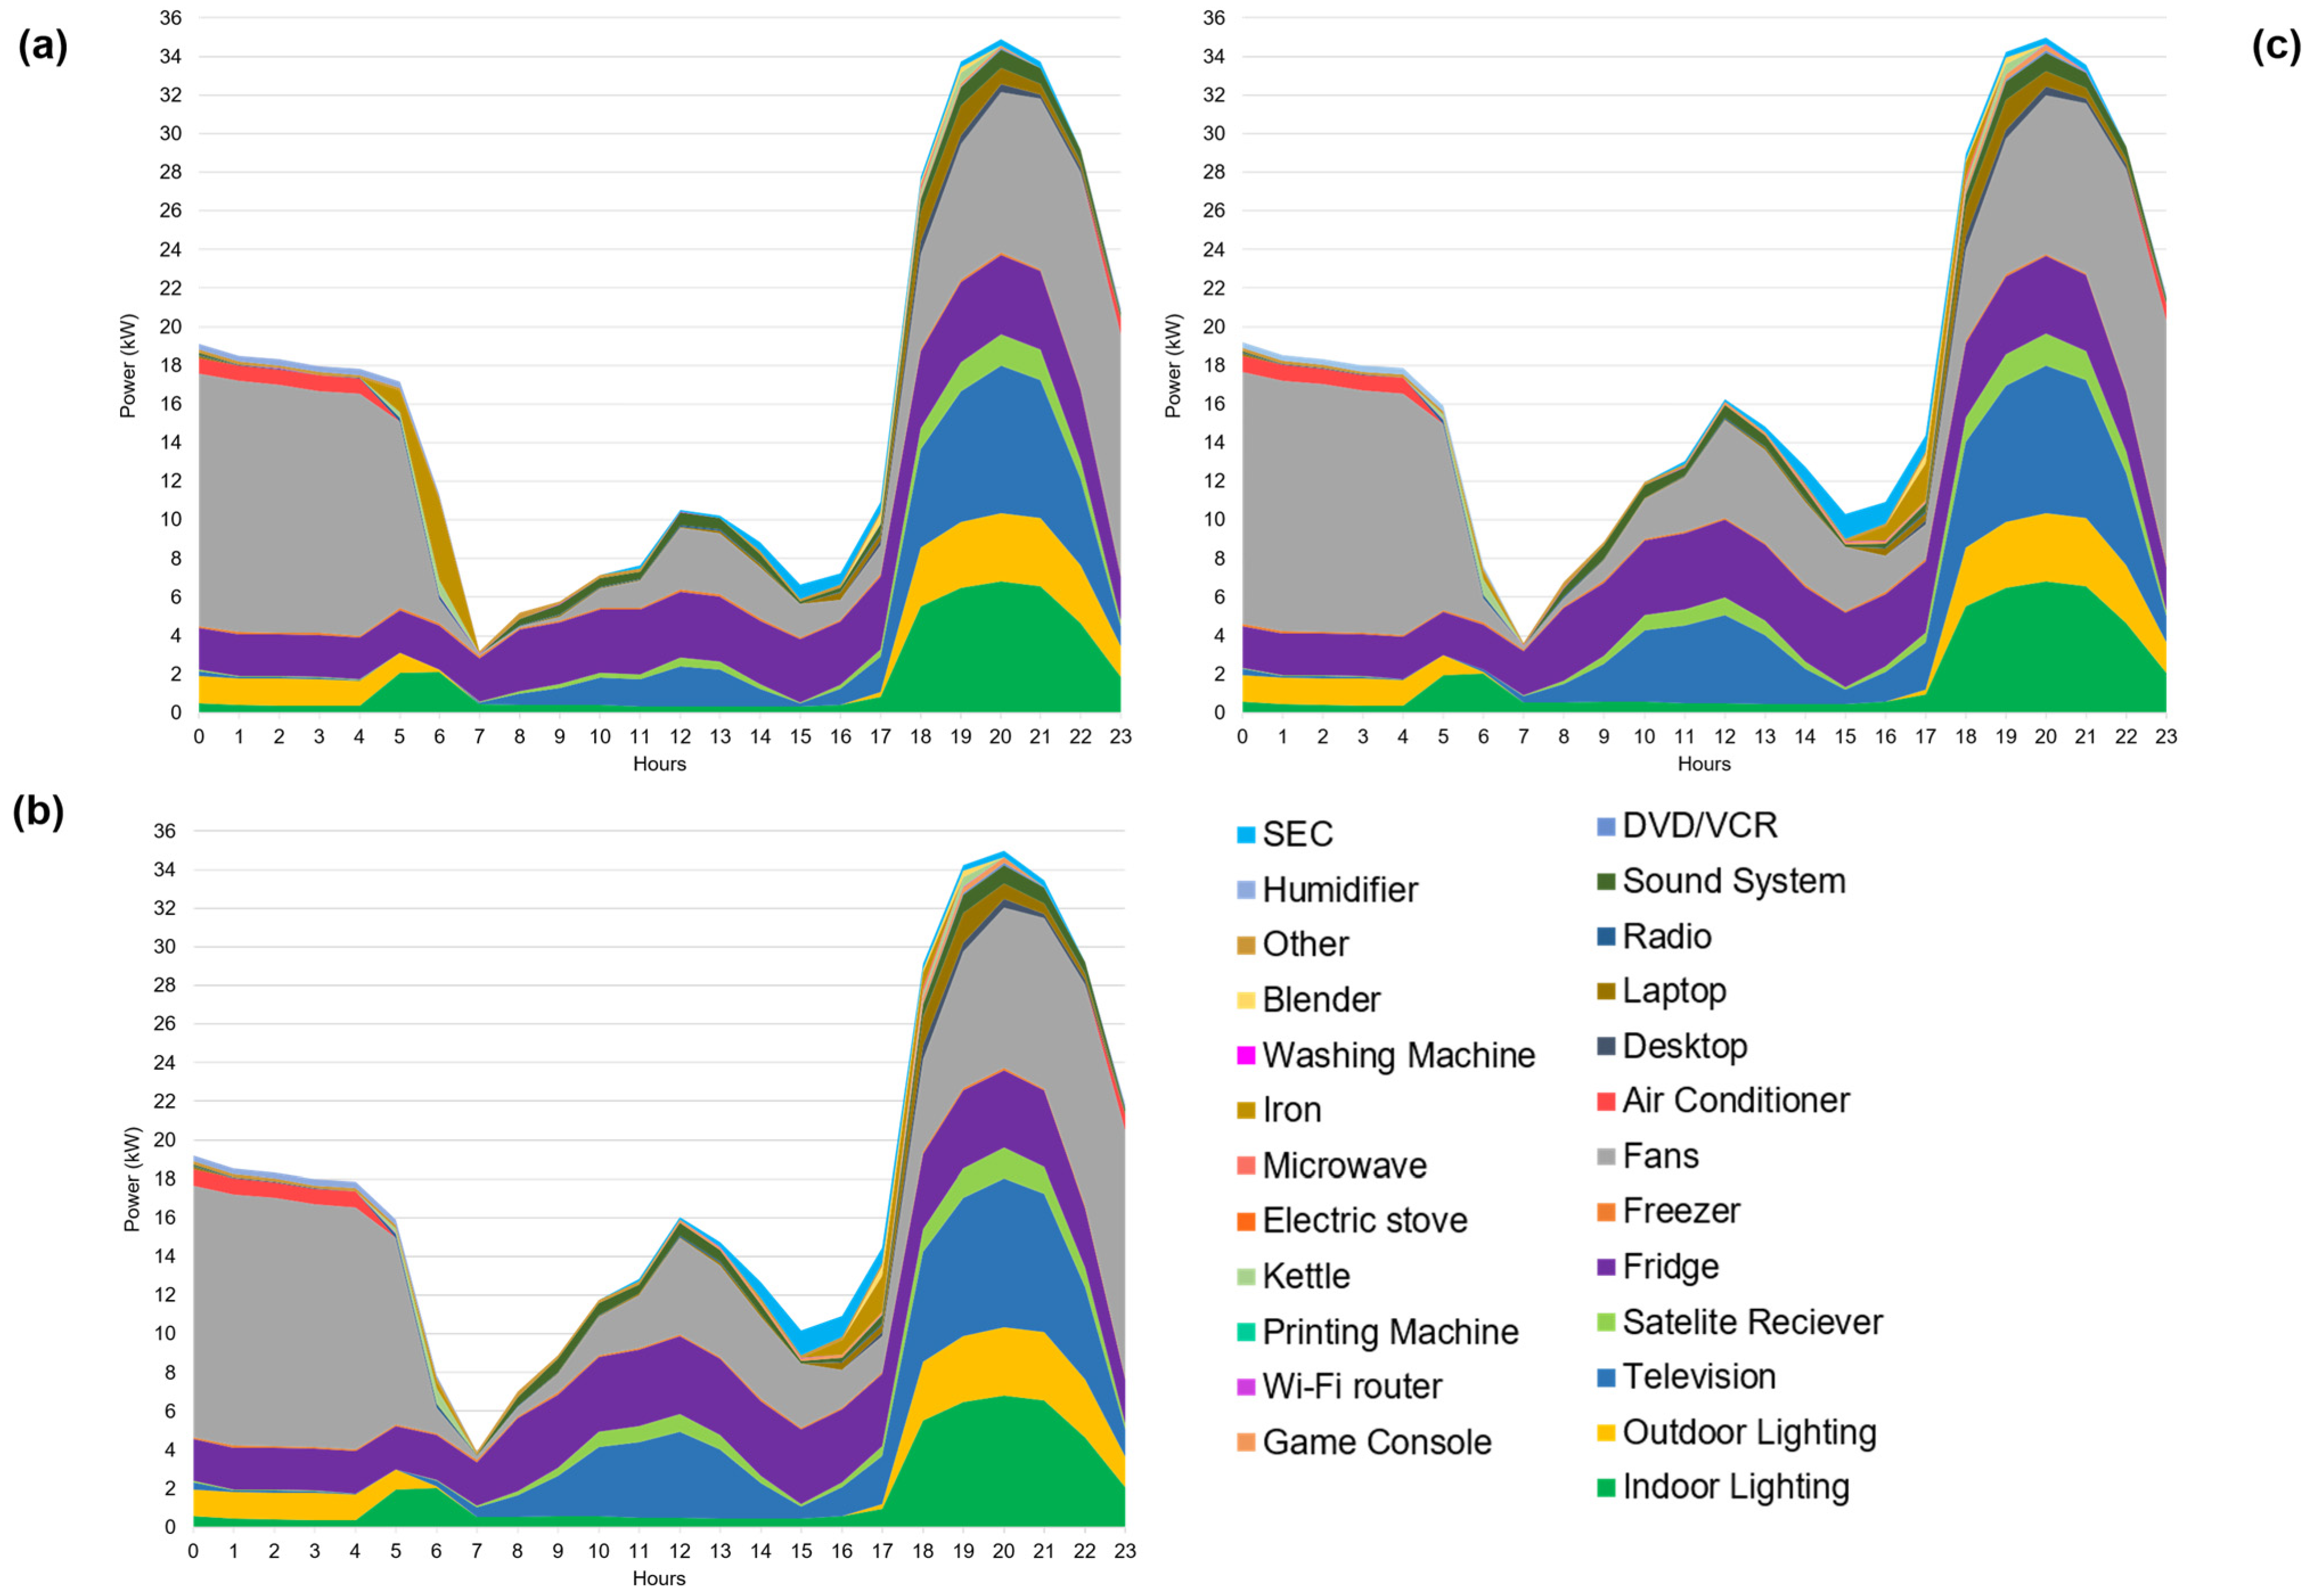
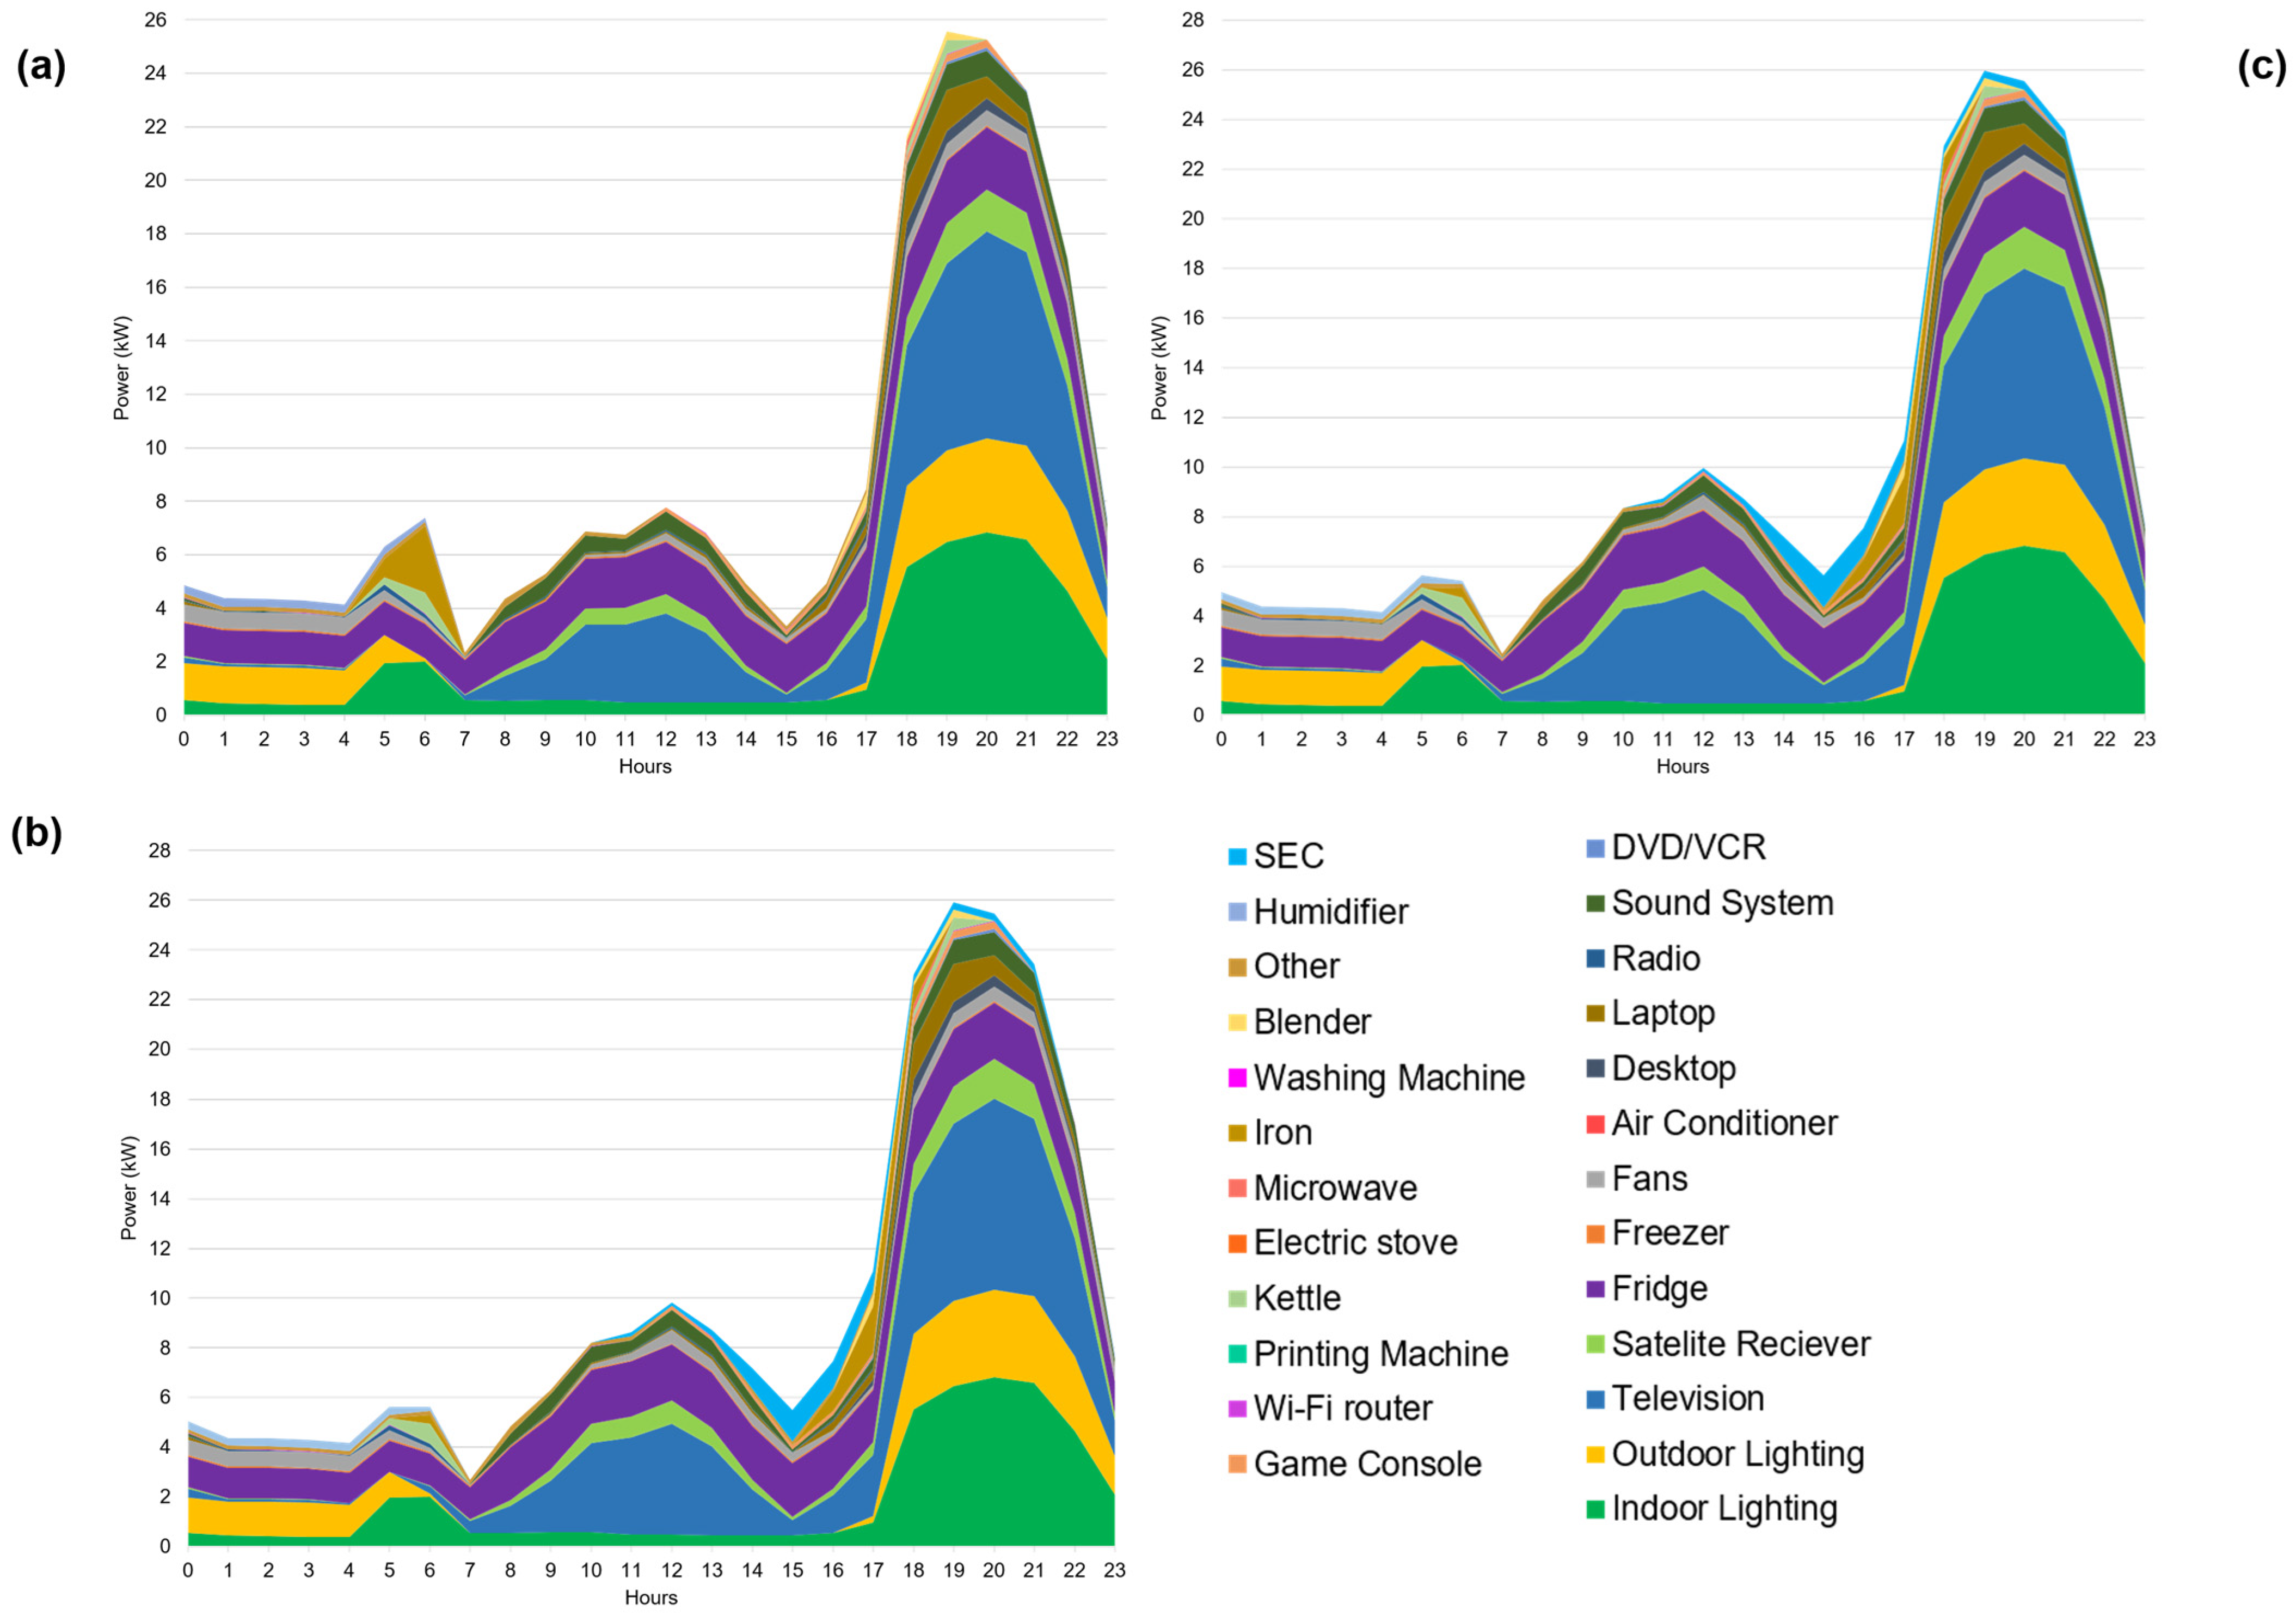

Disclaimer/Publisher’s Note: The statements, opinions and data contained in all publications are solely those of the individual author(s) and contributor(s) and not of MDPI and/or the editor(s). MDPI and/or the editor(s) disclaim responsibility for any injury to people or property resulting from any ideas, methods, instructions or products referred to in the content. |
© 2024 by the authors. Licensee MDPI, Basel, Switzerland. This article is an open access article distributed under the terms and conditions of the Creative Commons Attribution (CC BY) license (https://creativecommons.org/licenses/by/4.0/).