Article

Tracking Biofuel Innovation: A Graph-Based Analysis of Sustainable Aviation Fuel Patents

by
Matheus Noschang de Oliveira
1,*,
Letícia Rezende Mosquéra
2,
Patricia Helena dos Santos Martins
2,
André Luiz Marques Serrano
1,
Guilherme Dantas Bispo
1,
Guilherme Fay Vergara
1,
Gabriela Mayumi Saiki
1,
Clovis Neumann
1 and
Vinícius Pereira Gonçalves
1
1
Department of Electrical Engineering, University of Brasilia, Federal District, Brasilia 70910-900, Brazil
2
Department of Economy, University of Brasilia, Federal District, Brasilia 70910-900, Brazil
*
Author to whom correspondence should be addressed.
Energies 2024, 17(15), 3683; https://doi.org/10.3390/en17153683
Submission received: 28 May 2024 / Revised: 19 June 2024 / Accepted: 7 July 2024 / Published: 26 July 2024
(This article belongs to the Section A4: Bio-Energy)

Abstract

:
The use of biofuels represents a promising means of achieving a sustainable future and offers considerable economic and environmental benefits. Since they are derived from organic sources, such as vegetable oils and animal fats, biofuels can mitigate the effects of greenhouse gas emissions, improve air quality, support local agriculture, create employment opportunities, and enhance energy security by reducing dependence on fossil fuels. However, introducing these alternative fuels to the aviation sector remains a significant challenge. Thus, it is vital to investigate the potential of sustainable aviation fuel (SAF) and discover how to overcome the technological obstacles to its integration into mainstream aviation to attain broader decarbonization objectives. This article seeks to contribute to a discussion about SAF by examining how it has evolved and its connections to related patents. This article is a comprehensive study of biofuel innovation, highlighting the complex relationships between academia, industry, and other stakeholders. It is hoped that the findings from this study will provide a clearer understanding of the catalysts involved in SAF innovation and provide valuable insights for policymakers, academics, and professionals in the field who are committed to shaping the trajectory of sustainable energy technologies in the future.

1. Introduction

The search for new ways to meet energy needs without jeopardizing the future of the planet has become a priority in a world characterized by rapid population growth and technological advances that are increasingly dependent on energy [1]. In this scenario, sustainable energy sources have gained ground in a space previously occupied by conventional sources such as fossil fuels, which has triggered technological development without taking into account its environmental impact [2]. With fewer carbon emissions, sustainable, clean, or green energy has a lower environmental impact. Its main advantage is that it uses sources that are not depleted and can be replenished quickly or reused as byproducts of other economic activities. Sun, wind, water, and residual waste are some of the resources that can be used to create sustainable energy [3,4].
Energy production through sustainable mechanisms causes minor environmental damage because it is based on ecologically aware strategies, materials, and technologies. These alternatives help reduce greenhouse gas emissions and rely less on scarce resources such as oil, which is essential for slowing climate change and preserving natural landscapes [5]. In addition to the benefits of these new energy strategies, there is a growing concern about designing mechanisms that can assist in preserving the environment and make it possible to replace conventional energy with renewable sources.
With the surge in mandatory quotas on renewable energy in different countries, there has been considerable growth in the demand for alternative fuels [6]. According to Chou et al. [7], it should be noted that non-renewable energy sources take millions of years to form, and their reserves are concentrated in certain regions of the world, which means that several countries are forced to import oil and its derivatives. This affects the trade balance, while at the same time exposing political tensions and leading to a notable volatility of prices on the international market [3].
Environmental issues must also be considered: one of the main problems is the burning of oil derivatives, which results in the emission of carbon dioxide (CO2) into the atmosphere, which intensifies the greenhouse effect [8]. The significant emission of anthropogenic CO2 into the atmosphere is also alarming. According to the United Nations (UN) Convention on Climate Change (2023), the worldwide levels of the predominant greenhouse gas, CO2, exceeded those of the pre-industrial period by 50% in 2022. Therefore, a number of nations are poised to encounter occurrences of severe weather patterns, encompassing extreme heat waves, glacial thawing, as well as ocean warmth and acidification [9].
With regard to this, this study aims to examine the main trends in sustainable aviation fuel (SAF). Although no formal definition exists, this fuel is generally defined as a drop-in fuel. For instance, it is identical in molecular structure to fossil kerosene but derived from biomass, waste, or non-food energy crops, which means its carbon footprint is up to 80% lower than similar petroleum products [10]. This drop-in is important to ensure that manufacturers do not have to redesign engines or aircraft and to ensure that fuel suppliers and airports do not have to build new fuel supply systems [11,12] that may be necessary for alternatives such as hydrogen or electrification.
To this extent, this research is innovative in that it attempts to find trends and potential areas of collaboration by means of graph theory. This theory studies combinatorial objects—graphs that are satisfactory models for many problems in several branches of mathematics, computer science, engineering, and industry. A number of graph-based problems have become famous because they are intellectually challenging and have important practical applications.
From a practical perspective, the research used a dataset of patents from the database of the Derwent Innovations Index, which provides a comprehensive view of innovation in SAF and offers detailed information about the factors shaping the future of sustainable energy technologies. In this way, this research seeks to reveal the links within the innovation ecosystem and to give rise to a broader conversation about biofuel research and development to offer guidance to navigate and influence the future of sustainable energy.
This paper is structured as follows: Section 2 reviews the relevant literature on graph theory and SAF technologies. Following this, Section 3 outlines the materials and methodology employed in this study. Section 4 analyzes SAF innovation dynamics with the aid of graphs, and, finally, Section 5 concludes the paper by summarizing the key findings and discussing their implications for future research.

2. Literature Review

The operational and safety requirements of the airline sector greatly restrict its fuel options: in the short and medium term, there is no viable technology for using electricity in aviation, and gaseous fuels have low energy density and storage difficulties [13]. The papers’ researchers have discussed that, in turn, fuels such as ethanol and biodiesel, which are the most used in the automotive sector, have chemical and physical–chemical characteristics that represent serious problems in aviation. For example, the molecules of biodiesel and ethanol contain oxygen, which reduces the heat of combustion and increases the risks related to acid corrosion and microbial contamination (due to hygroscopicity). Furthermore, in the particular case of biodiesel, the relatively long lengths of their carbon chains (compared to the average length of the aviation kerosene chains) give rise to intense intermolecular interactions, which results in cold properties unsuitable for aviation given the very low temperatures to which fuels are exposed at high altitudes. Finally, the presence of double bonds decreases the stability of biodiesel against oxidation and increases its susceptibility to the formation of gums, which is unacceptable in aviation. Thus, the aviation sector still depends on technological advances for more sustainable alternatives. The following section provides an overview of advances in graph theory relating to patent analysis, biofuels, and sustainable aviation fuel (SAF) development, as well as promoting the sustainable production of alternative raw materials and methods, aiming to guide the discussion on possibilities for the future.

2.1. Advances in Visualizing and Understanding Graphs and Complex Patent Networks

Graph theory began in 1736 when Leonhard Euler encountered the Konigsberg bridge problem [14]. Konigsberg was a city in former Prussia in the 18th century, now called Kaliningrad (Russia), where there were two islands that, together with the mainland, were connected by seven bridges. In the city, there was a discussion about crossing all the bridges without repeating them. However, Euler, in 1736, showed the solution to this problem using simple reasoning: he transformed the bridge paths into straight lines and their intersections into points, possibly creating the first historical graph [14]. From this, Euler realized that it would only be possible to cross the entire path by passing each bridge once if there were at most two points from which an odd number of paths were left. This idea was based on the fact that, at each point, there should be an even number of paths representing the arrival and departure. The two points with odd paths would refer to the beginning and end of the route, as they would not need a path to arrive and a path to leave, respectively.
From 1970 onward, graph theory had a great leap with the accelerated development of computers, which, after the Second World War, reached their peak with the creation of the first microcomputer software created by students William (Bill) Gates and Paul Allen, which was an adaptation of BASIC for the ALTAIR personal computer designed in 1975 [15]. Years later, Gates and Allen founded Microsoft, one of the most successful companies in the world. Then, publications referring to graph algorithms appeared, thus opening up possibilities for applying graph theory.
From the aforementioned application, it can be established that a graph G = G(V,E) can be defined as a structure where V is a discrete, ordered set of points called vertices, E is a set of lines called edges, and each edge is connected to at least two vertices. Graph representation can facilitate understanding and problem-solving by allowing lines to connect points [16]. In this way, maps that represent the organizational structure of a company, routes of transport, communication networks, product distribution, and the chemical structure of molecules can be expressed through graphs. In general, the study of graphs has been growing in recent decades due to the advancement in new computational technologies, which allow for the resolution of problems via algorithms with greater efficiency, speed, and confidence [17]. Thus, the growing applicability of this theory is a positive factor for social development. One of the practical models that deserves to be highlighted is the problem known as coloring, which can be used in situations that require the selection of elements into independent sets with common characteristics.
In this way, graph theory has proven to be effective in examining and analyzing complex systems, and thus, it has naturally become a highly nuanced topic in the field of patents. Such studies prove that scientific research combining graph theory and patents has progressed, allowing for the viewing of different aspects of patent analysis and visualization from a new perspective. The contribution was made by Gross and Yellen [18], who provide a purely informative recap of graph theory and its multi-field uses.
Ma et al. [19] provide a graph-theoretic method for visualization and automated patent analysis in their research. Their experimental work was formulated to test two hypotheses—market covering and competitive threat—using import network and competitive import network as proxies. In addition, the authors incorporated endogenous network structure statistics, node attributes, and external relational network covariates into the models to explain the ever-increasing number of foreign patents worldwide.
Yang et al. [20] report a network analysis to provide several insights concerning the structure and evolution of international technology diffusion. Furthermore, the demonstration of network analysis effectiveness in delineating clusters of nations that facilitate, moderate, or assimilate patented innovations illustrates the countries responsible for transitions at the cluster level in these networks. Accordingly, by an extensive literature review, they point out broad applications of graph theory, addressing problems like patent citation cases, connectivity mapping of technology, and innovation dynamics [21].
Moreover, graph clustering algorithms have been observed in creating patent networks, providing a more profound insight into the connections between patents and companies, thereby enhancing the decision-making processes within various organizations [22]. Additionally, graph embedding techniques have been applied to comprehend the competitive dynamics between firms using patent networks, surpassing traditional topic modeling methods and effectively grouping organizations based on implicit competitive relationships [23]. Furthermore, there have been proposals for graph representation strategies to automatically extract semantic data from patents, offering semantic assistance for intelligent patent analysis by identifying frequent subgraph patterns and developing text classifiers [24].
The application of graph theory to large-scale patent datasets presents several challenges. The first is the complexity of understanding patents due to their technical nature, making it difficult to extract relevant information efficiently [25,26]. Additionally, the rapid growth of patent documents, characterized by the 3 V aspects of big data (volume, variety, and velocity), further complicates the analysis process [27]. Moreover, existing approaches like text mining and keyword analysis for patent similarity calculations have limitations, as they rely heavily on word choice and writing styles, potentially leading to inaccuracies in measuring patent relatedness [28].
Hence, visualization techniques play a crucial role in enhancing the comprehension of patent networks by providing a clear and insightful representation of the relationships between patents and technologies. Using data mining and deep learning approaches, researchers can construct large patent networks exhibiting the intricate connections between patents [22]. These visual analytics methods enable the visualization of patent portfolio strategies, aiding in identifying similar technologies and the protection of intellectual property rights [29].
Accordingly, interactive visualizations are crucial for enhancing the understanding and utilization of patent networks. By employing deep learning approaches to construct graph models representing relationships between patents [22], interactive visualization enables decision-makers to gain precise insights into technological areas and companies, aiding in improved managerial processes within organizations.
Additionally, the application of network mapping and filtering techniques helps remove weak links within the patent network map, thus improving the explanatory power of the network on inventor and organization diversification paths [30]. Furthermore, network representations allow for comparing molecules from patents with other bioactive compounds, facilitating the exploration of structure–activity relationships and enhancing the understanding of patent information within the broader bioactive chemical space [31].
All of these works exemplify graph theory in its fundamental form within the studies of patents. Therefore, this concept was subsequently applied to facilitate the extraction of valuable insights, thus enhancing intellectual property analytics. Consequently, overcoming the challenges requires innovative methods, like graph-based patent search engines and novel similarity measures that leverage direct and indirect co-citation links between patents [32].
Moreover, many network properties describe how nodes are connected to one another and the network as a whole. For instance, centrality represents a fundamental principle in network analysis. It is a metric that quantifies a node’s centrality within the network structure. This metric is a proxy for assessing a node’s significance within the network framework. Below is a Table 1. comparing different studies and limitations.
This metric began to be investigated during the 1950s and 1960s with several experiments, starting with those carried out under the direction of [33,34], who identified considerable differences in the character of group problem-solving activities between different communication structures. Of particular importance was the relationship between the centrality of an agent and its influence on the group. Leavitt [33], for example, demonstrated through different types of communication structures that the differences in influence between the most central and the least central agent increased with the increasing hierarchy of structures.
Freeman [35] developed a measure of network centralization based on the difference between the centrality of the most central unit and that of the other units. The rapid development of network analysis in recent years has led to the resurgence of experimental and non-experimental research into the relationship between the centrality and power of social agents.
Nevertheless, what constitutes centrality is subject to variation contingent upon the specific application and perspective being considered. Consequently, there exists a multitude of methodologies for quantifying the centrality of a node. Within the scope of this discourse, four distinct categories of centrality are examined: degree centrality, closeness centrality, betweenness centrality, and cross-clique centrality [36]. In this article, we focus only on the use of degree centrality, since it is a metric that only considers the number of edges in each node and, thus, provides us with useful information on how important an IPC is in the production chain. The other measures of centrality have shown no insightful information for the acyclic, undirected graph that was built.

Degree Centrality

Secondly, degree centrality is measured based on the degrees in a graph. It can be summarized by the number of neighbors a vertex has, which is important [37]. According to Freeman’s general formula to compute degree centralization [36], degree centrality C D ( G ) in an undirected graph is given by:
C D ( G ) = v G | deg ( v * ) deg ( v ) | | H | ,
where:
  • C D ( G ) is the degree centrality,
  • deg ( v ) is the degree of node v,
  • v* is the vertex with the highest degree,
  • H = ( | V | 1 ) ( | V | 2 ) .
If the network is spread out, then there should be low centralization. If the centralization is high, vertices with large degrees should dominate the graph.

2.2. A Synthesis of Feedstocks and Production Pathways

Global conditions are changing rapidly due to three of humanity’s greatest concerns of this century: the environment, the energy supply, and the global economy. Although they may seem quite distinct initially, these three areas are completely interconnected. The first two have been among the concerns of ordinary citizens for a longer time due to the greenhouse effect and global warming caused by the use of fossil fuels. As for the economy, only time will tell what permanent effects macroeconomic movements will have on the energy sector and, even more difficult to predict, on the environment. The only certainty is that these three sectors will be permanently affected by the use of fossil fuels.
Considering humanity’s concerns in the current century, the necessity of increasing the use of biofuels in a sustainable future offers significant economic and environmental benefits. Biofuels, such as biodiesel derived from organic sources like vegetable oils and animal fats [38], have the potential to reduce greenhouse gas emissions, improve air quality, promote local agriculture, create job opportunities, and enhance energy security by decreasing reliance on fossil fuels [39].
Policy measures are crucial for maximizing these benefits through incentivizing biofuel production, ensuring consistent quality standards, and promoting international biofuel trade to enhance economic welfare [40]. Collaboration between industry and policymakers is essential to optimize biofuel production processes, explore alternative feedstocks, and address challenges like land use competition with food production, ultimately contributing to a more sustainable energy landscape [41]. Consequently, by aligning policies with industry efforts, biofuels can play an important role in a greener future while fostering economic growth and environmental preservation.
As climate change concerns intensify, there is a greater push for alternative energy sources and ways to mitigate human-made greenhouse gas (GHG) emissions. Amidst all economic sectors, aviation is perhaps one of the most challenging industries to make more environmentally friendly due to numerous technological, economic, and political constraints. Today, it is possible to divide alternative aviation fuels (AAFs) into drop-in fuels, usually what the SAF abbreviation refers to, and alternative propulsion methods like hydrogen or electric propulsion [10].
According to Cabrera and Sousa [10], the second group, although promising, is not as viable as drop-in fuels, as it depends on structural changes in airplanes and more investments in research and development. Technologies based on hydrogen, particularly power-to-liquid processes, rely on advancements in green hydrogen production to close the cost gap with fossil sources, while battery power still requires significant research and development funding due to its current lack of technological readiness for commercialization. Without revolutionary breakthroughs, hydrogen- and battery-powered aircraft may have limited scope, primarily suitable for short-range flights. Once technological barriers are overcome, these two pathways are expected to play a vital role in decarbonization.
The drop-in fuels (referred to as SAF from now on) have a more optimistic scope of applicability since it is possible to blend them with traditional jet kerosene and since they are compatible with current aircraft engines and airport infrastructure [42]. The first flight test using SAF was performed in 2008 [10] and, currently, only seven SAF production conversion processes and technology platforms have been approved under ASTM D7566 for commercial use, which is shown in Table 2. Another one was approved under ASTM D1655, a shorter pathway that allows only a smaller percentage of blending.
As shown in Table 2, there are seven methods approved under ASTM D7566 for producing SAF, using a wide combination of feedstocks. Each of the production methods involves specific processes to convert these feedstocks into jet fuel. For instance, FT-SPK uses gasification and Fischer–Tropsch synthesis, while HEFA-SPK relies on the hydroprocessing of triglycerides. HFS-SIP employs microbial conversion, and ATJ-SPK involves a series of chemical reactions like dehydration and hydrogenation. The table also notes the year of approval for each pathway, ranging from 2009 for FT-SPK to 2020 for the latest methods, such as CH-SK and HC-HEFA-SPK. This highlights the evolution and diversification of SAF production technologies over the past decade, indicating a growing emphasis on utilizing various feedstocks and advanced chemical processes to create sustainable jet fuels.
Although the use of SAF has grown, alternative fuels account for less than 0.1% of jet fuel consumption and cost up to twice as much as its traditional pathways [44]. There are many barriers to the broader use and development of these technologies, such as economic viability, development difficulties, and legal and bureaucratic issues. To certify a new aviation fuel for commercial use, the contender must endure a three-phase, four-tiered testing process, conducted by the American Society of Testing and Materials (ASTM), which costs at least USD 5 million and takes 3 to 5 years to complete [10].
The meticulousness of the process is a necessary measure to ensure safety, but it discourages new assets in the field, which can only be encouraged by government measures such as tax subsidies or direct investment programs. Certain institutions follow a pathway of setting goals for the blending of sustainable fuels with conventional ones, but records show that it is more effective to impose a blending mandate than a voluntary approach.
Other alternatives to mandates are policy instruments based on GHG intensity reduction targets, e.g., carbon taxing and carbon marketing [42].
Considering mechanisms for production, we consider that biofuels are a type of fuel produced with biomass, an organic, non-fossil raw material [45]. SAF, ethanol, biodiesel, and biogas are examples of biofuels, which are produced with crops such as sugar cane, soybeans, corn, animal fat, and gases from the decomposition of organic materials, such as methane [46]. In this way, biofuels are made from organic and renewable raw materials, meaning they are recycled and not finite, in addition to there being a wide variety of materials that can be used in the manufacture of these fuels [47]. This is, therefore, one of its main advantages.
Linked to the renewable aspect of biofuels is the fact that they emit fewer polluting gases into the atmosphere when used to generate energy, which makes them an important alternative source to fossil fuels derived from, for example, petroleum, which generates gaseous waste that contributes to the degradation of air quality in the short and medium term and to the greenhouse effect, which in the long term worsens global warming and causes climate change [48]. Another advantage for the end consumer is its production cost, which is lower than fuels such as gasoline and diesel.
Like other types of energy-generating sources, biofuels have their disadvantages. Although their burning produces fewer greenhouse gases than fossil fuels, the biofuel production process, which generally takes place in plants or industries, is responsible for releasing polluting waste into the air and water, as is the case with vinasse derived from the distillation of sugar cane, which makes it disadvantageous [49]. In relation to the biofuel production process, some of them, such as ethanol, require very large amounts of water, one of the reasons why plants are installed close to rivers or dams [50]. In the case of fuels derived from vegetables such as sugar cane, corn, and soybeans, for example, there is the formation of monocultures specialized in these crops, which can lead to the deforestation of large areas to replace the natural cover with crops, as well as other structural problems, such as land concentration [51].
Apart from technology, another important aspect to examine when considering SAF production is the ability to scale feedstock production to meet predictions. The primary challenge is maintaining sustainability and avoiding using land designated for food farming. Despite this, SAF feedstock offers several advantages over crude oil, including sustainability, carbon dioxide recycling, renewability, eco-friendly technology, and reduced dependence on petroleum-supplying countries [52].
As of today, the main alternatives to producing biofuels for jets are non-food energy crops (such as Camelina, halophytes, and Jatropha), algae, municipal and sewage wastes, waste wood, forest residues, and fats, greases, and oils (FGOs) [52]. Some of these options have other positive side effects that can make implementing them more advantageous. Halophytes, for example, can help revert desertification, as they take the salt out of the land when growing [10]. The employment of waste, especially municipal solid waste (MSW), to produce fuel also addresses environmental concerns associated with landfill decomposition and contamination of soil and water bodies. Despite these benefits, the availability of MSW as an SAF feedstock remains a potential limitation, possibly falling short of meeting market demands [42]. Algae plants are another profitable opportunity since they reproduce very fast and can help clean polluted water, but the management and lipid extraction of these plants are still a challenge in scalability [52].
The potential of SAF to reduce GHG emissions varies greatly (between 20–95% when compared to traditional petroleum jet fuel) [42]. Using vegetable oil as feedstock, for example, is not the most efficient way to decrease GHG emissions due to indirect land use change (ILUC) emissions stemming from increased land conversion for jet fuel production, which competes with the food sector and road biofuel applications [42]. Apart from the feedstock, technology is an important part of GHG emissions. Forest residues have the lowest GHG emissions when used in Fischer–Tropsch (FT) synthesis but the highest when used in the alcohol-to-jet pathway [42,53].
Currently, the HEFA route is the one that has shown better results and has been responsible for the absolute majority of sustainable fuel production hydrocarbons. The main advantage of the route is the existing domain over the technology involved. On the other hand, lipid precursors’ cost, availability, and sustainability represent a major challenge. Furthermore, biofuels produced by the HEFA route are formed by linear alkanes with a boiling point in the diesel range. In this way, if the objective is employment in aviation, additional hydroprocessing is needed to adjust properties. This means that the production cost of HEFA-SPK is currently around three to six times that of conventional aviation kerosene.
From an economic perspective, comparing different routes for producing SAF reveals varying figures for the minimum fuel selling price (MFSP). The average MFSP of the HEFA route is the lowest, at a medium of USD 1.25 per liter. The low prices are justified since HEFA has the greatest production yield, exceeding 1000 liters per ton of dry feed, and relatively lower capital costs, approximately USD 0.34 per liter. The FT and ATJ routes exhibit similar average MFSPs at USD 1.98 and USD 1.86 per liter. The highest average MFSP is observed in the hydroprocessing of fermented sugars (HFS) route, with a range starting at USD 4.56 per liter [42].
Notably, the choice of feedstock and technology significantly influences the MFSP. For instance, using palm fatty acid distillate as feedstock in HEFA provides an estimated MFSP of USD 1.07, while Pongamia is estimated at USD 5.02 per liter. Employing energy crops in FT synthesis leads to a higher MFSP of USD 2.15 per liter compared to utilizing municipal solid waste (MSW) or forest residues, which yield USD 1.53 and USD 0.92 per liter, respectively. In the case of ATJ, energy crops result in the highest MFSP at USD 2.77 per liter, surpassing the costs associated with sugarcane, agricultural residues, and corn grains, which stand at USD 1.86, USD 2.71, and USD 1.86 per liter, respectively [42].
Additionally, the gasification-FT route requires substantial investment, where capital costs contribute 50–75% to total production costs, unlike the ATJ route, which ranges from 20–50%. However, despite its higher capital intensity, the gasification-FT route benefits from lower feedstock costs, accounting for 10–35% of total production costs, compared to 15–60% in the ATJ route [42].
Hence, based on the factors described above, HEFA stands out as the most advanced commercially available fuel production path, as the others still need further refinement, particularly to drive down production costs. Nevertheless, the FT-SPK process is rapidly advancing. It presents notable advantages, such as more feedstock flexibility and the ability to utilize a wide array of sources, such as agricultural waste or MSW, while delivering significant reductions in greenhouse gas emissions.
Accordingly, biofuels hold the potential to create new markets and opportunities; therefore, the integration of SAF encounters significant hurdles, both economically and within regulatory frameworks. Economically, the production of SAF competes for crucial resources such as land and clean energy, thereby impeding its widespread utilization [54]. Regulatory obstacles encompass the need to blend mandates and consider electricity costs in SAF production facilities [55,56].
To surmount these impediments, policymakers can implement supportive measures such as mandatory quotas for SAF utilization and financial incentives directed towards SAF production [56]. Furthermore, fostering research into alternative pathways for SAF production and addressing concerns regarding SAF’s impact on ice formation in aircraft fuel systems can bolster safety and efficiency, thus promoting greater acceptance of SAF within the aviation sector [57]. The broader adoption of SAF within aviation can be facilitated through targeted policies and technological advancements to mitigate economic and regulatory challenges.
The United States stands out as a leader in the development of sustainable aviation fuel (SAF) technologies [58,59,60]. Patent data reveals that the U.S. air transport industry has obtained many technological patents for climate change mitigation, particularly inefficient propulsion technologies [61]. Regarding policy and initiatives, the U.S. has federal rules defining greenhouse gas emission reduction standards for airplanes. It relies on federal, state, and regional voluntary programs for SAF adoption [62]. Additionally, states like California, Oregon, and Washington have implemented programs allowing SAF producers to participate, further highlighting the U.S.’s commitment to advancing SAF technologies.

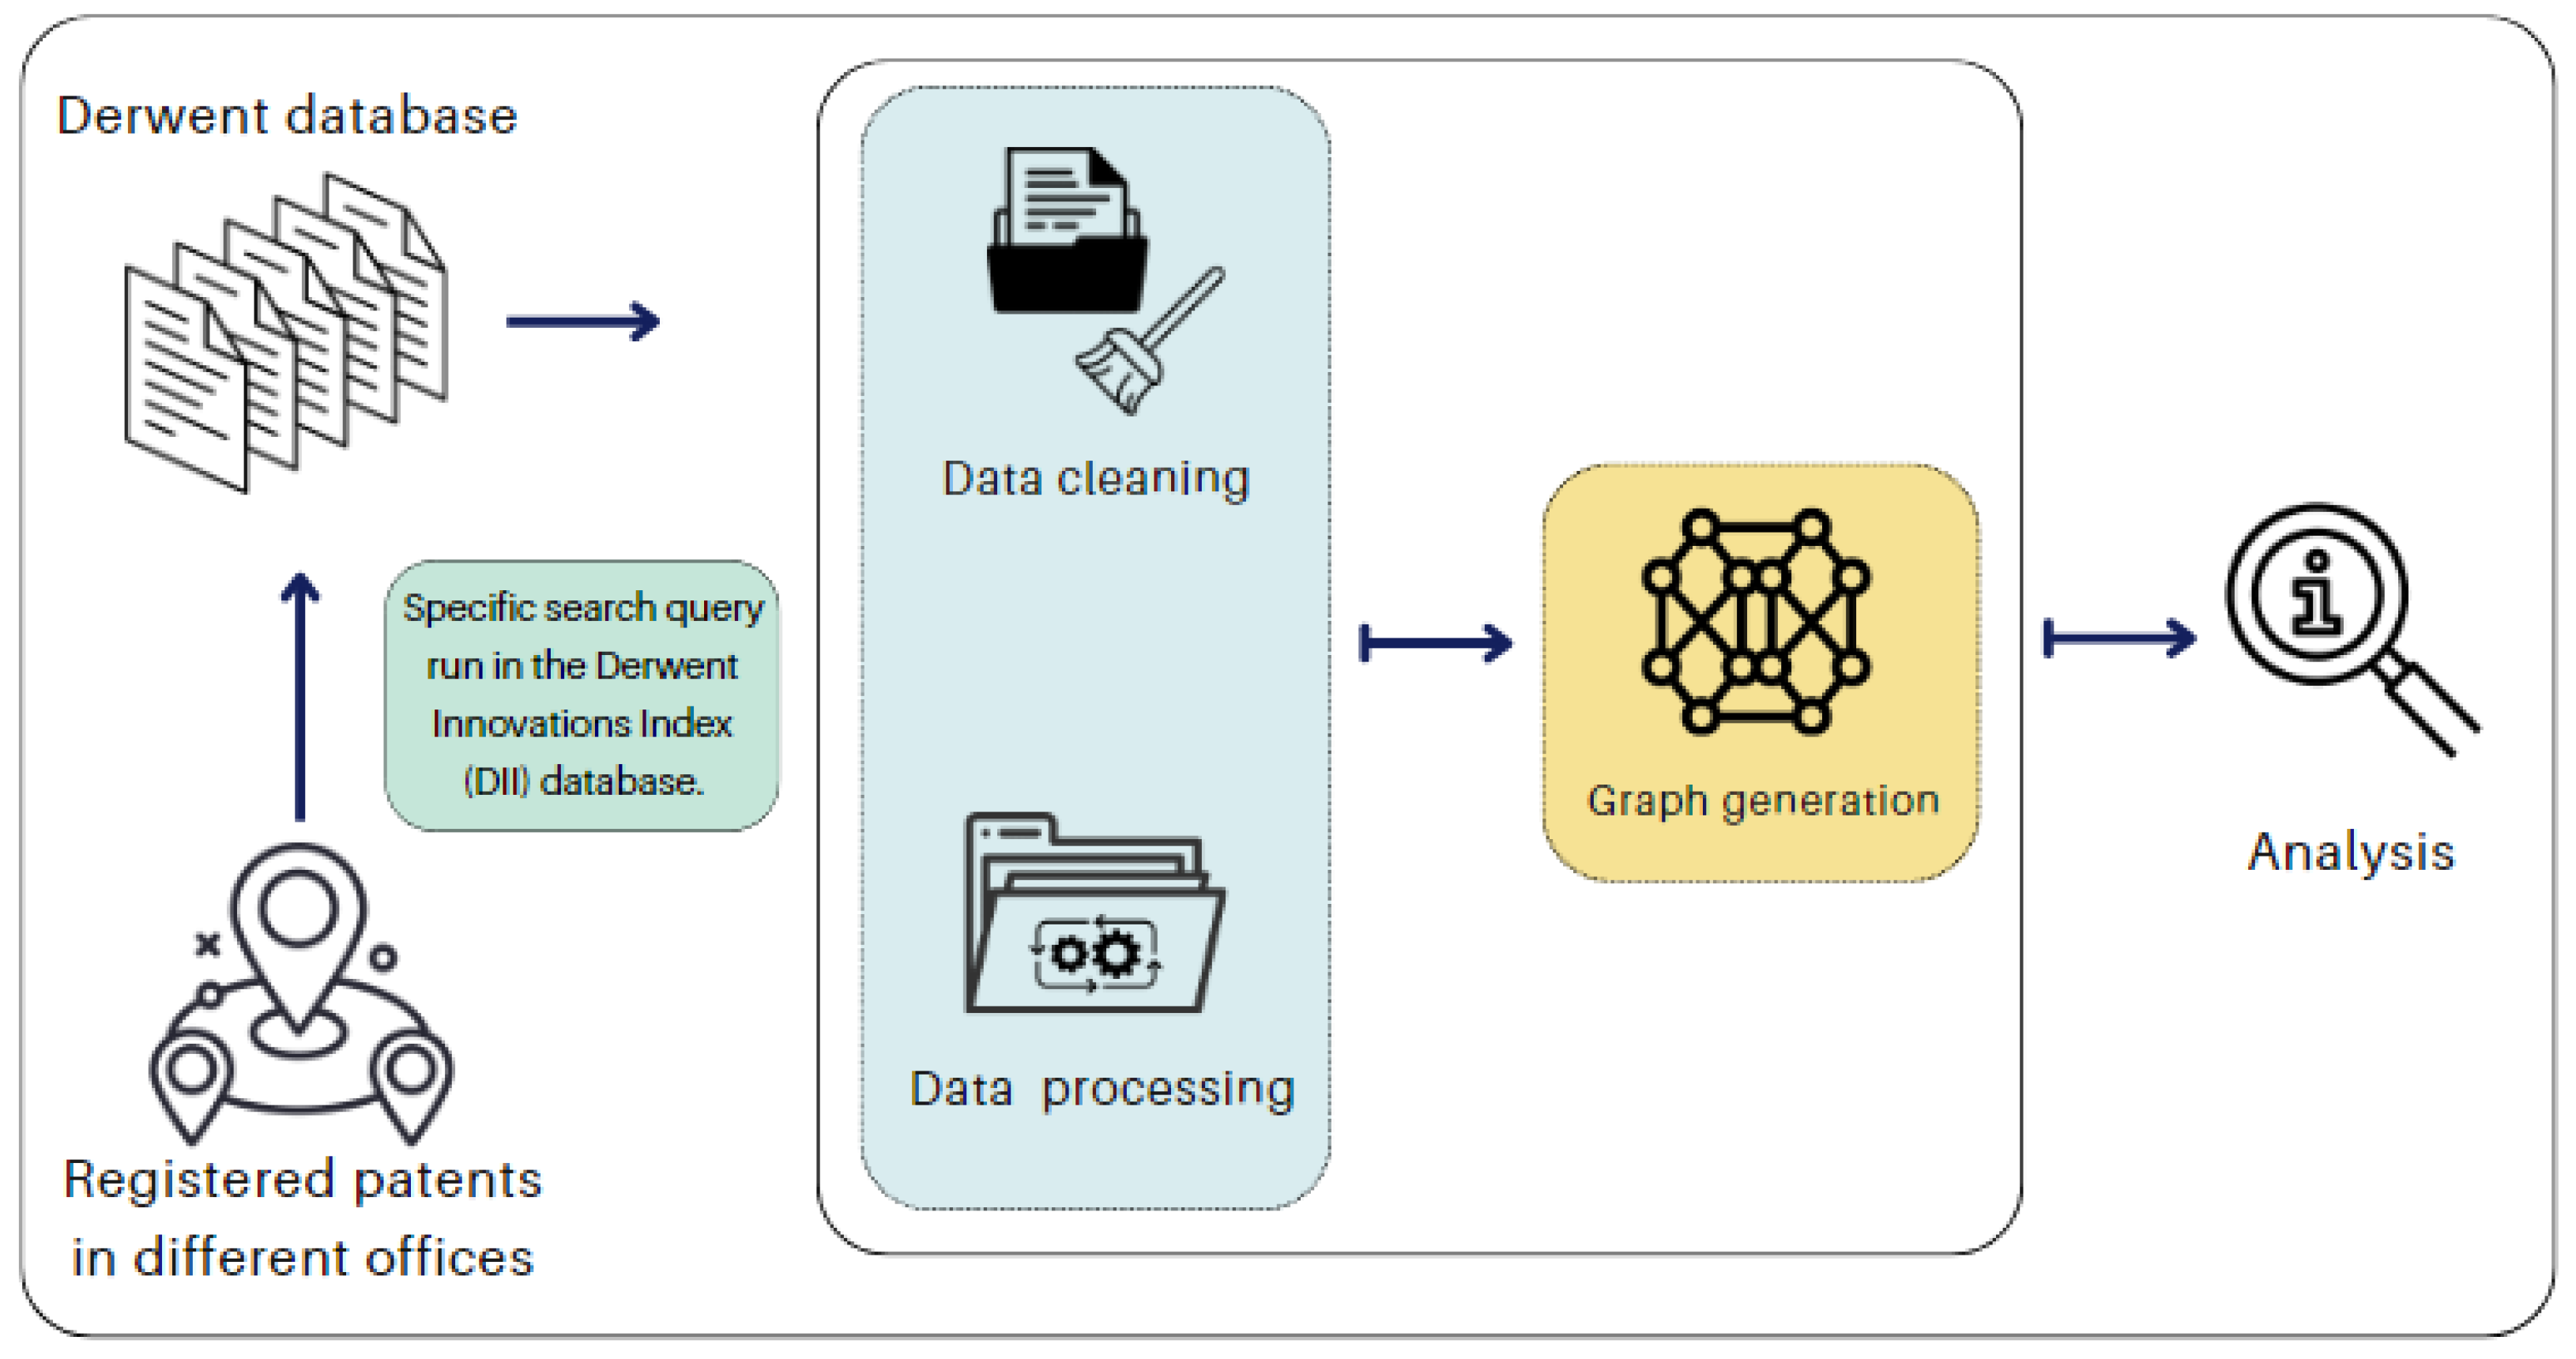
3. Materials and Methods

In this section, the methodology employed in the research is detailed to ensure the robustness and reproducibility of the analysis. This approach integrates both qualitative and quantitative methods, aiming to provide a holistic understanding of the subject matter. The following subsections explore the processes involved in the selection criteria for materials, the experimental setup, data collection methodologies, and statistical analyses used to interpret the results at each stage.

3.1. Data Collection

The first step performed was the running of a specific search query in the Derwent Innovations Index (DII) database using the keywords “Sustainable Aviation Fuel”. This search was conducted on 14 May 2024, and it yielded a total of 73 patent families related to this emerging technology. To ensure the relevance and applicability of the data, patents starting with “WO” (written opinion) from the dataset were excluded. These “WO” entries represent Patent Cooperation Treaty (PCT) applications, which are initial filings under the international patent system and have not yet secured protection in any country [63]. This decision was based on the understanding that such patents might not proceed to the national phase, where they would be evaluated and potentially granted protection within individual countries.
Following this initial data refinement, subsequent analysis was conducted to identify and understand future trends in patenting within the field of sustainable aviation fuel. The exclusion of “WO” patents was crucial, as these applications must transition to the national phase within 30 months of their filing date to avoid expiration and secure legal protection in the designated countries [63]. This period allows inventors to decide in which countries they seek patent protection and to comply with national patent laws. By focusing on patents that have already entered the national phase, the analysis was based on more mature and potentially enforceable patents, providing a clearer picture of the technological advancements and market commitments in sustainable aviation fuel.
This methodological approach allowed the user to streamline the dataset to include only those patents with a higher likelihood of impacting the market and regulatory landscapes. Consequently, the analysis offers a more accurate forecast of future developments and investment trends in sustainable aviation fuel technologies.

3.2. Data Retrieval and Preprocessing

After retrieving the relevant patent documents, the Python-based data retrieval and preprocessing pipeline started. The preprocessing steps encompassed the following:
  • Patent Information Parsing: Patent documents were processed, with critical data elements extracted using processes such as patent assignees, international patent classification (IPC) codes, filing application dates, and patent families’ IDs. Table 3 also shows the renaming table.
  • Data Filtering: A segregation approach was implemented to separate actual patent families from the exclusively “WO” applications (entries with no IDs other than those with the prefix).
  • Data Manipulation: The patent assignee’s leading company was extracted from the field to aggregate companies that belong to the same organization; family size was created by the count of the individual patent numbers, excluding “WO” applications; patent year was extracted from the “Application Details and Date” field; and a column “Years until expiration” was created for patents (20 years from 14 May 2024) and “WO” applications (2.5 years from 14 May 2024).

3.3. Graph Generation

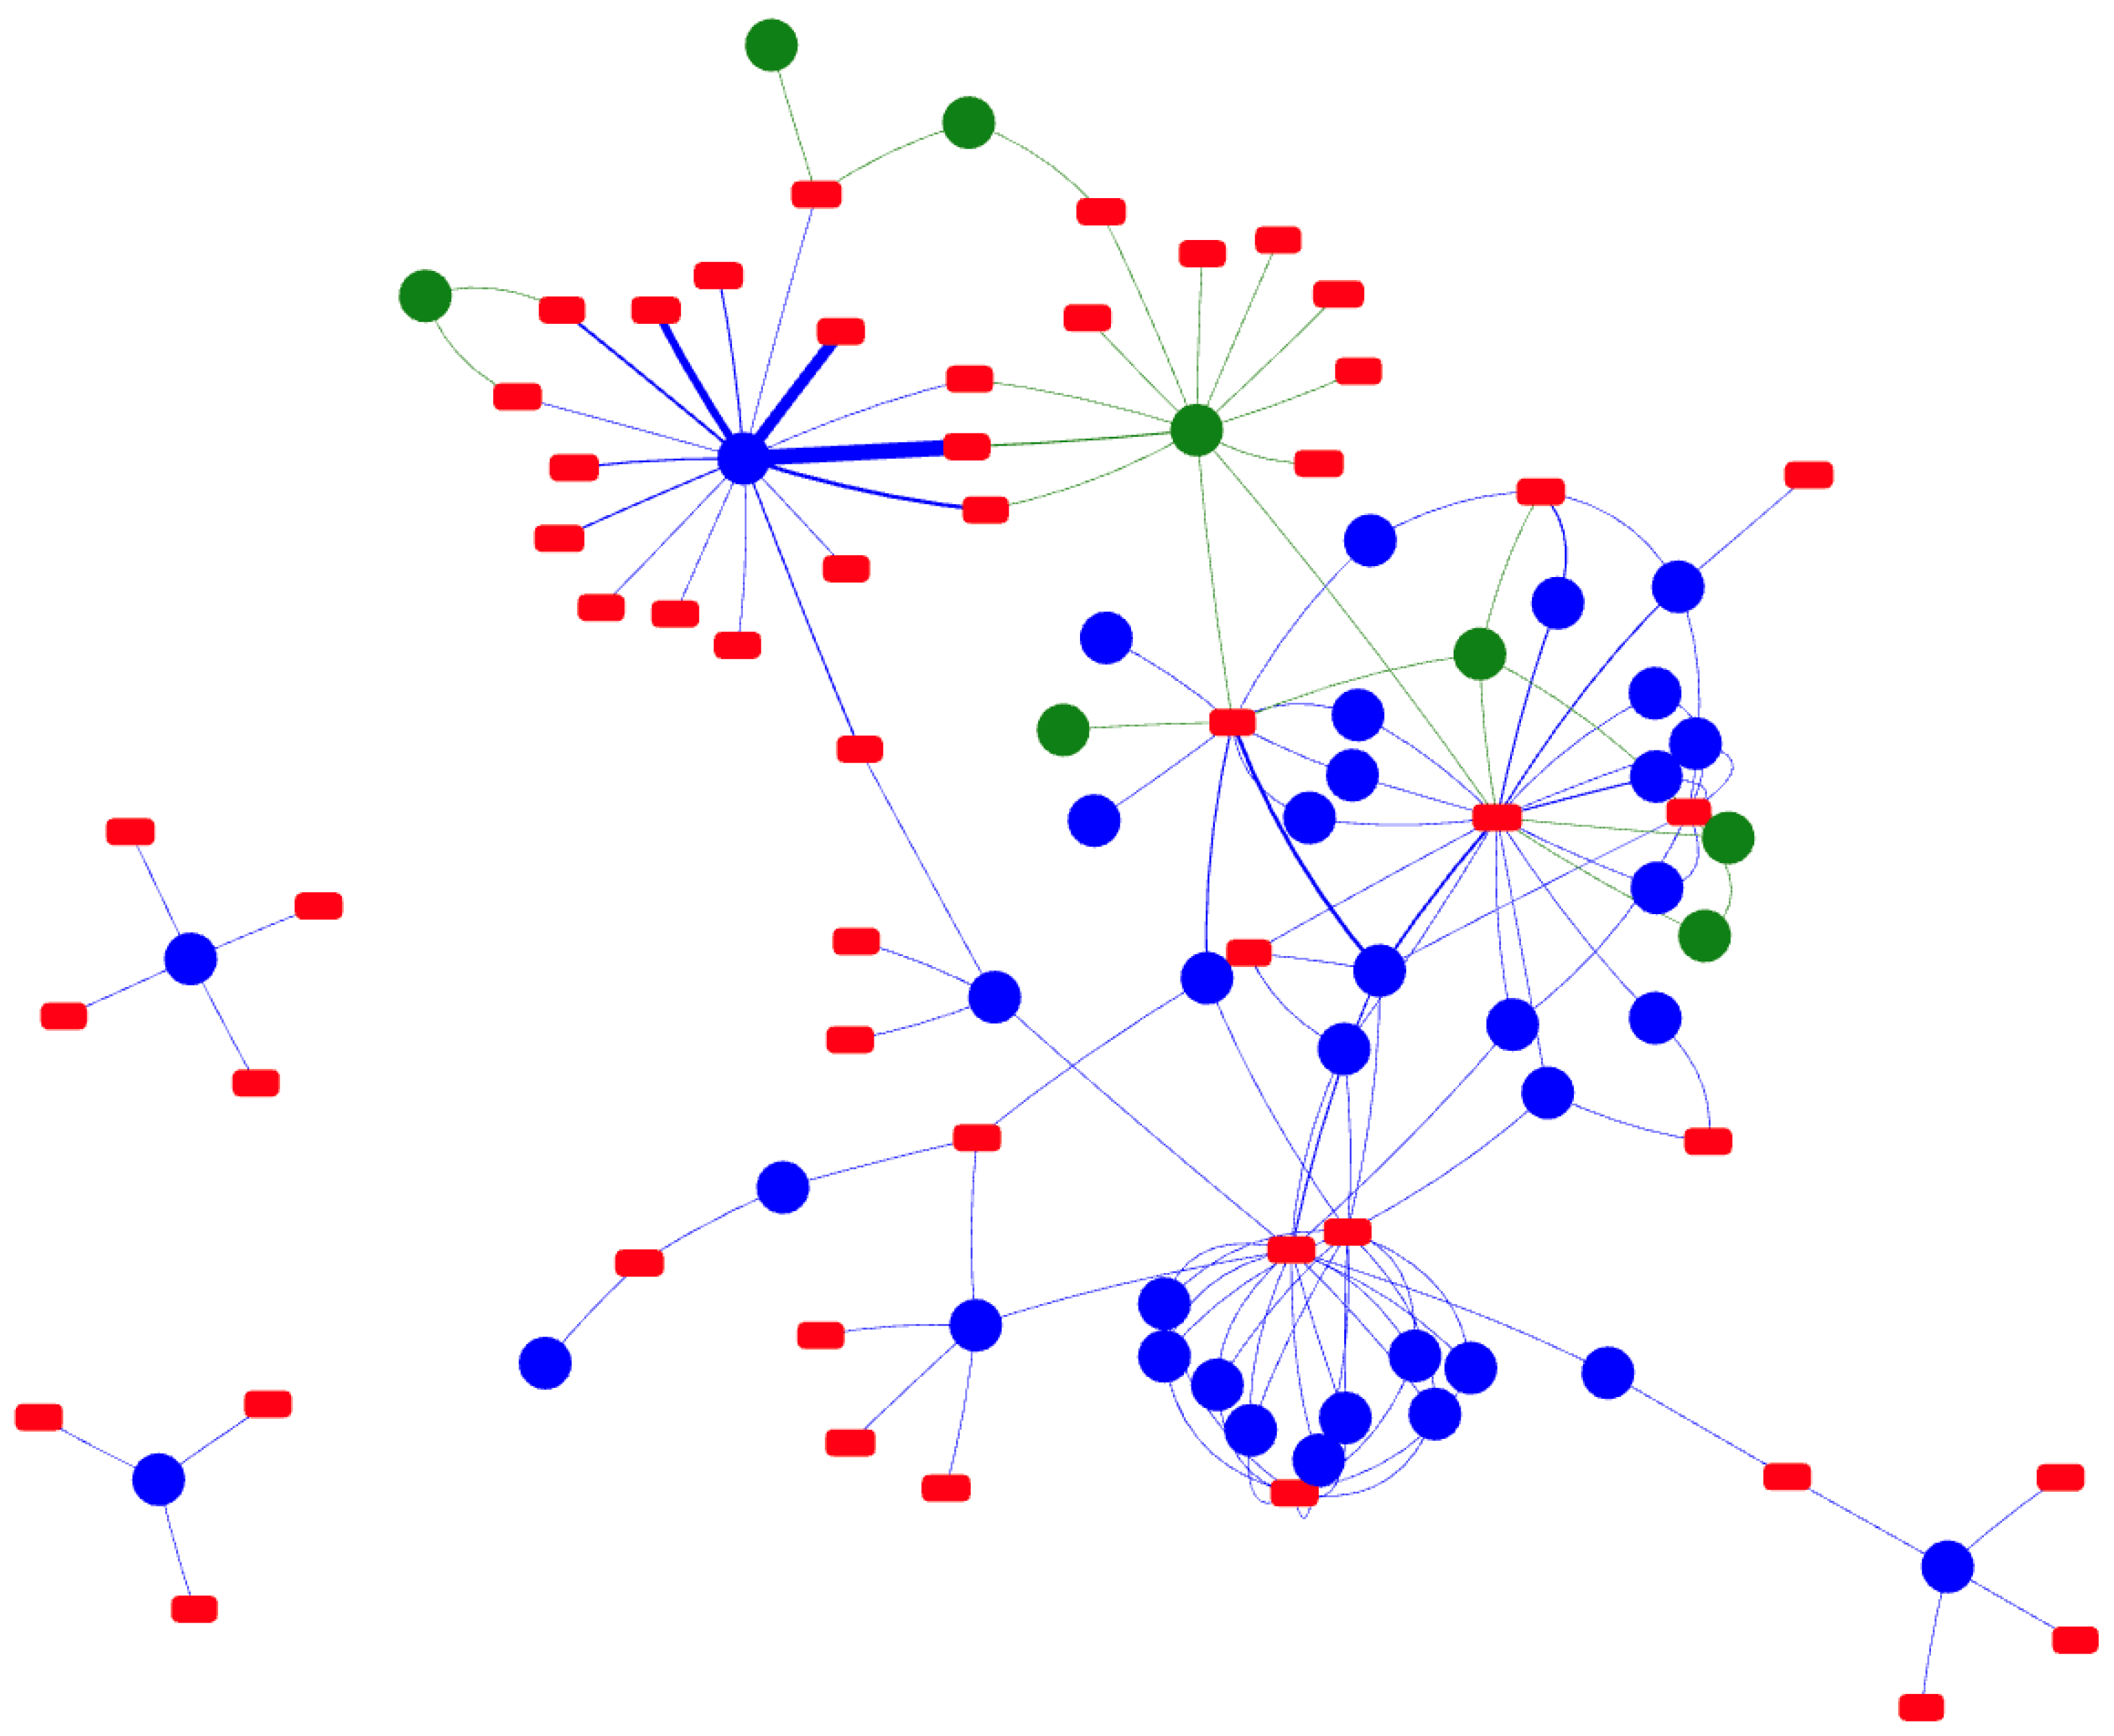
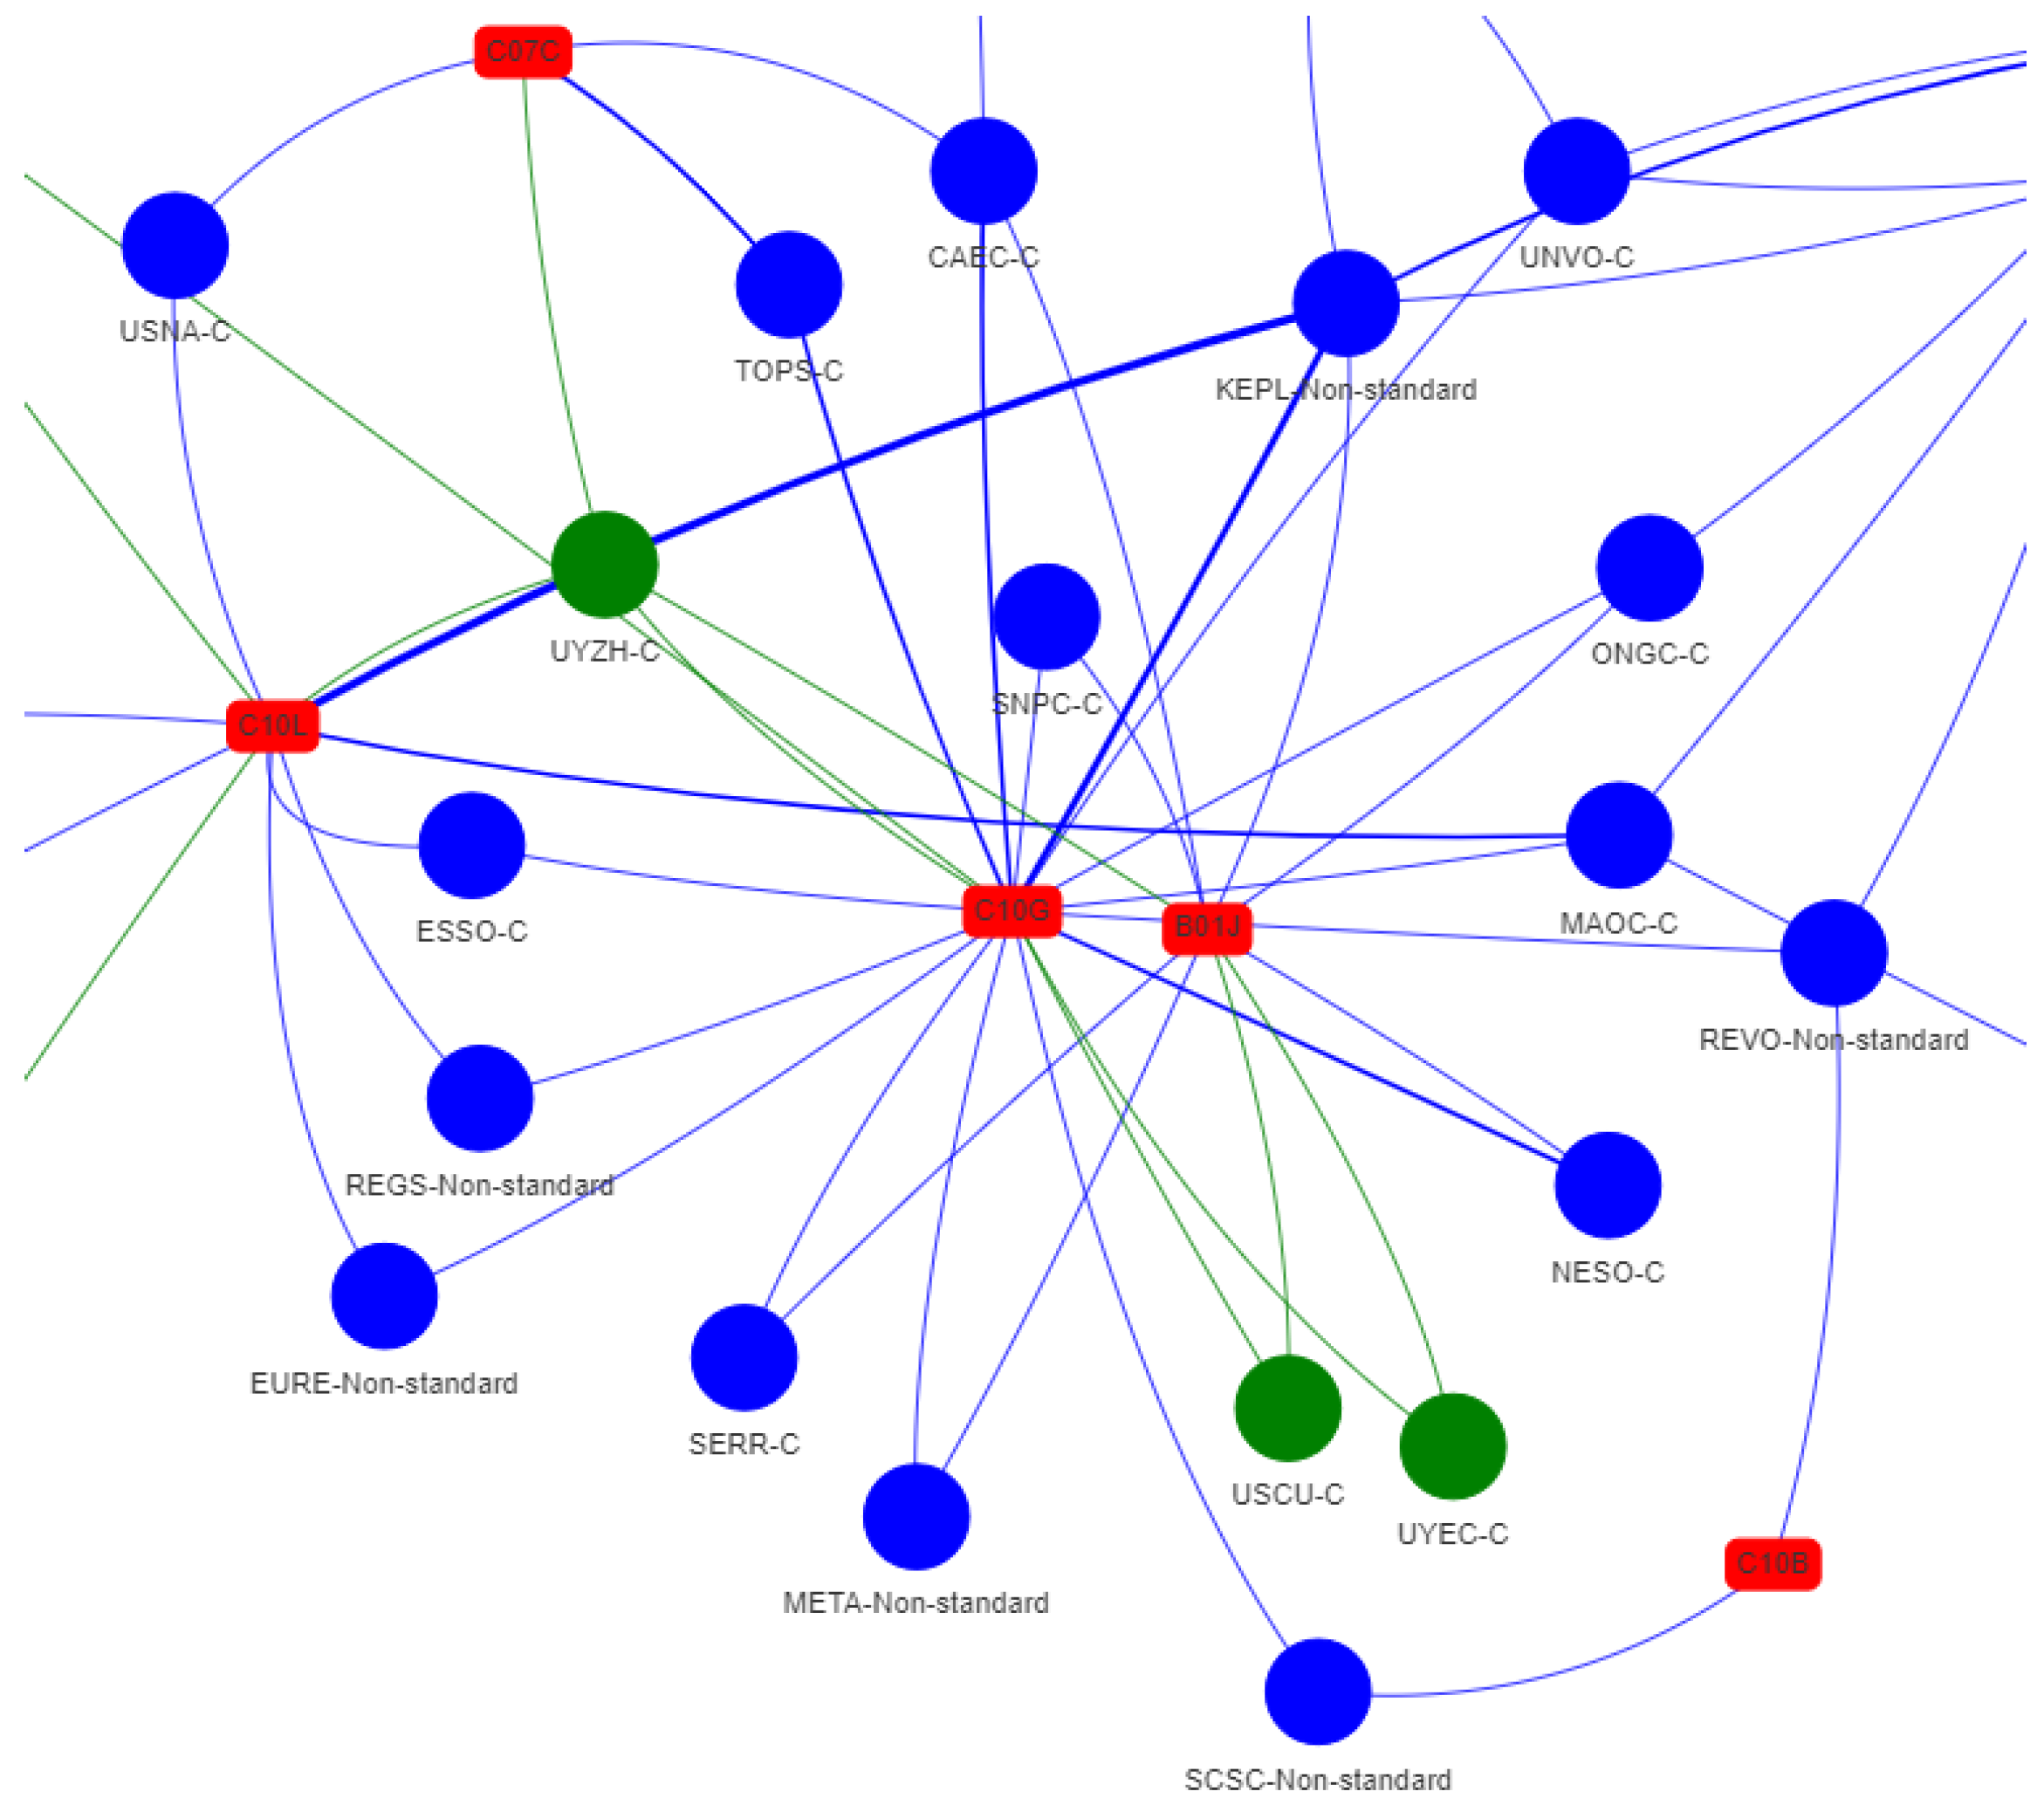
3.3.1. IPC–Assignee Network

With the preprocessed information loaded, a network graph was developed. The central red nodes represent the International Patent Classification (IPC) codes, and the adjacent blue nodes represent patent assignees: companies and universities. The latter were set to green to highlight their unique characteristics. The edge’s weights were set to the number of patents that each assignee has registered in the corresponding IPCs (https://github.com/Matheusmno/TGP1/blob/main/IPC_Assignee_weighted_DW.html (accessed on 27 May 2024)).

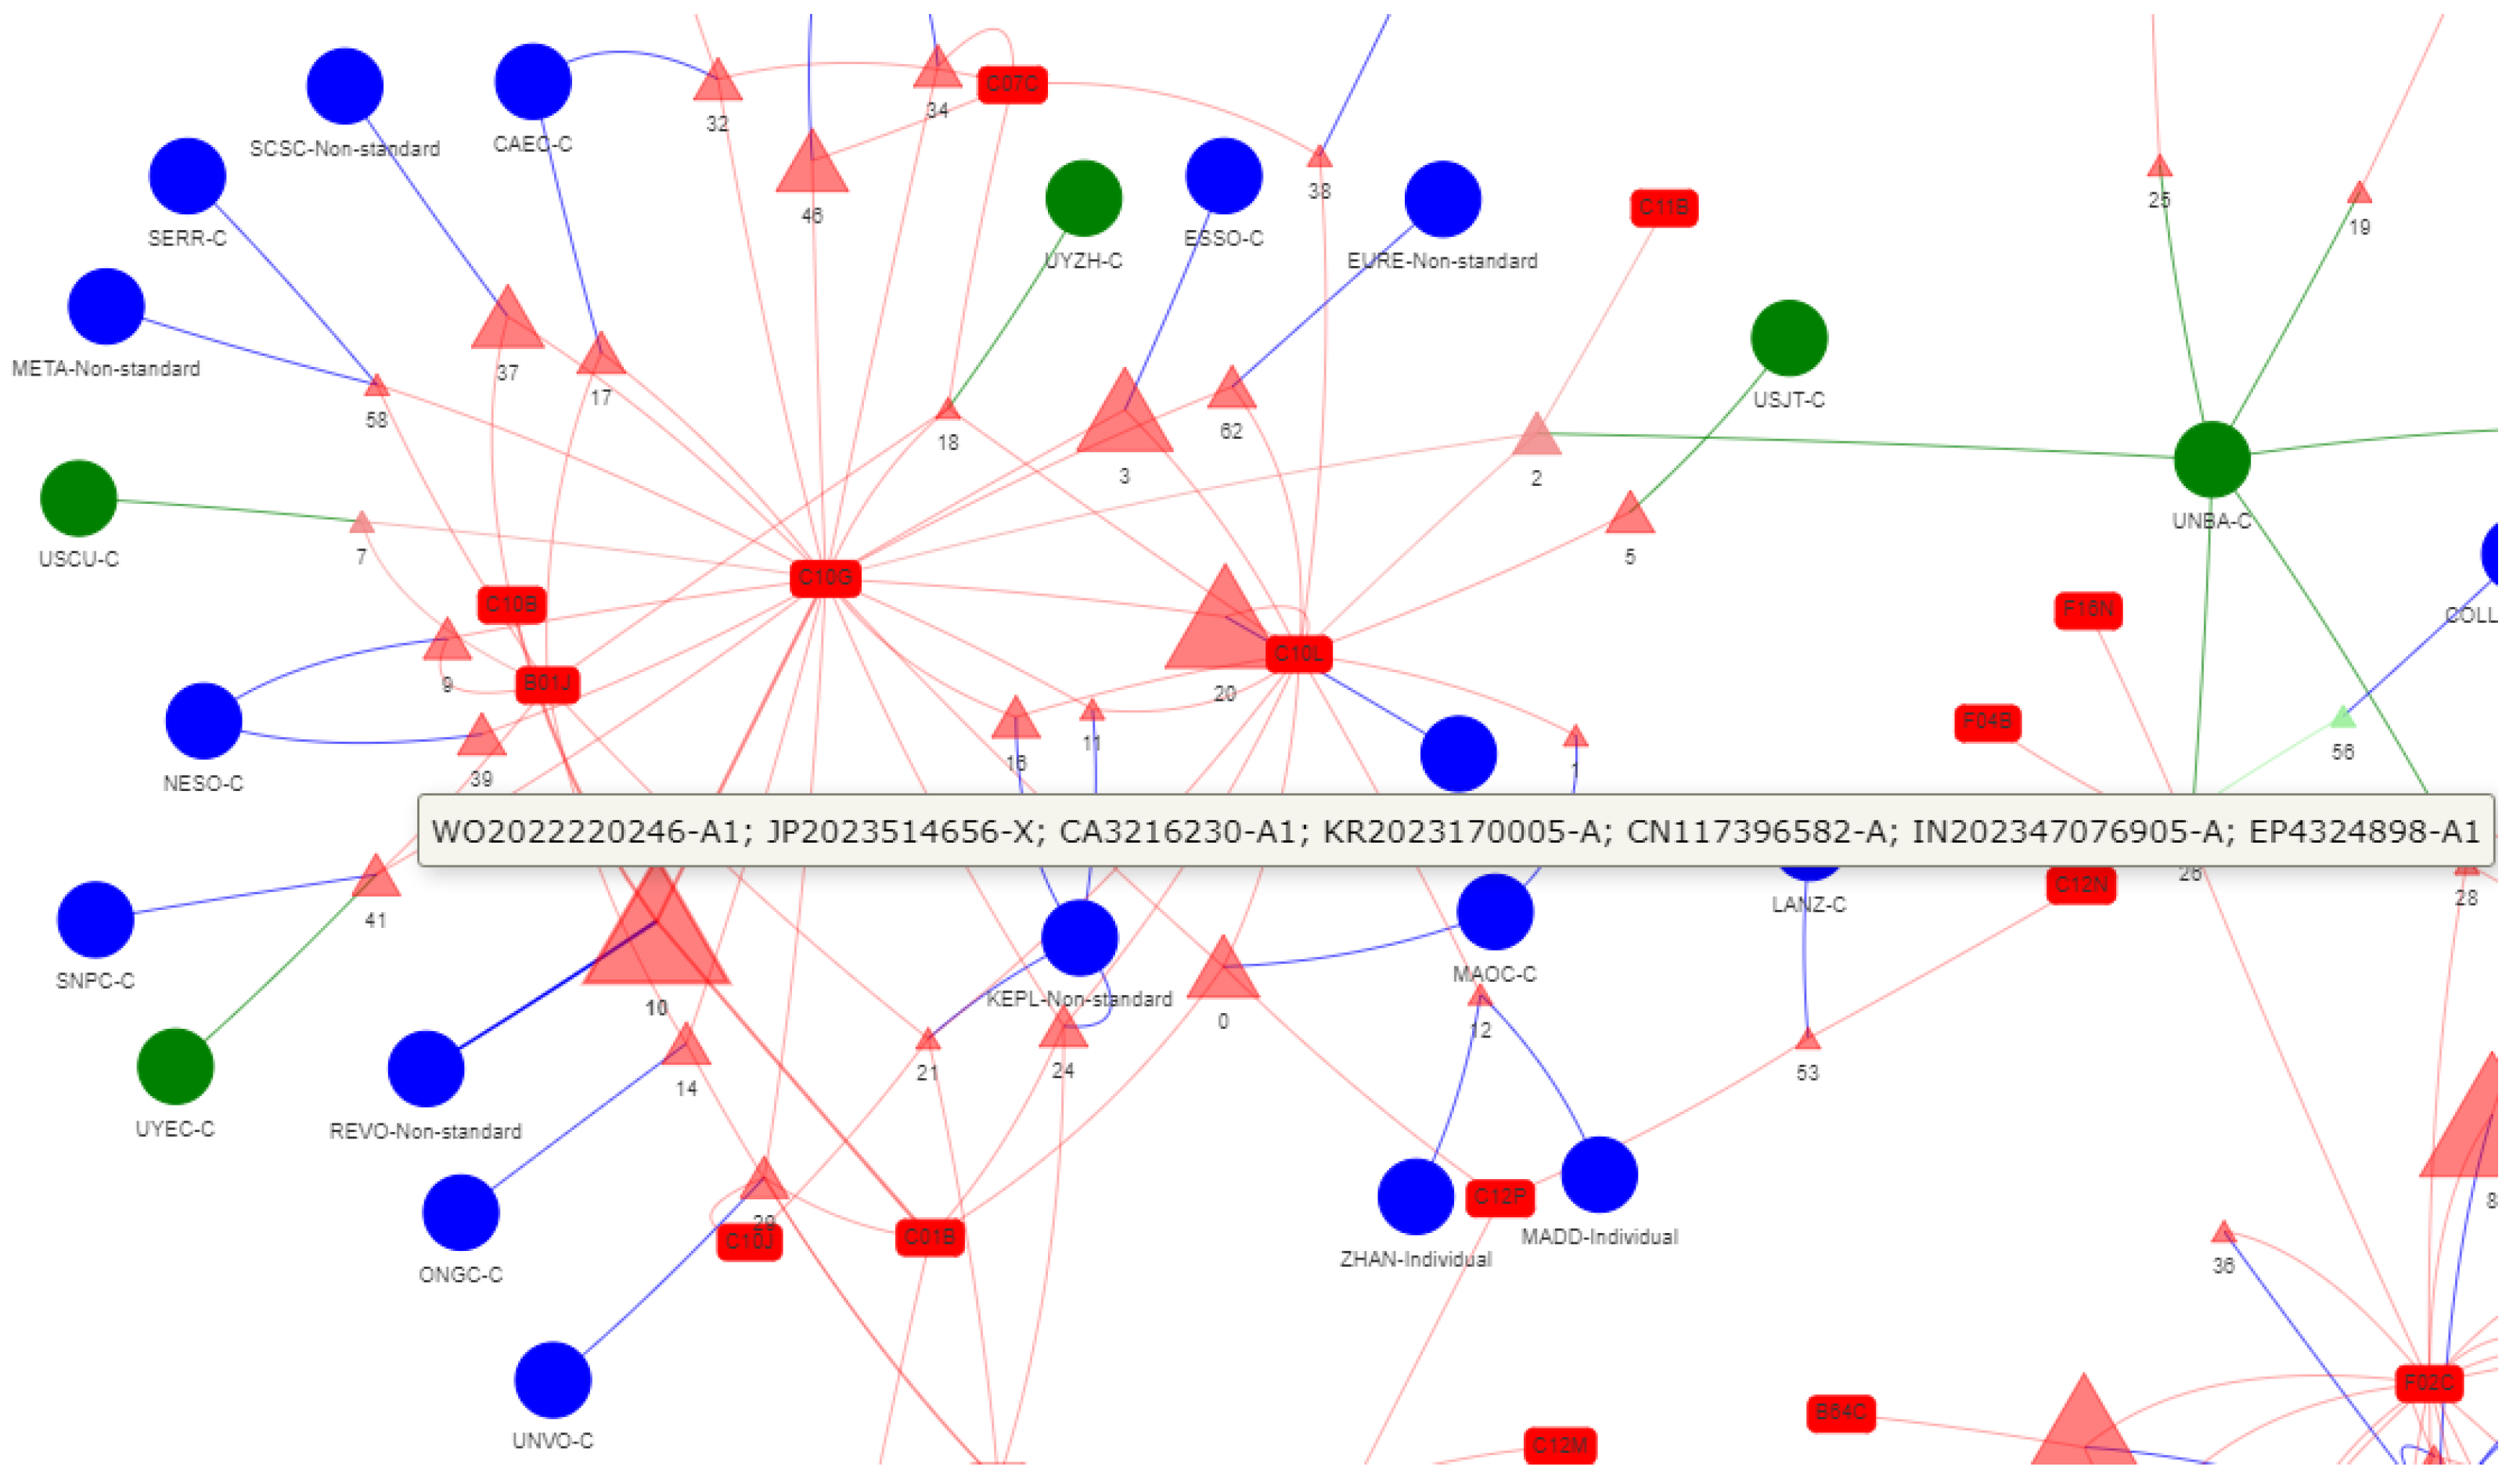
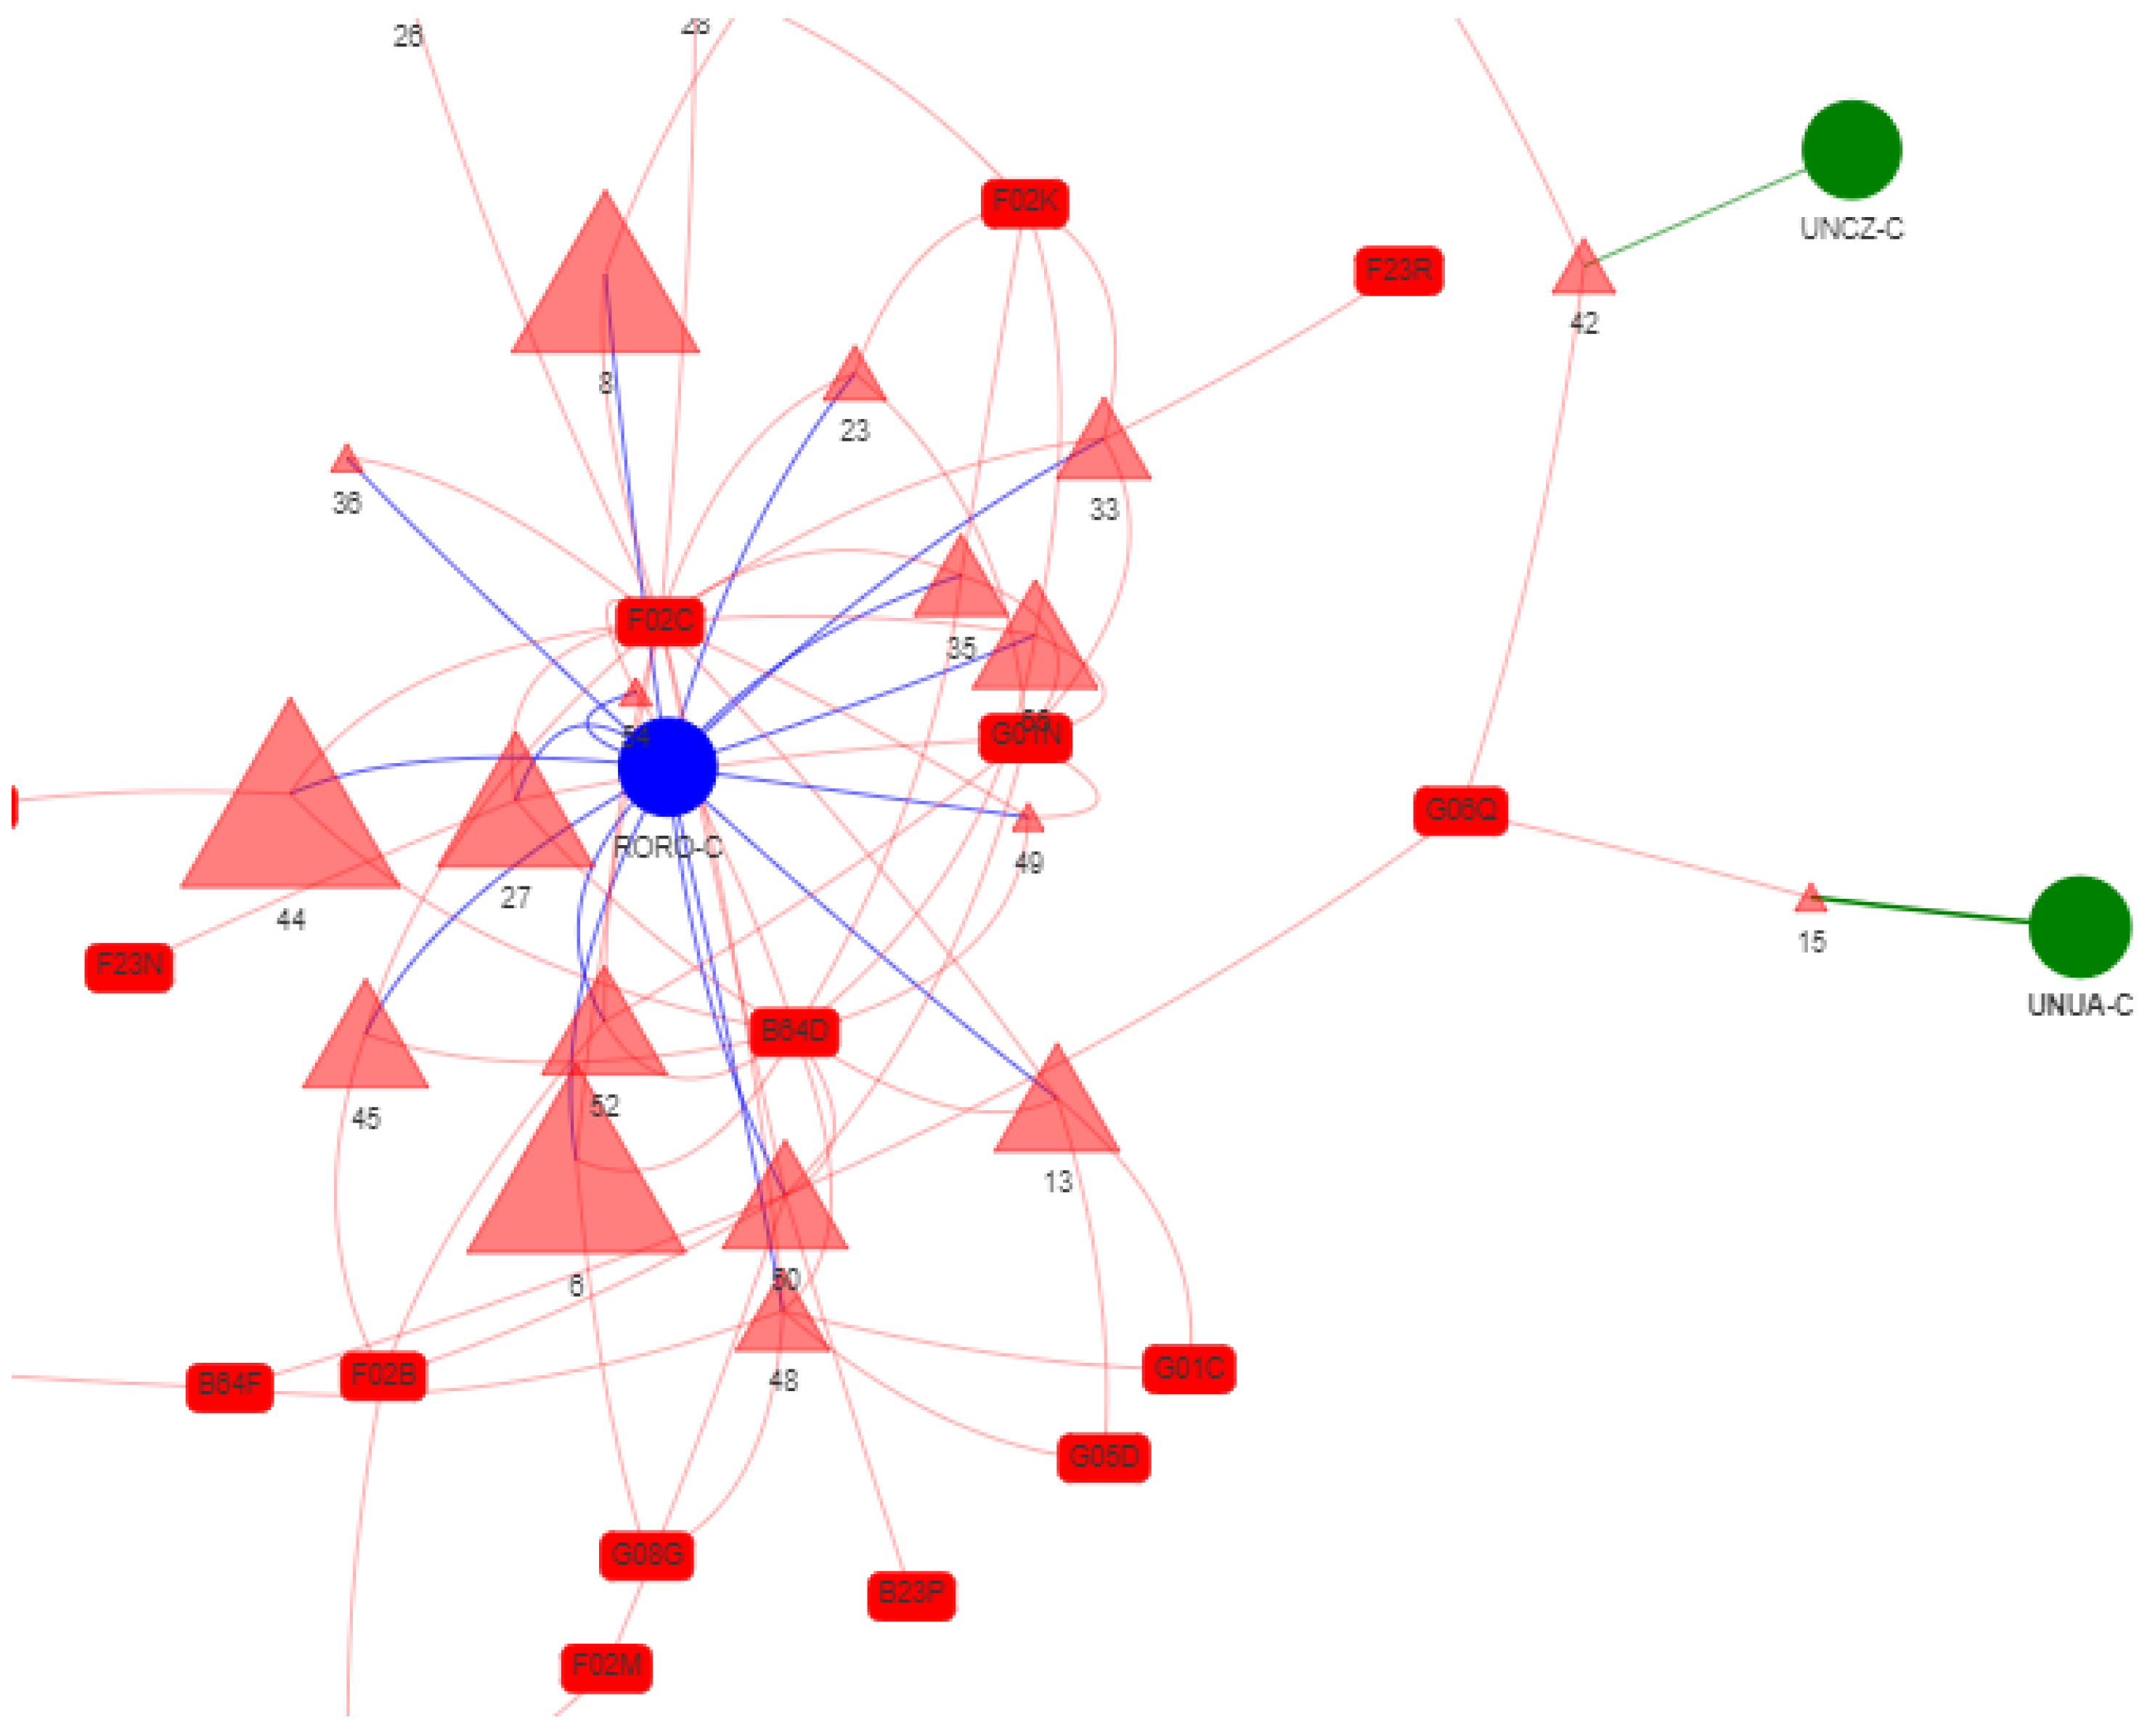
3.3.2. IPC–Patent-Assignee Network

This network was also created to visualize the patents as nodes and identify the most relevant patents in a given field. Two main metrics were considered when attributing the patent’s relevance: family size and years until expiration. The family size determines the size of the triangle, and its color is set by how many years there still are for the patent to expire, given the 20-year rule. There were four instances of five-year spans to determine the triangular node color: from 0 to 5 years, green; from 5 to 10 years, light green; from 10 to 15 years, light coral; and from 15 to 20 years, light red. In this way, it is possible to visualize the biggest patent families and the ones about to expire, which might be an opportunity for the industry to explore (https://github.com/Matheusmno/TGP1/blob/main/IPC_Assignee_PN_DW.html (accessed on 27 May 2024)).

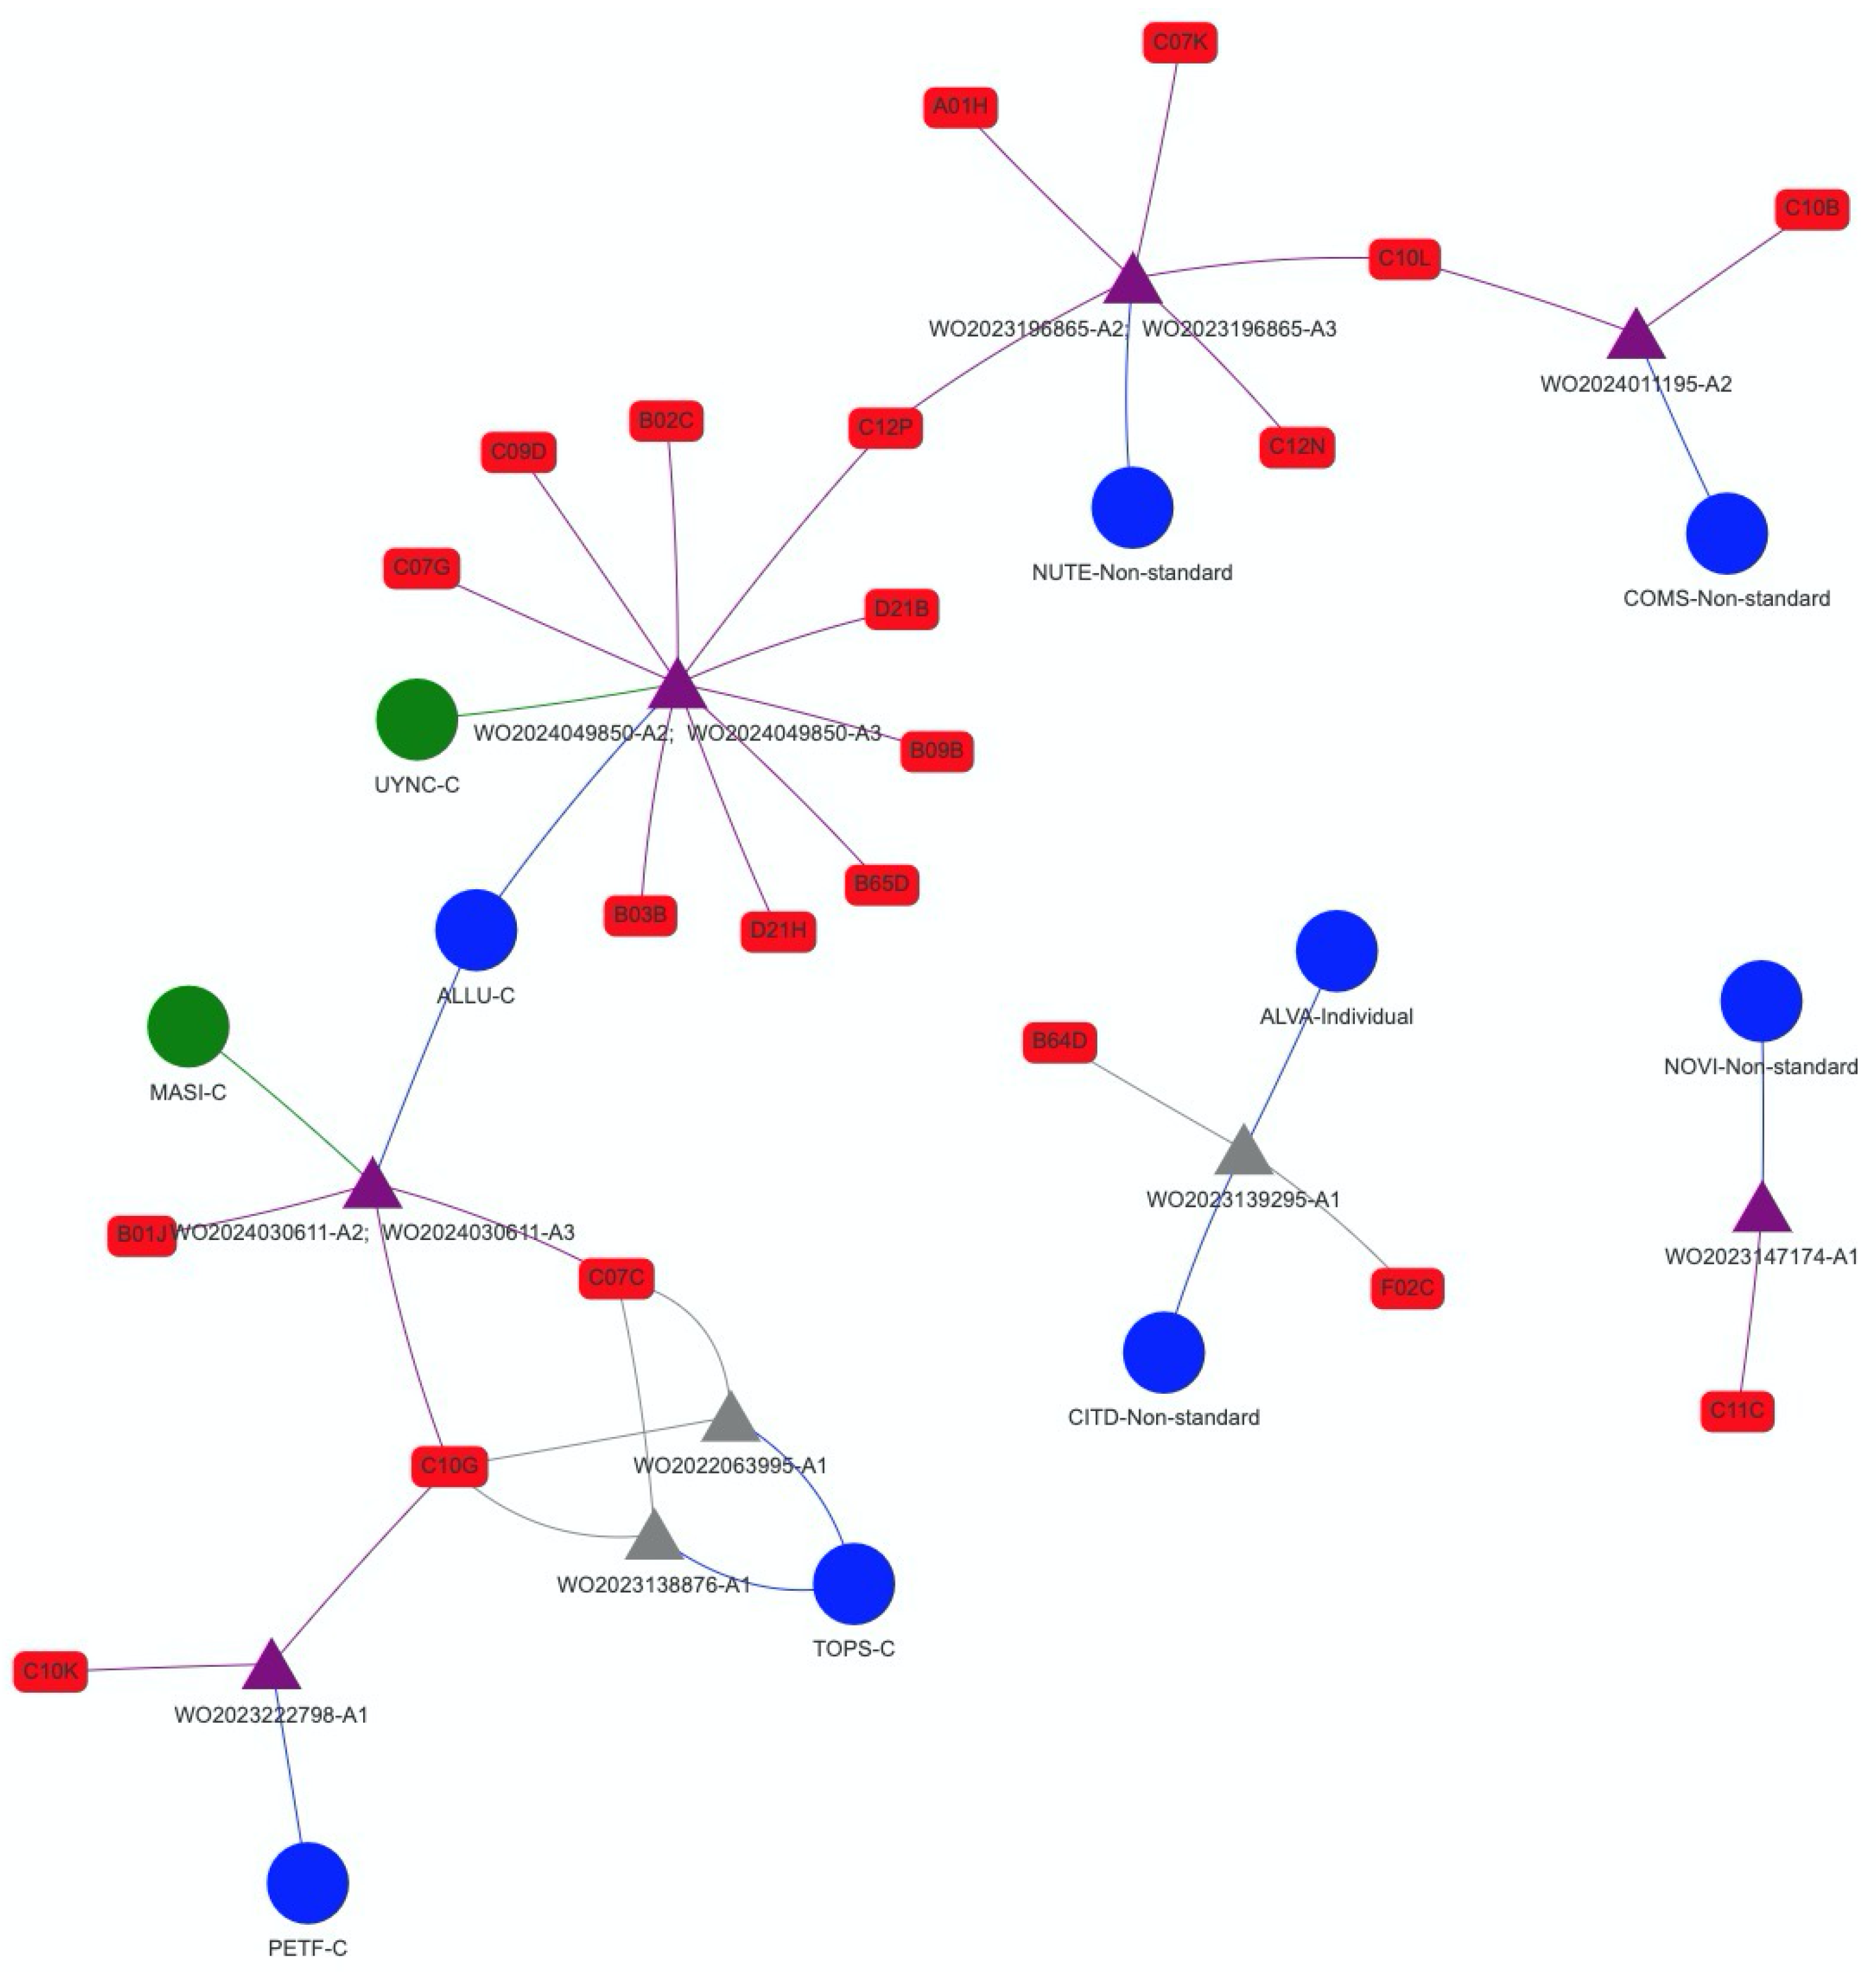
3.3.3. IPC–Assignee–Written Opinion Network

This network was created exclusively to visualize the “WO” applications and obtain an idea of what is coming next. It is essentially the same principle of visualization used in the IPC–Patent-Assignee network, but the rule for the triangular node color was set to be gray for applications that are about to expire (less than six months from the expiration date) and purple if they still have more than two years to become a patent (https://github.com/Matheusmno/TGP1/blob/main/IPC_Assignee_PN_WO.html (accessed on 27 May 2024)).

3.4. Python Libraries and Tools for Graph Analysis

  • Pandas: Implemented for data management and processing.
  • NetworkX: Employed to create graph structures and for graphics analysis.
  • PyVis: Used to create the NetworkX graph as an HTML file for interactive analysis.
Comprising both the Derwent Innovations Index database and graph analysis algorithms written in Python 3 (implemented in NetworkX), this methodology thoroughly investigated the SAF patent sphere. The methodological framework shown in Figure 1 allowed us to view cooperation between clusters, technological trends, and innovation inside the sustainable aviation fuel industry.

4. Analysis and Results

This section presents the results of the analysis of SAF patent data and graph analysis. It also reveals a recent surge in SAF patent activity and key technological focus areas.

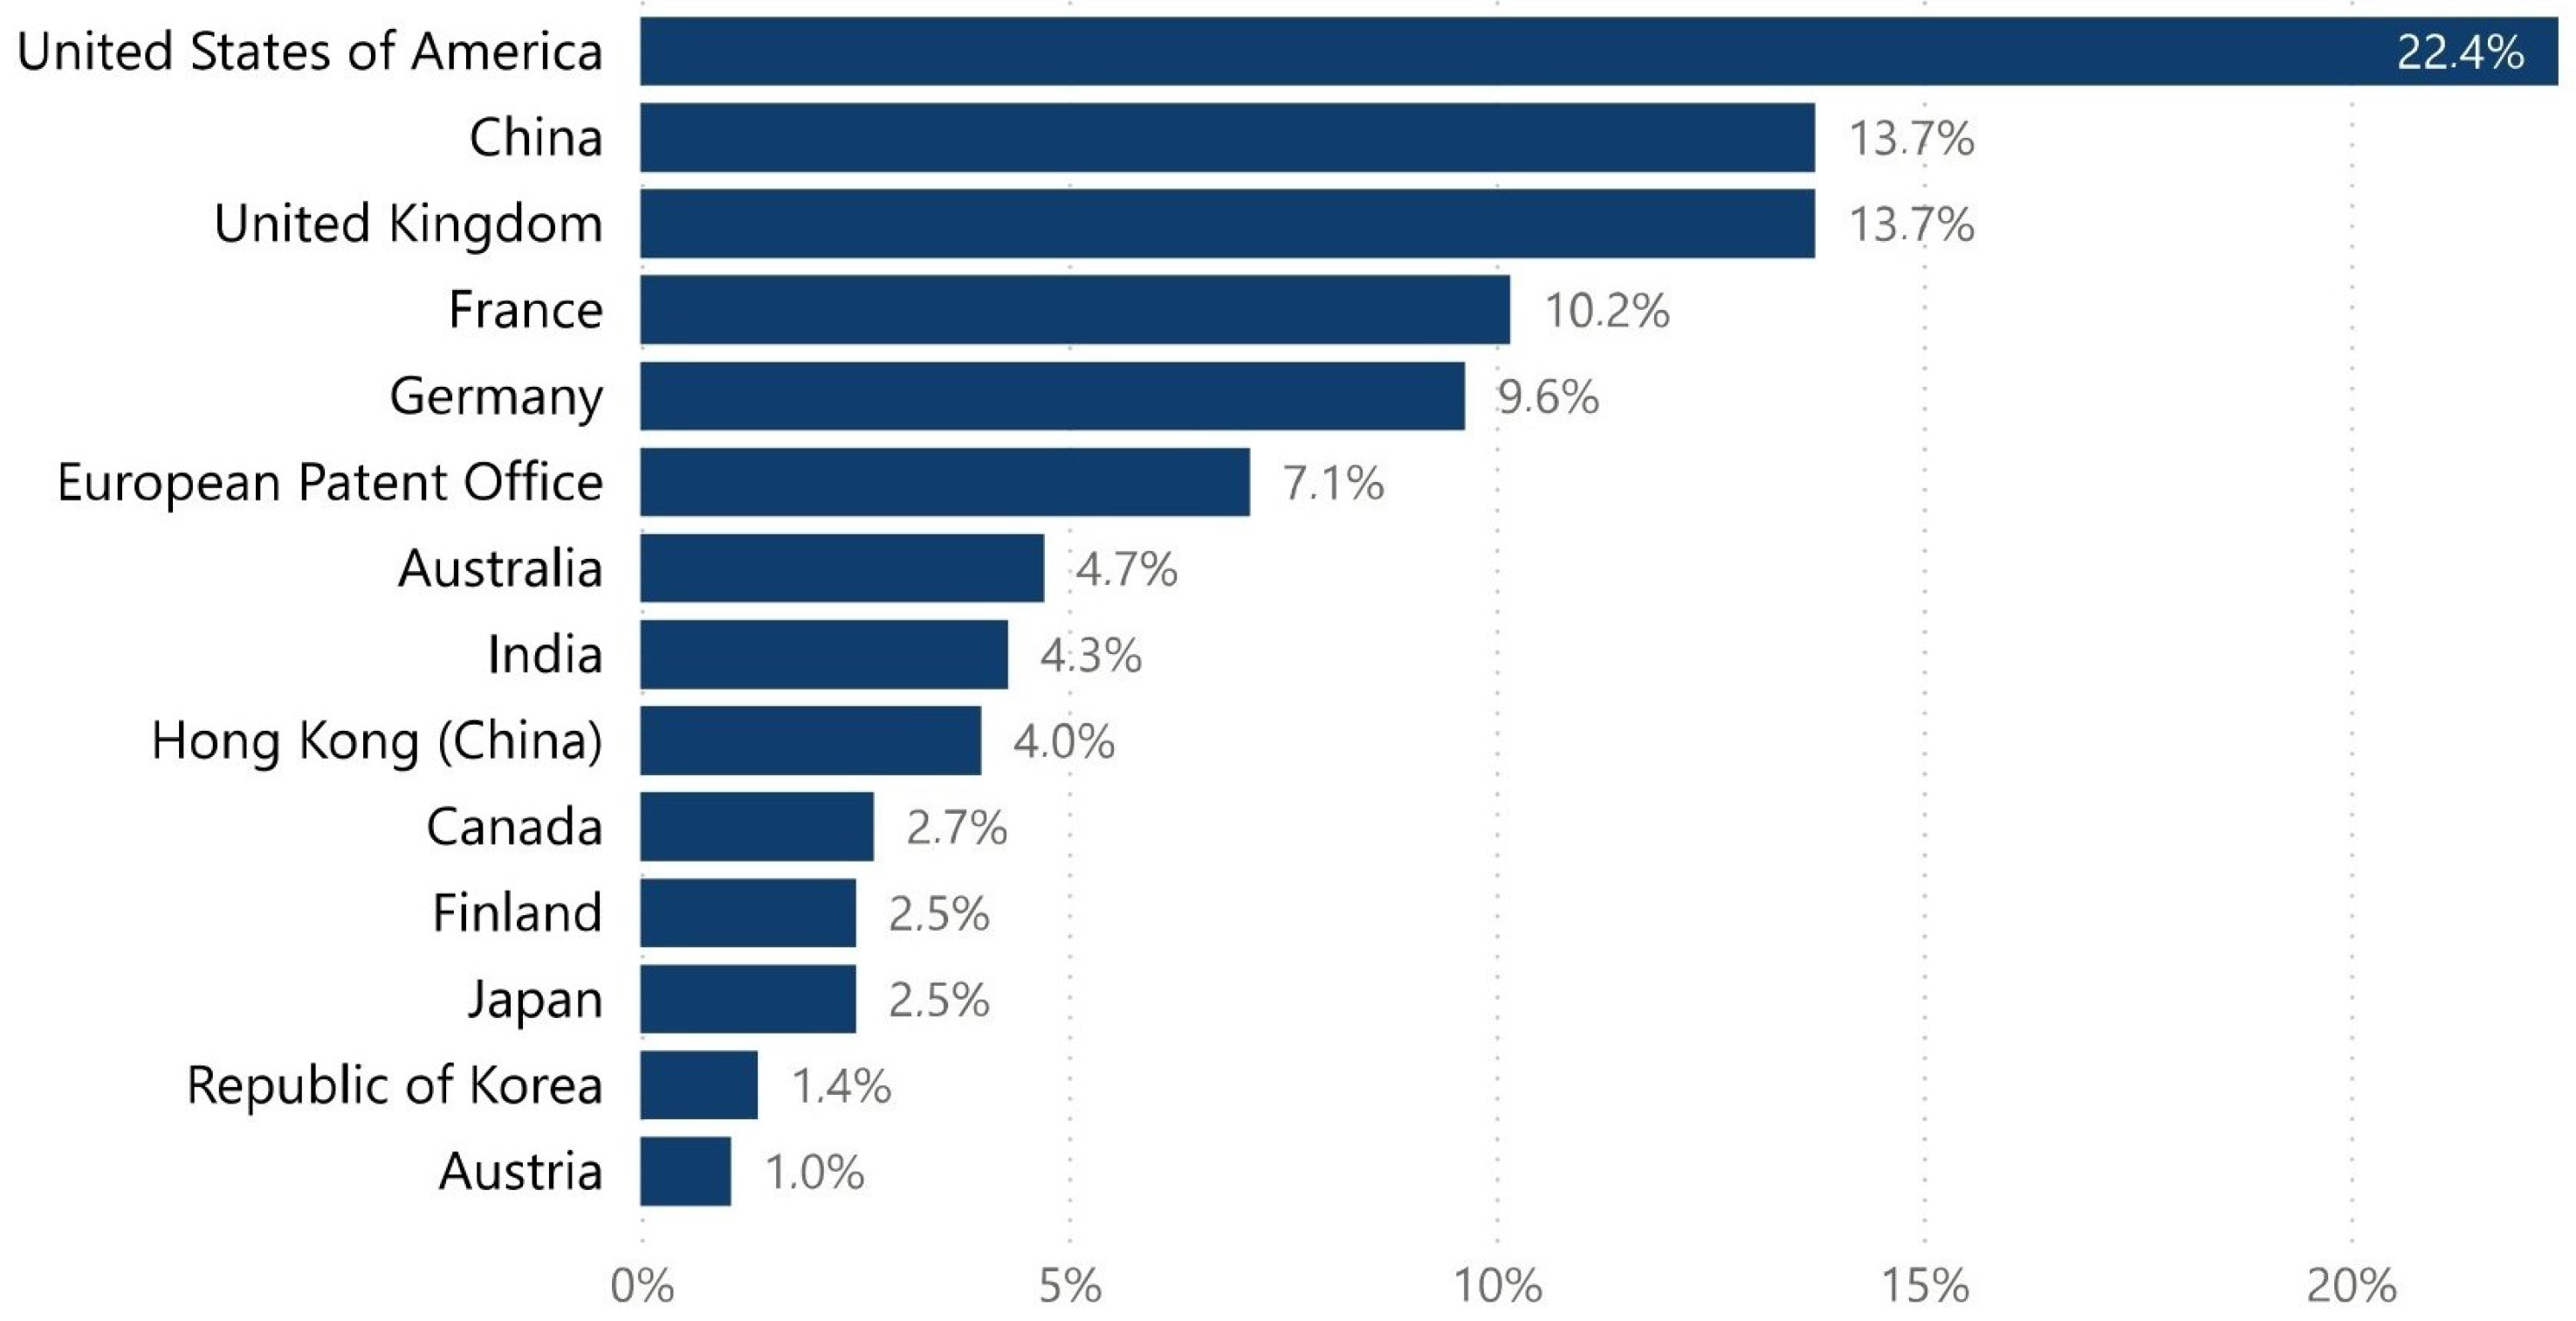
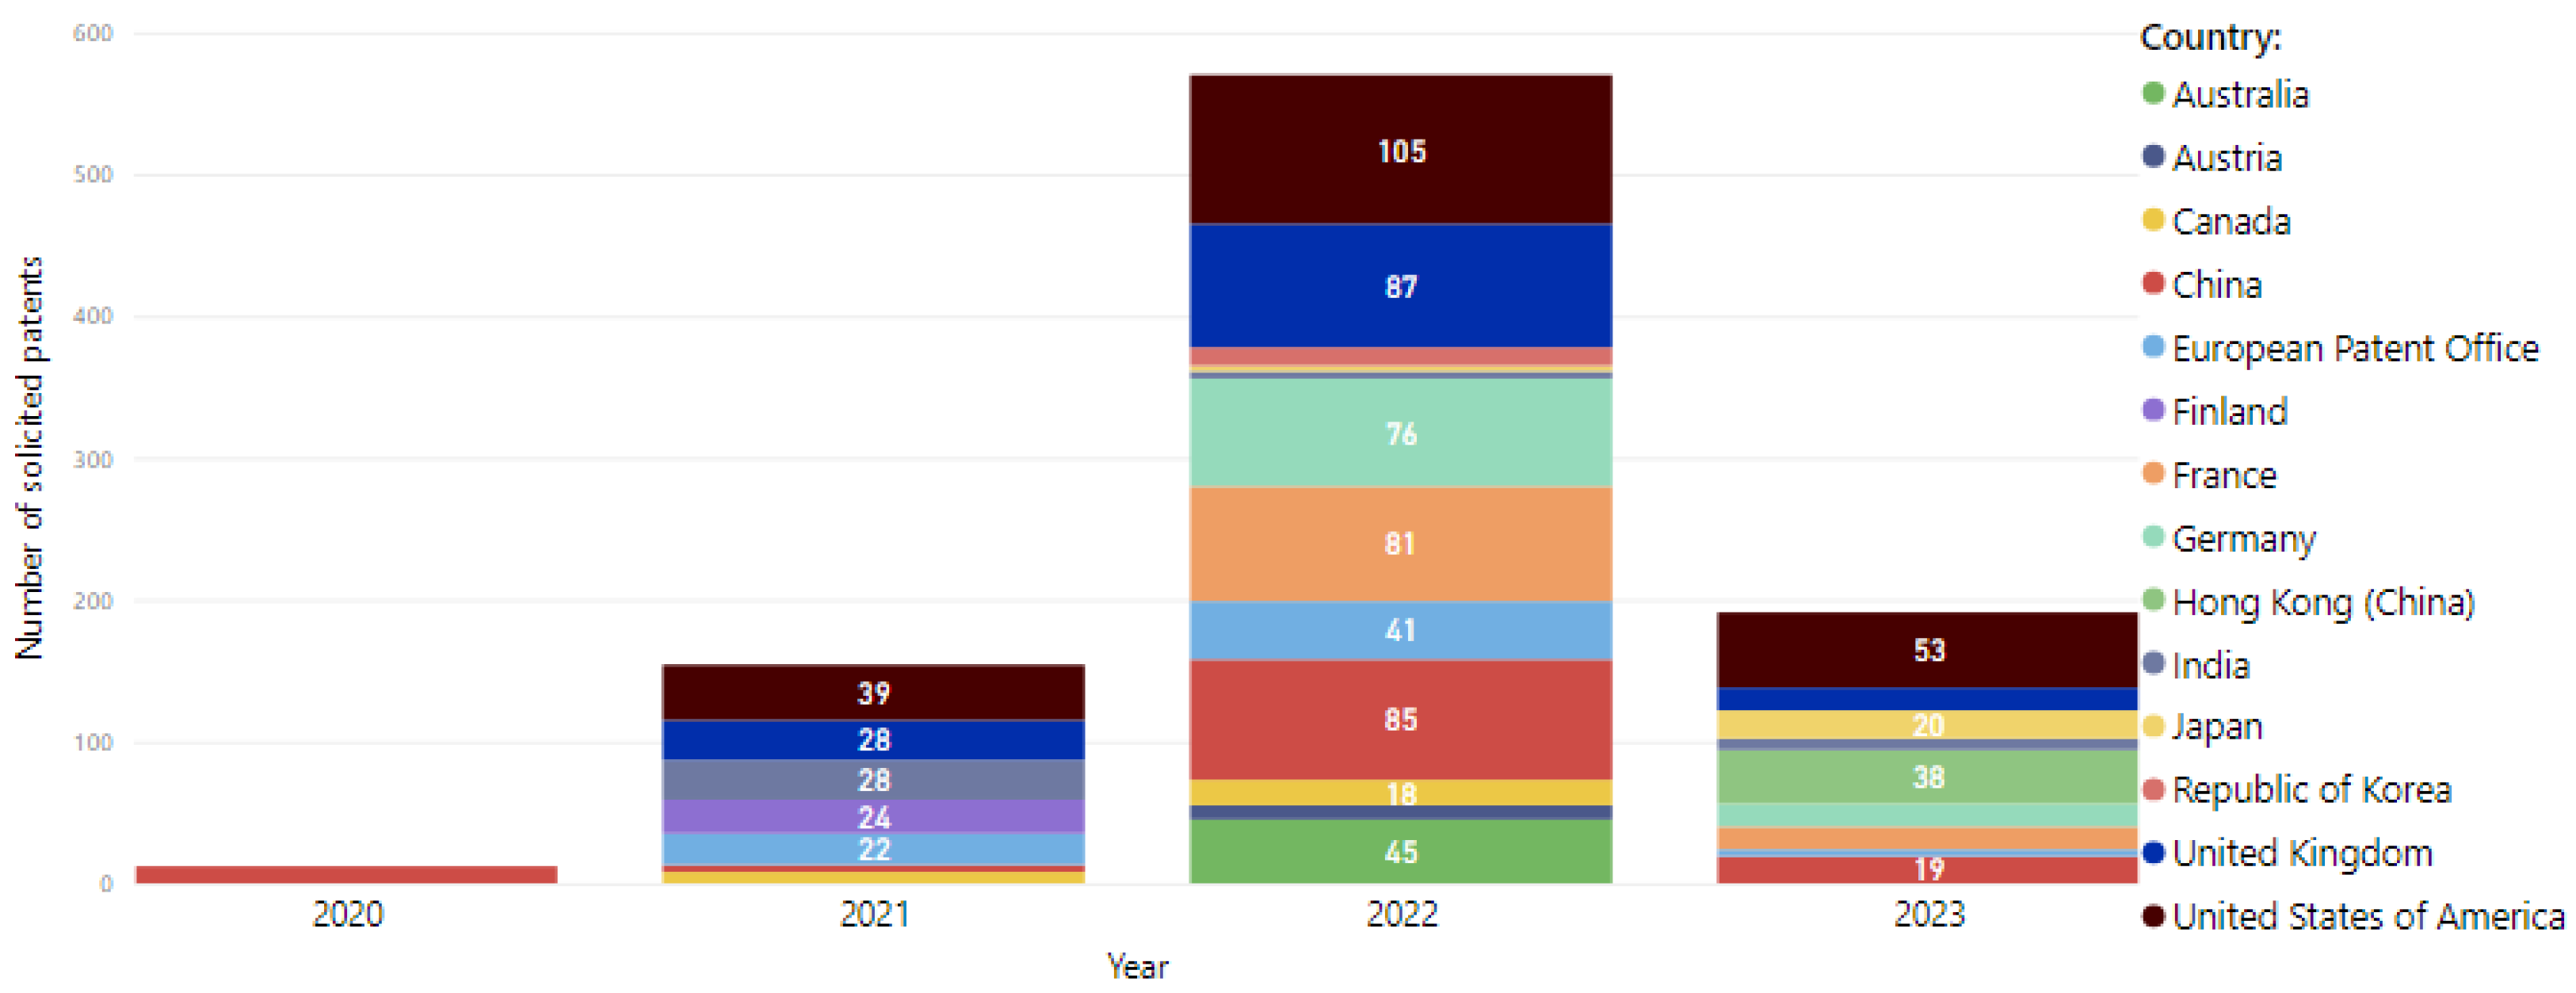
4.1. Contextualizing SAF Patent Data

Before utilizing graph theory to display the correlation between different patents, a comprehensive preliminary analysis was conducted to chart the evolution of patent applications and identify their main areas of research. The database comprises a total of 136 patents, excluding Patent Cooperation Treaty (PCT) applications, with only 6 patents having an application date before 2019. This dataset provides a clear indication of the burgeoning interest and rapid advancements in the field of sustainable aviation fuel (SAF) in recent years.
As illustrated in Figure 2, there has been a notable surge in patent applications, peaking in 2022 when 56.6% of all SAF-related patents were filed. This peak underscores a significant spike in innovation and research activity during that year.
In Figure 3, it is possible to see the participation of countries with registered SAF patents. The United States stands at the forefront of patent assignments, boasting 22.4% of all registered patents, while China and the United Kingdom closely follow with 13.7% each. This distribution underscores the vital contributions these countries make to the advancement and commercialization of SAF technologies but also demonstrates that it is not a closed market, as it is possible to see the participation of other interested contenders, such as India and the Republic of Korea.
In Figure 4, the explanation of countries’ profiles in SAF patents is continued. The graph illustrates the distribution of patents across various technology areas for different countries over the past five years (2019–2023), excluding the current year. The United States has a diverse range of patents, with significant shares in physics (39%), chemistry and metallurgy (27%), and mechanical engineering (27%).
China focuses heavily on chemistry and metallurgy (42%) and electricity (31%), with notable shares in physics (22%) and mechanical engineering (21%). The United Kingdom has a balanced distribution, particularly in human necessities (26%) and fixed constructions (26%). France emphasizes chemistry and metallurgy (41%) and physics (26%), while Germany shows a diversified portfolio, with leading areas in physics (29%) and chemistry and metallurgy (29%).
The European Patent Office (EPO) has a major focus on physics (54%). In Australia, physics (61%) and chemistry and metallurgy (37%) dominate. India emphasizes physics (54%) and chemistry and metallurgy (27%). Hong Kong (China) also focuses on physics (61%) and chemistry and metallurgy (39%). Canada, Finland, Japan, the Republic of Korea, and Austria have an overwhelming or exclusive focus on physics, with Canada, the Republic of Korea, and Austria dedicating 100% of their patents to this field. Overall, the chart highlights a global emphasis on physics in patent filings, with notable diversification in countries like the U.S., China, Germany, and France.
Furthermore, Figure 5 presents the number of solicited patents for each country per year from 2020 to 2023, revealing several key trends. In 2020, China was the only country with significant patent activity, but it did not continue this trend in subsequent years. The United States stands out as the dominant player in patent solicitations, especially in 2022, where it reached the highest count across all the years depicted. This dominance continued into 2023, with the U.S. maintaining its leading position in the patent landscape.
A notable spike in patent solicitations occurred in 2022 compared to other years, with a significant increase in activity from multiple countries. This year saw contributions from a diverse range of countries, including the United Kingdom, the Republic of Korea, Germany, France, the European Patent Office, China, Canada, and Australia, indicating a peak in global patent activity. In contrast, 2021 showed moderate patent activity, with the United States, United Kingdom, India, Finland, and the European Patent Office contributing to a balanced but smaller-scale distribution compared to 2022.
The number of patents solicited in 2023 was noticeably lower than in 2022. While the United States continued to lead, the overall number of patents solicited by other countries decreased significantly. Notably, countries like Japan and Hong Kong (China) only appear in the later years, specifically 2023, indicating their more recent engagement in patent solicitation activities.
Overall, the chart indicates that, while China had a strong presence in 2020, the United States consistently led in subsequent years, particularly peaking in 2022. The year 2022 marked a high point in global patent activity, with broad international participation, whereas 2023 showed a reduction in patent solicitations, suggesting a possible contraction or stabilization after the previous year’s surge.
The analysis extended to the distribution of patents across International Patent Classification (IPC) areas, aiming to uncover emerging trends and technological focus within the SAF domain. Figure 6 shows the diverse categorizations for the same patent number. Among the most prevalent IPC categories are chemistry and metallurgy (area C); mechanical engineering, lighting, heating, weapons, blasting (area F); and performing operations and transporting (area B). These categories represent the broad spectrum of technological innovations contributing to the advancement of SAF.
A further examination, depicted in Figure 7, illustrates the yearly evolution of IPCs in solicited patents, adding depth to the previous analysis. Notably, chemistry and metallurgy have maintained a consistent application rate over time, signifying steady research interest and continuous innovation in these foundational areas. Conversely, the category encompassing mechanical engineering, lighting, heating, weapons, and blasting experienced a significant surge in 2022, constituting 30.8% of all IPCs in SAF patents for that year. This sharp increase indicates a growing focus on engineering and mechanical solutions within the SAF field.
In summary, the examination of the database has provided valuable insights into the distribution and evolution of SAF patents in recent years. The dataset, despite its 136 patents, reveals that only a small fraction predates 2019, indicating a recent surge in patent activity reflective of accelerated innovation. The United States, China, and the United Kingdom emerged as dominant players in the global landscape of SAF patent registration. The analysis of IPC areas reveals distinct patterns, with chemistry and metallurgy; mechanical engineering, lighting, heating, weapons, blasting; and performing operations and transporting emerging as prominent categories. As illustrated by the yearly evolution of IPCs, the dynamic nature of patent distribution further enriches the understanding of emerging trends and areas of innovation within the field.

4.2. SAF Complex Network Analysis

The graph in Figure 8 connects enterprises and universities (patent assignees) to the International Patent Classification (IPC) codes that the patent was registered with. The green nodes represent the universities, and the width of the edge represents the number of patents each assignee has registered in the area.
The thickness of each edge connecting a node to an IPC indicates the volume of patents registered by each assignee within that specific field of technology. Thicker edges represent a higher quantity of patents, thus shedding light on the active involvement and specialized knowledge of the assignees in the particular IPC category.
This visual representation serves as a valuable tool for gaining insights into the pattern of distribution and the level of concentration of patent-related activities across organizations and their corresponding areas of research focus. Through the analysis of these interconnections, it becomes possible to pinpoint the major contributors in distinct technological sectors and identify potential opportunities for collaboration and areas that may give rise to competition.
In the section of the graph depicted in Figure 9, it is possible to see that the Rolls-Royce company (RORO-C) has many patents in multiple areas that have no other competitors and that these IPCs are connected to related IPCs that universities are exploring, suggesting potential cooperation between these entities.
The distribution demonstrates Rolls-Royce’s establishment of a dominant presence in specific technological fields, indicating the company has achieved a strong foothold. Concurrently, universities are seen to be actively involved in research areas closely related to those of the company. The interconnected nature of these International Patent Classifications (IPCs) underscores the potential for collaborative efforts in research and development.
If realized, this collaboration has the potential to transfer knowledge between industry and academia, ultimately leading to the enhancement of innovation processes and the driving force behind advancements in the aforementioned fields. Such a symbiotic relationship holds the promise of yielding the development of novel technologies and reinforcing intellectual property portfolios for both Rolls-Royce and the participating academic institutions.
The degree centrality analysis was conducted to identify key nodes in the graph, focusing specifically on IPC nodes. This analysis aimed to pinpoint those nodes with the most direct connections to others, thereby highlighting their importance and influence within the network.
The analysis yielded data that provides insights into the central roles played by specific IPC nodes. The results of this degree centrality analysis are consolidated in Table 4, which illustrates the top five significant degree centrality measurements for IPC nodes. It has been previously noted that node C10G demonstrates the highest degree of centrality in this examination. This implies that node C10G establishes the most immediate associations with other nodes within the framework, thereby strengthening its central position.
The predominance of C10G in relation to degree centrality accentuates its significance and impact within the system, which indicates that it likely functions as a pivotal focal point for engagements. This status emphasizes the role of C10G in enabling communication and linkages among IPC nodes.
Furthermore, Table 5 depicts the top five influential degree centrality metrics for assignee nodes. It is apparent from the data that RORO-C possesses the highest degree of centrality, demonstrating its prominent position within the network. The centrality of RORO-C implies a strong connection with other nodes and emphasizes its role in shaping the network. Similarly, the UNBA-C institution displays a noteworthy degree of centrality, emphasizing its significance and impact within the network. These results highlight the critical roles played by both RORO-C and UNBA-C in the network.
According to Figure 10, the most popular IPC (degree centrality = 0.2021) within the dataset is C10G, as shown in Table 4 (cracking hydrocarbon oils; production of liquid hydrocarbon mixtures, e.g., by destructive hydrogenation, oligomerization, polymerization (cracking to hydrogen or synthesis gas C01B; cracking or pyrolysis of hydrocarbon gases to individual hydrocarbons or mixtures thereof of definite or specified constitution C07C; cracking to cokes C10B); recovery of hydrocarbon oils from oil-shale, oil-sand, or gases; refining mixtures mainly consisting of hydrocarbons; reforming of naphtha; mineral waxes), having 22 edges connecting assignees to it, suggesting potential exhaustion.
By analyzing Figure 11, it becomes apparent that the highlighted patent family 10—“Production of liquid fuel, e.g., naphtha, involves supplying organic raw material containing polymer waste, introducing an inert gas, decomposing raw material, and discharging with a carrier gas, cooling non-solid cracked components, reforming, and distilling reformed oil” (WO2022220246-A1; JP2023514656-X; CA3216230-A1; KR2023170005-A; CN117396582-A; IN202347076905-A; EP4324898-A1), depicted by the largest triangle that is linked to the most targeted IPC (C10G), may be an opportunity for countries that are interested in the field to start off at, since it is an indicator of strength and success of a patent’s family.
For nations that have an interest in this particular field, concentrating on this specific patent family could yield a strategic point of origin. The evident presence of this patent family implies a degree of creativity and the potential for commercial growth; therefore, it provides a point of reference for individuals who are new to the field. Through utilizing the insights derived from this dominant patent family, industries have the opportunity to align their endeavors in research and development in order to capitalize on existing strengths and potentially acquire a competitive advantage within the domain, as demonstrated in Table 6.
Figure 12 shows that the biggest patent families are associated with the Rolls-Royce company, and it solely dominates the B64D IPC, which is connected to most of its patents. There are only two universities that also have patents connecting the network to the other communities, thereby indicating a restricted level of competition within this sector.
Moreover, the presence of two academic institutions that possess patents linking the network to various other communities implies a certain level of scholarly engagement; nonetheless, it is evident that market dominance predominantly rests with Rolls-Royce and the aforementioned two companies. The dominance of Rolls-Royce, alongside the limited involvement of other organizations, serves to underscore the corporation’s firm grip and potential sway over trends in innovation and development within the B64D IPC sector. The argument strongly suggests that this market control accentuates the necessity for monitoring competitive dynamics for broader participation to cultivate a competitive landscape for innovation.
Related to the subset of “WO” requests, Figure 13 segregates the “WO” applications for a clearer view of what is on the radar for the upcoming years. From the 73 entries extracted from the database, 9 or 12.32% are strictly “WO” applications and have not yet been patented anywhere in the world. It is important to address that these particular applications have not yet been granted patents in any other jurisdiction worldwide. The main point is that the segregation highlights the potential for novel and unique inventions that are currently under the global patenting process awaiting further examination and approval.
Subsequently, Figure 14 focuses on two applications that are about to expire and belong to the same company under the same IPCs. The fact that these applications are expiring simultaneously and pertain to the same technological domain may indicate several underlying issues. It could suggest a possible stagnation in the company’s innovative capabilities, where they have not developed significant advancements or improvements to warrant new or extended patent protections. Alternatively, it might reflect a lack of market interest or commercial viability for the technologies covered by these patents, leading the company to let them lapse rather than invest in their renewal or in further innovation.
Concerning the WO2024030611A2 and WO2024030611A3 applications, these are referenced as the reactants comprising lignin and hydrogen. Even though, in recent years, significant progress has been made towards the development of active electrocatalysts and the engineering of cell configuration, its kinetics remain lower than the ones involved in traditional water electrolysis by several orders of magnitude [64]. Therefore, this argument suggests that this type of technology may not be considered innovative enough for publication.
Likewise, the “WO” application entitled WO2023222798A1 demonstrates the same dilemma. Although efforts have been made, Zhu et al. [65] show that the use of a reverse water gas shift catalyst provokes a methanation side reaction on various catalysts. As a result, a mixture of CO and CH4 products forms, thereby burdening subsequent separation processes. In addition, the authors note the need for studies to focus on the reaction mechanism of catalysts in these processes, such as the ones used in this application. These scenarios highlight the potential challenges the companies face in maintaining their competitive edge and emphasize the importance of continuous research and development in sustaining technological and market leadership.
Finally, in Figure 15, attention is drawn to the collaboration between ALLU-C and UYNC-C, which hold expertise in nine areas. A possible new partnership could happen between ALLU-C and NUTE-Non-Standard since they share a common interest in the C12P IPC. This could indicate that, if they happen to be competitors and have no interest in collaborating with each other, then the suggested partnership would be between UYNC-C and NUTE-Non-Standard.
Ultimately, this subset of “WO” applications represents a significant portion of the total entries and underscores the potential for future innovation and patent filings in these areas. By isolating these “WO” applications, researchers and stakeholders can focus their attention on emerging technologies and trends that have not yet been fully resolved or protected. This targeted approach enables proactive monitoring and strategic planning to capitalize on emerging opportunities in the patent domain.

5. Conclusions

In conclusion, the aviation industry faces significant challenges in transitioning to more environmentally friendly practices. While sustainable aviation fuels show promise, there are technological, economic, and political obstacles that need to be overcome. Accordingly, drop-in fuels offer the most immediate and viable solution because they are compatible with current aircraft engines and infrastructure. However, their widespread adoption is constrained by questions of economic viability, development difficulties, and regulatory hurdles. Hence, a combination of technological advances, supportive governmental measures, and effective policy instruments will be crucial factors in driving the aviation industry toward decarbonization.
Hence, using graph theory in patent analysis has provided a deeper understanding of patent networks and how SAF can bring about innovation. These advances have shown how graph-theoretic approaches can trace patterns, trends, and connections within extensive patent collections. Graph clustering algorithms, embedding techniques, and interactive visualizations have revealed the relationships between patents and companies.
Furthermore, the illustration of SAF underscores the pivotal role of policy-making and technological ingenuity in making environmentally sustainable practices acceptable. The amalgamation of graph analysis with SAF patent data reveals the current status of technological progress and sheds light on future prospects for investigation.
Fostering collaboration between industry and policymakers and harnessing advanced visualization techniques can accelerate the shift toward a sustainable and competitive frontier. Ultimately, the convergence of graph theory with patent analysis demarcates a clear boundary for innovation by providing instruments for researchers, policymakers, and industrial stakeholders to navigate and exert influence on the evolving pattern of technological progress.
Future research should focus on investigating collaboration networks within patent data, as this will reveal key players and influential partnerships, as well as show the opportunities for fostering cooperation in innovation. Additionally, an analysis based on the combination of patent analysis with an examination of the articles may provide a methodology for giving opportunities for innovation, especially in specific countries, and leverage them to carry out strategic decision-making.

Author Contributions

Methodology, M.N.d.O., L.R.M. and G.D.B.; Formal analysis, M.N.d.O., L.R.M. and P.H.d.S.M.; Data curation, G.F.V. and G.M.S.; Writing—original draft, M.N.d.O., L.R.M. and P.H.d.S.M.; Writing—review & editing, G.F.V., G.M.S. and V.P.G.; Supervision, V.P.G.; Project administration, A.L.M.S. and C.N. All authors have read and agreed to the published version of the manuscript.

Funding

The APC was funded by University of Brasilia (UnB).

Data Availability Statement

The original contributions presented in the study are included in the following URL: https://github.com/Matheusmno/TGP1/ (accessed on 27 May 2024).

Acknowledgments

The authors would like to thank the Brazilian National Confederation of Industry (CNI) for partially supporting this project and for their support and collaboration throughout this research project.

Conflicts of Interest

The authors declare no conflicts of interest.

References

  1. Akpan, J.; Olanrewaju, O. Sustainable Energy Development: History and Recent Advances. Energies 2023, 16, 7049. [Google Scholar] [CrossRef]
  2. Wang, F.; Harindintwali, J.D.; Yuan, Z.; Wang, M.; Wang, F.; Li, S.; Yin, Z.; Huang, L.; Fu, Y.; Li, L.; et al. Technologies and perspectives for achieving carbon neutrality. Innovation 2021, 2, 100180. [Google Scholar] [CrossRef]
  3. Caldeira, A.A.; Wilbert, M.D.; Moreira, T.B.S.; Serrano, A.L.M. Brazilian State debt sustainability: An analysis of net debt and primary balance; [Sustainability of Brazilian state debt: An analysis of the relationship between net debt and primary result]; [Sustainability of the debt of the Brazilian states: An analysis of the net debt and the primary balance]. Public Adm. Mag. 2016, 50, 285–306. [Google Scholar] [CrossRef]
  4. Ray, P. Renewable energy and sustainability. Clean Technol. Environ. Policy 2019, 21, 1517–1533. [Google Scholar] [CrossRef]
  5. Bustamante, M.M.; Silva, J.S.; Scariot, A.; Sampaio, A.B.; Mascia, D.L.; Garcia, E.; Sano, E.; Fernandes, G.W.; Durigan, G.; Roitman, I.; et al. Ecological restoration as a strategy for mitigating and adapting to climate change: Lessons and challenges from Brazil. Mitig. Adapt. Strateg. Glob. Chang. 2019, 24, 1249–1270. [Google Scholar] [CrossRef]
  6. Cucchiella, F.; Condemi, A.; Rotilio, M.; Annibaldi, V. Energy Transitions in Western European Countries: Regulation Comparative Analysis. Energies 2021, 14, 3940. [Google Scholar] [CrossRef]
  7. Chou, C.H.; Ngo, S.L.; Tran, P.P. Renewable Energy Integration for Sustainable Economic Growth: Insights and Challenges via Bibliometric Analysis. Sustainability 2023, 15, 15030. [Google Scholar] [CrossRef]
  8. Kullmann, F.; Markewitz, P.; Stolten, D.; Robinius, M. Combining the worlds of energy systems and material flow analysis: A review. Energy Sustain. Soc. 2021, 11, 13. [Google Scholar] [CrossRef]
  9. Stergiou, E.; Rigas, N.; Zaroutieri, E.; Kounetas, K. Energy, renewable and technical efficiency convergence: A global evidence. Econ. Chang. Restruct. 2023, 56, 1601–1628. [Google Scholar] [CrossRef]
  10. Cabrera, E.; de Sousa, J.M.M. Use of Sustainable Fuels in Aviation—A Review. Energies 2022, 15, 2440. [Google Scholar] [CrossRef]
  11. Abrantes, I.; Ferreira, A.F.; Silva, A.; Costa, M. Sustainable aviation fuels and imminent technologies—CO2 emissions evolution towards 2050. J. Clean. Prod. 2021, 313, 127937. [Google Scholar] [CrossRef]
  12. Yusaf, T.; Fernandes, L.; Abu Talib, A.R.; Altarazi, Y.S.M.; Alrefae, W.; Kadirgama, K.; Ramasamy, D.; Jayasuriya, A.; Brown, G.; Mamat, R.; et al. Sustainable Aviation—Hydrogen Is the Future. Sustainability 2022, 14, 548. [Google Scholar] [CrossRef]
  13. Gray, N.; McDonagh, S.; O’Shea, R.; Smyth, B.; Murphy, J.D. Decarbonising ships, planes and trucks: An analysis of suitable low-carbon fuels for the maritime, aviation and haulage sectors. Adv. Appl. Energy 2021, 1, 100008. [Google Scholar] [CrossRef]
  14. Henning, M.A.; van Vuuren, J.H. Eulerian graphs. In Graph and Network Theory: An Applied Approach Using Mathematica®; Springer: Cham, Switzerland, 2022; pp. 293–322. [Google Scholar]
  15. Qin, Z.; Zhang, H.; Qin, X.; Xu, K.; Dimitrov, K.N.A.; Wang, G.; Yu, W.; Qin, Z.; Zhang, H.; Qin, X.; et al. The history of computing. In Fundamentals of Software Culture; Springer: Singapore, 2018; pp. 1–36. [Google Scholar]
  16. Gan, W.; Sun, Y.; Sun, Y. Knowledge structure enhanced graph representation learning model for attentive knowledge tracing. Int. J. Intell. Syst. 2022, 37, 2012–2045. [Google Scholar] [CrossRef]
  17. Adadi, A. A survey on data-efficient algorithms in big data era. J. Big Data 2021, 8, 24. [Google Scholar] [CrossRef]
  18. Gross, J.L.; Yellen, J. Graph Theory and Its Applications; Chapman and Hall/CRC: Boca Raton, FL, USA, 2019. [Google Scholar]
  19. Ma, D.; Yu, Q.; Li, J.; Ge, M. Innovation diffusion enabler or barrier: An investigation of international patenting based on temporal exponential random graph models. Technol. Soc. 2021, 64, 101456. [Google Scholar] [CrossRef]
  20. Yang, W.; Yu, X.; Zhang, B.; Huang, Z. Mapping the landscape of international technology diffusion (1994–2017): Network analysis of transnational patents. J. Technol. Transf. 2021, 46, 138–171. [Google Scholar] [CrossRef]
  21. Bispo, G.D.; Vergara, G.F.; Saiki, G.M.; Martins, P.H.d.S.; Coelho, J.G.; Rodrigues, G.A.P.; Oliveira, M.N.d.; Mosquéra, L.R.; Gonçalves, V.P.; Neumann, C.; et al. Automatic Literature Mapping Selection: Classification of Papers on Industry Productivity. Appl. Sci. 2024, 14, 3679. [Google Scholar] [CrossRef]
  22. Maskittou, M.; El Haddadi, A.; Routaib, H. Feature Learning of Patent Networks Using Tensor Decomposition. In Innovations in Smart Cities Applications Volume 4: The Proceedings of the 5th International Conference on Smart City Applications; Springer: Cham, Switzerland, 2021; pp. 1375–1390. [Google Scholar]
  23. Wang, Y.; Richard, R.; McDonald, D. Competitive analysis with graph embedding on patent networks. In Proceedings of the 2020 IEEE 22nd Conference on Business Informatics (CBI), Antwerp, Belgium, 22–24 June 2020; Volume 1, pp. 10–19. [Google Scholar]
  24. Ding, W.; Wang, J.; Zhu, H. Using graph representations for semantic information extraction from chinese patents. In Proceedings of the 2019 3rd International Symposium on Computer Science and Intelligent Control, New York, NY, USA, 25–27 September 2019; pp. 1–5. [Google Scholar]
  25. Björkqvist, S.; Kallio, J. Building a graph-based patent search engine. In Proceedings of the 46th International ACM SIGIR Conference on Research and Development in Information Retrieval, Taipei, Taiwan, 23–27 July 2023; pp. 3300–3304. [Google Scholar]
  26. Liu, W.; Zhang, H.; Guo, X.; Han, Y. Graph Convolutional Network Based Patent Issue Discovery Model. In Proceedings of the 2021 International Joint Conference on Neural Networks (IJCNN), Virtual, 18–22 July 2021; pp. 1–8. [Google Scholar]
  27. Trappey, A.J.; Trappey, C.V.; Liang, C.P.; Lin, H.J. IP Analytics and Machine Learning Applied to Create Process Visualization Graphs for Chemical Utility Patents. Processes 2021, 9, 1342. [Google Scholar] [CrossRef]
  28. Jun, S. Patent Big Data Analysis using Graph Theory. Adv. Sci. Technol. Lett. 2015, 85, 25–28. [Google Scholar]
  29. Lee, J.; Lee, J.; Kang, J.H.; Park, S.; Jun, S.; Jang, D. A Study on Visualization of Technology Transfer using Distance based Patent Network Analysis. In Proceedings of the 9th International Conference on Information Communication and Management, Prague, Czech Republic, 23–26 August 2019; pp. 66–69. [Google Scholar]
  30. Yan, B.; Luo, J. Filtering patent maps for visualization of diversification paths of inventors and organizations. J. Assoc. Inf. Sci. Technol. 2017, 68, 1551–1563. [Google Scholar] [CrossRef]
  31. Kay, L.; Porter, A.L.; Youtie, J.; Newman, N.; Ràfols, I. Visual analysis of patent data through global maps and overlays. In Current Challenges in Patent Information Retrieval; Springer: Berlin/Heidelberg, Germany, 2017; pp. 281–295. [Google Scholar]
  32. Rodriguez, A.; Kim, B.; Turkoz, M.; Lee, J.M.; Coh, B.Y.; Jeong, M.K. New multi-stage similarity measure for calculation of pairwise patent similarity in a patent citation network. Scientometrics 2015, 103, 565–581. [Google Scholar] [CrossRef]
  33. Leavitt, H. Some Effects of Certain Communication Patterns on Group Performance. J. Abnorm. Soc. Psychol. 1951, 46, 38–50. [Google Scholar] [CrossRef]
  34. Freeman, L.C.; Roeder, D.; Mulholland, R.R. Centrality in social networks: II. experimental results. Soc. Netw. 1979, 2, 119–141. [Google Scholar] [CrossRef]
  35. Freeman, L.C. Centrality in social networks conceptual clarification. Soc. Netw. 1978, 1, 215–239. [Google Scholar] [CrossRef]
  36. Metcalf, L.; Casey, W. Chapter 5—Graph theory. In Cybersecurity and Applied Mathematics; Metcalf, L., Casey, W., Eds.; Syngress: Boston, MA, USA, 2016; pp. 67–94. [Google Scholar] [CrossRef]
  37. Everett, M.G.; Borgatti, S.P. The centrality of groups and classes. J. Math. Sociol. 1999, 23, 181–201. [Google Scholar] [CrossRef]
  38. Mahmood, A.R.; Abdullah, M.R.; Khalaf, H.S. Biofuel Production and Its Impact on Global Food Security: A Review Article. Iraqi J. Ind. Res. 2022, 9, 75–83. [Google Scholar] [CrossRef]
  39. Jamwal, V.L.; Kapoor, N.; Gandhi, S.G. Biotechnology of biofuels: Historical overview, business outlook and future perspectives. In Biotechnology Business-Concept to Delivery; Springer: Cham, Switzerland, 2020; pp. 109–127. [Google Scholar]
  40. Sultana, S.; Nur, A.A.; Khan, S.; Ambati, R.R.; Gokare Aswathanarayana, R. Biofuels as Economic Security for the Poor. In Biofuels in Circular Economy; Springer: Singapore, 2023; pp. 201–218. [Google Scholar]
  41. Eswaran, N.; Parameswaran, S.; Johnson, T. Biofuels and sustainability. In Biofuels and Biodiesel; Humana: New York, NY, USA, 2021; pp. 317–342. [Google Scholar]
  42. Ng, K.S.; Farooq, D.; Yang, A. Global biorenewable development strategies for sustainable aviation fuel production. Renew. Sustain. Energy Rev. 2021, 150, 111502. [Google Scholar] [CrossRef]
  43. United State’s Department of Energy. Alternative Fuels Data Center-Sustainable Aviation Fuel. 2023. Available online: https://afdc.energy.gov/fuels/sustainable-aviation-fuel (accessed on 16 May 2024).
  44. Qasem, N.A.; Mourad, A.; Abderrahmane, A.; Said, Z.; Younis, O.; Guedri, K.; Kolsi, L. A recent review of aviation fuels and sustainable aviation fuels. J. Therm. Anal. Calorim. 2024, 149, 4287–4312. [Google Scholar] [CrossRef]
  45. Antar, M.; Lyu, D.; Nazari, M.; Shah, A.; Zhou, X.; Smith, D.L. Biomass for a sustainable bioeconomy: An overview of world biomass production and utilization. Renew. Sustain. Energy Rev. 2021, 139, 110691. [Google Scholar] [CrossRef]
  46. Prabhansu; Kumar, N. Biomass as Emerging Renewable: Challenges and Opportunities. In Renewable Energy for Sustainable Growth Assessment; John Wiley & Sons, Ltd.: Hoboken, NJ, USA, 2022; Chapter 1; pp. 1–23. [Google Scholar] [CrossRef]
  47. Barot, S. Biomass and Bioenergy: Resources, Conversion and Application. In Renewable Energy for Sustainable Growth Assessment; John Wiley & Sons, Ltd.: Hoboken, NJ, USA, 2022; Chapter 9; pp. 243–262. [Google Scholar] [CrossRef]
  48. Malla, F.A.; Bandh, S.A.; Wani, S.A.; Hoang, A.T.; Sofi, N.A. Biofuels: Potential Alternatives to Fossil Fuels. In Biofuels in Circular Economy; Bandh, S.A., Malla, F.A., Eds.; Springer Books; Springer: Singapore, 2022; pp. 1–15. [Google Scholar] [CrossRef]
  49. Carpanez, T.; Moreira, V.; Assis, I.; Amaral, M. Sugarcane vinasse as organo-mineral fertilizers feedstock: Opportunities and environmental risks. Sci. Total Environ. 2022, 832, 154998. [Google Scholar] [CrossRef]
  50. Sundaram, T.; Rajendran, S.; Gnanasekaran, L.; Rachmadona, N.; Jiang, J.J.; Khoo, K.S.; Show, P.L. Bioengineering strategies of microalgae biomass for biofuel production: Recent advancement and insight. Bioengineered 2023, 14, 2252228. [Google Scholar] [CrossRef] [PubMed]
  51. Widyati, E.; Nuroniah, H.S.; Tata, H.L.; Mindawati, N.; Lisnawati, Y.; Darwo; Abdulah, L.; Lelana, N.E.; Mawazin.; Octavia, D.; et al. Soil Degradation Due to Conversion from Natural to Plantation Forests in Indonesia. Forests 2022, 13, 1913. [Google Scholar] [CrossRef]
  52. Kandaramath Hari, T.; Yaakob, Z.; Binitha, N.N. Aviation biofuel from renewable resources: Routes, opportunities and challenges. Renew. Sustain. Energy Rev. 2015, 42, 1234–1244. [Google Scholar] [CrossRef]
  53. Ângelo, H.; De Almeida, A.N.; Serrano, A.L.M. Determinants of Brazil’s demand of pulpwood; [Determinantes da demanda de madeira em toras para celulose no Brasil]. Sci. For. Sci. 2009, 37, 491–498. [Google Scholar]
  54. Shehab, M.; Moshammer, K.; Franke, M.; Zondervan, E. Analysis of the Potential of Meeting the EU’s Sustainable Aviation Fuel Targets in 2030 and 2050. Sustainability 2023, 15, 9266. [Google Scholar] [CrossRef]
  55. Tomar, M.; Abraham, A.; Kim, K.; Mayhew, E.; Lee, T.; Brezinsky, K.; Lynch, P. Bio-derived sustainable aviation fuels—On the verge of powering our future. In Combustion Chemistry and the Carbon Neutral Future; Elsevier: Amsterdam, The Netherlands, 2023; pp. 521–598. [Google Scholar]
  56. Mäki-Arvela, P.; Aho, A.; Simakova, I.; Yu. Murzin, D. Sustainable Aviation Fuel from Syngas through Higher Alcohols. ChemCatChem 2022, 14, e202201005. [Google Scholar] [CrossRef]
  57. Detsios, N.; Theodoraki, S.; Maragoudaki, L.; Atsonios, K.; Grammelis, P.; Orfanoudakis, N.G. Recent advances on alternative aviation fuels/pathways: A critical review. Energies 2023, 16, 1904. [Google Scholar] [CrossRef]
  58. Deuber, R.d.S.; Bressanin, J.M.; Fernandes, D.S.; Guimarães, H.R.; Chagas, M.F.; Bonomi, A.; Fregolente, L.V.; Watanabe, M.D.B. Production of Sustainable Aviation Fuels from Lignocellulosic Residues in Brazil through Hydrothermal Liquefaction: Techno-Economic and Environmental Assessments. Energies 2023, 16, 2723. [Google Scholar] [CrossRef]
  59. Lai, Y.Y.; Karakaya, E.; Björklund, A. Employing a socio-technical system approach in prospective life cycle assessment: A case of large-scale Swedish sustainable aviation fuels. Front. Sustain. 2022, 3, 912676. [Google Scholar] [CrossRef]
  60. Liu, S. Development Prospect of Sustainable Aviation Fuel. In Annual Report on China’s Petroleum, Gas and New Energy Industry (2021); Springer: Singapore, 2022; pp. 265–276. [Google Scholar]
  61. Seçilmiş, N. Sustainable Aviation Based on Innovation. In Corporate Governance, Sustainability, and Information Systems in the Aviation Sector, Volume I; Springer: Singapore, 2022; pp. 93–119. [Google Scholar]
  62. Korkut, E.; Fowler, L.B. Regulatory and policy analysis of production, development and use of sustainable aviation fuels in the United States. Front. Energy Res. 2021, 9, 750514. [Google Scholar] [CrossRef]
  63. World Intellectual Property Organization. Patent Cooperation Treaty (PCT). 2022. Available online: https://www.wipo.int/export/sites/www/pct/en/docs/texts/ai.pdf (accessed on 12 May 2024).
  64. González-Cobos, J.; Prévot, M.S.; Vernoux, P. Electrolysis of lignin for production of chemicals and hydrogen. Curr. Opin. Electrochem. 2023, 39, 101255. [Google Scholar] [CrossRef]
  65. Zhu, M.; Ge, Q.; Zhu, X. Catalytic reduction of CO2 to CO via reverse water gas shift reaction: Recent advances in the design of active and selective supported metal catalysts. Trans. Tianjin Univ. 2020, 26, 172–187. [Google Scholar] [CrossRef]
Figure 1. Methodological framework.
Energies 17 03683 g001
Figure 2. Solicited patents’ evolution.
Energies 17 03683 g002
Figure 3. Patents per country.
Energies 17 03683 g003
Figure 4. Countries’ technology area profiles.
Energies 17 03683 g004
Figure 5. Patents solicited in each country per year.
Energies 17 03683 g005
Figure 6. Percentage of IPC tech areas.
Energies 17 03683 g006
Figure 7. Evolution of IPC tech. Areas in solicited patents.
Energies 17 03683 g007
Figure 8. IPC/assignee social network graph overview.
Energies 17 03683 g008
Figure 9. Rolls-Royce dominance and university leaf nodes (cropped/zoomed in).
Energies 17 03683 g009
Figure 10. Most targeted IPCs in SAF (cropped/zoomed in).
Energies 17 03683 g010
Figure 11. Most relevant patent family from C10G highlighted.
Energies 17 03683 g011
Figure 12. Rolls-Royce cluster.
Energies 17 03683 g012
Figure 13. IPC–Assignee–Written Opinion network.
Energies 17 03683 g013
Figure 14. Applications close to expiration.
Energies 17 03683 g014
Figure 15. Collaboration between a university and a company across multiple IPCs.
Energies 17 03683 g015
Table 1. Comparative studies.
Ref.YearAdvantagesLimitations
[18]2019Provides a foundational understanding of graph theory and its applications in various fieldsNot specifically focused on graph theory-based patent analysis
[19]2021Offers a graph-theoretic method for visualizing and analyzing patentsEstimation intensive to model specification, potentially affecting the robustness of the results
[20]2021Identifies transnational patents at the national level to depict the profiles of international technology diffusionDifficulty tracking development trends in different technologies
[22]2021Enables creation of patent networks using clustering algorithms, providing insights into connections between patents and companiesDifficulty extracting relevant information from technical patents
[23]2020Uses graph embedding techniques to understand competitive dynamics between firms through patent networksRapid growth of patent data (big data) makes analysis complex
[24]2019Proposes graph representation strategies for automatic semantic data extraction from patents, aiding intelligent patent analysisExisting methods like text mining and keyword analysis for patent similarity have limitations
[25]2023Efficiently searches technical documents and mimics work of professional patent examinersRequires domain knowledge to analyze documents
[26]2021Identifies and tags “issue sentences” (problems addressed by patents)Complexity of understanding technical patents
[27]2021Uses text mining and machine learning to automatically extract and visualize chemical processes from patentsRapid growth of patent data (big data)
[28]2015Proposes a graph model for visualizing patent dataLimitations of existing approaches like text mining and keyword analysis for patent similarity
[29]2019Visualizes patent portfolio strategies and aids in identifying similar technologies and protecting intellectual propertyDifficulty extracting relevant information from technical patents
[30]2017Improves explanatory power of network on inventor and organization diversification paths through filtering weak linksThe trade-off between removing weak links and maintaining the explanatory power of the network
[31]2017Enables comparison of molecules from patents with other bioactive compounds, facilitates exploration of structure–activity relationships, and enhances understanding of patent information within the broader bioactive chemical spaceFocuses on bioactive chemical patents; may not be generalizable
Table 2. SAF production pathways.
Production PathwayFeedstockBrief DescriptionYear of Approval
Fischer–Tropsch Synthetic Paraffinic Kerosene (FT-SPK)Municipal solid waste, agricultural and forest wastes, energy cropsConversion of feedstock to syngas using gasification, then a Fischer–Tropsch synthesis reaction converts the syngas to jet fuel.2009
Hydroprocessed Esters and Fatty Acids (HEFA-SPK)Oil-based feedstocksTriglyceride feedstocks are hydroprocessed to break apart the long chain of fatty acids, followed by hydroisomerization and hydrocracking.2011
Hydroprocessed Fermented Sugars to Synthetic Isoparaffins (HFS-SIP)SugarsMicrobial conversion of sugars to hydrocarbons.2014
FT-SPK with AromaticsMunicipal solid waste, agricultural and forest wastes, energy cropsBiomass is converted to syngas, then to synthetic paraffinic kerosene and aromatics by FT synthesis. This process is similar to FT-SPK but with the addition of aromatic components.2015
Alcohol-to-Jet Synthetic Paraffinic Kerosene (ATJ-SPK)Cellulosic biomassConversion of cellulosic or starchy alcohol into a drop-in fuel through a series of chemical reactions—dehydration, hydrogenation, oligomerization, and hydro treatment.2016
Catalytic Hydrothermolysis Synthesized Kerosene (CH-SK or CHJ)Fatty acids or fatty acid esters or lipids from fat oil greasesClean-free fatty acid oil from processing waste oils or energy oils is combined with preheated feed water and then passed to a catalytic hydrothermolysis reactor.2020
Hydrocarbon-Hydroprocessed Esters and Fatty Acids (HC-HEFA-SPK)Algal oilConversion of the triglyceride oil, derived from Botryococcus braunii, into jet fuel and other fractionations. Botryococcus braunii is a high-growth alga that produces triglyceride oil.2020
Synthesized by the authors, based on U.S. Department of Energy [43].
Table 3. Derwent column code descriptions.
Derwent CodeDescription
PNPatent Number
TITitle
AUAuthors or Inventors
AEPatent Assignee
GAIDS Number
ABAbstract/BHTD Critical Abstract
TFTechnology Focus Abstract
EAEarly access date; Equivalent Abstract
DCDerwent Class Code(s)
MCMajor Concepts or Derwent Manual Code(s)
IPInternational Patent Classification
PDPublication Date; Patent Details
ADApplication Details and Date
FDFurther Application Details
PIPublisher City; Patent Priority Information
DSDesignated States
FSField of Search
CPCited Patent(s)
CRCited References
DNDCR Number
MNMarkush Number
RIResearcher IDs; Ring Index Number
CIDerwent Compound Number
RGDerwent Registry Number
Table 4. Top five degree centrality measures for IPC nodes.
IPC NodeDegree Centrality
C10G0.2021
B01D0.1596
C01B0.1383
C10L0.1170
B01J0.1064
Table 5. Top five degree centrality measures for assignee nodes.
Assignee NodeDegree Centrality
RORO-C0.1702
UNBA-C0.1277
KEPL-Non-standard0.0638
PARA-Non-standard0.0532
CAEC-C0.0426
Table 6. Top five degree centrality values for patent nodes.
Patent Node IDDegree Centrality
680.0779
500.0584
480.0455
670.0390
00.0325
Disclaimer/Publisher’s Note: The statements, opinions and data contained in all publications are solely those of the individual author(s) and contributor(s) and not of MDPI and/or the editor(s). MDPI and/or the editor(s) disclaim responsibility for any injury to people or property resulting from any ideas, methods, instructions or products referred to in the content.

