Article

Power and Energy Losses in Medium-Voltage Power Grids as a Function of Current Asymmetry—An Example from Poland

by
Grzegorz Hołdyński
,
Zbigniew Skibko
and
Wojciech Walendziuk
*
Faculty of Electrical Engineering, Bialystok University of Technology, Wiejska 45D, 15-351 Bialystok, Poland
*
Author to whom correspondence should be addressed.
Energies 2024, 17(15), 3706; https://doi.org/10.3390/en17153706
Submission received: 25 June 2024 / Revised: 24 July 2024 / Accepted: 25 July 2024 / Published: 27 July 2024

Abstract

:
In connection with the growing requirements regarding the quality and continuity of energy supply and the dynamic development of renewable energy sources, the need for a thorough analysis of factors affecting power and energy losses and the effectiveness of the MV network increases. One of the biggest challenges in managing power networks is the problem of load asymmetry. Load asymmetry can lead to numerous adverse phenomena, such as increased power losses, deterioration of the quality of energy supplied, and an increased risk of network failure. Despite various research on this issue, there is still a need for a more accurate understanding of mechanisms leading to the development of methods of minimizing these phenomena. The relationships describing power losses in lines and power transformers are widely known. However, most published analyzes assume the same load on each phase. If the asymmetrical load of the line already appears, such analysis is not based on the data of actual lines and applies to a homogeneous line with equal load along its entire length. Therefore, the authors decided to modify the method of calculating power losses so that they can be determined in a branched line loaded in many points, with knowledge of the current flowing into the line, its length, and the number of acceptances. This method allows for the determination of power losses in an innovative way, taking into account line load asymmetry. The use of relationships commonly available in the literature to determine power losses leads to errors of 5.54% (compared to the actual, measured losses). Taking into account both the asymmetry and multi-point loading in the method proposed by the authors allows us to limit this error to 3.91%. To estimate the impact of asymmetry on power losses in lines and power transformers, the authors performed field tests in the selected medium voltage power network. The increase in power losses determined on their basis caused by the asymmetry of the load currents obtained values from 0.03% to 4.78%. Using generally known methods of reducing asymmetry, these losses can be avoided, and therefore the energy transmission costs may be reduced, and the greenhouse gas emissions might be lowered.

1. Introduction

Energy transformation occurring in recent years also applies to distribution networks, where a rapid increase in the power of solar installations (PV—photovoltaics), small wind turbines, electric heating systems (heat pumps and electric boilers), and electric vehicle charging stations (EV—Electric Vehicle) can be easily observed [1,2,3]. This situation creates a challenge for the existing network infrastructure, which must now cope with heavy loads and energy production. One main challenge is maintaining the level of energy quality parameters, including symmetry and sinusoidal voltage. Single-phase PV installations commonly installed in low-voltage networks can introduce load asymmetry. In addition, inverters can generate harmonic currents, and variable loads can cause a voltage flicker effect [4]. The Electricity Distribution Network Codes in force in many countries do not verify voltage asymmetry in individual phases [5,6]. Maintenance of line-to-line voltage asymmetry within the limits required by regulations does not guarantee that voltages in individual phases will not exceed the permissible values [7,8]. One of the methods for influencing the voltage value in the network is the active [9,10] or passive [11,12] power regulation produced in photovoltaic power plants. The effectiveness of both methods depends on the network structure, and the transmission of reactive power involves additional power losses in the electricity system [13,14,15]. Other voltage regulation methods propose centralized optimization and planning [16], or are based on local controllers [17,18]. To balance the voltage values, one can use the shunt connection of energy storage [1,19], in which the active and passive current components are regulated. Other solutions that reduce phase asymmetry include an increase in the cable cross-section [20], phase stabilizer installation [21], and the implementation of asymmetry compensation techniques in PV inverters [22,23]. In work [24], the possibility of generating negative and zero components in the charging current of energy storage was examined to reduce the voltage, and in [25,26], the problem was solved by injecting the appropriate power value into the network.
Under normal conditions, the voltage asymmetry of the phase is not only due to the asymmetrical load [27,28], but also to unbalanced phase impedances [29] or asymmetrical disturbances [30]. Non-balance of currents in individual phases reduces the usable load capacity of cables and distribution transformers [29]. Ciontea and Iov showed [21] that load asymmetry significantly impacts the correct estimation of some energy quality indicators, and the differences between the estimated and actual values of these indicators may sometimes be significant. The electronic balancer indicated in [31] may reduce the negative of the negative three-phase current appearing in railway lines, contributing to a significant reduction in the voltage asymmetry factor, increasing the value of the power factor, and can compensate for harmonic currents in the low-frequency range [32,33]. The impact of intelligent charging of electric vehicles in a low voltage network was tested mainly by modulating the active power consumed by electric vehicles employing droop regulation [34,35], active power drop control (Droop P) and passive power drop control (Droop Q) [36].
There are few works in the literature on balancing phase load in power transformers. Article [37] shows the dependence of the phase load on voltage for distribution transformers to improve the non-balance of the system and reduce losses. Abril proposed [38] the use of siding systems for this purpose. The Bacterial Foraging Optimization Algorithm (BFOA) was also used to find the optimal phase of the distribution transformer phase. In [39], a model of calculating losses was developed, which was determined using operational data and transformer resistance characteristics. Dai and others [40] proposed an intelligent model of the PCA-SSA (Principal Component Analysis (PCA) and Sparrow Search Algorithm (SSA) in order to solve the problem of low accuracy of transformer loss calculations for three-phase asymmetrical loads.
When modeling electricity flows, one should always balance the amount of energy produced in power plants and the recipients’ demand [41,42]. When obtaining the stability of the energy system, it is necessary to predict and consider power losses resulting from energy transmission at considerable distances [43,44]. The relationships describing power losses in power lines or transformers are widely known [15]. Unfortunately, most of the analyses available in the literature assume a symmetrical load on each phase [45,46,47,48]. If the asymmetrical load of the line appears, such analysis is not based on the data of actual lines [29,49,50,51,52]. That is why the authors decided to perform field tests involving the measurement of currents in the average voltage lines powered from the HV/MV (High Voltage/Medium Voltage) power station, based on which power and energy losses were determined, which could be avoided using known solutions, listed above. Preliminary studies conducted by the authors show that failure to account for the incremental power losses caused by load asymmetry can lead to significant errors when determining stability in power systems. Correlations between the voltage and current asymmetry factors, both negative and zero sequences, should also be determined. The proposed method allows for a new, simple way to determine the power losses occurring in medium-voltage lines loaded asymmetrically at multiple points. In order to estimate the errors that arise from calculations made based on relationships available in the literature, calculations were made using actual loads recorded in one rural power grid. Failure to include losses arising from asymmetric loading in the power balance can have significant consequences in maintaining the stability of the power system. It is important to emphasize that the conducted research aims to guide network operators, engineers, and decision-makers responsible for the development and modernization of power infrastructure. It will ultimately contribute to enhancing the reliability and sustainability of energy distribution systems.

2. Materials and Methods

In order to determine the power losses resulting from the asymmetry of loads in the medium voltage power networks, the terrain tests of loads of the line and transformers powered from the HV/MV power station, located in north-eastern Poland, were performed by the authors, whose scheme is shown in Figure 1. MV power lines supply recipients in rural areas, where most household and agricultural activities are available. Transformers and power lines were characterized by the parameters presented in Table 1 and Table 2.
Based on the results obtained from the field tests carried out, power and energy losses resulting from the asymmetrical load in transformers and individual medium voltage power lines were determined.
Generally, power losses in a three-phase, three-wire homogeneous power line loaded at the end with the flow of asymmetric currents can be determined according to the following Equation [53]:
P a s y m = R l i n L 1 · I l i n L 1 2 + R l i n L 2 · I l i n L 2 2 + R l i n L 3 · I l i n L 3 2
where: I l i n L 1 , I l i n L 2 , I l i n L 3 —effective values of currents in the individual phases, and R l i n L 1 , R l i n L 2 , R l i n L 3 —substitute line resistance values for individual phases.
For the analysis of three-phase asymmetrical circuits, the transformation of Fortescoue is used most frequently, which consists of the decomposition of phase currents into symmetrical components of the positive, negative, and zero sequences. It can be described by the following relationship [7,54]:
I _ 0 = 1 3 · I _ L 1 + I _ L 2 + I _ L 3 I _ 1 = 1 3 · I _ L 1 + a · I _ L 2 + a 2 · I _ L 3 I _ 2 = 1 3 · I _ L 1 + a 2 · I _ L 2 + a · I _ L 3
where: I0, I1, I2—complex values of the symmetrical components of the zero, positive, and negative sequence of the current, IL1, IL2, IL3—complex values of currents in the individual phases, and a—rotation operator described by this Equation:
a = e j 2 π 3
By using the symmetrical components method, power losses can also be described as follows [49]:
P a s y m = 3 · R 1 · I 1 2 + R 2 · I 2 2 + R 0 · I 0 2
where: I0, I1, I2—effective values of symmetrical components of the zero, positive, and negative sequence of the current; and R0, R1, R2—the value of a substitute resistance of the power network for symmetrical components of the zero, positive, and negative sequence.
When the values of power loss at symmetrical load are [54,55]:
P s y m = 3 · R 1 · I 1 2
The rate of power loss increase caused by the asymmetry of currents can be determined using the relationships (4) and (5):
δ P a s y m = R 1 · I 1 2 + R 2 · I 2 2 + R 0 · I 0 2 R 1 I 1 2 = 1 + R 2 R 1 · I 2 I 1 2 + R 0 R 1 · I 0 I 1 2
Using asymmetry coefficients of the currents of the negative kI2 and zero kI0 sequence [52,53], which are commonly described in the literature:
k I 2 = I 2 I 1
k I 0 = I 0 I 1
and the principle characteristic of the power network (lines and transformers) that the values of substitute resistance for the component of the positive and negative sequence are equal to R1 = R2 [7], Equation (6) can be presented in the following form:
δ P a s y m = 1 + k I 2 2 + k I 0 2 R 0 R 1
The resistance values of overhead and cable power lines for individual symmetrical components can be determined by applying the following Equation [55]:
R 1 l = 10 3 γ · s · l R 0 l = 10 3 γ · s + 3 · 10 3 f l
where: R0l, R1l—the values of lines resistance for symmetrical components of the zero and positive sequence, γ—conductivity of the conductors material, s—cross-section of conductors, and f—rated frequency of the power network voltage.
Thus, the ratio of zero sequence resistance to the resistance of the positive sequence for the line can be presented as follows:
R 0 l R 1 l = 1 + 3 · f · γ · s · 10 6
HV/MV transformers with YnD11 connection system are most frequently used to supply the medium voltage network, while the MV/LV receiving transformers use the Dyn5 connection system. For this type of transformer, the ratio of zero sequence resistance to the resistance of the positive sequence is 0.85.
After taking into account these assumptions, Equation (9) can be transformed into the following form:
For the line
δ P a s y m L = 1 + k I 2 2 + k I 0 2 1 + 3 · f · γ · s · 10 6
and for transformers:
δ P a s y m T = 1 + k I 2 2 + 0.85 · k I 0 2 .
In the case of real MV power networks, branched lines and lines loaded at many points through connected MV/LV transformer stations appear to be most frequent; therefore, relationship (1) cannot be directly used in this case. In the literature, the traditional sectional summation method [56,57,58] is used most frequently to calculate the power loss of a heterogeneous line loaded at multiple points:
P a s y m = i = 1 n I i L 1 2 R i L 1 + i = 1 n I i L 2 2 R i L 2 + i = 1 n I i L 3 2 R i L 3
where: I i L 1 , I i L 2 , I i L 3 —effective values of currents flowing through the i-th section of the line in the individual phases, R i L 1 , R i L 2 , R i L 3 —substitute resistance of the i-th section of the line in individual phases, and n—total number of power line sections.
In practice, to calculate losses according to Equation (14), it is necessary to obtain complete information about the current flow in all branches and sections of the network. Obtaining such information would require the installation of even several dozen measuring devices, which would entail huge costs.
Electricity distributors usually have only the values of currents flowing into the line, measured in the HV/MV supply station, and information about the network structure (number and length of lines leaving the stations, sections of wires) and the number of stations and the power of MV/LV stations powered from individual lines. According to [57,58], a branched network can be replaced with one element with an equivalent resistance Rev and a currently loaded current in the Ilin line. In this method, the equivalent resistance to the loaded line in many points can be determined from the following Equation [57,58]:
R e v = i = 1 n I i 2 R i I l i n 2
where: Ii—current flowing through the i-th section of the line, Ri—resistance of the i-th section of the line, Ilin—current feeding into the analyzed MV power line, and n—total number of power line sections.
Due to the lack of information about the currents of Ii flowing in individual sections of the power line, it is impossible to apply this Equation (15) directly. That is why the authors modified this method by adapting it to the realities of the actual MV electricity networks. In the absence of information on the loads of individual MV/LV stations, and thus also about currents flowing in individual sections of the line, it becomes necessary to use simplifying assumptions. First, with the knowledge of the value of the rated transformers in individual MV/LV receiving stations, it may be reasonable to assume that the currents taken by individual stations are proportional to the rated power of the transformers installed in them. This relationship can be presented as follows:
I i = I l i n Σ S T i Σ S T
where: ΣSTi—sum of transformers’ power at MV/LV power stations powered from the i-th section of the line, and ΣST—sum of the power of transformers of all MV/LV stations powered from the analyzed MV power line.
After taking into account the simplified assumption, the relationship (15) can be converted to the following form:
R e v = i = 1 n Σ S T i 2 R i Σ S T 2
Using the relationship for the resistance of the wires:
R = l γ s
where: l—length of the line, s—cross-section of conductor, and γ—conductivity of the conductor material.
Equation (17) can be transformed to the following form:
R e v = i = 1 n Σ S T i 2 l i s i γ Σ S T 2
where: li—length of the i-th section of the line, si—cross-section of conductors the i-th section of the line, and γ—conductivity of the conductors material.
When the power of transformers at individual MV/LV stations is unknown, the equality of currents taken by individual stations powered from the MV must be assumed. Then, the current flowing in the first section of the line will be proportional to the number of stations powered from this section:
I i = I l i n · n i n
where: Ilin—current feeding into the analyzed MV power line, ni—number of stations supplied from the i-th section of the line, and n—total number of MV/LV substations supplied from the MV line being considered.
After taking into account these assumptions, relationship (19) can be transformed into the following form:
R e v = i = 1 n n i 2 l i s i γ n 2
Suppose there is also a lack of information concerning the length of the line sections between individual loads. In that case, it becomes necessary to adopt the equality of the length of these sections. With this assumption, the lengths of all sections of the li line will equal:
l i = l l i n n
After taking into account these assumptions and assuming that in the entire length of the line, a cable with the same cross-section s was used, and the Equation of the value of equivalent resistance Rev can be converted to the following form:
R e v = l l i n s · γ n 3 i = 1 n n + 1 i 2
The sum in Equation (23) can be developed into a Taylor series and approximated using a third-degree polynomial. Then, this Equation takes the following form:
R e v = l l i n s · γ n 3 1 3 n 3 + 1 2 n 2 + 1 6 n
Considering the values of the equivalent resistance Rev and measured currents flowing into the line Ilin, power losses ΔPasym in a branched, three-phase, three-wire MV power line, loaded in many points, can be described by the following Equation:
P a s y m = R e v L 1 · I l i n L 1 2 + R e v L 2 · I l i n L 2 2 + R e v L 3 · I l i n L 3 2
where: I l i n L 1 , I l i n L 2 , I l i n L 3 —effective values of phase currents affecting the line, and R e v L 1 , R e v L 2 , R e v L 3 —values of equivalent resistance of lines for individual phases.
For calculations, it is most frequently assumed that in overhead and cable MV power lines, all phase cables are equally built, which simplifies Equation (25) to the form:
P a s y m = R e v · I l i n L 1 2 + I l i n L 2 2 + I l i n L 3 2

3. Results and Discussion

Weekly voltage measurements were conducted on the medium voltage (MV) of the high voltage/medium voltage (HV/MV) power supply station to assess power losses accurately in power systems. The load parameters of HV/MV transformers and all outgoing lines from the analyzed power station were also considered. Due to the enormous amount of measuring data, one line load parameters (Line 3) and one transformer (TR-1) have been chosen to be presented in this article.
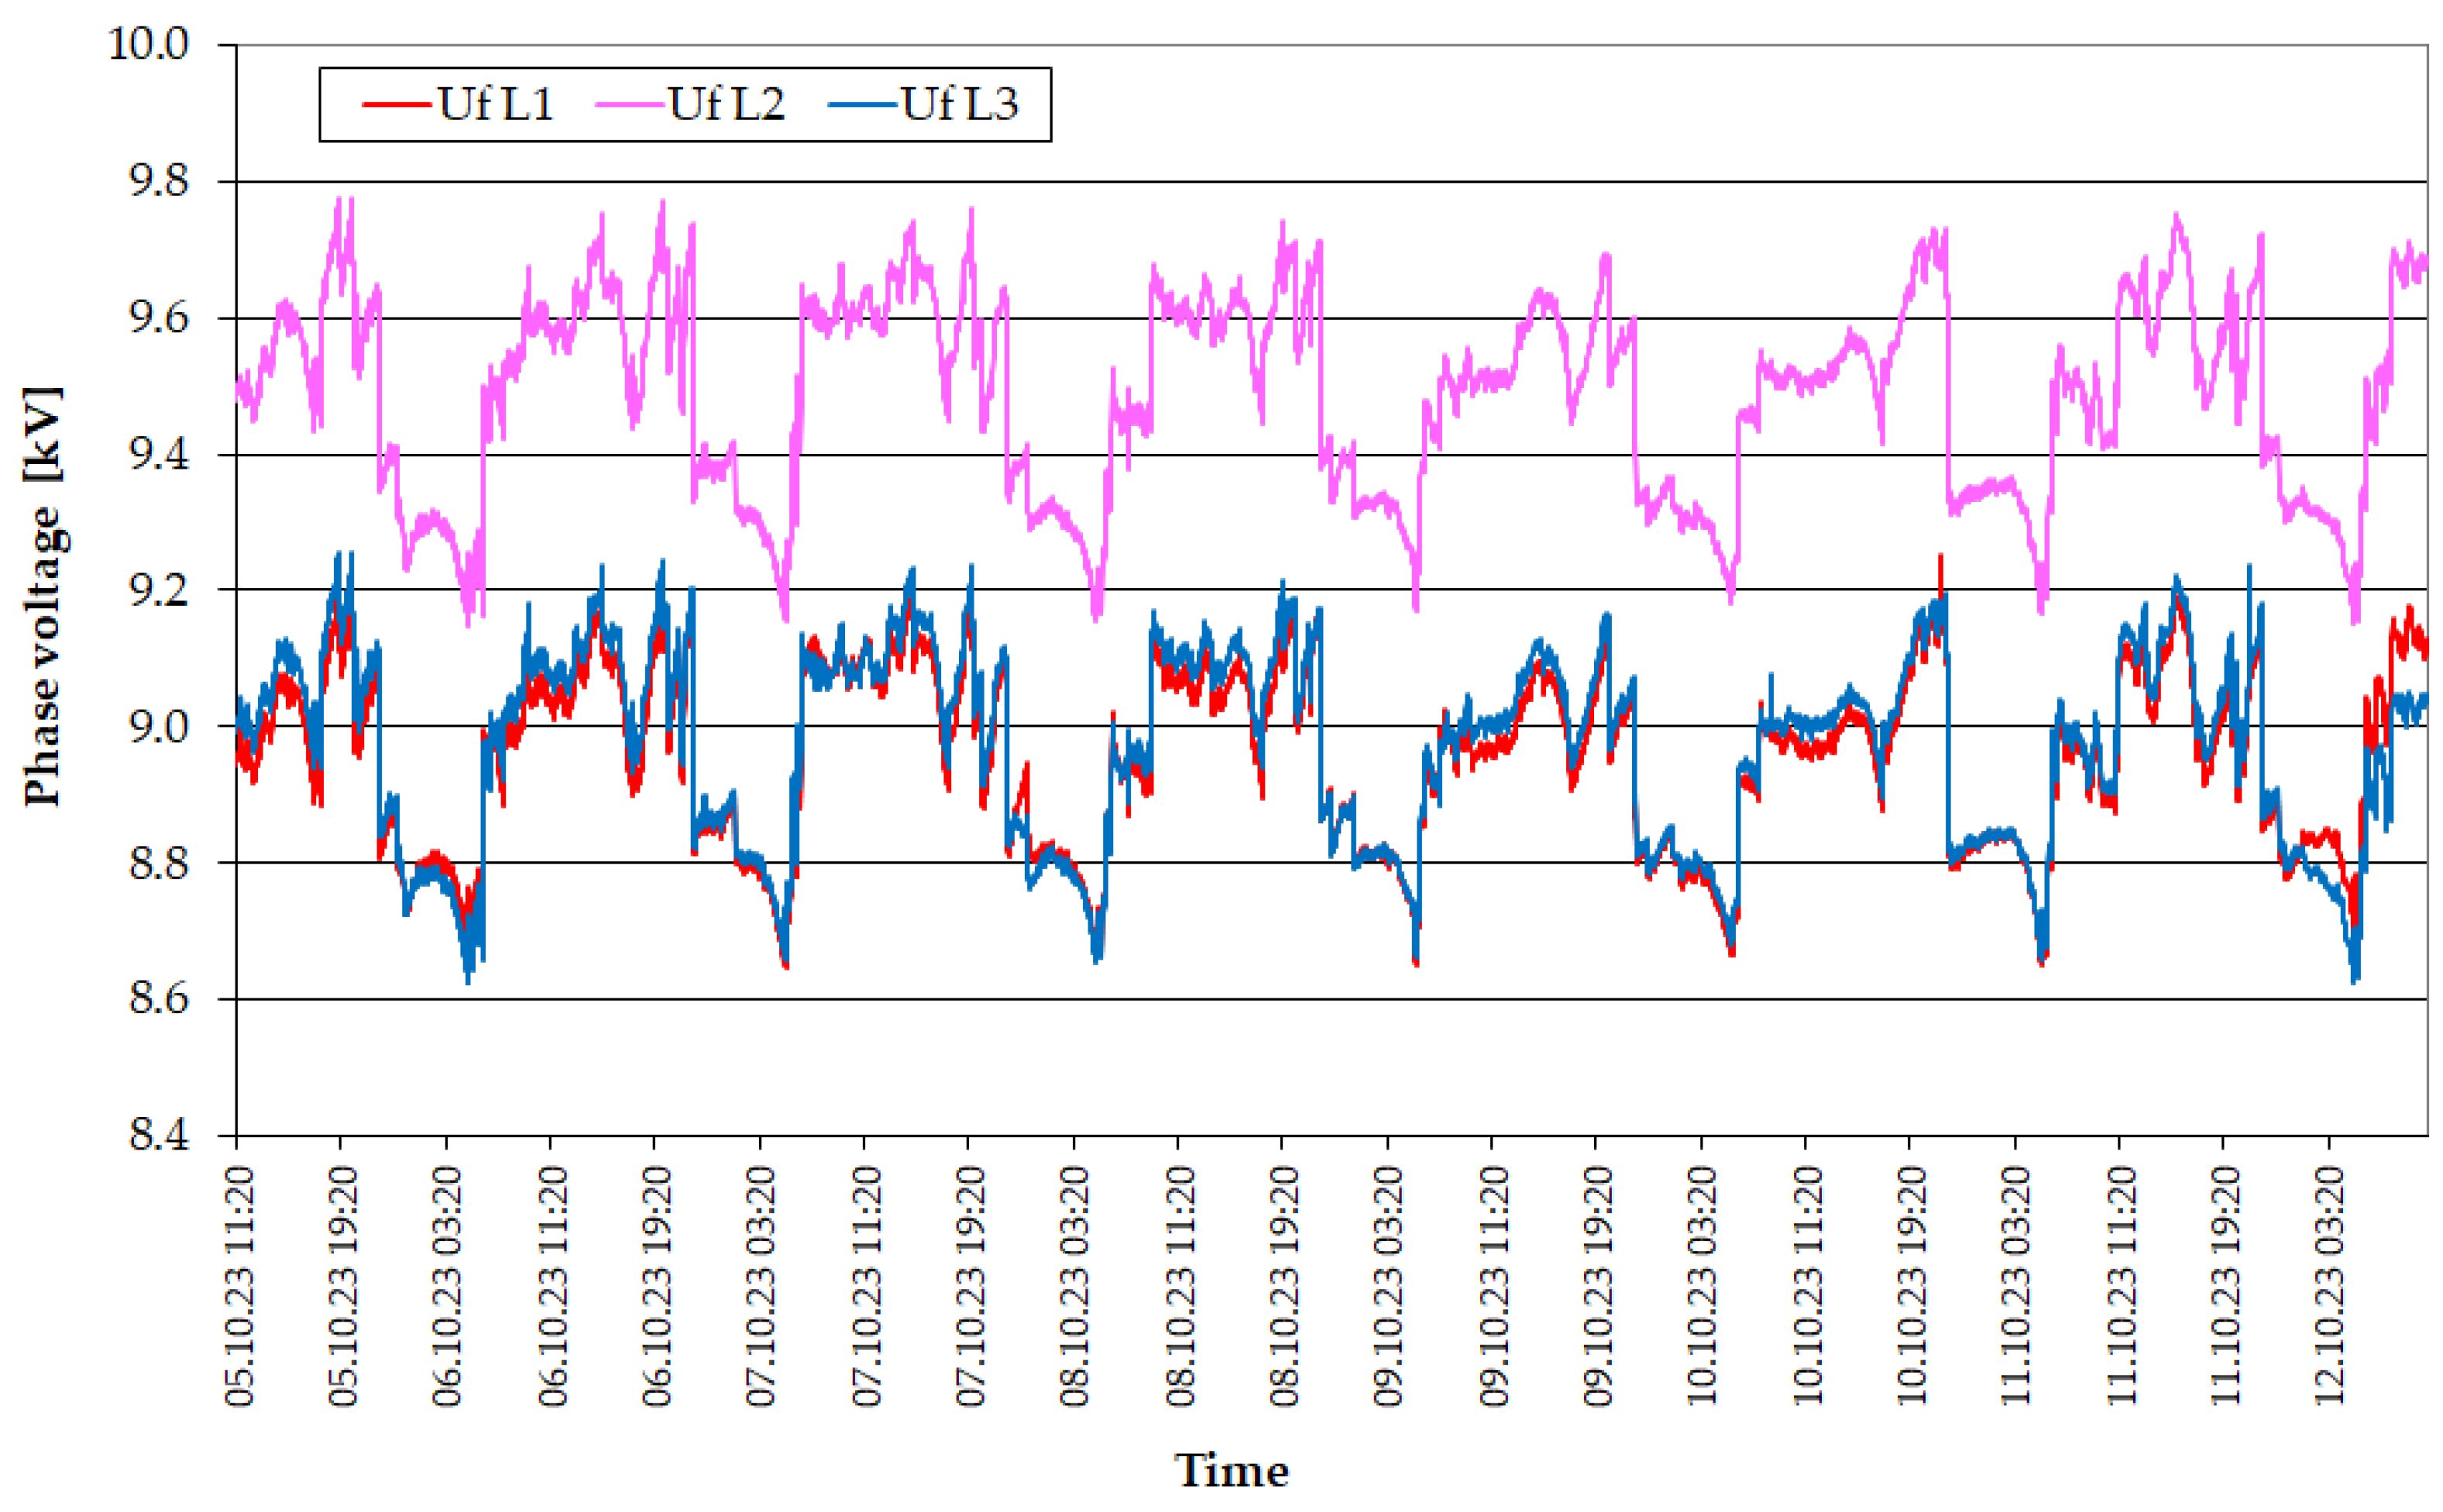
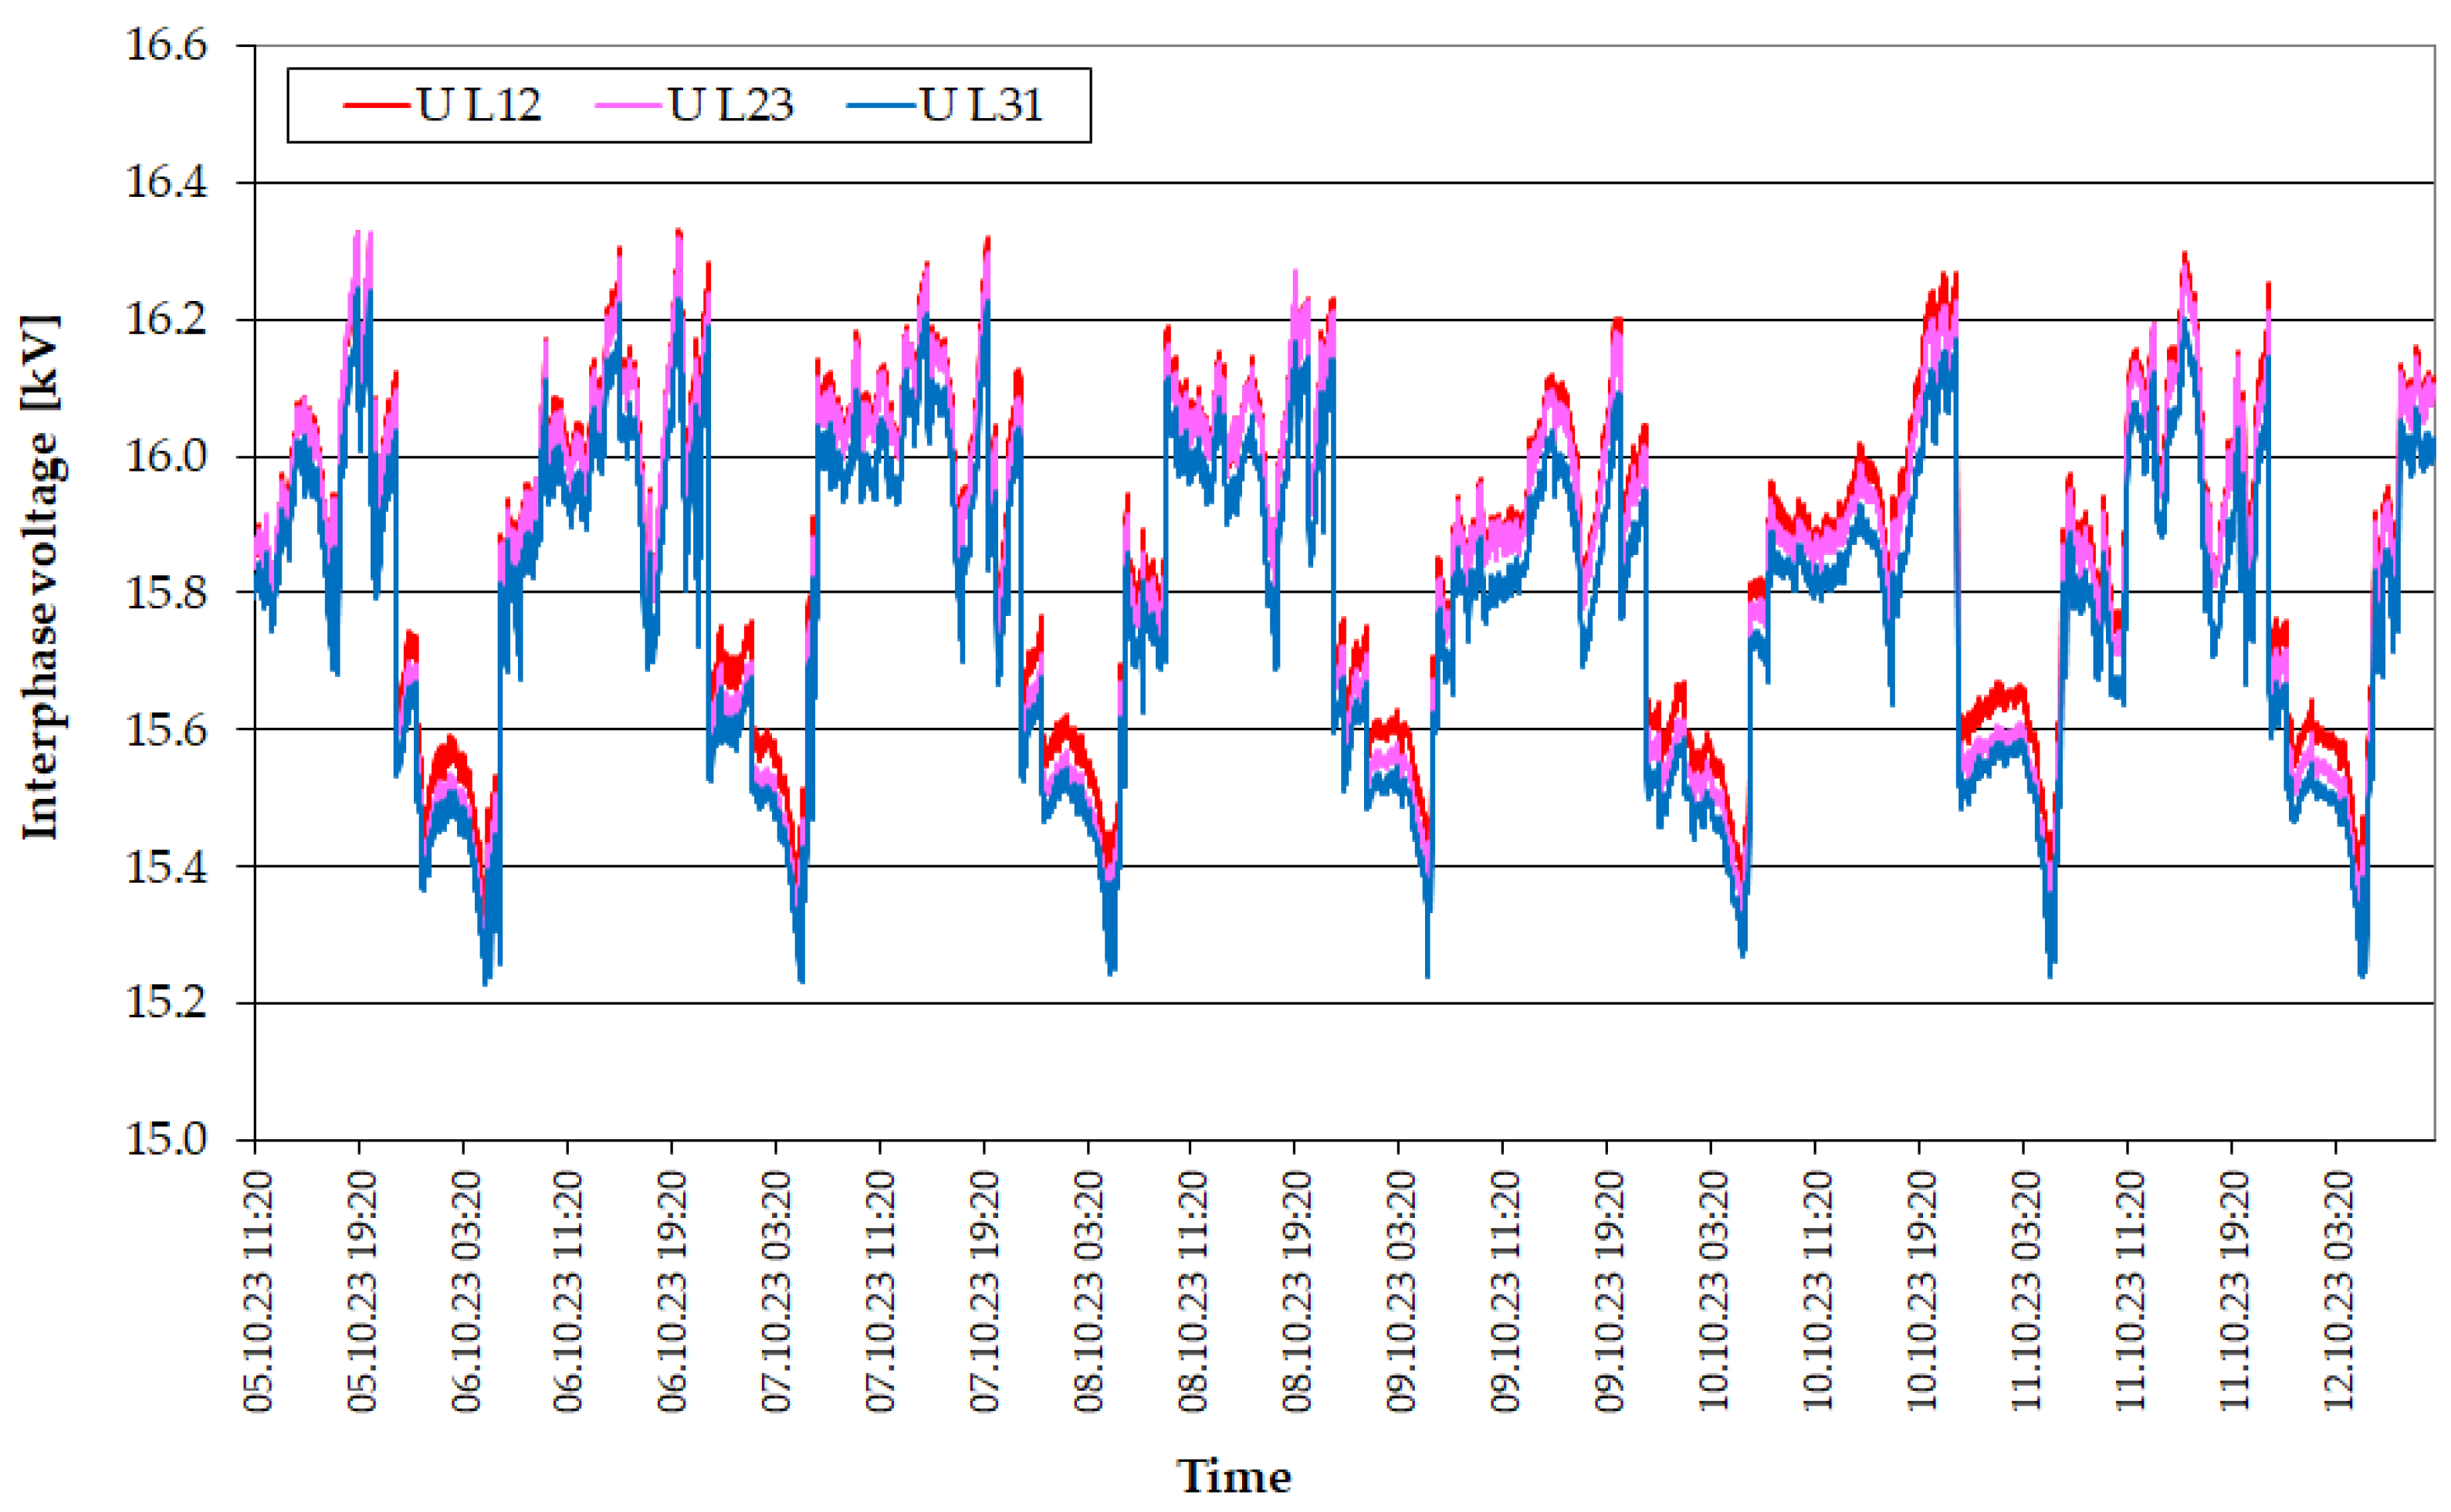
The first analyzed parameter was the voltage on the MV side. As it can be seen in Figure 2 and Figure 3, the voltage values change cyclically during the day, which is the result of the station load changes and the automatic regulator, which reduces the voltage value at night when the load is the smallest.
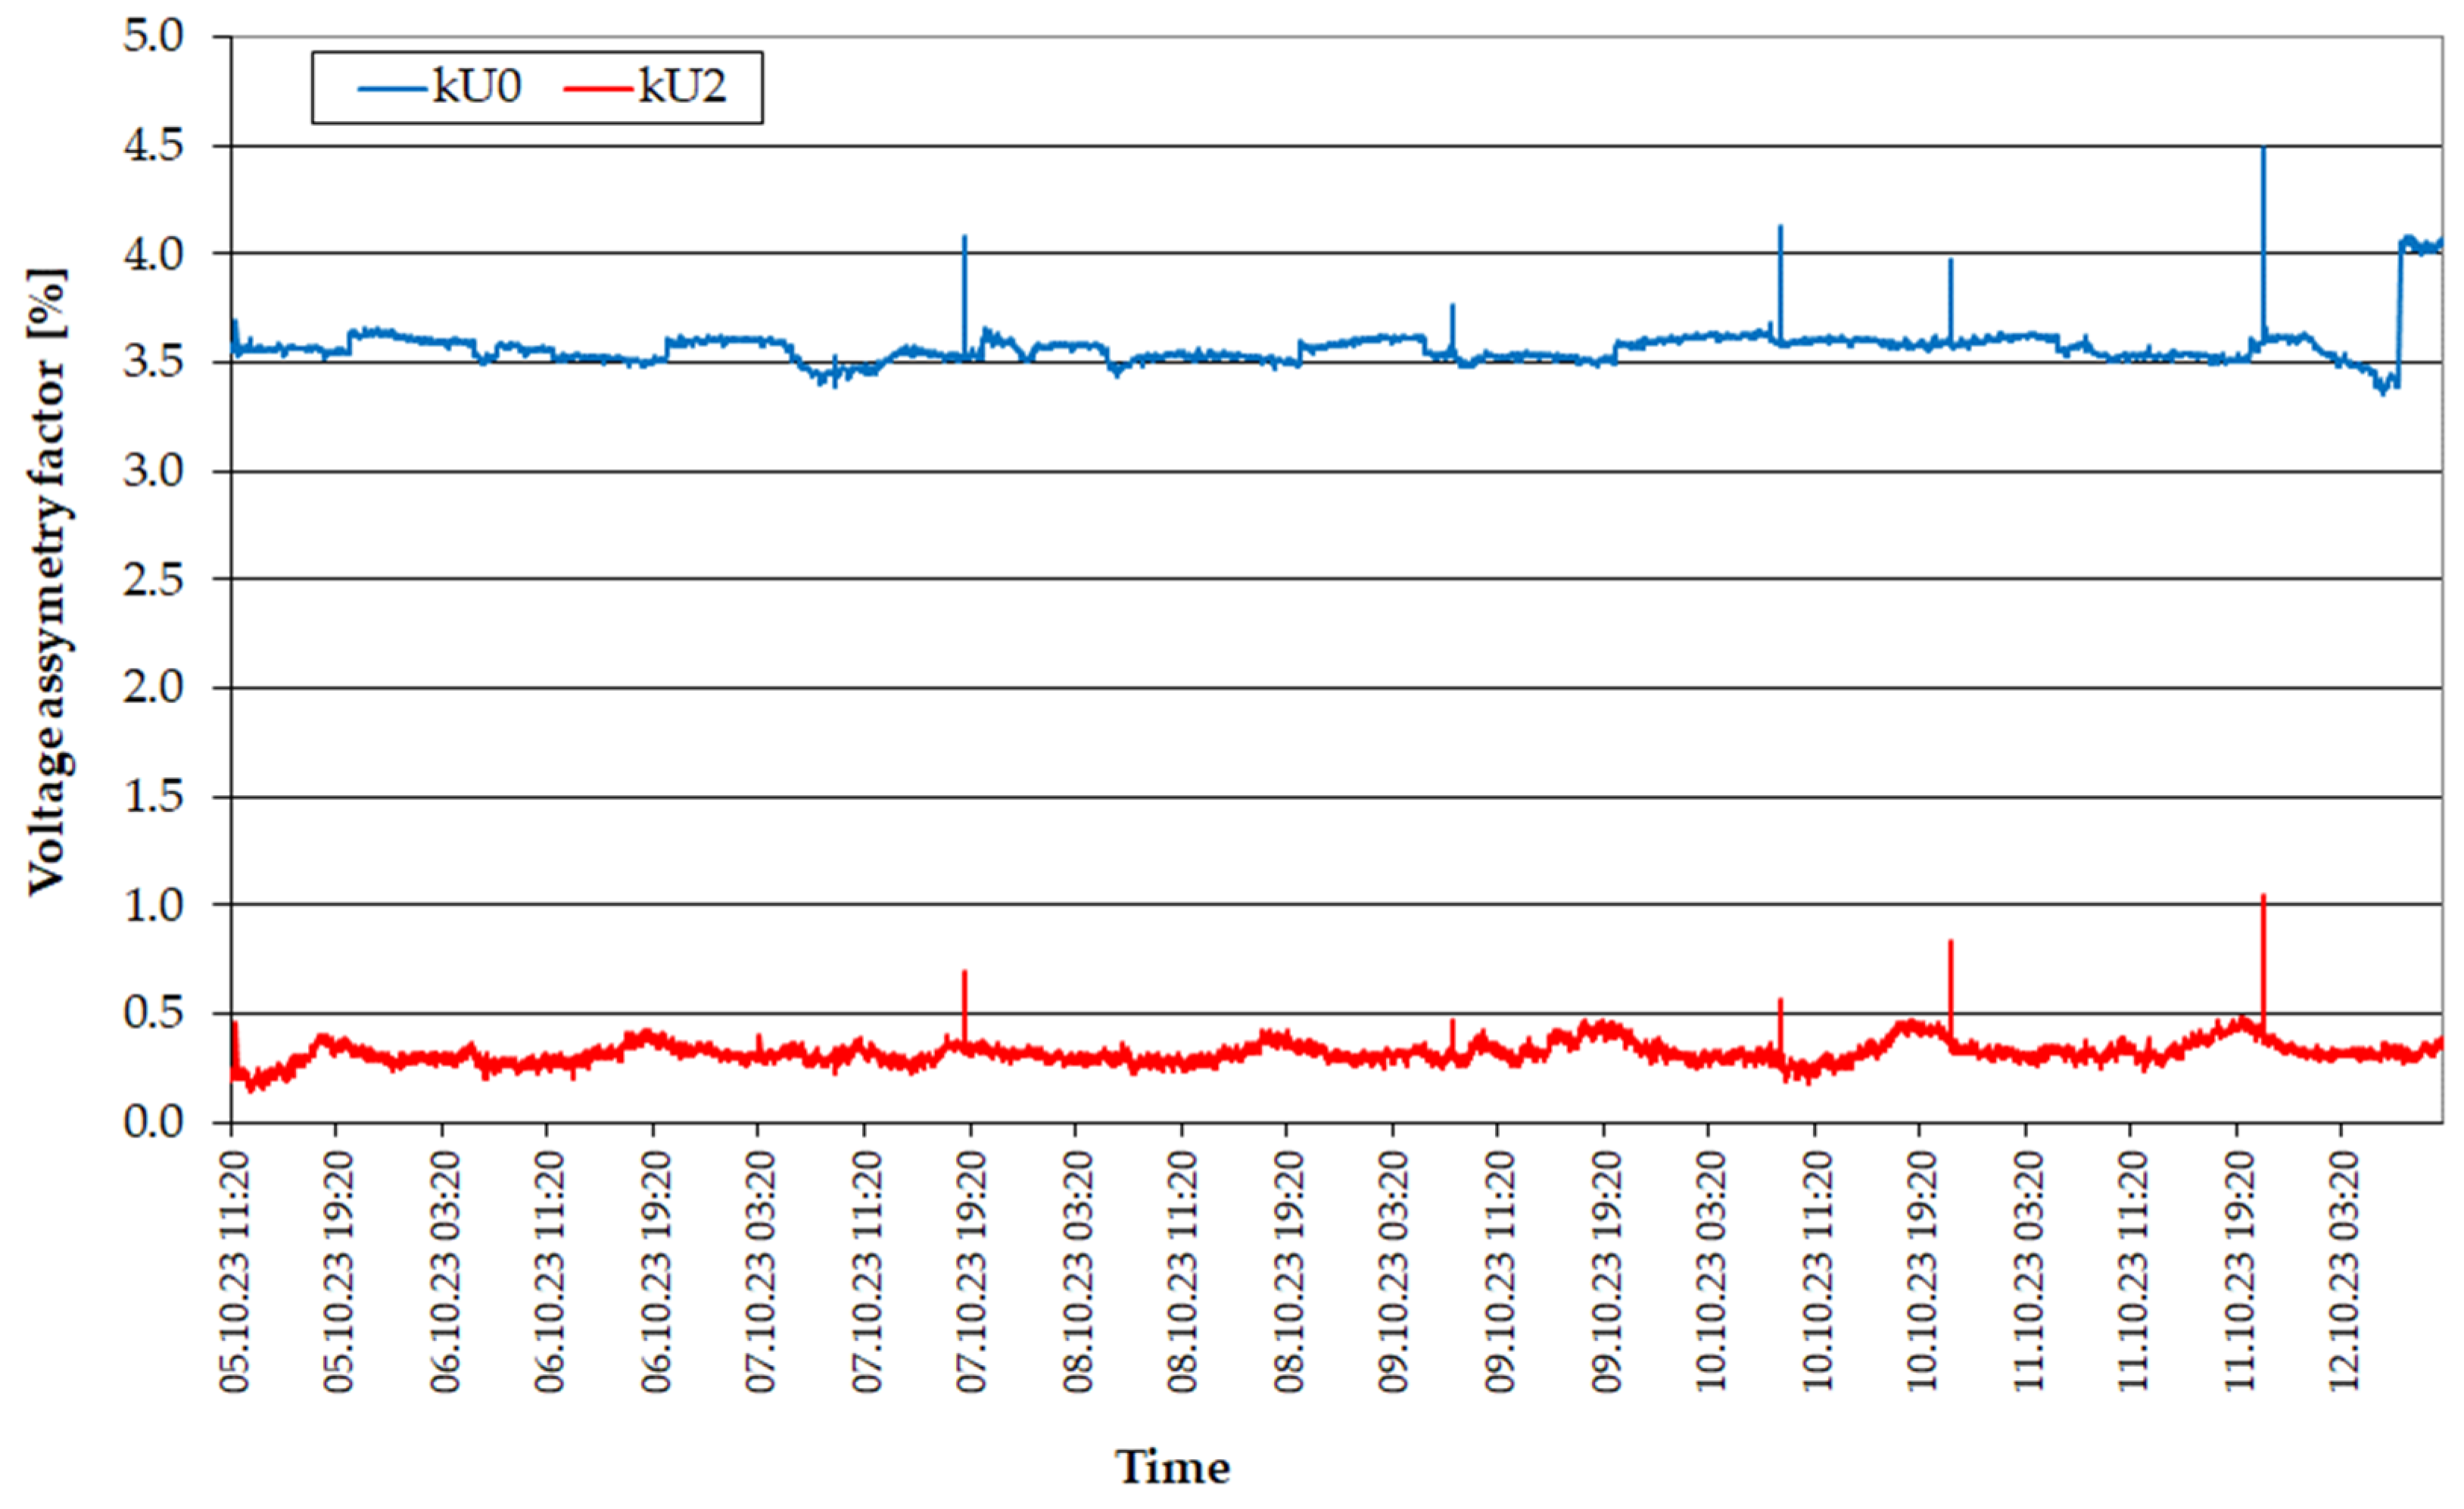
In the registered voltage curves (Figure 2) in individual phases, Phase 2, shifted in relation to the others, is clearly visible. Such a shift does not occur in the case of line-to-line voltages (Figure 3). This is reflected in the registered values of asymmetry coefficients (Figure 4). The negative asymmetry factor did not exceed 0.5% for most of the measurement time. In contrast, the zero asymmetry factor was more than seven times higher, averaging 3.49%.
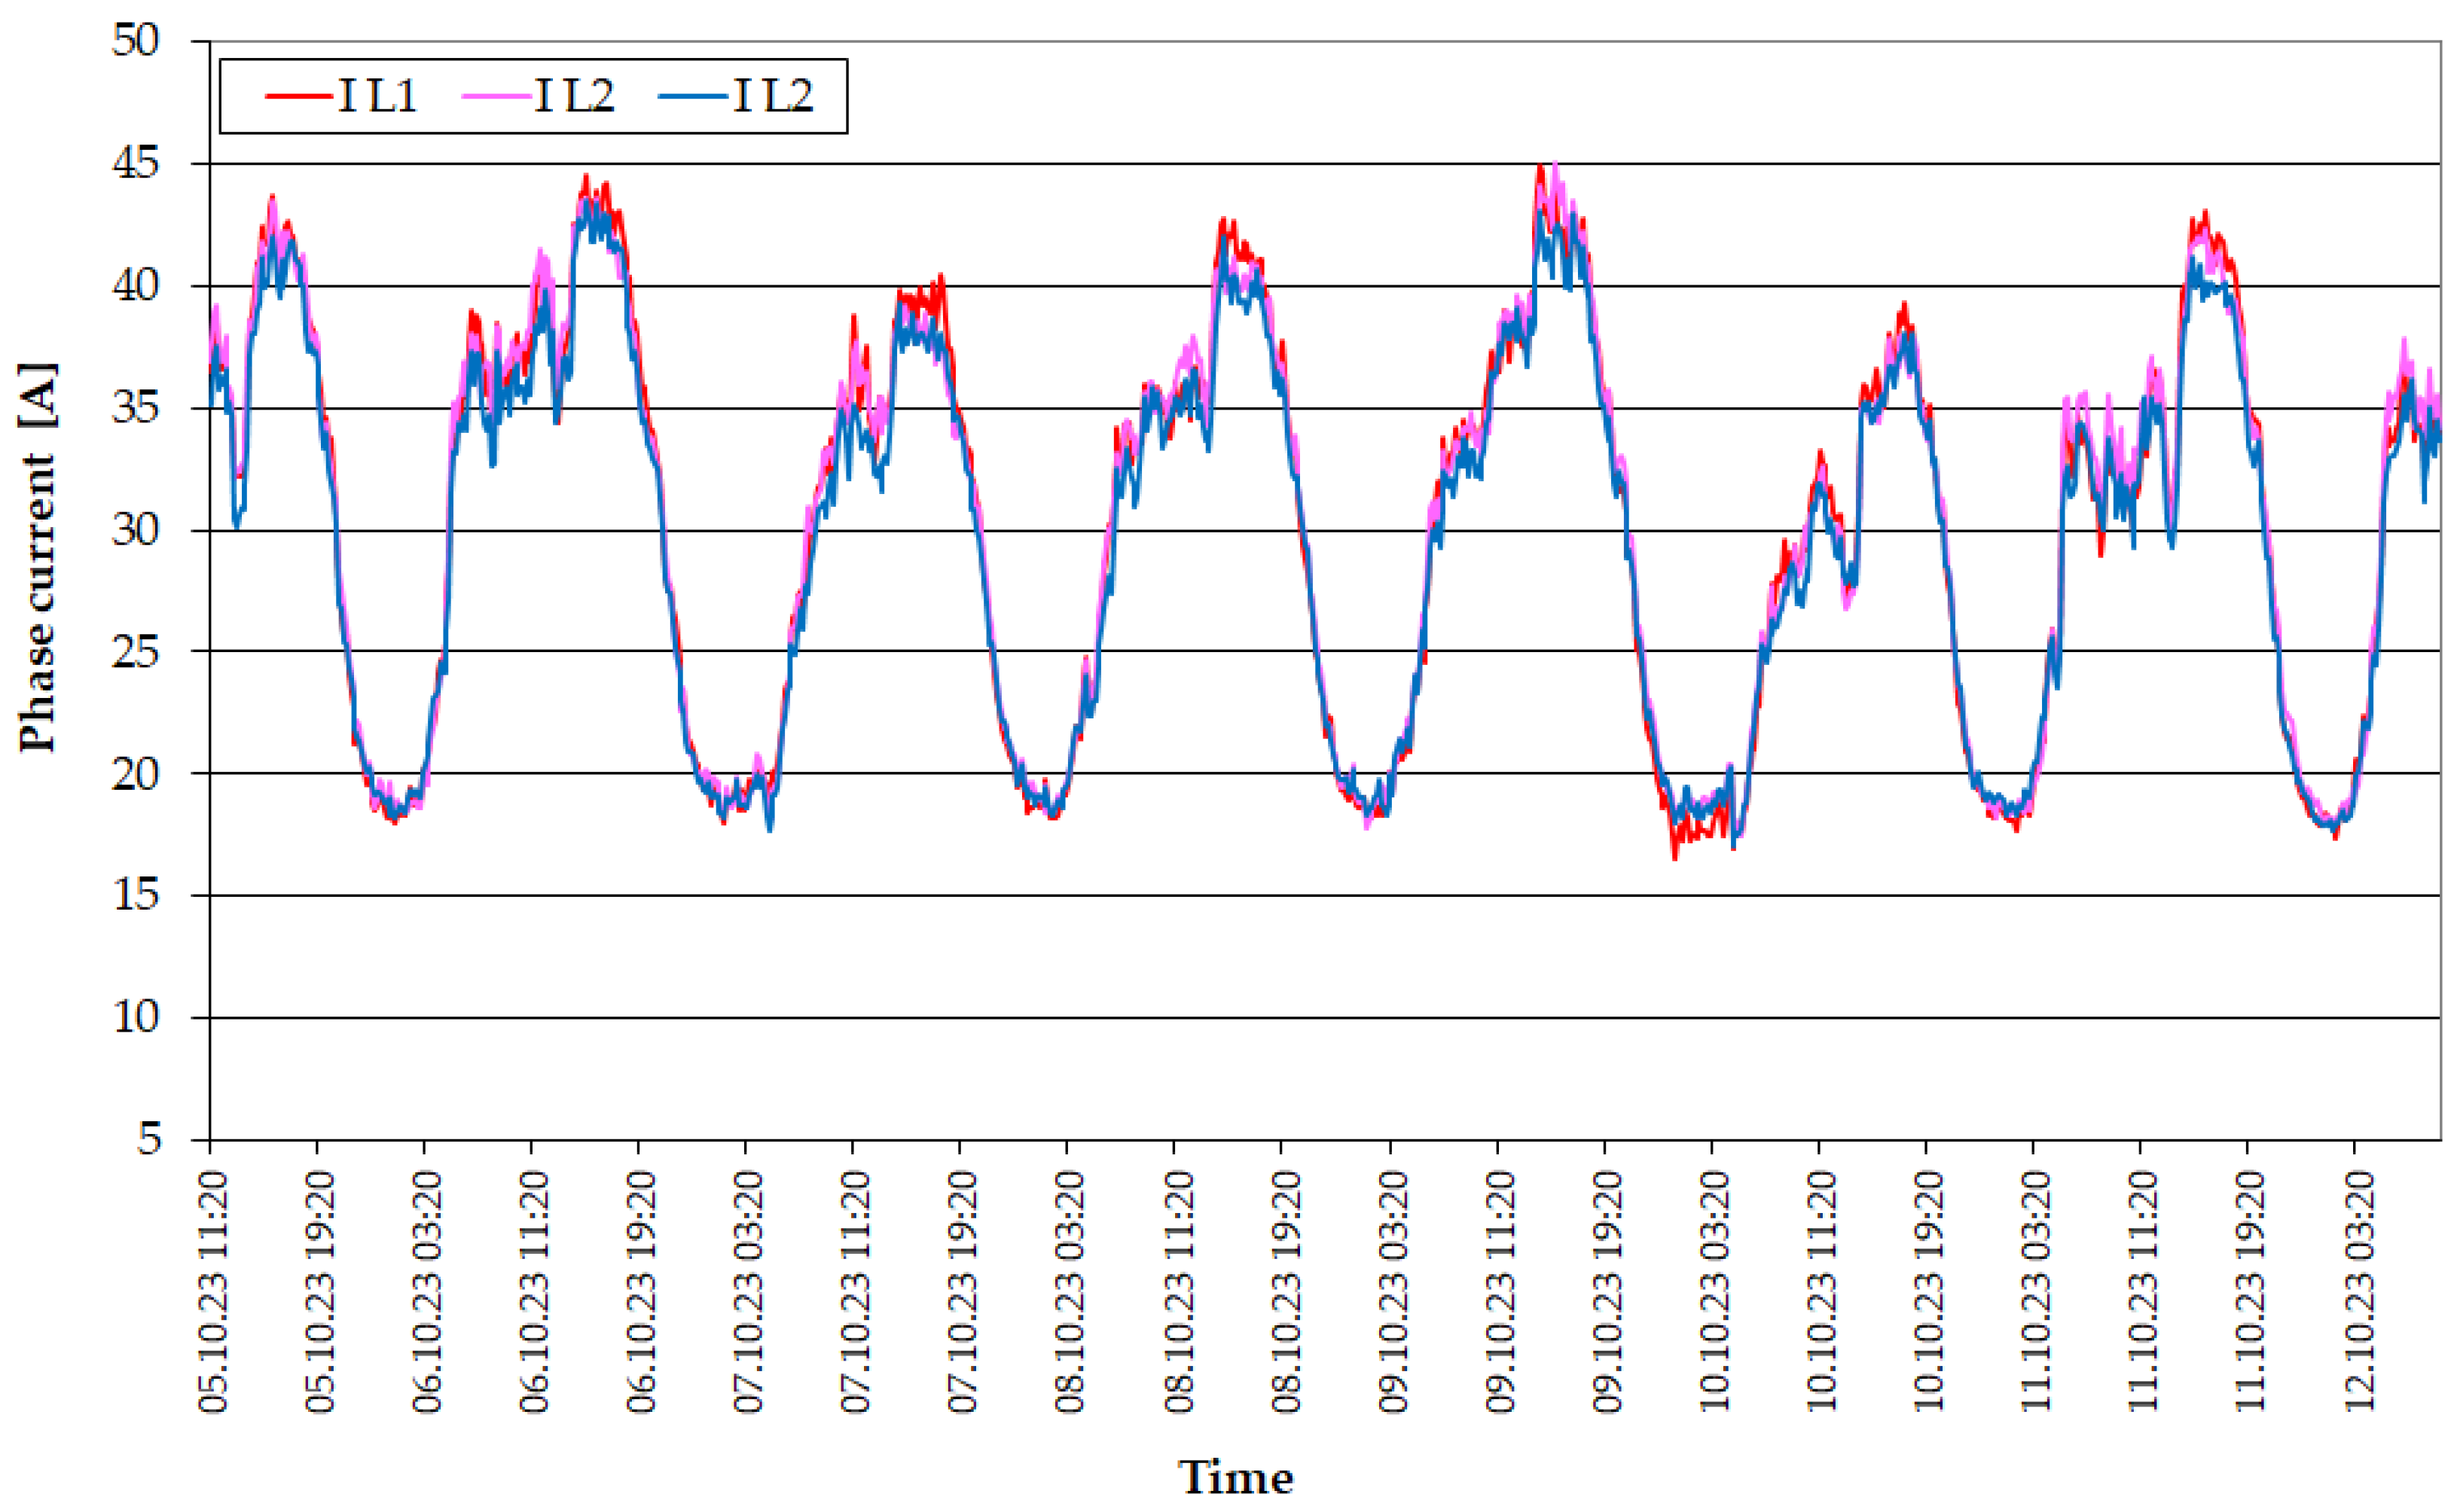
In order to determine the loads found in the analyzed power system, measurements of currents flowing into individual medium voltage lines were made. Due to the number of data received, the article presents the course of flowing into line 3 (Figure 5). In this case, the dependence of the value on the time of day is also visible, and the “night valley” is clearly marked.
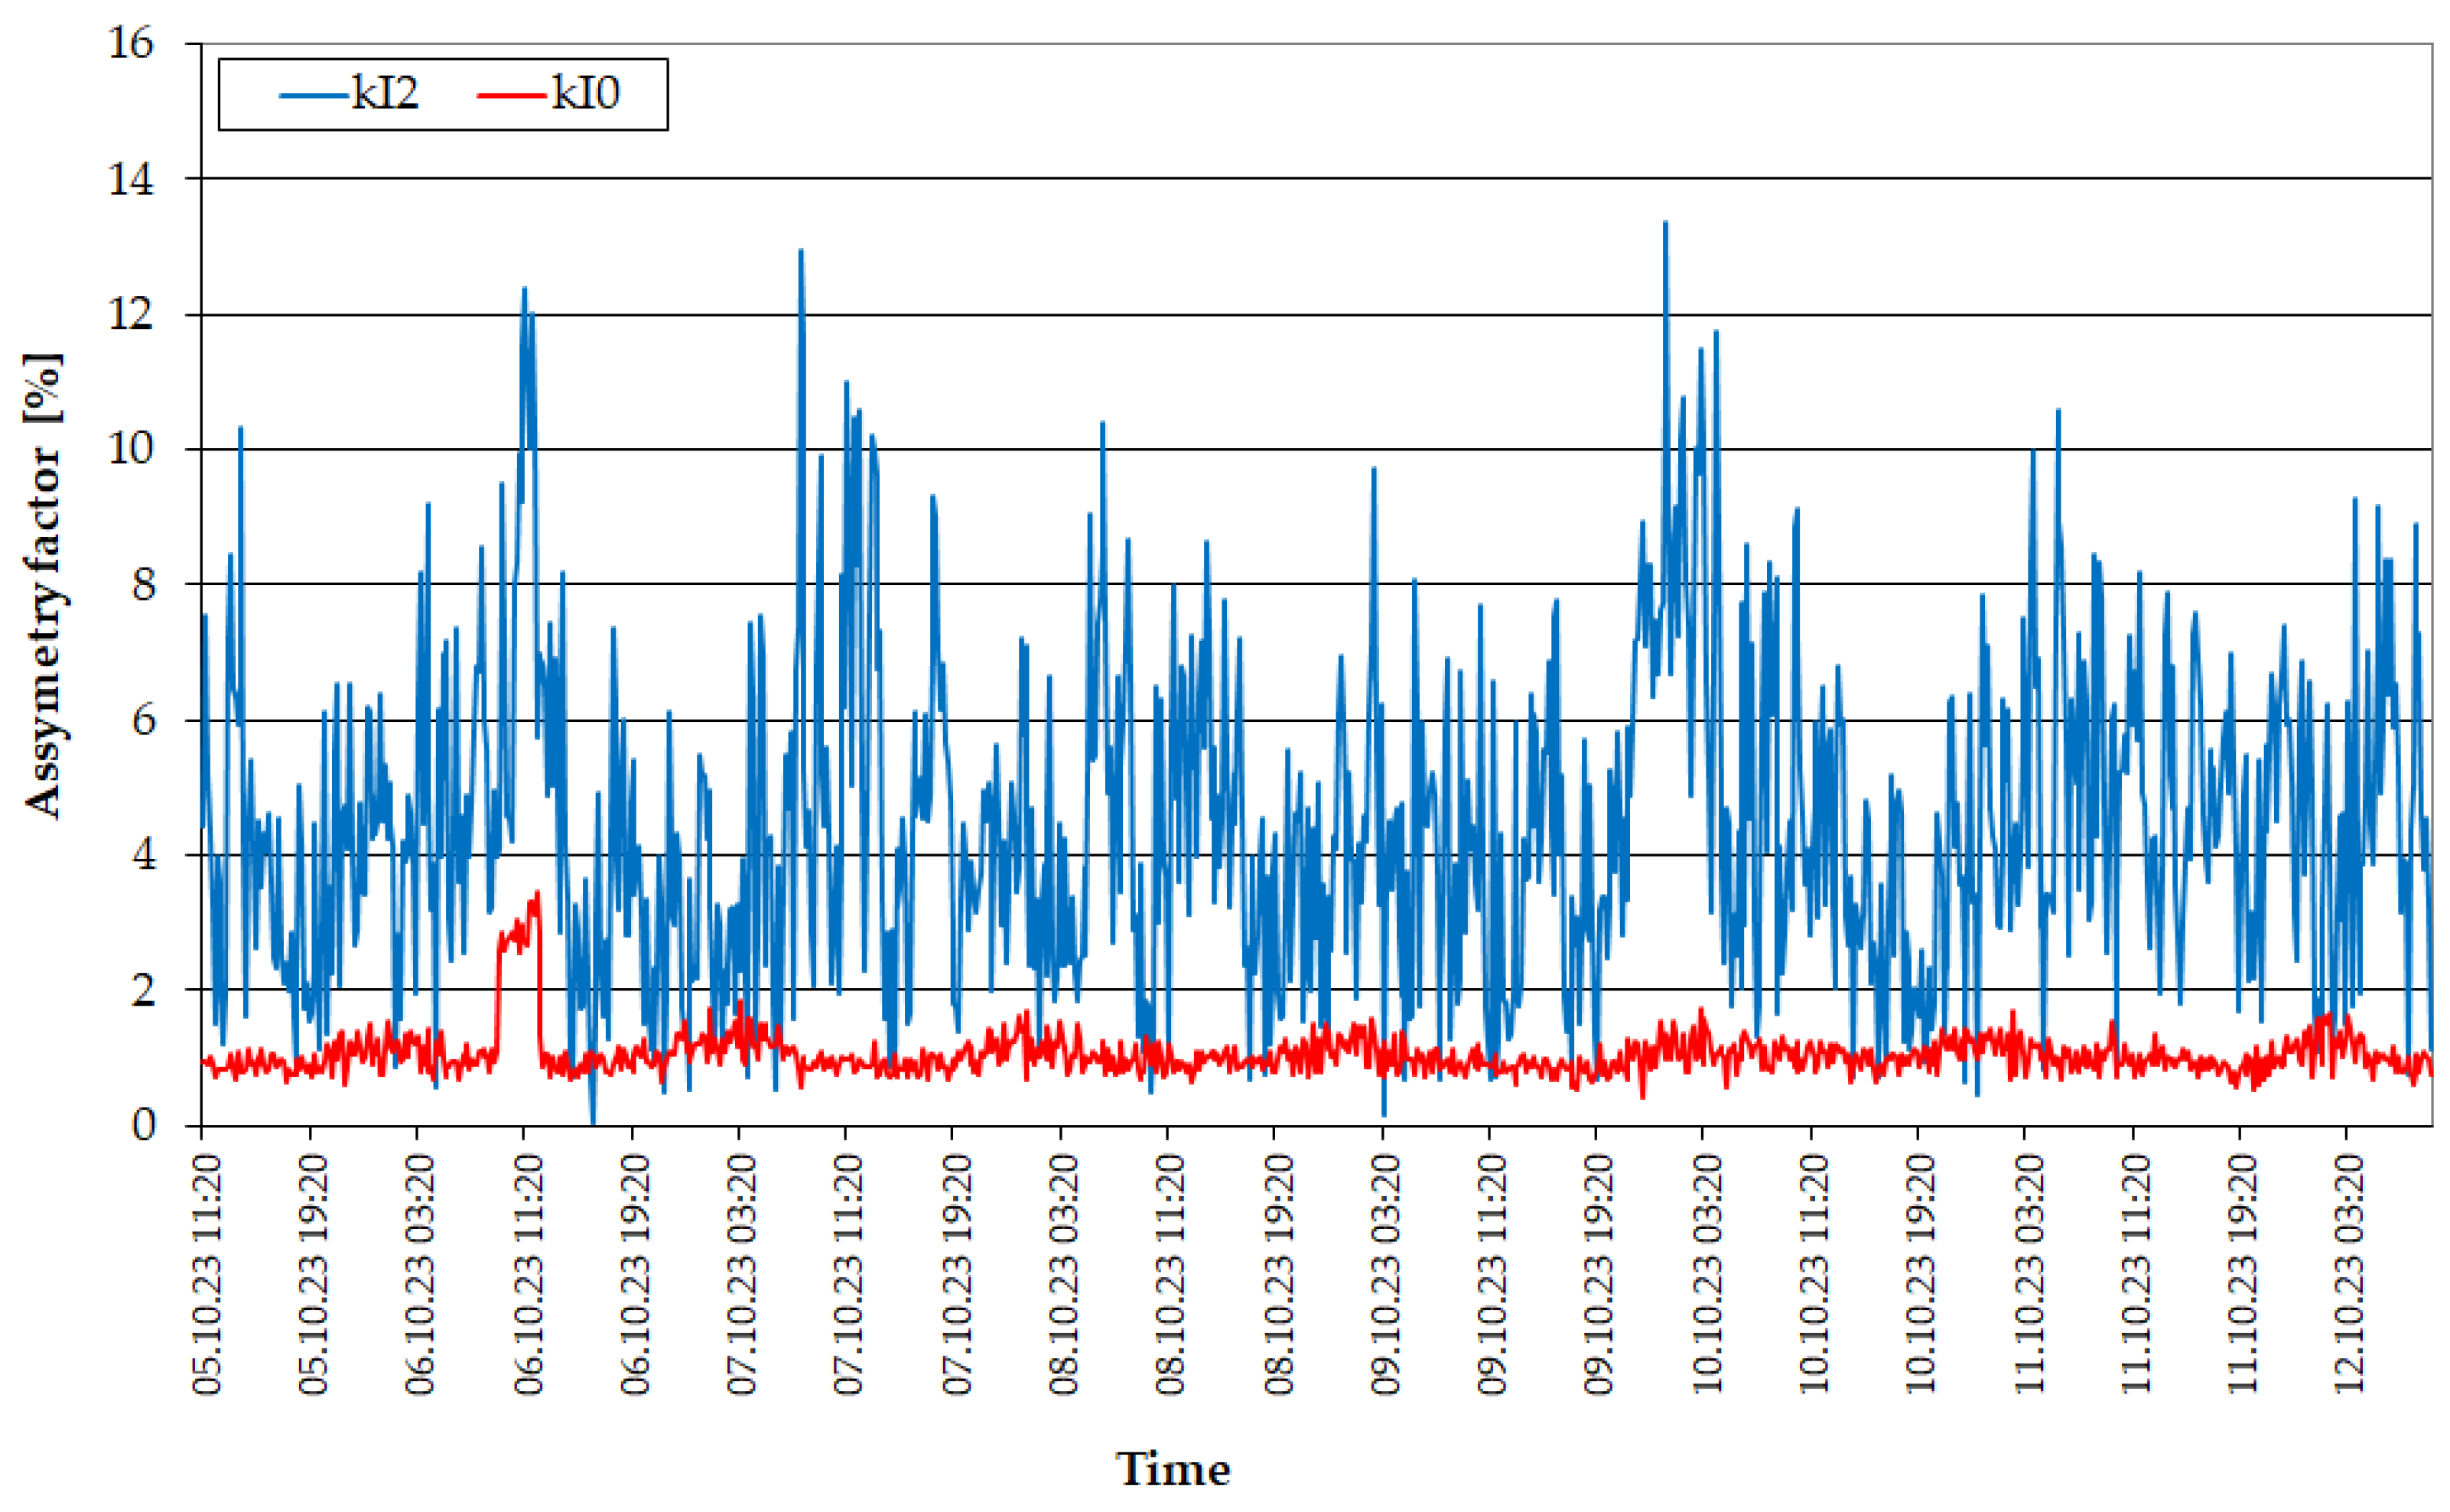
Although the currents shown in Figure 5 do not show noticeable shifts between phases, the values of the asymmetry coefficients reach significant values. As it can be observed in Figure 6, the average value of the coefficient of opposite asymmetry is 4.49%, while the coefficient of zero asymmetry is 1.06%. It is an inverse relationship to the coefficients of voltage asymmetry, where the coefficient kU0 took values much higher than kU2.
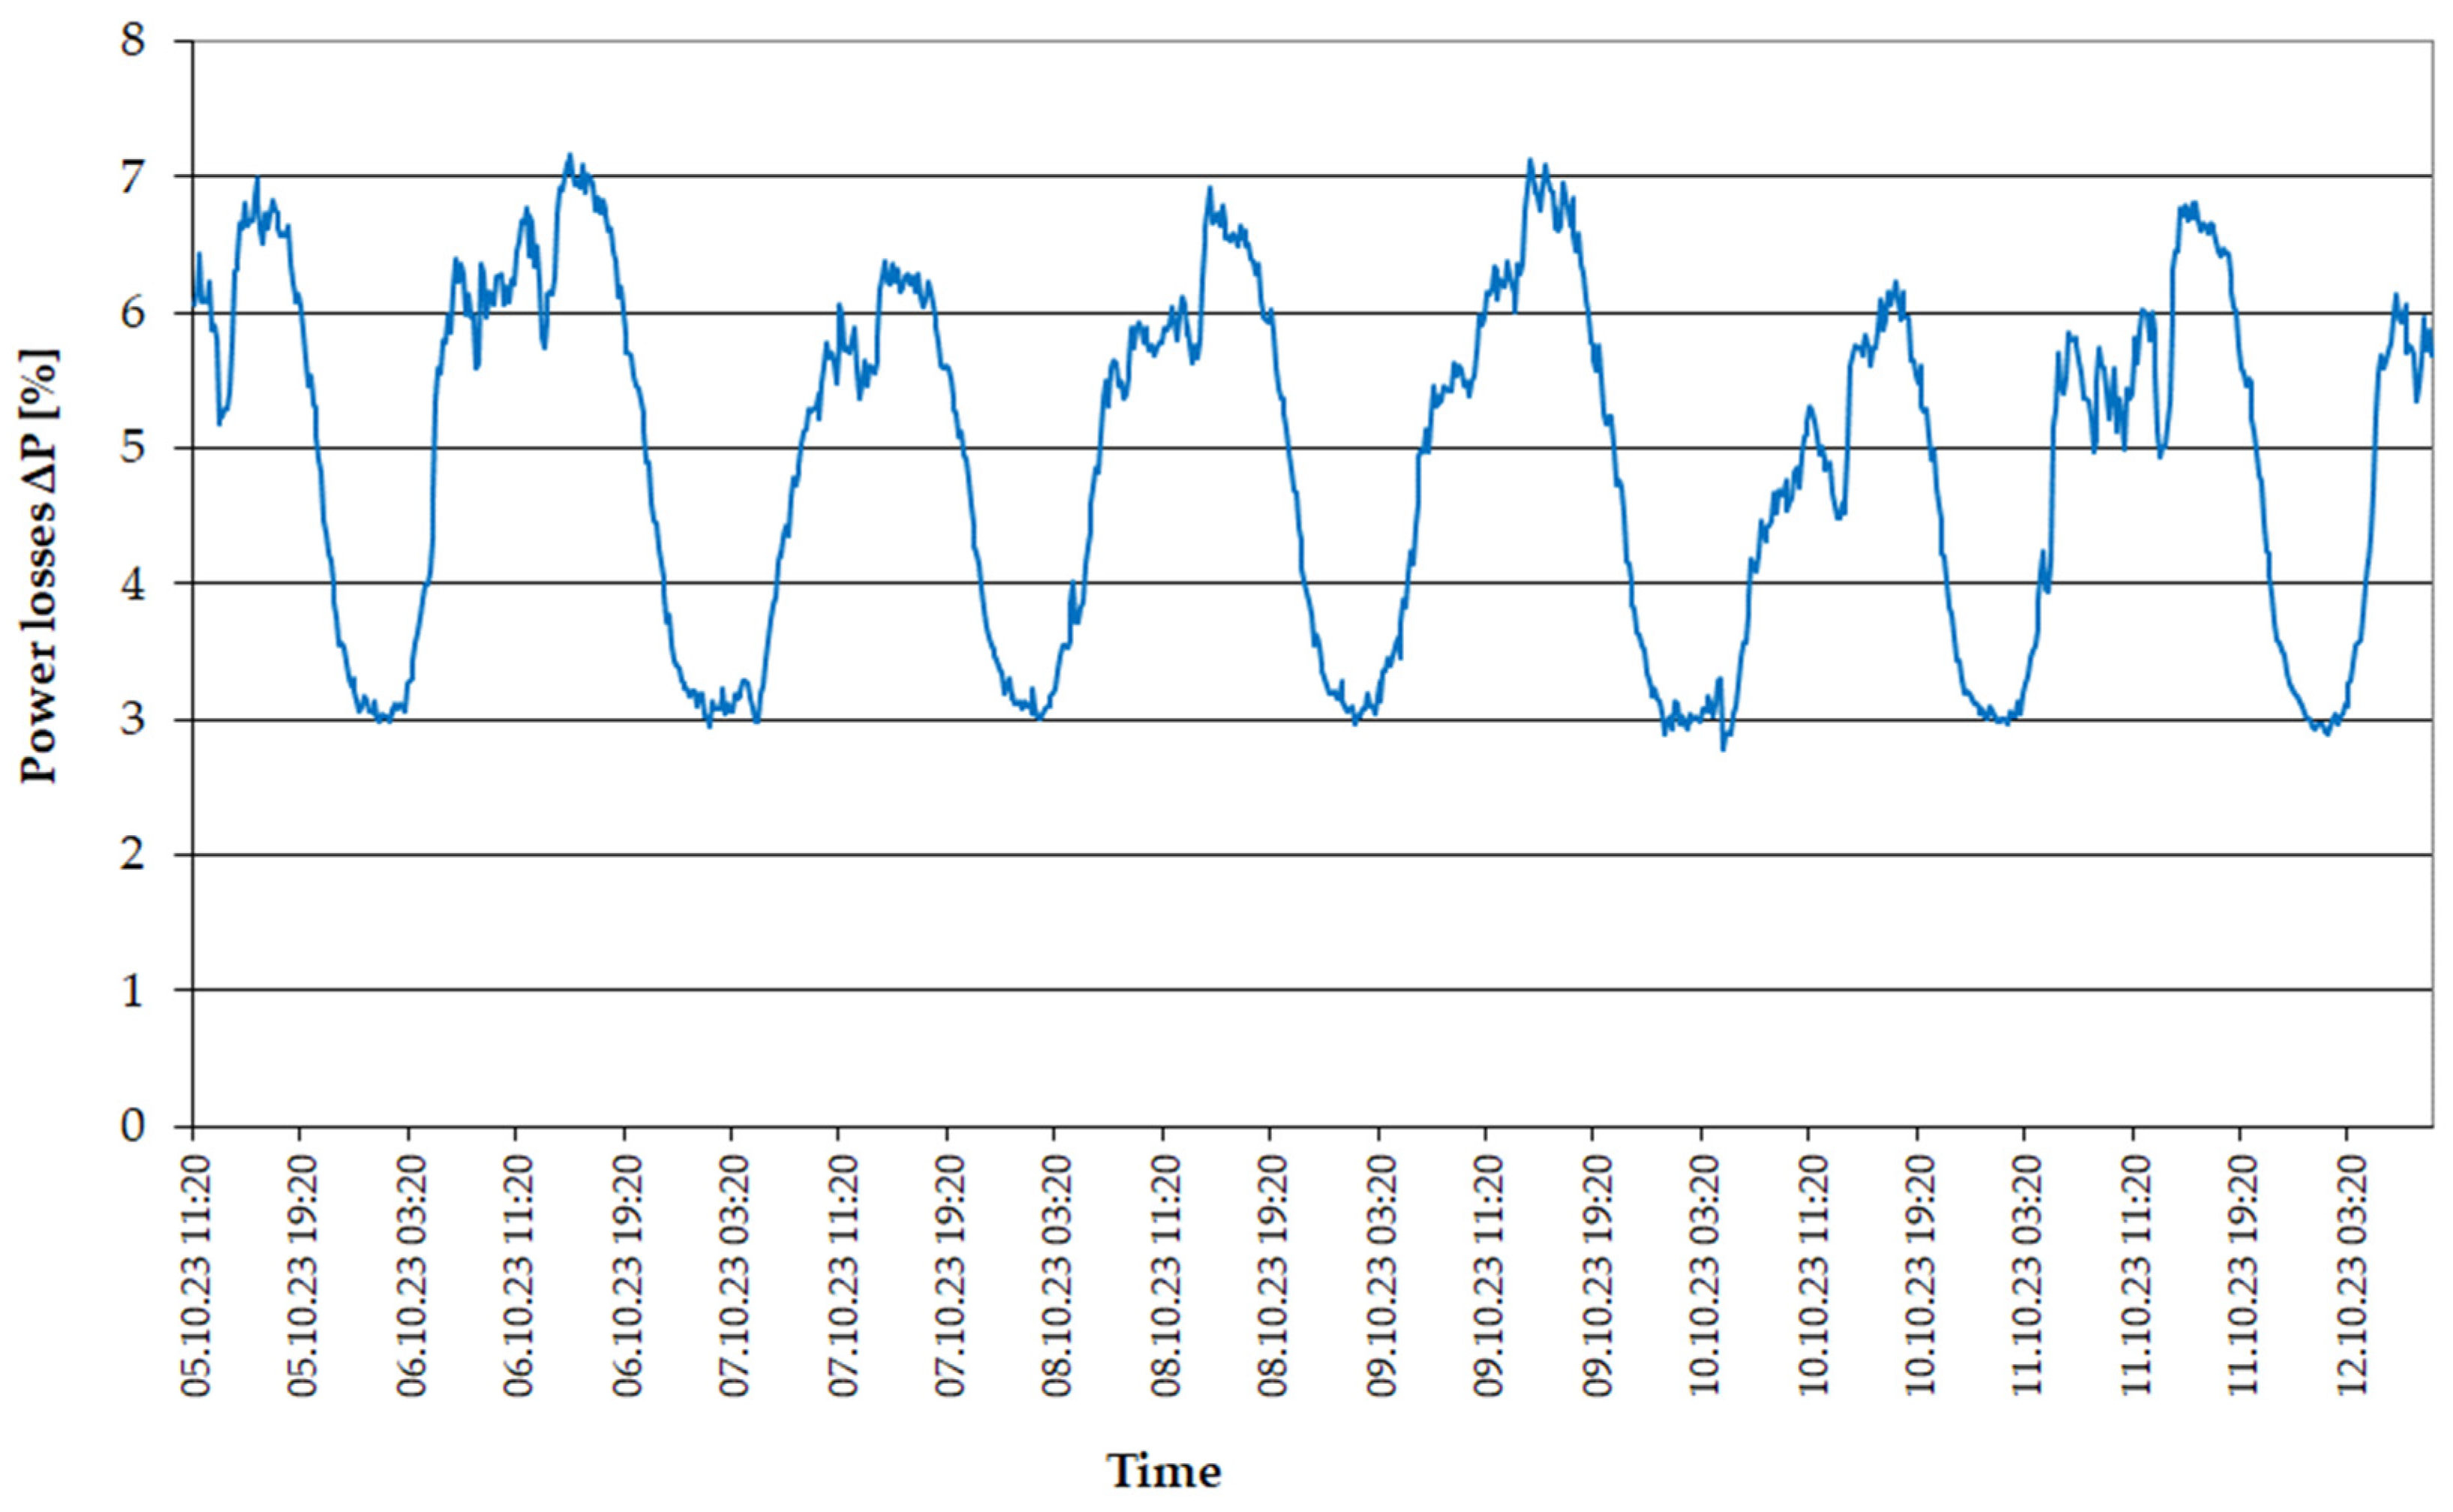
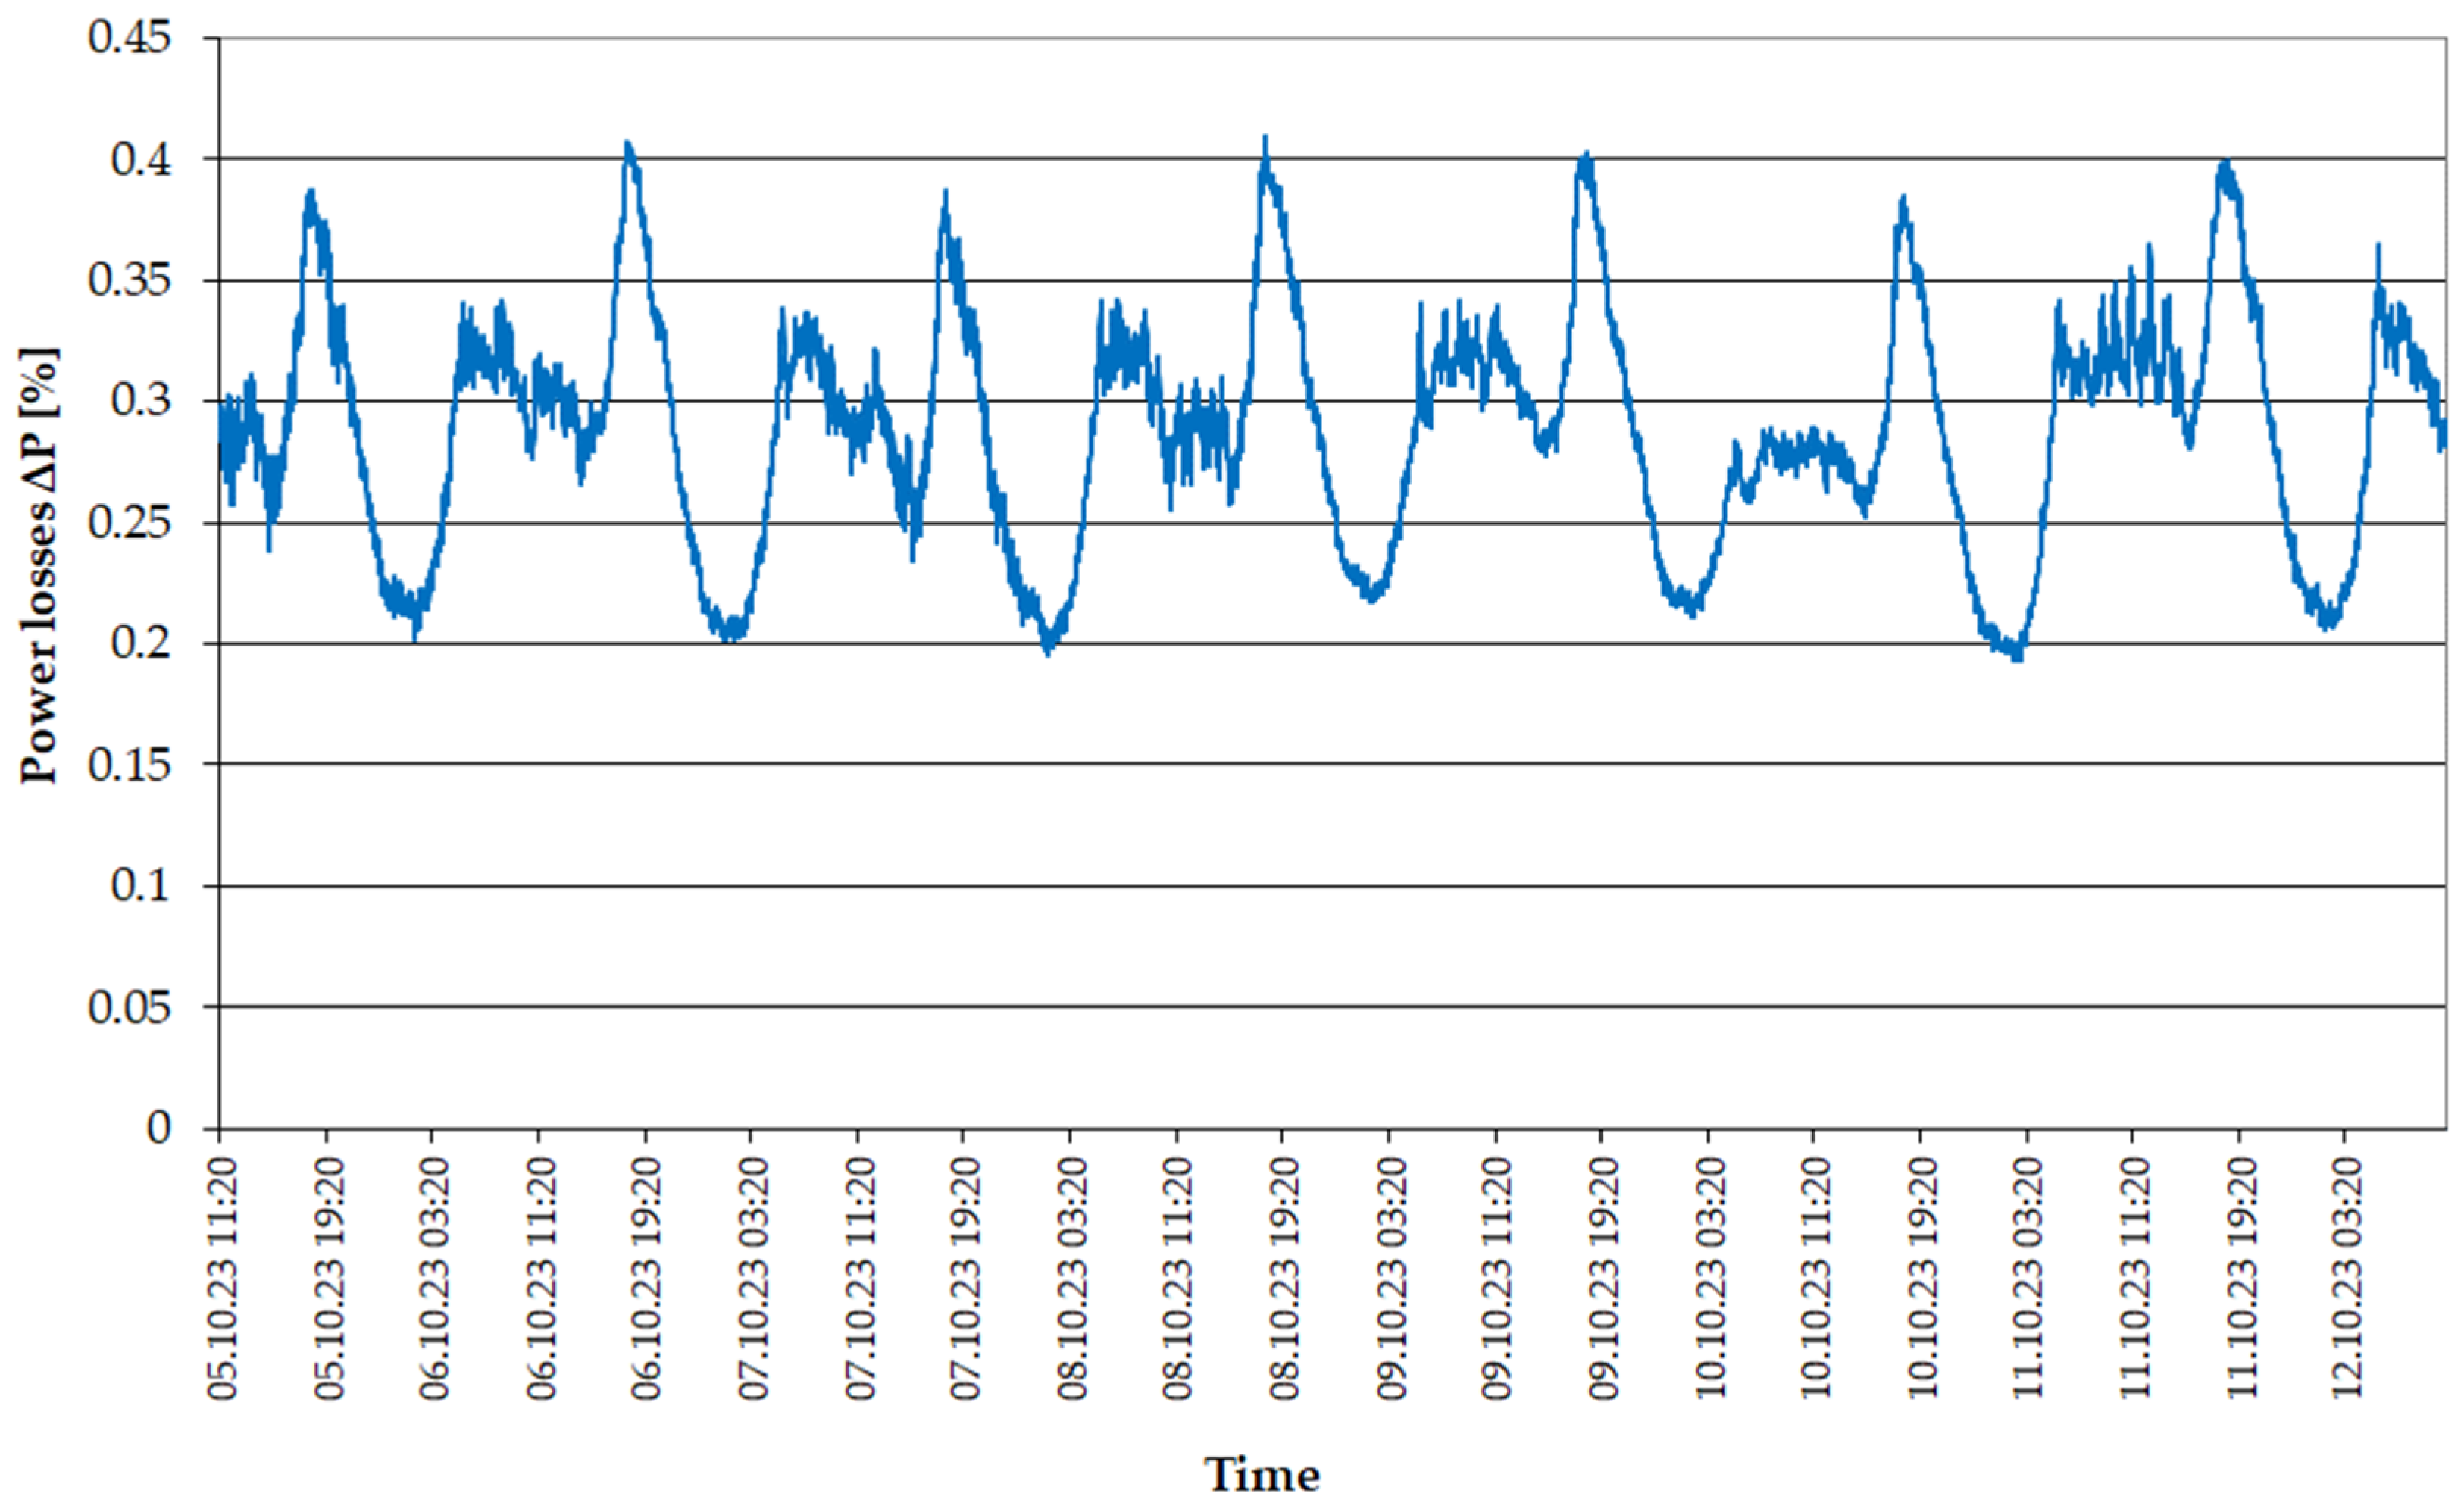
Power losses (determined on the basis of Equation (25)), resulting from the load of line 3 have an analogous course (Figure 7) to the course of (Figure 5) and range, depending on the time of day, from 3% to about 7% of the load power.
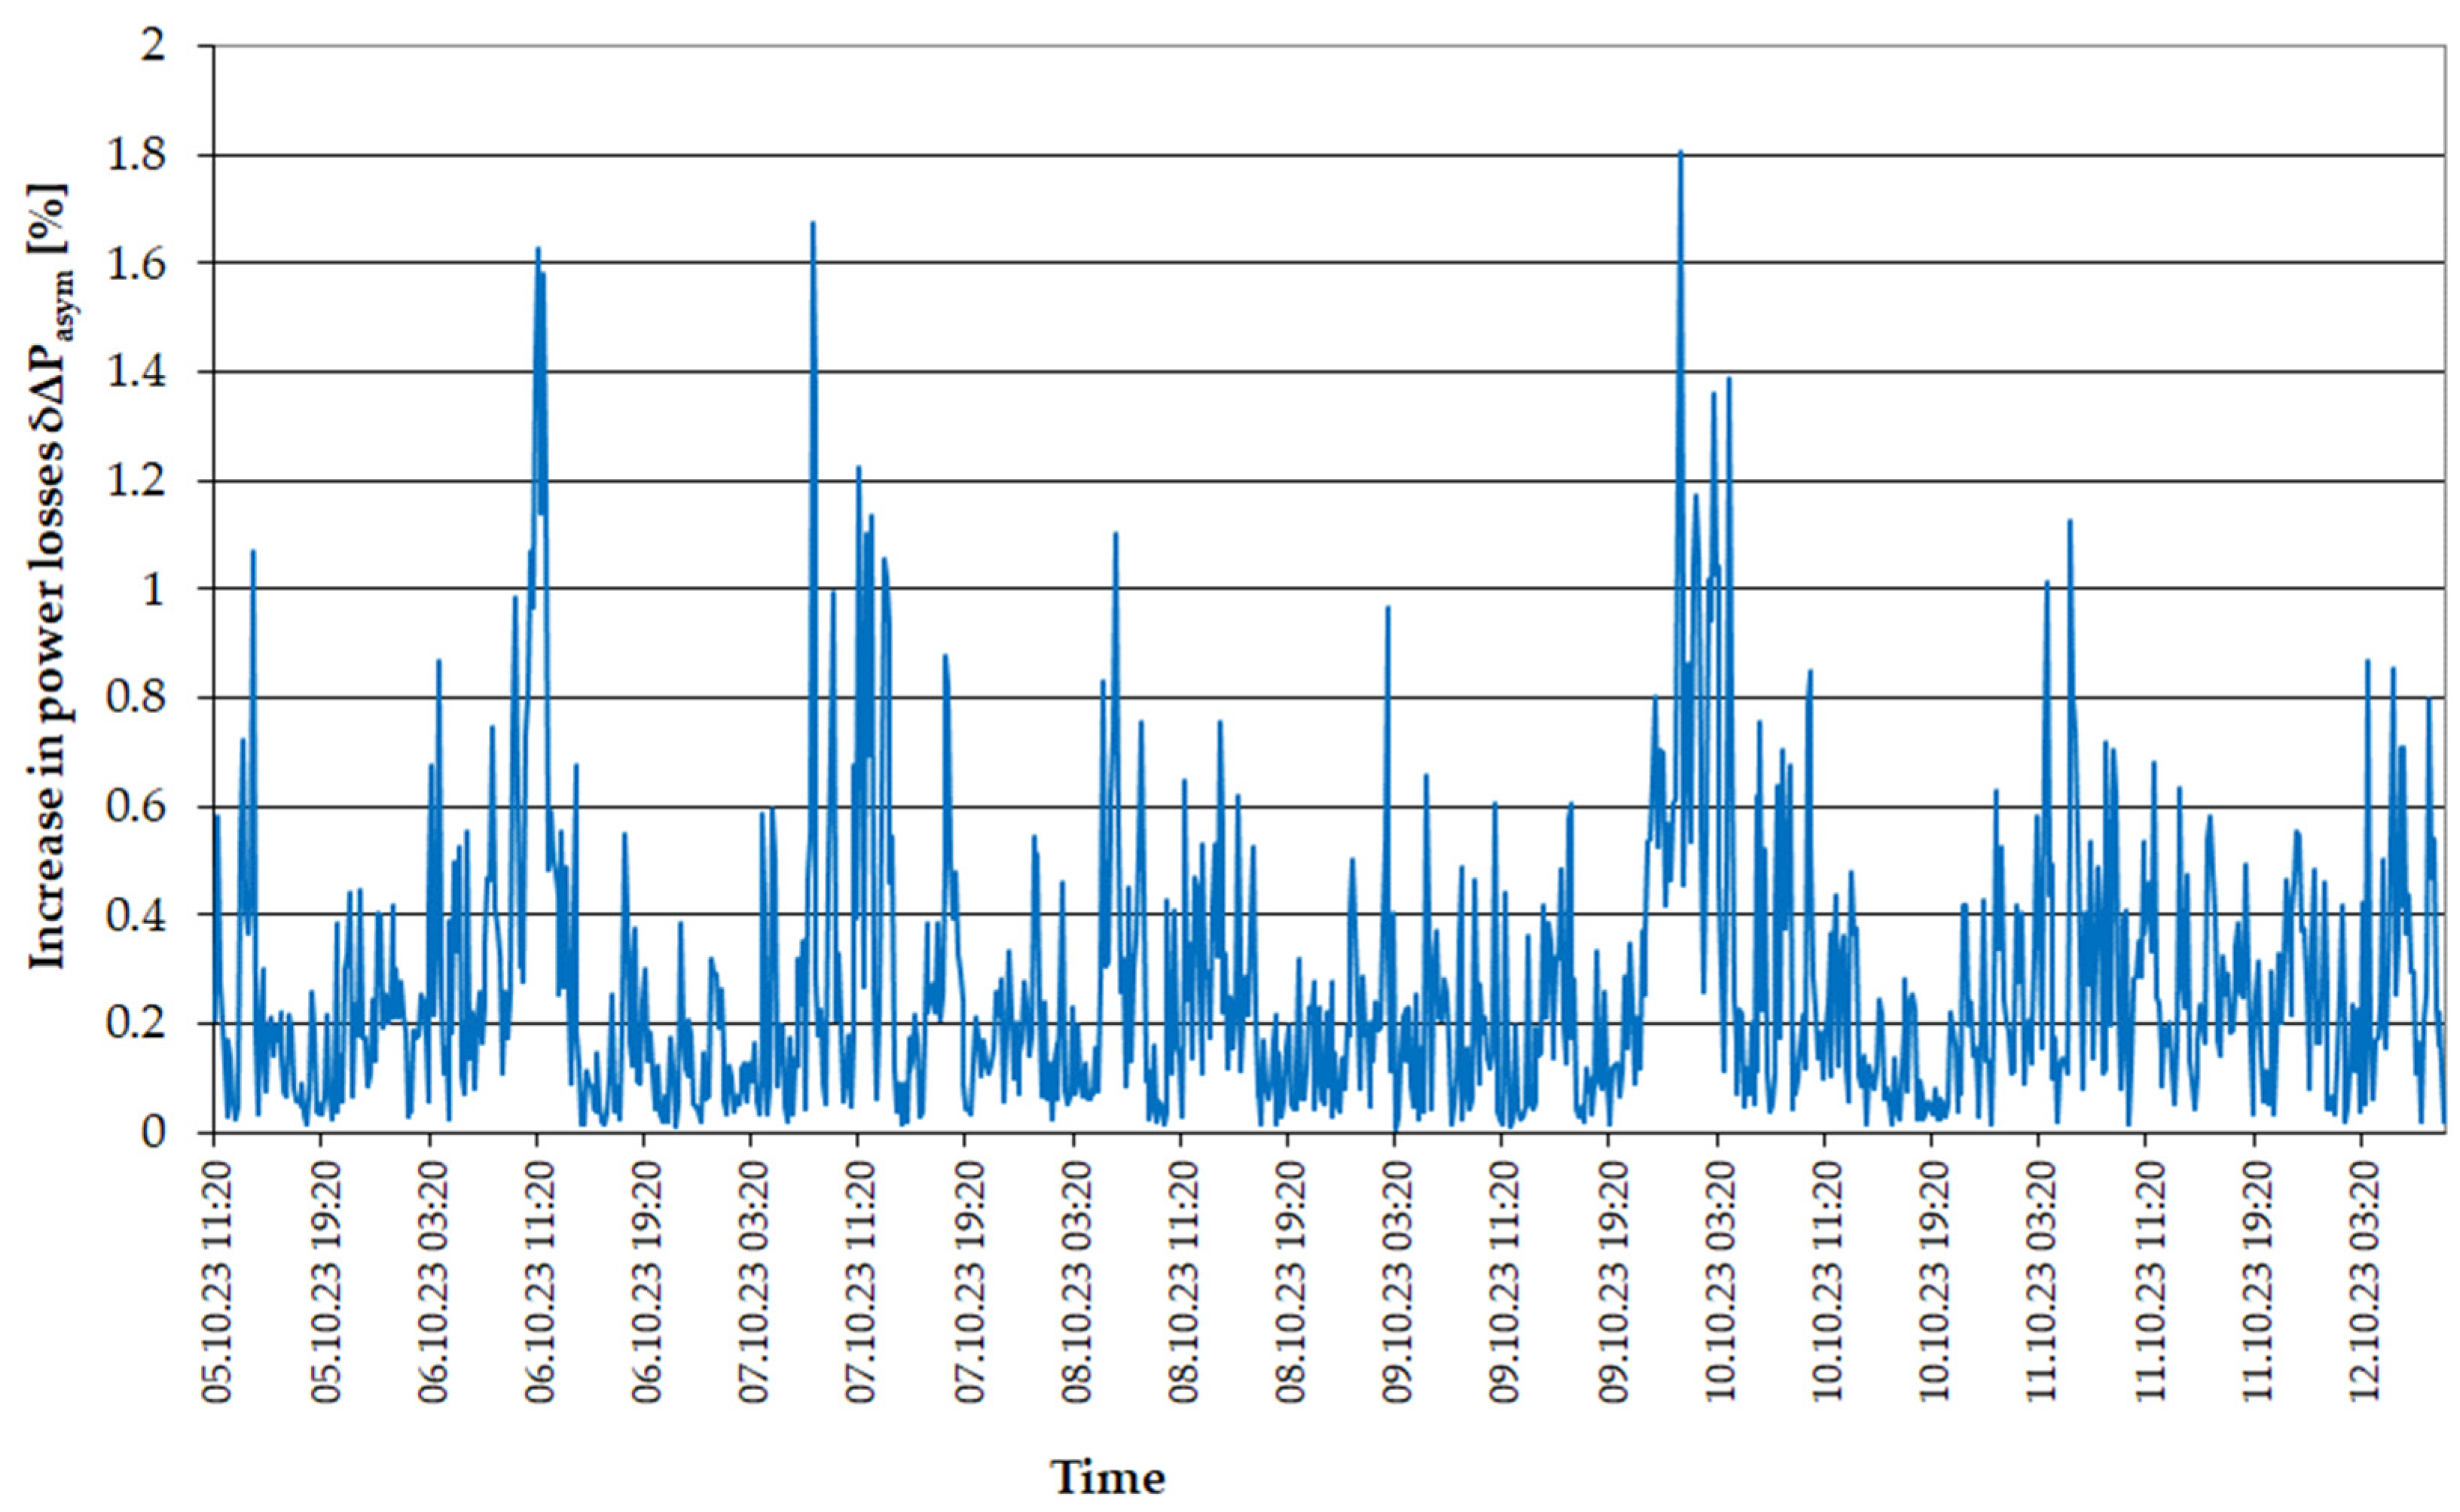
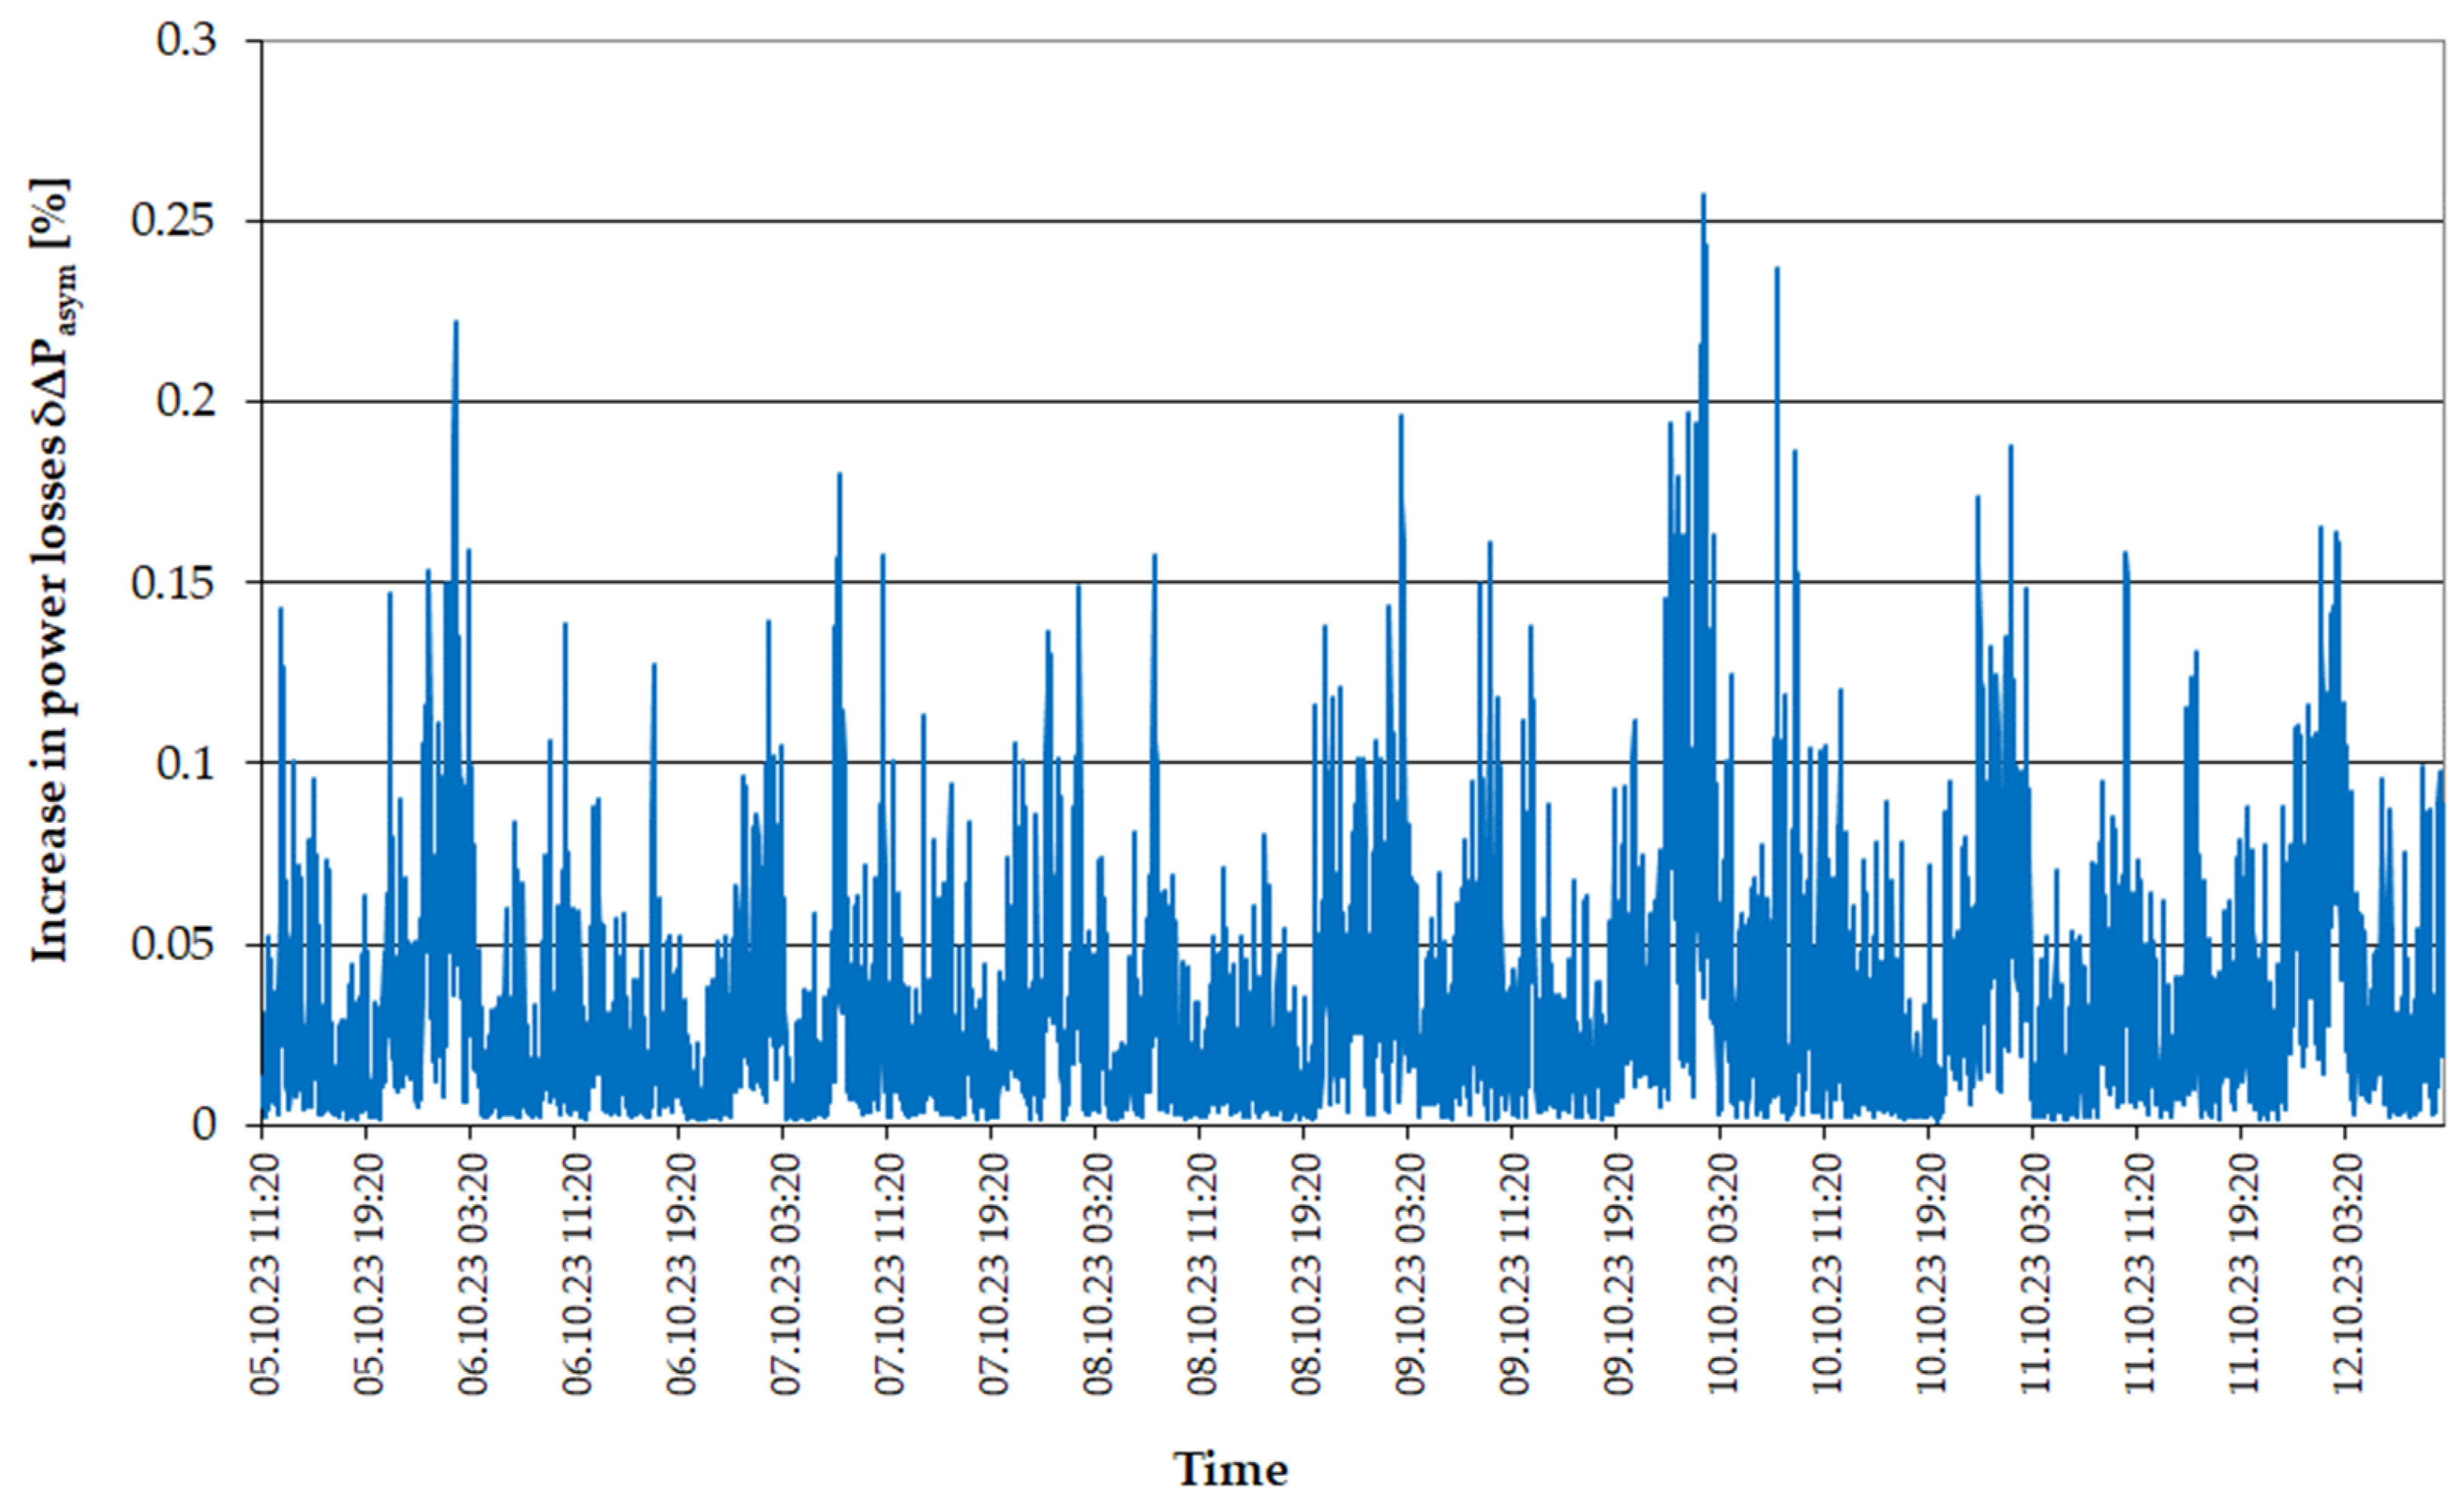
Taking into account Equation (12) and the course of registered currents asymmetry coefficients, the volatility of power loss increases in the line, caused by the asymmetry of the load currents (Figure 8), were determined. In most cases, these values do not exceed 0.6% of general losses, but at peak moments, they reach up to 1.8%. It is worth emphasizing that these losses do not show daily variability, and their course is similar to the course of the negative electricity asymmetry.
In order to verify the power losses occurring on HV/MV transformers, measurements of the volatility of the basic load parameters of both transformers occurring at the examined power station were also made. The registered course of currents in individual phases of the TR-1 transformer is shown in Figure 9. As in the case of the line load, the TR-1 transformer current showed daily variability depending on the time of day.
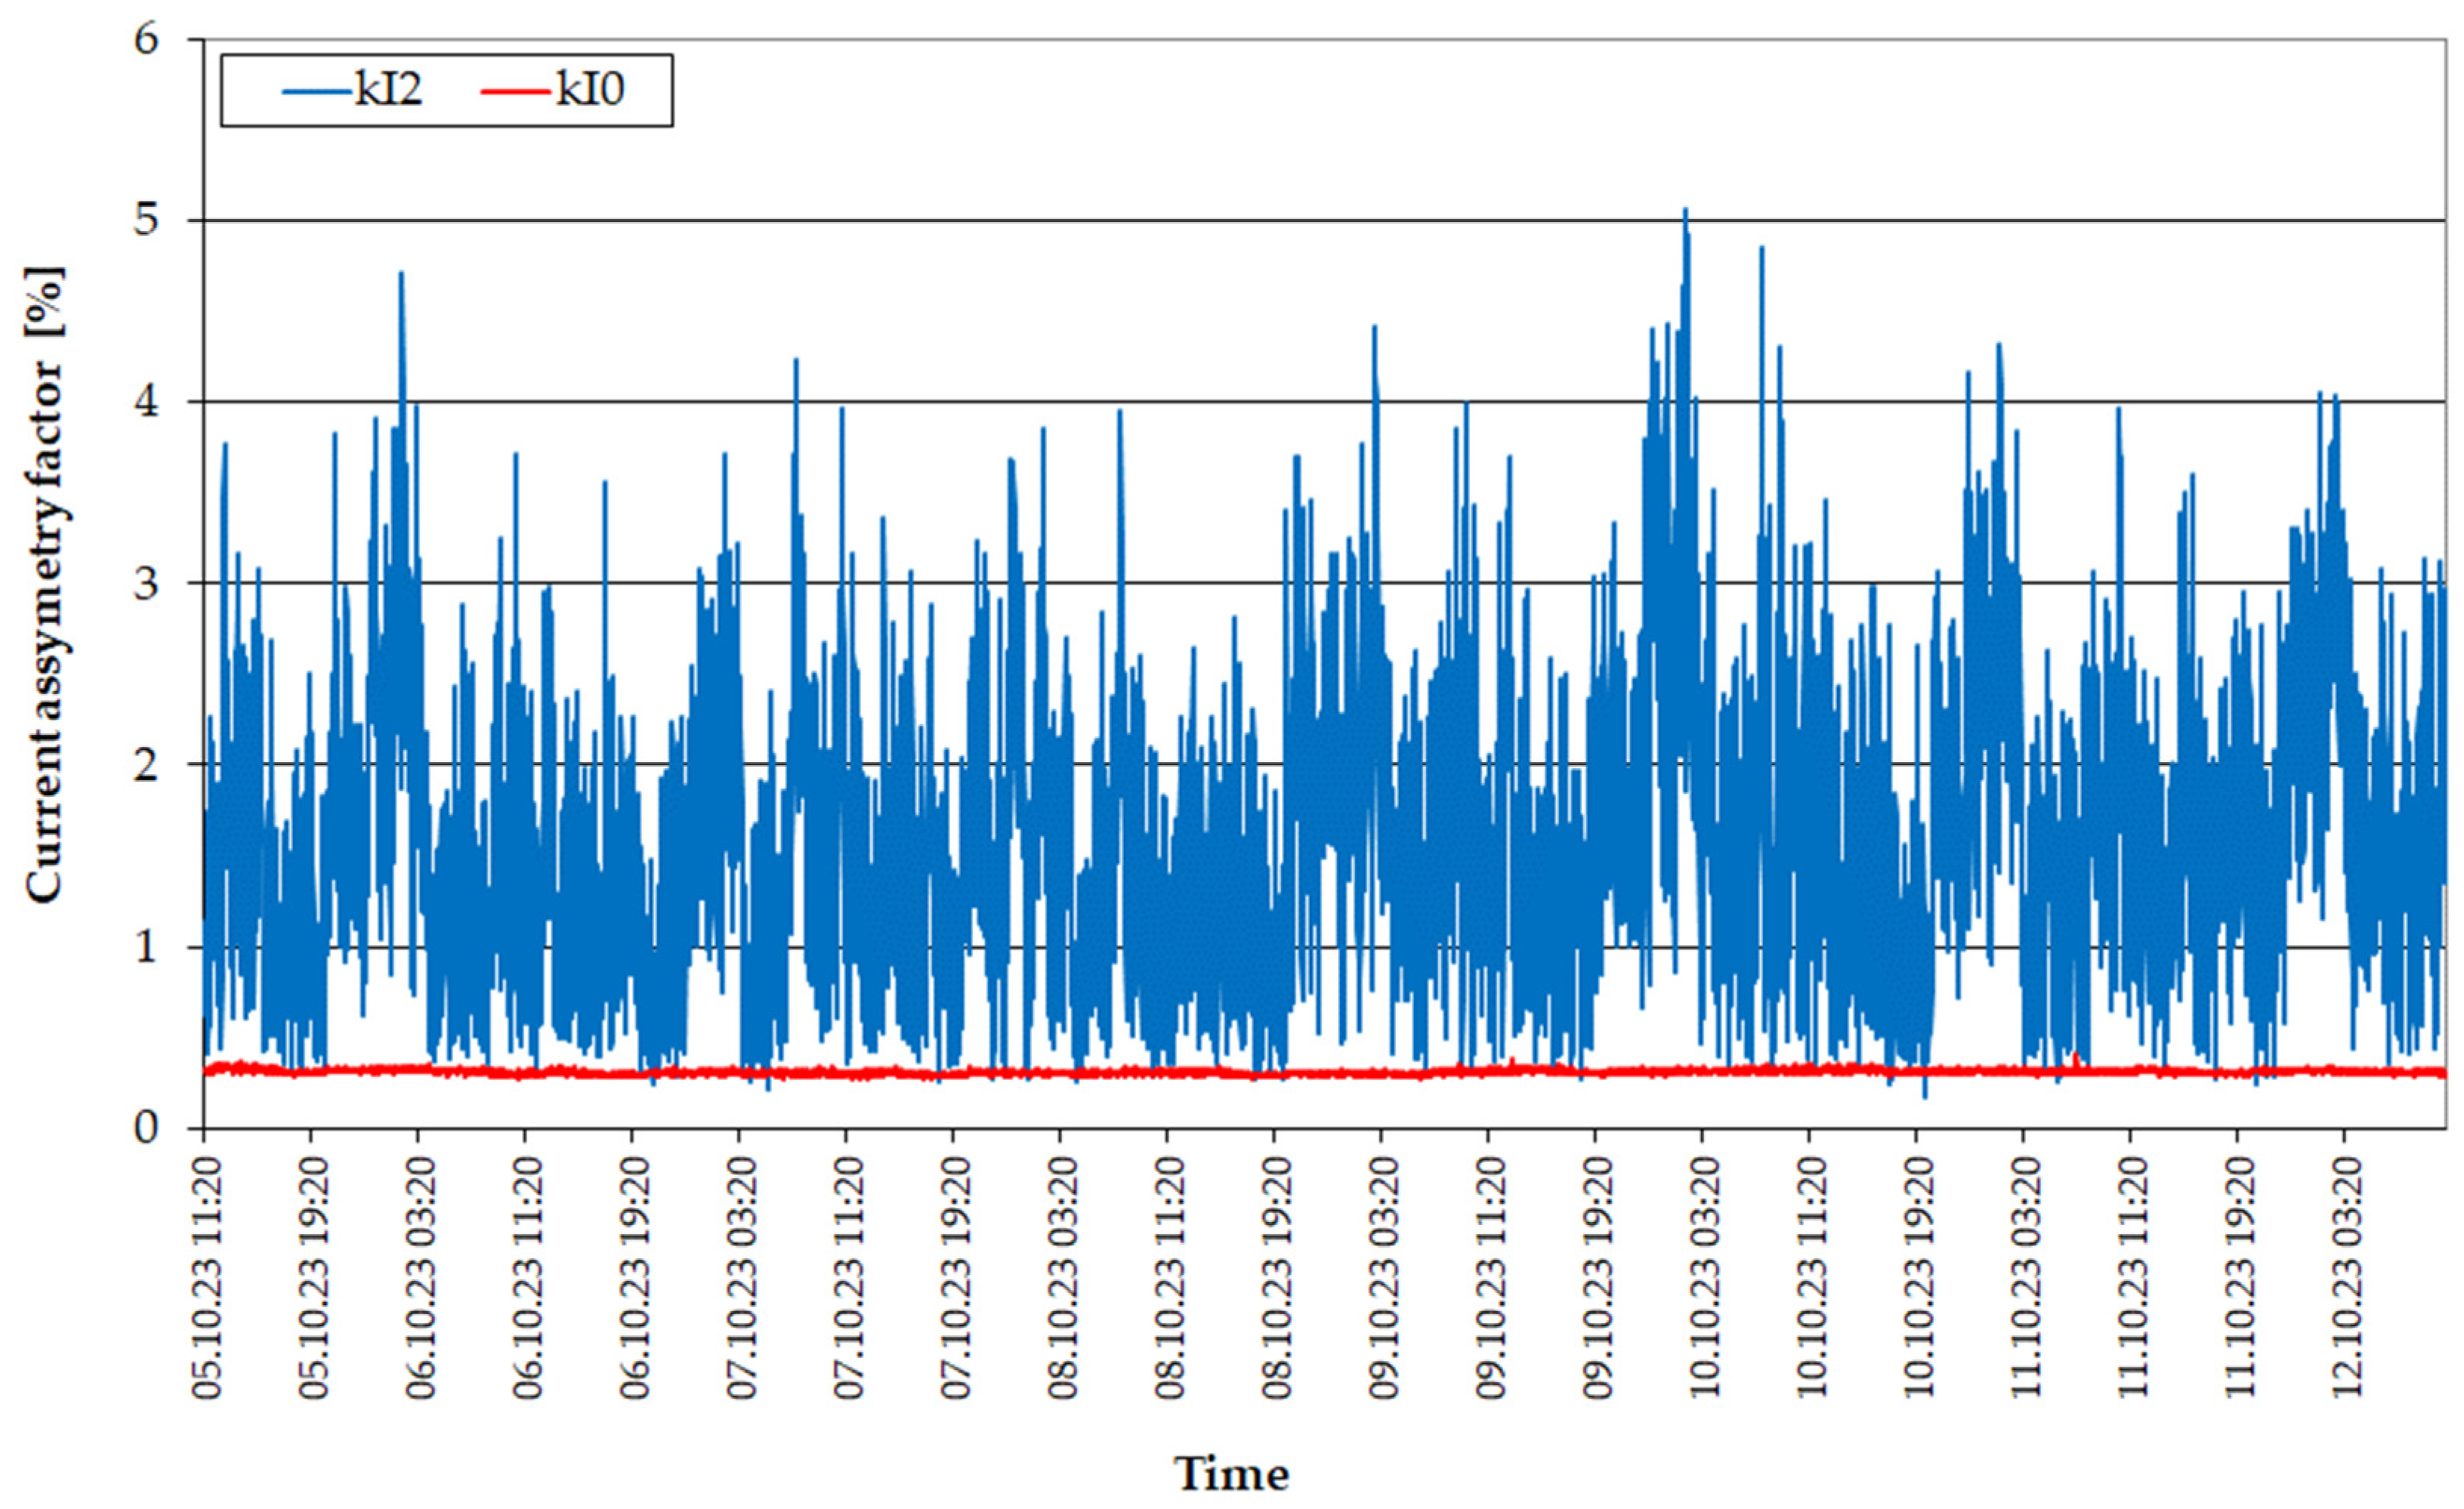
The currents in individual phases were unmatched, reflected in the values of registered currents asymmetry coefficients (Figure 10). Interestingly, the measured values of both coefficients are similar to those in line 3. In addition, similarly to the load on the MV power line, the kI0 factor shows less value and lower deviations than the average value compared to the kU2 coefficient.
The calculated power loss in the transformer (Figure 11) and power loss increases caused by load asymmetry (Figure 12) have a similar course to the course occurring in MV power lines, but the values are much smaller.
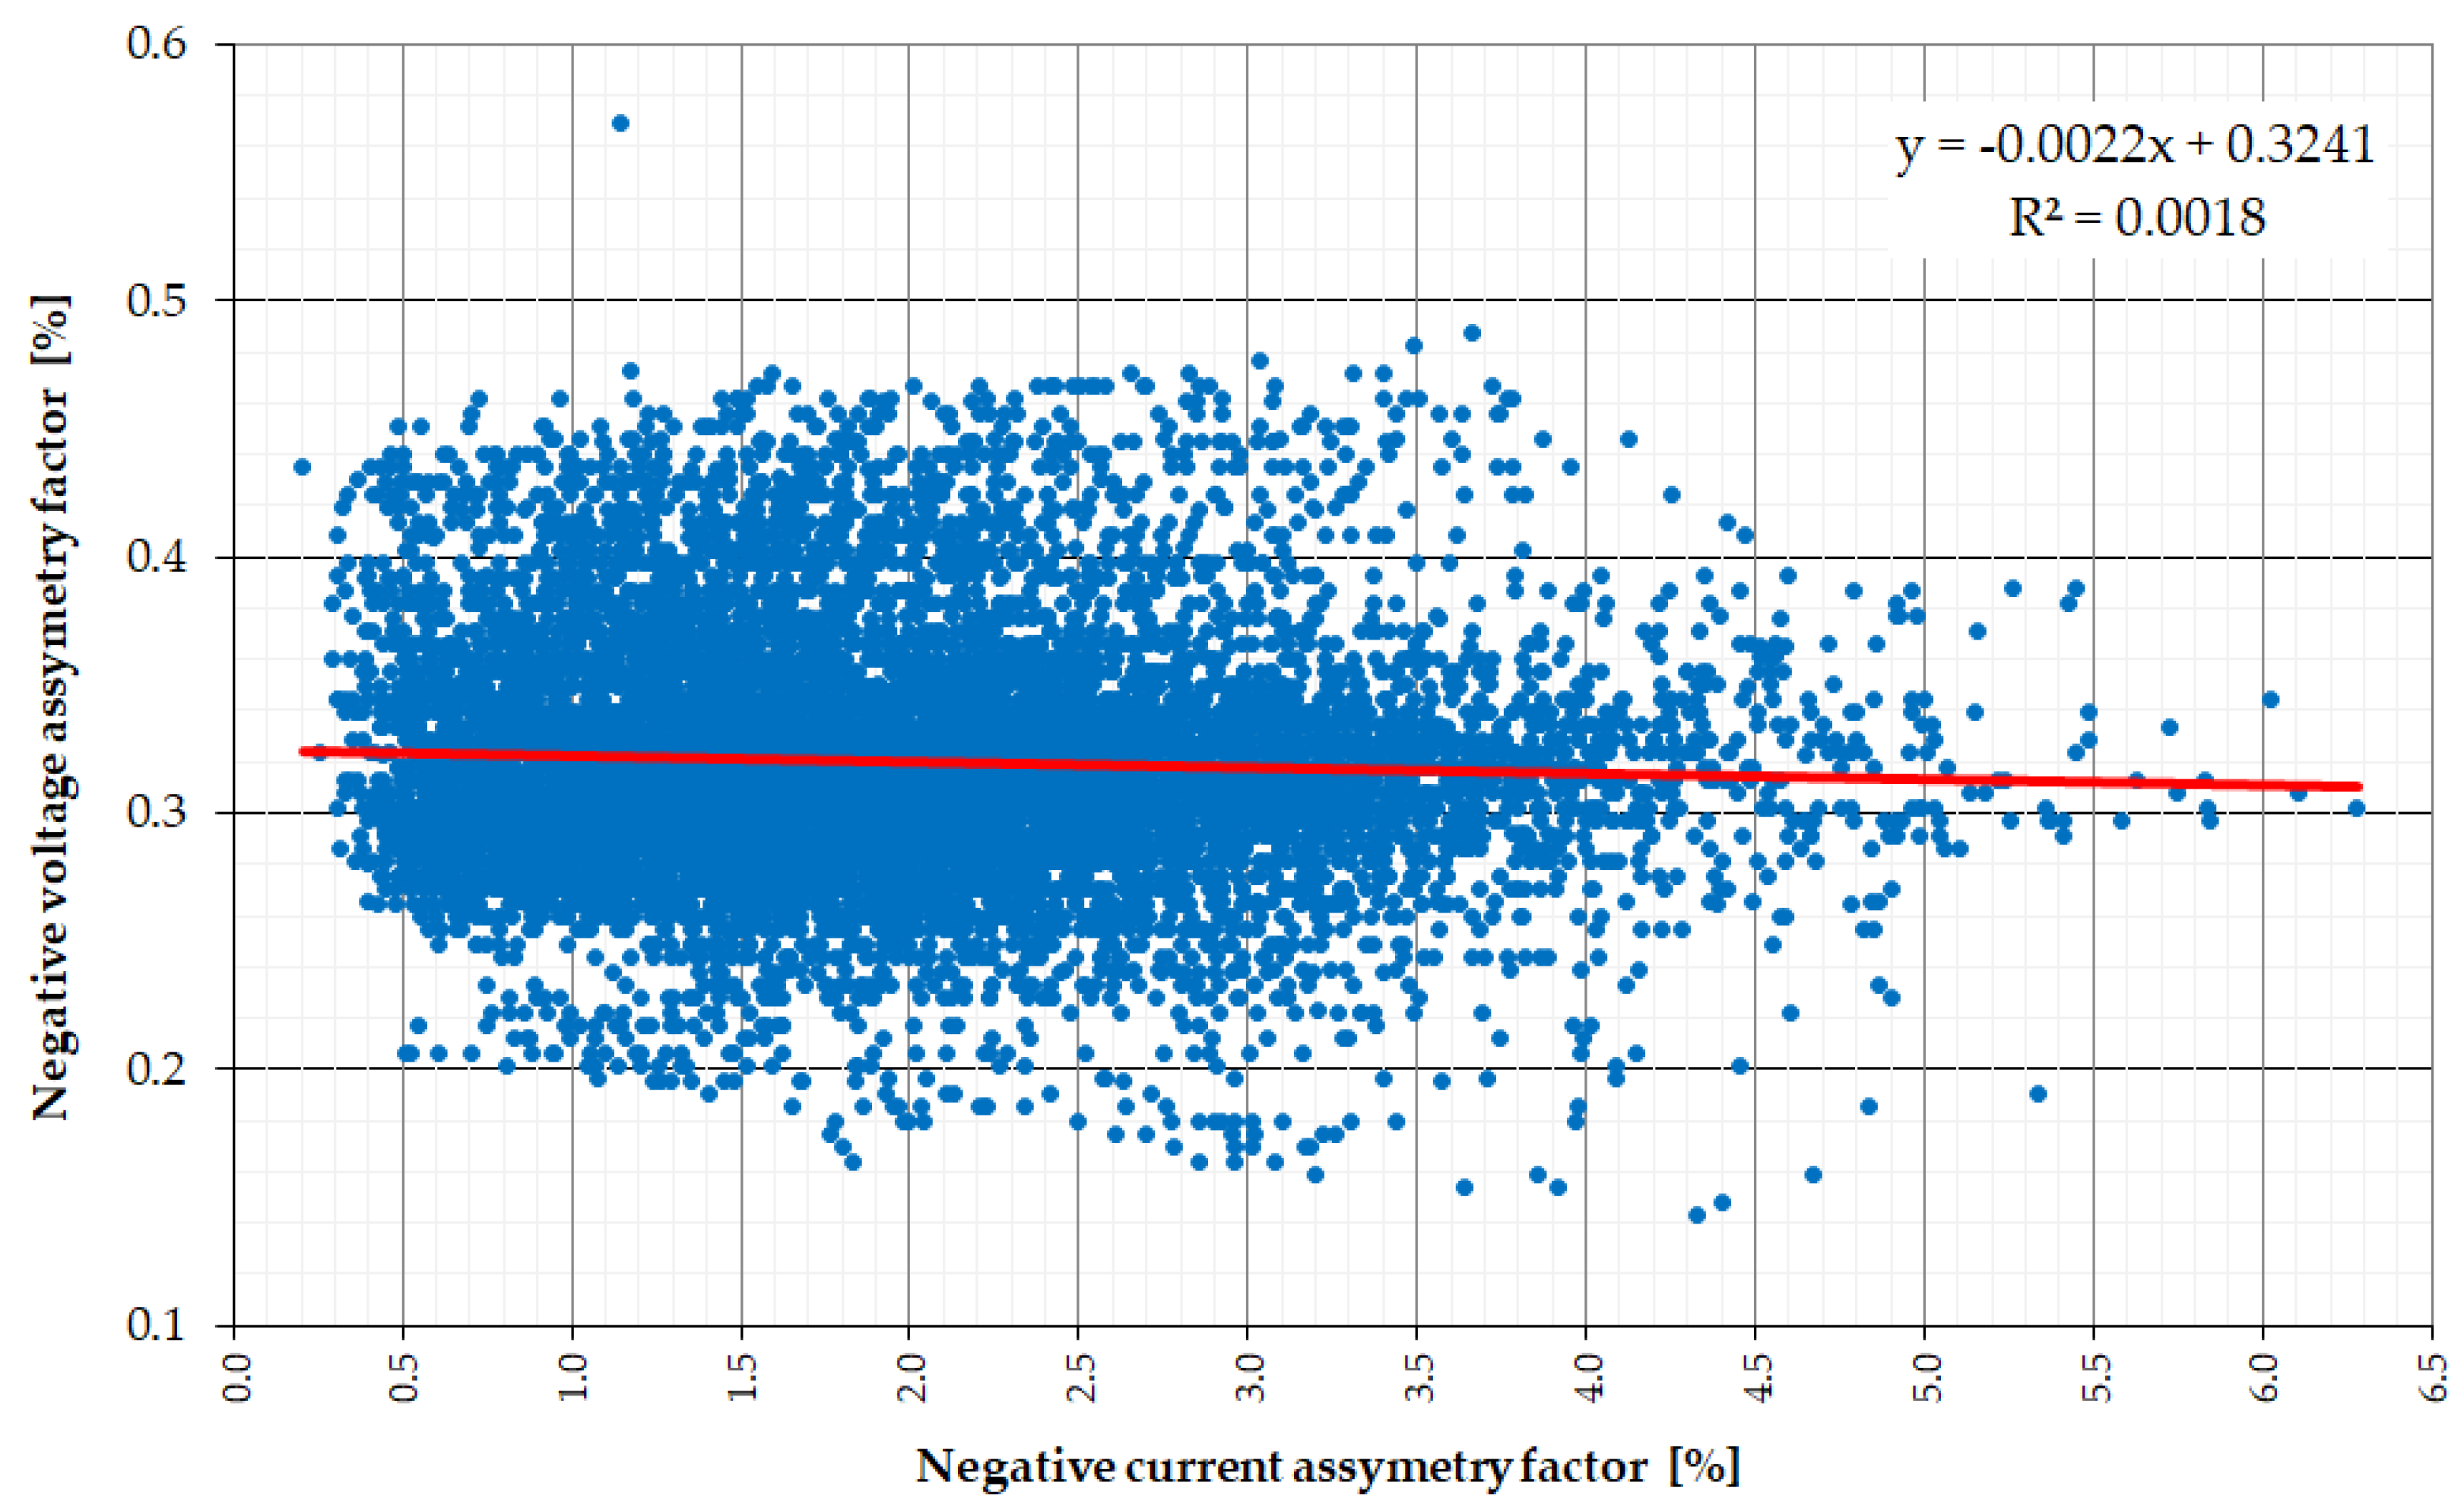
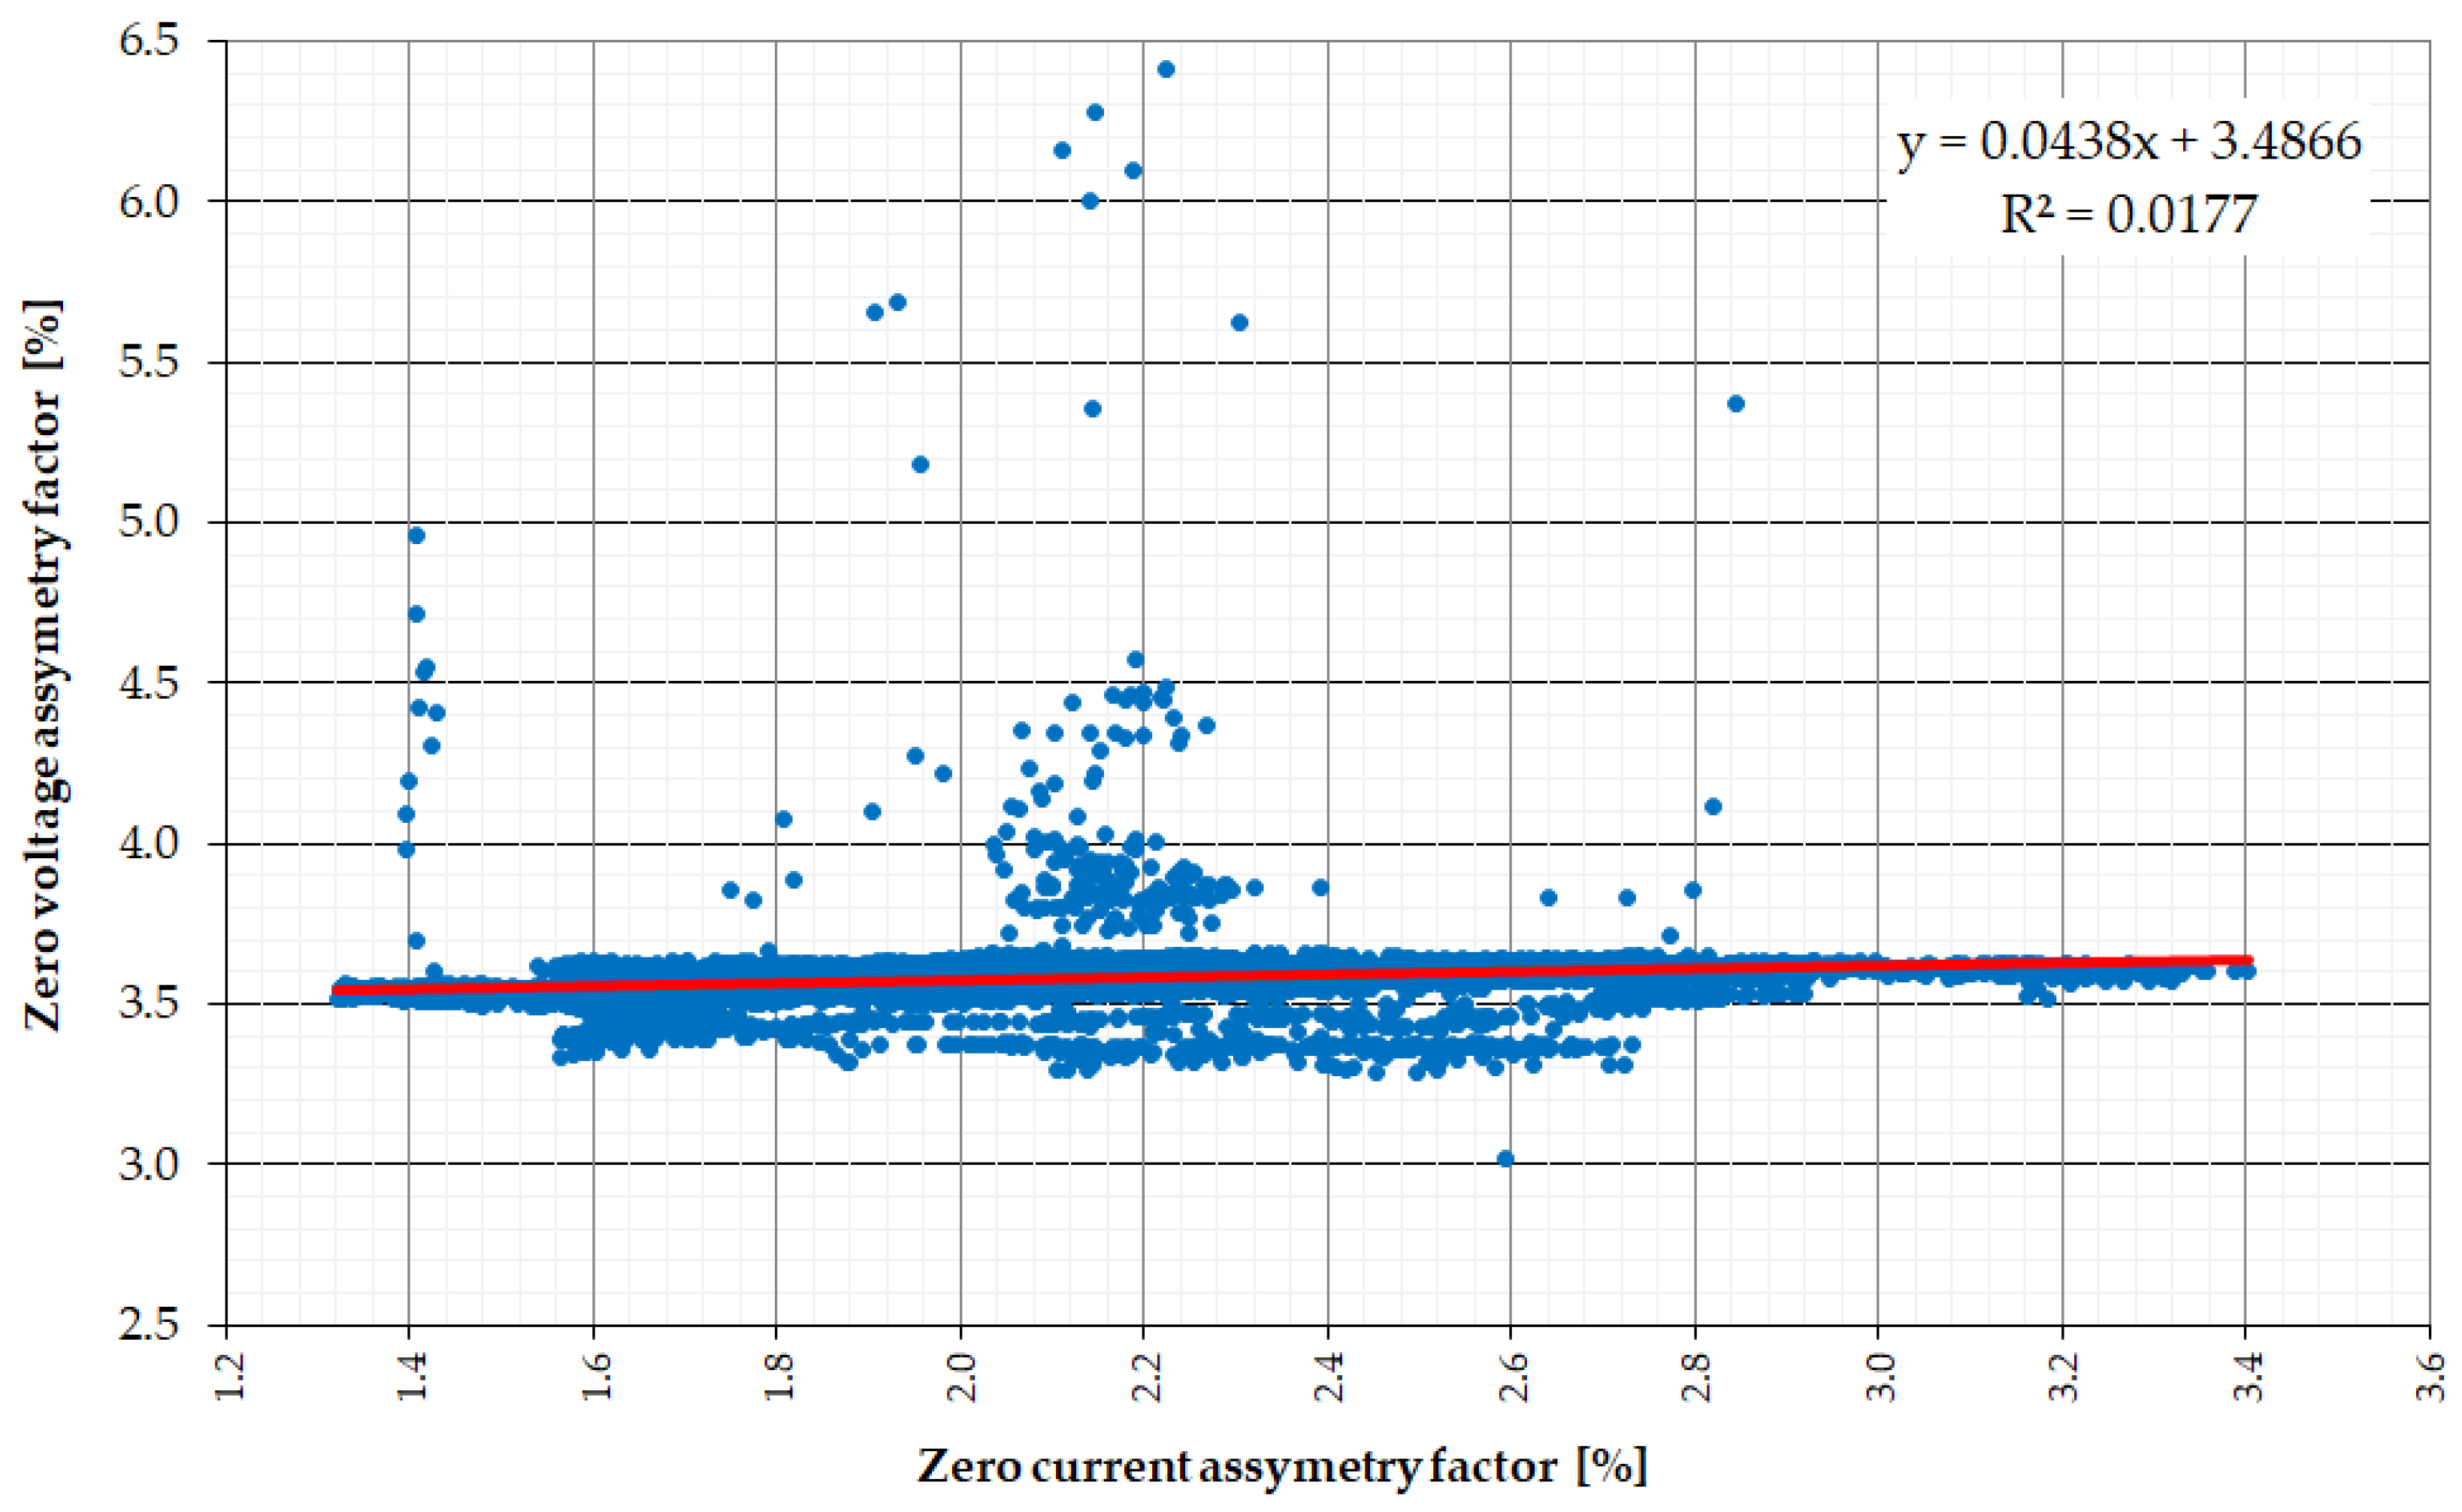
Since uneven phase load is the basic reason for the occurrence of voltage asymmetry in low-voltage networks, the authors decided to take a closer look at the relationship between voltage and current asymmetry. For this purpose, a correlation analysis was performed between voltage asymmetry (zero and negative) and current asymmetry coefficients (Figure 13 and Figure 14). The research did not confirm the relationship between these parameters in both cases. The values of R2 determination coefficients in both cases did not exceed 0.018 (for kU2(kI2) R2 = 0.018, for kU0(kI0) R2 = 0.0177), indicating a fragile relationship. It is also confirmed by the values of the calculated Pearson correlation coefficients r (for kU2(kI2) r = −0.134, for kU0(kI0) r = 0.133).
An aggregate summary of research results for the selected HV/MV power station is presented in Table 3. Due to the desire to maintain the transparency of research results, the authors focused only on presenting the losses of power calculated in individual elements of the tested electrical station. According to the dependencies presented in the previous chapter, the obtained capacity loss values strictly depended on the structure of the line (cross-section and the length of the wires) and their loads. They ranged from nearly 3% to over 17% of the load power. Percentage power losses in HV/MV transformers are significantly smaller and fluctuate around 0.32% (however, it must be remembered that the transformer load is many times greater than the loads registered in medium voltage lines). Total power losses in the studied power system are significant, amounting to 4.75% of the total load power. The total absolute loss values presented in Table 3, expressed in kW, were determined as the sum of all components. In contrast, the relative values expressed as percentages were determined as a weighted average of all components.
Analyzing the percentage values of power loss increases caused by electricity asymmetry, it can be seen that the losses occurring in the TR-2 transformer do not differ significantly from the increases determined for medium voltage lines. The determined increase in power losses caused by current asymmetry took the lowest value in the TR-1 transformer (just over 0.03%), and the highest value of this parameter occurred in line 7 and was nearly 4.8%. The average value of power loss increases registered in the examined system was about 0.87%. The values of the increase in power losses in the line presented in the last column are numerically equal to the errors made when determining power losses using the relationships commonly available in the literature [29,49,50,51,52].
Table 4 presents the results of the analysis of the accuracy of the methods for determining power losses in power networks. The values determined using the method proposed by the authors were compared with the values calculated from relationships commonly known from the literature. In order to estimate the accuracy of these calculations, the values determined from actual electricity meter readings are also provided. The analysis was carried out for lines No. 3 and 7, as only these lines had metering equipment installed, which made it possible to determine the actual power losses occurring in them.
From the analysis of the results shown in Table 4, it can be seen that the values of power losses determined analytically in both cases are smaller than those determined from measurements; however, the error is larger in the case of calculations that use the dependencies commonly available in the literature. These discrepancies, depending on the line analyzed, ranged from 1.63% to 2.24%. This means that not taking into account asymmetry and multipoint loading in the determination of power line power losses leads to significant discrepancies from the actual values occurring in the system, and may be relevant, for example, in power system balancing.

4. Conclusions

Current and voltage asymmetry is a serious problem in many electricity systems worldwide. As indicated in the introduction, various authors have repeatedly undertaken this topic. There are also many publications on power losses in energy lines and transformers. However, most of these analyzes apply to homogeneous lines, characterized by the same load on the entire length, which in practice is rare. For this reason, the authors presented a modified method that allows for the calculation of power loss in systems with loads at many points while considering the asymmetry of currents in individual phases. Analyses carried out based on field tests have shown that not considering the increase in power losses caused by load asymmetry can lead to significant errors, reaching up to 5.5%. Therefore, the use of relationships available in the literature to determine power losses may lead to an incorrect estimation of the amount of energy necessary to cover the energy demand of the power system in a given country or region. The determined power loss values depended strictly on the cross-section and length of the wires in the line and their load (they ranged from 3 to over 17% of the load power). It was noticed that the tested loss increments in HV/MV transformers were much smaller than in the lines, and did not exceed 0.3% in the analyzed system. Furthermore, research has demonstrated no discernible relationship between the voltage unbalance factor and the current unbalance factor in actual Medium Voltage systems, including the negative and zero components. The values of the correlation coefficients r between these values recorded during field tests did not exceed 0.13 (which indicates a fragile relationship), and the calculated coefficient of determination R2 did not exceed 0.02. This means that the change in the value of the current asymmetry coefficient does not help explain the change in the value of the voltage asymmetry coefficient. In further research, the authors plan to take a closer look at this relationship.

Author Contributions

Conceptualization, G.H. and Z.S.; methodology, G.H.; software, G.H.; validation, G.H. and Z.S.; formal analysis, G.H., Z.S. and W.W.; investigation, G.H.; resources, G.H. and Z.S.; data curation, G.H. and Z.S.; writing—original draft preparation, G.H. and W.W.; writing—review and editing, G.H. and W.W.; visualization, G.H. and W.W.; supervision, W.W.; project administration, G.H. and Z.S.; funding acquisition, W.W. All authors have read and agreed to the published version of the manuscript.

Funding

The work was supported by scientific work WZ/WE-IA/7/2023 conducted in the Department of Electrotechnics, Power Electronics and Electrical Power Engineering at Bialystok University of Technology.

Data Availability Statement

The original contributions presented in the study are included in the article, further inquiries can be directed to the corresponding author.

Conflicts of Interest

The authors declare no conflicts of interest.

References

  1. Rafał, K.; Biskupski, J.; Bykuć, S.; Chaja, P. Dynamic Voltage Regulation and Unbalance Compensation in a Low-Voltage Distribution Network Using Energy Storage System. Appl. Sci. 2022, 12, 11678. [Google Scholar] [CrossRef]
  2. Pourasl, H.H.; Barenji, R.V.; Khojastehnezhad, V.M. Solar energy status in the world: A comprehensive review. Energy Rep. 2023, 10, 3474–3493. [Google Scholar] [CrossRef]
  3. Larina, Y.; Galchynska, J.; Kucheruk, P.; Zghurska, O.; Ortina, G.; Al-Nadzhar, F.; Marusei, T.; Kubon, M.; Dzieniszewski, G. Estimation of the Domestic Agricultural Sector Potential for the Growth of Energy Cultures for Bioenergy Fuel Production. Agric. Eng. 2021, 25, 73–82. [Google Scholar] [CrossRef]
  4. Ismael, S.M.; Abdel Aleem, S.H.E.; Abdelaziz, A.Y.; Zobaa, A.F. State-of-the-art of hosting capacity in modern power systems with distributed generation. Renew. Energy 2019, 130, 1002–1020. [Google Scholar] [CrossRef]
  5. Babu, V.V.; Roselyn, J.P.; Sundaravadivel, P. Coordination of SRF-PLL and Grid Forming Inverter Control in Microgrid with Solar PV and Energy Storage. J. Low Power Electron. Appl. 2024, 14, 29. [Google Scholar] [CrossRef]
  6. Al Kez, D.; Foley, A.M.; McIlwaine, N.; Morrow, D.J.; Hayes, B.P.; Zehir, M.A.; Mehigan, L.; Papari, B.; Edrington, C.S.; Baran, M. A critical evaluation of grid stability and codes, energy storage and smart loads in power systems with wind generation. Energy 2020, 205, 117671. [Google Scholar] [CrossRef]
  7. Hołdyński, G.; Skibko, Z.; Borusiewicz, A. Analysis of the Influence of Load on the Value of Zero-Voltage Asymmetry in Medium-Voltage Networks Operating with Renewable Energy Sources. Energies 2023, 16, 580. [Google Scholar] [CrossRef]
  8. Hołdyński, G.; Skibko, Z.; Firlit, A.; Walendziuk, W. Analysis of the Impact of a Photovoltaic Farm on Selected Parameters of Power Quality in a Medium-Voltage Power Grid. Energies 2024, 17, 623. [Google Scholar] [CrossRef]
  9. Ferreira, P.D.F.; Carvalho, P.M.S.; Ferreira, L.A.F.M.; Ilic, M.D. Distributed energy resources integration challenges in low-voltage networks: Voltage control limitations and risk of cascading. IEEE Trans. Sustain. Energy 2013, 4, 82–88. [Google Scholar] [CrossRef]
  10. Ghosh, S.; Rahman, S.; Pipattanasomporn, M. Distribution Voltage Regulation Through Active Power Curtailment with PV Inverters and Solar Generation Forecasts. IEEE Trans. Sustain. Energy 2017, 8, 13–22. [Google Scholar] [CrossRef]
  11. Demirok, E.; González, P.C.; Frederiksen, K.H.B.; Sera, D.; Rodriguez, P.; Teodorescu, R. Local Reactive Power Control Methods for Overvoltage Prevention of Distributed Solar Inverters in Low-Voltage Grids. IEEE J. Photovolt. 2011, 2, 174–182. [Google Scholar] [CrossRef]
  12. Nejabatkhah, F.; Li, Y.W. Flexible Unbalanced Compensation of Three-Phase Distribution System Using Single-Phase Distributed Generation Inverters. IEEE Trans. Smart Grid 2017, 10, 1845–1857. [Google Scholar] [CrossRef]
  13. Kabir, M.N.; Mishra, Y.; Ledwich, G.; Dong, Z.Y.; Wong, K.P. Coordinated Control of Grid-Connected Photovoltaic Reactive Power and Battery Energy Storage Systems to Improve the Voltage Profile of a Residential Distribution Feeder. IEEE Trans. Ind. Inform. 2014, 10, 967–977. [Google Scholar] [CrossRef]
  14. Kuboń, M.; Skibko, Z.; Tabor, S.; Malaga-Toboła, U.; Borusiewicz, A.; Romaniuk, W.; Zarajczyk, J.; Neuberger, P. Analysis of Voltage Distortions in the Power Grid Arising from Agricultural Biogas Plant Operation. Energies 2023, 16, 6189. [Google Scholar] [CrossRef]
  15. Pamuk, N.; Uzun, U.E. Optimal Allocation of Distributed Generations and Capacitor Banks in Distribution Systems Using Arithmetic Optimization Algorithm. Appl. Sci. 2024, 14, 831. [Google Scholar] [CrossRef]
  16. Watson, J.D.; Watson, N.R.; Lestas, I. Optimized dispatch of energy storage systems in unbalanced distribution networks. IEEE Trans. Sustain. Energy 2017, 9, 639–650. [Google Scholar] [CrossRef]
  17. Hock, R.T.; de Novaes, Y.R.; Batschauer, A.L. A Voltage Regulator for Power Quality Improvement in Low-Voltage Distribution Grids. IEEE Trans. Power Electron. 2018, 33, 2050–2060. [Google Scholar] [CrossRef]
  18. El-Naggar, A.; Erlich, I. Control approach of three-phase grid connected PV inverters for voltage unbalance mitigation in low-voltage distribution grids. IET Renew. Power Gener. 2016, 10, 1577–1586. [Google Scholar] [CrossRef]
  19. Prístavka, M.; Findura, P.; Beloev, I.; Kuboń, M.; Hrdá, V.; Kovalyshyn, S.; Shchur, T. Verification of the Measurement System in a Production Organization. Agric. Eng. 2022, 26, 81–90. Available online: https://sciendo.com/article/10.2478/agriceng-2022-0007 (accessed on 24 June 2024). [CrossRef]
  20. Shahnia, F.; Majumder, R.; Ghosh, A.; Ledwich, G.; Zare, F. Voltage imbalance analysis in residential low voltage distribution networks with rooftop PVs. Electr. Power Syst. Res. 2011, 81, 1805–1814. [Google Scholar] [CrossRef]
  21. Ciontea, C.I.; Iov, F. A Study of Load Imbalance Influence on Power Quality Assessment for Distribution Networks. Electricity 2021, 2, 77–90. [Google Scholar] [CrossRef]
  22. Hussan, M.R.; Sarwar, M.I.; Sarwar, A.; Tariq, M.; Ahmad, S.; Shah Noor Mohamed, A.; Khan, I.A.; Ali Khan, M.M. Aquila Optimization Based Harmonic Elimination in a Modified H-Bridge Inverter. Sustainability 2022, 14, 929. [Google Scholar] [CrossRef]
  23. Bajo, C.G.; Hashemi, S.; Kjær, S.B.; Yang, G.; Østergaard, J. Voltage unbalance mitigation in LV networks using three-phase PV systems. In Proceedings of the IEEE International Conference on Industrial Technology (ICIT), Seville, Spain, 17–19 March 2015. [Google Scholar] [CrossRef]
  24. Caldon, R.; Coppo, M.; Turri, R. Distributed voltage control strategy for LV networks with inverter-interfaced generators. Electr. Power Syst. Res. 2014, 107, 85–92. [Google Scholar] [CrossRef]
  25. Tamoor, M.; Habib, S.; Bhatti, A.R.; Butt, A.D.; Awan, A.B.; Ahmed, E.M. Designing and Energy Estimation of Photovoltaic Energy Generation System and Prediction of Plant Performance with the Variation of Tilt Angle and Interrow Spacing. Sustainability 2022, 14, 627. [Google Scholar] [CrossRef]
  26. Chang, C.-K.; Cheng, S.-T.; Boyanapalli, B.-K. Three-Phase Unbalance Improvement for Distribution Systems Based on the Particle Swarm Current Injection Algorithm. Energies 2022, 15, 3460. [Google Scholar] [CrossRef]
  27. Weckx, S.; Driesen, J. Load balancing with EV chargers and PV inverters in unbalanced distribution grids. IEEE Trans. Sustain. Energy 2015, 6, 635–643. [Google Scholar] [CrossRef]
  28. Freire, R.; Delgado, J.; Santos, J.M.; De Almeida, A.T. Integration of renewable energy generation with EV charging strategies to optimize grid load balancing. In Proceedings of the 13th International IEEE Conference on Intelligent Transportation Systems, Funchal, Portugal, 19–22 September 2010; pp. 392–396. [Google Scholar] [CrossRef]
  29. Ma, K.; Fang, L.; Kong, W. Review of distribution network phase imbalance: Scale, causes, consequences, solutions, and future research directions. CSEE J. Power Energy Syst. 2020, 6, 479–488. [Google Scholar] [CrossRef]
  30. Ciontea, C.I. The use of symmetrical components in electrical protection. In Proceedings of the 72nd Conference for Protective Relay Engineers (CPRE), College Station, TX, USA, 25–28 March 2019. [Google Scholar] [CrossRef]
  31. Martins, A.P.; Rodrigues, P.; Hassan, M.; Morais, V.A. Voltage Unbalance, Power Factor and Losses Optimization in Electrified Railways Using an Electronic Balancer. Electricity 2021, 2, 554–572. [Google Scholar] [CrossRef]
  32. Skobiej, K. Energy efficiency in rail vehicles: Analysis of contemporary technologies in reducing energy consumption. Rail Veh. 2023, 3–4, 64–70. [Google Scholar] [CrossRef]
  33. Gruber, R.; O’Brien, D. Use of Modular Multilevel Converter (MMC) Technology in Rail Electrification. In Proceedings of the AusRAIL 2014, Making Making Innovation Work, Perth, Australia, 11–12 November 2014; Available online: https://trid.trb.org/view/1341047 (accessed on 24 June 2024).
  34. Leemput, N.; Geth, F.; Van Roy, J.; Delnooz, A.; Buscher, J.; Driesen, J. Impact of Electric Vehicle On-Board Single-Phase Charging Strategies on a Flemish residential Grid. IEEE Trans. Smart Grid 2014, 5, 1815–1822. [Google Scholar] [CrossRef]
  35. Huang, S.; Pillai, J.R.; Bak-Jensen, B.; Thøgersen, P. Voltage support from electric vehicles in distribution grid. In Proceedings of the 2013 15th European Conference on Power Electronics and Applications (EPE), Lille, France, 2–6 September 2013; pp. 1–8. [Google Scholar] [CrossRef]
  36. Nájera, J.; Mendonça, H.; de Castro, R.M.; Arribas, J.R. Strategies Comparison for Voltage Unbalance Mitigation in LV Distribution Networks Using EV Chargers. Electronics 2019, 8, 289. [Google Scholar] [CrossRef]
  37. Singh, D.; Misra, R.K.; Mishra, S. Distribution system feeder re-phasing considering voltage-dependency of loads. Int. J. Electr. Power Energy Syst. 2016, 76, 107–119. [Google Scholar] [CrossRef]
  38. Abril, I.P. NSGA-II phase balancing of primary distribution circuits by the reconnection of their circuit laterals and distribution transformers. Electr. Power Syst. Res. 2014, 109, 1–7. [Google Scholar] [CrossRef]
  39. Wang, W.; Wang, W.; Song, S.; Hu, W.; Guo, Q. Study on Daily Line Loss Calculation Based on Operation Data and Resistance Characteristics of Low Voltage Distribution Transformer Area. In Proceedings of the 2021 International Conference on Power System Technology (POWERCON), Haikou, China, 8–9 December 2021; pp. 2093–2096. [Google Scholar] [CrossRef]
  40. Dai, Z.; Shi, K.; Zhu, Y.; Zhang, X.; Luo, Y. Intelligent Prediction of Transformer Loss for Low Voltage Recovery in Distribution Network with Unbalanced Load. Energies 2023, 16, 4432. [Google Scholar] [CrossRef]
  41. Nithya, S.; Jeyanthi, K.M. Genetic algorithm based bacterial foraging optimization with three-pass protocol concept for heterogeneous network security enhancement. J. Comput. Sci. 2017, 21, 275–282. [Google Scholar] [CrossRef]
  42. Naveen, S.; Kumar, K.S.; Rajalakshmi, K. Distribution system reconfiguration for loss minimization using modified bacterial foraging optimization algorithm. Int. J. Electr. Power Energy Syst. 2015, 69, 90–97. [Google Scholar] [CrossRef]
  43. Saad, N.H.; El-Sattar, A.A.; Marei, M.E. Improved bacterial foraging optimization for grid connected wind energy conversion system based PMSG with matrix converter. Ain Shams Eng. J. 2018, 9, 2183–2193. [Google Scholar] [CrossRef]
  44. Zhou, L.; Han, W.; Qi, J.; Zhou, Z. Adaptive PI + VPI Harmonic Current Compensation Strategy under Weak Grid Conditions. Appl. Sci. 2023, 13, 5983. [Google Scholar] [CrossRef]
  45. Fan, Y.; Jun, L.; Bingbing, L. Design and application of integrated distribution network line loss analysis system. In Proceedings of the 2016 China International Conference on Electricity Distribution (CICED), Xi’an, China, 10–13 August 2016; pp. 1–4. [Google Scholar] [CrossRef]
  46. Chen, B.; Xiang, K.; Yang, L.; Su, Q.; Huang, D.; Huang, T. Theoretical Line Loss Calculation of Distribution Network Based on the Integrated Electricity and Line Loss Management System. In Proceedings of the 2018 China International Conference on Electricity Distribution (CICED), Tianjin, China, 17–19 September 2018; pp. 2531–2535. [Google Scholar] [CrossRef]
  47. Wang, W.; Wang, J.; Song, S.; Hu, W.; Guo, Q. Distribution Network Monthly Line Loss Calculate and Improvement with Convolutional Neural Network. In Proceedings of the 2021 China International Conference on Electricity Distribution (CICED), Shanghai, China, 7–9 April 2021; pp. 1035–1039. [Google Scholar] [CrossRef]
  48. Sołjan, Z.; Hołdyński, G.; Zajkowski, M. CPC-Based Minimizing of Balancing Compensators in Four-Wire Nonsinusoidal Asymmetrical Systems. Energies 2021, 14, 1815. [Google Scholar] [CrossRef]
  49. Oliveira, M.E.; Ochoa, L.F.; Padilha-Feltrin, A.; Mantovani, J.R.S. Network reconfiguration and loss allocation in a deregulated environment of distribution systems. In Proceedings of the 18th International Conference on Electricity Distribution, Turin, Italy, 6–9 June 2005. [Google Scholar] [CrossRef]
  50. Savier, J.S.; Das, D. Impact of network reconfiguration on loss allocation of radial distribution systems. IEEE Trans. Power Deliv. 2007, 22, 2473–2480. [Google Scholar] [CrossRef]
  51. Chandramohan, S.; Atturulu, N.; Devi, R.P.K.; Venkatesh, B. Operating cost minimization of a radial distribution system in a deregulated electricity market through reconfiguration using NSGA method. Int. J. Electr. Power Energy Syst. 2010, 32, 126–132. [Google Scholar] [CrossRef]
  52. Atanasovski, M.; Taleski, R. Power summation method for loss allocation in radial distribution networks with DG. IEEE Trans. Power Syst. 2011, 26, 2491–2499. [Google Scholar] [CrossRef]
  53. Chen, B.; Ye, L.; Cui, T.; Bi, W. Power loss analysis for low-voltage distribution networks with single-phase connected photovoltaic generation. In Proceedings of the 2015 5th International Conference on Electric Utility Deregulation and Restructuring and Power Technologies (DRPT), Changsha, China, 26–29 November 2015; pp. 1929–1934. [Google Scholar] [CrossRef]
  54. Gerkusov; Gracheva, E.; Shumikhina, O.; Valtchev, S. Effect of Unbalanced Load on Electrical Energy Losses in Distribution Grids with a Voltage of 0.4–20 Kv. In Proceedings of the 2022 4th International Conference on Control Systems, Mathematical Modeling, Automation and Energy Efficiency (SUMMA), Lipetsk, Russian Federation, 9–11 November 2022; pp. 842–848. [Google Scholar] [CrossRef]
  55. Porumb, R.; Toader, C.; Golovanov, N.; Leonida, T.; Seritan, G. Energy efficiency rating of transformers under unbalanced linear regime. In Proceedings of the 2015 Intl Aegean Conference on Electrical Machines & Power Electronics (ACEMP), 2015 Intl Conference on Optimization of Electrical & Electronic Equipment (OPTIM) & 2015 Intl Symposium on Advanced Electromechanical Motion Systems (ELECTROMOTION), Side, Turkey, 2–4 September 2015; pp. 538–544. [Google Scholar] [CrossRef]
  56. Costea, M.; Leonida, T. An Analyze of Power Losses in Distribution Transformers in Unbalanced and Distorted Loadings Conditions. In Proceedings of the 2023 11th International Conference on ENERGY and ENVIRONMENT (CIEM), Bucharest, Romania, 26–27 October 2023; pp. 1–5. [Google Scholar] [CrossRef]
  57. Niebrzydowski, J. Mathematical Methods for Estimating Selected Operating States of Rural Power Grids; Bialystok University of Technology Publications: Bialystok, Poland, 2001. (In Polish) [Google Scholar]
  58. Gawlak, A. Calculation of losses in a set of elements consisting of overhead low-voltage rural lines. Arch. Electr. Eng. 1997, XLVI, 367–378. [Google Scholar]
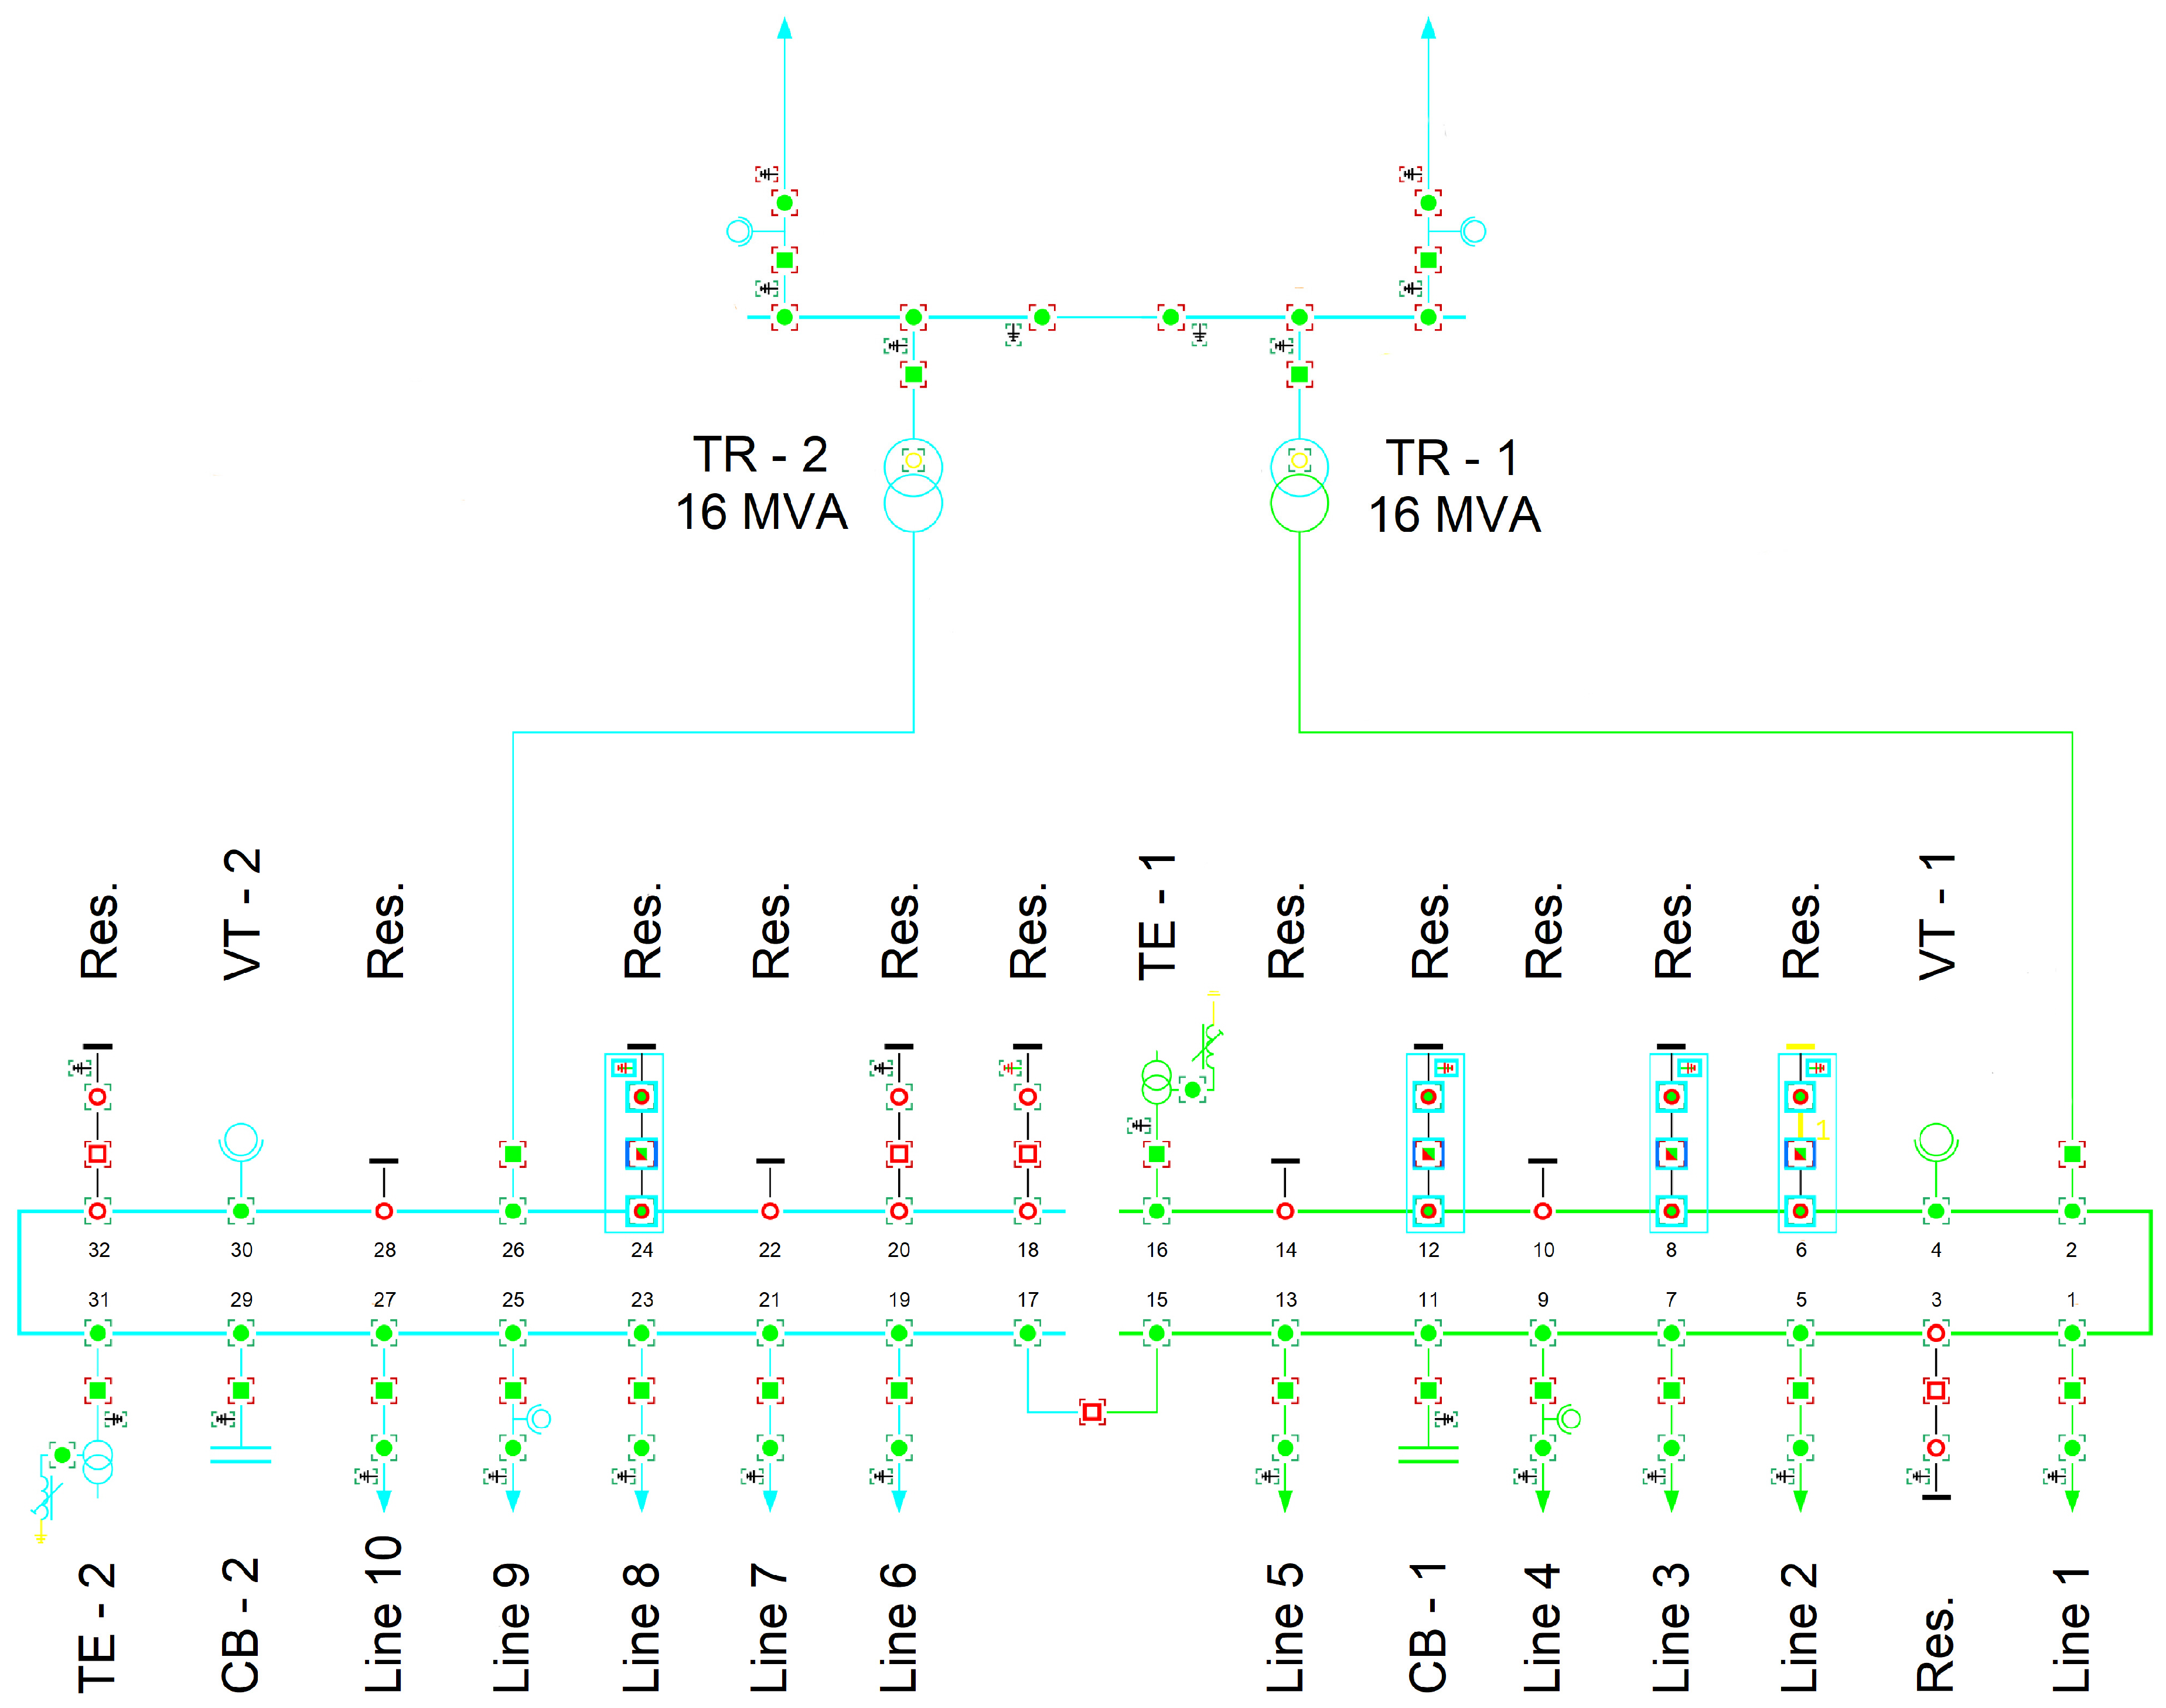
Figure 1. Diagram of the studied transformer station 110/15 kV, where: TR—HV/MV transformer, VT—voltage transformer, TE—grounding transformer, CB—capacitor bank, Res.—reserve switch-bay.
Energies 17 03706 g001
Figure 2. Recorded course of variation of the values of phase voltages on the MV buses of the studied HV/MV station.
Energies 17 03706 g002
Figure 3. Recorded course of variation of the values of line-to-line voltage values on MV buses in the examined HV/MV station.
Energies 17 03706 g003
Figure 4. Registered course of variability of the values of the asymmetry coefficients negative kU2 and zero kU0 voltages at the studied HV/MV station.
Energies 17 03706 g004
Figure 5. Registered course of variability of currents in individual phases of line 3.
Energies 17 03706 g005
Figure 6. Registered course of variability of the value of the asymmetry coefficients negative kI2 and zero kI0 currents in line 3.
Energies 17 03706 g006
Figure 7. Course of variability of power loss values occurring in line 3.
Energies 17 03706 g007
Figure 8. Course of variability of power losses caused by asymmetry in line 3.
Energies 17 03706 g008
Figure 9. Registered course of variability of currents in individual phases of the TR-1 transformer.
Energies 17 03706 g009
Figure 10. Registered volatility of the value of the asymmetry coefficients negative kI2 and zero kI0 currents in the TR-1 transformer.
Energies 17 03706 g010
Figure 11. Course of variability of power loss values occurring in the TR-1 transformer.
Energies 17 03706 g011
Figure 12. Course of variability of power losses caused by asymmetry in the TR-1 transformer.
Energies 17 03706 g012
Figure 13. Dependence of the asymmetry factor of the negative kU2 voltage in the function of the asymmetry factor of the negative kI2 current.
Energies 17 03706 g013
Figure 14. Dependence of the zero-voltage asymmetry coefficient kU0 as a function of zero-current asymmetry factor kI0.
Energies 17 03706 g014
Table 1. Basic data of HV/MV transformers, appearing in the studied electrical system.
Transformer NameRated Power [MVA]Rated Voltage [kV]Vector Group [-]Impedance Voltage [%]Load Losses [kW]No-Load Losses [kW]
TR-116115/16.5Ynd1111.8987.0713.82
TR-216115/16.5Ynd1110.9390.9915.11
Table 2. Basic data of the MV power lines occurring in the studied electricity system.
Switch-Bay NumberLine NameCable TypeLine Length [km]Number of MV/LV Substations [pcs.]Total Power of MV/LV Substations [MVA]
1Line 1ACSR 50 89564.6
5Line 2ACSR 7021.34302.52
ACSR 3528.46
7Line 3ACSR 5072.3573.3
9Line 4ACSR 7022.86563.52
ACSR 3553.94
13Line 5ACSR 7039.67634.57
ACSR 3546.98
19Line 6ACSR 7020.31402.67
ACSR 3531.39
21Line 7ACSR 7024.9585.54
ACSR 3530.35
23Line 8ACSR 7030.5694.3
ACSR 5034.2
25Line 9ACSR 7023.95625.83
ACSR 3572.93
27Line 10ACSR 5059.6512.9
Table 3. Summary of calculated average values of indicators describing the analyzed system.
Element NameAverage Three-Phase Load
PIII [kW]
Average Three-Phase Power Losses
ΔPIII [kW]
Average Percentage Power Loss
ΔPIII% [%]
Average Power Loss Due to Asymmetry
ΔPasym [kW]
Average Percentage Power Loss Due to Asymmetry
ΔPasym% [%]
Line 11072.70104.448.8100.29040.3650
Line 2599.8818.302.7380.02760.2118
Line 3807.2942.484.9200.11170.2696
Line 4921.2965.736.4791.54682.1898
Line 51206.64118.139.3780.50420.4364
Line 6675.1024.163.3650.26481.3874
Line 71566.07125.607.7044.93474.7807
Line 81252.35137.1011.7000.24750.2389
Line 91631.72299.0217.4460.55020.1896
Line 10692.1526.313.6340.12900.5413
TR-14683.30613.910.2880.00400.0319
TR-25906.14822.380.3680.05940.2865
Total21,014.64997.564.758.67030.8691
Table 4. Results of the analysis of the accuracy of methods for determining power losses.
Element NameMeasured Average Three-Phase Power Losses
ΔPIII [kW]
Average Three-Phase Power Losses Calculated by the Section Summation Method
ΔPIII [kW]
Average Three-Phase Power Losses Calculated by the Equivalent Resistance Method
ΔPIII [kW]
Accuracy of the Section Summation Method
δΔPIII [%]
Accuracy of the Equivalent Resistance Method
δΔPIII [%]
Line 344.2141.7642.48−5.54−3.91
Line 7128.33122.72125.60−4.37−2.13
Disclaimer/Publisher’s Note: The statements, opinions and data contained in all publications are solely those of the individual author(s) and contributor(s) and not of MDPI and/or the editor(s). MDPI and/or the editor(s) disclaim responsibility for any injury to people or property resulting from any ideas, methods, instructions or products referred to in the content.