Abstract
This study aims to identify the factors most likely to affect renewable energy consumption (REC) across mostly homogenous country groups worldwide. Classifying countries into a relatively homogenous group is taken from their economic and social development level measured with the Human Development Index. We delimited highly, medium-, and low-developed countries and checked whether the sets of determinants for using renewable energy sources are the same. We constructed a panel dataset as a basis for the panel Bayesian model averaging (panel BMA) as a factor selection method. The most likely factors were found and compared between the groups of countries. Then, the panel fixed-effects models for each country group were estimated. The results allowed us to confirm that CO2 per capita emissions, terms of trade, GDP, foreign direct investment, crude oil price, and energy consumption from alternative sources are the most critical drivers of REC in group I. The most important factors in group II are CO2 per capita, labor force, forest area, and gas and coal consumption. In the third group, REC consumption differs from that of the more advanced groups and strongly depends on foreign direct investment inflow. The results allow the formulation of policy recommendations on a global scale.
1. Introduction
Environmental damage, biodiversity loss, global warming, rapid population growth, increased fuel costs, military and geopolitical conflicts, and their eventual impact on all other economic sectors are the leading causes of extracting energy from renewable sources. Renewable energy consumption, or REC for short, has increased from 2011 to 2021 in the following scale: 8.3% in Europe, 29.4% in the Commonwealth of Independent States (CIS), 37.3% in Middle Eastern countries, 20.5% in Africa, 8.8% in North America, 20.5% in Asia–Pacific, and 10.8% in South and Central America. Conversely, the increase in the world’s energy consumption from non-renewable sources was only 1.25 percent. It showed negative growth in the European Union (EU), Europe, and Euro-Asian countries (−1.7%, −0.9%, and −0.6%, respectively), as well as relatively minor increases in locations like Africa (2.9%) and the Middle East (3.6%). Moreover, the increase in primary energy in 2021 was driven by emerging economies, with China being the leader in growth [1]. These facts motivate the studies that seek relationships between renewable energy consumption and its stimulants and de-stimulants across countries. Finding the factors that increase or decrease the ratio of REC in total energy consumption could help governments stimulate investments in renewable energy sources and create an appropriate climate policy. This knowledge is also essential for investors who can identify the investment potential and needs of countries and/or regions.
The current study examines economic-, energy-, and environmental-based determinants of renewable energy consumption from a global perspective. The main objective of the current study is to identify the most influential REC determinants, which are crucial for technologists, economists, and policymakers. Accurately identifying REC determinants is essential in developing a suitable policy mechanism to address the significant energy demand. Furthermore, it explores ways to reduce our long-term reliance on fossil fuels to achieve the Sustainable Development Goals (SDGs). Moreover, the appropriate policy gives momentum to control carbon emissions and achieve climate change targets under the SDGs. The creation of low greenhouse gas emissions is closely tied to the objectives of the Paris Agreement, and this can be accomplished by altering the structure of energy production and consumption.
The motivation behind considering subgroups of countries classified according to the level of social and economic development is the technological frontier, which affects technology absorption and efficient use across countries. The drivers for catching up are human and physical capital acquisition, socio-institutional factors, knowledge development, infrastructural bottlenecks, product diversification from low- to high-value-added activities, and participation in global and regional value chains [2]. Countries across the globe are also diversified in their exploitation of renewable energy sources. For example, the share of REC in the energy mix is diversified across countries and regions, being, in 2021, highest in Asia–Pacific (43.1%), Europe (25.4%), and North America (21.2%), and lowest in the CIS (0.3%), Middle East (0.4%), and Africa (1.2%) [1].
Therefore, the research problem discussed in this study refers to the differences between the key factors affecting energy consumption from renewable sources identified for different groups of countries. The analysis includes the energy consumption structure as determined by its sources. Initially, all countries worldwide were considered for this study, but data limitations corrected this scope. Eventually, 109 countries observed from 1995 to 2019 were considered. The countries were divided into subgroups according to the Human Development Index values reported in the last year of the sample. The Human Development Index is one of the crucial indicators demonstrating how countries could combine economic performance and social development. The HDI helped to identify 46 countries with “very high” HDIs (group I), 16 countries with “high” HDIs (group II), and 47 countries with “medium and low” HDIs (group III) [3]. The current study merged the medium and low HDI countries into one group. The HDI level groups do not correspond directly to the geographical regions but are related to these regions, with some exceptions.
A comprehensive methodology that integrates economic, environmental, and multiple REC factors forms the foundation of the current research. The panel BMA method serves as the first-tier methodological framework. When there are many possible variables, BMA’s primary benefit is that it ranks each component based on probability. Moreover, it guarantees comparable findings and recommends the model parameters most likely out of various competing ones [4]. The second tier is related to the panel econometric model construction. The panel fixed-effect models were estimated to extract the essential energy consumption factors from renewable sources. The relationships demonstrate differences and similarities between the countries’ subgroups. Such an approach is uncommon in the literature, mainly because of the panel BMA application. Combining the Bayesian approach relying on posterior probability with a classic one (panel FE models) has an advantage that justifies the results from two perspectives, recognized in contemporary statistics and econometrics.
The novelty of the current research lies in the applied methodology and in directly comparing the renewable energy consumption factors by focusing on HDI groups in REC across the globe and identifying the most likely factors affecting renewable energy consumption across mostly homogenous country groups worldwide. However, the subject’s popularity in the literature inevitably confirmed that the Paris Pact increased global awareness of climate change and its consequences. It aligns with the results obtained by [5]. They suggested that environmental concern is essential in explaining renewables participation in different countries.
The outcomes of this study indicate that CO2 emissions, measured per inhabitant, are crucial in implementing and increasing energy use from renewable sources. This factor was confirmed in countries included in groups I and II. This is in line with studies that confirmed the awareness of the impact of greenhouse gases on climate change, such as [5]. The results also revealed a similarity of factors determining REC in country groups I and II. Group III, which is less developed, remains different and requires special attention.
2. Literature Review
In the literature, researchers explored the influencing factors of REC, such as income, energy prices, environmental degradation, energy security, energy consumption, political environment, renewable energy potential, international flows, financial development, and regulatory systems. The research reported in [6,7] provided a robust framework for subsequent studies that examined the factors influencing REC. Most studies initially just regarded income and prices as primary factors of REC [8,9,10,11,12,13,14,15,16].
Several approaches tackle energy issues, and there is a plethora of literature on the causality between aggregate and disaggregated energy consumption from various sources (including renewable energy) and economic growth [6,17,18,19]. On the other hand, several studies in the economic literature have focused on key economic factors in increasing REC [20,21,22,23,24,25,26,27,28]. However, only a few studies have objectively investigated the factors determining renewable energy generation [5,8,29,30,31,32,33]. Recently, researchers have introduced environmental variables to explore the relationship between REC and economic development [10,11,13,14,16,17].
Ref. [9] included potential RE sources and the regulatory framework for fossil fuels in the list of possible determinants of REC in the existing literature using panel data from 46 industrialized and developing nations between 1980 and 2011. The study analyzed the primary short- and long-term drivers of the percentage of non-hydro renewable energy sources using panel cointegration estimation approaches. The study’s findings demonstrate that many driving factors have varying effects on the amount and proportion of non-hydro renewable energy, most of which have long-term effects. Increases in oil prices and financial development significantly impact the quantity and percentage of electricity generated by RE sources other than hydropower. Trade openness has an ambiguous effect. On the other hand, energy generation from non-hydro renewable sources is not significantly impacted by resource rent, gross fixed capital formation, ratification of the Kyoto Protocol, or foreign direct investments.
Considering the countries and regions, the literature focuses on both developing and developed ones. The multi-country approach is also very popular.
Referring to developing countries, Ref. [10] investigated the relationship between GDP, CO2 emissions, and REC using panel data for 24 Asian nations between 1990 and 2012. This study discovers a long-run equilibrium between the variables. RE use is positively impacted by CO2 emissions in China, the Philippines, Pakistan, Yemen, Iraq, and Saudi Arabia. The GDP of India, Sri Lanka, the Philippines, Thailand, Turkey, Malaysia, Jordan, the United Arab Emirates, Saudi Arabia, and Mongolia significantly impacts renewable energy. Two bidirectional causal linkages exist between CO2 emissions and REC and between GDP and RCE.
Ref. [20] analyzed the factors that influence the use of REC in the five biggest African nations—Nigeria, Egypt, Ethiopia, the Democratic Republic of Congo, and South Africa—using the data from 1996 to 2016. The researchers included macroeconomic, socioeconomic, and institutional variables in their investigation. The study applied the BMA (Bayesian model averaging) technique. The empirical findings depict that an increase in any of these determinants (population growth, urban population, energy demand/use, electricity power demand/consumption) causes an increase in REC. Ref. [25] also consider African countries in the context of REC.
Ref. [34] examined the factors influencing REC in a panel of six significant emerging economies: Brazil, China, India, Indonesia, the Philippines, and Turkey. This paper determines the long-term relationships between REC and pollutant emissions and income. These relationships are significant in Brazil, China, India, and Indonesia, while income plays a significant role in the Philippines and Turkey. Short-term bidirectional causal links have been identified between renewable energy and income and between renewable energy and pollution emissions. These findings imply that the initiatives made by developing nations to lower their carbon footprint by boosting energy efficiency and significantly raising the proportion of renewable energy sources in their total energy mix are justified.
Ref. [35] found that innovation contributed to a rise in REC, while CO2 emissions, real GDP per capita, and economic freedom caused a decrease in REC in the ASEAN+3 economies between 1998 and 2018. Ref. [36] investigated the factors influencing the adoption of renewable energy in Africa using data from 1990 to 2019. The study confirmed the feedback hypothesis, which examined the tripartite economic, environmental, and sociopolitical effects of adopting renewable energy in Africa. The study found a positive correlation between the adoption of renewable energy and economic factors. The findings also demonstrated how adopting RE in Sub-Saharan African economies adversely affected environmental issues, including carbon emissions and ecological footprints. Some researchers have recently focused on reducing CO2 emissions while growing the renewable energy industry without slowing economic growth [37,38,39].
It is widely acknowledged that renewable energy sources may replace crude oil in energy production and consumption. It is also anticipated that there will be a negative correlation between the demand for renewable energy and oil prices, as higher oil prices would incentivize people and companies to switch to renewable energy sources, lower their consumption, and buy more energy-efficient products [40]. Refs. [6,34,40] investigated the impact of oil prices on REC and found some evidence of significant effects on oil prices. The relationship between economic growth and REC is currently receiving much attention in the literature, e.g., [6,18,41,42,43].
Ref. [44] examined the impact of both renewable and non-renewable energy resources on greenhouse gas emissions. The panel data from 25 emerging Asian nations from 2000 to 2016 were taken. The study found a short- and long-term positive correlation between economic growth and renewable energy and suggested a feedback hypothesis. Conversely, the study observed that a 1% increase in renewable energy causes a 0.193% decline in carbon emissions. The results show that non-renewable energy resources significantly contribute to greenhouse gas emissions, while renewable resources have a favorable effect on reducing greenhouse gas emissions. This report also emphasizes how emerging Asian economies may protect the environment by utilizing renewable energy sources and stronger regional environmental regulations.
Ref. [45] analyzed the relationship between energy use and economic growth for the BRICS nations between 1990 and 2012 using a multivariate panel approach. The findings suggest that economic growth is the critical factor driving rising energy consumption in the BRICS nations.
To address environmental sustainability, Ref. [46] investigated the impacts of trade and natural resources on REC for Sub-Saharan African countries spanning 1990–2015. According to the findings, trade openness substantially negatively influences the amount of REC in the region. On the other hand, increased FDI and income levels were found to have a substantial positive impact on REC.
Trade openness’s impact on REC has received less attention than the relationship between trade openness and energy demand [47,48,49,50,51]. Trade expansion fosters economic growth, enabling the development and application of more energy-efficient technologies, leading to the expectation that trade openness will enhance renewable energy. A high level of trade openness can increase national income, giving affected countries more significant financial resources to create renewable energy that meets the demand for improved environmental quality. Trade openness is critical to economic development because it expands the domestic market for export-focused industries, improves bilateral trade relations, and provides access to energy-efficient technologies. Furthermore, economic activity has developed, and energy consumption in various channels (e.g., meeting the international requirements for surplus production and importing more machinery and equipment) has increased energy demand in South America [51]. Ref. [52] investigated the relationship between energy consumption and trade openness in four developing and oil-importing nations: Bangladesh, India, China, and Pakistan. The study observed a unidirectional causal relationship between trade openness and energy consumption. Summing up, REC in developing countries mainly depends on greenhouse gas emissions, income, oil price changes, population growth, and FDI inflow.
Different perspectives were considered when referring to developed countries. Ref. [6] investigates the determinants of REC for G7 countries and finds that, in the long run, real GDP per capita and CO2 per capita emissions are a major driving force that fluctuates per capita REC. The usage of renewable energy is negatively impacted by increases in oil prices, but less so. Ref. [53] examine how social and macroeconomic factors affected REC in the G7 between 1990 and 2014. The study empirically supports the positive and significant effects of energy imports, the Human Development Index, and research investment (% of GDP) on REC.
Ref. [54] illustrated empirical work, using growth and environmental functions, on how renewable energy can effectively spur economic growth and reduce carbon emissions in the context of 15 major developed countries that consume renewable energy. The findings demonstrate how effective renewable energy is at boosting economic growth and lowering carbon emissions. Ref. [55] used the panel fixed-effects model to analyze 28 EU countries from 1990 to 2015. Their findings demonstrated the impact of financial development on REC. They confirmed that energy prices, the banking sector, bonds, and capital markets increased the share of REC, whereas FDI was statistically insignificant.
Ref. [56] explored the case of OECD economies for data on the factors influencing REC from 1990 to 2017. The findings indicate that several factors, including income, human capital, energy productivity, energy pricing, and eco-innovation, can explain REC. Ref. [57] also examined the relationships between capital, labor, international trade, and non-renewable and renewable energy. The study concludes that trade between the EU-15 countries increases renewable energy use.
Ref. [58] use panel estimation techniques robust to cross-sectional dependence to examine the effects of real income, trade openness, and renewable and non-renewable energy on CO2 emissions in the Environmental Kuznets Curve (EKC) model for the European Union from 1980 to 2012. The study demonstrated that trade and renewable energy reduce carbon emissions while non-renewable energy increases CO2 emissions, supporting the EKC hypothesis using the dynamic ordinary least squares estimator.
Ref. [59] examined the most likely factors influencing REC in European countries. The study discusses various institutional, social, and economic factors that impacted REC and renewable energy policies in selected European nations before and after the Paris Agreement. To determine the most likely factors affecting REC in 2015 and 2018, the Bayesian model averaging (BMA) is utilized. The comparison results show that the GDP level and the nuclear and hydro energy consumption were the key drivers in both studied years. It also became evident that, in contrast to 2018, when trade openness and FDI contributed to an increase in REC, REC in 2015 heavily depended on the structure of energy consumption. Compared to developing countries, the factors of REC in developed ones are often similar, e.g., oil prices, CO2 emissions, and real GDP. However, financial innovations like green finance instruments (bonds and other capital market instruments) are also highly important.
Another stream of the literature refers to the multi-country perspective. They are typically divided according to high, medium, and low income. For example, the study of [60] considered a global panel of countries divided into high, middle, and low income, but it only refers to 64 countries. Also, Ref. [61] examined the long-term, bidirectional relationship between GDP growth and REC in high-income, upper-middle-income, and lower-middle-income nations. The findings are inconsistent, but higher-income countries are those where the bidirectional long-term association between the variables is more significant and stable. Ref. [62] investigated the relationship between energy demand and foreign direct investment (FDI). The study found that FDI increased renewable energy sources while decreasing non-renewable energy consumption in 74 countries between 1985 and 2012. The study breaks down FDI inflows into mining, manufacturing, financial services, and total services. The findings generally suggest that energy consumption is reduced regarding non-renewable energy sources and increased regarding renewable energy. Ref. [63] examines the relationship between output, FDI inflows, and energy consumption in 75 countries between 1990 and 2010. The current findings show that, in the three categories of countries (developed, all, and developing), there is evidence of a bidirectional relationship between FDI and output per capita, REC and GDP per capita, and non-renewable energy and GDP per capita. Ref. [64] analyzed low-income countries, middle-income, and upper-middle-income panels and revealed the long-run asymmetric correlations between financial development, trade openness, capital flows, and REC. The asymmetric relationship is also confirmed in the near run, except for lower-income nations. The results showed that long-term causation was present, especially when REC was included in the equation as a dependent variable. Ref. [65] examined the relationships between RCE, CO2 emissions, FDI, and economic growth in 190 countries from 1980 to 2018. The study used static and dynamic models, showing that carbon emissions, REC, FDI, and economic growth significantly impact one another. On the other hand, REC has been found to improve environmental quality and reduce FDI inflow.
The set of variables used typically to analyze renewable energy consumption is similar across different studies and constitutes a basis for further development and comparison.
3. Materials and Methods
This section is divided into two data characteristics and methodology subsections, primarily based on the panel Bayesian model averaging and the fixed-effects model. The selection of variables is based on both the principles of environmental economics [12] and a review of the empirical literature [5,40]. The chosen variables, GDP, oil price, and oil consumption, were utilized by [35,36], while foreign direct investment and net inflows (% of GDP) were adopted from [51]. BMA is a well-known approach to identify energy consumption [21,27], which aims to rank variables according to their relationship with the dependent variable.
3.1. Data Characteristics
The current study utilizes panel data on REC and its determinants across 109 selected countries from 1995 to 2019. This overall energy consumption includes electricity, heating and cooling, and transport. Table A1, Table A2 and Table A3 in Appendix A provide a list of all the countries included in the analysis. We use the Human Development Index (HDI) to classify countries with “very high” HDI, “high” HDI, and “medium and low” HDI.
It is well known that a growth and development measure is a crucial tool for economists, energy and environmental experts, ecologists, and policymakers. Therefore, to evaluate national socioeconomic development, the United Nations Development Programme (UNDP) created the Human Development Index (HDI) in 1990 and established a new methodology in 2010 [66]. It prioritizes development over gross domestic product (GDP) when assessing living standards. Therefore, the HDI has completed GDP as a different metric to gauge a nation’s development [67]. Increasing human development is vital for developing a nation [68]. However, human development and economic growth have an inevitable bidirectional relationship. On the one hand, economic growth provides a means of promoting progress in human development. On the contrary, it enhances human development (well-being, health, education, etc.). Compared to economic statistics like GDP per capita, the HDI offers a more thorough assessment of human development. It considers health and education critical to human well-being, wealth, and economic progress. Human development levels across nations can be compared using the HDI.
For this reason, we use this index to illustrate the impact of factors on renewable energy consumption by country at different stages of development. The ranking of countries based on the HDI was used to set the countries’ groups. Specifically, countries ranked from 1 to 66 in 2021 are designated as having a “very high” HDI (group I), those ranked from 67 to 115 are defined as having a “high” HDI (group II), and those ranked from 116 to 191 are denoted as having a “low and medium” HDI (group III). Following this simple classification, we have 46 countries ranked with a “very high” HDI, 16 countries ranked 67 to 115 (with a “high” HDI), and 47 countries ranked 116 to 191 (with medium and low HDI). Due to the lack of data, some countries from groups II and III are excluded from the study.
As the HDI levels fully define the economic and social characteristics of the countries and regions, the energetic characteristics are very interesting and diversified. On the one hand, the increase in the consumption of energy from renewable sources is observed. The facts and figures show that the growth rate of renewable energy consumption was 8.8% in North American countries from 2011 to 2021. Similarly, there was a 10.8% enhancement in REC in South and Central America. In Europe, the growth in REC at the same time was 8.3%. The insight of African countries shows a 20.5% growth rate in REC. The Asian–Pacific countries attained a 20.5% growth rate in REC [1]. On the other hand, the energy mix structure for the total energy supply brings quite a new perspective. It should be emphasized that countries qualified to be in the first group, according to the HDI (1–66), are located mainly in Europe, North America, Eurasia, the Middle East, and Asia–Pacific. According to the data provided by the International Energy Agency (www.iea.org), in 2021, the energy mix for developed countries consisted of coal 13.1%, oil 30.5%, natural gas 26.7%, nuclear 12.0%, and biofuels and waste 10.2%, with the remaining share related to hydro energy and wind and solar energy—for Europe; coal 10.4%, oil 35.9%, natural gas 35.0%, nuclear 9.2%, and the remaining share related to biofuels and waste, hydro energy, and wind and solar energy—for North America; coal 16.5%, oil 19.6%, natural gas 54.5%, and nuclear 5.8%, with the remaining share related to biofuels and waste, hydro energy, and wind and solar energy—for Eurasia; coal 0.5%, oil 40.2%, natural gas 58.3%, and nuclear 0.4%, with only 1% in share related to biofuels and waste, hydro energy, and wind and solar energy in the Middle East; and finally, coal 48.3%, oil 23.4%, natural gas 11.6%, hydro energy 2.4%, and the remaining share is for biofuels and waste, nuclear, and wind and solar energy—for Asia–Pacific. The second group of countries (67–115) consists partially of less-developed European countries (Bulgaria, Ukraine, North Macedonia), some Asian (China) and South American countries, and three countries located in Africa. The energy mix for Central and South America consists of coal 4.9%, oil 39.6%, natural gas 21.0%, biofuels and waste 21.9%, hydro energy 8.9%, and the remaining share relates to nuclear energy and wind and solar energy. The third group—the middle and low HDI countries (116–191)—are primarily associated with Africa, apart from Algeria, Egypt, and South Africa, which are included in group II. The energy mix there is as follows: coal 12.3%, oil 22.9%, natural gas 16.5%, biofuels and waste 45.5%, and the remaining share is related to hydro energy and wind and solar energy. The analysis of the energy mix across the groups of countries implies that traditionally industrialized countries have a lower share of renewables in the energy mix than developing countries. Additionally, countries grouped according to the HDI level have similar energy characteristics within the groups.
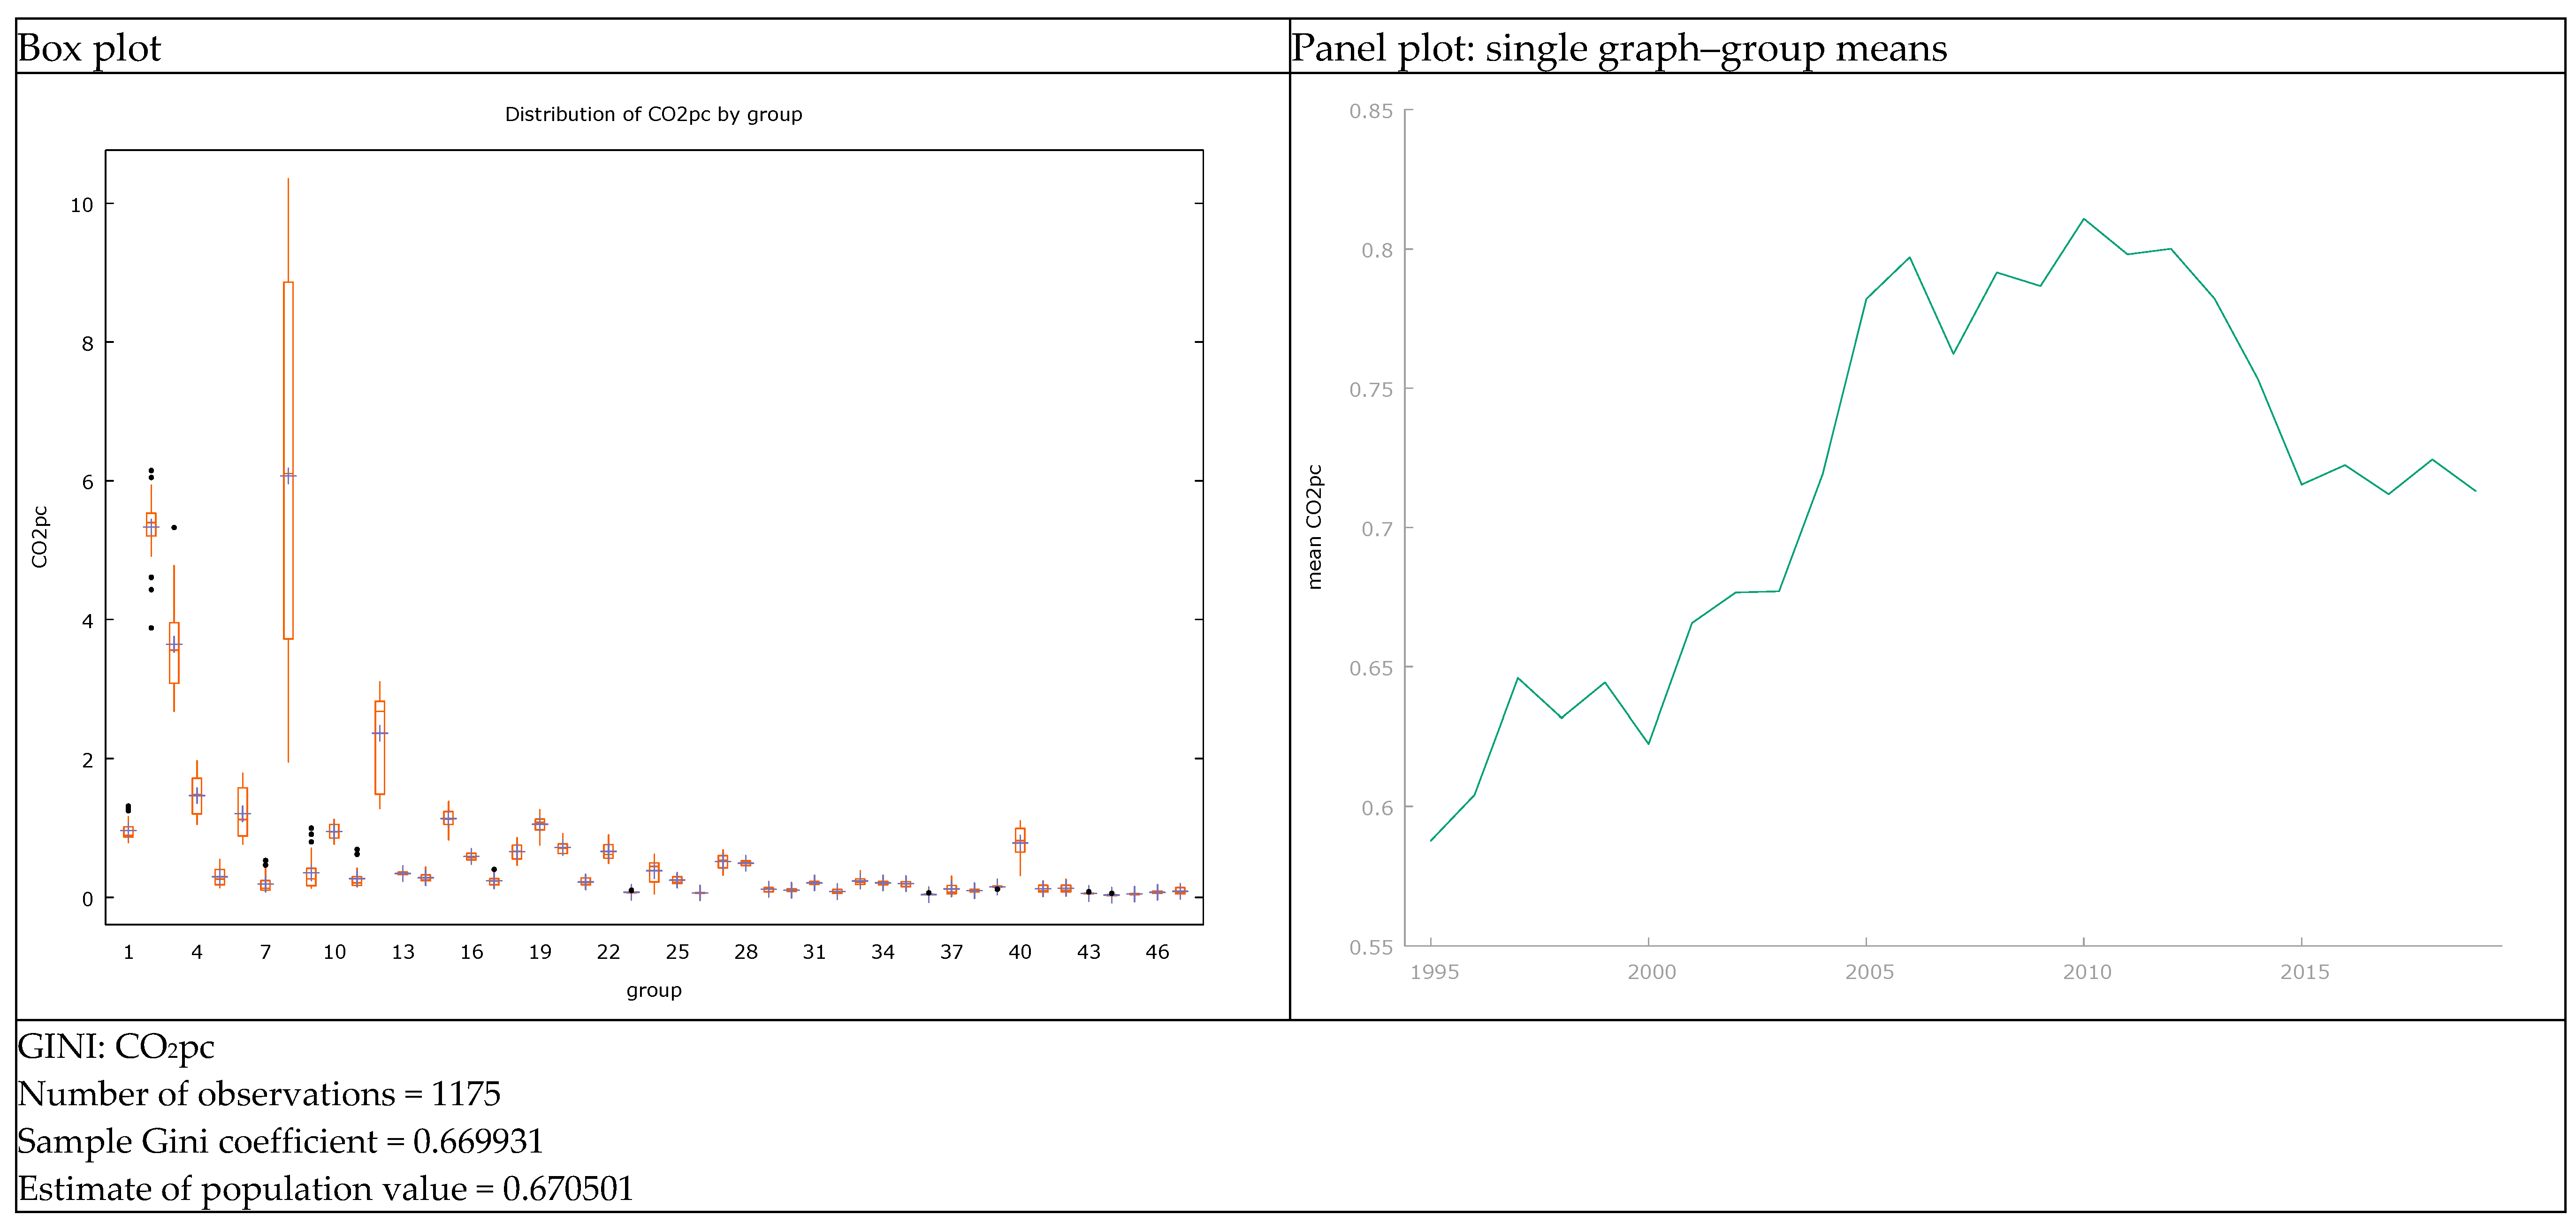
Figure A1, Figure A2, Figure A3, Figure A4, Figure A5 and Figure A6 (in Appendix A) present a detailed view of how renewable energy consumption (REC) and CO2 emissions per capita (CO2pc) vary across different groups of countries with ”very high”, ”high”, and ”medium and low” HDI. We notice substantial variation in renewable energy consumption across the countries in all three groups. Some countries have a wide range of REC values, while others have a much narrower range, presented in the left-hand panel. The right-hand panel plots show a steady increase in the mean renewable energy consumption for countries with a ”very high” HDI, while in the other groups (“high” and “medium and low”), we can observe a decrease. The situation is reversed in the case of CO2 emissions. Among the group of countries with the highest HDI, we observe a systematic decrease from 2015, while in the other groups, the volume of emissions has even increased.
Additionally, the sample GINI coefficient was calculated for REC and CO2pc variables to illustrate the scale of inequality concerning the variables of interest in each country group. Comparing the values for groups I and II, we can notice more diversity in REC consumption (0.48 and 0.43, respectively) than in CO2pc emission (0.34 and 0.35, respectively). That means the emission levels are similar, but countries still need to implement more energy from renewable sources. On the contrary, in group III, the countries are much more diversified by CO2pc emission (0.67) and indirectly in their development than in REC (0.25), which remains very low.
The study draws on data from various sources, including the World Development Indicators (WDI–2019) and Statistical Review of World Energy (BP–2019). Below is a list of all the variables considered in our study, with corresponding symbols provided in parentheses:
- Economic variables: gross domestic product (GDP), gross domestic product per capita (GDPpc), FDI net inflow (FDI/GDP), inflation (INF), trade openness (TO), adjusted savings: energy depletion (ADSED), the labor force (LF);
- Energy-based variables: oil (OC), coal (CC), gas (GC), nuclear (NC), hydro (HC), renewable energy consumption (% of total final energy consumption, REC), crude oil price (COP);
- Environmental: CO2 emission per capita (CO2pc);
- Others: forest area (FA).
Detailed descriptions of all variables and their units are provided in Table A4 in Appendix A. Table A5 presents descriptive statistics for the 109 selected countries from 1995 to 2019, confirming a general shift in energy consumption structure from various sources.
3.2. Methodology
An econometric panel model is a valuable tool for solving problems on an international scale; however, finding a suitable model for panel data requires testing and model comparisons. It is possible to develop and select a statistically and economically reasonable model, starting with the most straightforward construction and using the more advanced ones. The current study is based on fixed-effects (FE) models and employs the Bayesian model averaging approach for variable selection.
3.2.1. Panel Fixed-Effects Model
The panel dataset contains observations from different entities (countries) over time. This data type effectively identifies impacts not visible in cross-sectional or time-series data alone. The FE model controls the cross-sectional variations in the data and allows a separate intercept for each cross-section. The model takes the following form:
The FE model allows for an independent intercept for each cross-section and manages the cross-sectional variances in the data, according to [69]. The model has the following form:
where each unit (in this case, a country) has a vector of individual impacts denoted by , is a matrix of observed values of exogenous variables (in our study, the factors affecting REC), is a matrix of parameter estimates, is the error term, represents the units in the panel (here, countries), and denotes the time units (in our case, years).
In our research, we also test other panel model alternatives: the random-effects model (RE), which assumes that individual effects are random, and the pooled model, which ignores all individual-specific effects [69]. All models, i.e., pooled, fixed, and random effects, can be compared and tested by using the standard test for the common intercept in all units (PM versus FE hypotheses) and Hausman’s test to decide between the fixed- and random-effects model (FE vs. RE hypotheses). In the F test, we assume that the cross-sectional units all have a common intercept in the null hypothesis. In turn, if the Hausman and Taylor test [70] rejects the null hypotheses, it implies that the fixed- and random-effects estimators are different. Therefore, fixed effects should be preferred over random effects.
3.2.2. Bayesian Model Averaging
One challenge when constructing an econometric model is identifying significant variables from a large set of potential determinants. We considered 14 potential variables in the reported study, resulting in 16,384 linear combinations. We have employed the BMA—Bayesian model averaging—method to address this issue, which can determine the significance of competing specifications across the model space (see [71]). To obtain a current summary of the BMA methodology and its applications, refer to [72]. The following are the basics of BMA that we use in our paper.
For every competitive model , we set the prior probability , where . Based on Bayes’ formula, the posterior probability of the model can be calculated as
Formula (2) enables the calculation of the posterior probability for each model given that the density of the marginal distribution is known.
Another essential characteristic in model averaging is the posterior inclusion probability (PIP). The PIP represents the posterior probability that the independent variable is significant in explaining the dependent variable [71,72,73]. Within our framework, the PIP is computed by summing the posterior model probabilities for all models that incorporate a specific variable:
If the selected variable’s PIP value is greater than 0.7, we can consider this variable statistically robust.
4. Results
Empirical Results
To identify the determinants of renewable energy consumption (REC), we use the BMA selection procedure, which enables searching all possible combinations of potential variables and selecting the most probable candidates. We used the BMA 3.1 package [74], which is available in the Gretl program, an open-source software for econometric analysis. A simple description of how to use the BMA approach in modeling fixed-effects panel models is presented in [75]. In this study, we have 14 potential determinants of REC, so the total number of combinations equals . In the Monte Carlo experiment, we set 1,000,000 iterations (including 10% burn-in draws). The correlation coefficient between the analytical and numerical probabilities of the top models was above 0.99, confirming the convergence of the simulation. We set a uniform prior for all possible combinations, assuming they are equally likely.
Table 1 shows the posterior results for two sets of possible determinants, where Variant I includes GDPpc and Variant II uses GDP instead. The other variables in both variants remain the same. Therefore, Table 1 shows the posterior inclusion probabilities, the average value of the coefficient (parameter estimate overall considered models), and the corresponding average standard error. The posterior inclusion probability (PIP), equal to at least 0.7, shows a high probability of being included in the model. Although there is no formal requirement for high posterior probability, it is reasonable to assume that it is at least higher than 0.5 and treats the results higher than 0.7 as reliable.

Table 1.
BMA estimates of renewable consumption determinants in 1995–2019.
In the next step, we estimate a fixed-effects model once we have established which variables can be considered significant. For this purpose, we also use the solutions available in the Gretl package [76]. The results in Table 1 demonstrated that including GDP pc or GDP as a measure of economic performance does not change the results in countries assigned to groups I and II. The only difference is in very highly developed countries (group I; 1–66). Taking GDP pc, it is also suggested that energy consumption from nuclear sources be included. The first group of countries is mostly technologically advanced and the richest. Therefore, among the factors determining REC remained CO2pc. TO, GDP pc/GDP, FDI/GDP, COP, and energy consumption from alternative sources, mainly gas, coal, and nuclear. It is worth noting that the posterior mean was negative for CO2pc, suggesting a negative correlation between the emissions and consuming energy from renewable sources. Ultimately, negative values of the posterior means for gas, coal, and nuclear energy consumption demonstrate a competition between using energy from alternative sources. This is obvious due to the current energy production and necessary investments. The GDP pc/GDP and terms of trade (TO) support the more intense use of energy from renewable sources. The role of FDI as a percentage of GDP is not homogenous because it depends on the structure of the investments. If investments are located in the renewable energy sector, they can increase REC; otherwise, we can expect any direction of influence. The last significant factor is the price, represented by crude oil world prices (COP). The expected sign should be positive; however, when GDP is considered, it is slightly negative. The COP increase can indirectly negatively influence REC due to its negative impact on the inflation rate and, consequently, entire economic activity. In such a case, the investment in the energy sector is slowed down, negatively impacting REC.
The second group of countries (group II; 67–115) represents a high level of development according to the HDI level. The results show the fewest factors with a posterior inclusion probability (PIP) higher than 0.7. These are CO2pc with negative signs and labor force (LF), forest area (FA), and gas and coal consumption with positive signs. Here, there is no visible competition effect, which means that the countries are simultaneously developing energy consumption from gas, coal, and renewables. The labor force and forest area also positively impact REC, which is logical from the renewable energy sector development viewpoint.
The last group contains countries with medium and low levels of development (group III; 116–191). Here, the results are relatively diversified, depending on whether GDP pc or GDP is included. When GDP pc is included, its negative impact on REC is demonstrated, confirming that the effort to develop the poorer countries does not care much about clean energy use but uses all available energy sources. Their situation is much harder than developed ones [77].
The presence of FDI/GDP with positive signs indicates that foreign investors invest in the renewable energy sector, which highly supports the development and SDG achievement. The presence of adjusted savings: energy depletion (ADSED), with a positive sign, indicates that changes in the ratio of the value of the stock of energy resources to the remaining reserve lifetime stimulate countries to focus on renewable sources. Surprisingly, crude oil prices (COP) are negative, showing a similar impact as in group I.
In the empirical part, we propose using an FE estimator to extract the primary determinants of renewable energy consumption in the country subgroups. The results of the panel FE model estimation are presented in Table 2.
Table 2.
Fixed-effect estimates of renewable consumption determinants in 1995–2019.
The empirical models support the previous findings (Table 1) for the version including GDP pc, i.e., the same directions of the parameter estimates are confirmed, and the factors with posterior inclusion probabilities greater than 0.7 are statistically significant. These findings demonstrate that the panel BMA methodology can be efficiently used as a variable selection method for fixed-effects (FE) models. Additionally, the Hausman test results presented in the last three rows of Table 2 confirmed that the FE estimator outperforms the alternative random-effects (RE) one.
Referring to the methodology, we confirmed that applying the panel BMA procedure provides a reliable result since it allows a search of the entire model space to find the most likely determinants of renewable energy consumption. The most essential advantages of model averaging were indicated in [78]. The first one includes the model uncertainty in the selection procedure, which reduces overconfidence in a single model. Furthermore, it avoids the all-or-nothing mentality associated with classical hypothesis testing, where a model is either accepted or rejected wholesale. BMA gracefully updates its estimates as the data accumulate, and the resulting model weights are continually adjusted. Finally, BMA is relatively robust in terms of model misspecification. The successful application of BMA is possible for different databases, such as cross-sectional, time-series, and panel data [79,80,81].
When we refer to highly developed and developed countries (groups I and II), we can compare the results with those obtained by [82]. The authors employed a pooled OLS Model for European Union member states, while Central and Eastern Europe and Western Europe countries were analyzed separately. They analyzed entire economies and sectors that consume energy from renewable sources, such as transport, electricity, and heating and cooling. The empirical results confirmed the different conditions for the two groups of countries, suggesting the possibility of designing specific energy policies. The positive role of R&D in both categories of member states was emphasized. The authors reported a non-significant relationship between energy consumption from renewable sources and GDP per capita in Western as well as Central and Eastern European countries. The only exception was the electricity sector in the Western countries, which reported a negative relationship between REC and economic growth. Most recently, [83] examined renewable energy consumption factors in the Eurozone and confirmed a strong inverse association between GDP and renewable energy consumption. They also found a negative relationship between foreign direct investment (FDI), energy imports, and renewable energy consumption. A positive relationship between R&D and REC was also confirmed. In our study, the impact of GDP per capita on REC was positive and significant in group I—very highly developed countries, including the EU countries, among others.
When comparing with other publications, some similarities in the results can be identified with the study by [36]. The author prepared a deep analysis of African countries. He found that the two-sided (feedback) relationship between renewable energy (RE) and economic growth in the studied economies was positive and significant. He concluded that policies supporting renewable energy adoption should be advanced. A look at other explanatory variables suggests a positive relationship exists between financial development, foreign direct investment, trade, governance, urbanization, and life expectancy that stimulates RE adoption. However, the findings presented by [36] are rather unique. In our study, the African countries are mostly assigned to group III of countries, classified as medium- and low-developed. They are accompanied by other countries, so the results are different. However, it must be emphasized that when GDPpc has a negative sign, the crowding-out effect plays a specific role. To increase growth in poor countries, it is difficult to maintain an appropriate level of investment required to increase energy consumption from renewable sources. Conversely, we confirmed the positive impact of FDI, forest area, and ADSED. The last factor is highly important because limited natural resources determine the seeking and application of new technologies.
Another study related to African countries [84] found a significant negative and non-linear impact of renewable energy consumption on the economic growth of combined African countries. Dividing African countries into regions, the authors revealed a negative effect of renewable energy consumption on economic growth and further highlighted the varying resource and renewable energy development across African countries.
The results are relatively diversified depending on the data quality and availability, the diversity of the countries taken to the investigation, and possible correlations between the countries applying similar energy policies due to more general requirements (like the Sustainable Development Goals and the European Green Deal). Despite this, we confirmed that CO2pc. TO, GDP pc/GDP, FDI/GDP, COP, and energy consumption from alternative sources, mainly gas, coal, and nuclear (GC, CC, and NC), are the essential drivers of REC in group I. In the second group (group II), the key factors are CO2pc, labor force (LF), forest area (FA), and gas and coal consumption (GC and CC). Significant factors influencing renewable energy consumption in groups I and II are similar, taking CO2pc and gas and coal consumption. The results in the last group (group III) are diversified, demonstrating a huge dependence of REC on FDI. Additionally, the ADSED is essential as well. In general, group III, which is less developed, remains different and requires special attention.
5. Conclusions
In this paper, we analyzed the determinants of energy consumption from renewable sources using panel BMA and fixed-effects econometric models. The results were compared in three groups of countries delimited by the HDI level, which implies the development characteristics. The total number of countries of interest comprises 109, while the observation period was limited to 1995–2019. The results obtained from the panel BMA were confirmed when the FE models were estimated. The panel BMA approach found substantial differences between factors observed in groups of countries.
The outcomes of this study confirmed that CO2 emissions, measured per inhabitant, are crucial in implementing and increasing energy use from renewable sources. Furthermore, governments and inhabitants are generally aware of the threats of increasing emissions. This factor was positive in countries included in groups I and II. The results also revealed a similarity of factors determining REC in country groups I and II concerning other energy sources, particularly gas and coal consumption. Group III, which is less developed, relies on FDI inflow and requires special attention.
These findings are reliable and allow for energy policy recommendations. Firstly, all countries must implement an efficient, energetic policy to decrease greenhouse gas emissions, particularly CO2. The policy goals and the time of their realization must be determined and satisfied promptly. Secondly, the participation in costs of climate policy (emission taxes, coal taxes, etc.) must be distributed among all countries; however, due to differences in development, some discounts and deferments are allowed at both the macroscale and microscale (consumers, enterprises, particularly small and medium enterprises). Thirdly, the inflow of FDI, particularly in the middle- and low-developed countries, should be primarily directed to the renewable energy sectors.
Although including as much data as possible, we found some limitations in the study. One of them is related to the limitations of the data, particularly in poorer and non-democratic countries. It refers to both the variables and countries. We did not include the sectors of the economies; instead, we took the entire economies. Analysis across the sectors would enhance the findings and deepen the conclusions.
Author Contributions
Conceptualization, A.M.K., J.K., and M.O.; methodology, J.K. and M.O.; software, J.K.; validation, J.K.; formal analysis, A.M.K., J.K., and M.O.; investigation, A.M.K., J.K., and M.O.; resources, A.M.K.; data curation, A.M.K.; writing—original draft preparation, A.M.K., J.K., and M.O.; writing—review and editing, A.M.K., J.K., and M.O.; visualization, A.M.K., J.K., and M.O. All authors have read and agreed to the published version of the manuscript.
Funding
This research received no external funding.
Institutional Review Board Statement
Not applicable.
Informed Consent Statement
Not applicable.
Data Availability Statement
Data are contained within the article.
Conflicts of Interest
The authors declare no conflicts of interest.
Appendix A
Table A1.
The list of selected countries ranked 1–66 according to their HDI.
Table A1.
The list of selected countries ranked 1–66 according to their HDI.
| Country | Code | Country | Code | Country | Code |
|---|---|---|---|---|---|
| United Arab Emirates | ARE | France | FRA | Malaysia | MYS |
| Argentina | ARG | United Kingdom | GBR | Netherlands | NLD |
| Australia | AUS | Greece | GRC | Norway | NOR |
| Austria | AUT | Hong Kong SAR, China | HKG | New Zealand | NZL |
| Belgium | BEL | Croatia | HRV | Poland | POL |
| Belarus | BLR | Hungary | HUN | Portugal | PRT |
| Canada | CAN | Ireland | IRL | Qatar | QAT |
| Switzerland | CHE | Iceland | ISL | Romania | ROM |
| Chile | CHL | Israel | ISR | Russian Federation | RUS |
| Czech Republic | CZE | Italy | ITA | Singapore | SGP |
| Germany | DEU | Japan | JPN | Slovak Republic | SVK |
| Denmark | DNK | Lithuania | LTU | Slovenia | SVN |
| Spain | ESP | Luxembourg | LUX | Sweden | SWE |
| Estonia | EST | Latvia | LVA | Thailand | THA |
| Finland | FIN | Mauritius | MUS | Turkiye | TUR |
| - | - | - | - | United States of America | USA |
Table A2.
The list of selected countries ranked 67–115 according to their HDI.
Table A2.
The list of selected countries ranked 67–115 according to their HDI.
| Country | Code | Country | Code | Country | Code |
|---|---|---|---|---|---|
| Bulgaria | BGR | Peru | PER | Ecuador | ECU |
| Sri Lanka | LKA | Mexico | MEX | Egypt | EGY |
| Ukraine | UKR | Brazil | BRA | South Africa | ZAF |
| North Macedonia | MKD | Colombia | COL | Jamaica | JAM |
| China | CHN | Algeria | DZA | Indonesia | IDN |
| - | - | - | - | Vietnam | VNM |
Table A3.
The list of selected countries ranked 116–191 according to their HDI.
Table A3.
The list of selected countries ranked 116–191 according to their HDI.
| Country | Code | Country | Code | Country | Code |
|---|---|---|---|---|---|
| Philippines | PHL | Comoros | COM | Eritrea | ERI |
| Venezuela | VEN | Papua New Guinea | PNG | Guinea | GIN |
| Iraq | IRQ | El Salvador | SLV | Liberia | LBR |
| Morocco | MAR | Pakistan | PAK | Congo, Dem. Rep. | COD |
| Bangladesh | BGD | Haiti | HTI | Afghanistan | AFG |
| India | IND | Nigeria | NGA | Sierra Leone | SLE |
| Nepal | NPL | Rwanda | RWA | Guinea-Bissau | GNB |
| Equatorial Guinea | GNQ | Benin | BEN | Yemen | YEM |
| Cambodia | KHM | Lesotho | LSO | Burkina Faso | BFA |
| Angola | AGO | Malawi | MWI | Mozambique | MOZ |
| Myanmar | MMR | Senegal | SEN | Mali | MLI |
| Syrian Arab Republic | SYR | Djibouti | DJI | Burundi | BDI |
| Cameroon | CMR | Sudan | SDN | Central African Republic | CAF |
| Kenya | KEN | Madagascar | MDG | Niger | NER |
| Congo | COG | Gambia | GMB | Chad | TCD |
| Solomon Islands | SLB | Ethiopia | ETH | - | - |
Table A4.
Variable Descriptions.
Table A4.
Variable Descriptions.
| No. | Variable Abbreviation | Variable Name | Proxy/Scale of Measurement | Data Source |
|---|---|---|---|---|
| Energy-based variables | ||||
| 1 | REC | Renewable Consumption | Renewable energy consumption (% of total final energy consumption) | BP-2019 |
| 2 | OC | Oil consumption | Million tonnes of oil equivalent to exajoules (Mtoe) | BP-2019 |
| 3 | GC | Gas consumption | Million tonnes of oil equivalent to exajoules (Mtoe) | BP-2019 |
| 4 | CC | Coal consumption | Million tonnes of oil equivalent to exajoules (Mtoe) | BP-2019 |
| 5 | HC | Hydro consumption | Million tonnes of oil equivalent to exajoules (Mtoe) | BP-2019 |
| 6 | NC | Nuclear consumption | Million tonnes of oil equivalent to exajoules (Mtoe) | BP-2019 |
| 7 | COP | Crude oil price | Crude oil price (US dollars per barrel) | BP-2019 |
| Economic variables | ||||
| 8 | GDP | Gross domestic product | Constant 2010 US dollar | WDI-2019 |
| 9 | GDPpc | Per capita gross domestic product | Constant 2010 US dollar | WDI-2019 |
| 10 | TO | Trade openness | Trade openness = Exports of goods and services (% of GDP) + Imports of goods and services (% of GDP). | WDI-2019 |
| 11 | ADSED | Adjusted savings: energy depletion | (current US dollar) | WDI-2019 |
| 12 | LF | Labor force | Total labor force | WDI-2019 |
| 13 | FDI/GDP | Foreign direct investment, net inflows | (% of GDP) | WDI-2019 |
| 14 | INF | Inflation, GDP deflator | (annual %) | |
| Environmental Variables | ||||
| 15 | CO2pc | CO2 emissions | (metric tons per capita) | WDI-2019 |
| Other variables | ||||
| 16 | FA | Forest area | Square. Km | WDI-2019 |
Table A5.
Descriptive statistics of variables under study in groups of countries.
Table A5.
Descriptive statistics of variables under study in groups of countries.
| Summary Statistics for Ranked 1–66 | ||||||||||||||||
|---|---|---|---|---|---|---|---|---|---|---|---|---|---|---|---|---|
| Variable | REC | TO | ADSED | CO2pc | CC | COP | FA | FDI/GDP | GC | GDP | GDPpc | HC | INF | LF | NC | OC |
| Mean | 16 | 105 | 5,250,000,000 | 9 | 24 | 55 | 416,874 | 5 | 37 | 921,000,000,000 | 31,060 | 8 | 6 | 14,938,128 | 11 | 52 |
| Med | 11 | 84 | 197,000,000 | 8 | 4 | 54 | 34,282 | 3 | 8 | 252,000,000,000 | 31,185 | 1 | 2 | 4,794,475 | 0 | 14 |
| Max | 81 | 443 | 164,000,000,000 | 48 | 546 | 112 | 8,153,116 | 86 | 728 | 19,900,000,000,000 | 112,418 | 86 | 662 | 167,000,000 | 194 | 964 |
| Min | 0 | 16 | 0 | 0 | 0 | 13 | 0 | −58 | 0 | 5,120,000,000 | 1886 | 0 | −25 | 154,357 | 0 | 0 |
| S.D. | 15 | 73 | 16,500,000,000 | 7 | 72 | 32 | 1,334,422 | 10 | 96 | 2,400,000,000,000 | 21,794 | 16 | 25 | 26,266,159 | 31 | 132 |
| Skew | 2 | 2 | 6 | 3 | 6 | 0 | 5 | 3 | 5 | 6 | 1 | 3 | 18 | 4 | 4 | 6 |
| Kurt | 6 | 9 | 44 | 13 | 38 | 2 | 25 | 22 | 25 | 36 | 4 | 14 | 432 | 18 | 23 | 35 |
| JB | 876 | 2381 | 88,097 | 6133 | 63,470 | 85 | 27,737 | 18,971 | 26,451 | 59,601 | 191 | 8140 | 8,882,952 | 13,331 | 21,881 | 54,380 |
| Prob. | 0 | 0 | 0 | 0 | 0 | 0 | 0 | 0 | 0 | 0 | 0 | 0 | 0 | 0 | 0 | 0 |
| Obs. | 1150 | 1150 | 1150 | 1150 | 1150 | 1150 | 1150 | 1150 | 1150 | 1150 | 1150 | 1150 | 1150 | 1150 | 1150 | 1150 |
| Summary Statistics for Ranked 67–115 | ||||||||||||||||
| Mean | 22.21 | 65.72 | 11,700,000,000 | 3.24 | 99.16 | 55.17 | 678,820.9 | 3.12 | 19.79 | 694,000,000,000 | 4542.80 | 15.85 | 11.98 | 73,925,151 | 3.18 | 48.82 |
| Med | 16.64 | 56.69 | 3,260,000,000 | 2.52 | 4.79 | 54.19 | 131,335.4 | 2.65 | 6.24 | 151,000,000,000 | 4238.37 | 2.66 | 6.47 | 19,578,367 | 0.00 | 13.21 |
| Max | 69.94 | 164.70 | 237,000,000,000 | 8.44 | 1969.07 | 111.67 | 5,699,933.0 | 31.23 | 264.26 | 14,300,000,000,000 | 10,155.49 | 270.33 | 913.21 | 781,000,000 | 74.24 | 666.52 |
| Min | 0.06 | 15.64 | 0 | 0.32 | 0.00 | 12.72 | 449.80 | −2.76 | 0.00 | 5,750,000,000.0 | 906.13 | 0.00 | −26.30 | 815,445 | 0.00 | 0.00 |
| S.D. | 17.53 | 30.31 | 25,000,000,000 | 2.06 | 356.71 | 31.71 | 1,294,186.0 | 2.90 | 32.08 | 1,850,000,000,000.0 | 2175.66 | 40.89 | 50.90 | 179,000,000 | 8.02 | 100.39 |
| Skew | 0.80 | 0.92 | 4.97 | 0.76 | 4.29 | 0.41 | 2.82 | 3.92 | 3.74 | 4.95 | 0.63 | 3.94 | 15.24 | 3.45 | 4.66 | 3.93 |
| Kurt | 2.66 | 3.31 | 34.44 | 2.49 | 20.50 | 1.94 | 10.25 | 31.49 | 22.62 | 29.55 | 2.72 | 20.12 | 257.03 | 13.34 | 31.53 | 19.59 |
| JB | 44.54 | 57.83 | 18,116.49 | 43.15 | 6329.39 | 29.69 | 1408.15 | 14,550.23 | 7350.19 | 13,385.32 | 27.86 | 5918.48 | 1,090,975 | 2575.21 | 15,014.37 | 5614.66 |
| Prob. | 0 | 0 | 0 | 0 | 0 | 0 | 0 | 0 | 0 | 0 | 0.000001 | 0 | 0 | 0 | 0 | 0 |
| Obs. | 400 | 400 | 400 | 400 | 400 | 400 | 400 | 400 | 400 | 400 | 400 | 400 | 400 | 400 | 400 | 400 |
| Summary Statistics for Ranked 116–191 | ||||||||||||||||
| Mean | 61.62 | 66.00 | 1,550,000,000 | 0.72 | 5.96 | 55.17 | 142,645 | 3.57 | 2.36 | 63,900,000,000 | 1308.50 | 1.05 | 19.84 | 18,849,678 | 0.13 | 5.49 |
| Med | 72.71 | 52.73 | 1,967,612 | 0.24 | 0.00 | 54.19 | 55,022.90 | 1.51 | 0.00 | 10,900,000,000 | 856.25 | 0.00 | 6.33 | 4,570,977 | 0.00 | 0.00 |
| Max | 98.34 | 348.00 | 36,400,000,000 | 10.35 | 444.73 | 111.67 | 1,472,640 | 161.82 | 51.84 | 2,690,000,000,000 | 14,222.55 | 34.46 | 4800.53 | 501,000,000 | 9.62 | 244.53 |
| Min | 0.31 | 0.00 | 0.00 | 0.02 | 0.00 | 12.72 | 56.00 | −11.20 | 0.00 | 0.00 | 0.00 | 0.00 | −31.57 | 109,672 | 0.00 | 0.00 |
| S.D. | 28.76 | 52.94 | 4,460,000,000 | 1.31 | 40.97 | 31.68 | 249,621 | 9.23 | 7.87 | 228,000,000,000 | 1475.87 | 4.25 | 171.79 | 62,887,753 | 0.83 | 23.40 |
| Skew | −0.71 | 2.92 | 4.42 | 3.78 | 8.02 | 0.41 | 3.18 | 8.71 | 3.72 | 7.48 | 4.51 | 4.85 | 22.46 | 6.26 | 7.97 | 6.74 |
| Kurt | 2.30 | 15.35 | 24.83 | 19.68 | 70.83 | 1.94 | 14.56 | 110.37 | 16.74 | 67.91 | 31.59 | 27.45 | 567.52 | 42.55 | 71.16 | 53.84 |
| JB | 122.81 | 9144.08 | 27,158.45 | 16,420.69 | 237,879.70 | 87.21 | 8524 | 579,290.50 | 11,947.12 | 217,268.80 | 44,016.60 | 33,876.73 | 15,700,836 | 84,240.46 | 239,899.10 | 135,424 |
| Prob. | 0.00 | 0.00 | 0.00 | 0.00 | 0.00 | 0.00 | 0.00 | 0.00 | 0.00 | 0.00 | 0.00 | 0.00 | 0.00 | 0.00 | 0.00 | 0.00 |
| Obs. | 1175 | 1175 | 1175 | 1175 | 1175 | 1175 | 1175 | 1175 | 1175 | 1175 | 1175 | 1175 | 1175 | 1175 | 1175 | 1175 |
Note: Med= median; Min = minimum; Max = maximum; S.D. = standard deviation; Kurt = Kurtosis; Skew = skewness; JB = Jerqa–Berra; Prob = probability; Obs = observations.
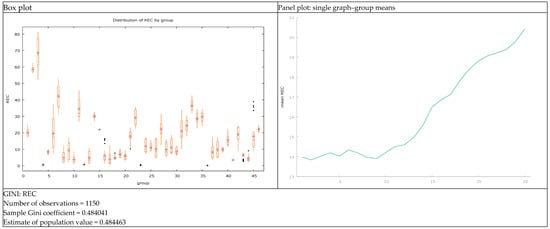
Figure A1.
Graphical view of REC in countries with “very high” HDI (Ranked 1–66). Note: The box plots for all countries in the group are provided in the left-hand panel, while the average values for all countries in 1995–2019 are presented in a right-hand panel in all Figure A1, Figure A2, Figure A3, Figure A4, Figure A5 and Figure A6.
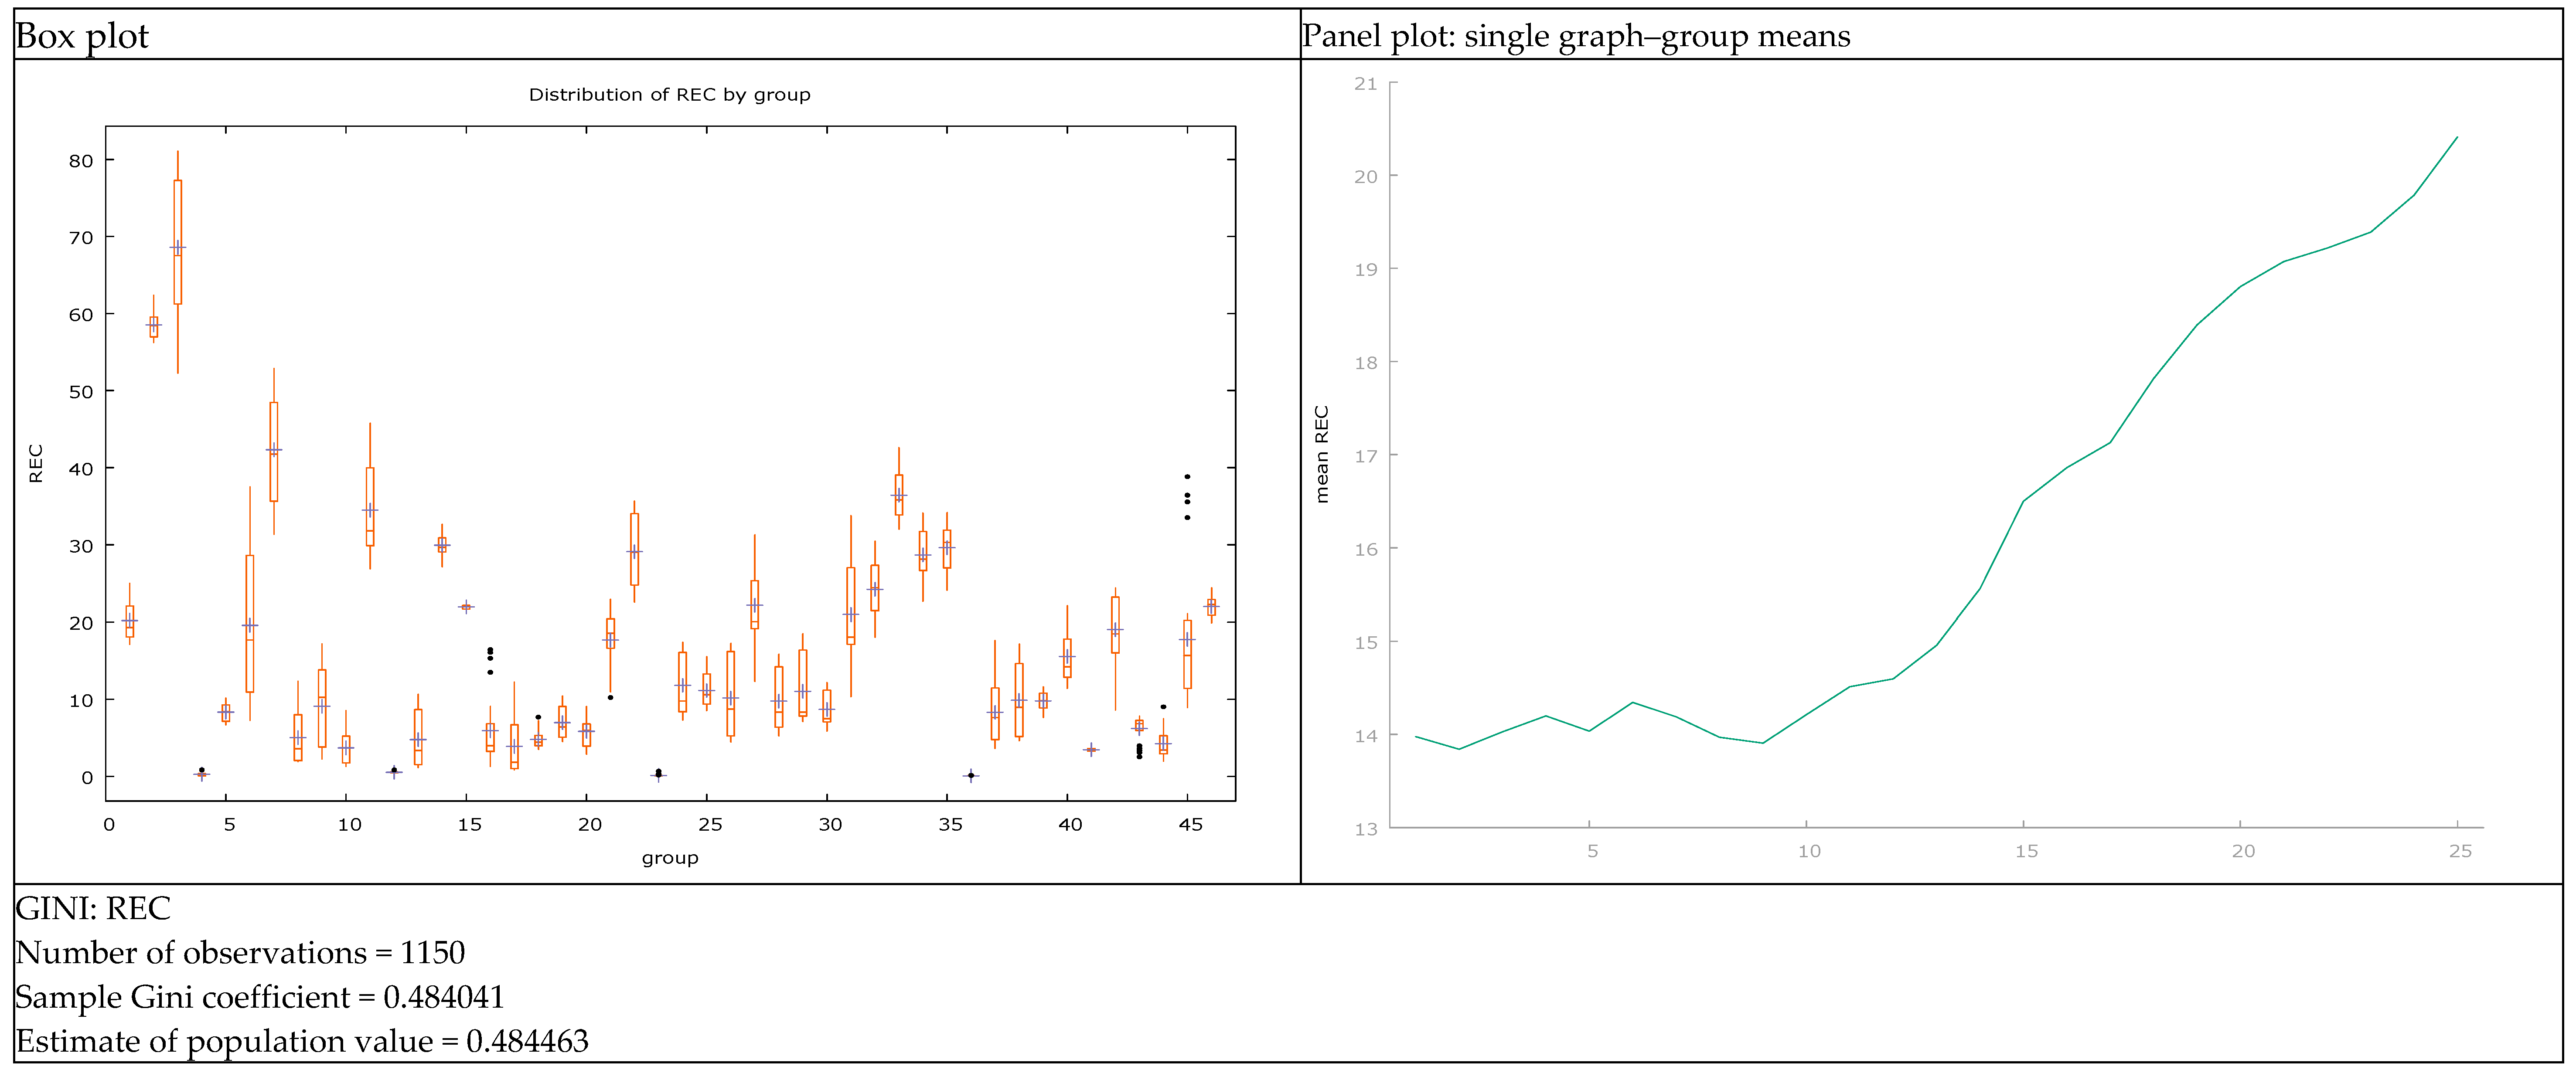
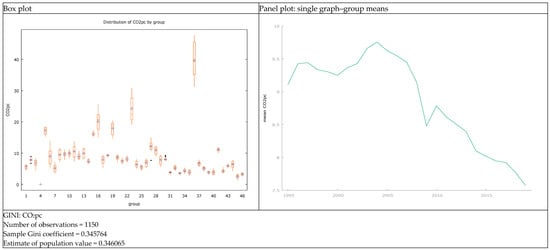
Figure A2.
Graphical view of CO2pc in countries with “very high” HDI (Ranked 1–66).
Figure A2.
Graphical view of CO2pc in countries with “very high” HDI (Ranked 1–66).
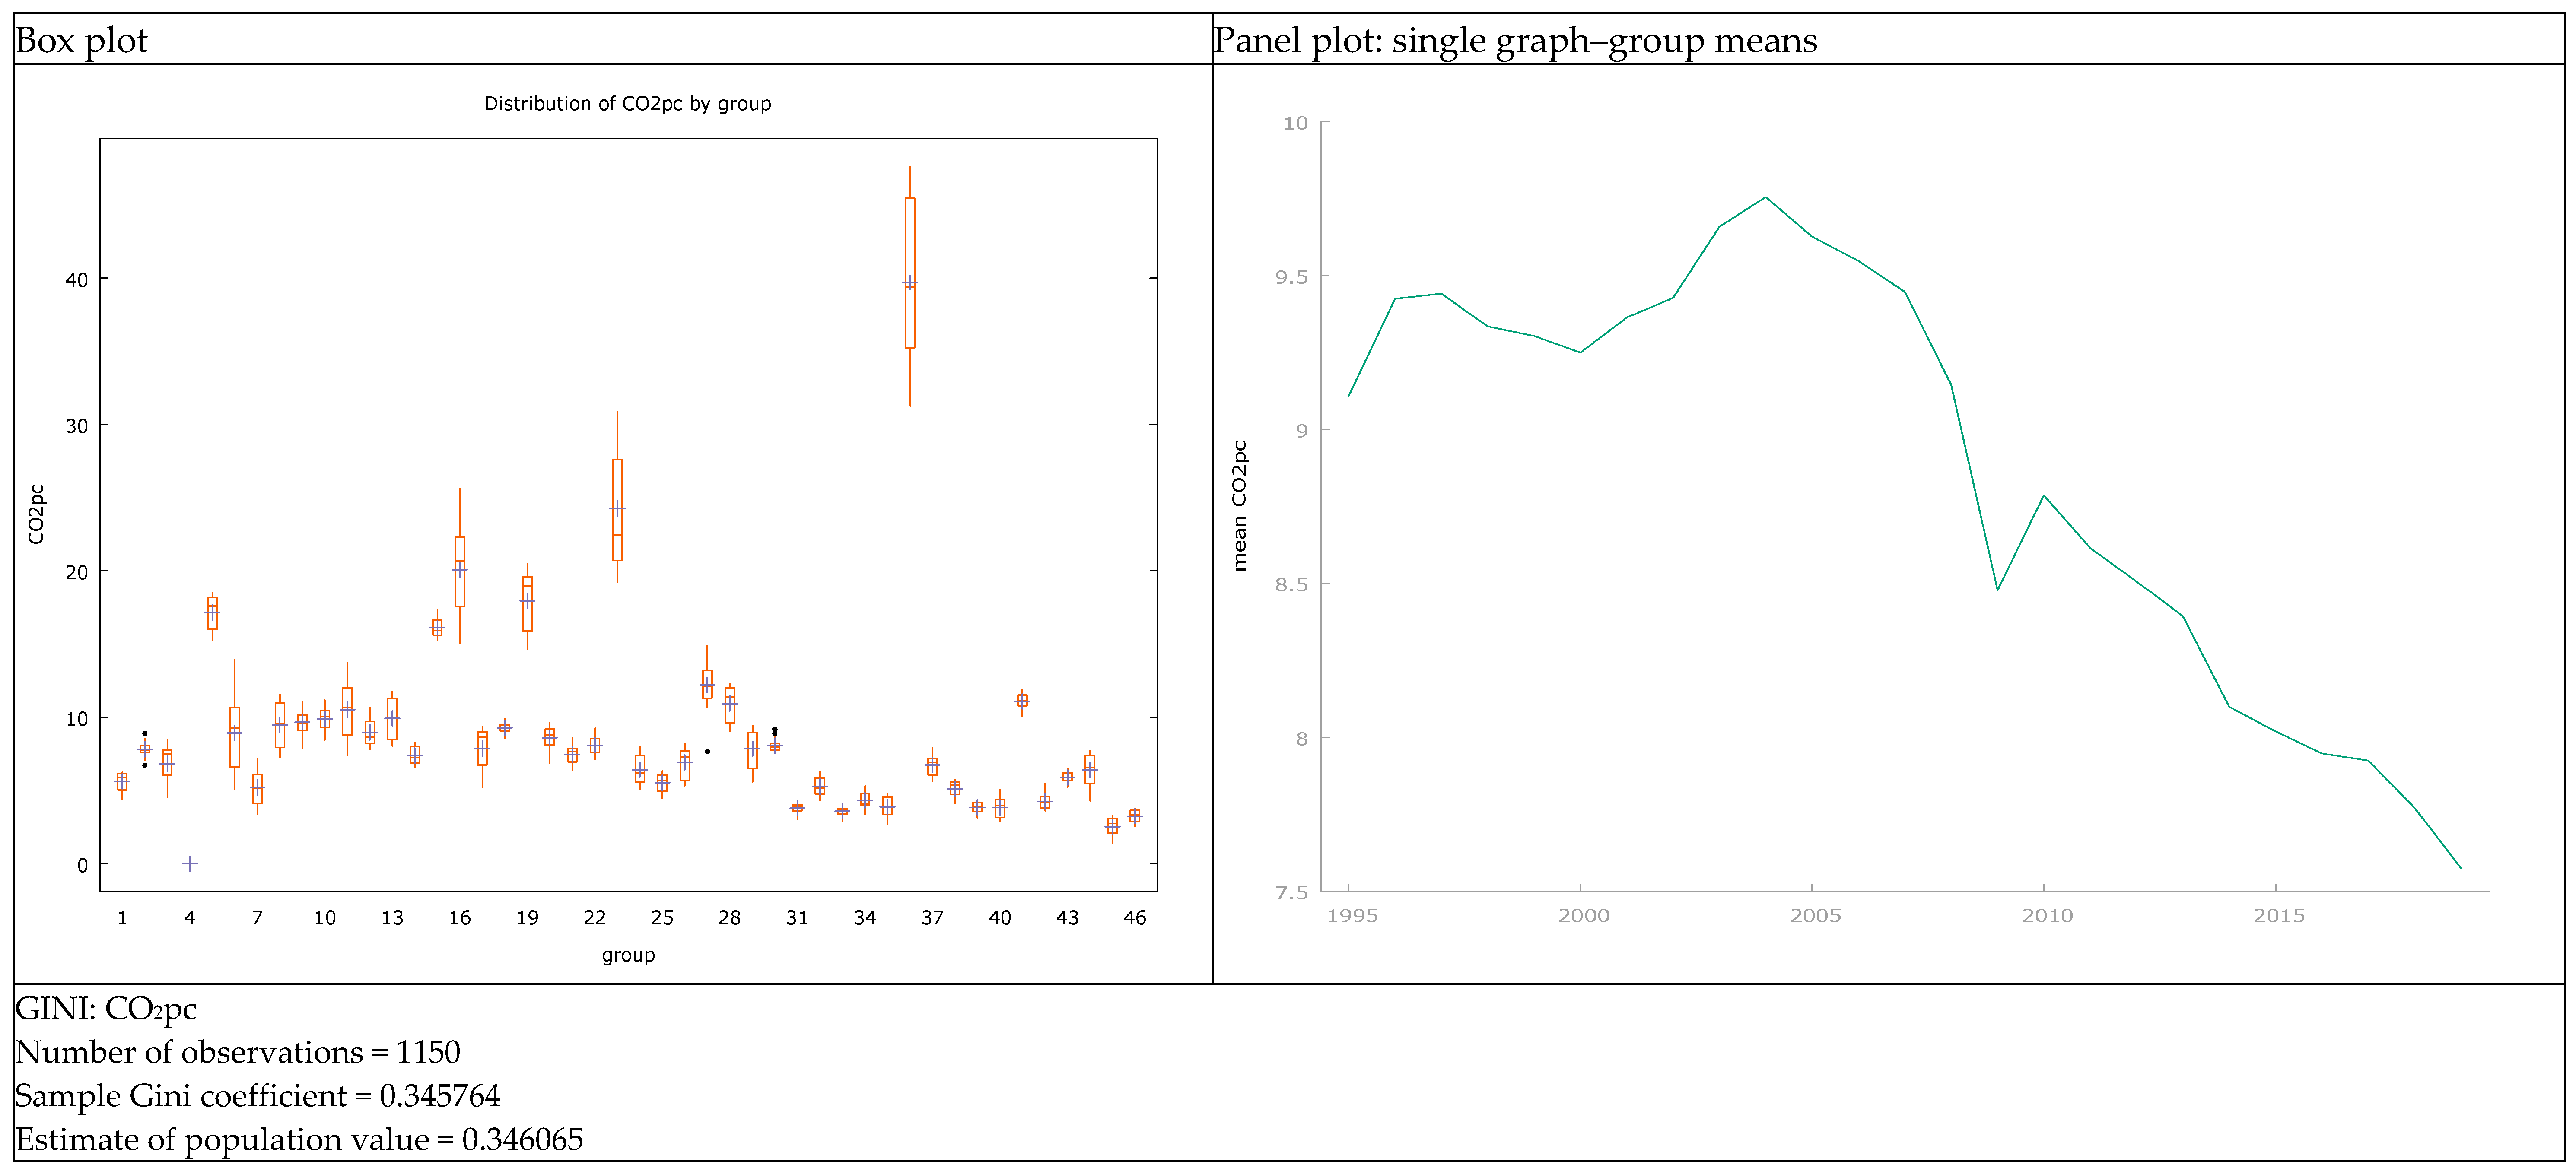
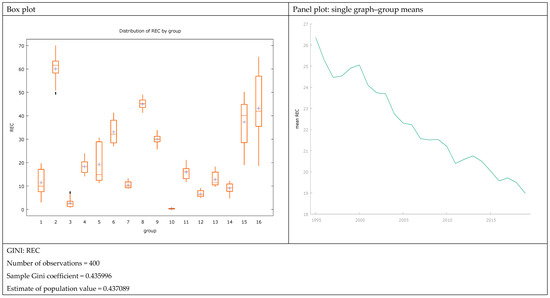
Figure A3.
Graphical view of REC in countries with “high” HDI (Ranked 67–115).
Figure A3.
Graphical view of REC in countries with “high” HDI (Ranked 67–115).
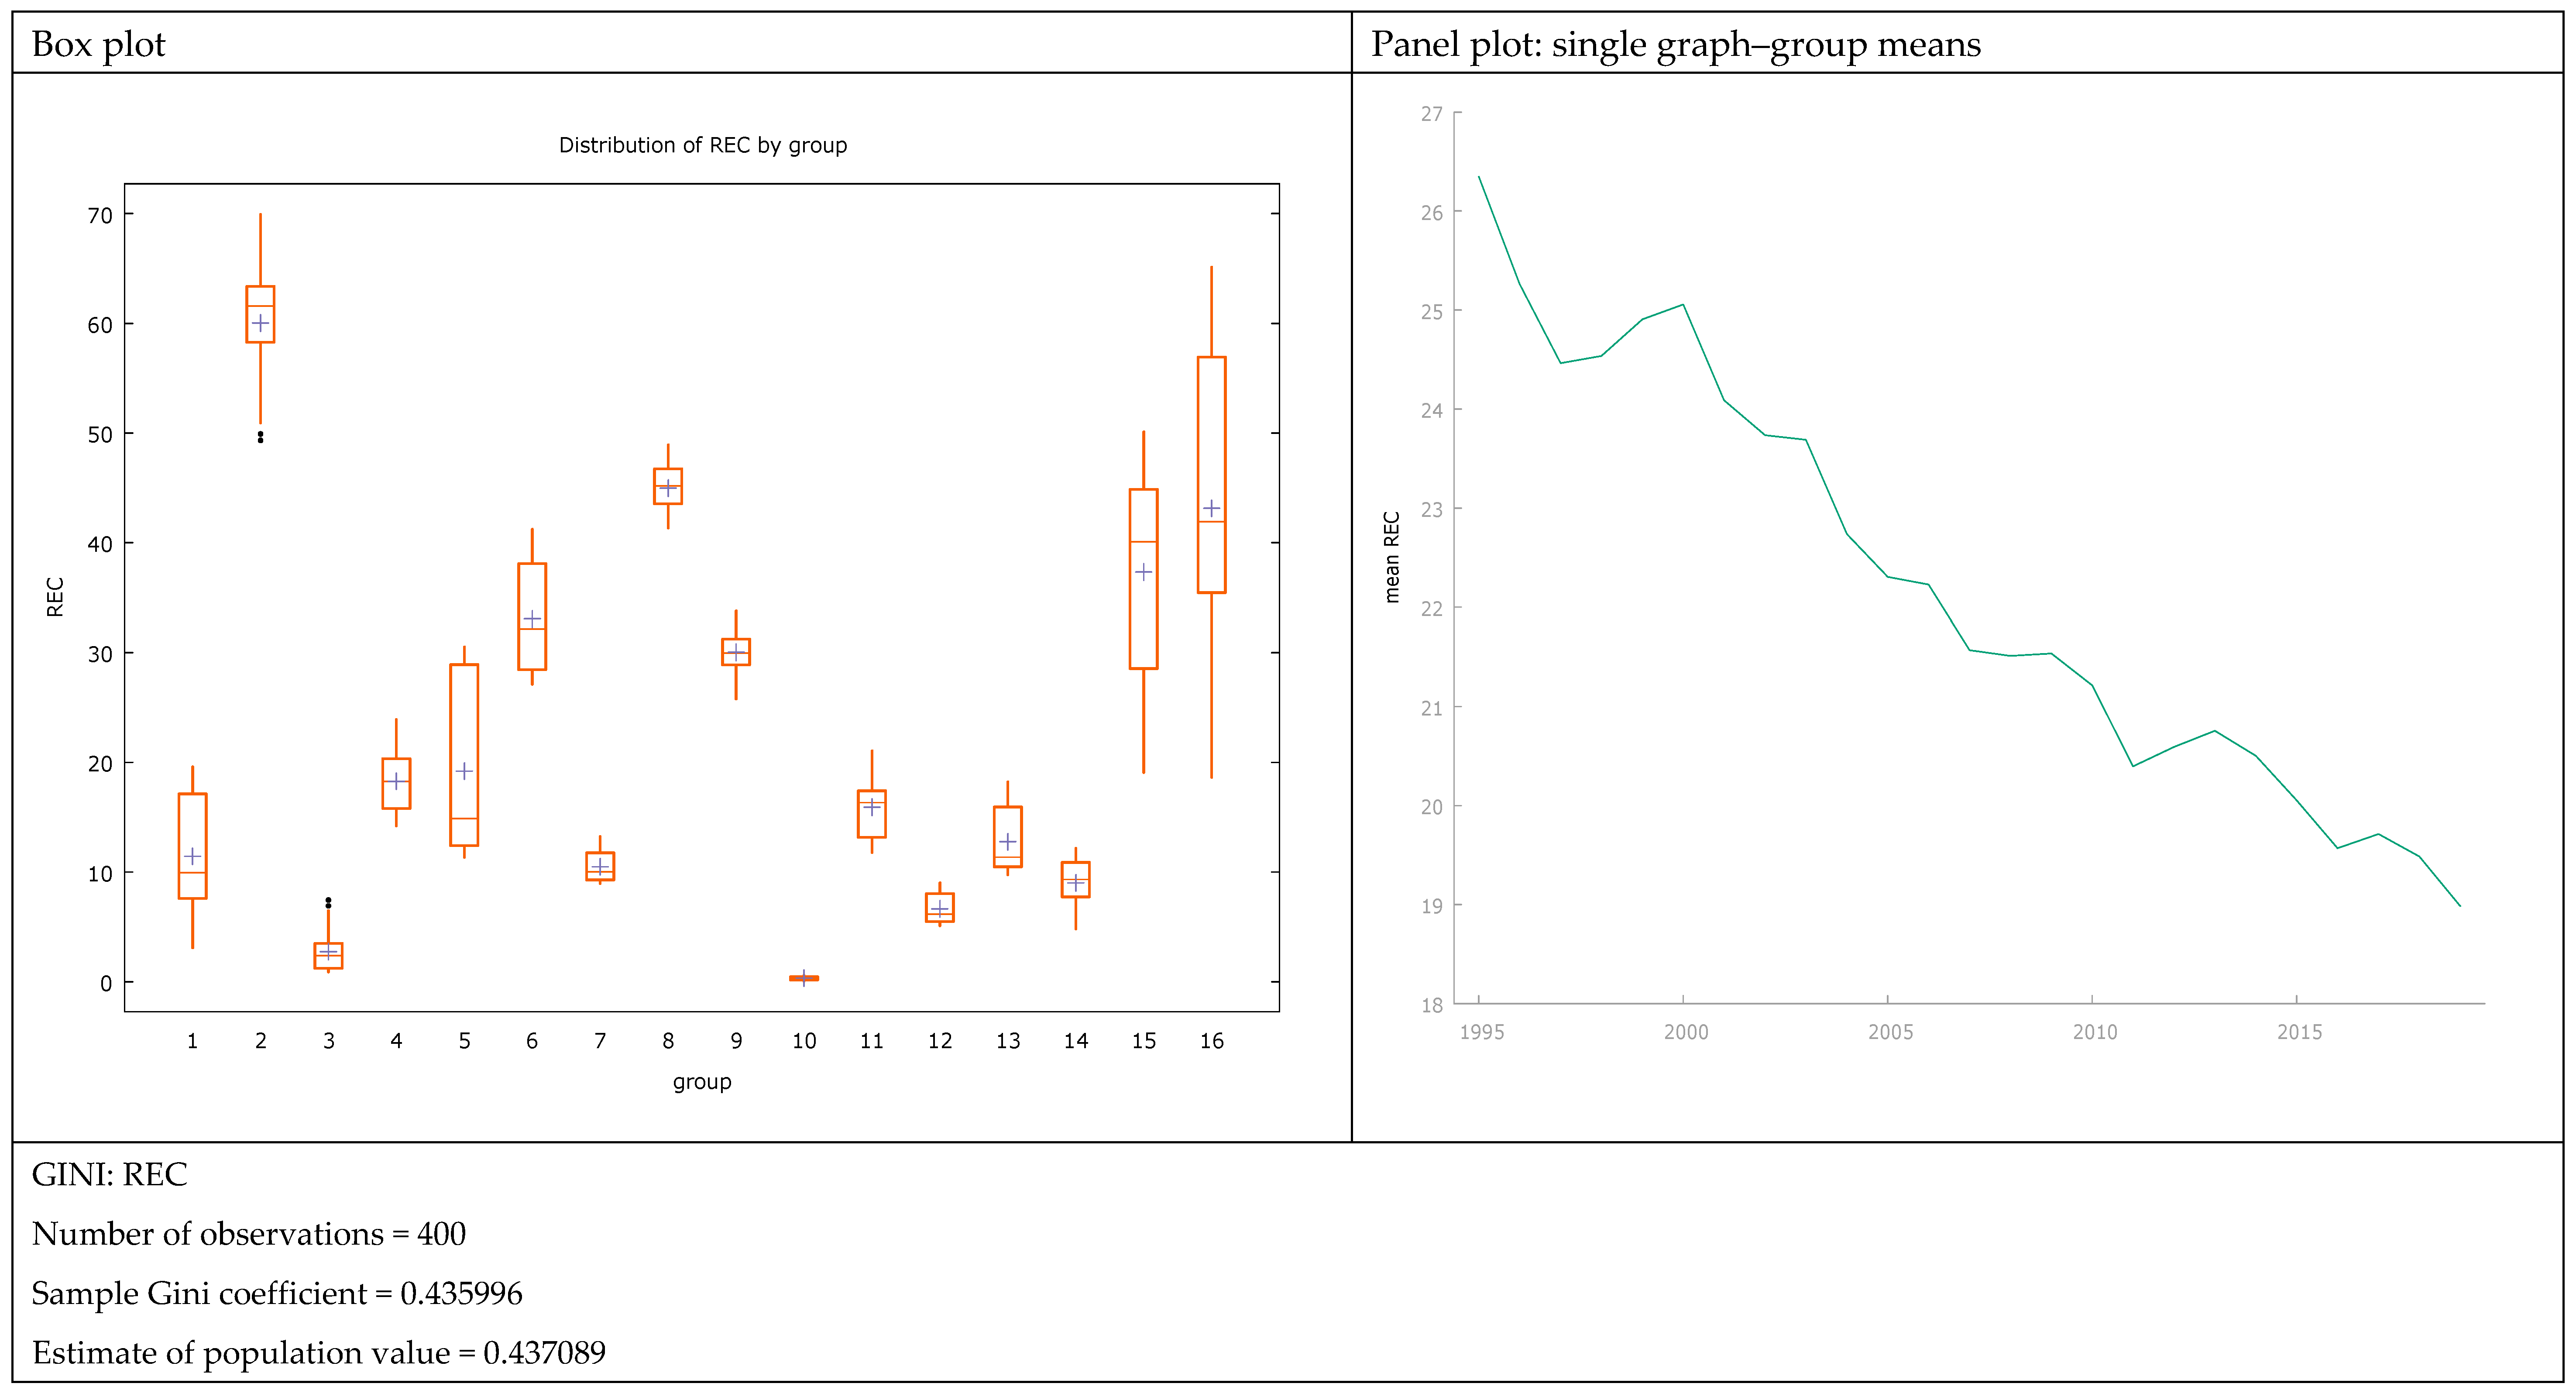

Figure A4.
Graphical view of CO2pc in countries with “high” HDI (Ranked 67–115).
Figure A4.
Graphical view of CO2pc in countries with “high” HDI (Ranked 67–115).
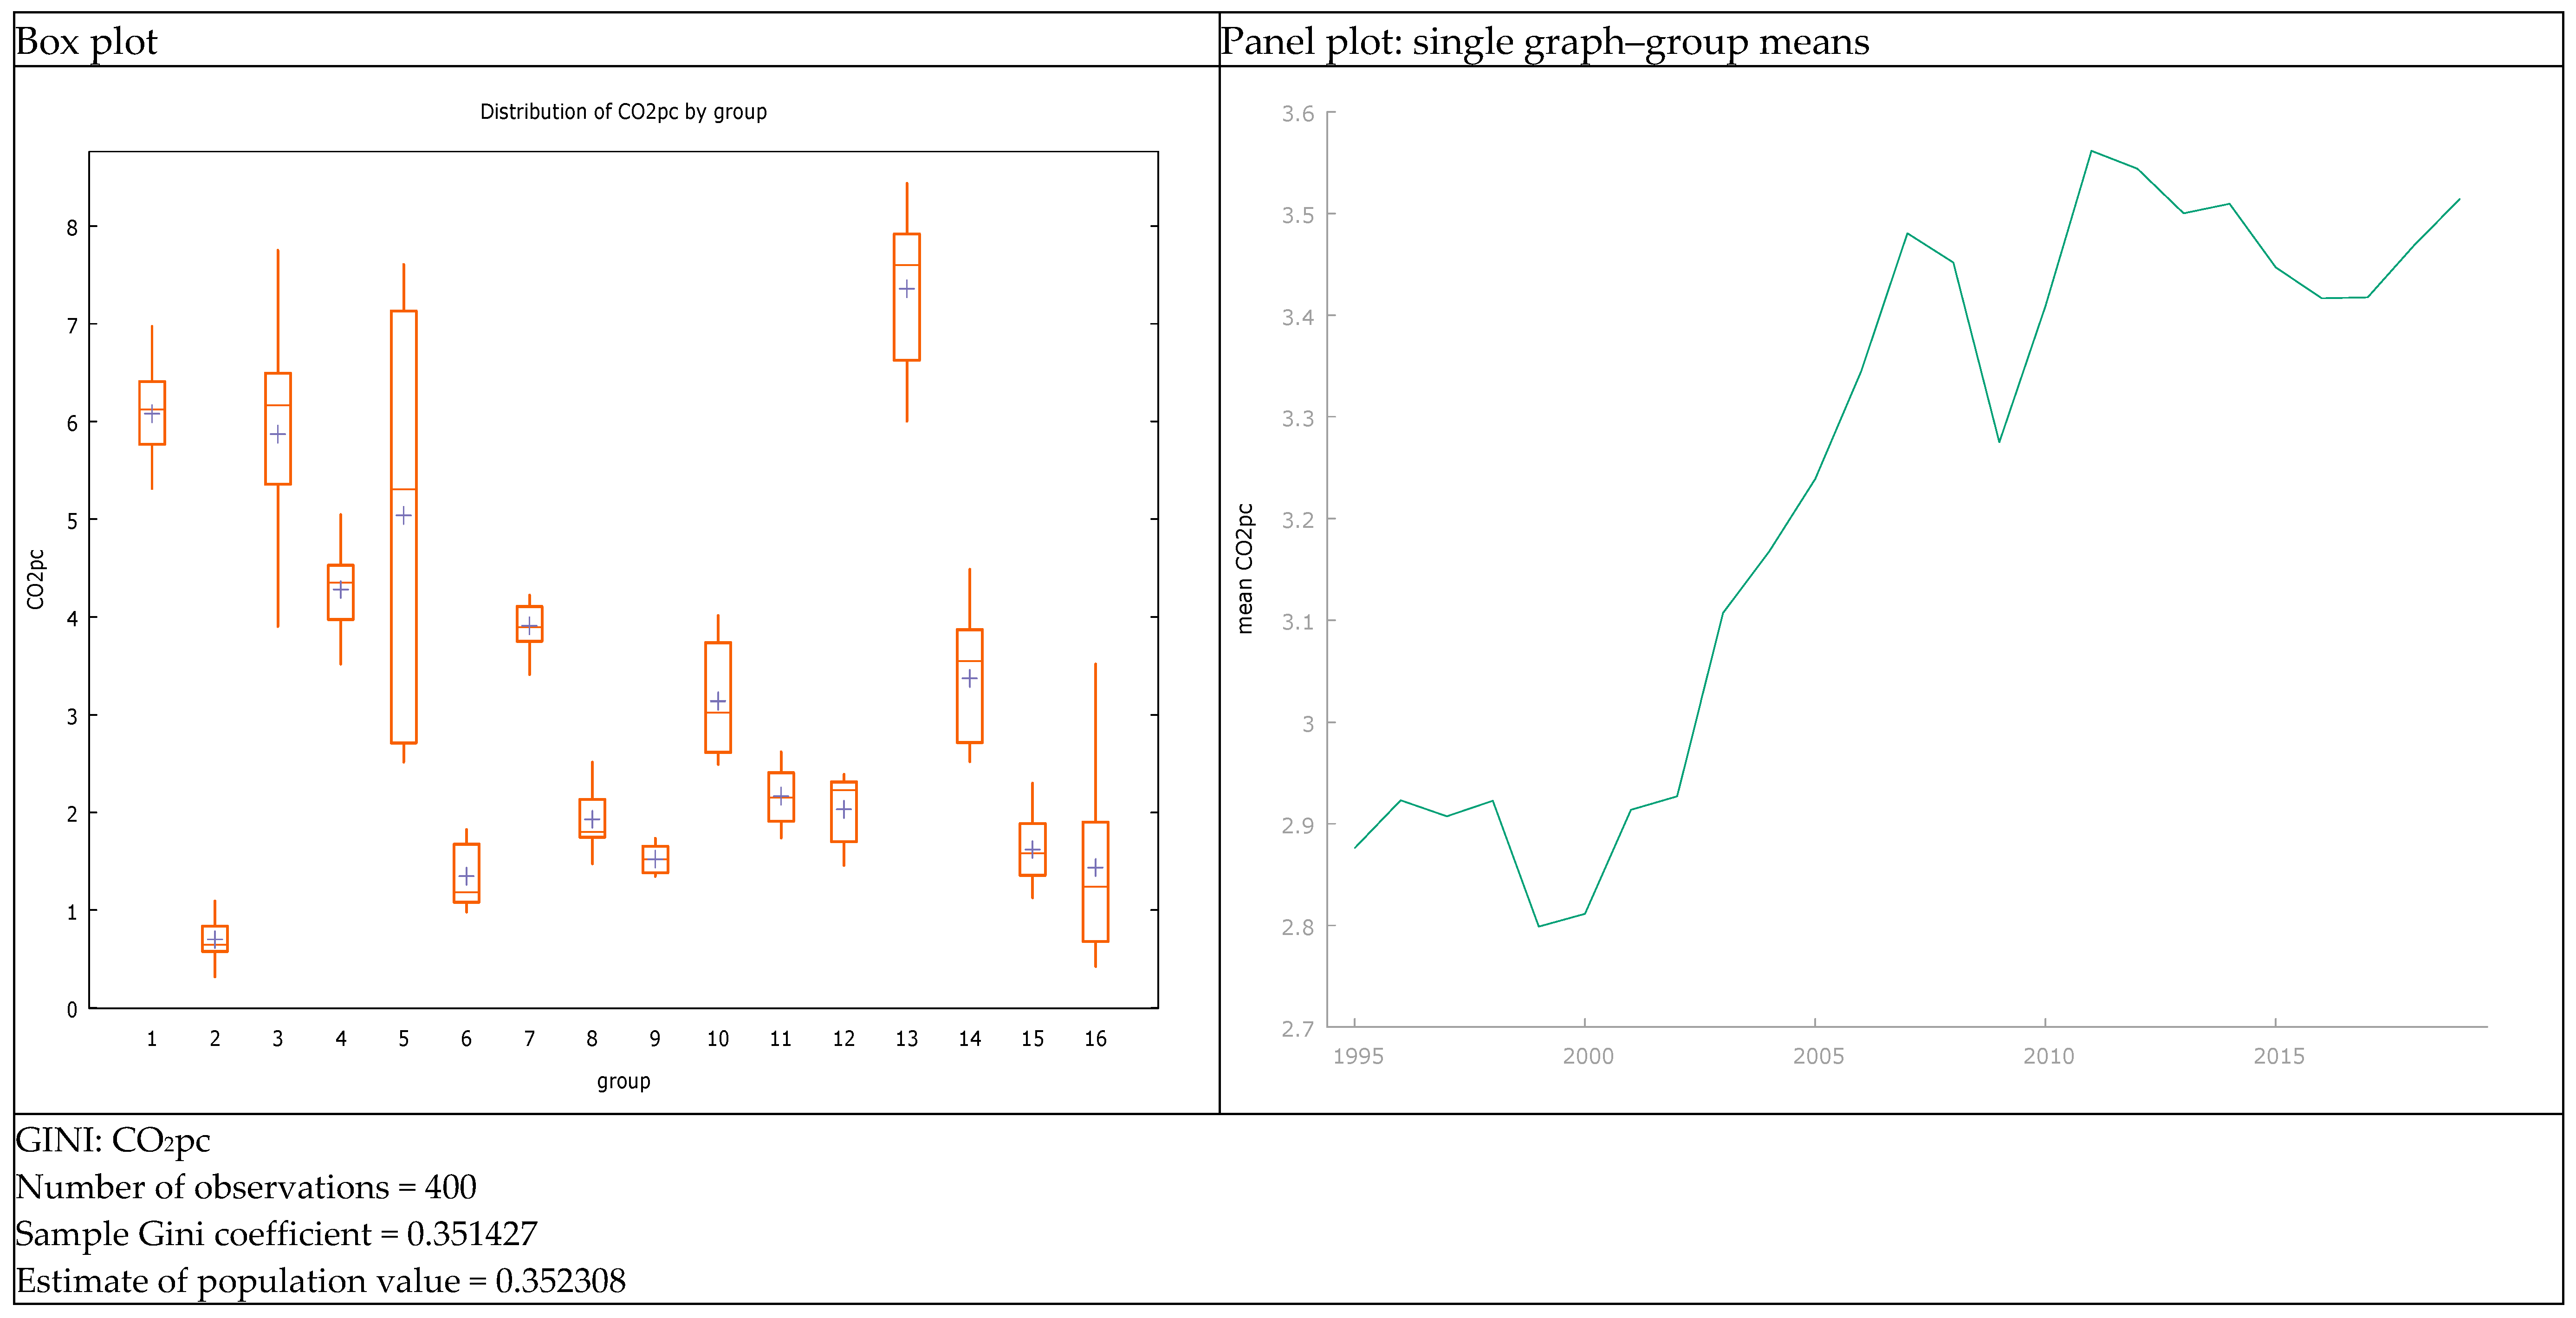
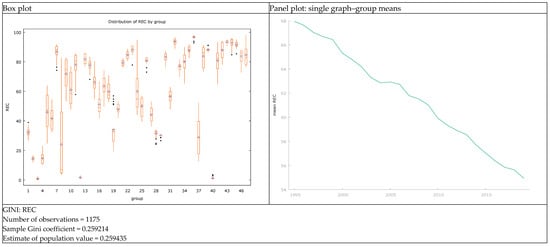
Figure A5.
Graphical view of REC in countries with “medium and low” HDI (Ranked 116–191).
Figure A5.
Graphical view of REC in countries with “medium and low” HDI (Ranked 116–191).
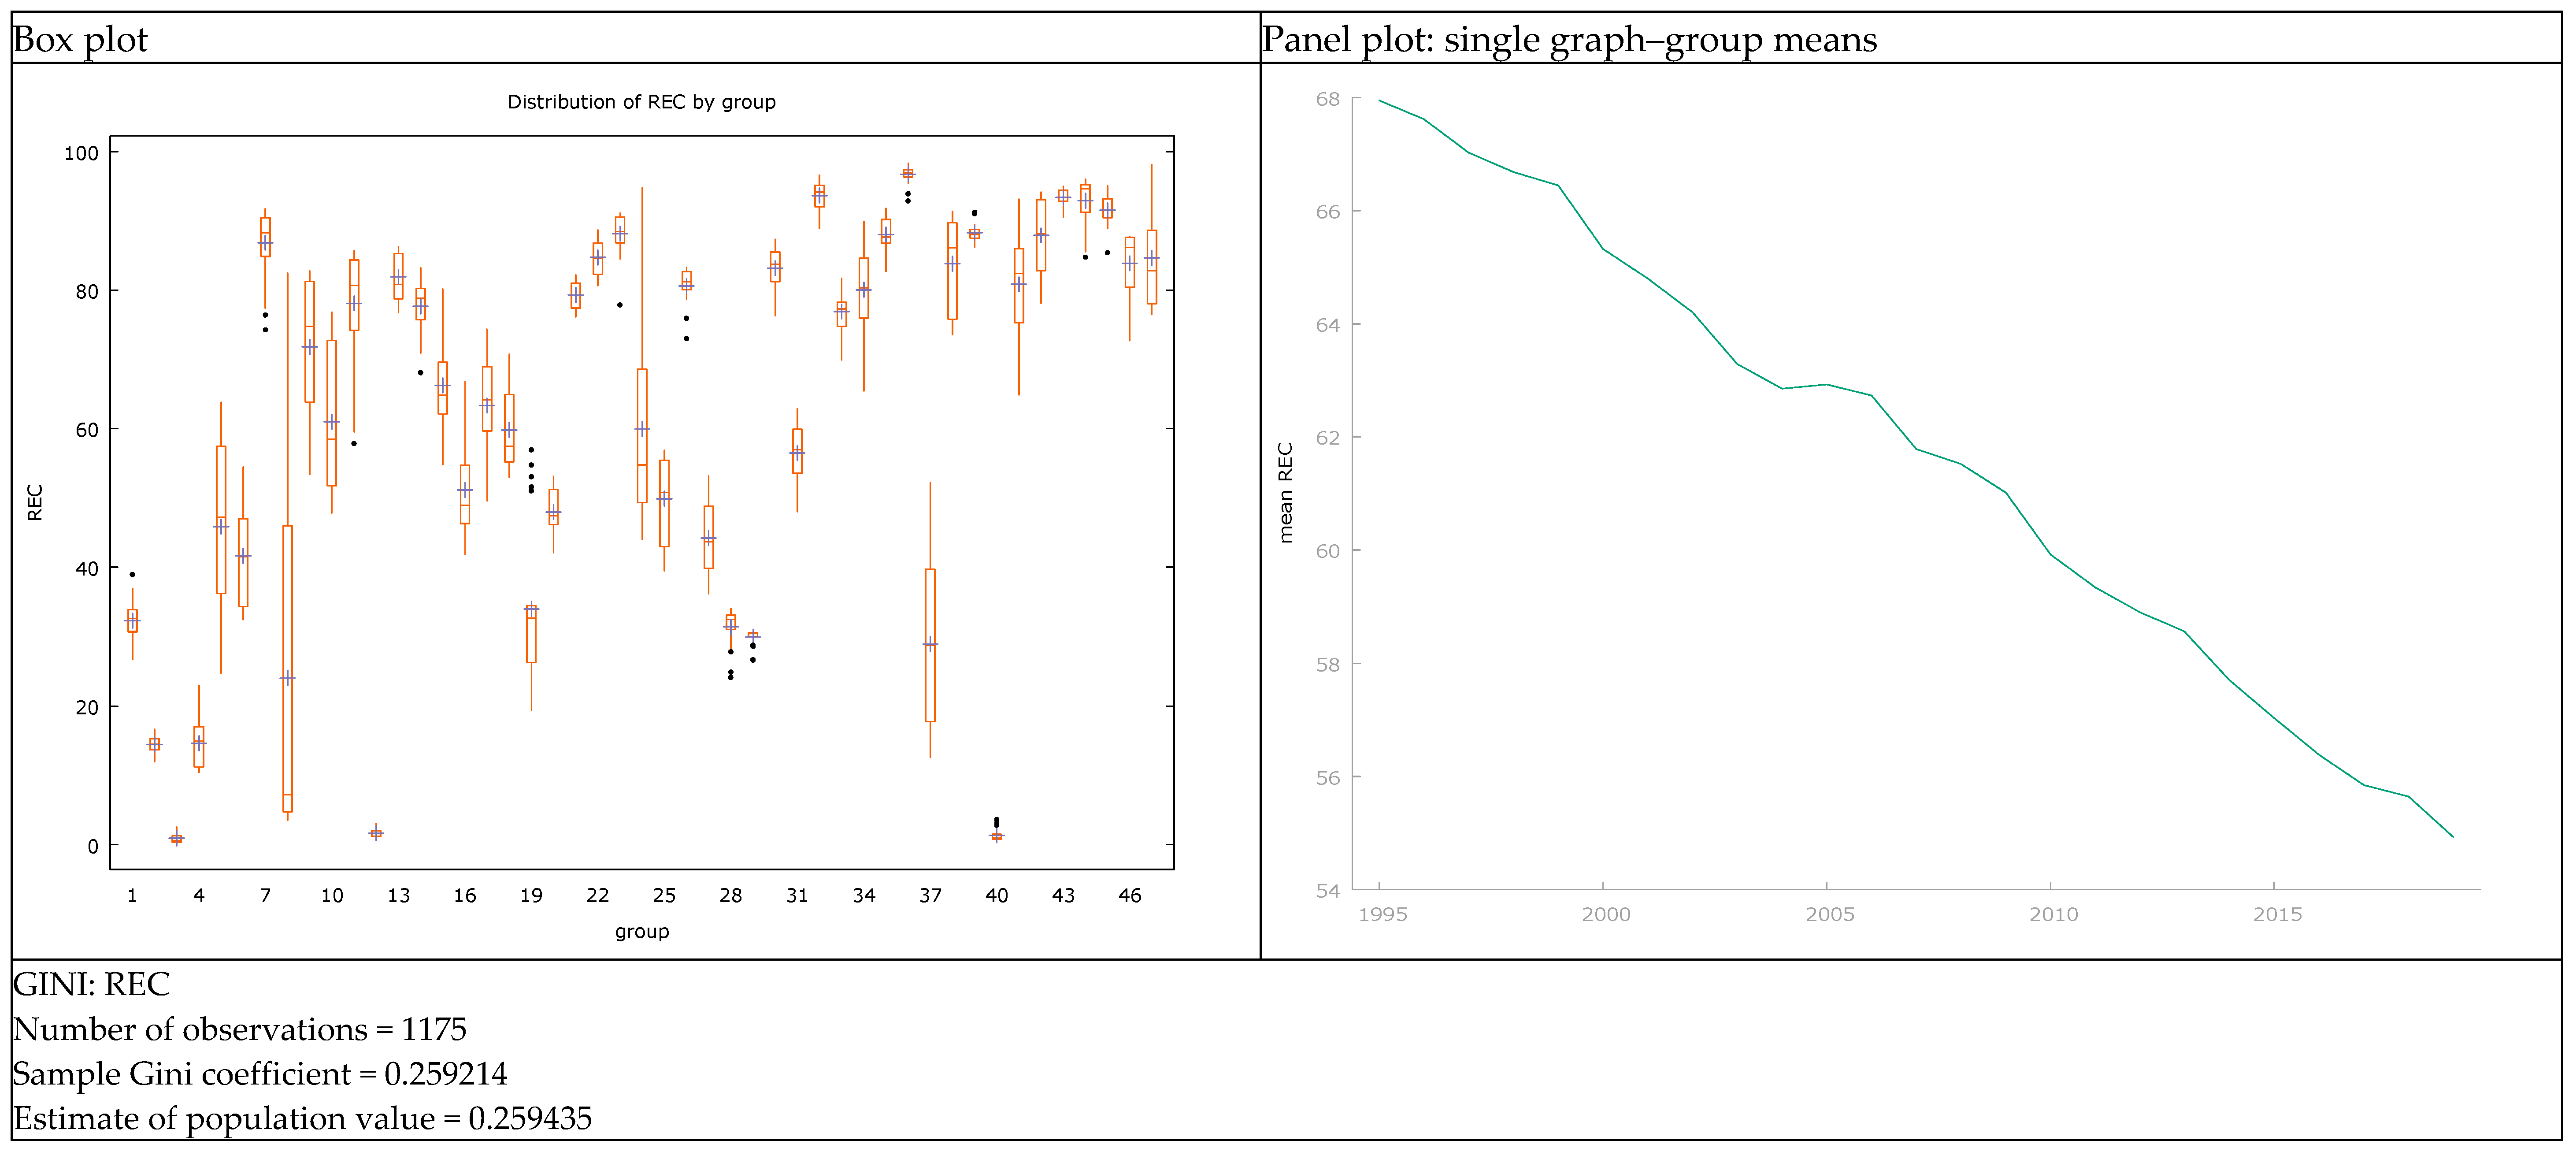
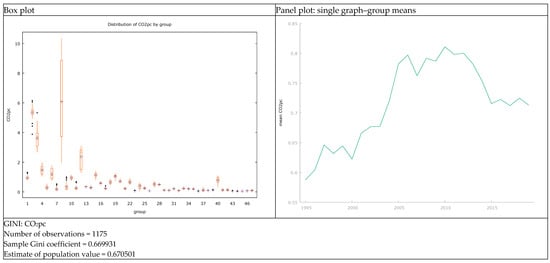
Figure A6.
Graphical view of CO2pc in countries with “medium and low” HDI (Ranked 116–191).
Figure A6.
Graphical view of CO2pc in countries with “medium and low” HDI (Ranked 116–191).
References
- Statistical Review of World Energy 2022. 2022. Available online: https://www.bp.com/content/dam/bp/business-sites/en/global/corporate/pdfs/energy-economics/statistical-review/bp-stats-review-2022-full-report.pdf (accessed on 18 June 2024).
- Das, G.G.; Drine, I. Distance from the Technology Frontier: How Could Africa Catch-up via Socio-Institutional Factors and Human Capital? Technol. Forecast. Soc. Chang. 2020, 150, 119755. [Google Scholar] [CrossRef]
- UNDP. The Next Frontier: Human Development and the Anthropocene. In Human Development Report; United Nations Development Programme: New York, NY, USA, 2020; ISBN 978-92-1-126442-5. [Google Scholar]
- Błażejowski, M.; Kufel, P.; Kwiatkowski, J. Model Simplification and Variable Selection: A Replication of the UK Inflation Model by Hendry (2001). J. Appl. Econom. 2020, 35, 645–652. [Google Scholar] [CrossRef]
- Aguirre, M.; Ibikunle, G. Determinants of Renewable Energy Growth: A Global Sample Analysis. Energy Policy 2014, 69, 374–384. [Google Scholar] [CrossRef]
- Sadorsky, P. Renewable Energy Consumption, CO2 Emissions and Oil Prices in the G7 Countries. Energy Econ. 2009, 31, 456–462. [Google Scholar] [CrossRef]
- Chang, T.-H.; Huang, C.-M.; Lee, M.-C. Threshold Effect of the Economic Growth Rate on the Renewable Energy Development from a Change in Energy Price: Evidence from OECD Countries. Energy Policy 2009, 37, 5796–5802. [Google Scholar] [CrossRef]
- Brunnschweiler, C.N. Finance for Renewable Energy: An Empirical Analysis of Developing and Transition Economies. Envir. Dev. Econ. 2010, 15, 241–274. [Google Scholar] [CrossRef]
- Lin, B.; Omoju, O.E. Focusing on the Right Targets: Economic Factors Driving Non-Hydro Renewable Energy Transition. Renew. Energy 2017, 113, 52–63. [Google Scholar] [CrossRef]
- Lu, W.-C. Renewable Energy, Carbon Emissions, and Economic Growth in 24 Asian Countries: Evidence from Panel Cointegration Analysis. Environ. Sci. Pollut. Res. 2017, 24, 26006–26015. [Google Scholar] [CrossRef]
- Gershon, O.; Emekalam, P. Determinants of renewable energy consumption in Nigeria: A Toda Yamamoto approach. In IOP Conference Series: Earth and Environmental Science; IOP Publishing: Bristol, UK, 2021; Volume 665, p. 012005. [Google Scholar] [CrossRef]
- Marques, A.C.; Fuinhas, J.A.; Pires Manso, J.R. Motivations Driving Renewable Energy in European Countries: A Panel Data Approach. Energy Policy 2010, 38, 6877–6885. [Google Scholar] [CrossRef]
- Nicolini, M.; Tavoni, M. Are Renewable Energy Subsidies Effective? Evidence from Europe. Renew. Sustain. Energy Rev. 2017, 74, 412–423. [Google Scholar] [CrossRef]
- Nyiwul, L. Economic Performance, Environmental Concerns, and Renewable Energy Consumption: Drivers of Renewable Energy Development in Sub-Sahara Africa. Clean Technol. Environ. Policy 2017, 19, 437–450. [Google Scholar] [CrossRef]
- Popp, D.; Hascic, I.; Medhi, N. Technology and the Diffusion of Renewable Energy. Energy Econ. 2011, 33, 648–662. [Google Scholar] [CrossRef]
- Romano, A.A.; Scandurra, G. Investments in Renewable Energy Sources in Countries Grouped by Income Level. Energy Sources Part B Econ. Plan. Policy 2016, 11, 929–935. [Google Scholar] [CrossRef]
- Apergis, N.; Payne, J.E. Renewable Energy Consumption and Economic Growth: Evidence from a Panel of OECD Countries. Energy Policy 2010, 38, 656–660. [Google Scholar] [CrossRef]
- Menegaki, A.N. Growth and Renewable Energy in Europe: A Random Effect Model with Evidence for Neutrality Hypothesis. Energy Econ. 2011, 33, 257–263. [Google Scholar] [CrossRef]
- Ohler, A.; Fetters, I. The Causal Relationship between Renewable Electricity Generation and GDP Growth: A Study of Energy Sources. Energy Econ. 2014, 43, 125–139. [Google Scholar] [CrossRef]
- Akintande, O.J.; Olubusoye, O.E.; Adenikinju, A.F.; Olanrewaju, B.T. Modeling the Determinants of Renewable Energy Consumption: Evidence from the Five Most Populous Nations in Africa. Energy 2020, 206, 117992. [Google Scholar] [CrossRef]
- Borozan, D.; Borozan, L. Examining the Industrial Energy Consumption Determinants: A Panel Bayesian Model Averaging Approach. Energies 2019, 13, 70. [Google Scholar] [CrossRef]
- Ergun, S.J.; Owusu, P.A.; Rivas, M.F. Determinants of Renewable Energy Consumption in Africa. Environ. Sci. Pollut. Res. 2019, 26, 15390–15405. [Google Scholar] [CrossRef]
- Kahia, M.; Ben Jebli, M.; Belloumi, M. Analysis of the Impact of Renewable Energy Consumption and Economic Growth on Carbon Dioxide Emissions in 12 MENA Countries. Clean Technol. Environ. Policy 2019, 21, 871–885. [Google Scholar] [CrossRef]
- Nguyen, K.H.; Kakinaka, M. Renewable Energy Consumption, Carbon Emissions, and Development Stages: Some Evidence from Panel Cointegration Analysis. Renew Energy 2019, 132, 1049–1057. [Google Scholar] [CrossRef]
- Olanrewaju, B.T.; Olubusoye, O.E.; Adenikinju, A.; Akintande, O.J. A Panel Data Analysis of Renewable Energy Consumption in Africa. Renew. Energy 2019, 140, 668–679. [Google Scholar] [CrossRef]
- Wang, Q.; Wang, L. Renewable Energy Consumption and Economic Growth in OECD Countries: A Nonlinear Panel Data Analysis. Energy 2020, 207, 118200. [Google Scholar] [CrossRef]
- Zhang, W.; Yang, J. Forecasting Natural Gas Consumption in China by Bayesian Model Averaging. Energy Rep. 2015, 1, 216–220. [Google Scholar] [CrossRef]
- Zhao, P.; Lu, Z.; Fang, J.; Paramati, S.R.; Jiang, K. Determinants of Renewable and Non-Renewable Energy Demand in China. Struct. Chang. Econ. Dyn. 2020, 54, 202–209. [Google Scholar] [CrossRef]
- Bourcet, C. Empirical Determinants of Renewable Energy Deployment: A Systematic Literature Review. Energy Econ. 2020, 85, 104563. [Google Scholar] [CrossRef]
- Carley, S.; Baldwin, E.; MacLean, L.M.; Brass, J.N. Global Expansion of Renewable Energy Generation: An Analysis of Policy Instruments. Environ. Resour. Econ. 2017, 68, 397–440. [Google Scholar] [CrossRef]
- Marques, A.C.; Fuinhas, J.A.; Pereira, D.S. The Dynamics of the Short and Long-Run Effects of Public Policies Supporting Renewable Energy: A Comparative Study of Installed Capacity and Electricity Generation. Econ. Anal. Policy 2019, 63, 188–206. [Google Scholar] [CrossRef]
- Przychodzen, W.; Przychodzen, J. Determinants of Renewable Energy Production in Transition Economies: A Panel Data Approach. Energy 2020, 191, 116583. [Google Scholar] [CrossRef]
- Xu, X.; Wei, Z.; Ji, Q.; Wang, C.; Gao, G. Global Renewable Energy Development: Influencing Factors, Trend Predictions and Countermeasures. Resour. Policy 2019, 63, 101470. [Google Scholar] [CrossRef]
- Salim, R.A.; Rafiq, S. Why Do Some Emerging Economies Proactively Accelerate the Adoption of Renewable Energy? Energy Econ. 2012, 34, 1051–1057. [Google Scholar] [CrossRef]
- Assi, A.F.; Zhakanova Isiksal, A.; Tursoy, T. Renewable Energy Consumption, Financial Development, Environmental Pollution, and Innovations in the ASEAN + 3 Group: Evidence from (P-ARDL) Model. Renew. Energy 2021, 165, 689–700. [Google Scholar] [CrossRef]
- Lawal, A.I. Determinants of Renewable Energy Consumption in Africa: Evidence from System GMM. Energies 2023, 16, 2136. [Google Scholar] [CrossRef]
- Raychev, S.; Dimitrova, G.; Madzhurova, B.; Stoyanova, D. Innovations as a Factor for Economic Growth and Labor Market Development. MMI 2020, 3, 22–31. [Google Scholar] [CrossRef]
- Ziabina, Y.; Pimonenko, T.; Lyulyov, O.; Us, Y.; Proshkin, D. Evolutionary Development of Energy Efficiency in the Context of the National Carbon-Free Economic Development. E3S Web Conf. 2021, 307, 09002. [Google Scholar] [CrossRef]
- Ziabina, Y.; Pimonenko, T.; Starchenko, L. Energy Efficiency of National Economy: Social, Economic And Ecological Indicators. SEC 2020, 4, 160–174. [Google Scholar] [CrossRef]
- Omri, A.; Daly, S.; Nguyen, D.K. A Robust Analysis of the Relationship between Renewable Energy Consumption and Its Main Drivers. Appl. Econ. 2015, 47, 2913–2923. [Google Scholar] [CrossRef]
- Sadorsky, P. Renewable Energy Consumption and Income in Emerging Economies. Energy Policy 2009, 37, 4021–4028. [Google Scholar] [CrossRef]
- Apergis, N.; Payne, J.E. Renewable and Non-Renewable Energy Consumption-Growth Nexus: Evidence from a Panel Error Correction Model. Energy Econ. 2012, 34, 733–738. [Google Scholar] [CrossRef]
- Tugcu, C.T.; Ozturk, I.; Aslan, A. Renewable and Non-Renewable Energy Consumption and Economic Growth Relationship Revisited: Evidence from G7 Countries. Energy Econ. 2012, 34, 1942–1950. [Google Scholar] [CrossRef]
- Mohsin, M.; Kamran, H.W.; Atif Nawaz, M.; Sajjad Hussain, M.; Dahri, A.S. Assessing the Impact of Transition from Nonrenewable to Renewable Energy Consumption on Economic Growth-Environmental Nexus from Developing Asian Economies. J. Environ. Manag. 2021, 284, 111999. [Google Scholar] [CrossRef] [PubMed]
- Aneja, R.; Banday, U.J.; Hasnat, T.; Koçoglu, M. Renewable and non-renewable energy consumption and economic growth: Empirical evidence from panel error correction model. Jindal J. Bus. Res. 2017, 6, 76–85. [Google Scholar] [CrossRef]
- Dingru, L.; Onifade, S.T.; Ramzan, M.; AL-Faryan, M.A.S. Environmental Perspectives on the Impacts of Trade and Natural Resources on Renewable Energy Utilization in Sub-Sahara Africa: Accounting for FDI, Income, and Urbanization Trends. Resour. Policy 2023, 80, 103204. [Google Scholar] [CrossRef]
- Narayan, P.K.; Smyth, R.; Prasad, A. Electricity Consumption in G7 Countries: A Panel Cointegration Analysis of Residential Demand Elasticities. Energy Policy 2007, 35, 4485–4494. [Google Scholar] [CrossRef]
- Lean, H.H.; Smyth, R. Multivariate Granger Causality between Electricity Generation, Exports, Prices and GDP in Malaysia. Energy 2010, 35, 3640–3648. [Google Scholar] [CrossRef]
- Lean, H.H.; Smyth, R. On the Dynamics of Aggregate Output, Electricity Consumption and Exports in Malaysia: Evidence from Multivariate Granger Causality Tests. Appl. Energy 2010, 87, 1963–1971. [Google Scholar] [CrossRef]
- Sadorsky, P. Trade and Energy Consumption in the Middle East. Energy Econ. 2011, 33, 739–749. [Google Scholar] [CrossRef]
- Sadorsky, P. Energy Consumption, Output and Trade in South America. Energy Econ. 2012, 34, 476–488. [Google Scholar] [CrossRef]
- Arif, I.; Kazmi, S.W.; Khan, L. Relationship between trade openness and energy consumption in oil importing Asian countries. J. Financ. Econ. Res. 2017, 2, 37–53. [Google Scholar] [CrossRef]
- Sonmez, F.; Manso, J.R.P. Impact of Macroeconomic and Social Variables on Renewable Energy Consumption for the G7 Countries: A Panel Data Approach. Available online: https://lisbon2018.econworld.org/papers/Sonmez_Manso_Impact.pdf (accessed on 11 September 2021).
- Saidi, K.; Omri, A. The Impact of Renewable Energy on Carbon Emissions and Economic Growth in 15 Major Renewable Energy-Consuming Countries. Environ. Res. 2020, 186, 109567. [Google Scholar] [CrossRef]
- Anton, S.G.; Afloarei Nucu, A.E. The Effect of Financial Development on Renewable Energy Consumption. A Panel Data Approach. Renew. Energy 2020, 147, 330–338. [Google Scholar] [CrossRef]
- Li, J.; Zhang, X.; Ali, S.; Khan, Z. Eco-innovation and energy productivity: New determinants of renewable energy consumption. J. Environ. Manag. 2020, 271, 111028. [Google Scholar] [CrossRef] [PubMed]
- Halicioglu, F.; Ketenci, N. Output, renewable and non-renewable energy production, and international trade: Evidence from EU-15 countries. Energy 2018, 159, 995–1002. [Google Scholar] [CrossRef]
- Dogan, E.; Seker, F. Determinants of CO2 emissions in the European Union: The role of renewable and non-renewable energy. Renew. Energy 2016, 94, 429–439. [Google Scholar] [CrossRef]
- Khan, A.M.; Kwiatkowski, J.; Osińska, M.; Błażejowski, M. Factors of Renewable Energy Consumption in the European Countries—The Bayesian Averaging Classical Estimates Approach. Energies 2021, 14, 7526. [Google Scholar] [CrossRef]
- Omri, A.; Nguyen, D.K. On the Determinants of Renewable Energy Consumption: International Evidence. Energy 2014, 72, 554–560. [Google Scholar] [CrossRef]
- Al-mulali, U.; Fereidouni, H.G.; Lee, J.Y.; Sab, C.N.B.C. Examining the Bi-Directional Long Run Relationship between Renewable Energy Consumption and GDP Growth. Renew. Sustain. Energy Rev. 2013, 22, 209–222. [Google Scholar] [CrossRef]
- Doytch, N.; Narayan, S. Does FDI Influence Renewable Energy Consumption? An Analysis of Sectoral FDI Impact on Renewable and Non-Renewable Industrial Energy Consumption. Energy Econ. 2016, 54, 291–301. [Google Scholar] [CrossRef]
- Amri, F. The Relationship amongst Energy Consumption, Foreign Direct Investment and Output in Developed and Developing Countries. Renew. Sustain. Energy Rev. 2016, 64, 694–702. [Google Scholar] [CrossRef]
- Qamruzzaman, M.; Jianguo, W. The Asymmetric Relationship between Financial Development, Trade Openness, Foreign Capital Flows, and Renewable Energy Consumption: Fresh Evidence from Panel NARDL Investigation. Renew. Energy 2020, 159, 827–842. [Google Scholar] [CrossRef]
- Khan, H.; Khan, I.; Kim Oanh, L.T.; Lin, Z. The Dynamic Interrelationship of Environmental Factors and Foreign Direct Investment: Dynamic Panel Data Analysis and New Evidence from the Globe. Math. Probl. Eng. 2020, 2020, 1–12. [Google Scholar] [CrossRef]
- do Carvalhal Monteiro, R.L.; Pereira, V.; Costa, H.G. A multicriteria approach to the human development index classification. Soc. Indic. Res. 2018, 136, 417–438. [Google Scholar] [CrossRef]
- Ouedraogo, N.S. Energy consumption and human development: Evidence from a panel cointegration and error correction model. Energy 2013, 63, 28–41. [Google Scholar] [CrossRef]
- Hung, N.T. Effect of economic indicators, biomass energy on human development in China. Energy Environ. 2022, 33, 829–852. [Google Scholar] [CrossRef]
- Gujarati, D.N. Basic Econometrics; Tata McGraw-Hill Education: New York, NY, USA, 2009. [Google Scholar]
- Hausman, J.A.; Taylor, W.E. Panel data and unobservable individual effects. Econom. J. Econom. Soc. 1981, 49, 1377–1398. [Google Scholar]
- Koop, G. Bayesian Econometrics; John Wiley & Sons Ltd.: Hoboken, NJ, USA, 2003. [Google Scholar]
- Steel, M.F.J. Model averaging and its use in economics. J. Econ. Lit. 2020, 58, 644–719. [Google Scholar] [CrossRef]
- Mitchell, T.J.; Beauchamp, J.J. Bayesian variable selection in linear regression. J. Am. Stat. Assoc. Assoc. 1988, 83, 1023–1032. Available online: https://www.jstor.org/stable/pdf/2290129.pdf (accessed on 18 June 2024). [CrossRef]
- Błażejowski, M.; Kwiatkowski, J. Bayesian Model Averaging and Jointness Measures for gretl. J. Stat. Softw. 2015, 68, 1–24. [Google Scholar] [CrossRef]
- Feldkircher, M. BMS and the Fixed Effects Estimator-A Tutorial. 2011. Available online: https://www.r-bloggers.com/bms-and-the-fixed-effects-estimator-a-tutorial/ (accessed on 5 April 2024).
- Cottrell, A.; Lucchetti, R. Gretl Command Reference. 2024. Available online: https://gretl.sourceforge.net/gretl-help/cmdref.html (accessed on 18 June 2024).
- Ahuja, D.; Tatsutani, M. Sustainable Energy for Developing Countries. 2009. Available online: https://journals.openedition.org/sapiens/823 (accessed on 22 July 2024).
- Hinne, M.; Gronau, Q.F.; van den Bergh, D.; Wagenmakers, E.J. A conceptual introduction to Bayesian model averaging. Adv. Methods Pract. Psychol. Sci. 2020, 3, 200–215. [Google Scholar] [CrossRef]
- Balázs, É.; Kózluk, T.; Sutherland, D. Infrastructure and growth: Empirical evidence. In OECD Economics Department Working Papers; OECD Publishing: Paris, France, 2009; Volume 685. [Google Scholar] [CrossRef]
- Moral-Benito, E. Determinants of economic growth: A Bayesian panel data approach. Rev. Econ. Stat. 2012, 94, 566–579. [Google Scholar] [CrossRef]
- Albis, M.L.F.; Mapa, D.S. Bayesian averaging of classical estimates in asymmetric vector autoregressive models. Commun. Stat. -Simul. Comput. 2017, 46, 1760–1770. [Google Scholar] [CrossRef]
- Lupu, I.; Hurduzeu, G.; Lupu, R.; Popescu, M.F.; Gavrilescu, C. Drivers for Renewable Energy Consumption in European Union Countries. A Panel Data Insight. Amfiteatru Economic. 2023, 25, 380–396. [Google Scholar] [CrossRef] [PubMed]
- Estevão, J.; Lopes, J.D. SDG7 and renewable energy consumption: The influence of energy sources. Technol. Forecast. Soc. Chang. 2024, 198, 123004. [Google Scholar] [CrossRef]
- Muazu, A.; Yu, Q.; Liu, Q. Does renewable energy consumption promote economic growth? An empirical analysis of panel threshold based on 54 African countries. Int. J. Energy Sect. Manag. 2023, 17, 106–127. [Google Scholar] [CrossRef]
Disclaimer/Publisher’s Note: The statements, opinions and data contained in all publications are solely those of the individual author(s) and contributor(s) and not of MDPI and/or the editor(s). MDPI and/or the editor(s) disclaim responsibility for any injury to people or property resulting from any ideas, methods, instructions or products referred to in the content. |
© 2024 by the authors. Licensee MDPI, Basel, Switzerland. This article is an open access article distributed under the terms and conditions of the Creative Commons Attribution (CC BY) license (https://creativecommons.org/licenses/by/4.0/).