Abstract
In order to address the issues of significant energy and resource waste, low-energy management efficiency, and high building-maintenance costs in hot-summer and cold-winter regions of China, a research project was conducted on an office building located in Nantong. In this study, a data-driven golden jackal optimization (GJO)-based Long Short-Term Memory (LSTM) short-term energy-consumption prediction and optimization system is proposed. The system creates an equivalent model of the office building and employs the genetic algorithm tool Wallacei to automatically optimize and control the building’s air conditioning system, thereby achieving the objective of reducing energy consumption. To validate the authenticity of the optimization scheme, unoptimized building energy consumption was predicted using a data-driven short-term energy consumption-prediction model. The actual comparison data confirmed that the reduction in energy consumption resulted from implementing the air conditioning-optimization scheme rather than external factors. The optimized building can achieve an hourly energy saving rate of 6% to 9%, with an average daily energy-saving rate reaching 8%. The entire system, therefore, enables decision-makers to swiftly assess and validate the efficacy of energy consumption-optimization programs, thereby furnishing a scientific foundation for energy management and optimization in real-world buildings.
1. Introduction
The acceleration of global urbanization and population growth has resulted in the expansion of building land and building area, thereby leading to a significant increase in building energy consumption. The global energy landscape is significantly influenced by building energy consumption, which accounts for more than a third of total global energy consumption [1]. The building sector in China accounts for 45.5% of the total energy consumption and contributes to 50.9% of the national carbon emissions, with a consistent upward trend over the years [2]. In the China–US Joint Announcement on Climate Change, China proposed to peak carbon emissions around 2030 and strive for carbon neutrality by 2060 [3,4]. Therefore, it is urgent to study building energy consumption and find effective energy management strategies to achieve energy sustainability and reduce carbon emissions.
In recent years, there has been notable progress in enhancing the energy efficiency of buildings through the implementation of energy-efficient building designs [5,6,7], advanced equipment and technologies [8,9], as well as intelligent control systems [10,11]. Yixing Chen et al. [12] assessed the impact of climate change and building energy efficiency on building diversity in Changsha, China, and subdivided four energy management measures and rooftop photovoltaic systems based on energy efficiency criteria. After optimization, large office buildings can achieve an energy saving rate of 46.67%. Zengxi Feng et al. [13] use an improved beluga whale optimization algorithm (IBWO) to optimize long short-term memory networks (LSTMs) for short-term energy consumption prediction in a Xi’an office. Xiaoyu Luo et al. [14] established a multi-objective optimization (MOO) model for the building envelope of an office park, comprehensively considering the photovoltaic area of the building and the location relationship under the photovoltaic arrangement scheme. Zhixing Luo et al. [15] proposed a dual-objective optimization method based on the HypE algorithm and applied it to the design of a small office building in Xi’an, China, so as to solve the problem of low building energy efficiency. Xiao Chen et al. [16] developed a chaotic satin bowerbird optimization algorithm (CSBOA) for the minimization of energy consumption. In addition, the team established a comprehensive temperature plan for each area within an office building located in Edinburgh, Scotland, incorporating 24 h heating settings. Consequently, the implementation of this system has resulted in a remarkable 28% reduction in energy consumption costs, as per the TOU tariff. Fabrizio Ascione et al. [17] propose a simulation-based model predictive-control approach that incorporates multi-objective optimization of space conditioning and thermal comfort operating costs. The objective of the study was to optimize the hourly set temperature within a predetermined time frame based on weather conditions and occupancy forecasts. Currently, this method is applicable to multi-district residential buildings situated in Naples, Italy. Liu, Yang et al. [18] used building information modeling (BIM) and hybrid machine learning algorithms to analyze energy consumption parameters, thereby offering scientific recommendations for the selection of facades and air conditioning systems in both new constructions and existing buildings. Li Xiao-Xu et al. [19] optimized and analyzed the night ventilation strategy of an ultra-low-energy-consumption building in Shenyang, China, and examined the impact of various ventilation parameters on building temperature and energy usage, as well as comparing natural ventilation with mechanical ventilation schemes. Verma Rahul et al. [20] proposed four different passive building design strategies for buildings located in the composite climate zone of Delhi, India, to mitigate the impact of environmental conditions on building energy consumption in the composite climate zone. He Lihua et al. [21] studied public buildings in Qingdao and proposed a dual-objective integer programming optimization model to minimize energy consumption and investment costs. Ilbeigi, Marjan et al. [22] employed artificial neural networks and genetic algorithms to accurately forecast and optimize energy consumption in the Iranian Research Center building. Based on the findings, implementing system optimization measures can potentially result in a significant reduction of approximately 35% in the overall energy usage of the building. Liu, Ming et al. [23] simulated the building energy consumption and indoor thermal comfort of China University Student Center through software, and used a multi-objective optimization design method to find an optimization scheme for building energy consumption. Based on the simulation results, the optimized building achieved a 58.8% reduction in annual comprehensive energy consumption, while extending indoor thermal comfort by 53.0%.
The studies presented in the aforementioned papers primarily focus on identifying optimal energy consumption-reduction methods for buildings through case analyses. However, there is a dearth of pre- and post-analysis of energy consumption during real-world engineering applications to evaluate the actual impact and efficacy of the proposed methods. In light of the aforementioned situation, this paper selects an office building in Nantong as the experimental subject and proposes a data-driven system for short-term energy-consumption prediction and optimization. The objective of this system is to identify an energy consumption optimization scheme for real-world engineering buildings and validate the feasibility of this scheme through empirical data. The entire system is primarily categorized into energy consumption optimization, data acquisition, and energy consumption prediction. In terms of energy consumption optimization, the equivalent model of the office building is established through modeling and simulation software to obtain the energy consumption and optimization results of the building; in terms of data acquisition, the acquisition terminal reads and analyzes the meter data, and uploads the data to the cloud server through Ethernet or 4G; and in terms of energy consumption prediction, an energy consumption-prediction model based on GJO-LSTM is designed to predict the building energy consumption in the coming week.
The main contributions of this system are the following:
(1) The establishment of an integrated platform for model construction, energy consumption simulation, and automatic optimization is accomplished. The proposed design utilizes the Rhino and Grasshopper platforms to construct a representative model of the physical building. The energy consumption simulation is carried out by configuring the building-model information on the platform, while the genetic algorithm tool is employed to seek the optimal solution for energy consumption. This integrated platform offers efficient and precise solutions for energy-efficient design.
(2) The data collection process is confronted with challenges such as dealing with vast amounts of data, managing high complexity, and encountering difficulties in analysis. Therefore, the embedded Free Real Time Operating System (FreeRTOS) is selected for resource scheduling and problem handling [24]. The FreeRTOS system enables concurrent execution of multiple tasks with diverse functionalities including communication with multiple meters, data analysis and processing, and data uploading. Additionally, the integration design between the acquisition terminal and intelligent gateway is achieved based on the FreeRTOS system. Compared to traditional instruments used in the literature [25], the multitasking capability of FreeRTOS effectively minimizes system delays while meeting real-time monitoring requirements.
(3) The GJO-LSTM-based energy consumption-prediction method is designed to achieve accurate predictions of building energy consumption for the upcoming week [26,27]. Through practical testing, the prediction accuracy rate has reached 97%, and the accurate prediction of energy consumption has been basically realized. In addition, the combined prediction model of GJO-LSTM proves that the GJO algorithm has better optimization effect on the LSTM model, and further improves the prediction accuracy.
The entire system achieves the organic integration of modeling and simulation, data acquisition, real-time monitoring, practical application, and prediction verification. Driven by data from the collection system, accurate predictions are made for building energy consumption while verifying the feasibility of energy optimization. The solution provided takes into account all aspects of building energy consumption to ensure reliable optimization.
2. Energy Consumption Modeling and Optimization
This design selects an office building in Nantong as a reference example for 3D modeling. The objective of this study is to utilize software simulation techniques to identify strategies for reducing energy consumption in the physical building. Finally, the system achieves the goal of sustainable development through the enhancement of energy efficiency [28].
2.1. Research Methods and Routes
The design is based on the Rhino and Grasshopper platforms, aiming to establish an integrated platform for model construction, energy consumption simulation, and automatic optimization [29,30,31]. The research process is structured as follows:
(1) The office building’s equivalent model should be constructed based on the pertinent floor plan data.
(2) The Honeybee plugin was utilized to configure the model, encompassing the envelope structure, internal heat source, air conditioning system, and schedule. In addition, weather data for the region throughout the year is obtained through the local weather bureau.
(3) The OpenStudio engine is invoked within the simulation software to conduct an annual energy consumption analysis for the office building. After the simulation, the annual heating energy consumption, cooling energy consumption, lighting energy consumption and equipment energy consumption are obtained.
(4) The results of energy consumption were comprehensively analyzed, and the optimization target was selected as the genetic algorithm tool for gene input. Finally, the optimal results are output with minimizing energy consumption as the objective.
2.2. Establish Equivalent Model
The initial step is to gather the CAD design drawings, plans, elevations, and other relevant building data. The next step is to generate the fundamental architectural elements in Rhino, encompassing walls, floors, roofs, and other relevant components [32,33]. The architectural elements such as windows, doors, and skylights should be added based on the building’s characteristics [34]. The building consists of seven floors, with approximately twelve office areas on each floor, totaling eighty-seven rooms.
2.3. Structural Parameters of Building Model
2.3.1. Envelope Structure
The Honeybee plugin is utilized in the Grasshopper platform to establish the building model based on the current construction process. The envelope structure primarily comprises exterior walls and external windows:
(1) The exterior walls of the actual building are mainly composed of cement mortar, polystyrene foam, reinforced concrete and lime cement mortar. The parameters are presented in Table 1.

Table 1.
Main materials and parameters of external walls.
(2) The design of the exterior window primarily focuses on factors such as heat conduction, safety, solar radiation, and other related considerations. The parameters are presented in Table 2.
Table 2.
The parameters of the exterior window.
2.3.2. Internal Heat Source
The setting of the internal heat source is primarily based on the “Public Building Energy Saving Design Standard” (DB37/5155-2019) [35] and the “Near-Zero Energy Building Technical Standard” (GB/T 51350-2019) [36]. According to the requirements, the equipment load is 13 W/m2, the lighting load is 11 W/m2, and the office density is 4 m2/p.
2.3.3. Air Conditioning System
Air conditioning systems select central air conditioning under ideal conditions. The temperature, air volume, and fresh air rate for cooling and heating modes are determined in accordance with the specifications outlined in GB50343-2012 [37] Code for Office Building Design. The parameters are presented in Table 3. The remaining operating parameters are automatically configured by the air conditioner’s default settings.
Table 3.
Parameters of the air conditioning system.
2.3.4. Schedule
The building running-time schedule should comply with the requirements specified in DB37/5155-2019 Standard Office building. The objective is to ensure that all settings are in compliance with applicable regulations and enable energy-efficient and comfortable building operation. The heating season spans from 15 November to 15 March of the subsequent year, while the cooling season extends from 1 May to 31 October; the air conditioning system is programmed to activate between the hours of 8 a.m. and 6 p.m.; and the lighting plans, equipment usage plans, personnel occupancy rates, etc., are established in accordance with the standards applicable to office buildings.
2.3.5. Meteorological Data
Obtain hourly meteorological data for the entire year from the local meteorological bureau, including temperature, humidity, wind speed and direction, precipitation, solar radiation levels, and atmospheric pressure.
2.4. Energy Consumption Simulation Analysis
Combining weather data, time schedules, and energy system settings, the OpenStudio engine starts simulating the building model’s energy consumption throughout the year [38]. The method offers comprehensive energy consumption results, encompassing heating, cooling, lighting, and equipment energy usage. Finally, comprehensive energy consumption data is obtained, encompassing heating, cooling, lighting and equipment usage. As can be seen from Figure 1, the cooling energy consumption reaches its peak during the summer, while the heating energy consumption reaches its maximum in winter. Both refrigeration and heating energy consumption are relatively lower during spring and autumn. In addition, the changes in equipment and lighting energy consumption exhibit a smoother trend.
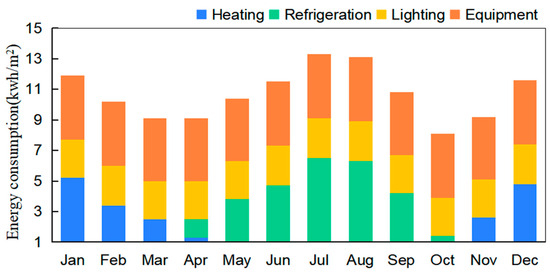
Figure 1.
Annual simulation results of office-building energy consumption.
2.5. Optimization Strategy of Energy Consumption
Energy consumption optimization is achieved through the Wallacei plugin on the Grasshopper platform. This plugin is an evolutionary engine based on NSGA-II (the non-dominated sorting genetic algorithm II), which can simulate and solve multi-objective optimization problems through the genetic algorithm [39,40]. Based on the building equivalent model established on the Grasshopper platform, this paper inputs optimization objectives and decision variables into the Wallacei plug-in, and sets optimization algorithm parameters such as iteration times, population size, and crossover probability to obtain the optimal building solution.
Several key factors impact building energy consumption: due to the system’s focus on the actual building, the optimization performance of the envelope structure is limited and the economic benefit is unsatisfactory. The deployment of internal heat sources and schedules should be tailored to the specific functions of each room, which can be a time-consuming and labor-intensive process. The meteorological conditions are exogenous variables beyond control, thus rendering their optimization unattainable. The simulation results indicate that the air conditioning system contributes to approximately 40% of the overall energy consumption during both summer and winter seasons. The air conditioning system exhibits significant potential for optimization and energy conservation, with the added advantage of manual adjustment capabilities. Consequently, this study aims to optimize the energy consumption of the air conditioning system and conducts experimental analysis on its effectiveness during the initial two weeks of July.
The literature [41,42,43,44] demonstrates that the factors influencing the air conditioning system primarily are air-supply temperature, temperature difference between the chilled water supply and return, outlet temperature of chilled water, and cooling water-inlet temperature.
(1) Air supply temperature: it is an important parameter of the fan. By adjusting the air supply temperature, the indoor temperature control and comfort requirements are balanced. The energy consumption of the air conditioning system can be reduced by increasing the air supply temperature, while decreasing the air supply temperature can enhance the cooling effect at the expense of increased energy consumption.
(2) Temperature difference between the water supply and the return water: it is an important parameter in the chiller. The efficiency of the chiller can be enhanced and energy consumption reduced by increasing the temperature difference between the water supply and the return water.
(3) Outlet temperature of chilled water and cooling water-inlet temperature: they are the key control parameters of the chiller. The outlet temperature and return-water temperature are properly adjusted according to the actual demand, in order to achieve optimal operation and load matching of the chiller, thereby enhancing system efficiency and energy savings.
Taking a certain day in the first two weeks of July as an example, the above four parameters are inputted into the genetic algorithm tool Wallacei as decision variables, while the remaining parameters remain unchanged. The optimal operation strategy of air conditioning and the optimal energy consumption of the building are taken as the goal to output the optimization results within the range of maintaining the comfortable temperature of a human body. The optimized operational strategy of the air conditioning system is illustrated in Figure 2. Conversely, Figure 3 depicts the non-optimized operational strategy of the air conditioning system.
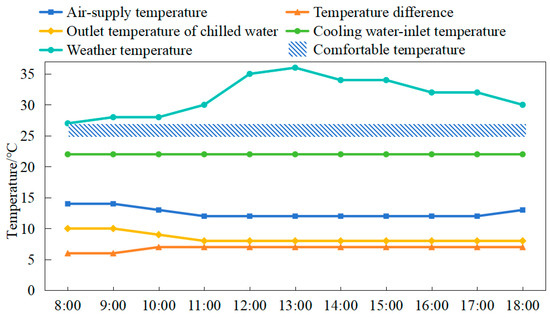
Figure 2.
Optimal operation strategy of air conditioning system.
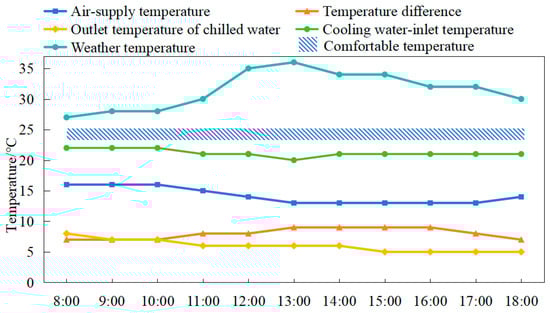
Figure 3.
Unoptimized air conditioning-system operation strategy.
The outdoor temperature rises rapidly around noon, as depicted in Figure 2. Consequently, there is an increase in the cooling load demand of the system and a greater need for cooling capacity from the air conditioner refrigerator. After optimization, the cooling water-inlet temperature of the air conditioning system remains unchanged at 22 °C, while the outlet temperature of the chilled water decreases. Additionally, there is a reduction in the air-supply temperature adjustment and an increase in the temperature difference between the chilled-water supply and the return. The system keeps the room temperature within the comfortable temperature range of a human body in a relatively gentle change way, and achieves the purpose of reducing energy consumption. Compared with the unoptimized operation strategy of the air conditioning system in Figure 3, when the cooling load demand increases, the system chooses to rapidly reduce the air supply temperature, increase the temperature difference between the chilled-water supply and the return, reduce the outlet temperature of the chilled water, and reduce the cooling water-inlet temperature. As a result, the indoor temperature drops rapidly. However, the air conditioning system consumes a significant amount of energy and fails to maintain the room temperature within the comfortable range for human occupancy.
During the operational period of the air conditioning system, a two-week simulation was conducted on the office building. Based on the findings presented in Table 4, it can be observed that while the optimized air conditioning system had minimal impact on lighting and the equipment’s energy consumption, there was a significant reduction of approximately 10% in refrigeration energy consumption. This outcome serves as evidence supporting the theoretical feasibility of the optimization scheme.
Table 4.
Simulation results before and after optimization in the first two weeks of July.
3. Design of Acquisition System
In order to verify the reliability of energy-consumption simulation results, a collection system is designed to collect energy consumption in the office building. The acquisition system data are compared with the simulation results to ensure that the model truly reflects the building energy consumption and provides data guarantee for subsequent engineering practice.
The hardware and software design of the acquisition system is based on the three-layer architecture of the Internet of Things, enabling the fulfillment of requirements such as data collection, analysis, transmission, and real-time monitoring of energy consumption data [45]. The overall architecture of the acquisition system is illustrated in Figure 4.
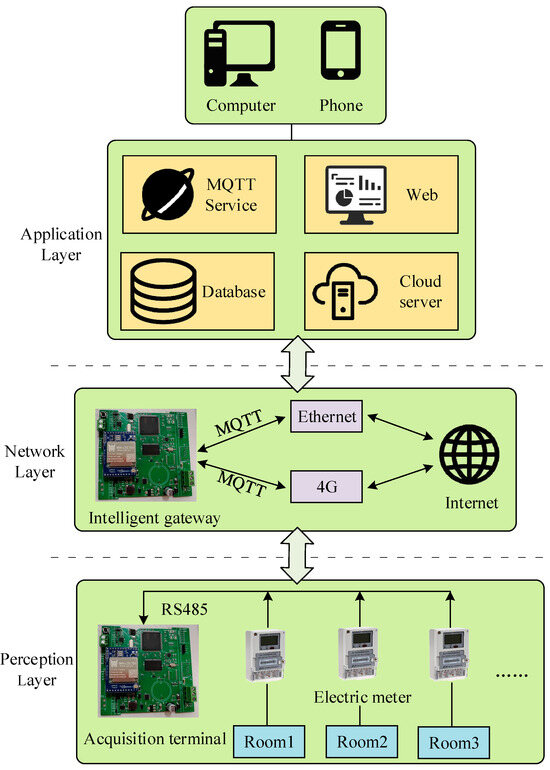
Figure 4.
The overall architecture of the system.
3.1. Perception Layer
The perception layer consists of the acquisition terminal and the electricity meter in each room, which is responsible for collecting front-end energy consumption data. According to the serial link protocol, the acquisition terminal collects the data of multiple meters through the RS485 communication mode.
3.2. Network Layer
The network layer consists of an intelligent gateway and a communication network, which are responsible for the processing and transmission of information. The intelligent gateway processes and packages the collected data. Then the data are uploaded to the cloud platform through the Ethernet or 4G module through the Message Queuing Telemetry Transport (MQTT) protocol for subsequent data analysis [46,47].
3.3. Application Layer
The application layer is primarily accountable for the processing of uploaded data, encompassing tasks such as data storage, analysis, monitoring, and control. By establishing a database, MQTT service, web-based visual interface and cloud servers, users can achieve real-time monitoring and management of energy consumption data through computers and phones [48].
3.4. Hardware Design
The acquisition terminal utilizes the STM32F407ZGT6 as its core processor for efficient execution of complex computational tasks. The acquisition terminal controls RS485 communication with the meter through the serial port: the signal indicator is connected via General Purpose Input Output (GPIO) to ensure smooth communication with the meter; the serial port is utilized to securely store parsed meter data in external FLASH memory; the Ethernet or 4G module can be connected through the serial port, enabling MQTT protocol for cloud-server communication; a debugging module can be connected via GPIO to facilitate system troubleshooting; and the power module converts an external DC power supply into a suitable 5V operating voltage for system operation. The hardware design of the acquisition system is shown in Figure 5.
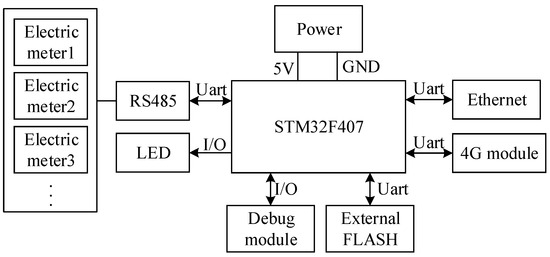
Figure 5.
Hardware design of acquisition system.
3.5. Software Design
This design incorporates the FreeRTOS real-time operating system. The system employs RTOS multithreading for concurrent task processing, addressing modularity challenges while maintaining system real-time responsiveness [49]. After the initialization of hardware, the system initiates four tasks, which include an OTA (over-the-air technology) upgrade task, a data acquisition task, a data parsing and processing task, and a data upload task.
(1) The OTA-upgrade task is responsible for monitoring the status of firmware upgrades and controlling the process of updating firmware.
(2) The data-acquisition task is responsible for facilitating communication between the acquisition terminal and the meter. The meter data are collected at regular intervals of 15 min, and subsequently stored in a queue via the serial port.
(3) The data-parsing and -processing task is responsible for parsing and processing the received data, and packaging it in the specified format.
(4) The data-upload task ensures normal network communication and uploads packaged data to the cloud platform.
The software architecture of the acquisition system is illustrated in Figure 6.
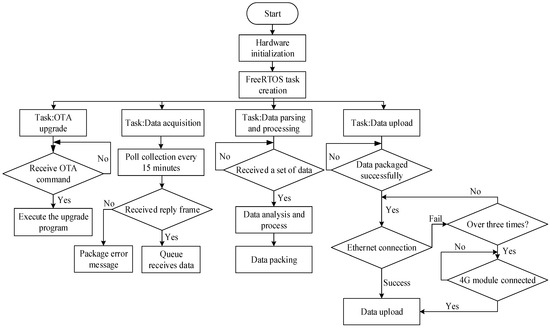
Figure 6.
Software design of acquisition system.
3.6. Comparison of Energy Consumption Data
The data acquisition system records the energy consumption of the office building during the first two weeks of July and compares it with simulation results. As depicted in Figure 7, the simulation results closely align with the actual data, thereby validating the accuracy of the simulation system’s output. However, there is a maximum error margin of approximately 10% in the simulation results, indicating some instability within the system and preventing confirmation of the authenticity of the energy consumption-optimization scheme.
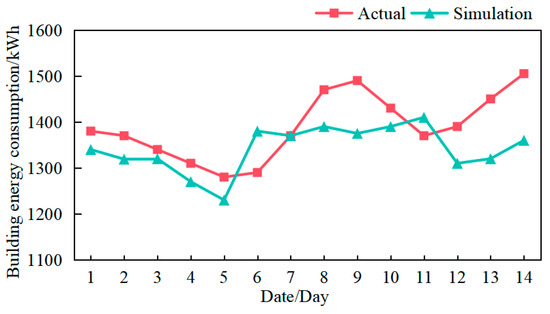
Figure 7.
Comparison of energy consumption data.
In addition, according to the line chart of the actual energy consumption results in Figure 7, it can be seen that the daily building energy consumption varies greatly. Consequently, the factors that affect building energy consumption are complicated. A single optimization of energy consumption cannot prove that it has a substantial optimization of building energy consumption, rather than other factors.
4. Energy Consumption-Prediction Algorithm
In order to verify the energy consumption-optimization scheme and its practical engineering application, this paper proposes an energy consumption prediction method based on GJO-LSTM. The algorithm is integrated with the acquisition system to achieve precise forecasting of energy consumption for the upcoming week [50,51].
The GJO-LSTM-combination prediction model is constructed in this design, with the utilization of the GJO algorithm for automatic optimization of the LSTM network. So the network has the advantages of improving performance, accelerating training, and enhancing generalization ability and robustness [52]. The LSTM model can leverage historical energy consumption data to provide accurate predictions, while the GJO algorithm optimizes and adjusts these predictions. Extensive error evaluation standards and practical applications demonstrate that the combined GJO-LSTM model exhibits superior prediction accuracy and enhanced stability, compared to the standalone LSTM model.
4.1. LSTM Neural Network
The LSTM, a type of recurrent neural network (RNN), consists of three essential gating units: the Forget Gate, Input Gate, and Output Gate [53,54]. In comparison to traditional RNNs, LSTM effectively addresses the issues of gradient vanishing and exploding by incorporating memory units and gating mechanisms. Moreover, it excels in capturing long-term dependencies within time-series data [55,56,57]. The LSTM structure is illustrated in Figure 8. The input component comprises the status information from the previous time step , the output information , and the input value of the current time step . The output component consists of the current status information and output value . Here, represents the output of the forget gate, denotes the output of the input gate, signifies the output of the output gate, while corresponds to the output of an input node. Additionally, refers to a sigmoid function.
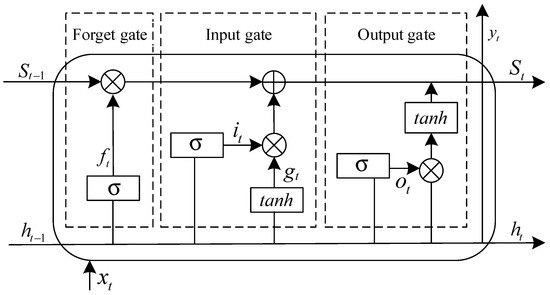
Figure 8.
LSTM structure.
4.2. Golden Jackal Optimization
The golden jackal algorithm is inspired by the foraging behavior of golden jackals in their natural environment, and it aims to find the optimal solution through simulating social interaction and information sharing among individuals [58,59]. The golden jackal algorithm consists of two main stages: hunting for prey and rounding up prey.
4.2.1. Hunt for Prey
The search is led by the male jackals, followed by the female jackals, and the positions of the male and female jackals are as follows.
In the formula, and , respectively, represent the position of male and female jackals in relation to the updated prey; and represent the positions of male and female jackals after iterations; represents the position vector of the prey; and represents the energy of the prey when avoiding the jackal. The calculation formulas are as follows:
In the formula, represents the decline in prey escape energy; represents a randomly generated number ranging from 0 to 1; is a constant value of 1.5; indicates the current number of iterations; and indicates the maximum number of iterations.
represents the escape trajectory of the prey. The calculation formula is as follows:
In the formula, is the Levy flight function, where is the vector dimension.
The prey location was determined based on the coordinates and of both male and female jackals. The calculation formula is as follows:
The variable denotes the prey’s position after iterations.
4.2.2. Round Up Prey
The escape energy E of the prey gradually diminishes as it is pursued by jackals. After the prey is surrounded by golden jackals, the male and female jackals will round up the prey together. The corresponding mathematical models are as follows:
The meaning of each variable in the formula remains consistent with that in Formula (1), and the updated position of the prey is obtained through calculations.
4.3. GJO-LSTM Prediction Model
The learning rate L, packet loss rate D, the number of hidden layer neurons H and the number of iterations K of the LSTM model can directly affect the results of energy consumption prediction. In order to find the optimal parameter combination, the golden jackal algorithm is used to automatically optimize these four parameters. The specific procedures are as follows (Figure 9):
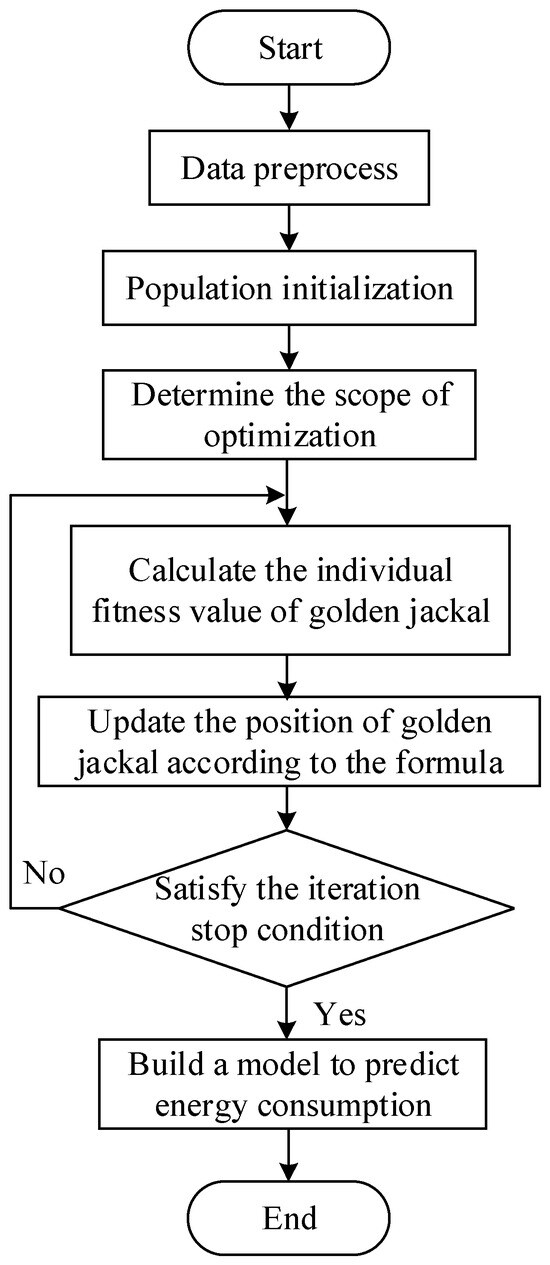
Figure 9.
The specific process of GJO-LSTM prediction model.
(1) Preprocessing the historical data set, including dividing the training set and the test set, screening the data outliers and normalizing the data set;
(2) Initializing the initial population by randomly generating a certain number of golden jackal individuals;
(3) The prediction model is constructed and the optimization range of parameters L, D, H and K is determined;
(4) The fitness value of each individual golden jackal is computed in order to determine the spatial distribution of male and female jackals;
(5) Through the simulation of social interaction and information sharing among golden jackals, individuals update their own positions and solutions by exploring and using the information of the current best individuals;
(6) The optimal population location is determined based on the fitness value, and whether the results meet the iteration stop condition is checked;
(7) The trained model is used to predict energy consumption.
Through the interaction and information sharing among individuals, the golden jackal algorithm enhances the network’s ability to capture features and patterns in the dataset, expedites the network training process, and improves its generalization capability. In addition, the golden jackal algorithm adjusts the interaction between individuals according to the complexity of the problem and the characteristics of the data through an adaptive optimization strategy to help the network better adapt to the input data and noise.
4.4. Energy Consumption-Prediction Model Test
The energy consumption-prediction model selected the building energy consumption data collected from 1 June 2023 to 30 June 2023 as the sample, with a sampling period of 15 min, totaling 2880 sets of data. This dataset includes date type, weather factors, and energy consumption. For training purposes, the model utilized 672 sets of data from the previous week as test sets, while using the remaining data as training sets. The GJO-LSTM model was trained for a maximum of 200 iterations with an initial learning rate set at 0.01. After completing 150 training sessions, the learning rate was reduced by multiplying it by a factor of 0.1.
The energy consumption of the GJO-LSTM-model test sets, both actual and predicted, along with their relative error, are depicted in Figure 10 and Figure 11, respectively. It can be observed from Figure 10 that the trend in the real energy consumption aligns closely with the predicted values. As illustrated in Figure 11, the maximum relative error of the prediction model is 5%, while all other relative errors remain within a range of approximately 3%. This substantiates that this model exhibits high precision in predicting energy consumption.
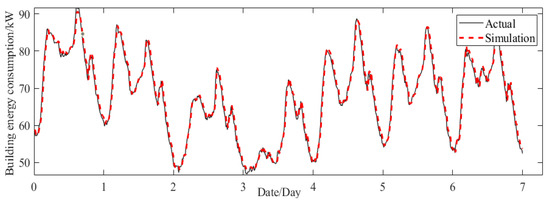
Figure 10.
Comparison of actual and predicted energy consumption of the test set.
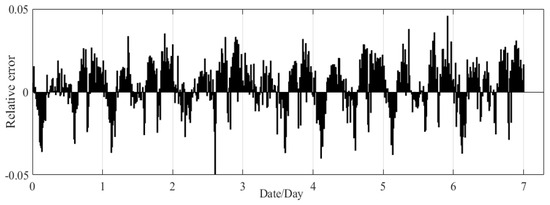
Figure 11.
Relative error.
In order to further verify the performance of the GJO-LSTM combined prediction model, this paper selected a variety of algorithms for comparative experiments to predict the energy consumption of the same day in the future [60,61]. As shown in Figure 12, compared with other algorithms, the predicted energy consumption of GJO-LSTM has a higher degree of fitting at points with large fluctuations, and the prediction curve is significantly closer to the true value, with higher prediction accuracy.
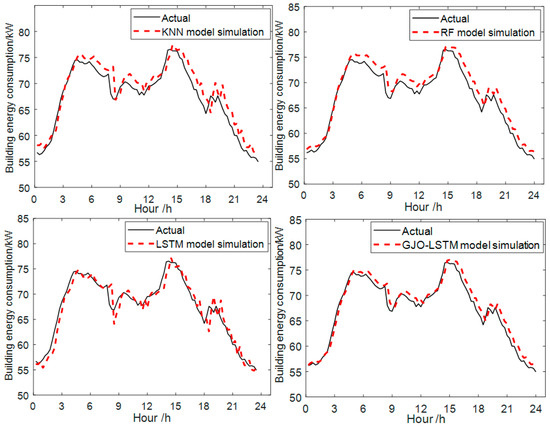
Figure 12.
Comparative experimental results.
The prediction accuracy of different models was evaluated using two error evaluation criteria, namely root mean square error (RMSE) and mean absolute error (MAE) [62]. The results of the error comparison are presented in Table 5. As can be seen from Table 5, the error parameters of both LSTM and GJO-LSTM are smaller than those of the KNN model and RF model in error evaluation indexes, and the combined GJO-LSTM model has higher prediction accuracy than the single LSTM model.
Table 5.
Comparison results of model errors.
5. Energy Consumption-Prediction Algorithm
5.1. Short-Term Energy Consumption Forecast
The energy consumption data of the office building in July was selected as the experimental subject. The energy consumption forecast for the first two weeks of July is shown in Figure 13. The predicted energy-consumption values align closely with the actual measurements, exhibiting an accuracy rate exceeding 97%. This substantiates that the prediction method has achieved precise forecasting of energy consumption.
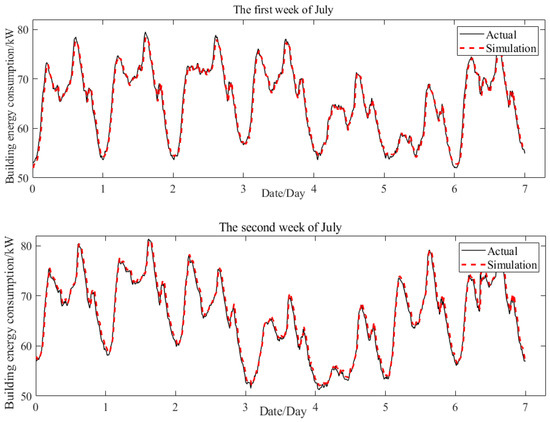
Figure 13.
Comparison of actual and predicted energy consumption in the first two weeks of July.
5.2. Optimization Scheme Verification
In the last two weeks of July, the air conditioner was adjusted according to the optimal operation strategy of the air conditioning system. This is due to the fact that the energy consumption forecast for the next two weeks still uses an unoptimized air conditioning system, and the prediction accuracy has reached 97%. Therefore, the predicted energy consumption is considered as the unoptimized-building energy consumption, and the actual energy consumption is regarded as the optimized-building energy consumption. At this point, the predicted energy-consumption value is compared with the real value to prove that the reduction in energy consumption is caused by the optimization strategy and not by other external factors.
As can be seen from Figure 14, the air-conditioning operation stage reveals that the optimized building exhibits lower real-energy consumption compared to the non-optimized building. Notably, this reduction effect becomes more pronounced when the building’s energy consumption is high. Specifically, the optimized building achieves an hourly energy consumption saving ranging from 6% to 9%, with an average daily energy-saving rate of up to 8%.
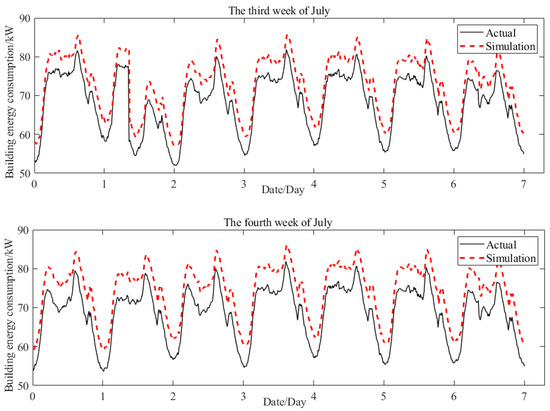
Figure 14.
Comparison of actual and predicted energy consumption in the last two weeks of July.
The practice proves that the optimization scheme of the air conditioning system has achieved remarkable energy-saving effect in many practical application scenarios. Furthermore, the data-driven GJO-LSTM energy consumption-prediction model validates the fact that the reduction in building’s energy consumption is attributed to the optimized air conditioning system rather than external factors.
6. Conclusions
In summary, this paper proposes a data-driven GJO-LSTM system for short-term energy consumption prediction and optimization, consisting of three components: energy-consumption optimization, data acquisition, and energy-consumption prediction. It has been proven through practice that the feasibility of energy-consumption optimization schemes has been verified through the collection of system data and energy consumption-prediction methods. In addition, it is found that the GJO-LSTM combined energy consumption-prediction model demonstrates superior prediction accuracy and enhanced stability, compared to the single LSTM model.
The whole system provides scientific basis and support for energy management and optimization. However, the system still has some limitations:
(1) In the field of modeling and simulation, the presence of incomplete or inaccurate input data directly impacts the precision of simulation output results and significantly influences the initial stage of optimization decision-making.
(2) The GJO-LSTM combination prediction model has high requirements for data quality and requires data cleaning and preprocessing to ensure accuracy and consistency.
(3) Compared to a single LSTM model, the GJO-LSTM model requires more computing resources and time to train and optimize the model.
(4) The optimal operating strategy for the air conditioning system in the coming week will be implemented on-site after the server-side training is completed. At present, the air conditioning system still needs to be manually modified.
Therefore, the future work of this paper will primarily focus on four key aspects. Firstly, we aim to enhance the authenticity of simulation results and improve the stability of the simulation system by strengthening the architectural equivalent model in detail. Secondly, we intend to employ automatic tools and algorithms for data cleaning and preprocessing, thereby reducing early data processing time. Additionally, transfer learning techniques will be utilized to leverage knowledge from related fields or previous forecasting tasks and apply it to building energy-consumption forecasting. This approach allows us to expedite the training and optimization process using existing models and data, while improving prediction performance. Finally, we will develop a remote control system that facilitates convenient user operation and modification of targets, after formulating an optimization strategy.
Author Contributions
Conceptualization, Y.Y. and Y.L.; methodology, Y.Y. and P.X.; software, Y.C. and H.T.; validation, Y.Y., Y.L. and P.X.; formal analysis, Y.C.; investigation, H.T.; resources, Y.L. All authors have read and agreed to the published version of the manuscript.
Funding
This work is supported by the National Natural Science Foundation of China under Grant 62271271.
Data Availability Statement
All data that support the findings of this study are included within this article. Other related data associated with this study could be made available upon request.
Conflicts of Interest
The authors declare no conflicts of interest.
References
- Hu, S.; Zhang, Y.; Yang, Z.; Yan, D.; Jiang, Y. Challenges and opportunities for carbon neutrality in China’s building sector—Modelling and data. Build. Simul. 2022, 15, 1899–1921. [Google Scholar] [CrossRef]
- Pu, X.; Yao, J.; Zheng, R. Forecast of energy consumption and carbon emissions in China’s building sector to 2060. Energies 2022, 15, 4950. [Google Scholar] [CrossRef]
- Xu, Z. Towards carbon neutrality in China: A systematic identification of China’s sustainable land-use pathways across multiple scales. Sustain. Prod. Consum. 2024, 44, 167–178. [Google Scholar] [CrossRef]
- Dong, H.; Zhang, L. Transition towards carbon neutrality: Forecasting Hong Kong’s buildings carbon footprint by 2050 using a machine learning approach. Sustain. Prod. Consum. 2023, 35, 633–642. [Google Scholar] [CrossRef]
- Alimohamadi, R.; Jahangir, M.H. Multi-Objective optimization of energy consumption pattern in order to provide thermal comfort and reduce costs in a residential building. Energy Convers. Manag. 2024, 305, 118214. [Google Scholar] [CrossRef]
- Maleki, A.; Dehghan, N. Optimization of energy consumption and daylight performance in residential building regarding windows design in hot and dry climate of Isfahan. Sci. Technol. Built Environ. 2020, 27, 351–366. [Google Scholar] [CrossRef]
- Batres, R.; Dadras, Y.; Mostafazadeh, F.; Kavgic, M. MEVO: A Metamodel-Based Evolutionary Optimizer for Building Energy Optimization. Energies 2023, 16, 7026. [Google Scholar] [CrossRef]
- Satrio, P.; Mahlia, T.M.I.; Giannetti, N.; Saito, K. Optimization of HVAC system energy consumption in a building using artificial neural network and multi-objective genetic algorithm. Sustain. Energy Technol. Assess. 2019, 35, 48–57. [Google Scholar]
- Li, J.; Wang, M.; Fang, P.; Zhao, Q.; Zheng, X.; Gao, H. Modeling and optimization of a passive building HVAC system based on improved PSO and HJ Algorithm. Energy Rep. 2024, 11, 2415–2438. [Google Scholar] [CrossRef]
- Parvin, K.; Lipu, M.H.; Hannan, M.A.; Abdullah, M.A.; Jern, K.P.; Begum, R.A.; Mansur, M.; Muttaqi, K.M.; Mahlia, T.I.; Dong, Z.Y. Intelligent controllers and optimization algorithms for building energy management towards achieving sustainable development: Challenges and prospects. IEEE Access 2021, 9, 41577–41602. [Google Scholar] [CrossRef]
- Wang, H.; Liao, X.; Ji, X.; Gong, S.; Meng, X.; Wang, J. Intelligent optimization algorithm-based electricity pricing strategy for smart building clusters. Front. Energy Res. 2023, 11, 1265906. [Google Scholar] [CrossRef]
- Chen, Y.; Ren, Z.; Peng, Z.; Yang, J.; Chen, Z.; Deng, Z. Impacts of climate change and building energy efficiency improvement on city-scale building energy consumption. J. Build. Eng. 2023, 78, 107646. [Google Scholar] [CrossRef]
- Feng, Z.; An, J.; Han, M.; Ji, X.; Zhang, X.; Wang, C.; Liu, X.; Kang, L. Office building energy consumption forecast: Adaptive long short term memory networks driven by improved beluga whale optimization algorithm. J. Build. Eng. 2024, 91, 109612. [Google Scholar] [CrossRef]
- Luo, X.; Zhang, Y.; Lu, J.; Ge, J. Multi-objective optimization of the office park building envelope with the goal of nearly zero energy consumption. J. Build. Eng. 2024, 84, 108552. [Google Scholar] [CrossRef]
- Luo, Z.; Lu, Y.; Cang, Y.; Yang, L. Study on dual-objective optimization method of life cycle energy consumption and economy of office building based on HypE genetic algorithm. Energy Build. 2022, 256, 111749. [Google Scholar] [CrossRef]
- Chen, X.; Cao, B.; Pouramini, S. Energy cost and consumption reduction of an office building by Chaotic Satin Bowerbird Optimization Algorithm with model predictive control and artificial neural network: A. case study. Energy 2023, 270, 126874. [Google Scholar] [CrossRef]
- Ascione, F.; Bianco, N.; De Stasio, C.; Mauro, G.M.; Vanoli, G.P. Simulation-based model predictive control by the multi-objective optimization of building energy performance and thermal comfort. Energy Build. 2016, 111, 131–144. [Google Scholar] [CrossRef]
- Liu, Y.; Li, T.; Xu, W.; Wang, Q.; Huang, H.; He, B.J. Building information modelling-enabled multi-objective optimization for energy consumption parametric analysis in green buildings design using hybrid machine learning algorithms. Energy Build. 2023, 300, 113665. [Google Scholar] [CrossRef]
- Li, X.X.; Huang, K.L.; Feng, G.H.; Li, W.Y.; Wei, J.X. Night ventilation scheme optimization for an Ultra-low energy consumption building in Shenyang, China. Energy Rep. 2022, 8, 8426–8436. [Google Scholar] [CrossRef]
- Verma, R.; Kumar, S.; Rakshit, D.; Premachandran, B. Design and optimization of energy consumption for a low-rise building with seasonal variations under composite climate of India. J. Sol. Energy Eng. 2023, 145, 011006. [Google Scholar] [CrossRef]
- He, L.; Wang, W. Design optimization of public building envelope based on multi-objective quantum genetic algorithm. J. Build. Eng. 2024, 145, 109714. [Google Scholar] [CrossRef]
- Ilbeigi, M.; Ghomeishi, M.; Dehghanbanadaki, A. Prediction and optimization of energy consumption in an office building using artificial neural network and a genetic algorithm. Sustain. Cities Soc. 2020, 61, 102325. [Google Scholar] [CrossRef]
- Liu, M.; Que, Y.; Yang, N.; Yan, C.; Liu, Q. Research on Multi-Objective Optimization Design of University Student Center in China Based on Low Energy Consumption and Thermal Comfort. Energies 2024, 17, 2082. [Google Scholar] [CrossRef]
- Ramegowda, D.; Lin, M. Energy efficient mixed task handling on real-time embedded systems using FreeRTOS. J. Syst. Archit. 2022, 131, 102708. [Google Scholar] [CrossRef]
- Morcillo-Jimenez, R.; Mesa, J.; Gómez-Romero, J.; Vila, M.A.; Martin-Bautista, M.J. Deep learning for prediction of energy consumption: An applied use case in an office building. Appl. Intell. 2024, 54, 5813–5825. [Google Scholar] [CrossRef]
- Hanafi, A.V.; Ghaffari, A.; Rezaei, H.; Valipour, A.; Arasteh, B. Intrusion detection in Internet of things using improved binary golden jackal optimization algorithm and LSTM. Clust. Comput. 2024, 27, 2673–2690. [Google Scholar] [CrossRef]
- Ma, R.; Yuan, Y. Remaining useful life prediction framework of equipment based on improved golden jackal algorithm assisted-LSTM. AIP Adv. 2024, 14, 015102. [Google Scholar] [CrossRef]
- Zhang, C.; Luo, Z.; Rezgui, Y.; Zhao, T. Enhancing building energy consumption prediction introducing novel occupant behavior models with sparrow search optimization and attention mechanisms: A case study for forty-five buildings in a university community. Energy 2024, 294, 130896. [Google Scholar] [CrossRef]
- Amasyali, K.; El-Gohary, N. Hybrid approach for energy consumption prediction: Coupling data-driven and physical approaches. Energy Build. 2022, 259, 111758. [Google Scholar] [CrossRef]
- Aguilar-Carrasco, M.T.; Acosta, I.; Domínguez-Amarillo, S. CircaLight, a new circadian light assessment tool for Grasshopper environment: Development and reliability testing. J. Build. Eng. 2023, 71, 106527. [Google Scholar] [CrossRef]
- Zhang, C.; Ma, L.; Han, X.; Zhao, T. Reconstituted data-driven air conditioning energy consumption prediction system employing occupant-orientated probability model as input and swarm intelligence optimization algorithms. Energy 2024, 288, 129799. [Google Scholar] [CrossRef]
- Xu, F.; Liu, Q. Building energy consumption optimization method based on convolutional neural network and BIM. Alex. Eng. J. 2023, 77, 407–417. [Google Scholar] [CrossRef]
- Zhao, S.; Hai, G.; Zhang, X. An Analysis of the Influence of Cool Roof Thermal Parameters on Building Energy Consumption Based on Orthogonal Design. Buildings 2023, 14, 28. [Google Scholar] [CrossRef]
- Feng, J.; Luo, X.; Gao, M.; Abbas, A.; Xu, Y.P.; Pouramini, S. Minimization of energy consumption by building shape optimization using an improved Manta-Ray Foraging Optimization algorithm. Energy Rep. 2021, 7, 1068–1078. [Google Scholar] [CrossRef]
- DB37/5155-2019; Public Building Energy Saving Design Standard. Shandong Provincial Institute of Construction and Development Research: Jinan, China, 2019.
- GB/T 51350-2019; Near-Zero Energy Building Technical Standard. Ministry of Housing and Urban Rural Development of the People’s Republic of China: Beijing, China, 2019.
- GB50343-2012; Technical Code for Protection of Building Electronic Information System against Lightning. Ministry of Housing and Urban Rural Development of the People’s Republic of China: Beijing, China, 2012.
- Theresa Innocent, L.; Ramalingam, V. Comparison of a real-time building with brick and exfoliated vermiculite using OpenStudio modeling for Indian climatic zones. Energy Sources Part A Recovery Util. Environ. Eff. 2019, 41, 2334–2345. [Google Scholar] [CrossRef]
- Bai, W.; Wu, Y.; He, Y.; Wang, L.; Qiu, Z.; Ye, Y. Optimizing Built Environment in Urban Negative Spaces Using Parametric Methods—Research on a High-Density City in China. Buildings 2024, 14, 1081. [Google Scholar] [CrossRef]
- Valiyappurakkal, V.K.; Shabarise, Y.; Natawadkar, K.; Misra, K. A methodology to assess the constructibility of free-form buildings using building and surface performance indicators: Application to a case study. Energy Build. 2022, 270, 112303. [Google Scholar] [CrossRef]
- Chen, J.; Sun, Y. A new multiplexed optimization with enhanced performance for complex air conditioning systems. Energy Build. 2017, 156, 85–95. [Google Scholar] [CrossRef]
- Yang, X.; Liu, X.; Sun, G.; Tian, Y. Energy-saving optimization control of central air-conditioning system based on improved particle swarm algorithm. J. Electr. Power Sci. Technol. 2023, 38, 65–75, 93. [Google Scholar]
- Li, J.; Wang, M. Application of improved particle swarm optimization in the energy saving strategy for a central air-conditioning system. IET Gener. Transm. Distrib. 2023, 17, 3512–3523. [Google Scholar] [CrossRef]
- Bamdad, K.; Mohammadzadeh, N.; Cholette, M.; Perera, S. Model predictive control for energy optimization of hvac systems using energyplus and aco algorithm. Buildings 2023, 13, 3084. [Google Scholar] [CrossRef]
- Weqar, M.; Mehfuz, S.; Gupta, D.; Urooj, S. Adaptive Switching Based Data-Communication Model for Internet of Healthcare Things Networks. IEEE Access 2024, 12, 11530–11548. [Google Scholar] [CrossRef]
- Hintaw, A.J.; Manickam, S.; Aboalmaaly, M.F.; Karuppayah, S. MQTT vulnerabilities, attack vectors and solutions in the internet of things (IoT). IETE J. Res. 2023, 69, 3368–3397. [Google Scholar] [CrossRef]
- Alshammari, H.H. The internet of things healthcare monitoring system based on MQTT protocol. Alex. Eng. J. 2023, 69, 275–287. [Google Scholar] [CrossRef]
- Liu, X.; Zhang, T.; Hu, N.; Zhang, P.; Zhang, Y. The method of Internet of Things access and network communication based on MQTT. Comput. Commun. 2020, 153, 169–176. [Google Scholar] [CrossRef]
- Oliveira, G.; Lima, G. Scheduling and energy savings for small scale embedded FreeRTOS-based real-time systems. Des. Autom. Embed. Syst. 2023, 27, 3–29. [Google Scholar] [CrossRef]
- Cao, W.; Yu, J.; Chao, M.; Wang, J.; Yang, S.; Zhou, M.; Wang, M. Short-term energy consumption prediction method for educational buildings based on model integration. Energy 2023, 283, 128580. [Google Scholar] [CrossRef]
- Zhang, J.; Yuan, C.; Yang, J.; Zhao, L. Research on Energy Consumption Prediction Models for High-Rise Hotels in Guangzhou, Based on Different Machine Learning Algorithms. Buildings 2024, 14, 356. [Google Scholar] [CrossRef]
- Wang, Z.; Li, Y.; Liang, F.; Xu, H.; Shi, X. Ethylene production prediction using Attention-LSTM model based on Golden jackal optimization. In Proceedings of the 2023 4th International Conference on Machine Learning and Computer Application, Hangzhou, China, 27–29 October 2023; pp. 239–244. [Google Scholar]
- Zhou, X.; Lin, W.; Kumar, R.; Cui, P.; Ma, Z. A data-driven strategy using long short term memory models and reinforcement learning to predict building electricity consumption. Appl. Energy 2022, 306, 118078. [Google Scholar] [CrossRef]
- Mishra, A.; Lone, H.R.; Mishra, A. DECODE: Data-driven energy consumption prediction leveraging historical data and environmental factors in buildings. Energy Build. 2024, 307, 113950. [Google Scholar] [CrossRef]
- Somu, N.; MR, G.R.; Ramamritham, K. A hybrid model for building energy consumption forecasting using long short term memory networks. Appl. Energy 2020, 261, 114131. [Google Scholar] [CrossRef]
- Fekri, M.N.; Patel, H.; Grolinger, K.; Sharma, V. Deep learning for load forecasting with smart meter data: Online Adaptive Recurrent Neural Network. Appl. Energy 2021, 282, 116177. [Google Scholar] [CrossRef]
- Ruan, Y.; Wang, G.; Meng, H.; Qian, F. A hybrid model for power consumption forecasting using VMD-based the long short-term memory neural network. Front. Energy Res. 2022, 9, 772508. [Google Scholar] [CrossRef]
- Bai, J.; Khatir, S.; Abualigah, L.; Wahab, M.A. Ameliorated Golden jackal optimization (AGJO) with enhanced movement and multi-angle position updating strategy for solving engineering problems. Adv. Eng. Softw. 2024, 194, 103665. [Google Scholar] [CrossRef]
- Askr, H.; Abdel-Salam, M.; Hassanien, A.E. Copula entropy-based golden jackal optimization algorithm for high-dimensional feature selection problems. Expert Syst. Appl. 2024, 238, 121582. [Google Scholar] [CrossRef]
- Zhang, R.; Chen, Y.; Li, Z.; Jiang, T.; Li, X. Two-stage robust operation of electricity-gas-heat integrated multi-energy microgrids considering heterogeneous uncertainties. Appl. Energy 2024, 371, 123690. [Google Scholar] [CrossRef]
- Shang, Y.; Li, S. FedPT-V2G: Security enhanced federated transformer learning for real-time V2G dispatch with non-IID data. Appl. Energy 2024, 358, 122626. [Google Scholar] [CrossRef]
- Jiang, Y.; Ren, Z.; Li, W. Committed carbon emission operation region for integrated energy systems: Concepts and analyses. IEEE Trans. Sustain. Energy 2023, 15, 1194–1209. [Google Scholar] [CrossRef]
Disclaimer/Publisher’s Note: The statements, opinions and data contained in all publications are solely those of the individual author(s) and contributor(s) and not of MDPI and/or the editor(s). MDPI and/or the editor(s) disclaim responsibility for any injury to people or property resulting from any ideas, methods, instructions or products referred to in the content. |
© 2024 by the authors. Licensee MDPI, Basel, Switzerland. This article is an open access article distributed under the terms and conditions of the Creative Commons Attribution (CC BY) license (https://creativecommons.org/licenses/by/4.0/).