Abstract
This work presents a comprehensive study of the burst of an LPG tank in Gravedona, Italy. The possible causes of the burst were investigated through analytical methods and numerical simulations. That is, an analytical lumped system analysis was conducted to accurately predict the thermodynamic properties of the LPG–air mixture within the tank during filling operations. Additionally, computational fluid dynamics (CFD) simulations were carried out to (i) better capture local effects and (ii) determine if the mixture reached explosive conditions during these operations. The likelihood that possible mechanical defects led to the burst of the tank during filling operations was also evaluated through numerical simulations. The proposed methods were validated against experimental observations, confirming their accuracy and reliability. Furthermore, a specifically developed analytical model was used to describe the tank’s dynamic response after the burst. The results provided a comprehensive understanding of the cause of the burst thanks to the combination of analytical models and numerical simulations. The derived insights not only pinpointed the factors leading to the incident, but also provided valuable perspectives for predicting and preventing similar occurrences.
1. Introduction
Liquefied petroleum gas (LPG) is widely used in many applications, ranging from heating appliances and vehicles to cooking equipment. Its transportation and storage require strict safety measures to avoid safety risks. In fact, LPG is highly flammable in air and may generate explosive vapor. In the case that such measures fail, the burst of LPG tanks may happen, leading to catastrophic consequences including loss of life, damage to buildings, and environmental disasters [1,2,3]. Among large-scale disasters, the 1984 San Juanico incident in Mexico is worth mentioning [4]. A gas leak at an LPG storage facility led to a series of explosions, resulting in over 500 fatalities and extensive damage to the surrounding area. Another large-scale event occurred in 1978 in Alcanar, Spain [5]. A road tanker carrying 23 tons of liquefied propylene exploded near a campsite, resulting in 215 fatalities. Although a different liquefied gas was involved here, the incident dynamics adhered to all other events involving LPG. More recently, smaller-scale, but still relevant, accidents involving LPG have occurred. In 2020, an LPG tank truck overturned and collided with the guardrail. The tank exploded and 25 tons of LPG were released. The tank was then shot into the air, and the gas cloud ignited, resulting in 20 people killed and 175 people injured, along with significant property loss [6,7,8]. Investigating the causes of such events may help prevent other similar incidents. Similarly, assessing the risk of potential leakage and explosion in critical sites may also reveal interesting information for incident prevention, as in Refs. [9,10,11].
In this context, this work investigates an incident that occurred in Gravedona, Italy, in 2019, where an underground LPG tank burst led to a fatal accident. Although the tank had recently undergone maintenance, it failed during the filling process, causing the operator to be thrown several meters away, resulting in his death. Preliminary investigations identified several potential contributing factors, including improper filling procedures, the presence of air in the tank, and mechanical defects in the tank structure.
The causes of this incident were comprehensively studied by means of a multifaceted approach. That is, an analytical lumped system model was developed to predict the thermodynamic properties of the LPG–air mixture during the filling process. This model provided a global assessment of the mixture’s flammability. Next, detailed computational fluid dynamics (CFD) simulations were conducted to capture local effects that the analytical model might overlook. A fracture analysis was then performed to evaluate the mechanical integrity of the tank, focusing on the presence and propagation of cracks. All models were validated against experiments.
This paper is organized as follows. Section 2 describes the accident, the analytical and numerical models developed to study its causes, and the experimental tests carried out to validate the proposed methods. Section 3 shows the results of the investigation. Here, valuable perspectives for predicting and preventing similar occurrences are also discussed. The conclusions of the work are drawn in Section 4.
2. Materials and Methods
The flammability of the gas mixture in the LPG tank was assessed through an analytical model and numerical simulations. The analytical model was used to identify the global flammability of the mixture while the tanks are being filled, neglecting local effects. More accurate information was retrieved through CFD simulations, which helped identify whether local flammable regions were present. Then, the tank was modeled through the FE formulation to investigate the influence of cracks on the tank burst. Finally, a simple analytical model of the tank mechanics was used to verify if the dynamics determined by the identified cause of the burst adhered to the events observed during the accident. All the developed models are described below.
2.1. Description of the Accident
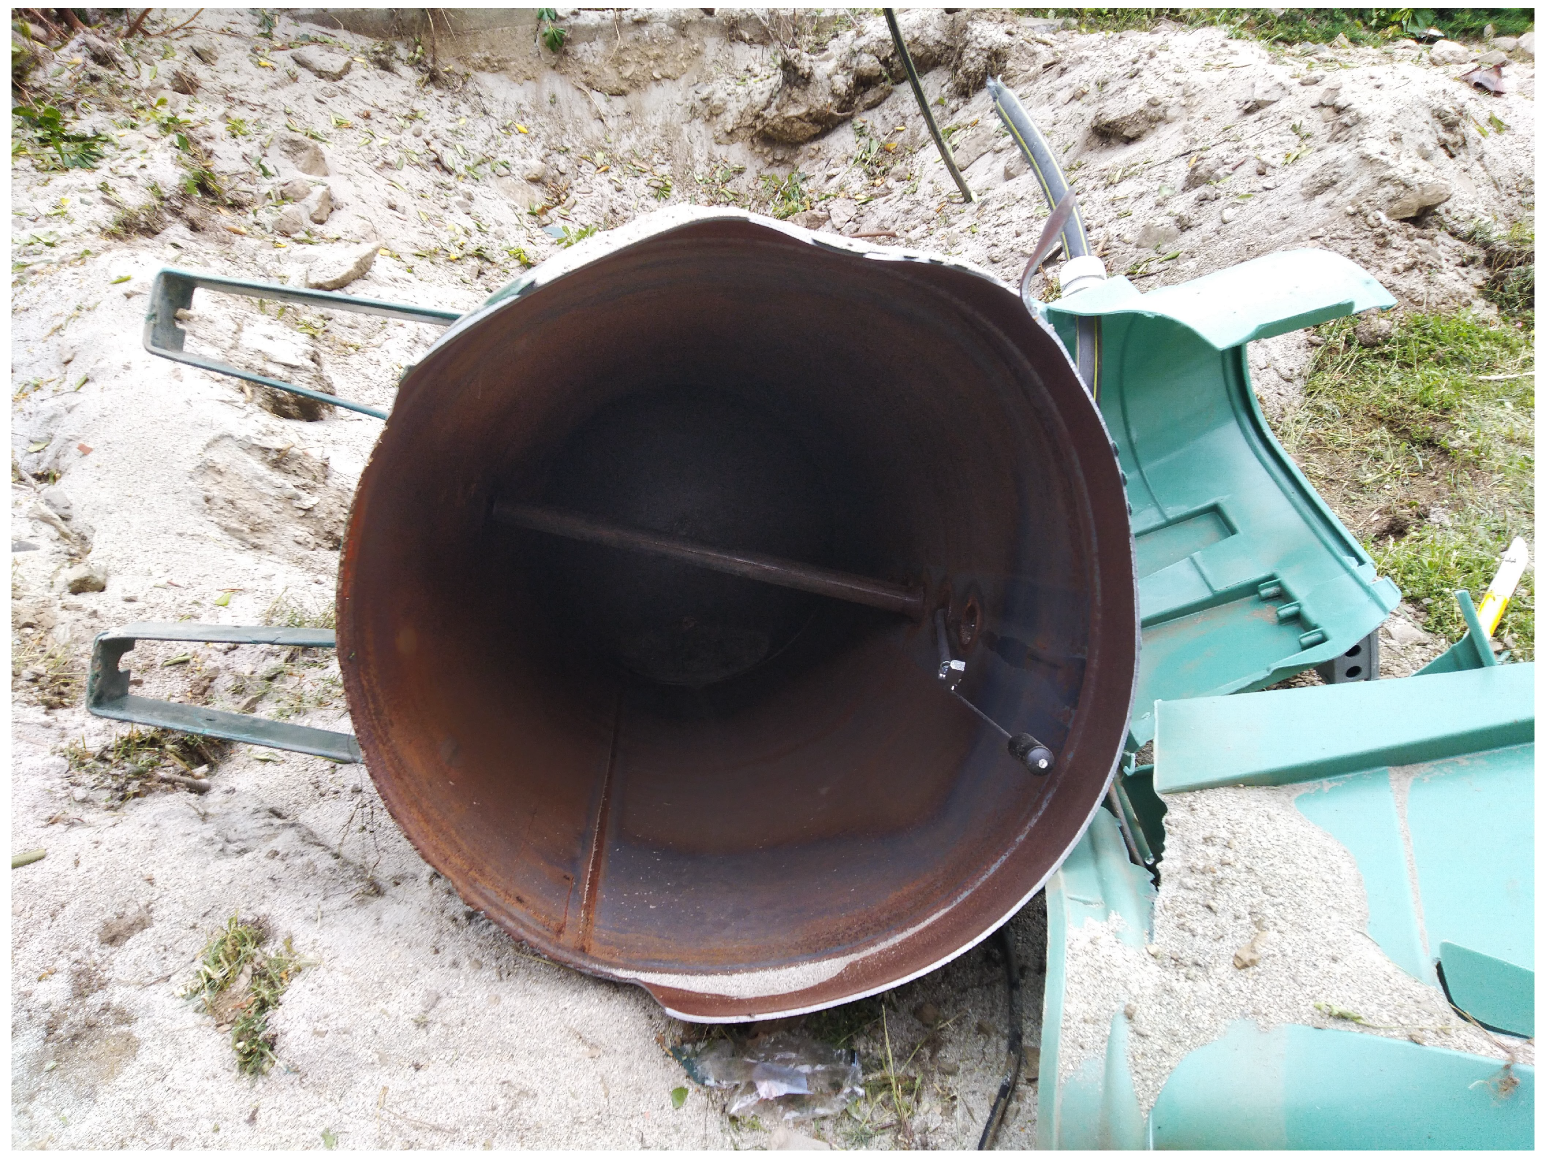
In 2019 at 10 a.m. local time, an underground LPG tank burst in Gravedona, Italy. The accident took place during the filling procedure, after the tank had undergone maintenance. No fire was detected during the event. The tank burst threw the operator several meters away, resulting in his death. A picture of the tank after the accident is shown in Figure 1.

Figure 1.
Tank after the accident.
The tank was made of Fe510, and had a length of 2.27 m, a diameter of 0.80 m, and a wall thickness of 4.5 mm. Hence, the tank volume was . The LPG mixture C, which is composed of 98% propane and 2% butane in volume, was used to fill the tank. Right before the burst, the tank had been filled with 593 L.
Some negative factors were identified during the investigations:
- After maintenance, the tanks had been left open, causing the inter gas to exit. That is, the filling procedure may have taken place when the tank was filled with air at ambient pressure.
- The standard filling procedure had not been adopted.
- A safety valve had not been properly mounted.
- The tanks had not been grounded.
- A crack was present.
- The tank had not been properly positioned and installed.
Given the above negative factors, two possible scenarios were analyzed:
- The air–LPG mixture inside the tank became flammable during the filling procedure. The flammable mixture was somehow ignited, and the resulting internal overpressure led to the tank bursting.
- The normal pressure rise due to the filling procedure led to the rupture of the tank due to the presence of a crack.
2.2. Analytical Model for Studying Mixture Flammability
In order for the gas mixture in the tank to become flammable, the assumption that air at ambient pressure was present before the filling procedure was made. This assumption adhered to one of the negative factors described in Section 2.1 and did not limit the validity of the proposed method.
An analytical model based on lumped parameters was developed to verify if the air–LPG mixture underwent flammability conditions during the filling procedure. The following hypotheses were made:
- The behavior of the gases inside the tank can be described through the ideal gas law, and the gas mixture is homogeneous.
- Prior to filling, the tank contains air at pressure and volume . Initially, the liquefied LPG flowing into the tank undergoes a change of state and becomes gas. The air partial pressure remains constant, while the propane and butane partial pressure is determined by the moles inserted into the tank. This filling phase is referred to as phase 1.
- When the conditions inside the tank allow for the formation of liquefied LPG, a dynamic equilibrium between gaseous and liquefied LPG determines the thermodynamic state in the tank. The LPG vapor pressure at temperature T is constant at , while the air pressure increases as the ullage is reduced in size. This filling phase is referred to as phase 2.
Equation (1) shows the partial pressure of the i-th gas within the tank:
where R = 2.314 J/(mol·K) is the gas constant, and indicates the moles of the i-th gas. The mixture pressure is determined by Equation (2):
The moles of air in the tank remain constant throughout the filling procedure, and can be computed through Equation (3):
where 22 °C is the air temperature before filling and was identified through the analysis of a database of weather forecasts [12].
After the conditions inside the tank allow for the formation of liquefied LPG, the air pressure can be computed through Equation (4):
where is the tank temperature right before the burst, and is the ullage volume. When the tank burst, 539 L of LPG had already been introduced into the tank, which led to when the accident occurred. This is true under the assumption that the amount of gaseous LPG in the tank can be neglected.
Furthermore, during phase 2, the moles of propane and butane can be computed using Equations (5) and (6), respectively:
where identifies the partial pressure of gas i in the mixture in the tank ullage, according to Equation (7)
where is the propane vapor pressure at temperature , and is the liquid propane molar concentration in the liquefied LPG mixture. The same applies for butane.
The air–LPG mixture in the ullage can be characterized through Equations (8)–(10):
where identifies the moles of air-LPG mixture, the volume concentration of LPG in the gaseous mixture, and the pressure inside the tank.
Moreover, the propane and butane molar concentration in the air–LPG mixture can be computed through Equations (11) and (12):
Such quantities can be used to compute the flammability range of the air–LPG mixture at pressure P and temperature T. Specifically, the lower limit LFL and the upper limit UFL are defined according to Equations (13) and (14), respectively, as reported in [13]:
where and are computed through Equations (15) and (16), respectively:
where and are reference temperature values. The reference values considered in this work are reported in Table 1.

Table 1.
Reference values for the flammability limits of propane and butane in air.
Vapor pressure values of gases vary with temperature and pressure through the Clausius–Clapeyron law shown in Equation (17):
where is the latent heat of vaporization.
Moreover, Raoult’s law shown in Equation (18) is used to determined the vapor pressure of the LPG mixture:
Note that, without losing generality, the molar concentration of propane and butane in the liquefied mixture can be replaced by the volume concentration. The reference values used for computing vapor pressures are reported in Table 2.
Table 2.
Reference values for determining vapor pressures.
The air–LPG mixture is considered flammable when the condition in Equation (19) is satisfied:
2.3. Numerical Model for Studying Mixture Flammability
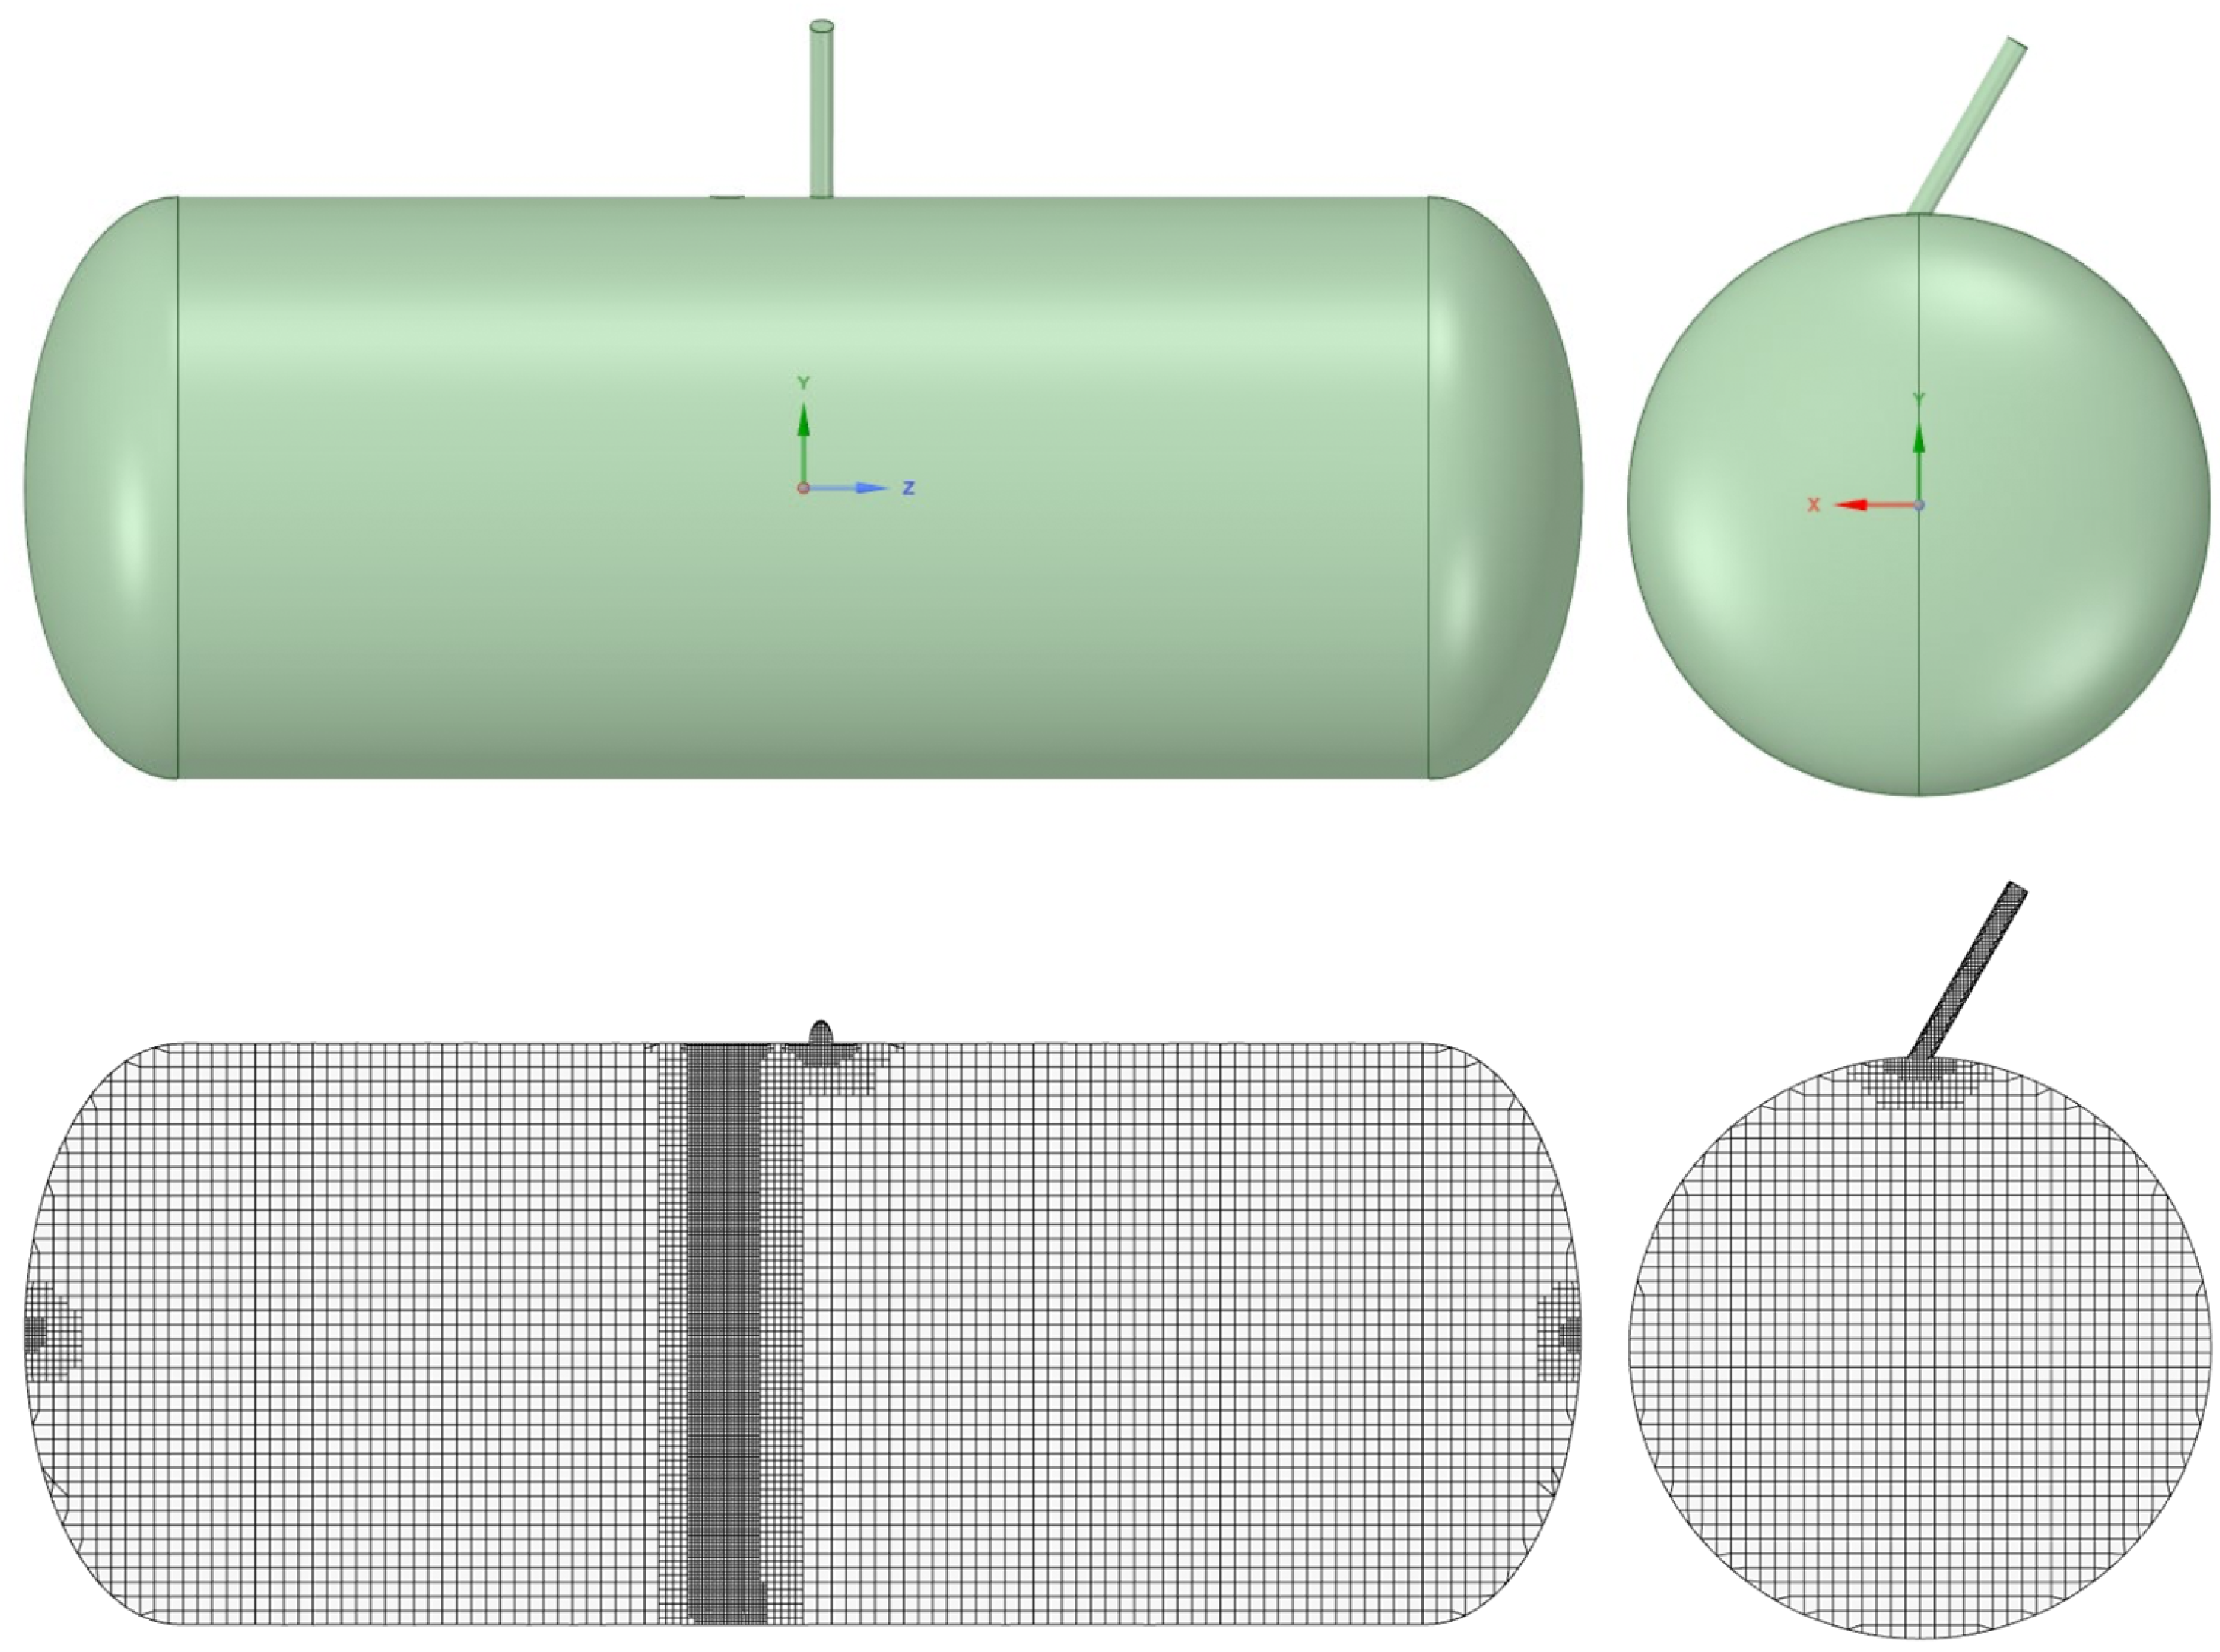
Computational fluid dynamics (CFD) simulations were employed to numerically evaluate the conditions of mixture flammability. The numerical domain consisted in a simplified version of the real tank where some geometrical details of the filling valves were omitted. The domain was meshed with a hybrid non-structured Cartesian cut-cell approach.With this methodology, the volume is filled with a prevalence of hexahedral elements in the central part of the numerical domain, allowing for the limitation of classical numerical diffusion problems in the presence of non-aligned flows. Limited tetrahedral elements were instead used in the peripheral zones. The domain and the mesh are displayed in Figure 2, while Table 3 reports the main characteristics of the numerical grid. Given the objective of this study, no prismatic layer was adopted to discretize the boundary layer at the wall, but a condition of was guaranteed in the domain according to the enhanced wall treatment option adopted.
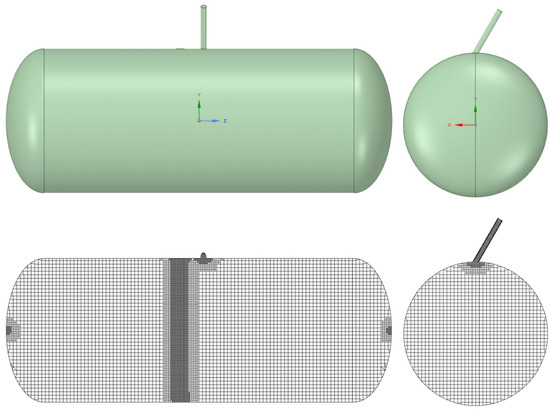
Figure 2.
Domain considered in the simulations (top) and mesh fpr the numerical calculations (bottom).
Table 3.
Characteristics of the discretization grid.
The CFD simulations were run using ANSYS-Fluent release 2020 R2, employing a segregated pressure-based solver with implicit formulation to solve the set of governing equations. The equations used for the analysis are mass balance in multiphase formulation (Volume of Fluid, VOF), momentum balance with Reynolds-Averaged Navier–Stokes (RANS) formulation, energy balance, turbulence transport equation ( realizable model), void fraction transport equation, and Lee’s evaporation-condensation mass transfer mechanism [14] to model propane’s gas/liquid balance. In order to avoid losing focus on the objective of the present paper, the reader is suggested to refer to the official theory guide [15] for details of how these equations are implemented in the code.
The simulations were performed in a transient fashion using a bounded second-order implicit time advancement scheme. Gradients were discretized with Green–Gauss node-based scheme (Warped-Face Gradient Correction active), and the interface between the gas and liquid phases was tracked with a sharp compressive scheme. The coupling between pressure and velocity was addressed with a fractional step scheme, while all other flow variables were discretized with a second-order UPWIND numerical scheme. The compressive scheme was adopted to track the interface between the gas mixture (propane–air) and the liquid propane injected during the filling process. The gas mixture was treated as a compressible ideal gas, while the liquid phase was considered as an incompressible fluid. An important role is played by the propane’s liquid–gas saturation curves as it governs the evaporation–condensation mass transfer mechanism between the two phases. These data were retrieved from [16] and added to the code as a piecewise-linear profile in the pressure–temperature domain. Regarding boundary conditions, the mass flow rate of propane at saturation temperature was imposed at the inlet according to the measurements performed during the experimental campaign. Walls were modeled as no-slip surfaces with convection boundary conditions to model heat dissipation to the environment (heat transfer coefficient of 5 W/m2K and ambient temperature of 16.8 °C as measured during experiments). The shell-conduction approach was adopted to add the thermal resistance of the tank’s shell to the model according to the material thickness and thermo-physical properties. To validate the numerical results, the time history data of pressure and tank external temperature at different locations obtained from the experimental campaign were compared to the data obtained from the simulations. Finally, to comply with the objective of the numerical analysis (i.e., the assessment of the flammability region throughout the duration of the entire filling process), the simulations’ results were processed to quantify the volume of the numerical domain where the propane concentration was in between the LFL and UFL limits described by Equations (13) and (14), respectively. This was monitored throughout the entire duration of the simulation to provide a temporal variation of such a parameter with adequate time resolution.
2.4. Analytical and Numerical Models for Studying the Possibility That the Burst Was Caused by Mechanical Failure
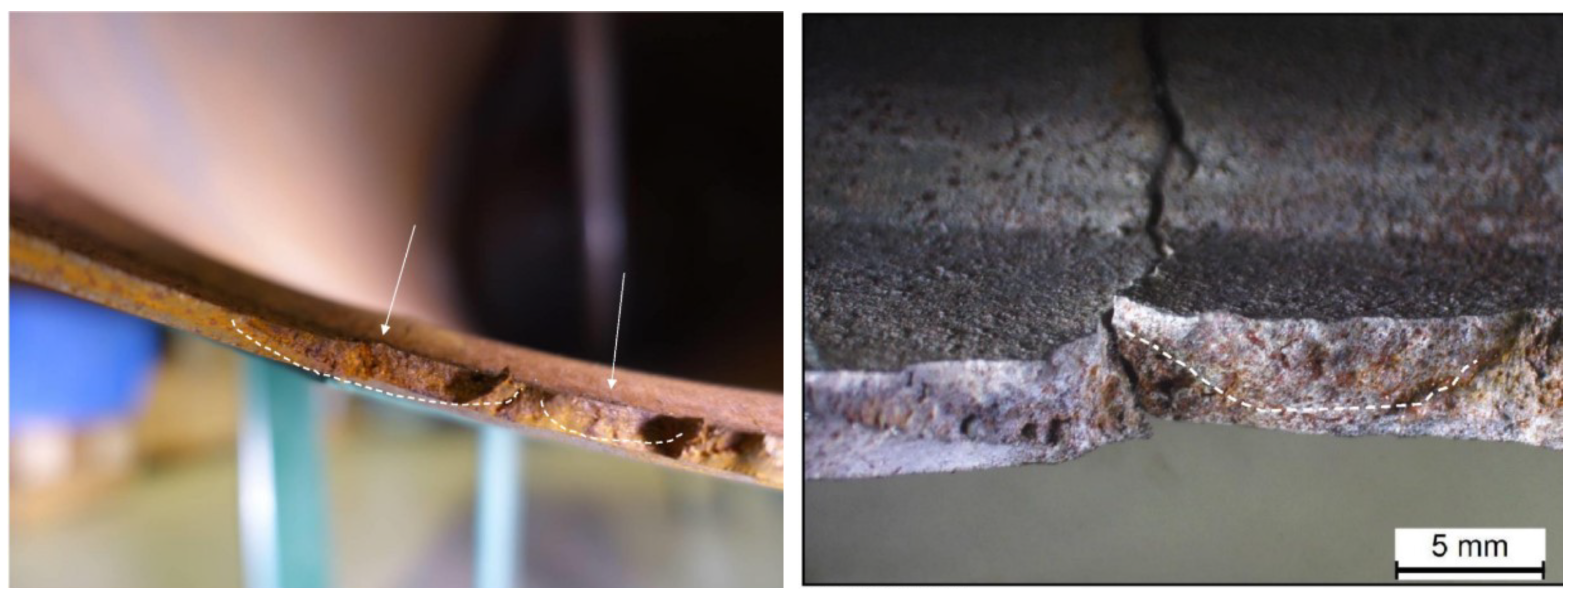
The possibility that the tank burst due to the unstable propagation of the cracks identified when studying the fracture area (Figure 3) was investigated through an analytical model. This choice was made after identifying the presence of chevron marks. The analytical model was based on the analysis of a level 2 failure assessment diagram [17]. The proposed method was based on the assessment of cracks in the space. and are defined according to Equations (20) and (21), respectively:
where is the reference stress according to the geometric and loading conditions under assessment, is the yielding stress, is the stress intensity factor, and is the fracture toughness. The limit curve defining the border between critical and safe cracks is defined through Equation (22):
where is the material’s ultimate tensile stress. Only cracks satisfying the condition shown in Equation (23) are considered safe:

Figure 3.
Cracks identified when studying the fracture area.
and values were determined using traditional mechanics formulas reported in Annexes P and M in Ref. [17], which are not reported here in the interest of brevity.
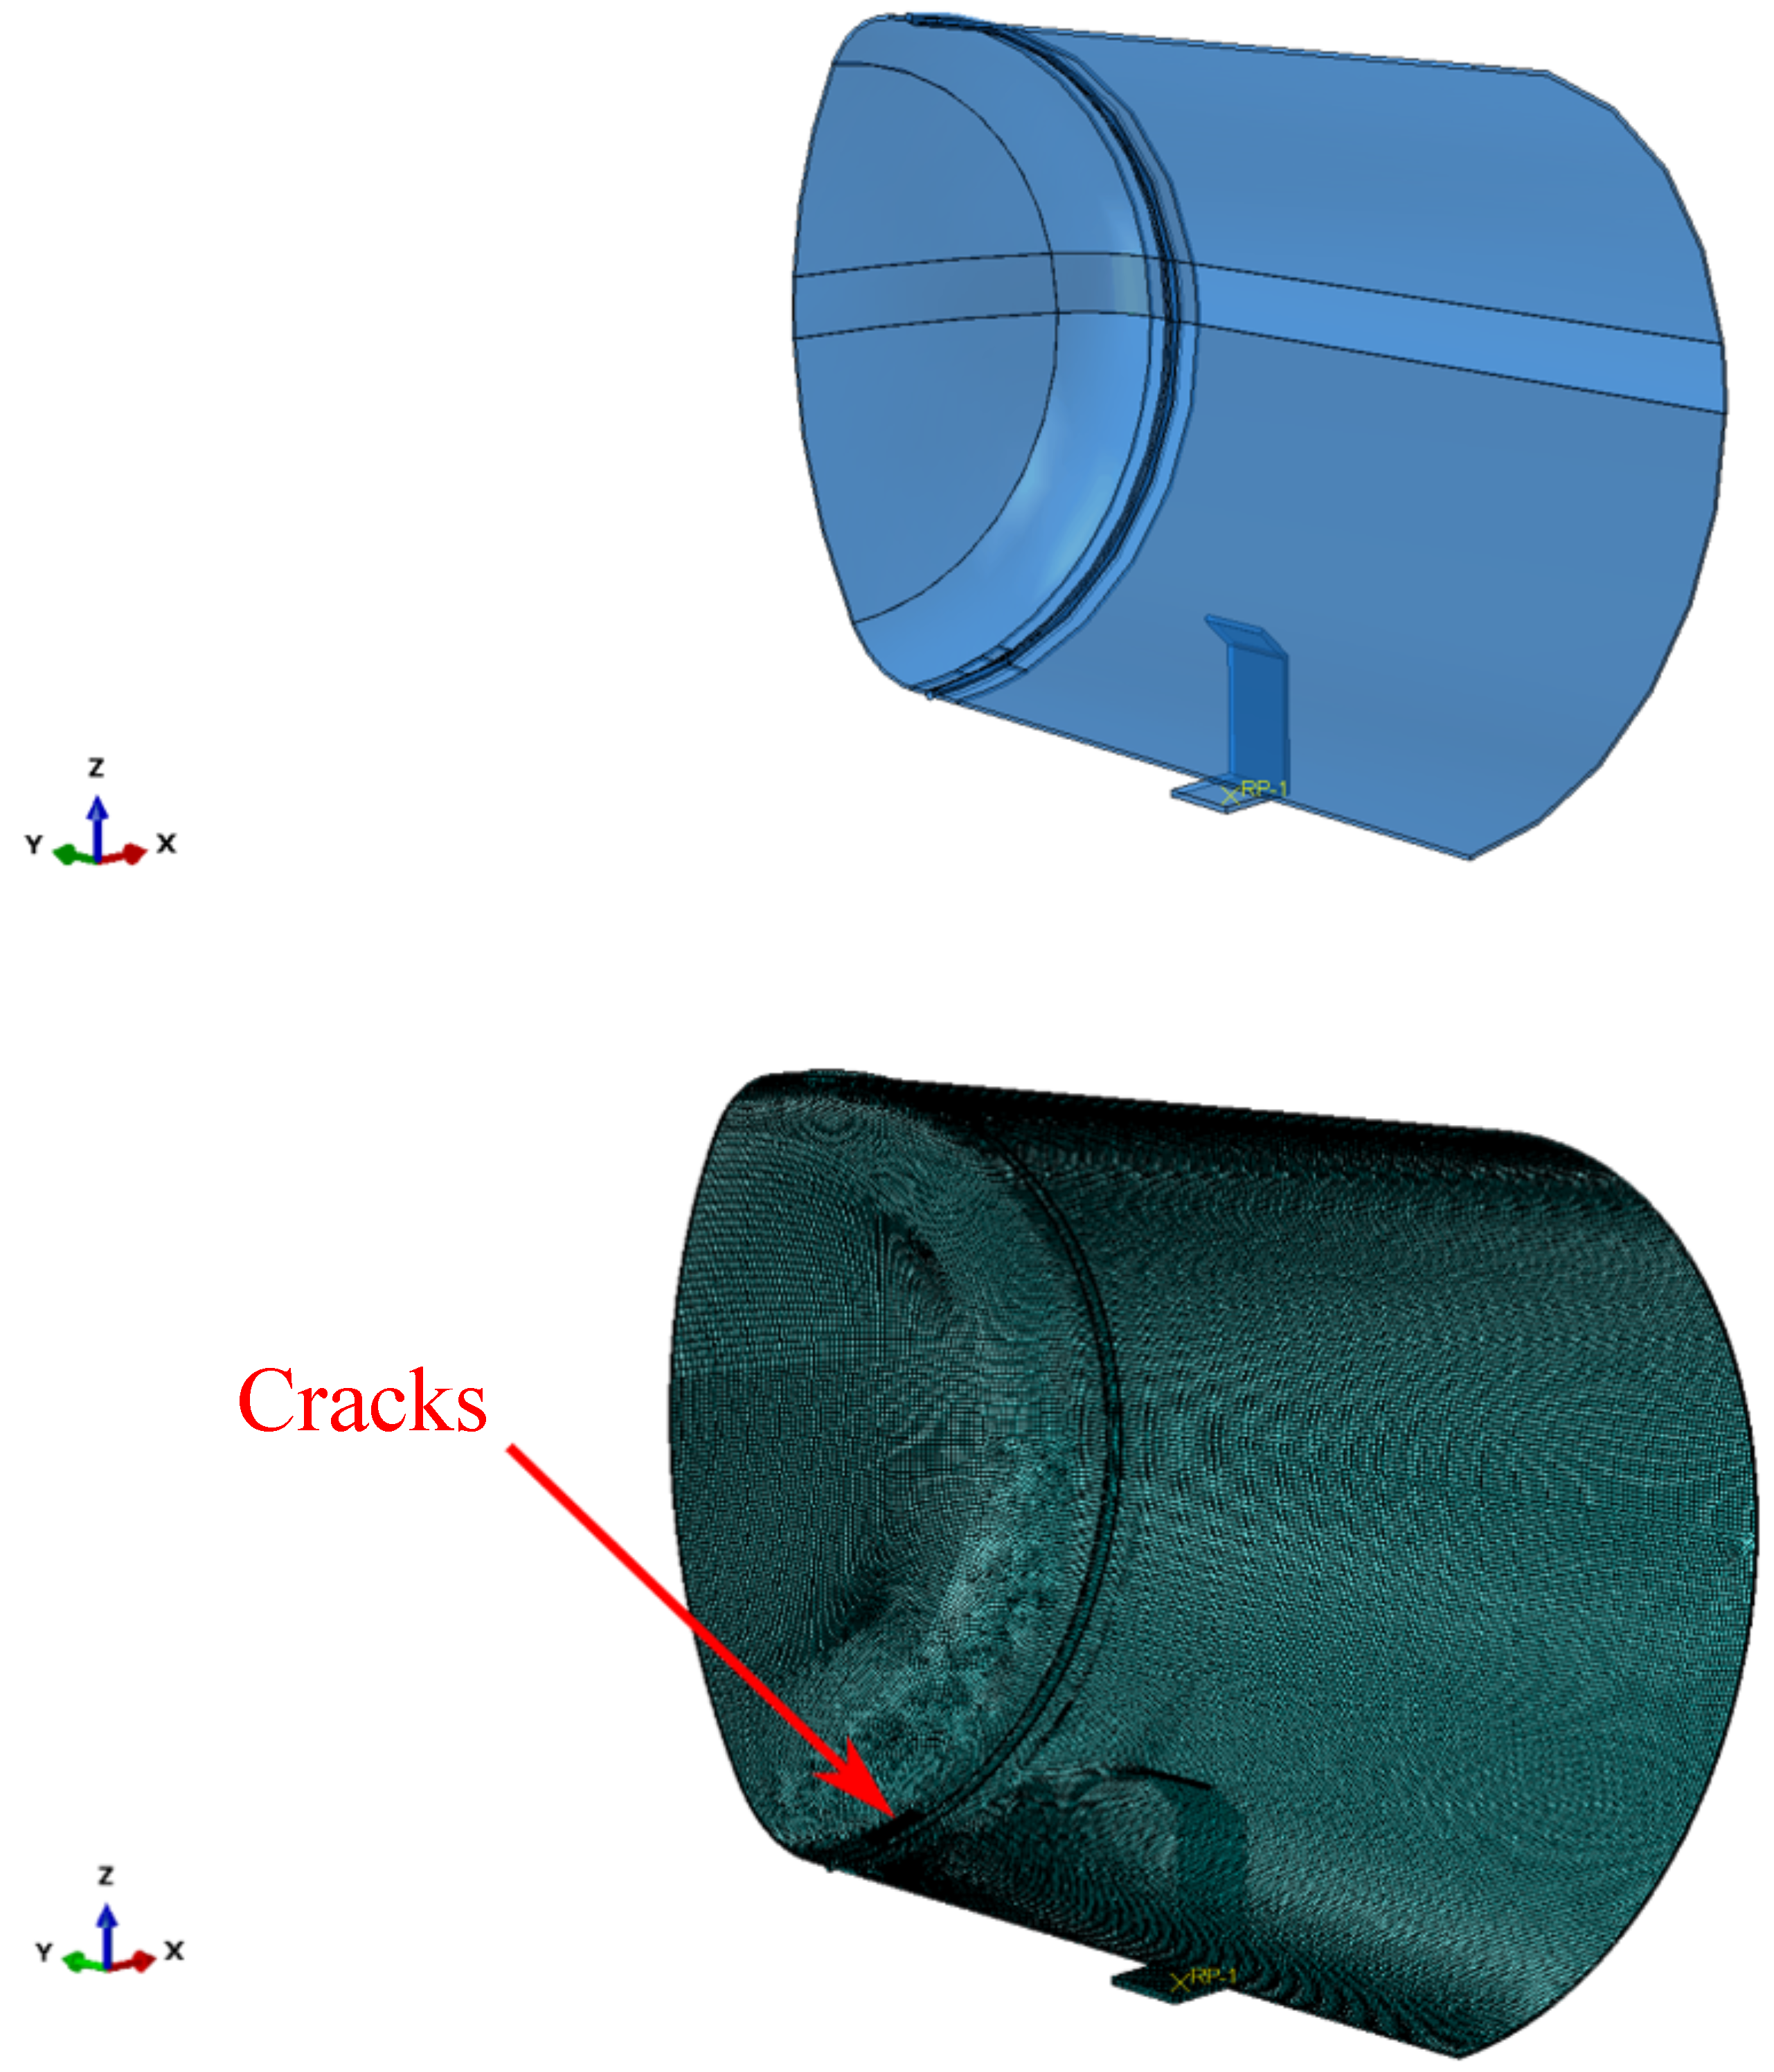
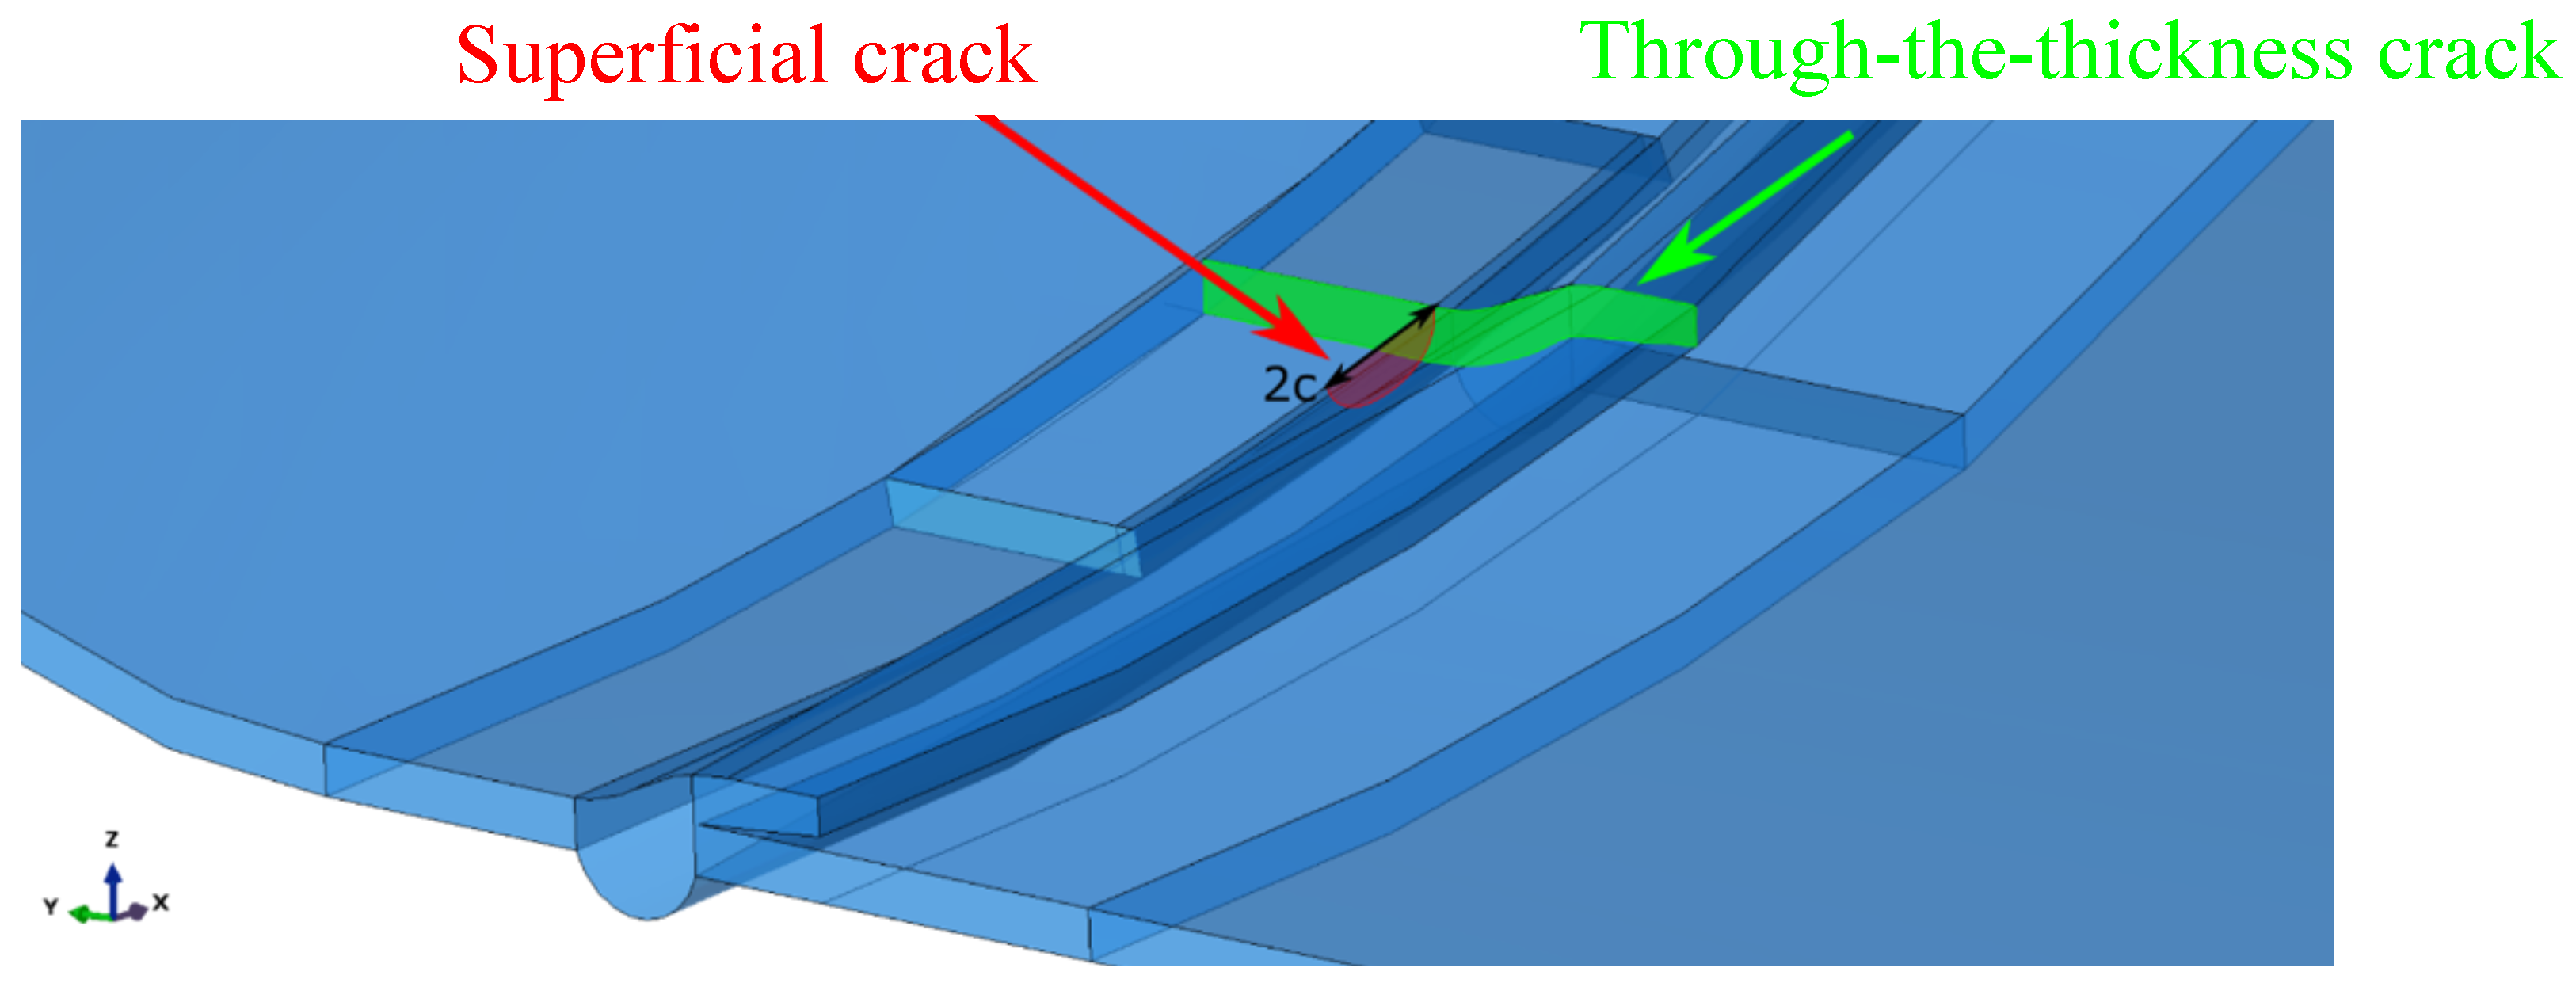
Furthermore, superficial cracks were found close to the through-the-thickness cracks identified along the fracture area. A numerical model was developed to study if the combination of the two defects would lead to the mechanical failure of the tank before reaching the critical crack length found through the FAD analysis described above. The symmetric quarter model of the tank considered in the simulations is shown in Figure 4. General-purpose quadratic brick elements with reduced integration and characteristic dimensions of were used to model the tank, except for the region close to the cracks, where quadratic elements with characteristic dimensions of –0.5 were used. The cracks are better shown in Figure 5.

Figure 4.
Symmetric quarter model of the tank.
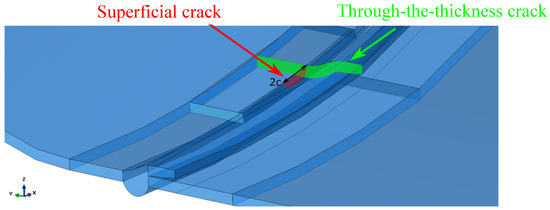
Figure 5.
Cracks in the symmetric quarter model of the tank.
2.5. Analytical Model for Studying the Mechanics of the Tank after the Burst
After the burst, the pressurized gases suddenly flowed out of the tank, and the operator who was standing on the earth on top of the tank during the filling procedure was thrown. A simplified analytical model was developed to verify that the identified causes of the burst were compatible with the observed events and the tank’s dynamics.
The tank’s rotational dynamics are described through Equation (24):
where is the moment acting on the tank, I is the inertia moment, and is the angular acceleration. The inertia moment was computed considering the liquefied LPG inside the tank, the tank itself, and the earth on top of it.
The tank weight , the liquefied LPG weight and that of the earth on top of the tank , along with the outflow force of the gases inside the tank, were considered to compute . Specifically, the tank weight was computed through geometric considerations. Given that the material the tank was made of, i.e., Fe510, has a density of 7870, the tank weight was 240 . Moreover, assuming that when the burst occurred, 593 of LPG had been inserted in the tank, and knowing that the liquefied LPG density was 506 , the liquefied LPG weight was 300 . Finally, the weight of the earth on top of the tank was supposed to be 277 , assuming that the earth density was 1800 [18]. The computations are not reported here in the interest of brevity. Instead, the outflow force of the gases inside the tank was computed through Equation (25)
where is the tank’s cross-sectional area occupied by the gases right before the burst, which was estimated to be . The aforementioned forces were then combined with their distance from the point where the tank was constrained to compute . Note that one of the two constraints of the tank did not fail during the accident. Hence, that constraint was the only one considered to be active and that determined the tank’s dynamics. The considered forces, along with their direction and distance from the tank constraint, are shown in Figure 6. Equation (24) was solved numerically with the following initial conditions: and . identifies the angle between the active constraint and the center of gravity of the whole system, and it was computed based on geometrical considerations only.
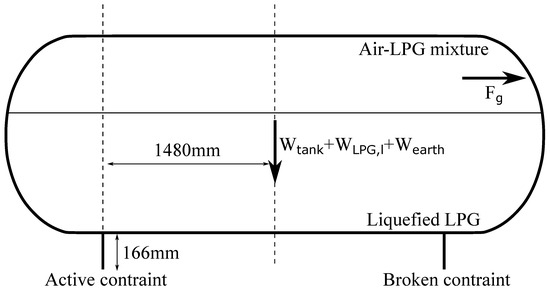
Figure 6.
Forces used to compute .
Furthermore, the traditional projectile motion formulas were used to verify whether the motion of a body on top of the tank when the burst occurred was compatible with the observed events. That is, Equations (26) and (27) were considered to describe the maximum horizontal and vertical distance reached by the body during its motion, respectively:
where is gravity acceleration, is the initial velocity along the horizontal direction, and is the initial velocity along the vertical direction. Note that the initial velocity of the body was computed considering the position of the operator when the burst occurred and using the rotational velocity retrieved by solving Equation (24).
2.6. Experimental Campaign
The experimental campaign was conducted in collaboration with SGS CTR s.r.l. in Sammichele di Bari, Italy. The aim was to characterize the thermodynamic state inside the tank during the filling procedure.
Seven tanks were tested, considering different filling velocities, initial conditions, and quantities of LPG. All tanks were identical to the one involved in the accident. The following tests were performed:
- RSN-OUT-60
- RSA-IN-20
- RSA-IN-60
- RVA-IN-20
- RVA-IN-60
- RLA-IN-20
- RLA-IN-60
The tests were identified by the following nomenclature. RS stands for the filling procedure described in the standards [19], while RS and RL identify faster and slower filling procedures, respectively. The third letter indicates whether air (A) or nitrogen (N) was inside the tank before pumping in LPG. OUT and IN specify that air or nitrogen was taken out or kept in before starting the filling procedure, respectively. Finally, numbers identify the amount of liquefied LPG that was pumped in the tank during the filling procedure, in terms of percentage of tank volume. Mixture C was considered in the tests. That is, the liquefied LPG was composed of 98% propane and 2% butane.
In the interest of brevity, only test RSA-IN-60 is described in this work. The filling procedure is described below:
- Connect the empty hose and pump in 20 L of liquefied LPG. Wait for 120 s.
- Pump in 5 L of liquefied LPG. Wait for 120 s.
- Pump in the remaining quantity of LPG at a flow rate of .
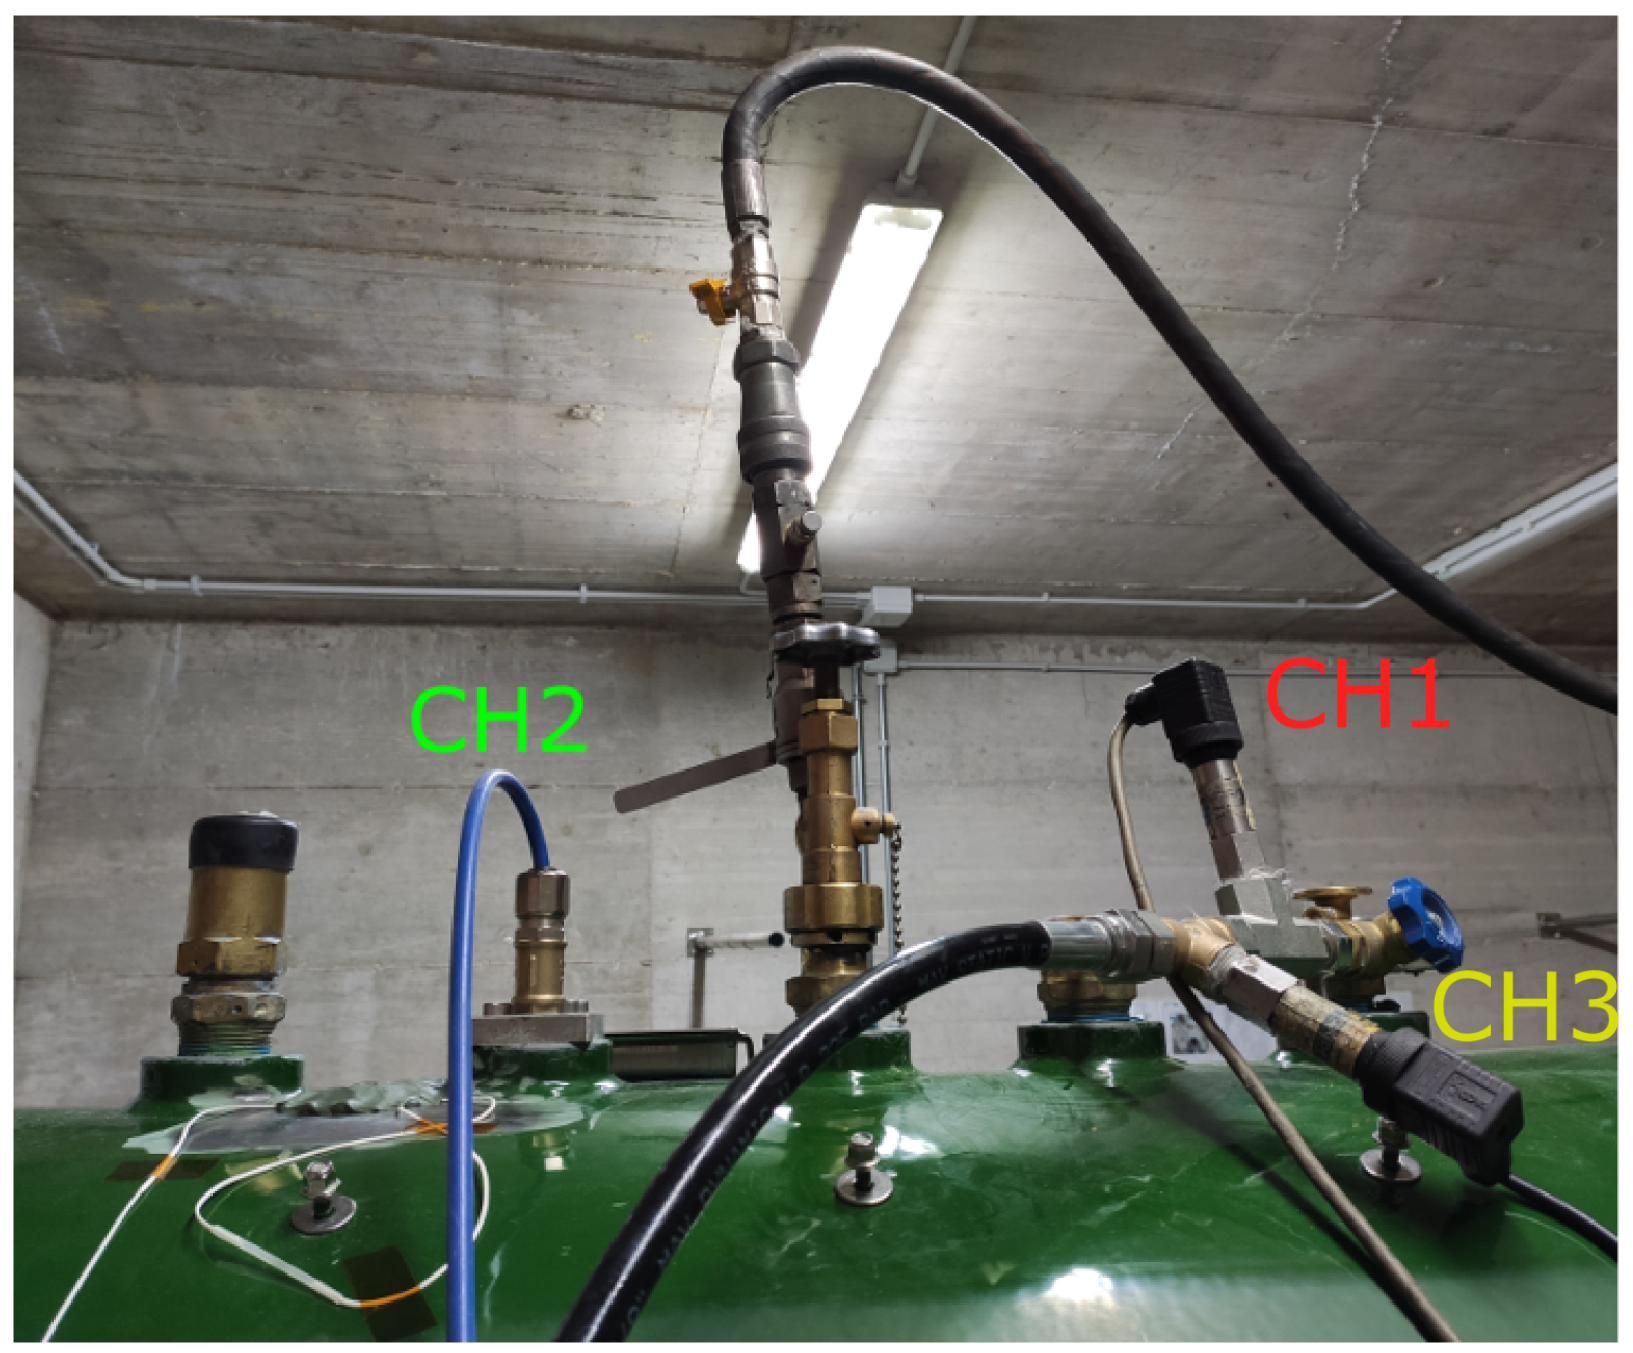
The road tanker and the hose used in the experiments were the same as the ones involved in the accident. The hose was 40 m long and had an internal diameter of 25 mm. Three pressure transducers were installed on the tank: two sensors (CH1 and CH3) were mounted to measure the gas pressure inside the tank, while sensor CH2 was installed inside the tank and was of the immersed type. Sensors CH1 and CH3 were SX18 sensors produced by Nuova Fima Srl (Invorio, Italy). The immersed sensor (CH2) was an LH-20 pressure transducer manufactured by WIKA Srl (Arese, Italy). It was installed to measure the pressure 35 mm above the bottom of the tank. All sensors had a sampling frequency of 1 Hz. The three sensors are shown in Figure 7.
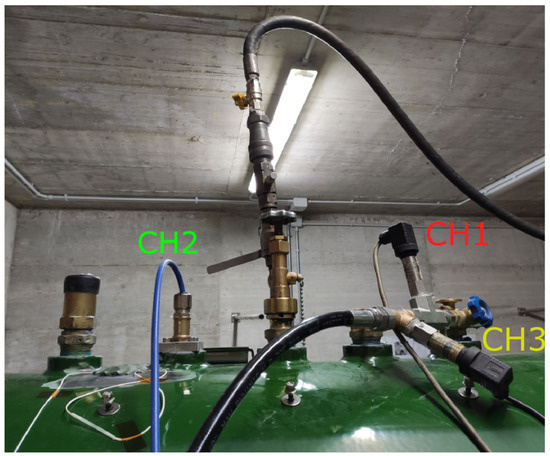
Figure 7.
Pressure transducers installed on the tank.
Strain gauges were also installed to measure the strain of the tank during the filling procedure. However, they are not described here because the results were used for investigations that are out of the scope of this work.
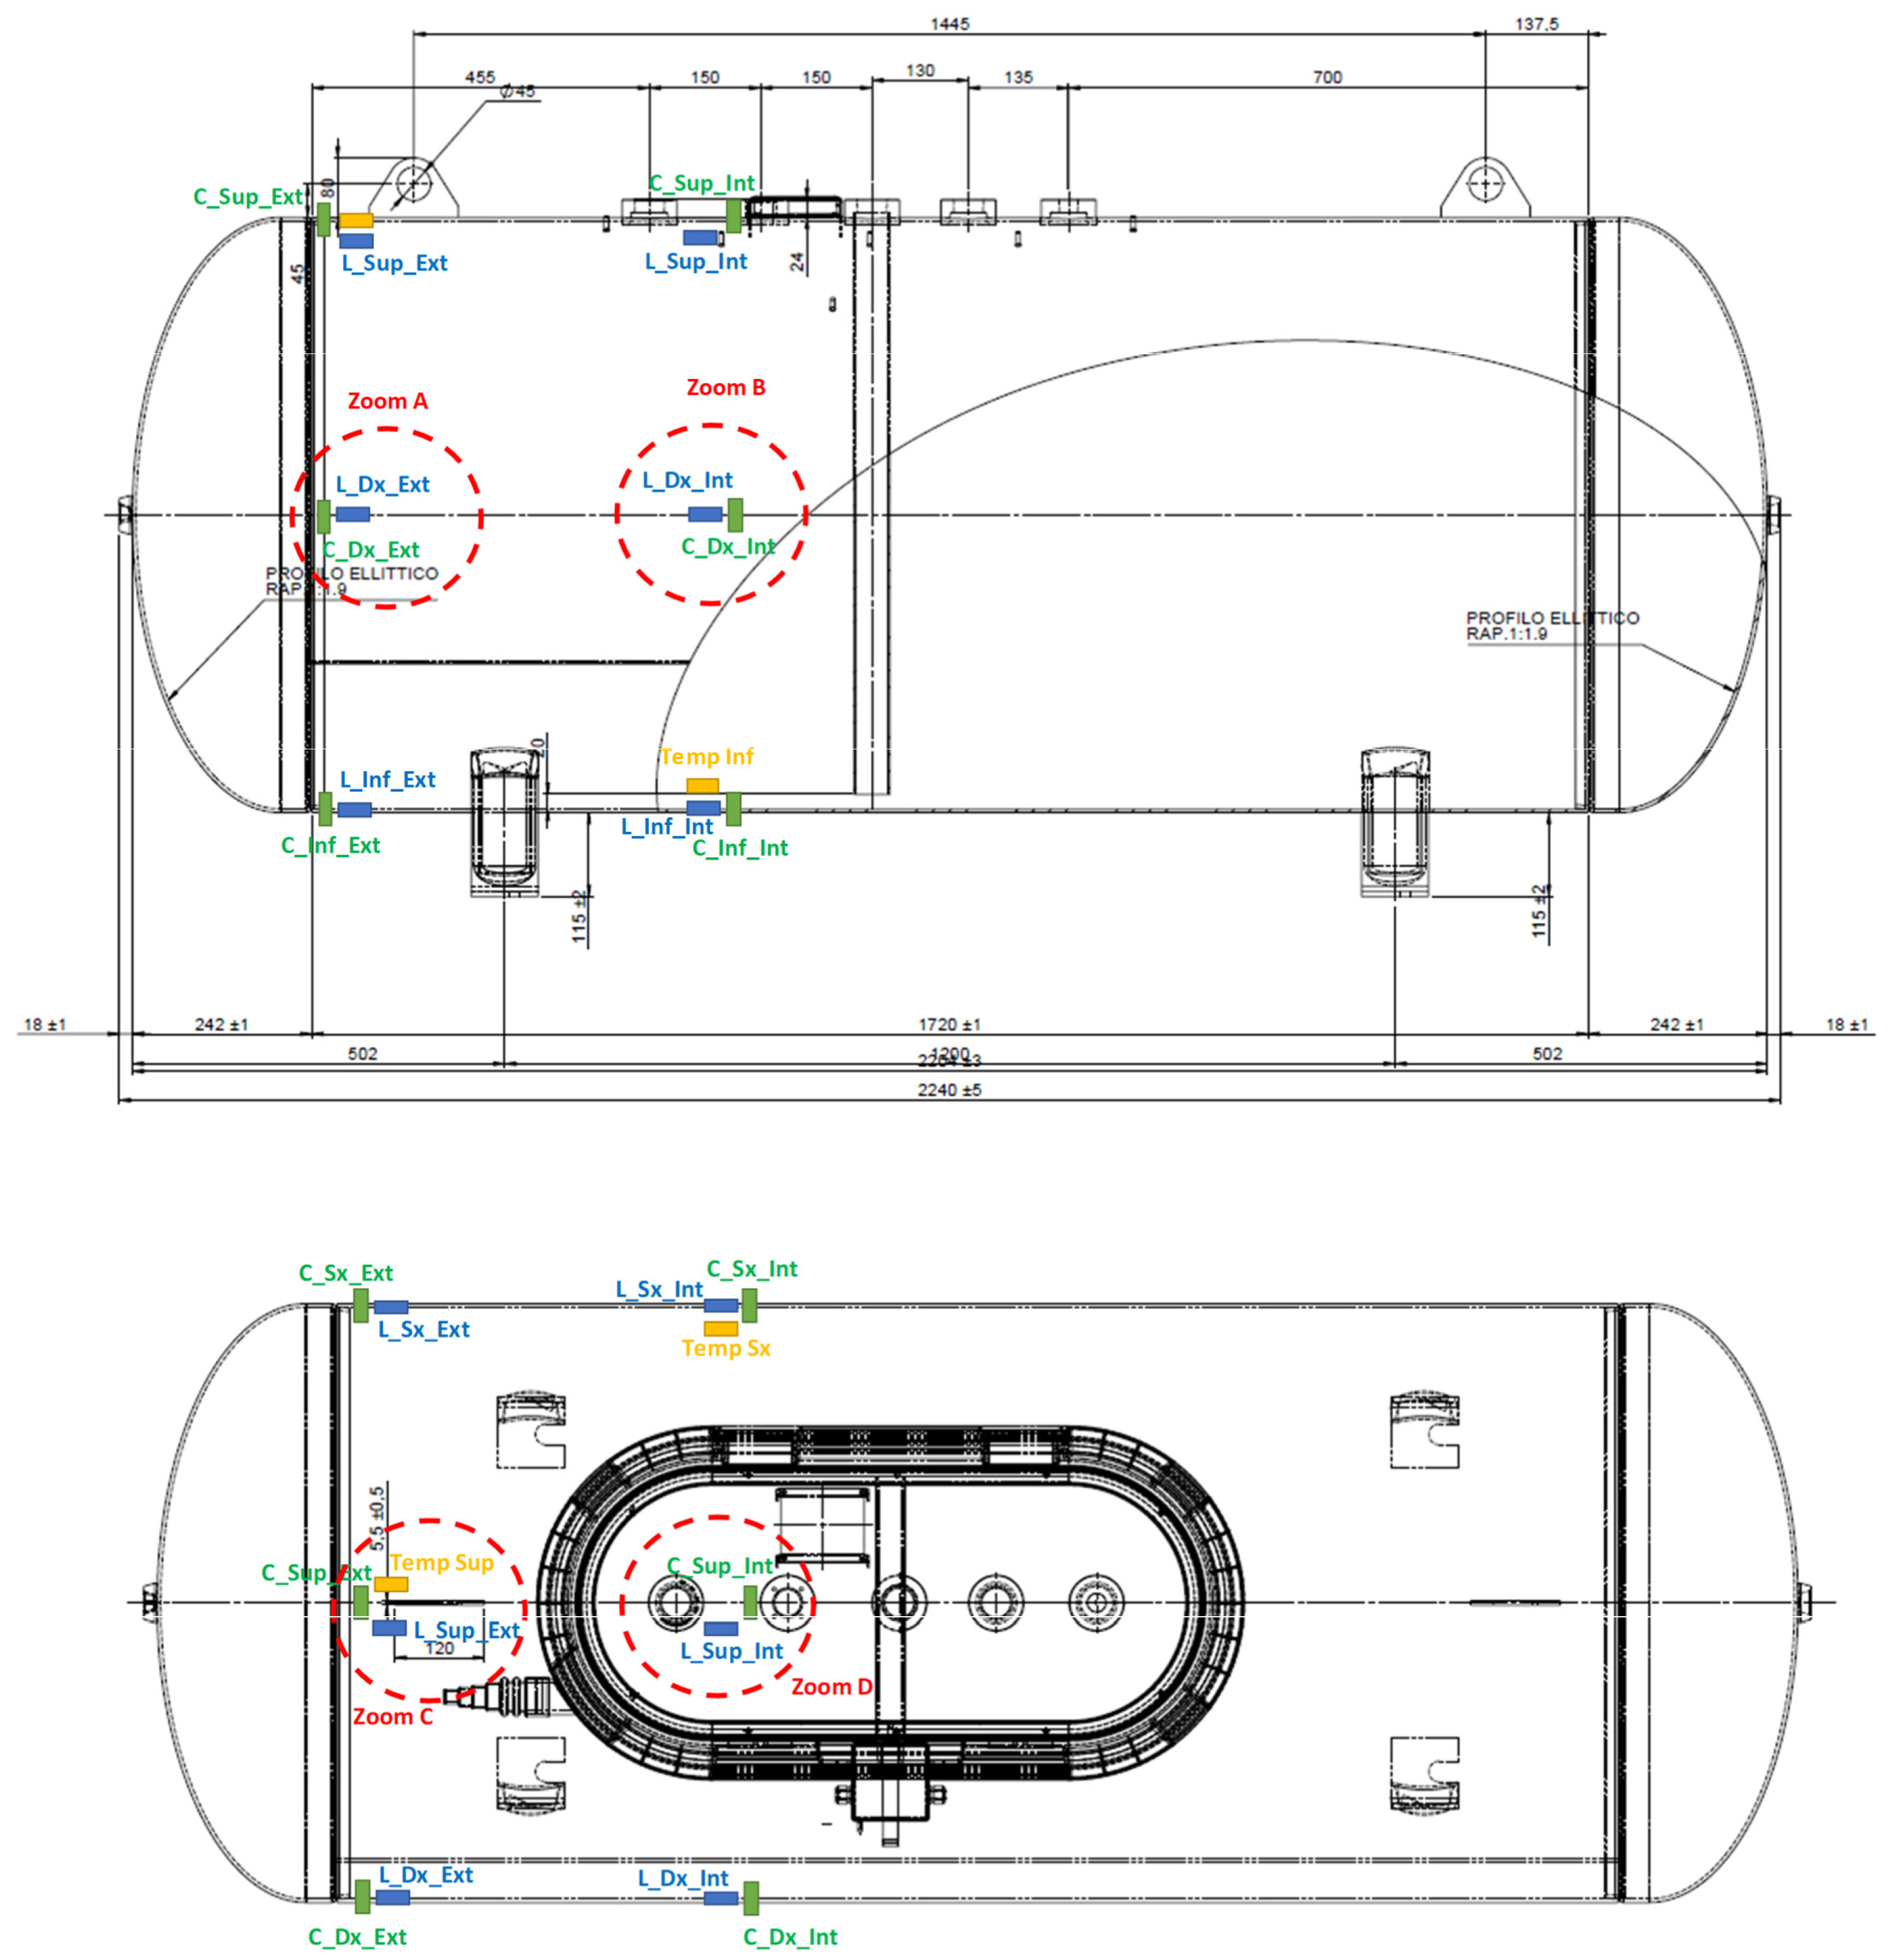
Temperature measurements were taken by means of two FLIR ONE Pro thermal cameras (manufactured by FLIR Systems in Portland, OR, USA) and three fiber Bragg grating sensors (manufactured by the company HBK in Chicago, IL, USA). The thermal cameras acquired frontal and lateral images at a sampling frequency of 8.7 Hz. Instead, the fiber Bragg grating sensors were installed at positions Temp Sup, Temp Inf, and Temp Sx shown in Figure 8, and acquired signals with a sampling frequency of 1 Hz.
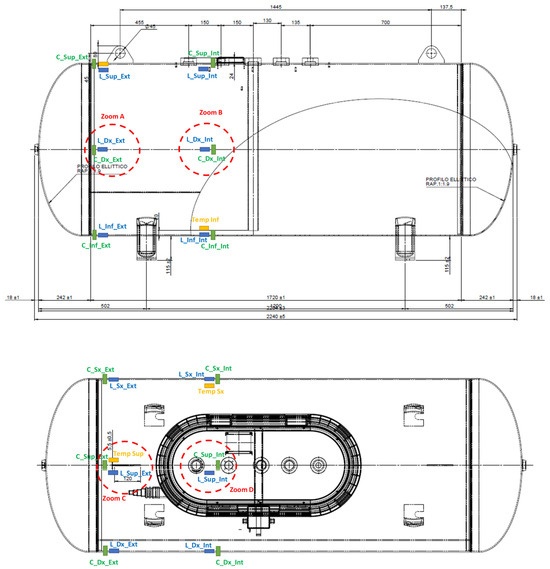
Figure 8.
Positions of the fiber Bragg grating sensors.
Sampling cylinders produced by Fitok Group in Stafford, TX, USA were used to sample the air–LPG gaseous mixture in the tank after each test, except for test RSN-OUT-60. The cylinders were sealed after three liters of mixture had flowed through them. This procedure was chosen to prevent the air trapped inside the cylinders before the sampling procedure from influencing the air–LPG gaseous mixture composition assessment.
3. Results
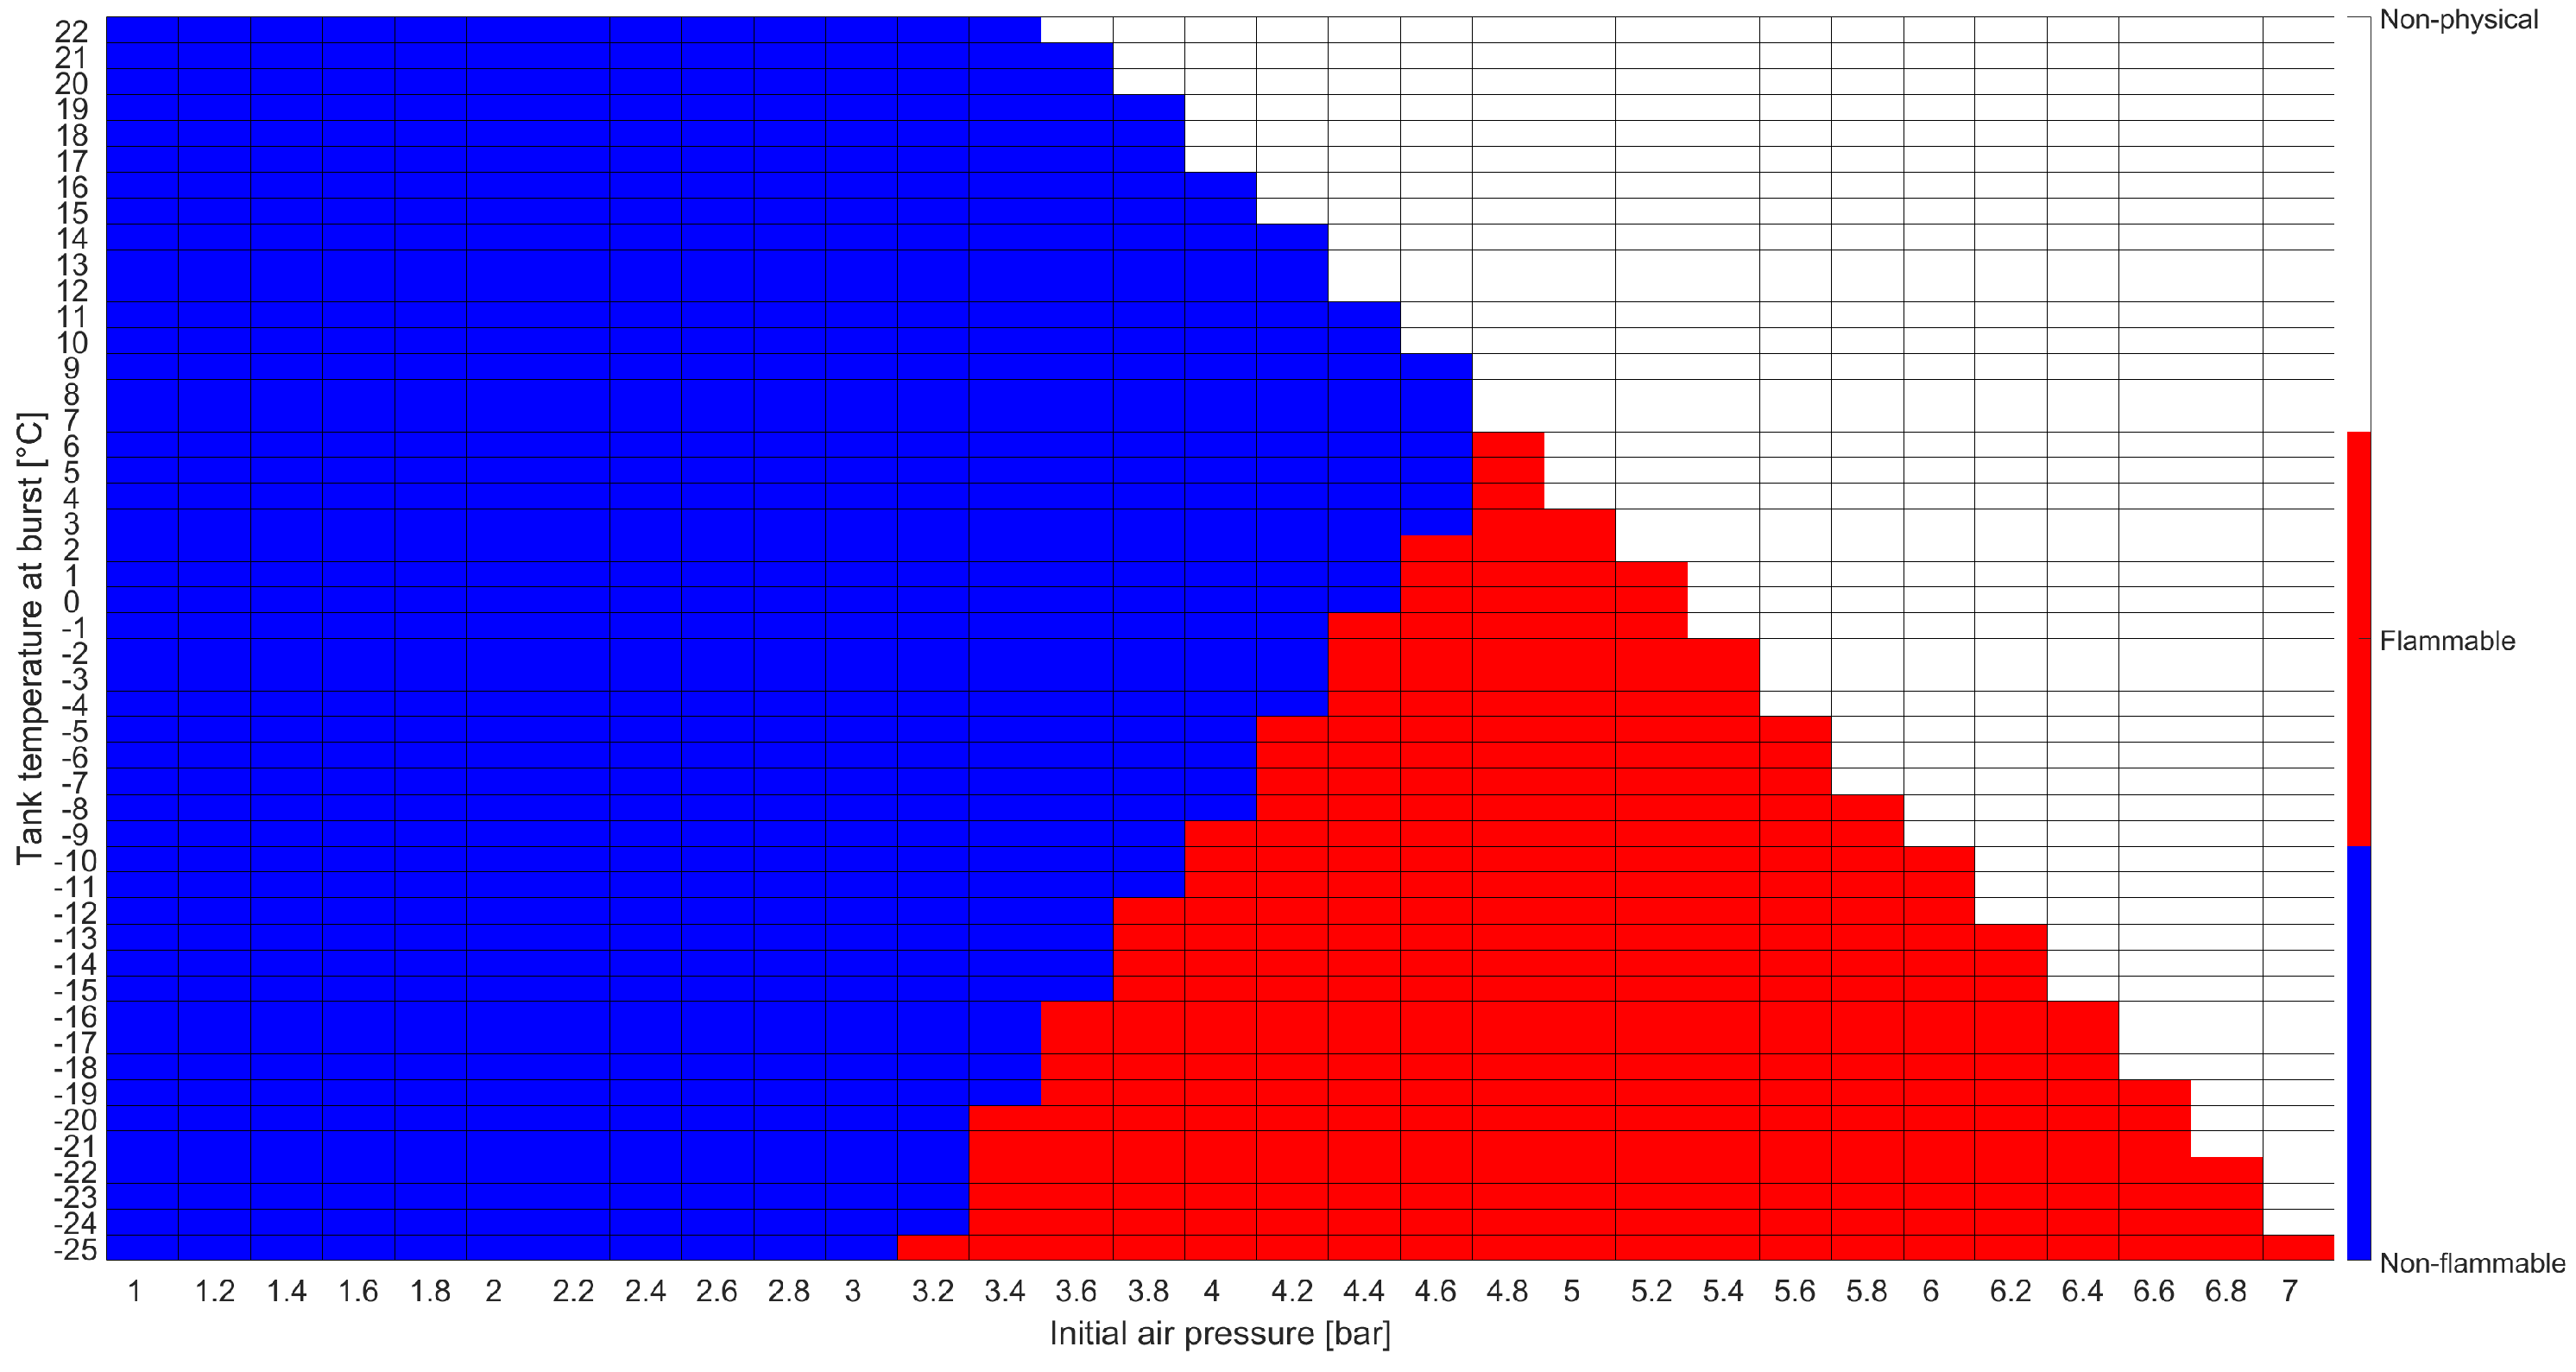
The analytical model presented in Section 2.2 was used to determine the global flammability of the air–LPG mixture during the filling procedure. A sensitivity analysis was conducted considering the following parameters:
- The air pressure inside the tank before filling was varied between 1 and 7 , with step 0.2 . This choice was made to study the influence of this parameter on the flammability conditions. Only the initial condition was considered relevant with regard to the accident described in this work.
- The tank temperature when the burst occurred was varied between −25 °C and 22 °C, with step 1 °C. This choice allowed us to consider the influence of the non-standard filling procedure on the tank temperature [19].
The results of the analytical flammability assessment are shown in Figure 9. Here, red tiles identify flammability conditions, blue indicate non-flammable regions, and white stands for non-physical conditions that would lead to a pressure higher than the operational pressure (17.7 in the considered scenario). For the sake of brevity, only the flammability assessment at the moment of the burst, i.e., when 539 L of LPG had been inserted into the tank, is shown.

Figure 9.
Flammability assessment results using the analytical model.
The results showed that the air–LPG mixture never achieved flammable conditions considering . Hence, the analytical model identified that the scenario according to which the tank burst due to the ignition of the mixture was not plausible.
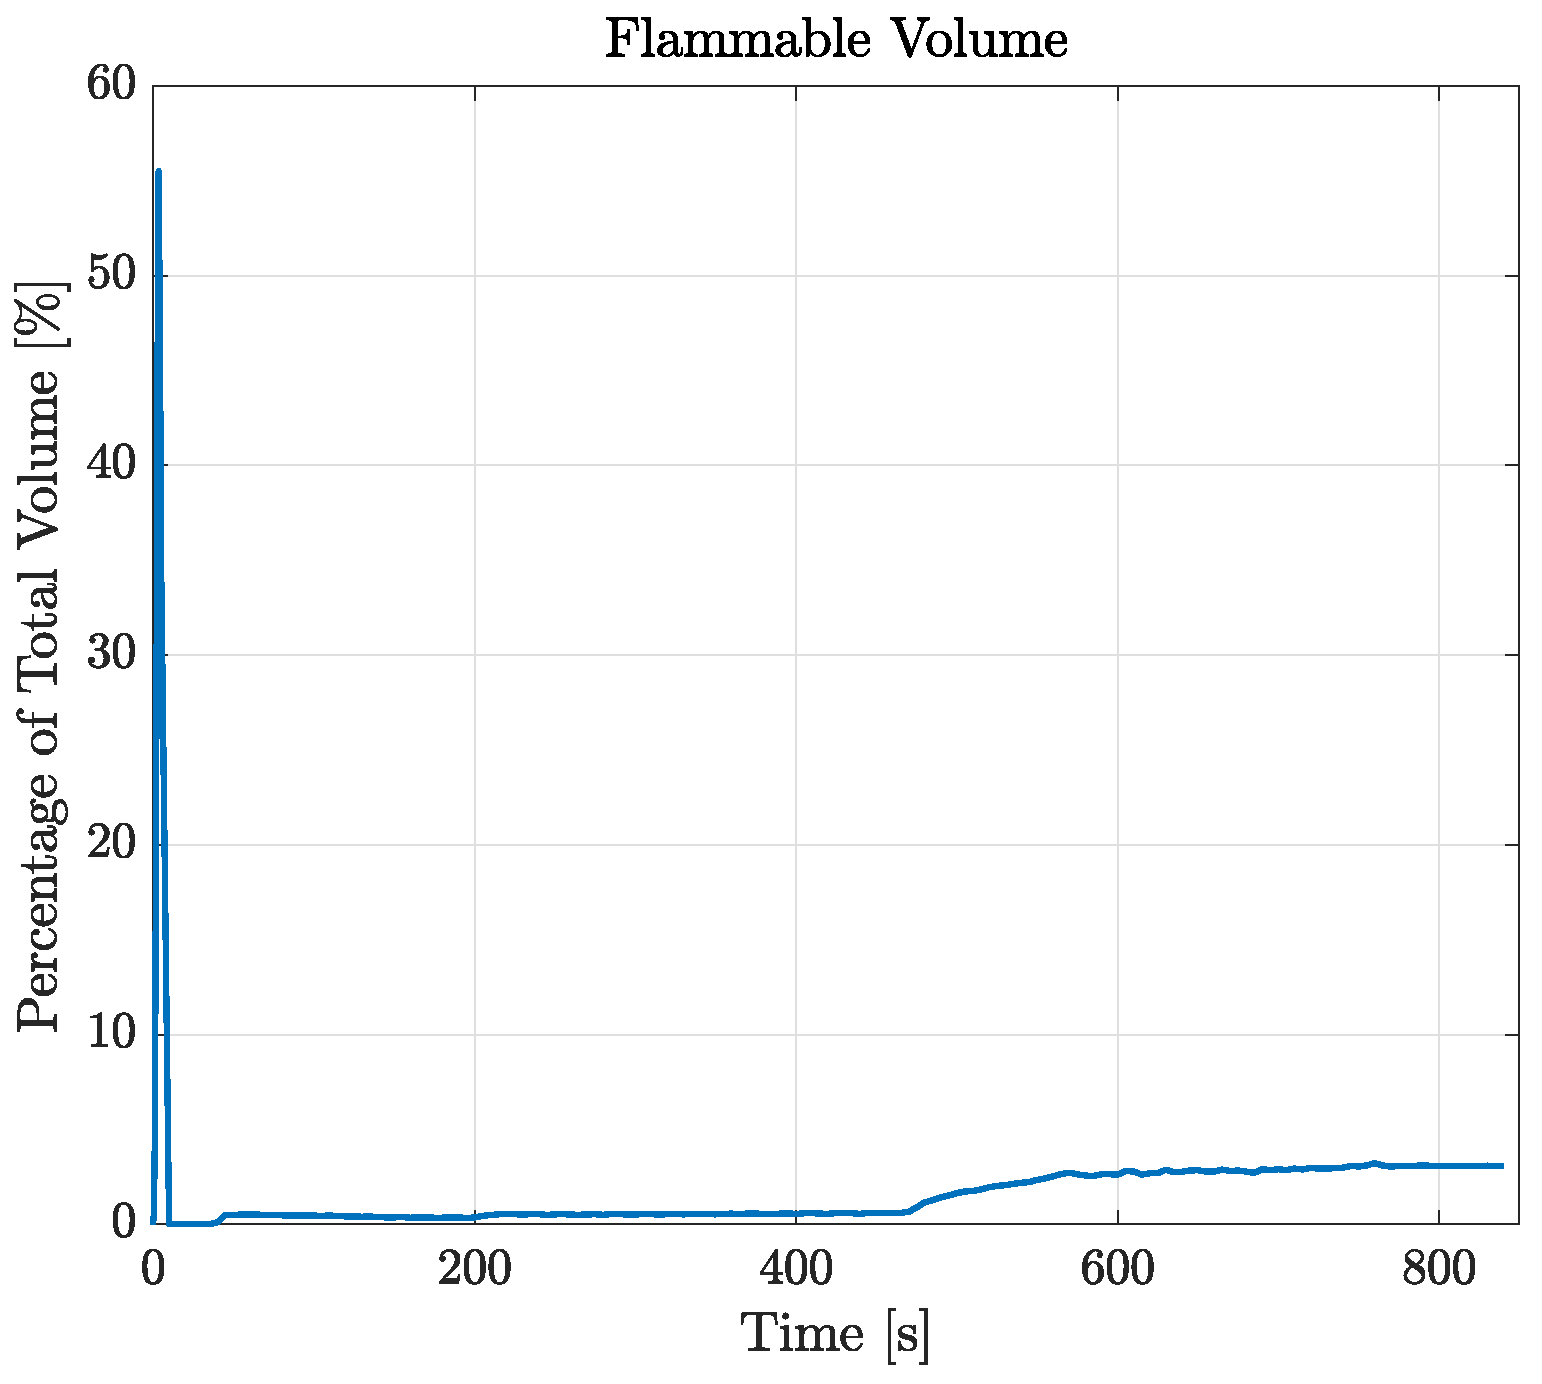
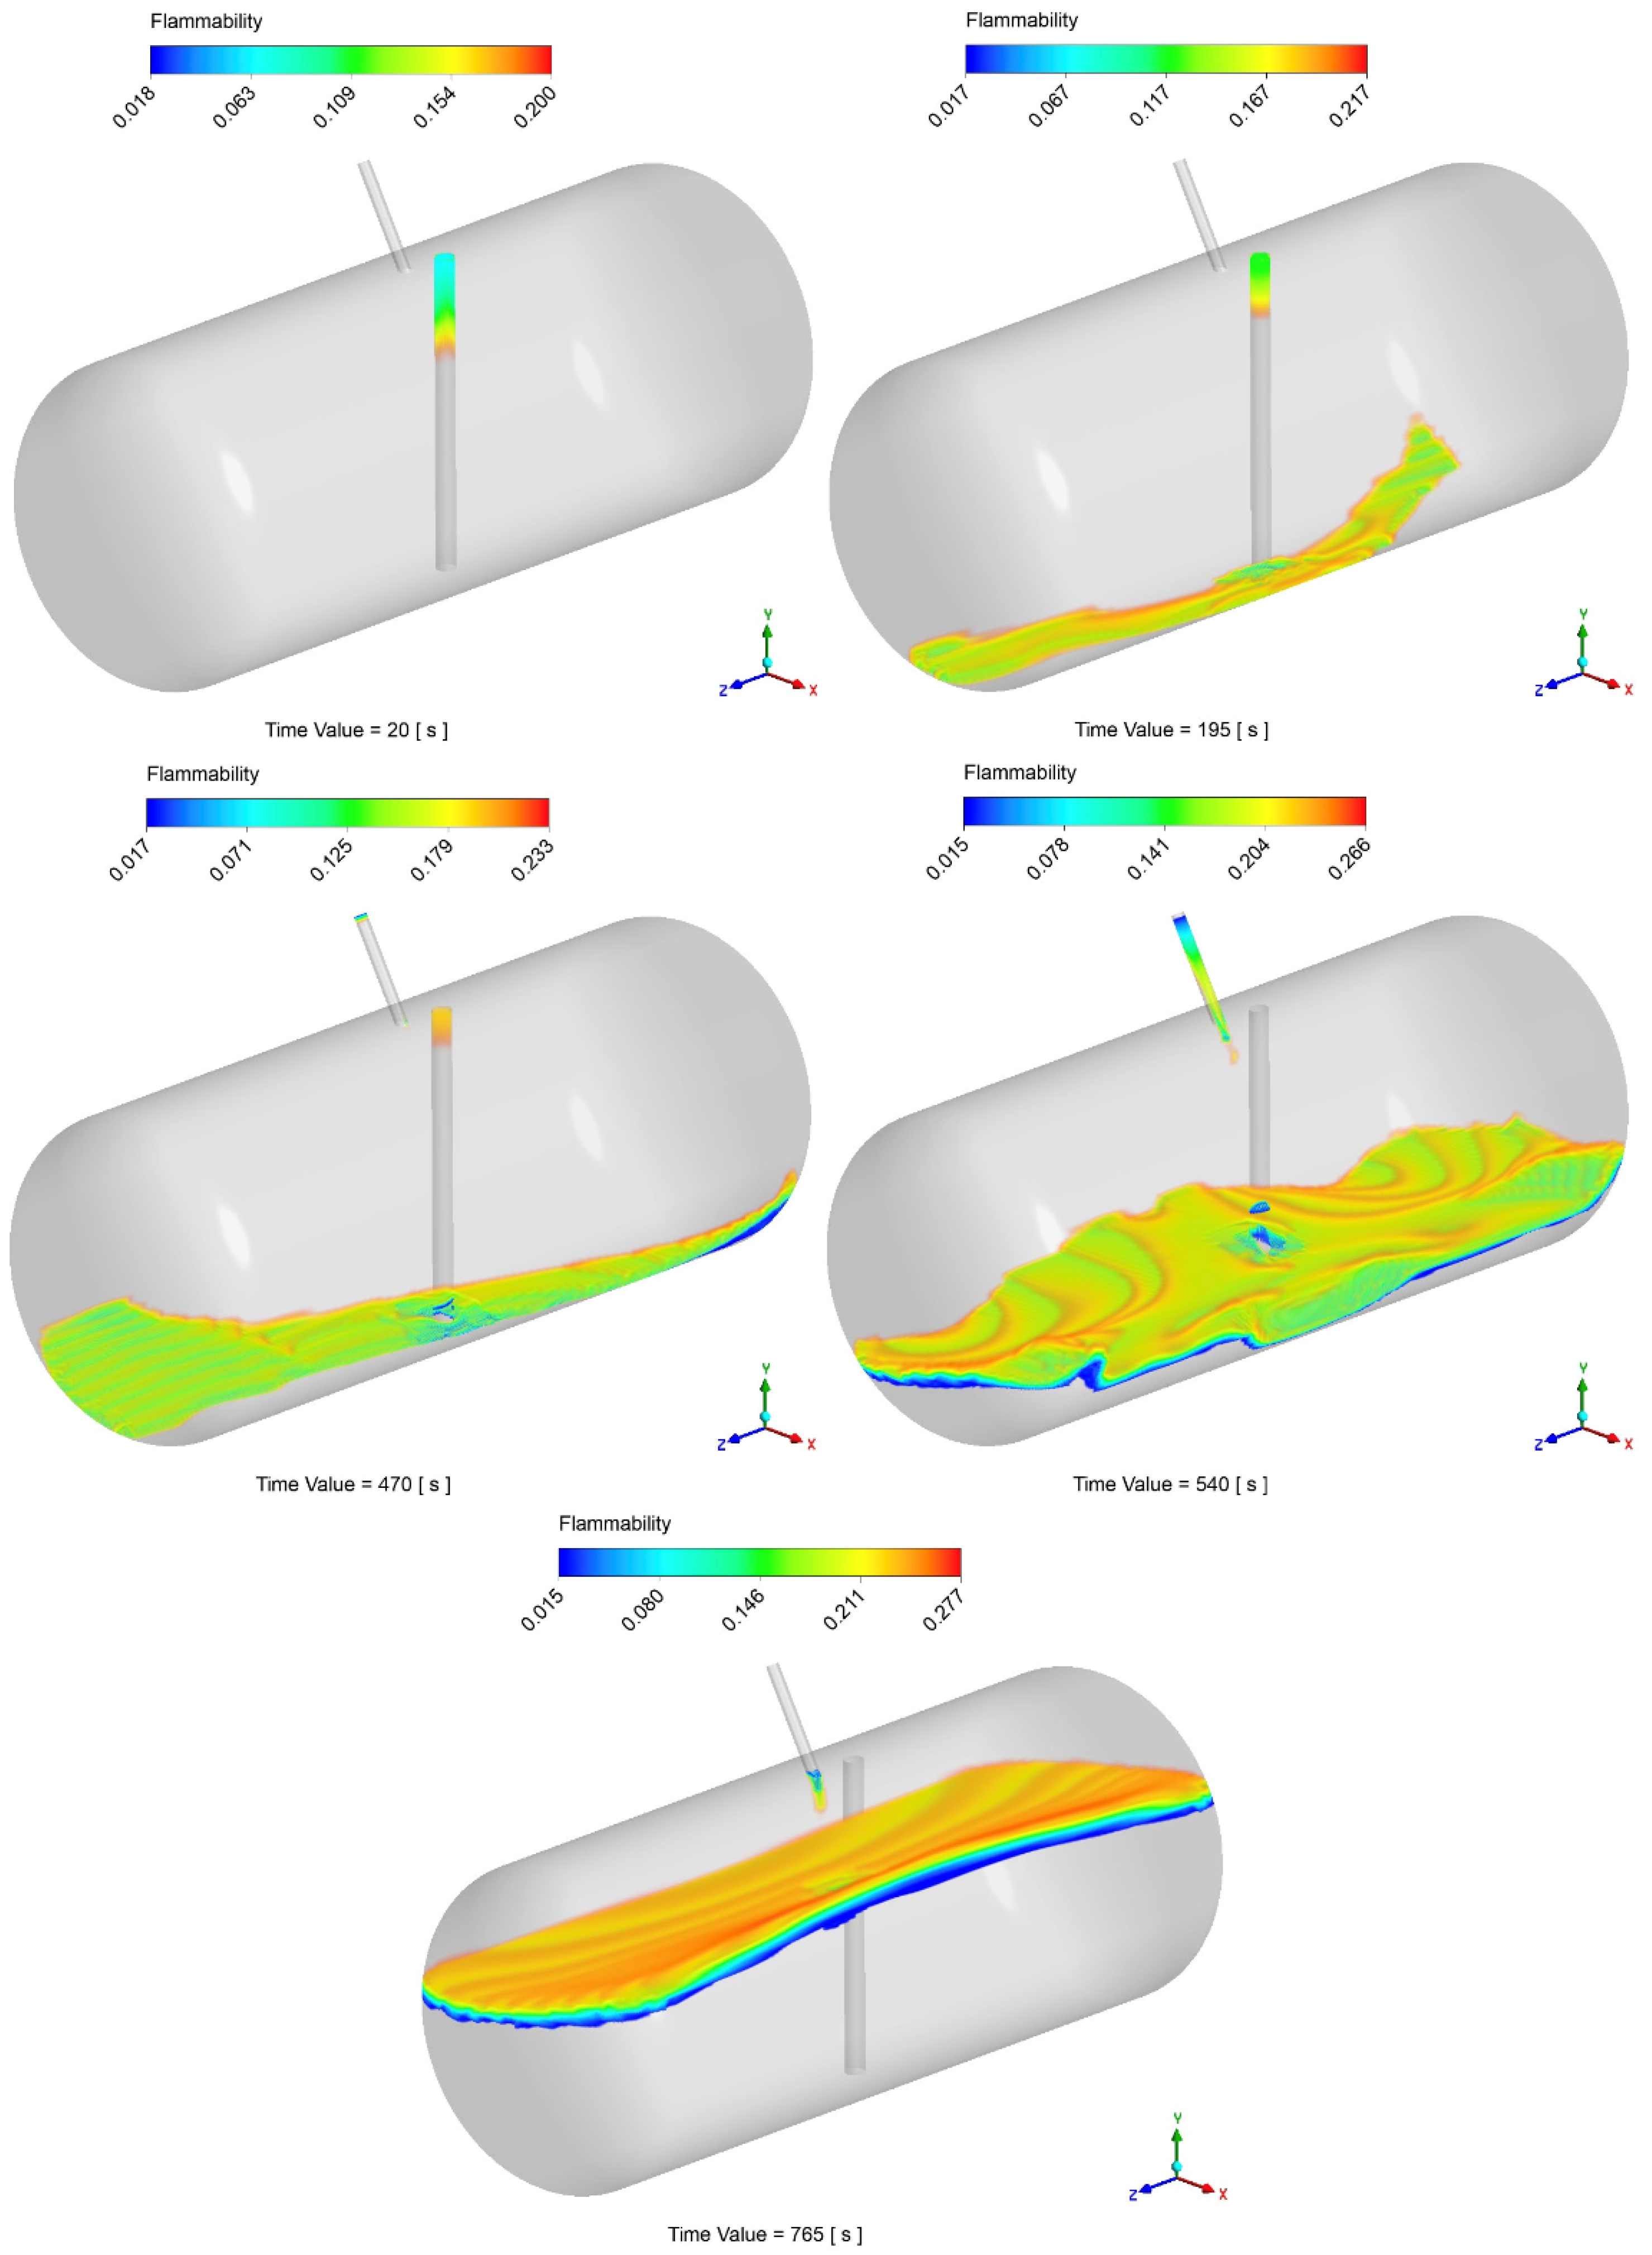
The possibility of local flammable conditions was evaluated through the CFD simulations, as described in Section 2.3. Figure 10 displays the time history of the flammable volume during the filling process. Differently from the analytical model, by looking at this graph, simulations show the presence of a flammable region inside the tank during the entire filling process. During the injection of the first 20 liters of LPG, the flammable volume spikes to about 55% of the total tank volume. This is due to the flash expansion of the LPG and its mixing with air leading to inevitable flammable conditions. After 10 s, the volume concentration becomes greater than the UFL, therefore minimizing the flammable volume to about 0.5% of the total. During the last filling step (as reported in Section 2.6), the flammable volume starts to rise again, stabilizing at a final value of about 3%. After the initial spike, by looking at the results reported in Figure 11, that flammable region seems to be limited to the zone around the gas–liquid interface. However, the localized flammable region is unlikely to have caused the explosion of the tank, especially given its limited extension and the absence of burnt areas found in the tank.
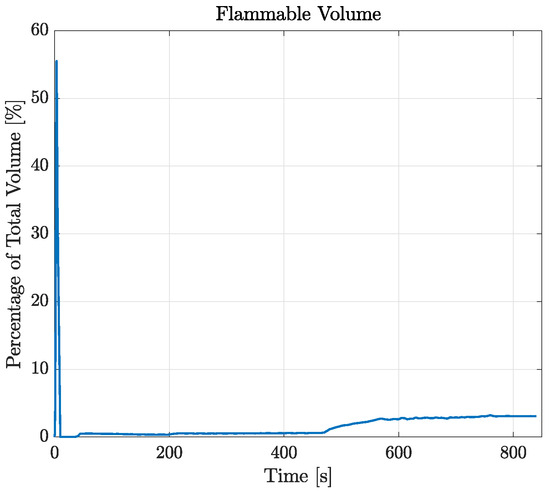
Figure 10.
Temporal variation in flammable volume for the case RSA-IN-60.

Figure 11.
Example of temporal variation in the flammable volume during the filling process.
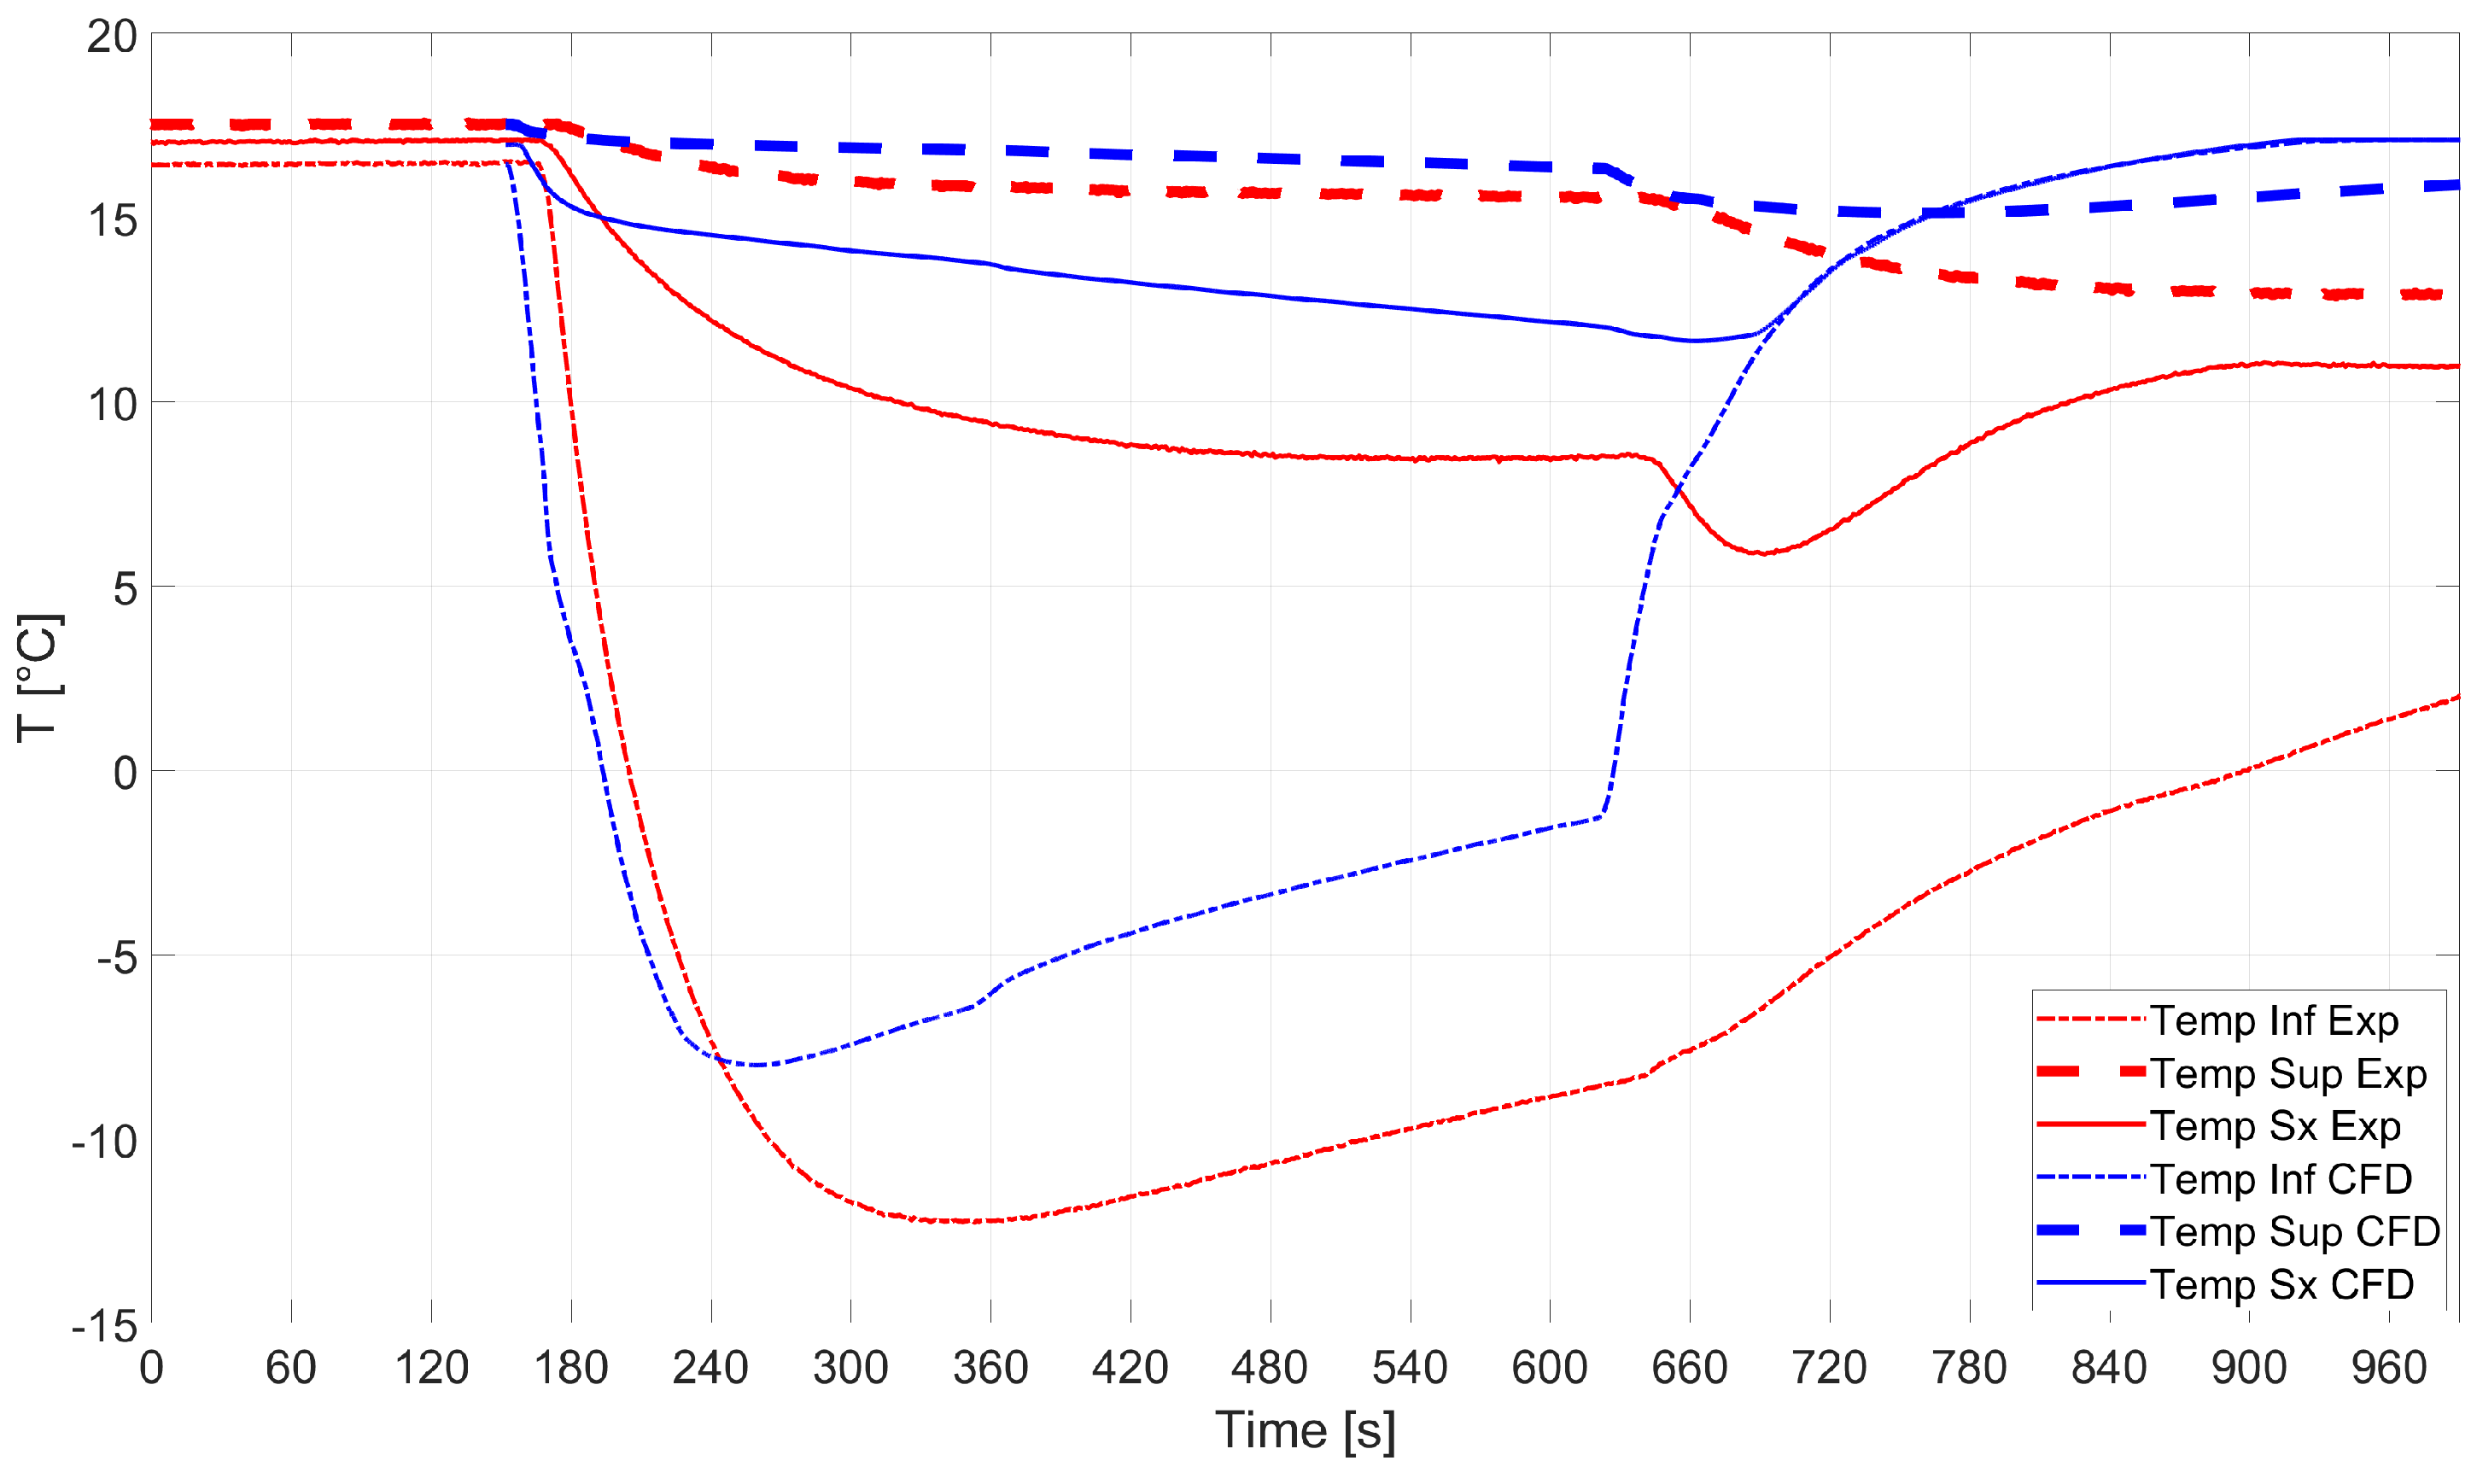
All the findings reported above were consolidated by validating the analytical and CFD analyses against experiments. The comparison between the temperature evaluated by means of the numerical simulations and that from the sensors installed on the experimental tank is shown in Figure 12. Good predictions of the temperature measured by sensors Sup and Sx were found, while sensor Inf got frozen during the experimental campaign and measured incorrect temperature values. The average temperature measured by the sensors after the operations were over was 11.9 °C. Sensor Inf was neglected in the calculations for the reason mentioned above.
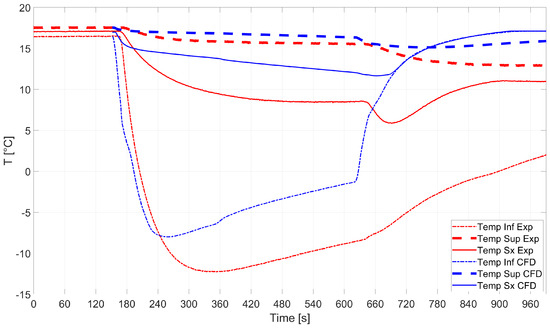
Figure 12.
RSA-IN-60: comparison between numerics and experiments.
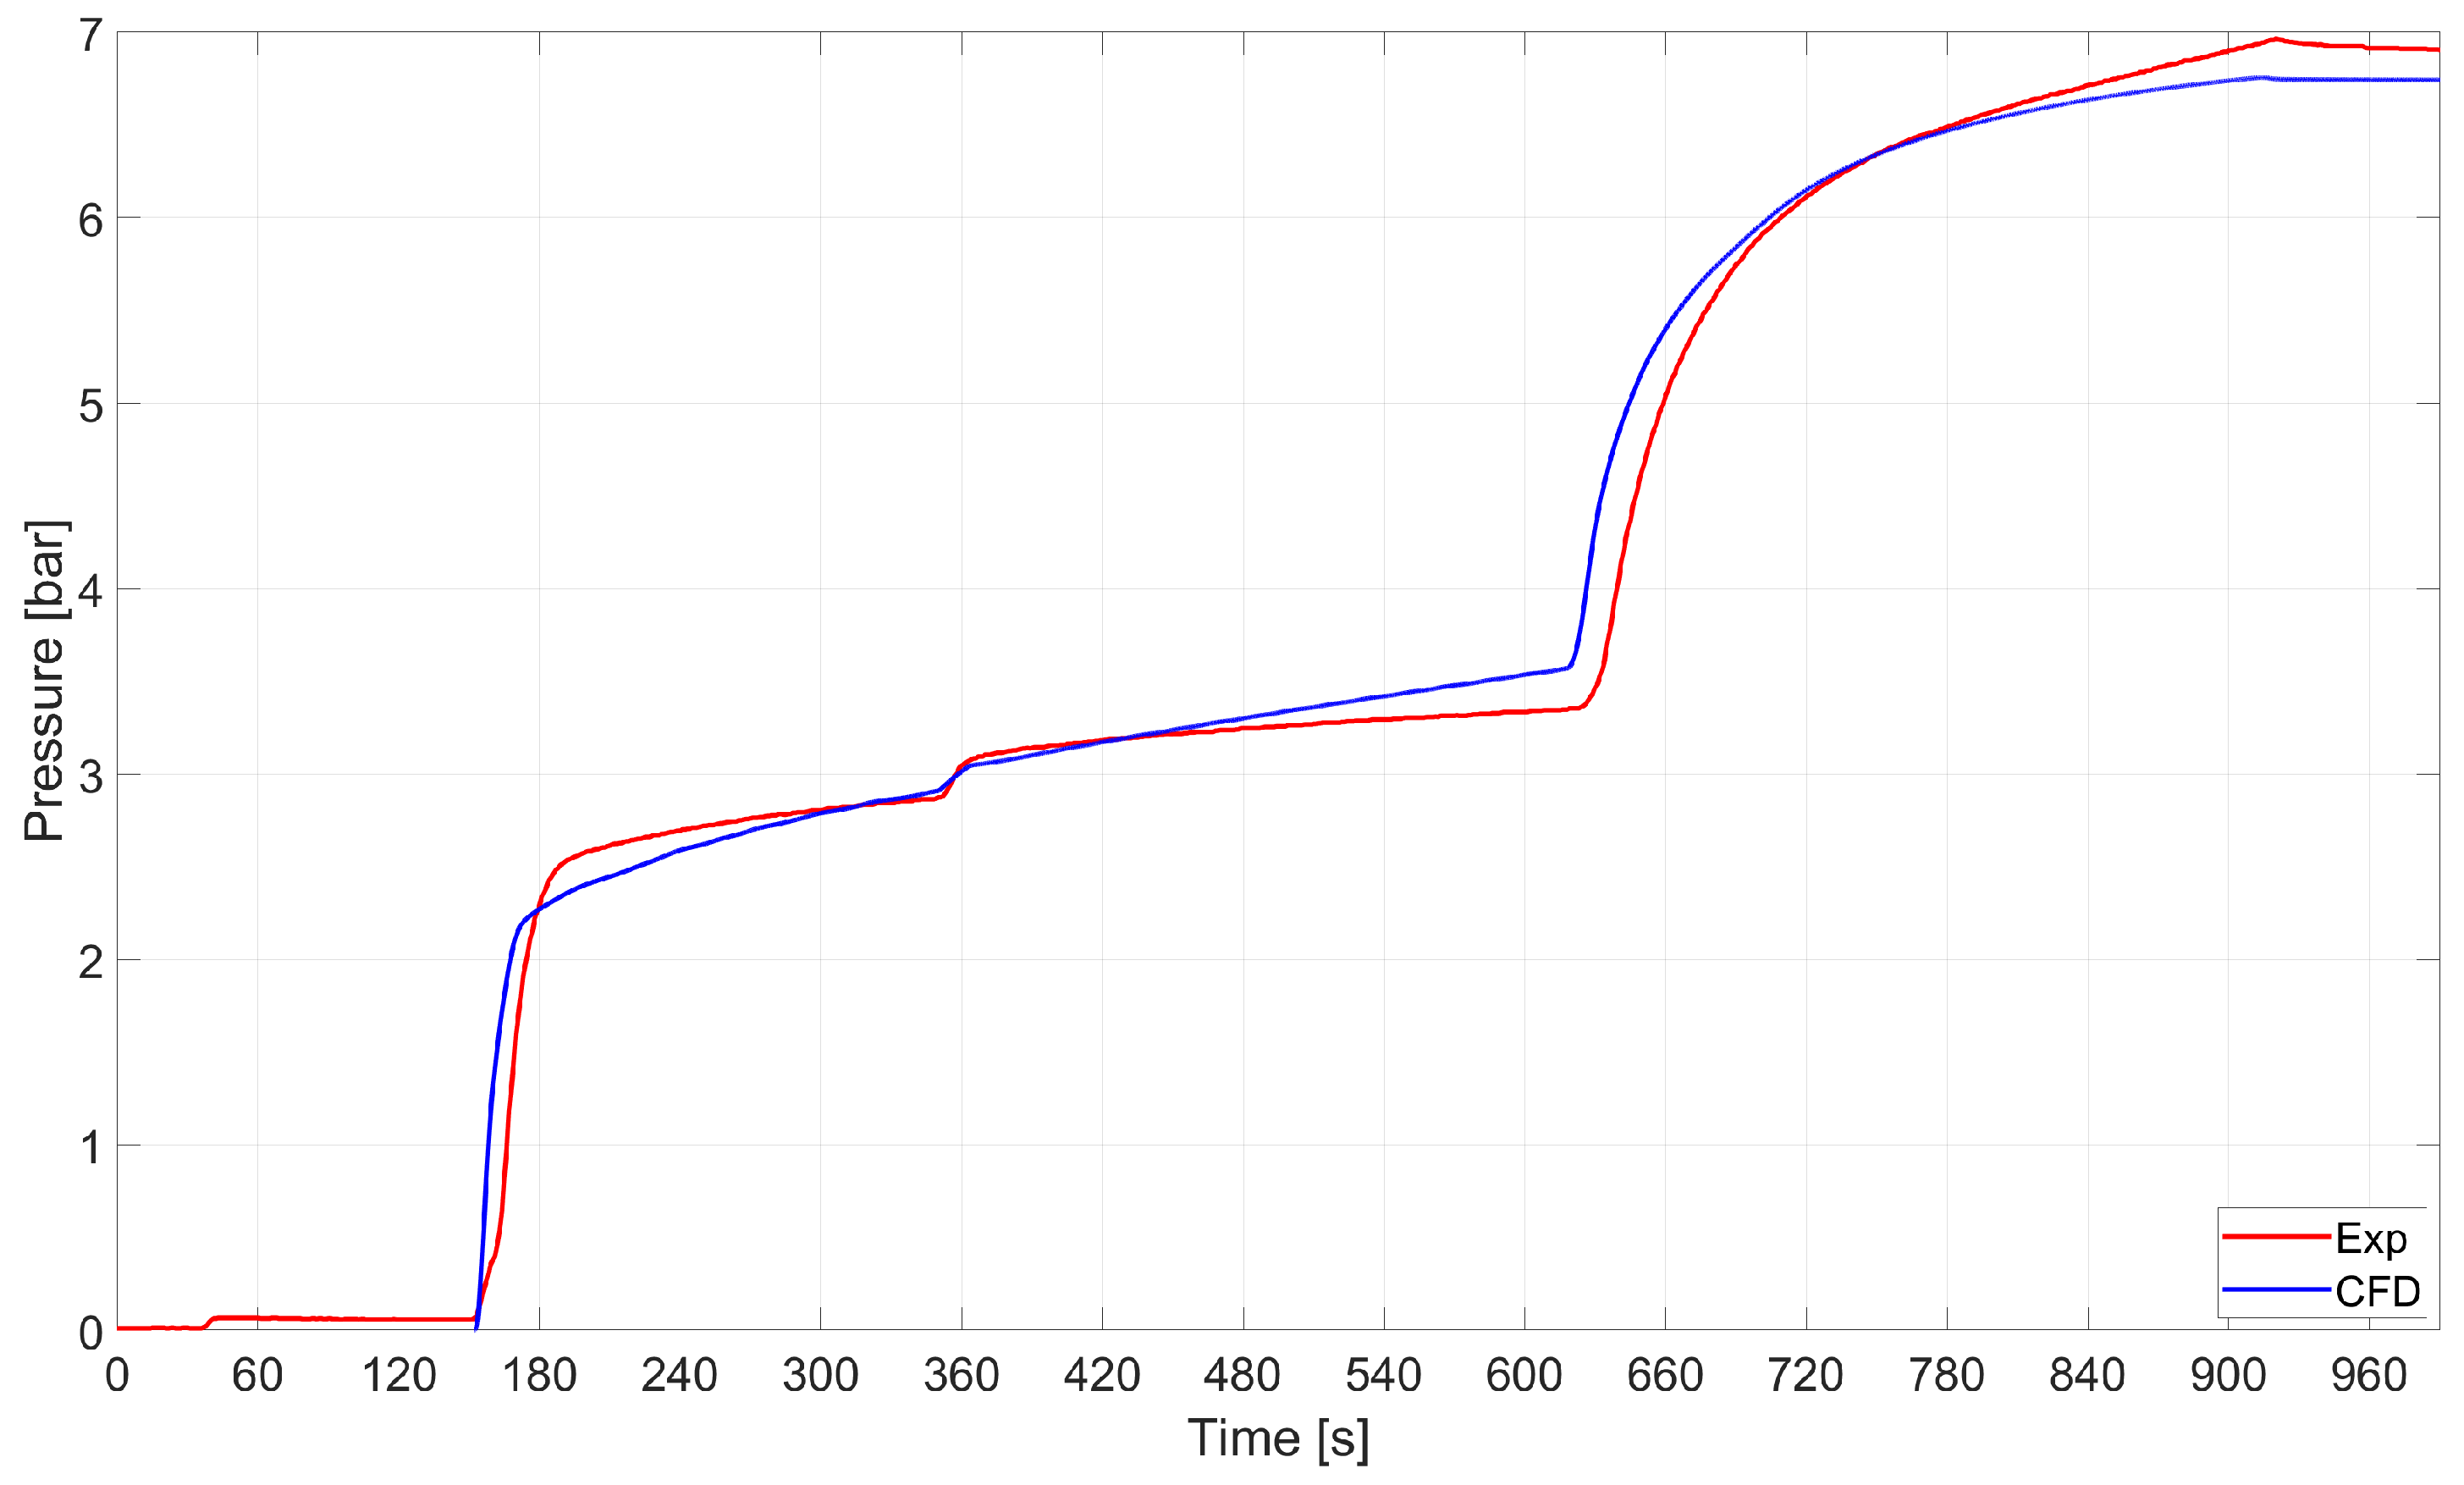
Pressure–time histories are compared in Figure 13. It turned out that the CFD model accurately captured the average pressure–time history.
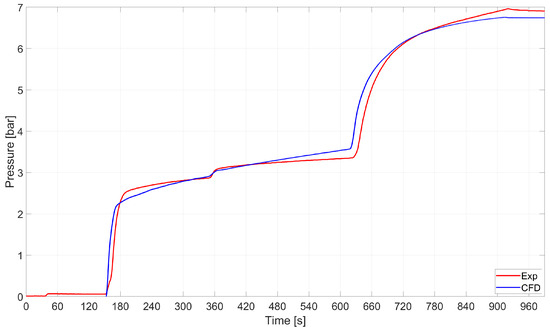
Figure 13.
RSA-IN-60: comparison between the average pressure in the tank as computed by numerics and experiments.
Finally, two samples were considered for test RSA-IN-60. The experimental findings revealed that the concentration of LPG in the ullage was 78.6%mol and 84.7%mol, while the analytical model predicted an average concentration of 85.1%mol.
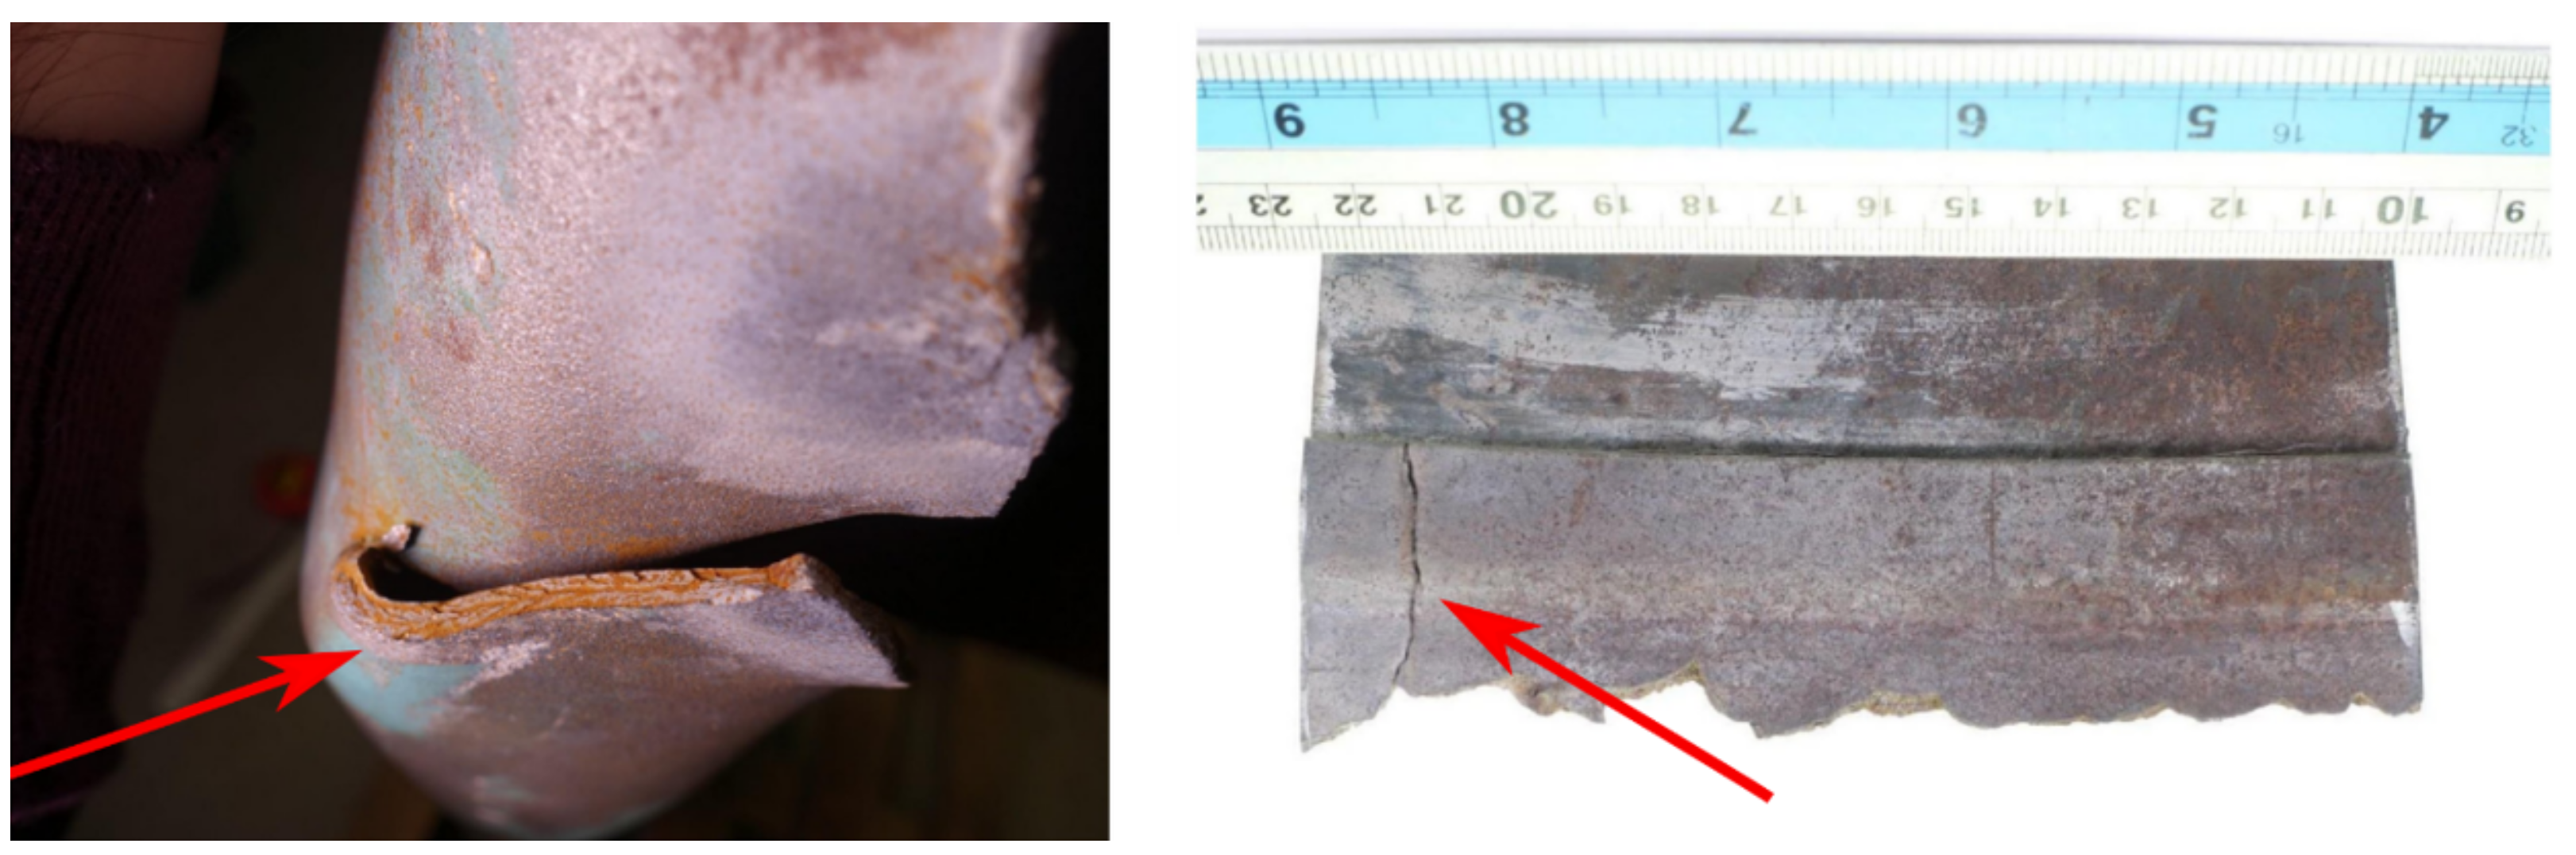
All the models developed for evaluating the possibility that the tank burst due to the ignition of the gas mixture brought evidence that this was not the cause of the accident. Hence, the likelihood that the burst was caused by the presence of cracks was evaluated through the models described in Section 2.4. The possible unstable propagation of the through-the-thickness crack shown in Figure 14 was evaluated through the FAD analysis. The results are shown in Figure 15. The analytical method revealed that a crack with length would have been critical enough to make the tank fail due to the combination of static and fatigue failure mechanisms. Note that the FAD analysis did consider the effect of residual stresses close to the weld line where the analyzed crack was found. That is, the identified critical length is conservative, meaning that a shorter crack would already have led to the tank burst.
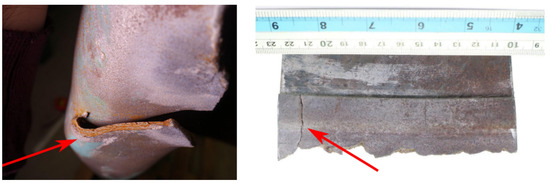
Figure 14.
Crack under assessment.
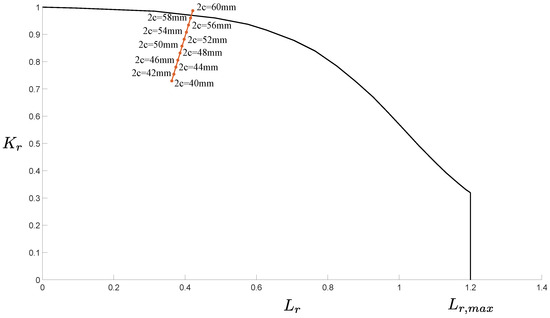
Figure 15.
FAD of the identified crack.
Finally, the analytical model described in Section 2.5 was used to verify if the distance at which the body of the operator was found after the accident was compatible with the identified causes of the burst. The body was assumed to weigh 80 . The results of the investigation are shown in Figure 16. Note that the detachment angle was left as a parameter, since it could not be predicted a priori based on the available data.
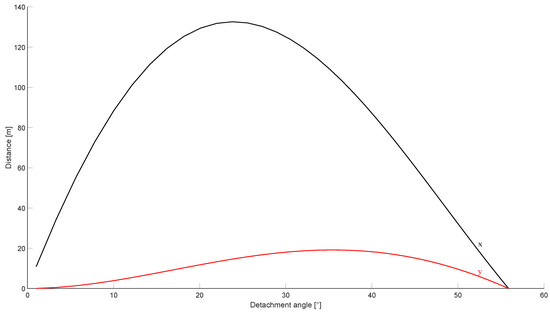
Figure 16.
Motion of a body on top of the tank after the burst. The black line identifies the horizontal coordinate, while the red line shows the maximum height reached by the body.
The results showed that the maximum distance at which the body would be thrown after the burst was compatible with the observed events. In fact, the body was found at from the tank, while the analytical model showed that a theoretical distance of was expected. The theoretical distance was expected to be higher than the observed distance, since no drag effect was retained in the analytical formulation.
4. Conclusions
This work presented an in-depth investigation of the burst of an LPG tank in Gravedona, Italy. The accident was studied through a multifaceted approach involving analytical methods, numerics, and experiments. That is, an analytical lumped system model was developed to predict the thermodynamic properties of the LPG–air mixture during the filling process. This model only provided information about the global mixture’s flammability. Hence, local effects overlooked by the analytical approach were captured by computational fluid dynamics (CFD) simulations. Then, a fracture assessment diagram (FAD) analysis was conducted to investigate the the mechanical health of the tank, particularly focusing on cracks. Finally, all models described above were validated though an extensive experimental campaign. This involved simulating various filling procedures under controlled conditions to gather empirical data on pressure, temperature, and other relevant parameters. The key findings from this investigation are summarized below:
- lammability Analysis: According to the analytical lumped system model, the air–LPG mixture did not reach global flammable conditions. Instead, the local assessment performed by means of computational fluid dynamics (CFD) simulations revealed the presence of flammable regions, particularly around the gas–liquid interface. However, given the absence of burnt areas found in the tank, and considering the small extension of the identified flammable region, the ignition of the mixture was not the primary cause of the burst. Still, the results show that both global and local analyses should be carried out to fully investigate failures.
- Mechanical Failure Analysis: A critical crack length of 58mm was identified, beyond which the tank would fail due to a combination of static and fatigue failure mechanisms. This finding, along with the presence of chevron marks, suggest that the burst was primarily caused by mechanical failure rather than an explosive mixture ignition.
- Dynamic Response Analysis: The analytical model developed for describing the tank’s dynamics after the burst confirmed that the observed displacement of the operator’s body was consistent with the forces and moments generated by the sudden release of pressurized gases. This model validated the proposed scenario and demonstrated the plausibility of the observed accident dynamics.
- Experimental Validation: Experiments were carried out to validate the developed models. The pressure and temperature data collected during controlled filling procedures matched the analytical and numerical results. Similarly, the gas mixture composition from the experiments was accurately predicted by the analytical lumped system model.
In conclusion, the burst of the LPG tank was likely due to mechanical failure. The identified accident dynamics were identified through a comprehensive approach combining analytical models, CFD simulations, and experimental validation. Such an approach represents a robust framework for understanding similar accidents and can be used for offering insights for predicting and preventing similar occurrences in the future.
Author Contributions
Conceptualization, L.L., F.C. and M.G.; Methodology, L.L. and R.M.; Software, L.L. and S.P.; Validation, L.L., S.P. and R.M.; Formal Analysis, L.L., R.M. and M.G.; Investigation, L.L., S.P., R.M. and M.G.; Resources, R.M. and M.G.; Data Curation, L.L. and S.P.; Writing—Original Draft Preparation, L.L. and S.P.; Writing—Review and Editing, L.L. and S.P.; Visualization, L.L. and S.P.; Supervision, R.M. and M.G.; Project Administration, M.G.; Funding Acquisition, M.G. All authors have read and agreed to the published version of the manuscript.
Funding
This research received no external funding.
Data Availability Statement
The data presented in this study are available on request from the corresponding author.
Conflicts of Interest
The authors declare no conflict of interest.
References
- Arturson, C. Analysis of severe fire disasters. In The Management of Mass Burn Casualties and Fire Disasters: Proceedings of the First International Conference on Burns and Fire Disasters; Masellis, M., Gunn, S., Eds.; Springer: Dordrecht, The Netherlands, 1992; pp. 24–33. [Google Scholar] [CrossRef]
- Wang, K.; Hu, Q.; Qian, X.; Li, M.; Shi, T. Cause analysis and damage mechanism of explosive destruction with case investigation involving LPG tank trailer. Eng. Fail. Anal. 2022, 133, 106002. [Google Scholar] [CrossRef]
- Gamas, E.D.; Magdaleno, M.; Diaz, L.; Schifter, I.; Ontiveros, L.; Alvarez-Cansino, G. Contribution of Liquefied Petroleum Gas to Air Pollution in the Metropolitan Area of Mexico City. J. Air Waste Manag. Assoc. 2000, 50, 188–198. [Google Scholar] [CrossRef] [PubMed]
- Arturson, G. The tragedy of San Juanico—The most severe LPG disaster in history. Burns 1987, 13, 87–102. [Google Scholar] [CrossRef] [PubMed]
- Arturson, G. The los alfaques disaster: A boiling-liquid, expanding-vapour explosion. Burns 1981, 7, 233–251. [Google Scholar] [CrossRef]
- Lyu, S.; Zhang, S.; Huang, X.; Peng, S.; Li, J. Investigation and modeling of the LPG tank truck accident in Wenling, China. Process Saf. Environ. Prot. 2022, 157, 493–508. [Google Scholar] [CrossRef]
- Yang, D.; Peng, K.; Zheng, J.; Xie, B.; Wang, J.; Xu, B.; Li, F. Consequences analysis of the LPG tank truck traffic accident: A case study of the Wenling explosion accident. J. Loss Prev. Process Ind. 2024, 87, 105228. [Google Scholar] [CrossRef]
- Jiao, Y.; Chen, R.; Wang, K.; Fan, X.; Liu, F. Simulation of scenario characteristics of LPG tank explosion accident and its contribution to emergency planning: A case study. J. Loss Prev. Process Ind. 2023, 83, 105066. [Google Scholar] [CrossRef]
- Terzioglu, L.; Iskender, H. Modeling the consequences of gas leakage and explosion fire in liquefied petroleum gas storage tank in Istanbul technical university, Maslak campus. Process Saf. Prog. 2021, 40, 319–326. [Google Scholar] [CrossRef]
- Akpi, A.; MMom, P.; Olanrewaju, L. Liquefied Petroleum Gas Stations Disaster Risk Preparedness Assessment of Port Harcourt City, Nigeria. J. Risk Anal. Crisis Response 2023, 13, 209–219. [Google Scholar] [CrossRef]
- Wang, X.; Shen, X.; Qian, X.; Hu, Q.; Yuan, M.; Li, M.; Jiang, J. Case study of fire and explosion accident based on damage consequence and numerical results: Explosion medium traceability. Case Stud. Therm. Eng. 2023, 49, 103171. [Google Scholar] [CrossRef]
- Database of Weather Forecasts From 3B Meteo. Available online: https://www.3bmeteo.com/meteo/gravedona+ed+uniti/storico/201907 (accessed on 7 April 2020).
- Zabetakis, M.G. Flammability Characteristics of Combustible Gases and Vapors; Technical Report; Bureau of Mines: Pittsburgh, PA, USA, 1964. [Google Scholar]
- Lee, W.H. A pressure iteration scheme for two-phase flow modeling. Multiph. Transp. Fundam. React. Safety, Appl. 1980, 1, 407–431. [Google Scholar]
- Fluent, A. 2020R2 Theory Guide; ANSYS Inc.: Canonsburg, PA, USA, 2020. [Google Scholar]
- Lemmon, E.W. Thermophysical properties of fluid systems. NIST Chemistry WebBook. Available online: https://webbook.nist.gov/chemistry/fluid/ (accessed on 17 July 2024).
- BS 7910:2005; Guide to Methods for Assessing the Acceptability of Flaws in Metallic Structures. Institution, B.S.: London, UK, 2005.
- United States Department of Agriculture N.R.C.S. Soil Bulk Density Moisture Aeration. Available online: https://www.nrcs.usda.gov/sites/default/files/2022-10/Soil%20Bulk%20Density%20Moisture%20Aeration.pdf (accessed on 17 July 2024).
- ASSOGASLIQUIDI. PRIMO RIFORNIMENTO DI SERBATOI DESTINATI ALL’INSTALLAZIONE IN DEPOSITI DI GPL SOGGETTI AL D.M. 14.5.2004.

Disclaimer/Publisher’s Note: The statements, opinions and data contained in all publications are solely those of the individual author(s) and contributor(s) and not of MDPI and/or the editor(s). MDPI and/or the editor(s) disclaim responsibility for any injury to people or property resulting from any ideas, methods, instructions or products referred to in the content. |
© 2024 by the authors. Licensee MDPI, Basel, Switzerland. This article is an open access article distributed under the terms and conditions of the Creative Commons Attribution (CC BY) license (https://creativecommons.org/licenses/by/4.0/).