Abstract
Fluid components in cores are crucial parameters in evaluating the quality of a shale reservoir in both laboratory analyses and log interpretation. In the Gulong area, shale reservoirs are characterized by a high clay content, with clay spaces hosting both oil and water phases, complicating the occurrence mechanism of fluid components, as a result, traditional research methods are no longer applicable. As an advanced technique, nuclear magnetic resonance (NMR) has been applied in oilfields to determine the specific petrophysical properties of rocks. To more accurately identify the types of fluid components, this study carried out a new, well-designed 2D NMR experiment, rock pyrolysis experiment, and quantitative oil and water detection experiment (QOWDE) to study the Gulong shale. This study measured the 2D NMR map of the original state, saturation state, centrifugal state, and pyrolysis at different temperatures, and conducted mutual verification between the QOWDE and 2D NMR pyrolysis experiments to obtain the distribution of different components of Gulong shale on the 2D NMR map. Based on the experimental results, this study developed a component identification template suitable for the Gulong area and calculated the 2D NMR porosity and saturation from it. This lays a foundation for the analysis and application of fluid components in the Gulong region and provides a new experimental basis and methodological support for porosity and saturation calculations.
1. Introduction
As conventional resource reserves gradually diminish, unconventional oil and gas reservoirs have increasingly attracted widespread attention [1]. In particular, shale oil, an unconventional oil and gas resource with significant potential, has become a research focus in recent years [2]. Nonetheless, the complexity of shale oil’s microporosity, fractures, storage spaces, and occurrence mechanisms, renders many traditional methodologies inapplicable in the field of shale oil research [3].
The research on shale oil reservoirs usually focuses on parameters such as porosity and hydrocarbon saturation [4,5]. Nevertheless, with the continued advancement of shale oil exploration, the analysis of the components within the shale oil reservoirs has emerged as a critical evaluative metric [6]. Shale oil components are essential for elucidating the mechanisms of shale oil genesis and critical variables in studying the interactions between oil, water, and rock within the shale’s pore space [7]. Determining how to objectively and accurately evaluate the fluid and non-fluid components within shale oil reservoirs, and precisely characterize parameters such as oil saturation and mobile oil saturation, is a critical issue in contemporary shale oil reservoir studies [8]. However, the intricate microporosity structures and mineral components of shale oil reservoirs raise significant challenges for the study of reservoir components [9,10]. Currently, the main methods employed in laboratories for analyzing these components include the heating release method, nuclear magnetic resonance (NMR), and fluorescence analysis.
The most common technique for the study of shale fluid composition is the heating release method [11]. This method operates on the principle of exploiting the distinct thermal properties of various fluid components. By gradually increasing the temperature to heat the shale samples, the fluid components are volatilized gradually. Investigating the properties of the components volatilized at different temperatures allows for the classification and evaluation of the shale fluid components [12]. A common technique for the heating release method is rock pyrolysis, an analytical approach for quantitatively detecting hydrocarbon content within rock samples. It determines parameters, including S0, S1, S2, and S3, which are critical for evaluating the oil richness and fluid characteristics of a reservoir. This technique is also instructive in guiding the determination of oil saturation and the forecasting of a reservoir’s production potential [13].
However, numerous current studies indicate that the S1 does not reflect the entirety of moveable oil, and S2 does not solely represent the hydrocarbons produced from the pyrolysis of kerogen, which includes both pyrolytic hydrocarbons and a small amount of free and adsorbed oil, making it difficult for this pyrolysis method to provide an accurate classification of shale components [14]. Some researchers reclassified shale components through a revised temperature sequence, building upon the foundation of rock pyrolysis. Jiang et al. [15] performed pyrolysis experiments on shale oil samples, utilizing a Rock-Eval6 pyrolyzer and a Humble pyrolysis chromatograph. They designed a novel temperature sequence for pyrolyzing the samples and employed chromatographic analysis to both qualitatively and quantitatively assess the components released at various temperatures; as a result, they were able to distinguish the various fluid components more effectively. However, this method still has some limitations, as it does not analyze the occurrence state of water in shale. This omission results in an incomplete study of fluid components in shale oil reservoirs. Nevertheless, the technique of modifying the temperature sequence for pyrolysis experiments on shale samples provides a novel perspective to the field.
Fluorescence analysis is predicated on the principle that hydrocarbons in rock samples exhibit fluorescence when illuminated by ultraviolet light. The characteristics of this fluorescence depend on the hydrocarbons’ molecular structures, with variations in these structures and their content leading to distinct fluorescence colors and intensities [16]. The spectral hue of fluorescence in shale samples is influenced by the presence and attributes of hydrocarbon components, including asphaltenes. The fluorescence color can judge the hydrocarbons’ characteristics, and the fluorescence intensity can serve as an indicator of the content levels for these hydrocarbon components [17]. The spectral distribution of fluorescence within shale samples enables the assessment of hydrocarbon composition and its spatial distribution, thus supporting the analysis of reservoir components and the evaluation of hydrocarbon content [18]. However, fluorescence analysis is limited to the examination of sample slices. The intricate pore structure and fluid composition of shale oil reservoirs, characterized by micropores and nanopores, results in low-resolution fluorescence images that cannot provide an accurate analysis of these reservoirs. This limitation will further cause inaccurate assessment of hydrocarbon content.
NMR capitalizes on the resonant properties of atomic nuclei possessing magnetic moments in a magnetic field, which is adept at assessing shale samples. Since the majority of magnetic nuclei present are hydrogen nuclei (1H) in shale samples, NMR enables the acquisition of signals from both hydrocarbon and aqueous phases within the samples [19]. Furthermore, NMR is capable of analyzing bulk samples, remedying the shortcomings of thermo-release techniques and fluorescence analysis. NMR techniques can be categorized into one-dimensional T2 (1D T2) NMR and two-dimensional T1-T2 (2D T1-T2) NMR [20]. The 1D T2 method is typically employed for determining porosity. However, this method has a drawback in fluid component analysis: the overlap of oil and water signals in the T2 map may obscure the clarity of fluid component differentiation when they reside in pores of similar size. In NMR, the longitudinal relaxation time, denoted by T1, is greatly affected by the intrinsic properties of the constituents [21,22,23,24,25]. Consequently, the 2D NMR T1-T2 technique can effectively discriminate between diverse fluid components and facilitate the identification of solid and semi-solid organic substances, including kerogen and asphaltenes. Researchers usually utilized 2D NMR for conducting rock physics experimental measurements and identifying fluid components in shale samples. Studies have shown that the 2D NMR technique can effectively discern fluid components and solid organic matters [26,27,28,29,30,31,32,33,34,35]. Some researchers conducted integrated geochemical pyrolysis and 2D NMR analyses on crushed samples from shale oil reservoirs. The 2D NMR technique is utilized to differentiate adsorbed and free hydrocarbons, which furnishes a means to assess fluid mobility [36,37]. The results show that 2D NMR is an ideal approach for classifying shale components. Although the 2D NMR T1-T2 method is adept at distinguishing various components, other supplementary methods are still needed to assist in qualitative analysis of individual components.
To address the specific challenges of the shale oil reservoir, this study proposes to utilize the T1-T2 method as a primary analytical approach, analyzing the thermal properties of various components and devising an innovative temperature sequence for pyrolysis. Subsequently, the samples will be subjected to multistage pyrolysis to facilitate the integrated pyrolysis–nuclear magnetic resonance (pyrolysis–NMR) experiments. The T1-T2 map analysis of the samples is also conducted to indicate the shale components based on their T1-T2 map characteristics. Additionally, this study designs quantitative oil and water detection experiments (QOWDEs) for shale oil synchronized with the multistage pyrolysis process. This experiment enables quantitative analysis of the pyrolytic components and validations for the pyrolysis–NMR joint experiments. Finally, this approach aims to classify and quantitatively evaluate the components of the Gulong shale oil reservoir, thus contributing to research on this reservoir.
The shale reservoirs in the Gulong area of the northern Songliao Basin exhibit unique characteristics, including pronounced layered bedding and lamination, elevated clay content, and abundant nanopores [38,39]. In addition, the occurrence mechanism of shale oil within the microporosity fracture system is complex, with part of the clay containing oil and gas. Therefore, related research is of great importance [40,41,42].
2. Samples and Methods
2.1. Experiment Samples
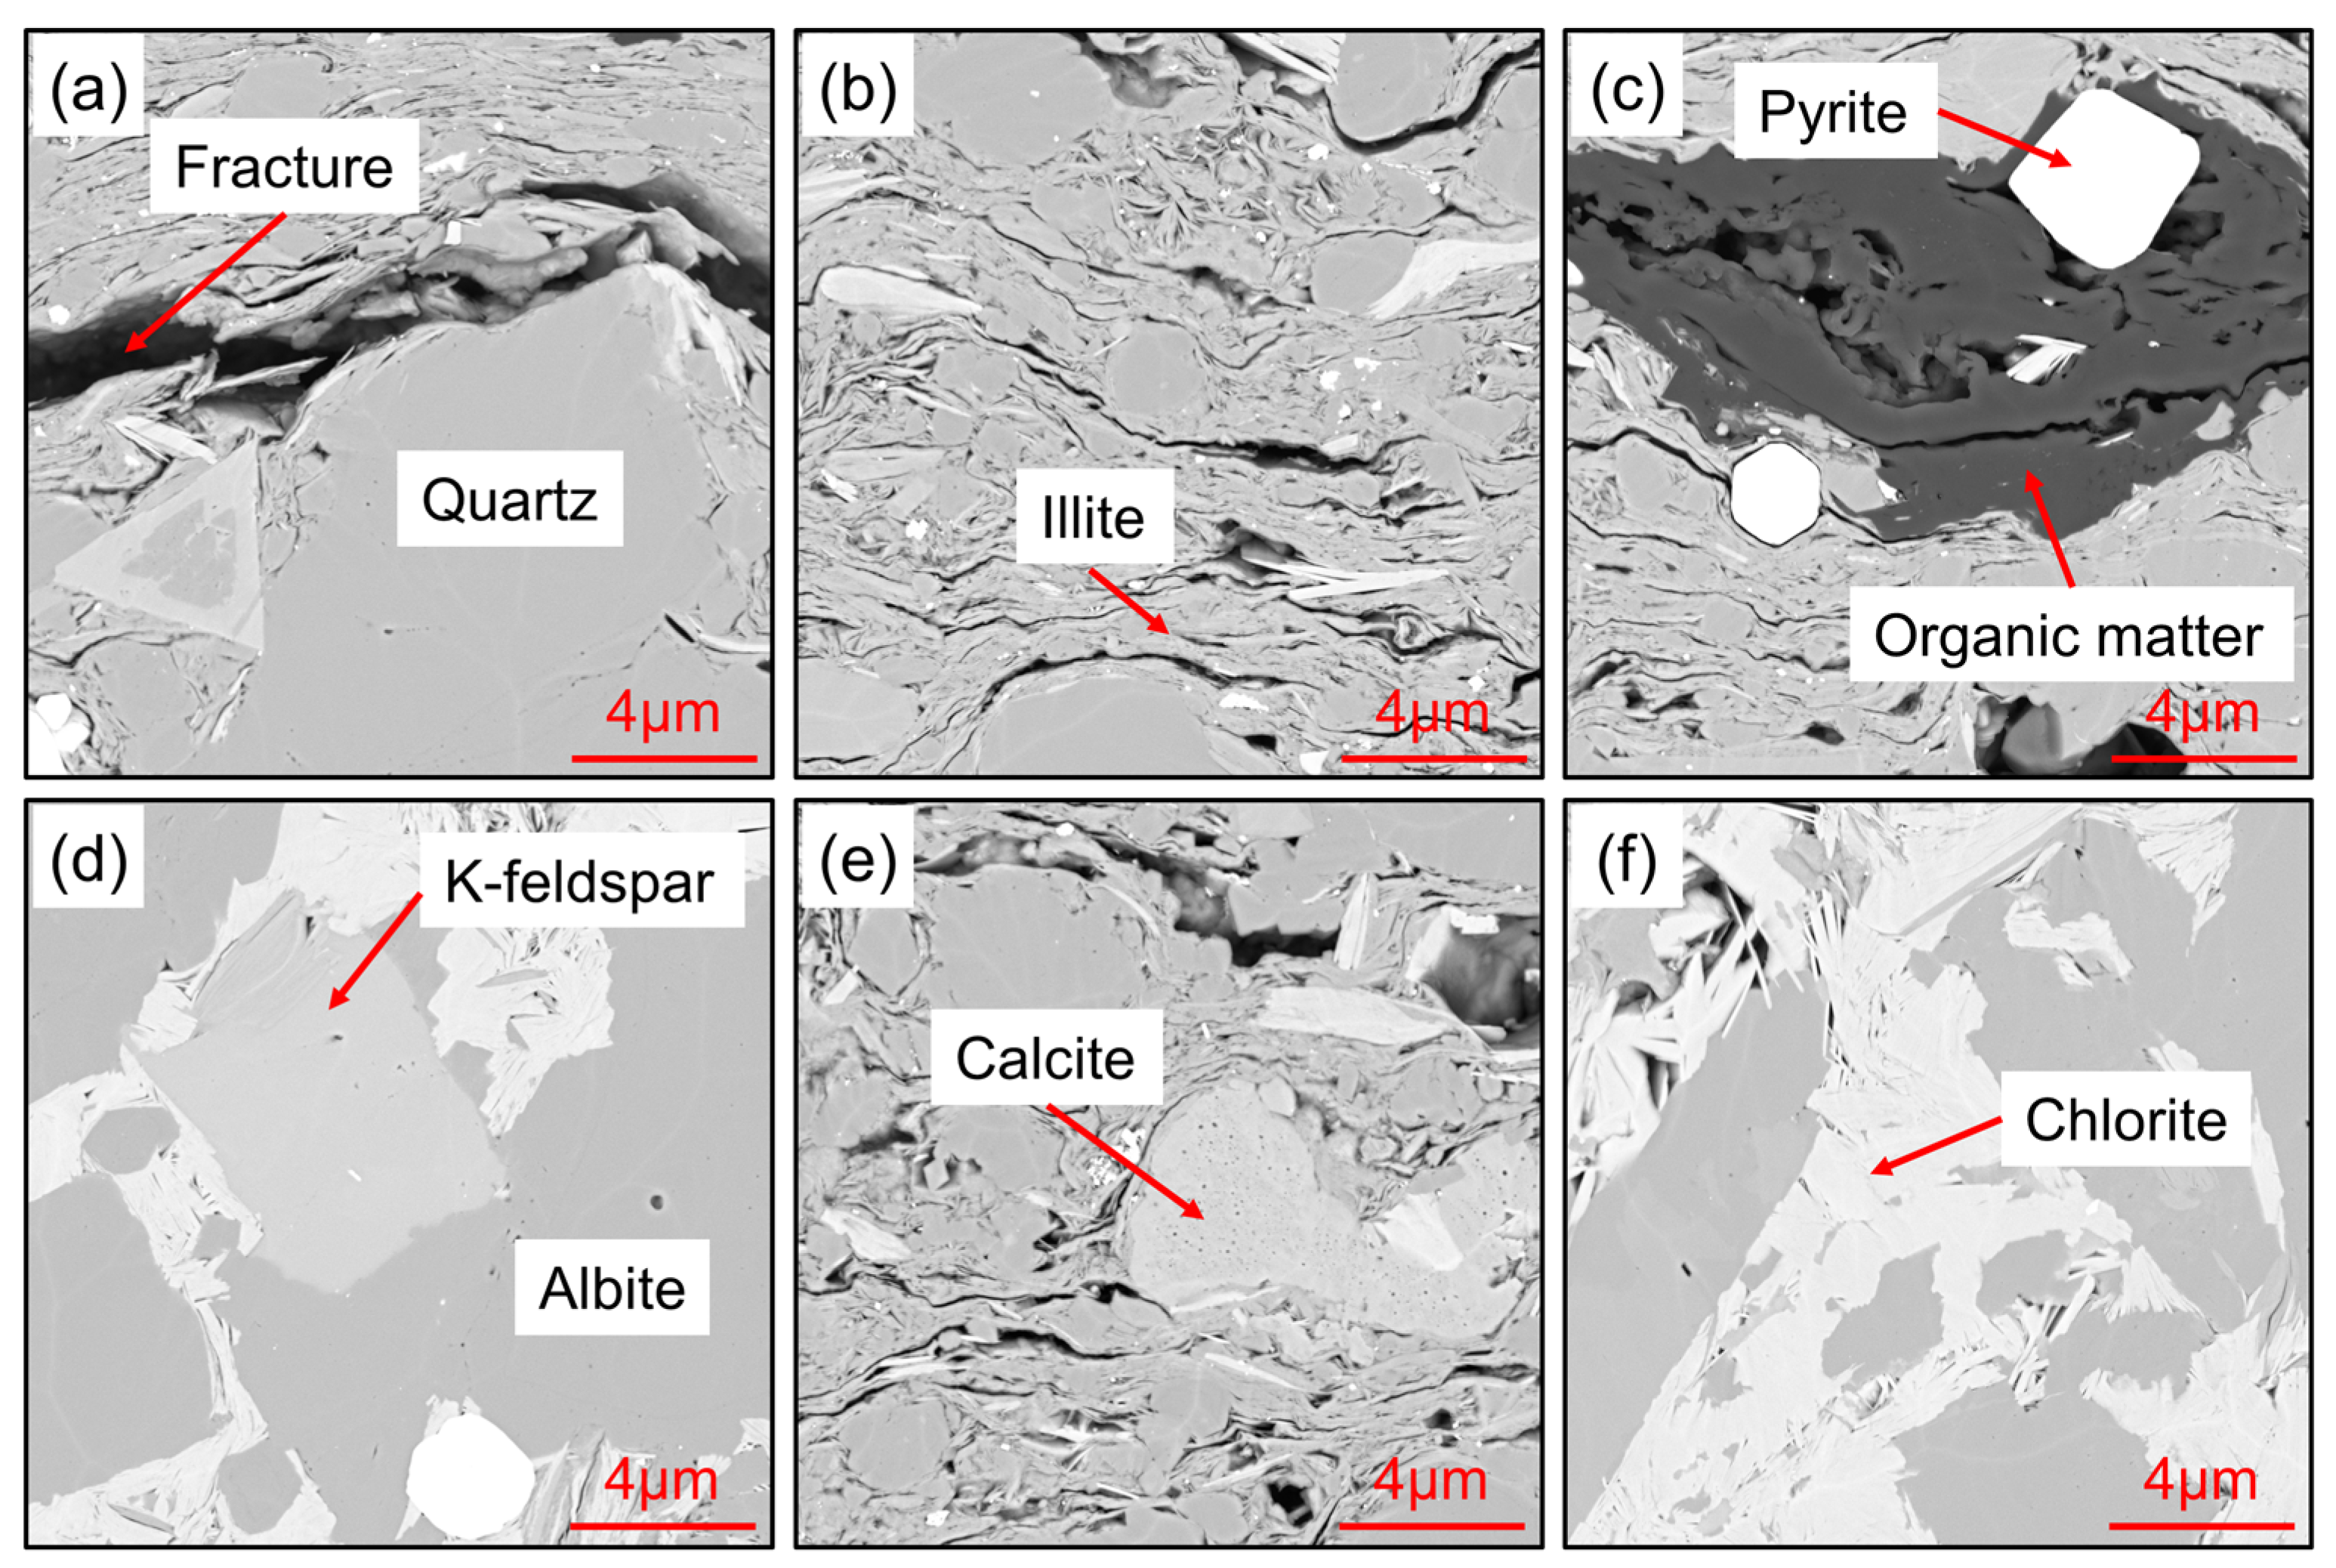
The 10 shale samples used in this study were obtained from the continental facies shale of the Qingshankou formation within the Songliao Basin, Gulong region (Figure 1). The Songliao Basin is located in northeast China and was formed within a large depression belt during the Yanshan Movement. The strata of the Songliao Basin can be divided into lower-fault-depression sedimentary sequences, middle depression sedimentary sequences, and upper-inversion-period sedimentary sequences. The Qingshankou formation studied in this article belongs to the middle depression sedimentary sequence. During the sedimentary period of the Qingshankou formation, the basin was in a post-rift subsidence stage with relatively stable structures. During the first sedimentary period of the Qingshankou formation, water movement formed a large area of the lake basin with abundant organic matter, laying the foundation for the good oil-bearing properties of the Qingshankou formation. The lithofacies of the Qingshankou formation are mainly clayey shale and mixed shale, and the mineral composition is mainly clay minerals, plagioclase, and quartz (Figure 2a,b,d,f), which is characterized by high organic matter content (Figure 2c), high maturity, high clay content, and complex mineral composition [1,2,3,4,5] (Table 1) (Figure 2e). The photographs of core sample photographs reveal the pronounced possession of lamellation and bedding structures [6]. The SEM results from this region display various types of pores and fractures, such as well-developed fractures, organic pores, and inorganic pores, which indicates that the samples are highly representative of high-clay shale.
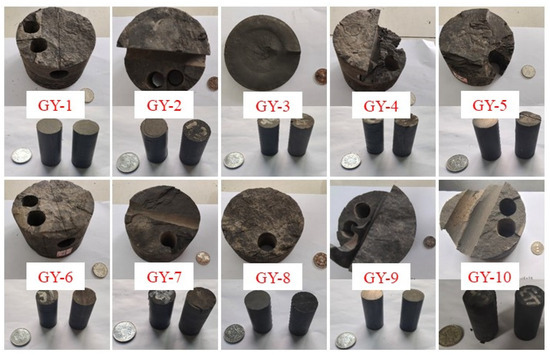
Figure 1.
Photos of 10 shale samples from the Qingshankou formation within the Songliao Basin, Gulong region.
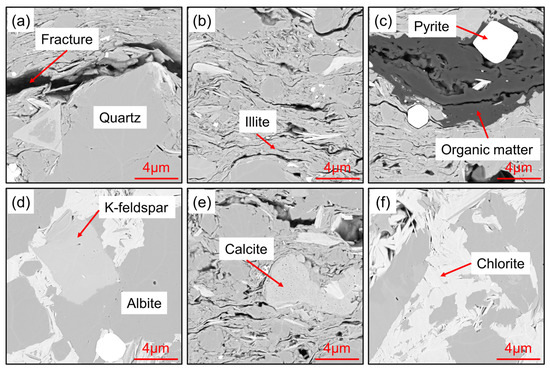
Figure 2.
SEM images of the Qingyi shale in the Gulong area. (a) Fracture and quartz; (b) lllite; (c) pyrite and organic matter; (d) k-feldspar and albite; (e) calcite; (f) chlorite.

Table 1.
XRD information of 10 shale samples from the Qingshankou formation within the Songliao Basin, Gulong region.
2.2. Experiment Methods
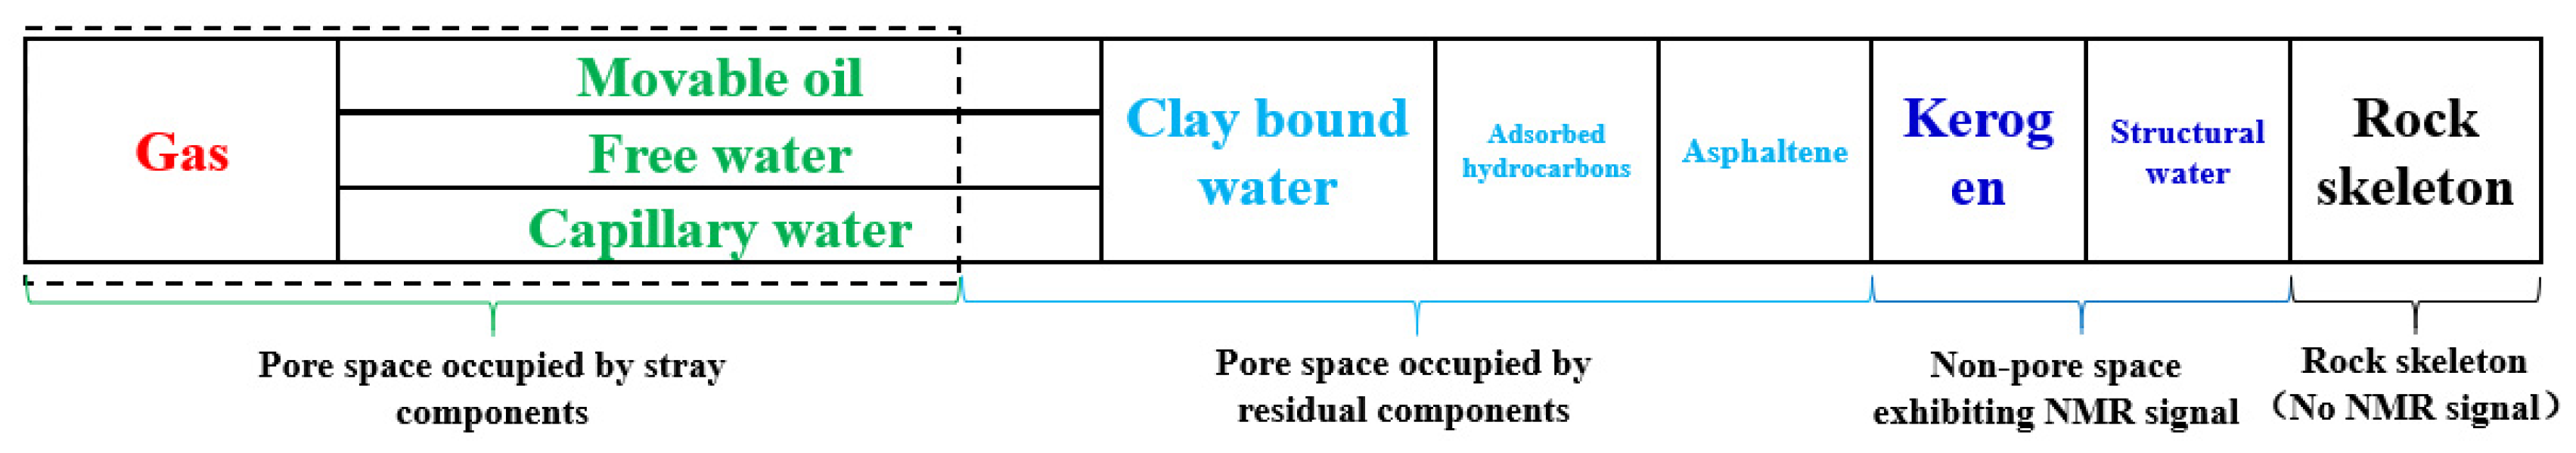
The Gulong shale oil reservoir exhibits a complex pore space and solid composition [7], which can be categorized, in terms of component properties, into gas, movable oil, free water, clay-bound water, capillary water, adsorbed hydrocarbons, structural water, kerogen, asphaltenes, and rock matrix (Figure 3). The samples collected from this region are nearly gas-free, thus rendering the influence of gas negligible in the analysis. The pore space within the shale formation consists of movable oil, free water, capillary water, clay-bound water, adsorbed hydrocarbons, and asphaltenes, while the non-pore space is composed of the other components. Except for the rock matrix, all other constituents of the shale samples present signals in NMR.
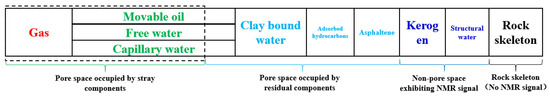
Figure 3.
Diagram of shale component composition.
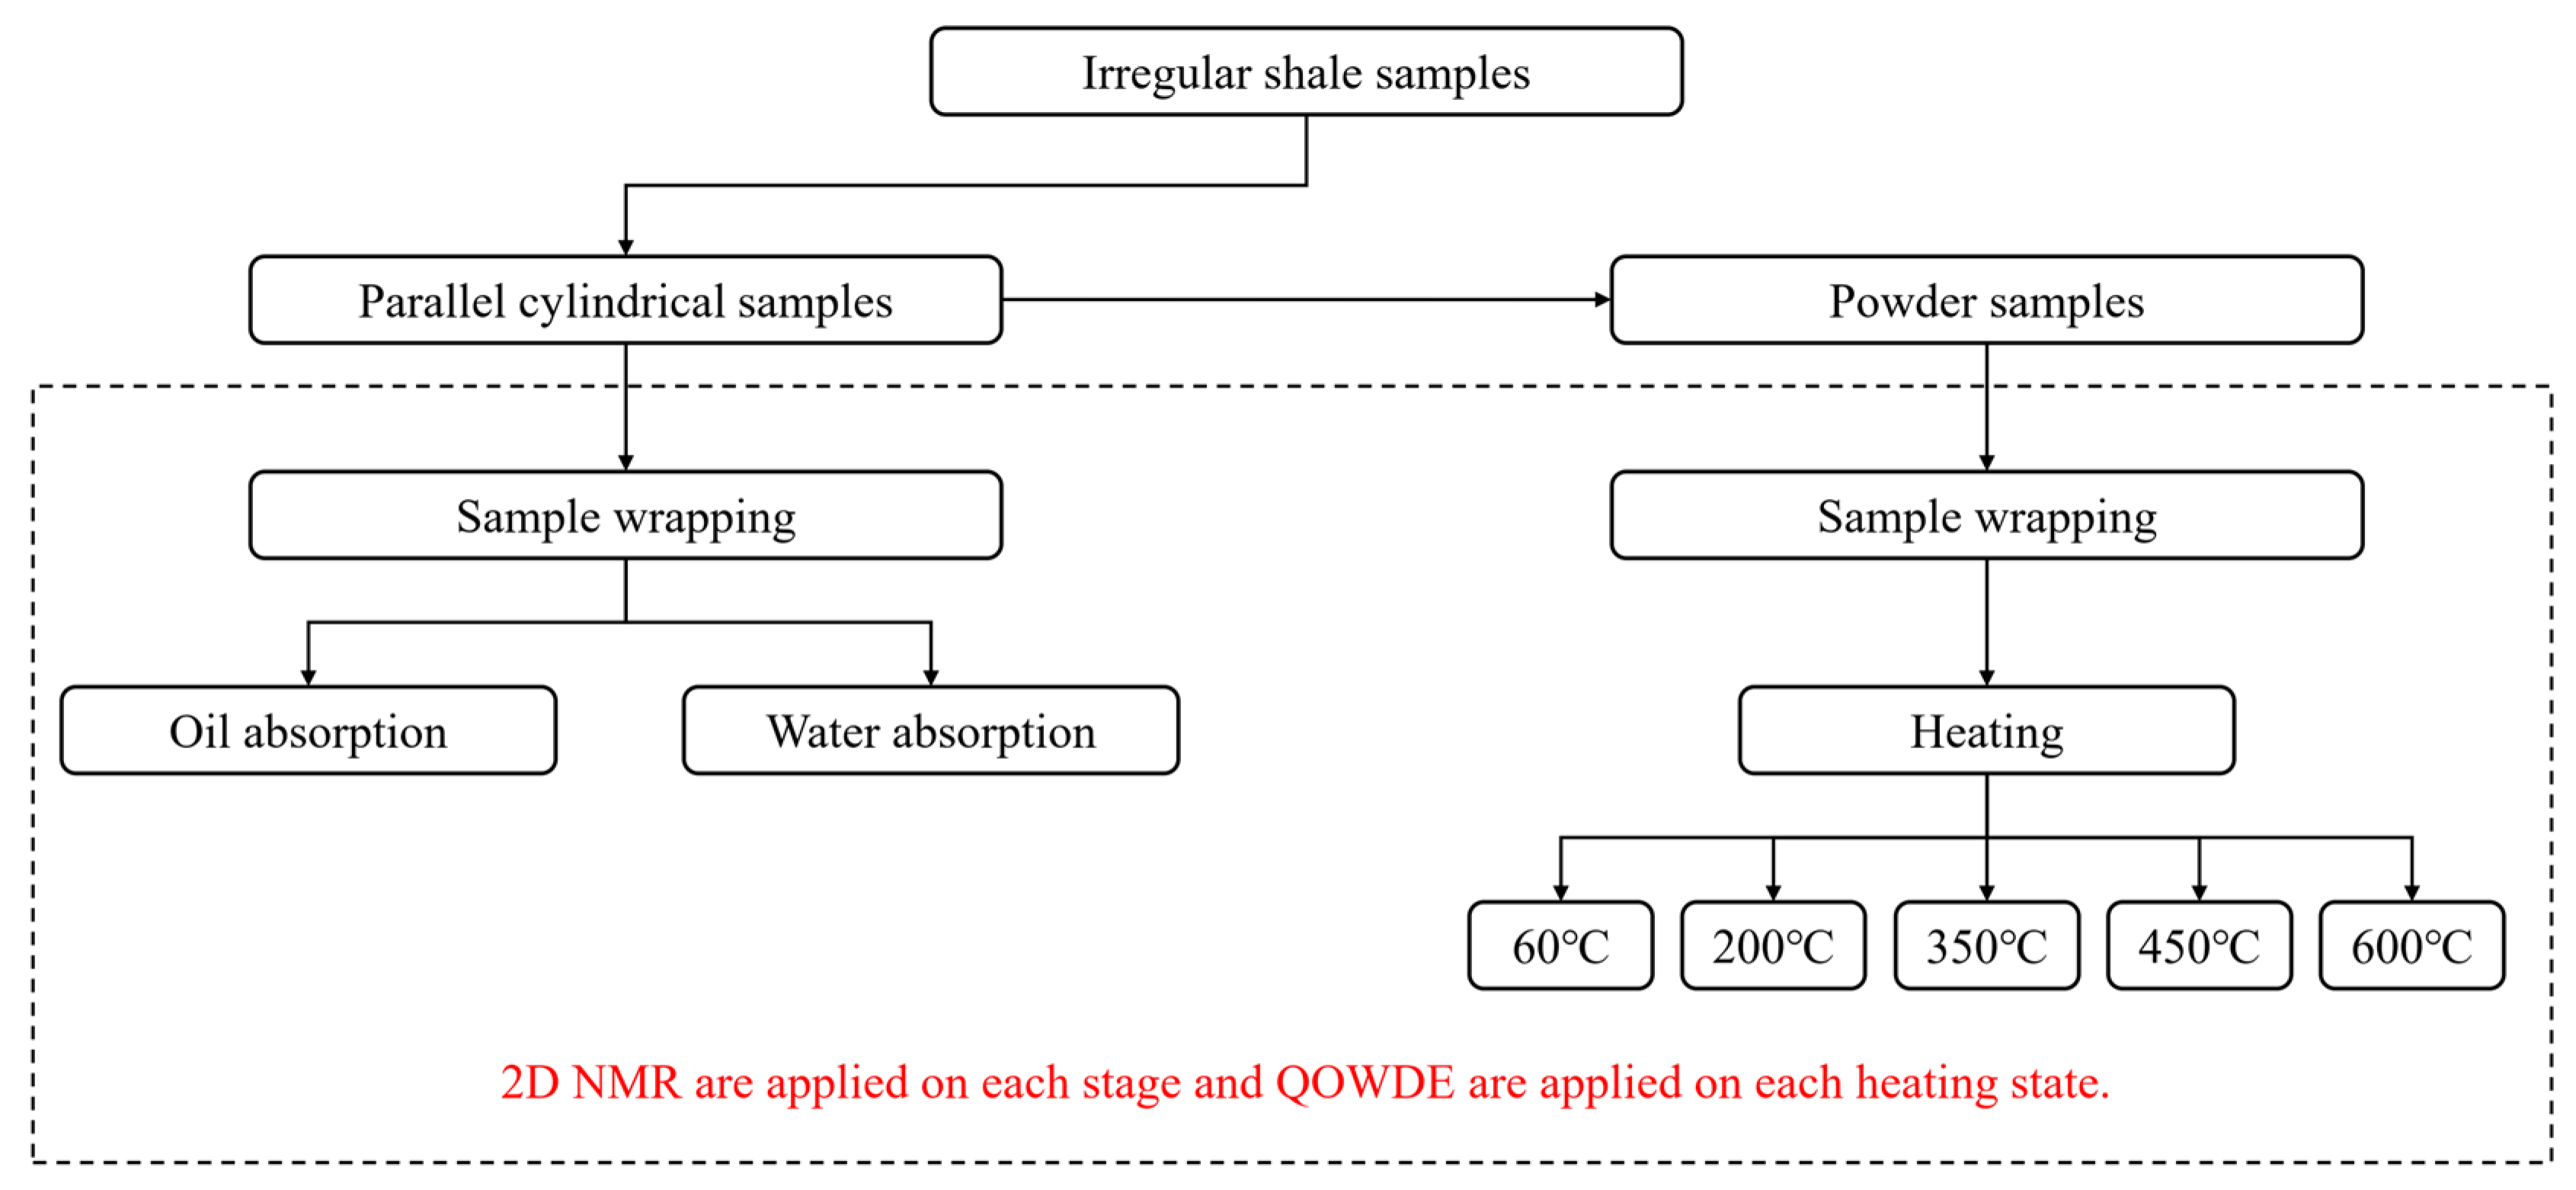
Due to the potential loss of oil and water in laboratory samples, it is necessary to replenish them fully during testing and distinguish other hydrocarbon components. Therefore, this study designed dual-phase saturation NMR experiments and a pyrolysis–NMR experiment and incorporated QOWDEs to validate the NMR experiments. A flow chart of the experimental procedure is presented in Figure 4, and details of the experimental procedure are provided below.
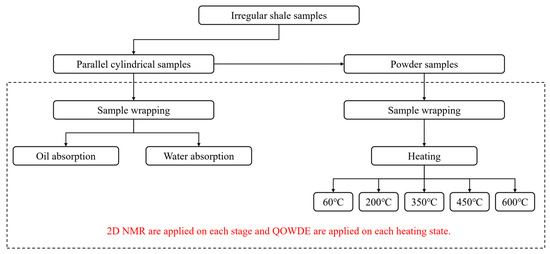
Figure 4.
The flow chart of the experimental procedure.
2.2.1. Dual-Phase Saturation NMR Experiments
It is well known that laboratory samples may lose some movable oil, free water, and capillary water. To obtain the distribution of these fluids in the 2D NMR map, saturation experiments must be conducted to restore the lost hydrocarbon and water. In conventional core saturation experiments, aviation kerosene is usually utilized for oil saturation, and brine is used for water saturation [11]. Shale formations, however, possess both inorganic and organic pores. The organic pores exhibit a propensity for oil wettability, and the inorganic pores show a preference for water wettability. Influenced by the wettability of the core, conventional pressure saturation methods have drawbacks. When oil is used exclusively for pressure saturation, imprecise measurements of the water-wet pore spaces will occur [12,13]. Conversely, using water alone for pressure saturation may not adequately account for the oil-wet pore spaces. Consequently, these methods fail to reflect fluid distributions in the reservoir accurately.
Considering the distinct wettability of organic and inorganic pores in shale, this study proposes a dual-phase saturation method, with oil and water, by using a twin sample. Two twin-plug samples were extracted from the same depth. Firstly, pressure saturation was conducted on one sample with brine, enabling water to enter the inorganic pores. Subsequently, the twin sample was subjected to pressure saturation with oil, which facilitates oil entering the organic pores. The combination of both experimental outcomes ensures the complete filling of all fluid-bearing pores in the shale. This comprehensive approach contributes to the analysis and study of the saturated fluid components using 2D NMR experiments.
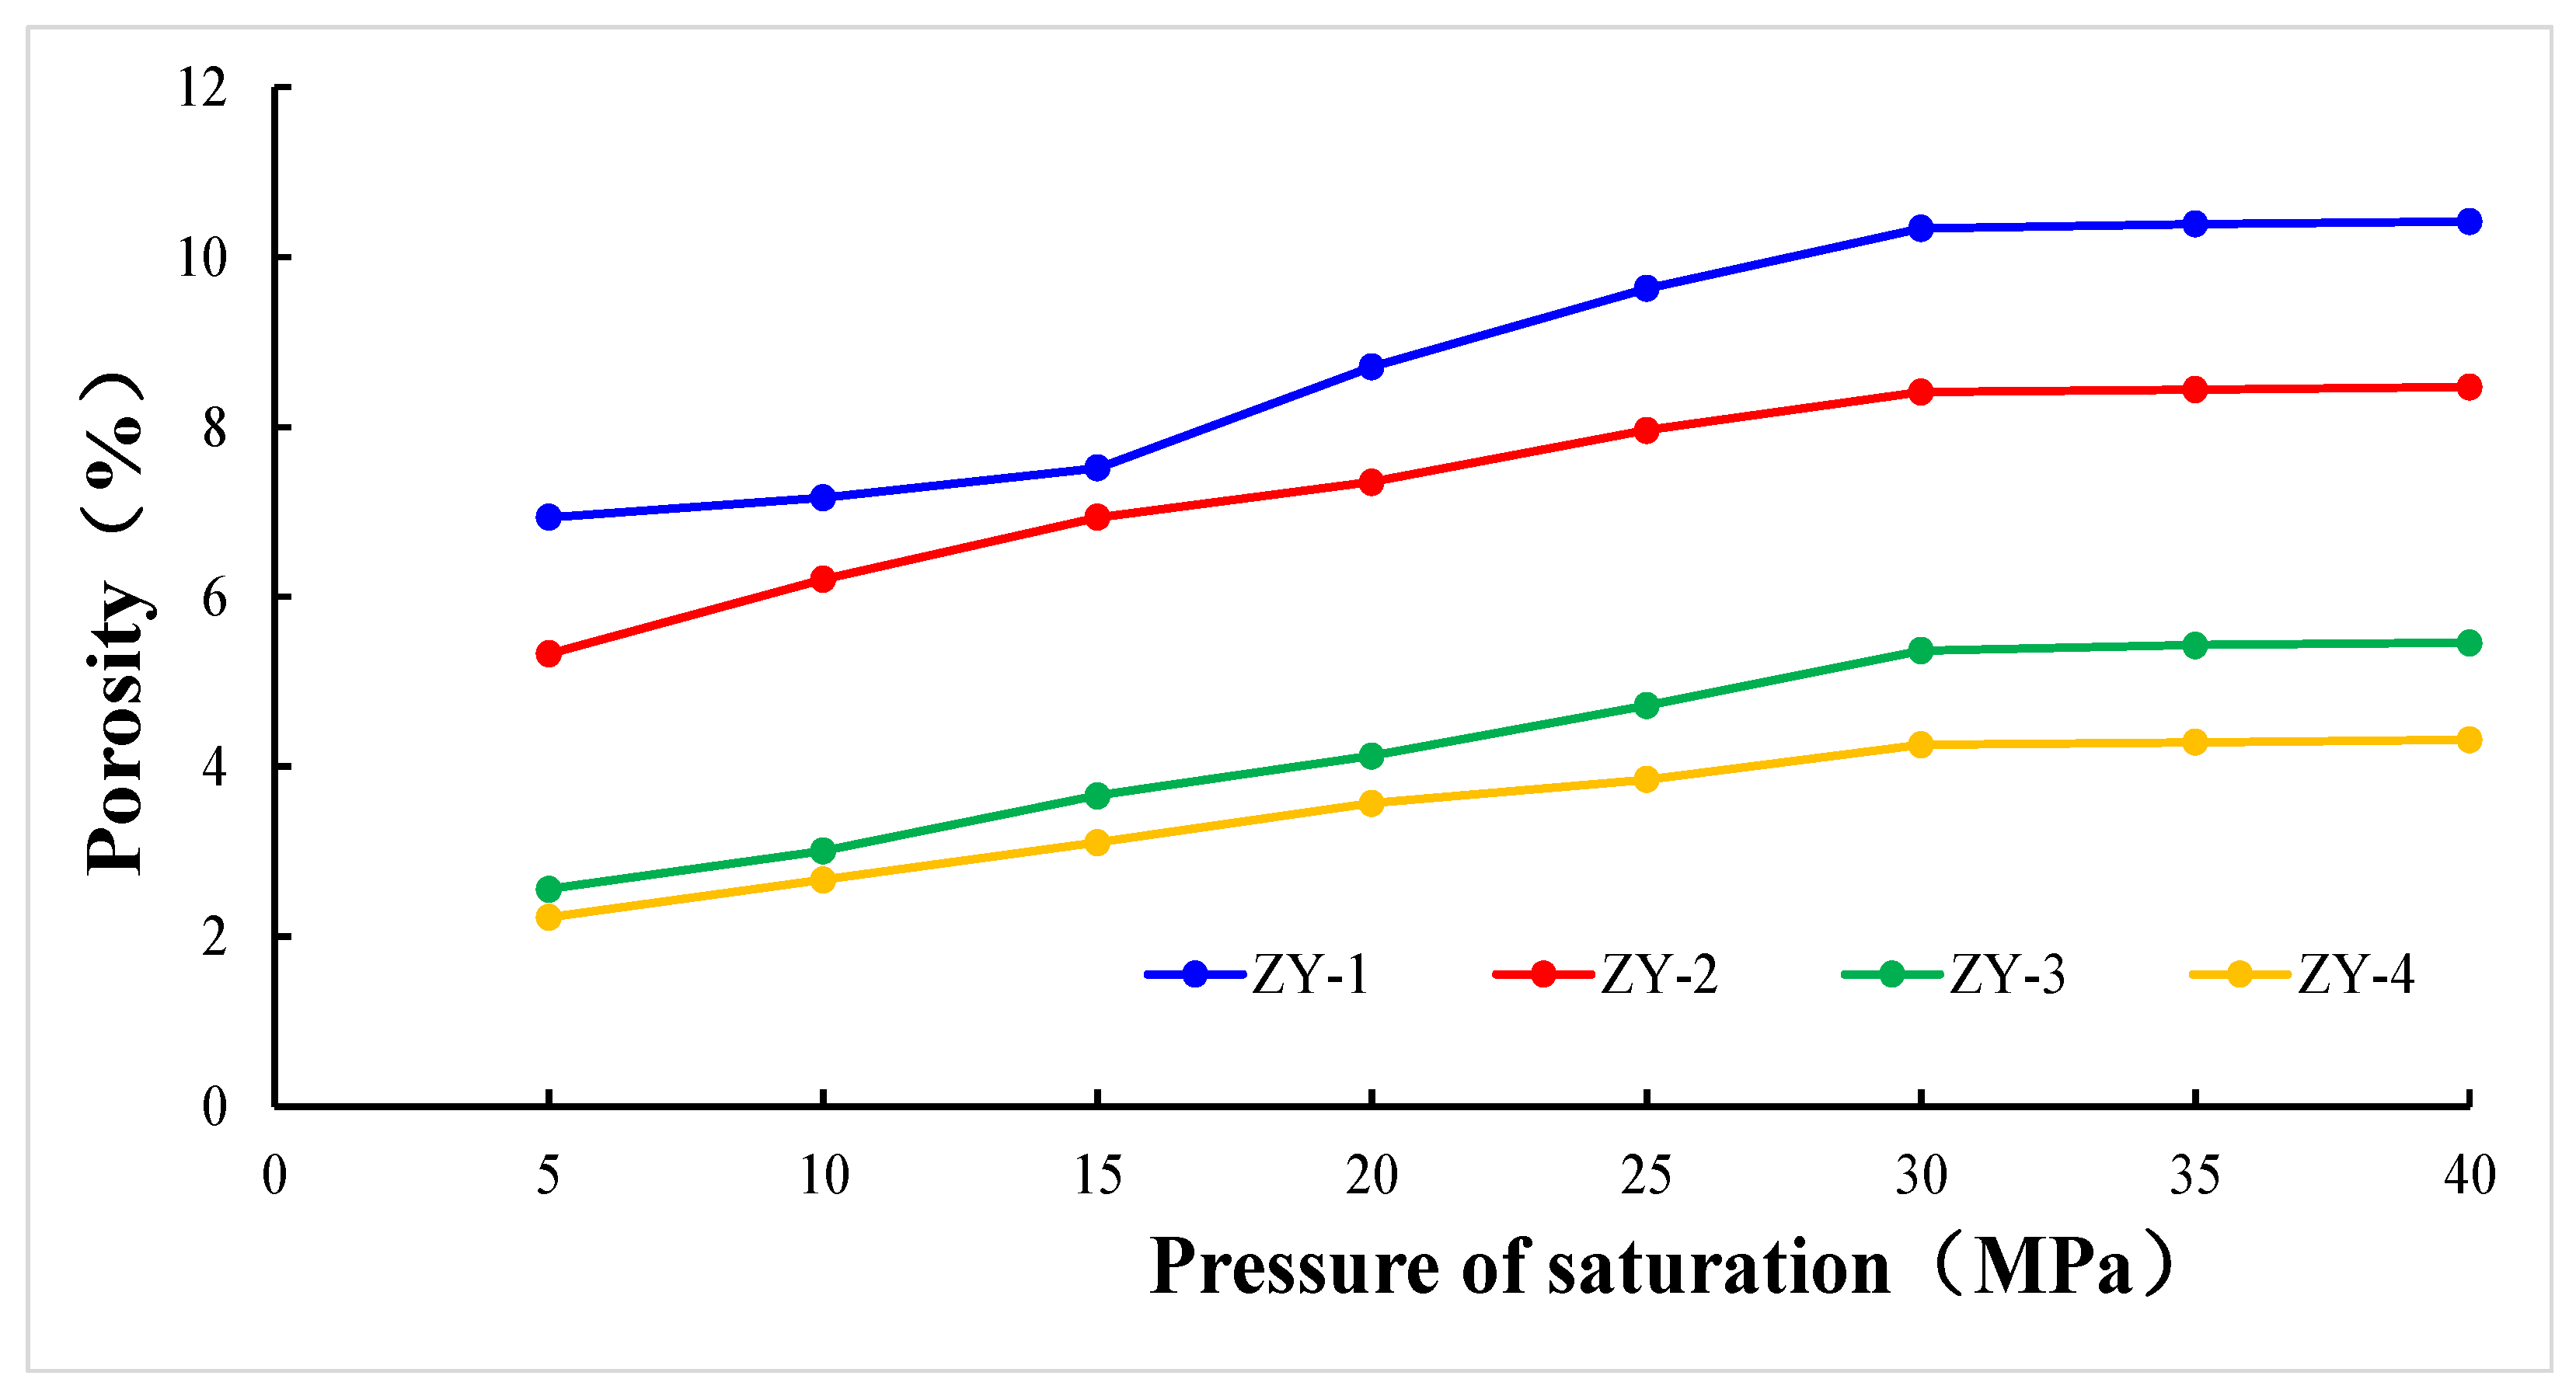
The efficacy of the porosity measurements using the saturation method is affected by the saturation pressure applied and by its duration. To achieve optimal conditions, this study conducted verification experiments. These experiments utilized four shale samples with distinct porosity, labeled ZY-1, ZY-2, ZY-3, and ZY-4; their porosity was 5.5%, 1.6%, 2.4%, and 0.35%, respectively. Using a pressure gradient of 5, 10, 15, 20, 25, 30, 35, and 40 MPa, the saturation pressure was gradually increased to measure the porosity of the four shale samples at each pressure level (Figure 5). It can be observed that before 30 MPa, porosity grew with an increase in the saturation pressure, and after 30 MPa, it tended to stabilize. This suggests that elevated saturation pressure is conducive to enhancing porosity. However, once the pressure surpasses 30 MPa, the impact of pressure on porosity becomes negligible. Therefore, 30 MPa is a more suitable pressure for saturation.
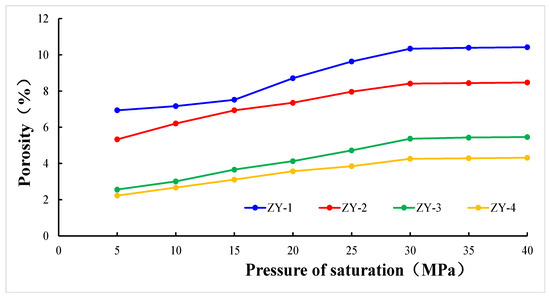
Figure 5.
Diagram of the relationship between porosity and saturation pressure.
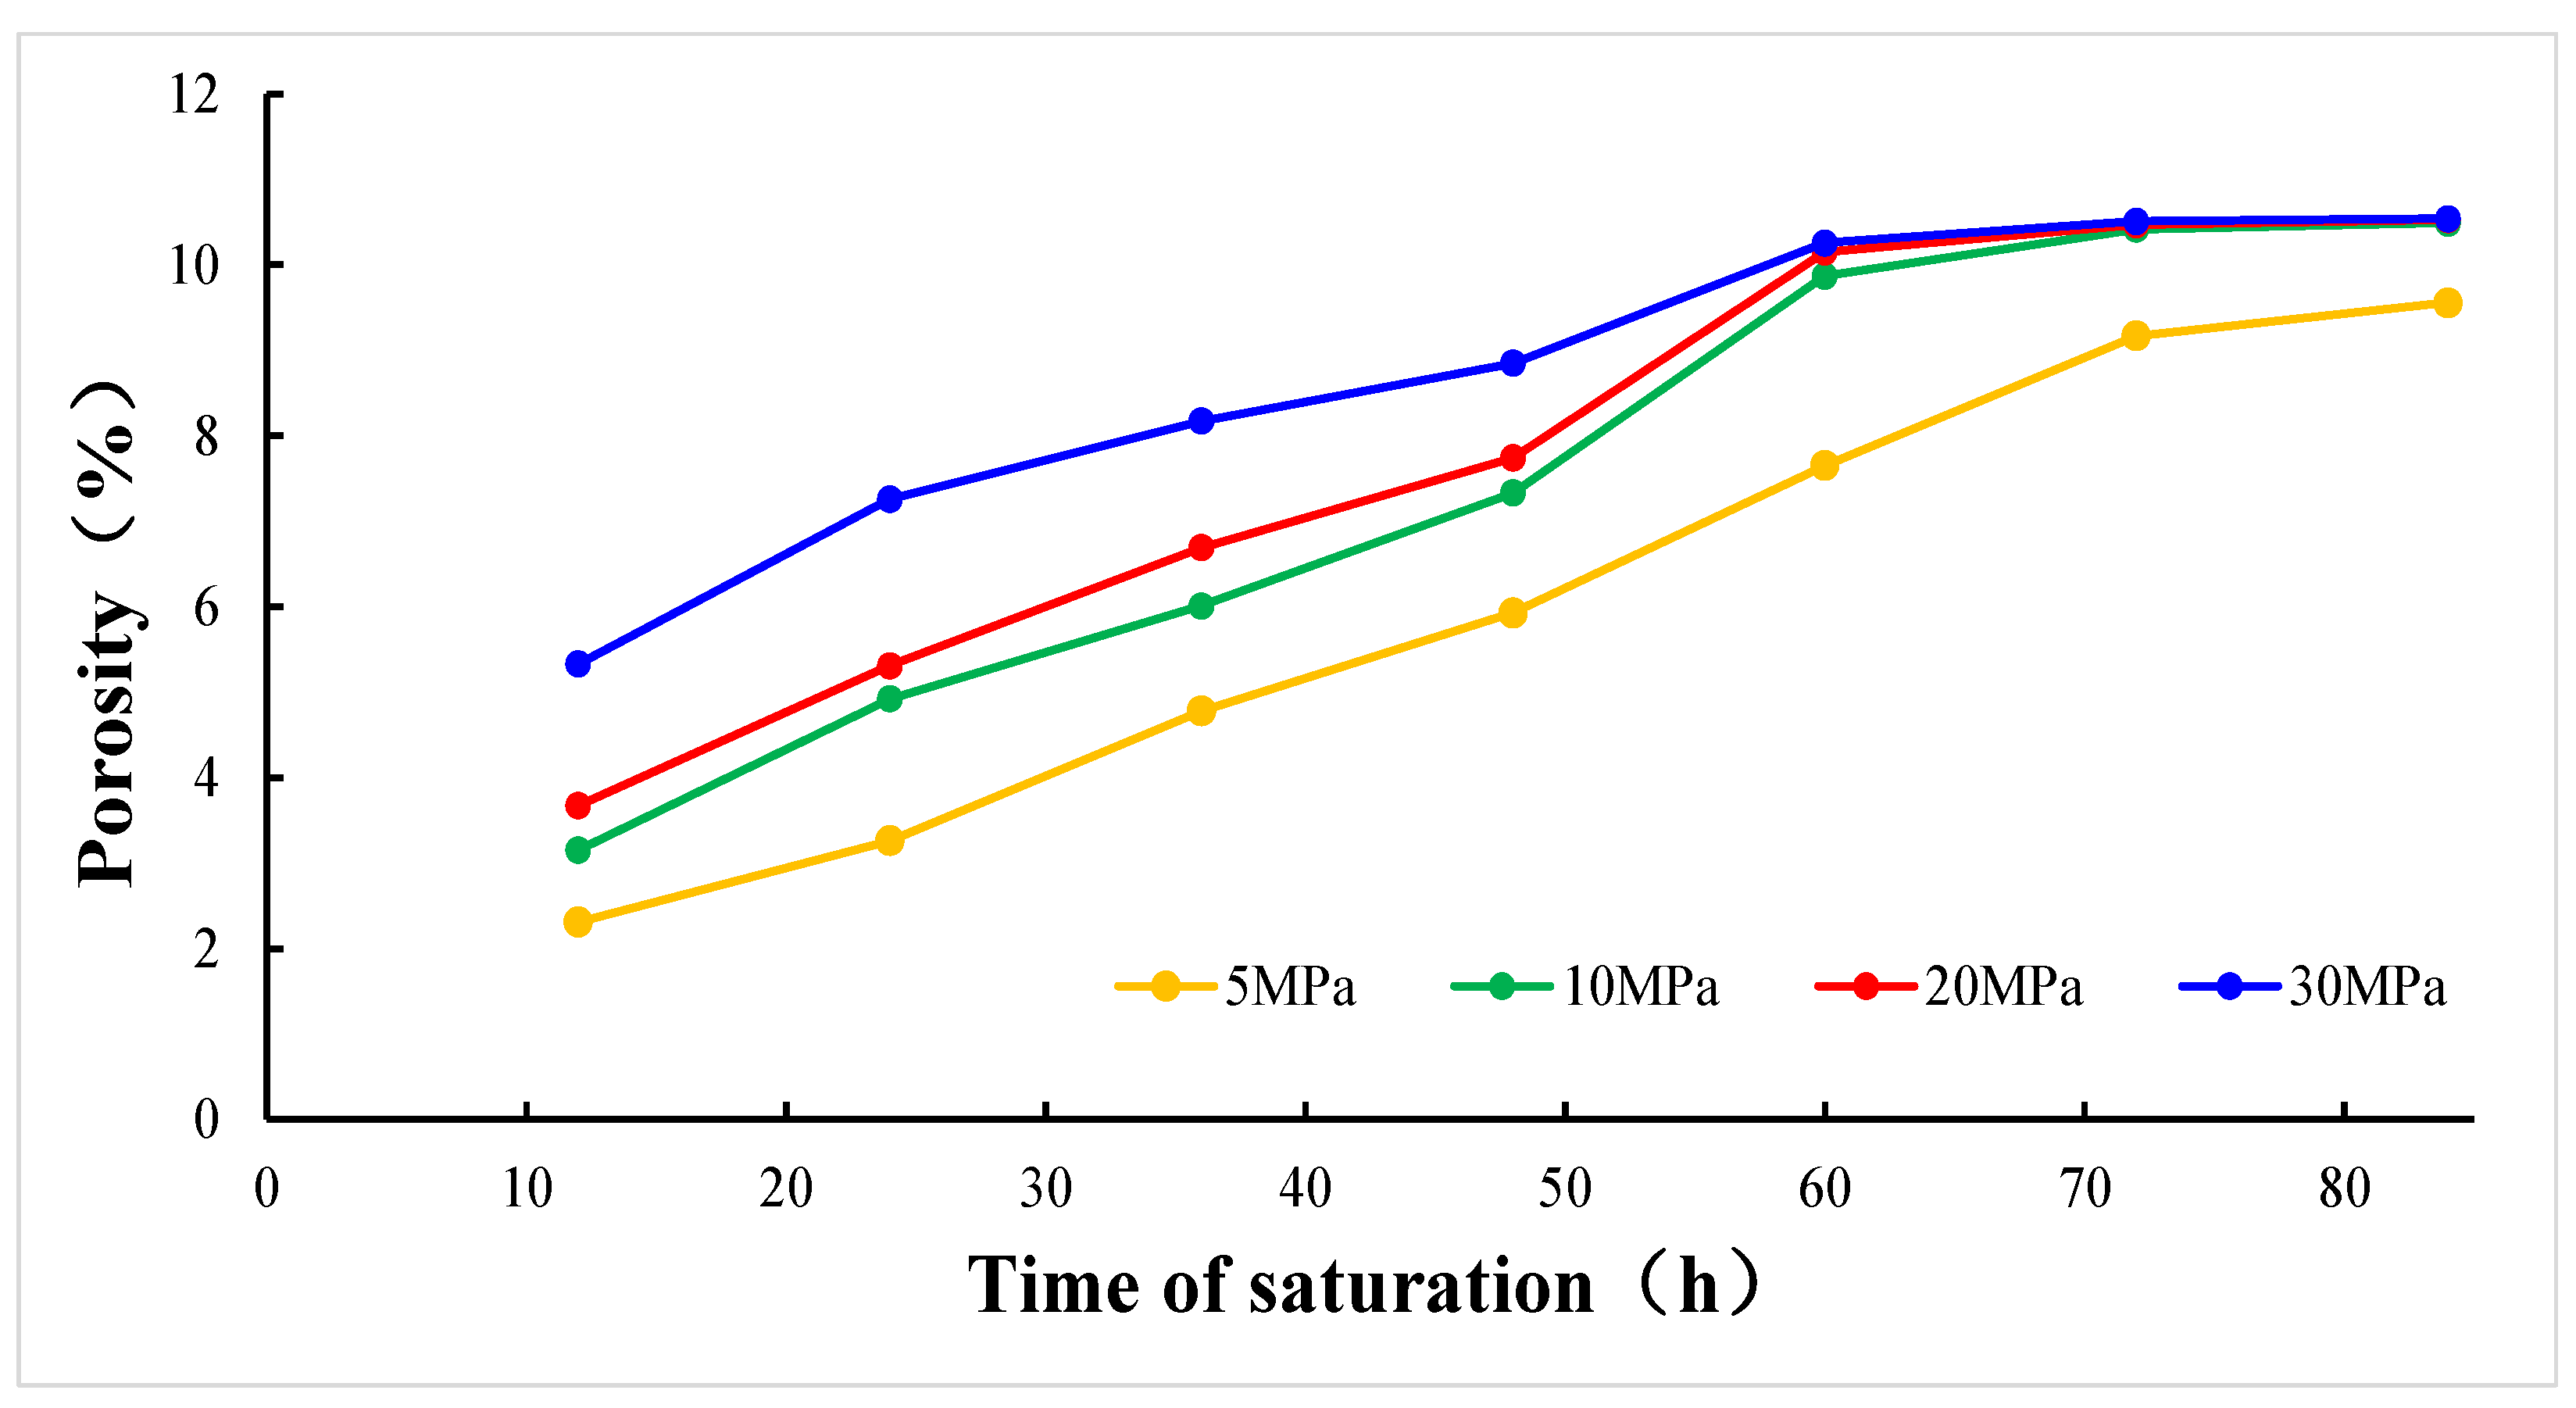
Subsequently, the porosity was assessed at varying pressures and saturation durations (Figure 6).This study selected 12 h, 24 h, 36 h, 48 h, 60 h, 72 h, and 84 h as time gradients and measured the porosity at different time gradients at saturation pressures of 5 MPa, 10 MPa, 20 MPa, and 30 MPa. At pressures below 5 MPa, the porosity rose with saturation time, yet it did not stabilize after 84 h, suggesting that it is difficult to attain equilibrium under low saturation pressures. Beyond 5 MPa, the porosity first grew with increased saturation time and, finally, converged to a steady value, with negligible variation observed after 72 h. This suggests that an elevated saturation time is conducive to enhancing porosity. Once the saturation time surpassed 72 h, the impact of pressure on the porosity became negligible. Therefore, 72 h is a more suitable time for saturation. In light of the validation findings, a saturation condition of 72 h at 30 MPa was regarded as optimal for achieving both oil and water saturation.
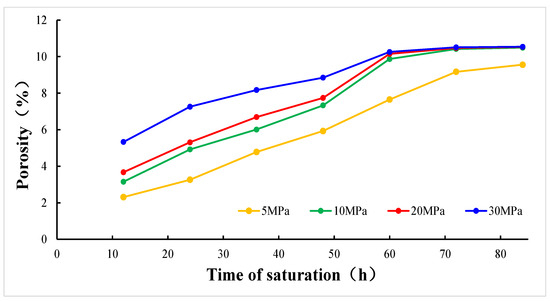
Figure 6.
The diagram of the relationship between porosity and equilibrium time under different saturation pressures.
2.2.2. Pyrolysis–Nuclear Magnetic Resonance Joint Experiments
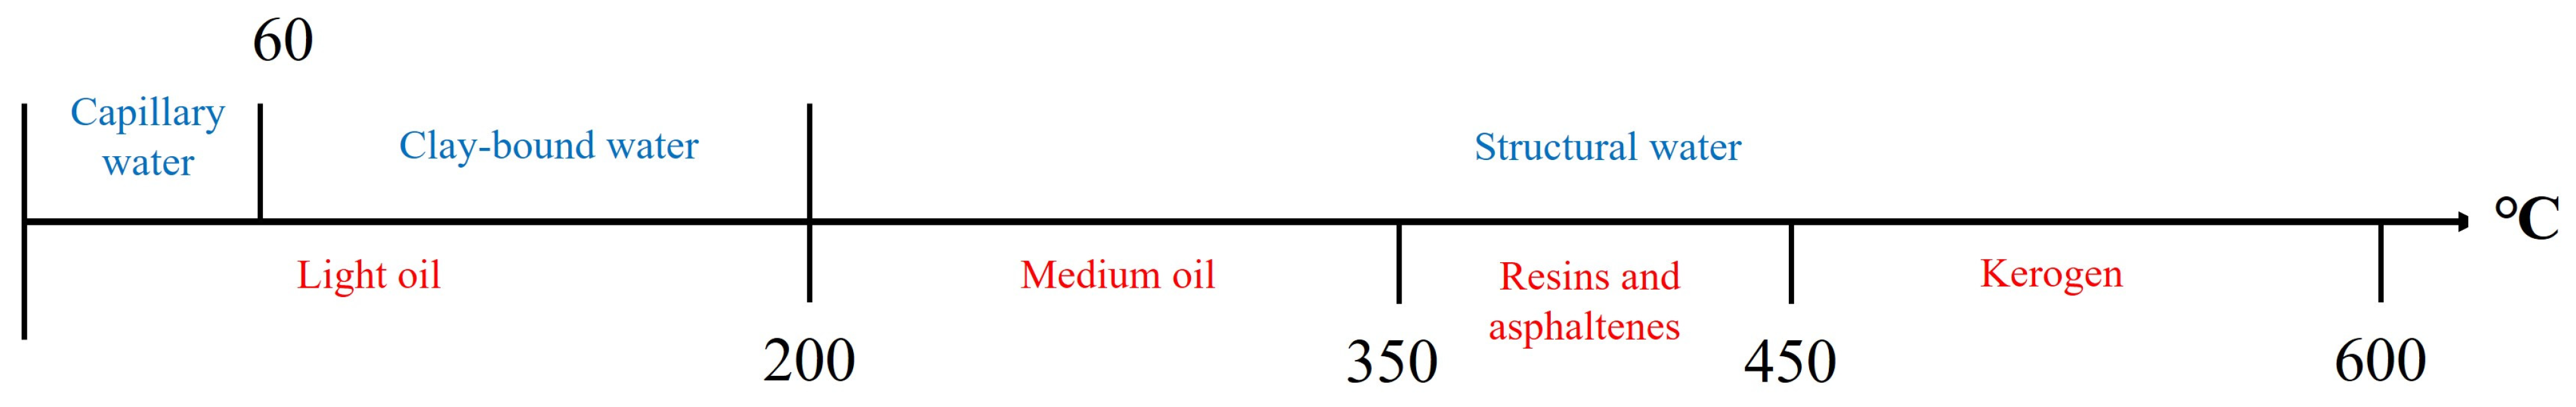
The shale samples from the Gulong region, which are both oil- and water-bearing, require the differentiation of fluid components during analysis. The distinct temperature characteristics of these components are attributed to the principle that components in various states of existence possess different molecular volatilities, leading to the volatilization of components with varying properties at different temperatures. Utilizing this principle, this study adopted the heating release method to investigate the distinct fluid components. Oil within shale is found in a variety of forms (Figure 7). Geochemical pyrolysis analysis indicates that when heated to 200 °C, light oil is volatilized. Between 200 °C and 350 °C, medium oil is volatilized. Between 200 °C and 350 °C, resins and asphaltenes are pyrolyzed. The thermal degradation of kerogen, leading to hydrocarbon generation, occurs between 450 °C and 600 °C [20]. Shale includes a series of water forms such as free water, capillary water, clay-bound water, and structural water. In this study, the centrifugation method was employed to isolate free water. After centrifugation, the sample was subjected to a 60 °C heat treatment, facilitating the evaporation of capillary water [17]. Finally, a 200 °C heating process was utilized to differentiate between clay-bound and structural water. Additionally, the temperature properties of oil and water were combined to establish a novel heating sequence: 60 °C, 200 °C, 350 °C, 450 °C, and 600 °C. This sequence was applied to anoxic pyrolysis experiments on crushed shale samples. Following each increment in temperature, a T1-T2 map was generated to delineate the residual components within the shale.
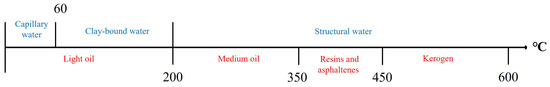
Figure 7.
Temperature dependent relationship between oil and water in shale.
2.2.3. QOWDE
To compare with the pyrolysis–NMR experiments and verify the rationality of the fluid component classification, the QOWDEs were integrated into this study. In these experiments, the shale samples were heated under vacuum conditions following the newly established temperature sequence. Fluids with distinct temperature profiles were separated at their specific temperatures. The oil and water yields at each stage were collected using a multistage heating process, allowing this study to quantify the hydrocarbon and water content at various stages. This method leverages the distinct volatilities and boiling points of various substances. By precisely controlling the heating temperatures and collecting the volatilized components at specific temperatures, the mixture is effectively separated and purified, allowing for the differentiation of oil and water. The experimental results validated the results of multistage pyrolysis–NMR measurements, as the samples were subjected to identical temperature gradients as those used in the pyrolysis process.
However, the QOWDE measures the weight of these substances, and the variation in 2D NMR signal intensity corresponds to the hydrogen index (indicating the number of hydrogen nuclei) of oil and water. Considering the hydrogen index difference between oil and water, signal intensities from different weights of these substances cannot be directly compared. To this end, this study defined a parameter termed hydrogen content, which correlates fluid weight with the count of hydrogen nuclei, enabling a coherent analysis between the outcomes of the quantitative oil and water detection experiments and 2D NMR data.
The hydrogen index is defined as the ratio of the number of hydrogen nuclei per unit volume (1 cm3) of a substance to that of an equivalent volume of freshwater [43], and it quantifies the hydrogen content characteristic of the substance. It can be expressed as follows:
The hydrogen index reflects the number of hydrogen nuclei per unit volume of substance. To determine the number of hydrogen nuclei for substances of different weights, this study divided the weight by density and multiplied by 1H. This study defined the number of hydrogen nuclei in the actual weight of a substance as the hydrogen content. It can be represented as follows:
From this, the hydrogen content of oil and water can be calculated. The density of the experimental oil was 0.85 g/cm3, and its hydrogen index was 1.034. The hydrogen content can be calculated as follows:
Similarly, the density of the experimental water was 1 g/cm3, and its hydrogen index was approximated to a value of 1. Its hydrogen content of it can be calculated as follows:
In Equations (1)–(4), the main parameters are defined as follows: HI represents the hydrogen index; 1H is the number of hydrogen nuclei per unit volume of any substance; 1Hw is the number of hydrogen nuclei per unit volume of water; HC denotes the hydrogen content; HIo represents the hydrogen index of oil; HIw represents the hydrogen index of water; HCo is the hydrogen content of oil; HCw is the hydrogen content of oil; mo is the weight of oil; mw is the weight of water; ρo is the density of oil; and ρw is the density of water.
3. Results and Discussion
3.1. Dual-Phase Saturation Determines Movable Oil and Free Water
Firstly, the T1-T2 map of the sample in its original state was measured to obtain the distribution of residual components. In the Gulong region, the NMR signals from the original samples are mainly distributed in three distinct regions, and the most intense signal exists in region II. This intensity is attributed to the high clay content in the samples (the average clay content is 36.4%), which imparts intricate storage properties to the clay-bound spaces, potentially harboring both oil and water phases. The components in these spaces are difficult to volatilize in their natural state, leading to a higher amount of residue, thus explaining the main signal of residual regions in region II.
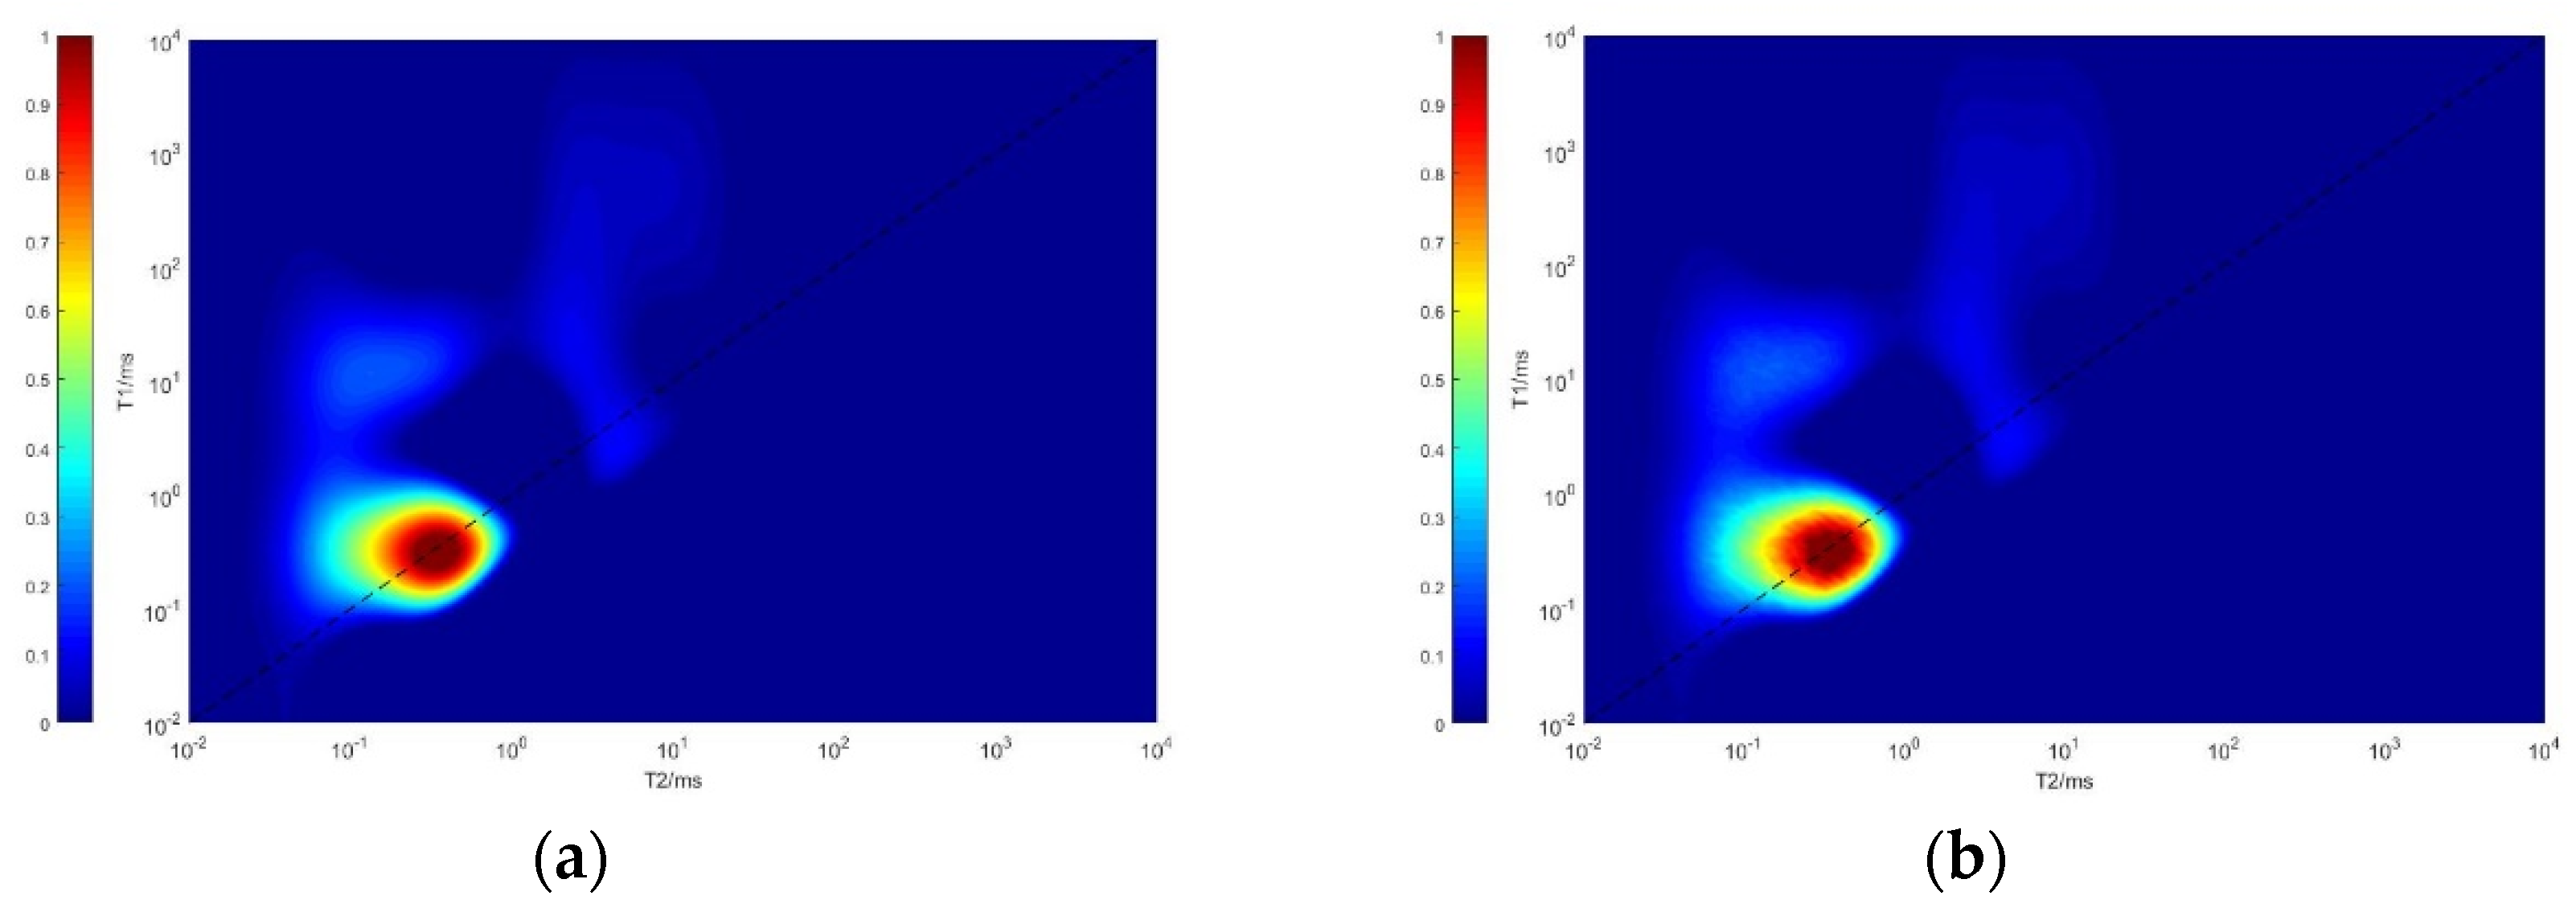
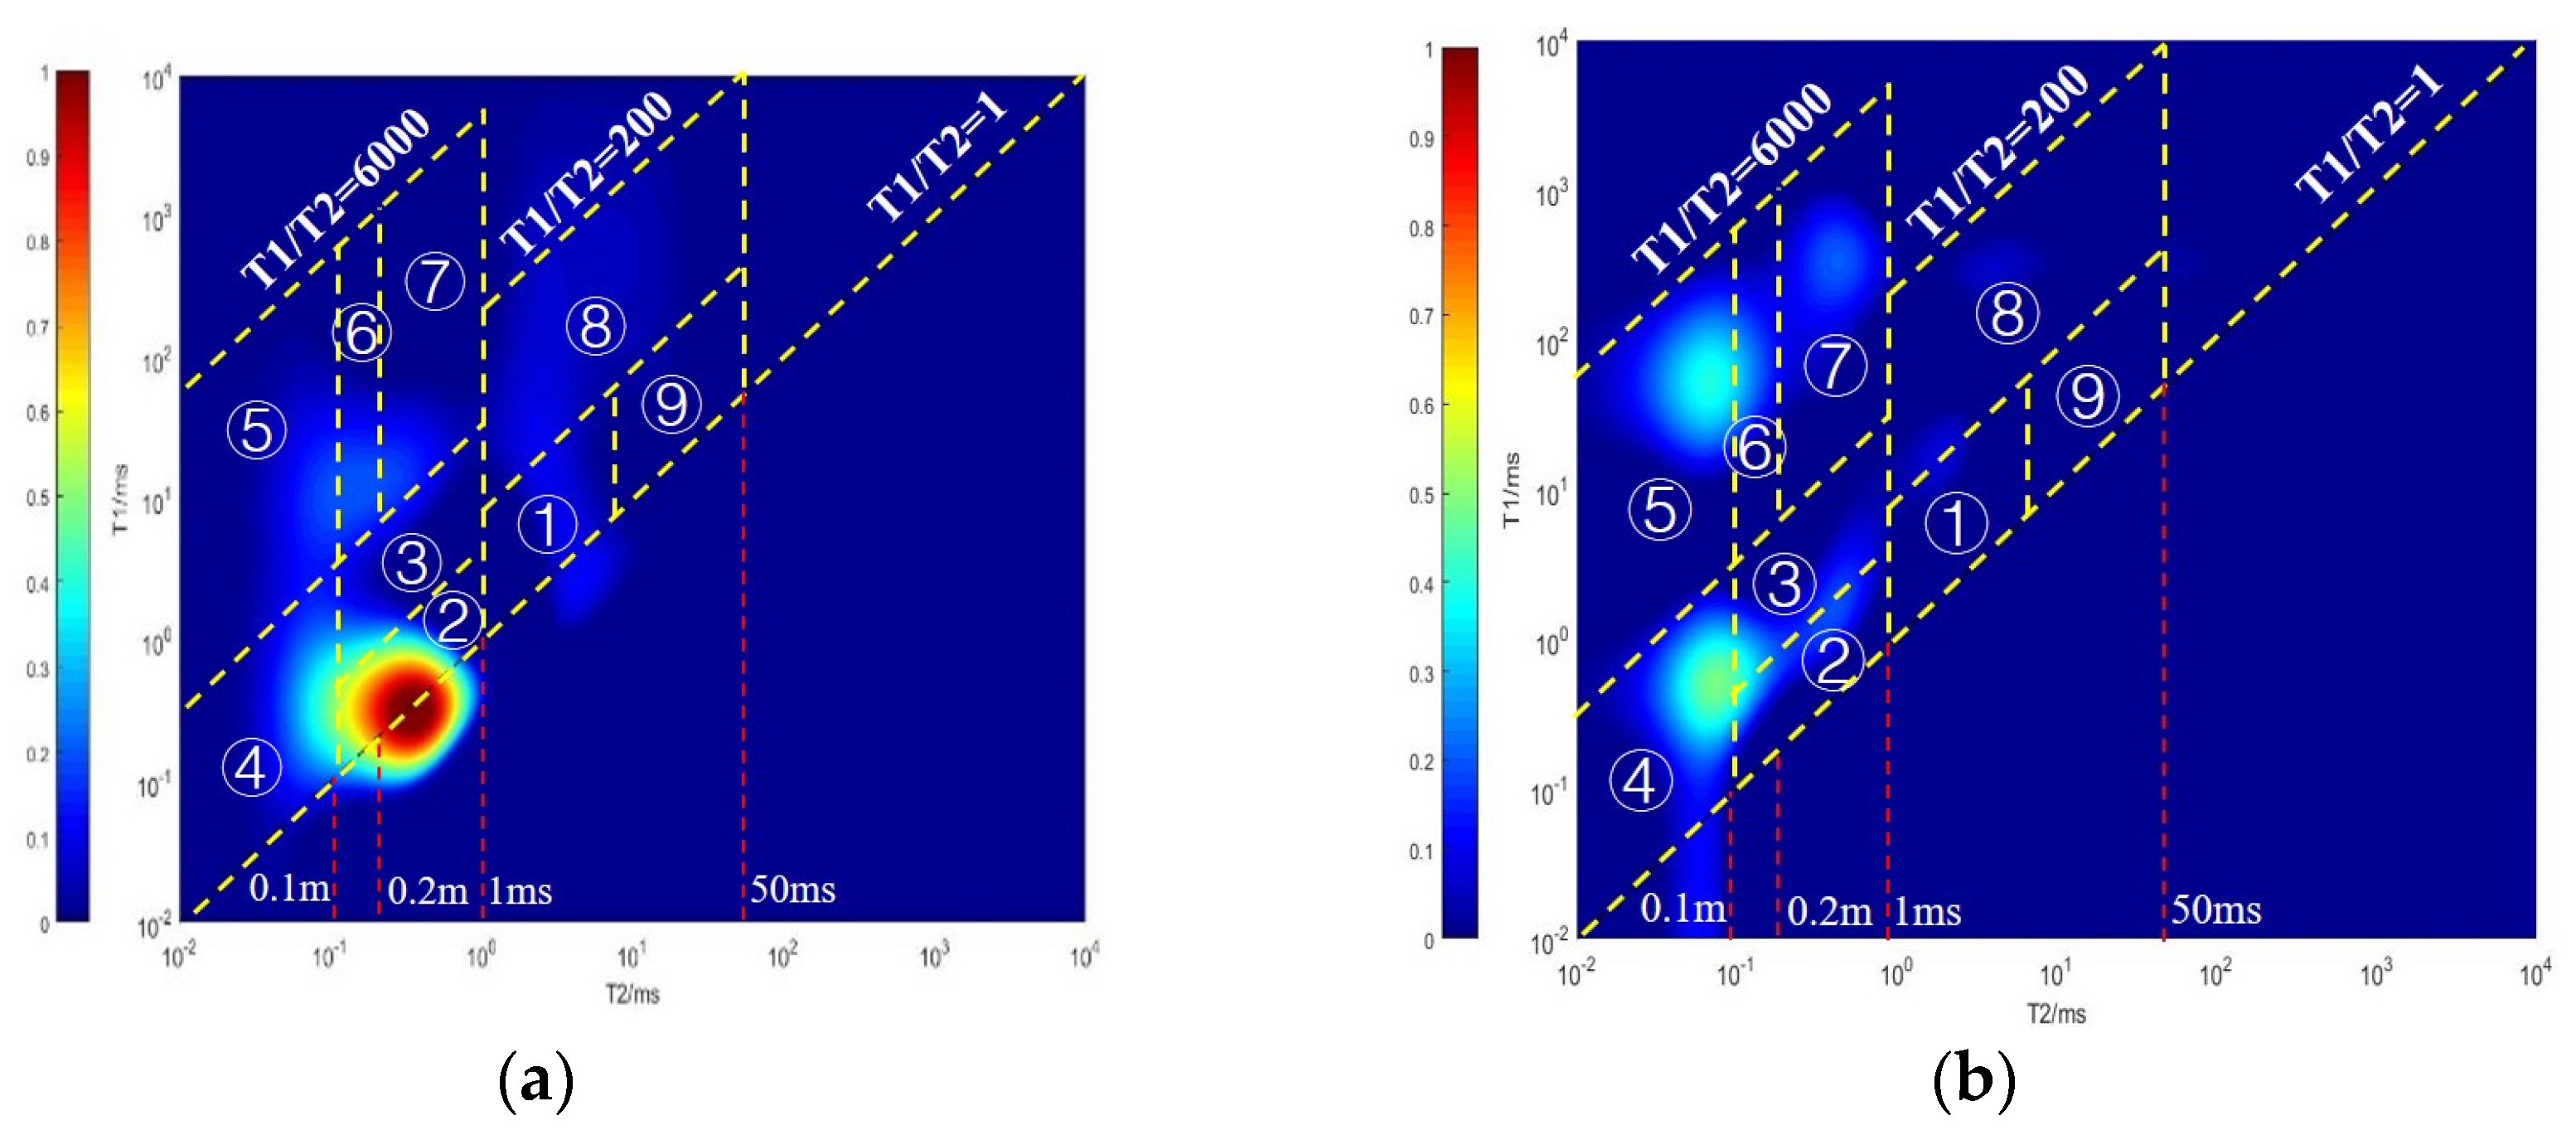
Subsequently, the sample underwent pressure saturation with oil to refill the organic pores, which was measured to obtain a T1-T2 map. Concurrently, a twin plug sample was subjected to water pressure saturation with water to replenish the inorganic pores. Then, the water-saturated sample was centrifuged at 5000 revolutions per minute (rpm), and the 2D map at each stage was measured and compared (Figure 8a,b). In the 2D NMR map, the signal intensity in region III significantly increased after oil saturation, demonstrating the infiltration of mobile oil into the pores. After water saturation, a pronounced signal appeared in region IV of the map. This signal was reduced after centrifugation, which indicates the locations of free water. The twin experiments of water saturation and centrifugation on samples aid in localizing the free water. Additionally, the enlargement of region II may be associated with the re-saturation of water in the clay regions. This study performed multistage pyrolysis and QOWDEs on the crushed twin samples, following the predefined temperature sequence. Then, the 2D NMR map at each stage was measured to ascertain the fluid component distribution by analyzing the variations across different temperatures (Figure 8c,d). The rationality of the component partitioning was validated via the quantitative oil and water assays.
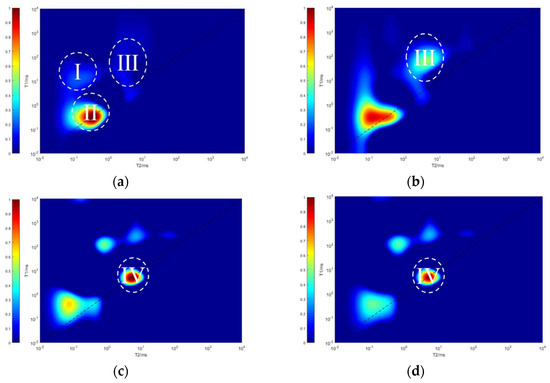
Figure 8.
Multi-state 2D T1-T2 maps for the cylindrical shale sample GY-1: (a) original state; (b) oil saturation; (c) water saturation; (d) centrifugal. Regions I–IV represent kerogen, clay-bound water, movable oil, and free water, respectively.
3.2. Pyrolysis–NMR Joint Experiments to Determine Remaining Components
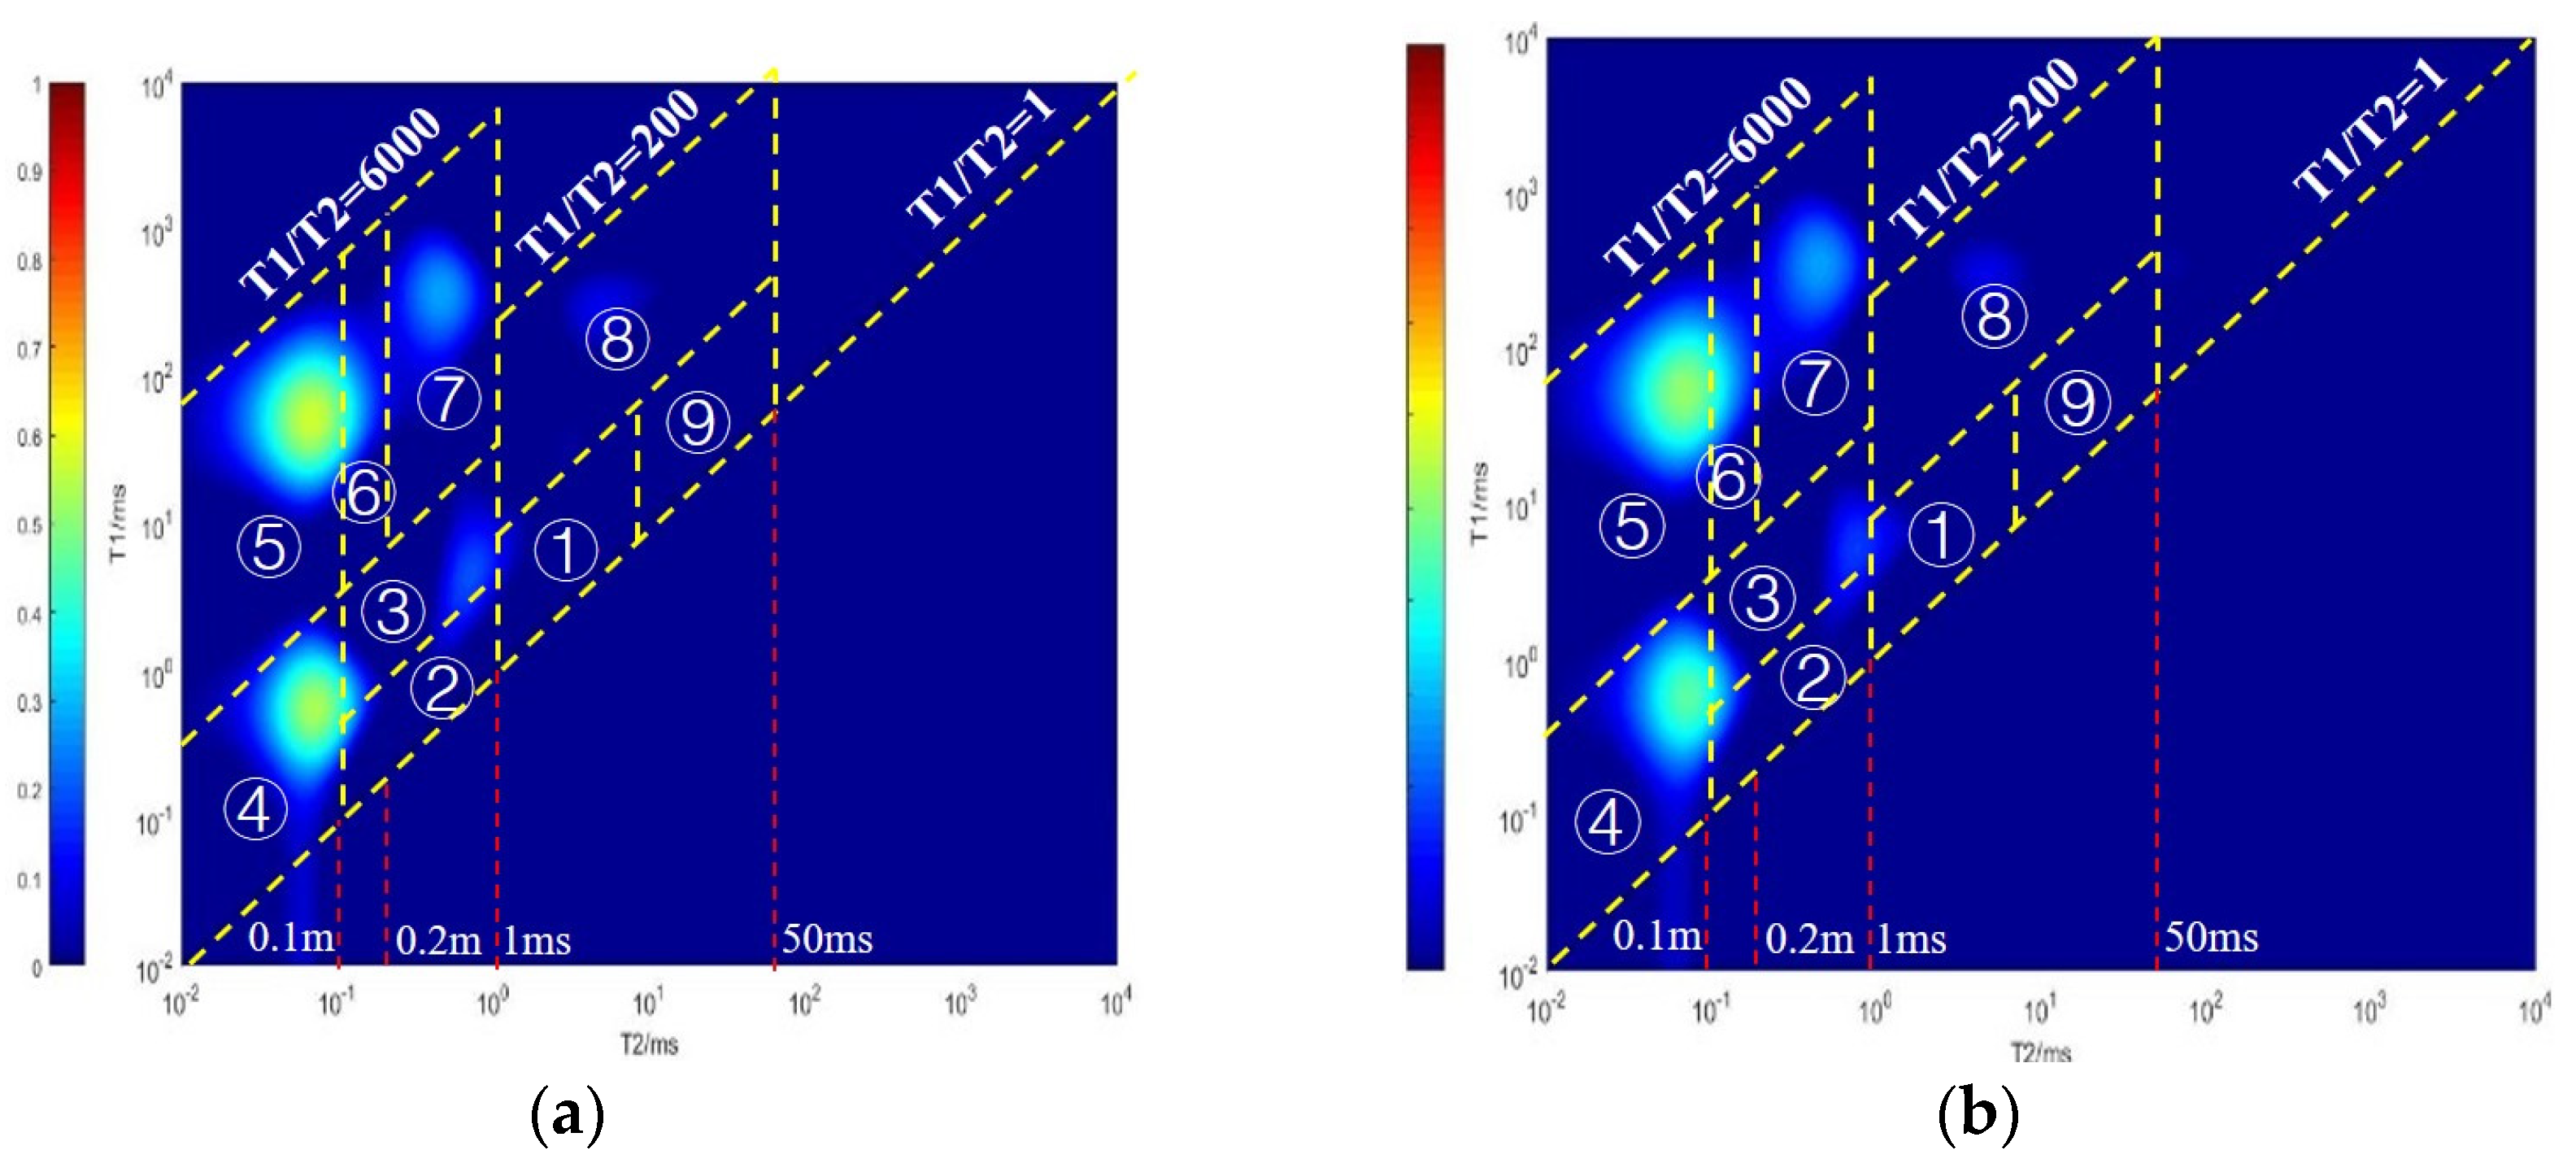
By comparing the original 2D NMR maps of the crushed and plug samples, the research found that crushing to a 60-mesh size results in negligible map variation (Figure 9a,b). This observation suggests that the crushing process has no remarkable effect on the NMR signal integrity, confirming that the crushed sample can be analyzed together with the plug sample. Because the 2D NMR signals from shale oil in oil- and water-saturated conditions are obviously higher than post-pyrolysis signals, combining these states for normalization may obscure the map of the crushed sample (Figure 9c,d). To enhance clarity for analysis, this study normalized the 2D NMR map of the crushed sample separately to study the residual components effectively.
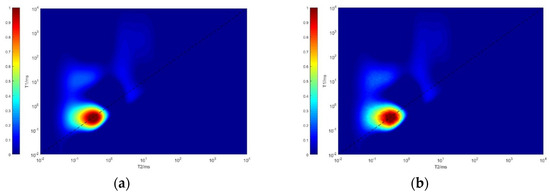

Figure 9.
Multi-state 2D T1-T2 maps for the cylindrical and powder shale samples GY-1: (a) cylindrical sample original state; (b) powder sample original state; (c) oil saturation; (d) 60 °C heating.
The 2D map of the Gulong shale demonstrates significant temperature-dependent variations across seven distinct regions (Figure 10a). When the sample was heated from its original state to 60 °C, there was a disappearance of the signal in region ① of the map (Figure 10b) (the NMR signal intensity decreased by 61). This indicates that certain components within the sample are volatilized at this temperature. In terms of temperature characteristics, the components in this temperature gradient comprise movable oil, free water, and capillary water. Distinguishing whether the components observed in the 2D NMR map are oil or water requires the integration of QOWDEs for further analysis. During the QOWDEs, the sample was heated to 60 °C, 0.1 g of water was released, and no oil was produced. The hydrogen content of the components released during this process was calculated to be 0.67 × 10²², and the ratio of signal intensity to hydrogen content was 0.1098 × 10²¹. Only water was released without oil, indicating that the variation in region ① of the 2D NMR map is attributed to water. Utilizing the temperature-based classification, the fluids below 60 °C were identified as free water and capillary water. As shown in the saturated water experiment of Section 3.1, free water exists in region ⑨ (the region IV in Section 3.1). On this basis, region ① was identified as the range of the 2D map distribution specific to capillary water.
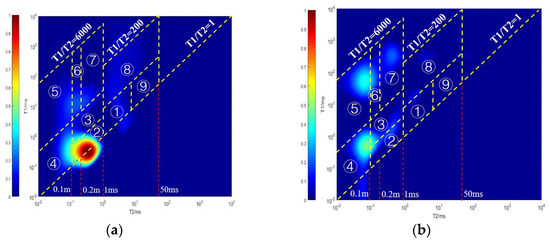
Figure 10.
Multi-temperature state 2D T1-T2 maps for shale sample GY-1: (a) original state and (b) 60 °C heating.
With continued heating from 60 °C to 200 °C (Figure 11a), the signal in region ② of the 2D NMR map disappeared, with a decrease of 124 in the NMR signal intensity. In the QOWDE, the increase in temperature resulted in the release of 0.2 g of water with no oil production. The hydrogen content of the components released during this process was calculated to be 1.34 × 10²². Then, the hydrogen content of the released components and the ratio of signal intensity to hydrogen content was 0.1081 × 10²¹. Given that only water was released during this phase, the components lost in region ② of the 2D map were confirmed as water. Based on the temperature properties of water, the component released between 60 °C and 200 °C was clay-bound water. Consequently, region ② in the 2D map was identified as the distribution range for clay-bound water.
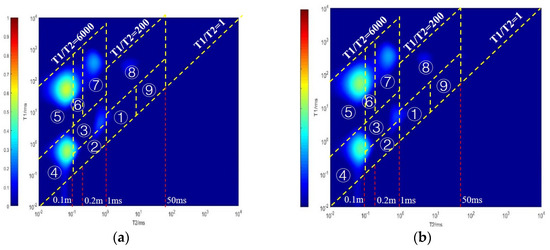
Figure 11.
Multi-temperature state 2D T1-T2 maps for shale sample GY-1: (a) 200 °C heating and (b) 350 °C heating.
During the heating phase from 200 °C to 350 °C (Figure 11b), there was a notable decrease in the signal intensity within region ③ of the 2D NMR map. The NMR signal intensity decreased by 164. Concurrently, in the QOWDE, no water was released, whereas 0.2 g of oil was released during this temperature interval. The hydrogen content of the components released during this process was calculated to be 1.62 × 10²². The calculated hydrogen content of the released components and the ratio of signal intensity to hydrogen content was 0.0988 × 10²¹. In this phase, only oil was released, without concurrent water being released. According to the pyrolysis classification standard for hydrocarbons, the substances released between 200 °C and 350 °C are categorized as medium hydrocarbons, including diesel and kerosene. Therefore, region ③ was identified as medium crude oil.
During the heating phase from 350 °C to 450 °C (Figure 12a), variations were observed in region ④ and region ⑦ of the 2D NMR map. The signal intensity in region ④ diminished (the NMR signal intensity decreased by 181), and the same occurred in region ⑦ (the NMR signal intensity decreased by 166). Concurrently, in the QOWDE, 0.29 g of water was released (the hydrogen content of which was 1.943 × 10²²). Additionally, 0.2 g of oil was released (the hydrogen content of which was 1.62 × 10²²). The accumulated hydrogen content for the entire process was 3.563 × 10²². In this phase, both oil and water were released, thus requiring identification of the relationship between the NMR signal intensity and the hydrogen content. First, it was hypothesized that all the water produced in this process originated from region ④. Region ④ exhibited a signal-to-hydrogen content ratio of 0.1073 × 10²¹, while region ⑦ showed a ratio of 0.0967 × 10²¹. These ratios are consistent with the observed law between signal intensity and hydrogen content in the previous discussion. Thus, region ④ was identified as the water, and region ⑦ was the oil. According to the pyrolysis classification standard for hydrocarbons and water, the water released in this process was classified as bound water, while the oil was categorized as heavy oil. Therefore, region ④ was confirmed to represent bound water, and region ⑦ represents heavy oil.
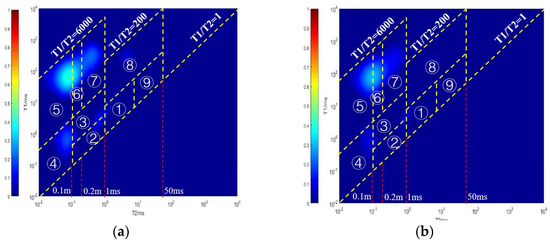
Figure 12.
Multi-temperature state 2D T1-T2 maps for shale sample GY-1: (a) 450 °C heating and (b) 600 °C heating.
During the heating process from 450 °C to 600 °C (Figure 12b), the 2D NMR map exhibited alterations in the signal intensities within region ④, region ⑤, and region ⑥. Region ⑤ presented a signal decrease throughout the heating process, but retained a residual signal over 600 °C. In contrast, region ⑥ essentially disappeared during the heating process from 450 °C to 600 °C. The NMR signal intensity in region ④, region ⑤, and region ⑥ decreased by 97, 176, and 35, respectively. During the oil and water quantitative detection experiment, within this temperature range, 0.14 g of water was released (with a hydrogen content of 0.938 × 10²²), and 0.26 g of oil was released (with a hydrogen content of 2.106 × 10²²). The total hydrogen content for the entire process was 3.044 × 10²². In this temperature range, the water was identified as structural water. Region ④ was identified as structural water in the previous discussion. Thus, it needed to be determined whether all the water generated throughout this process originated entirely in region ④. First, it was hypothesized that all the water produced in this process originated from region ④. The ratio of the signal intensity to the hydrogen content in region ④ at this time was 0.096 × 10²¹, which is consistent with the previously established pattern between signal intensity and hydrogen content. This result supports the hypothesis that all water released during the process originated from region ④ and substantiates the conclusion that region ④ is characterized as containing structural water. The emergence of oil can be attributed to the changes within region ⑤ and region ⑥. Throughout the heating stage from 450 °C to 600 °C, changes occur in both asphaltenes and kerogen. Asphaltenes are completely decomposed in this temperature range, whereas kerogen tends to leave behind residues. Considering the distinct patterns of variation in region ⑤ and region ⑥, region ⑤ was identified as the kerogen, and region ⑥ was identified as the asphaltenes.
Consequently, this study successfully identified and mapped the residual components on the 2D T1-T2 map through multistage pyrolysis–NMR measurements and QOWDEs.
4. Research Application
4.1. Component Identification Template
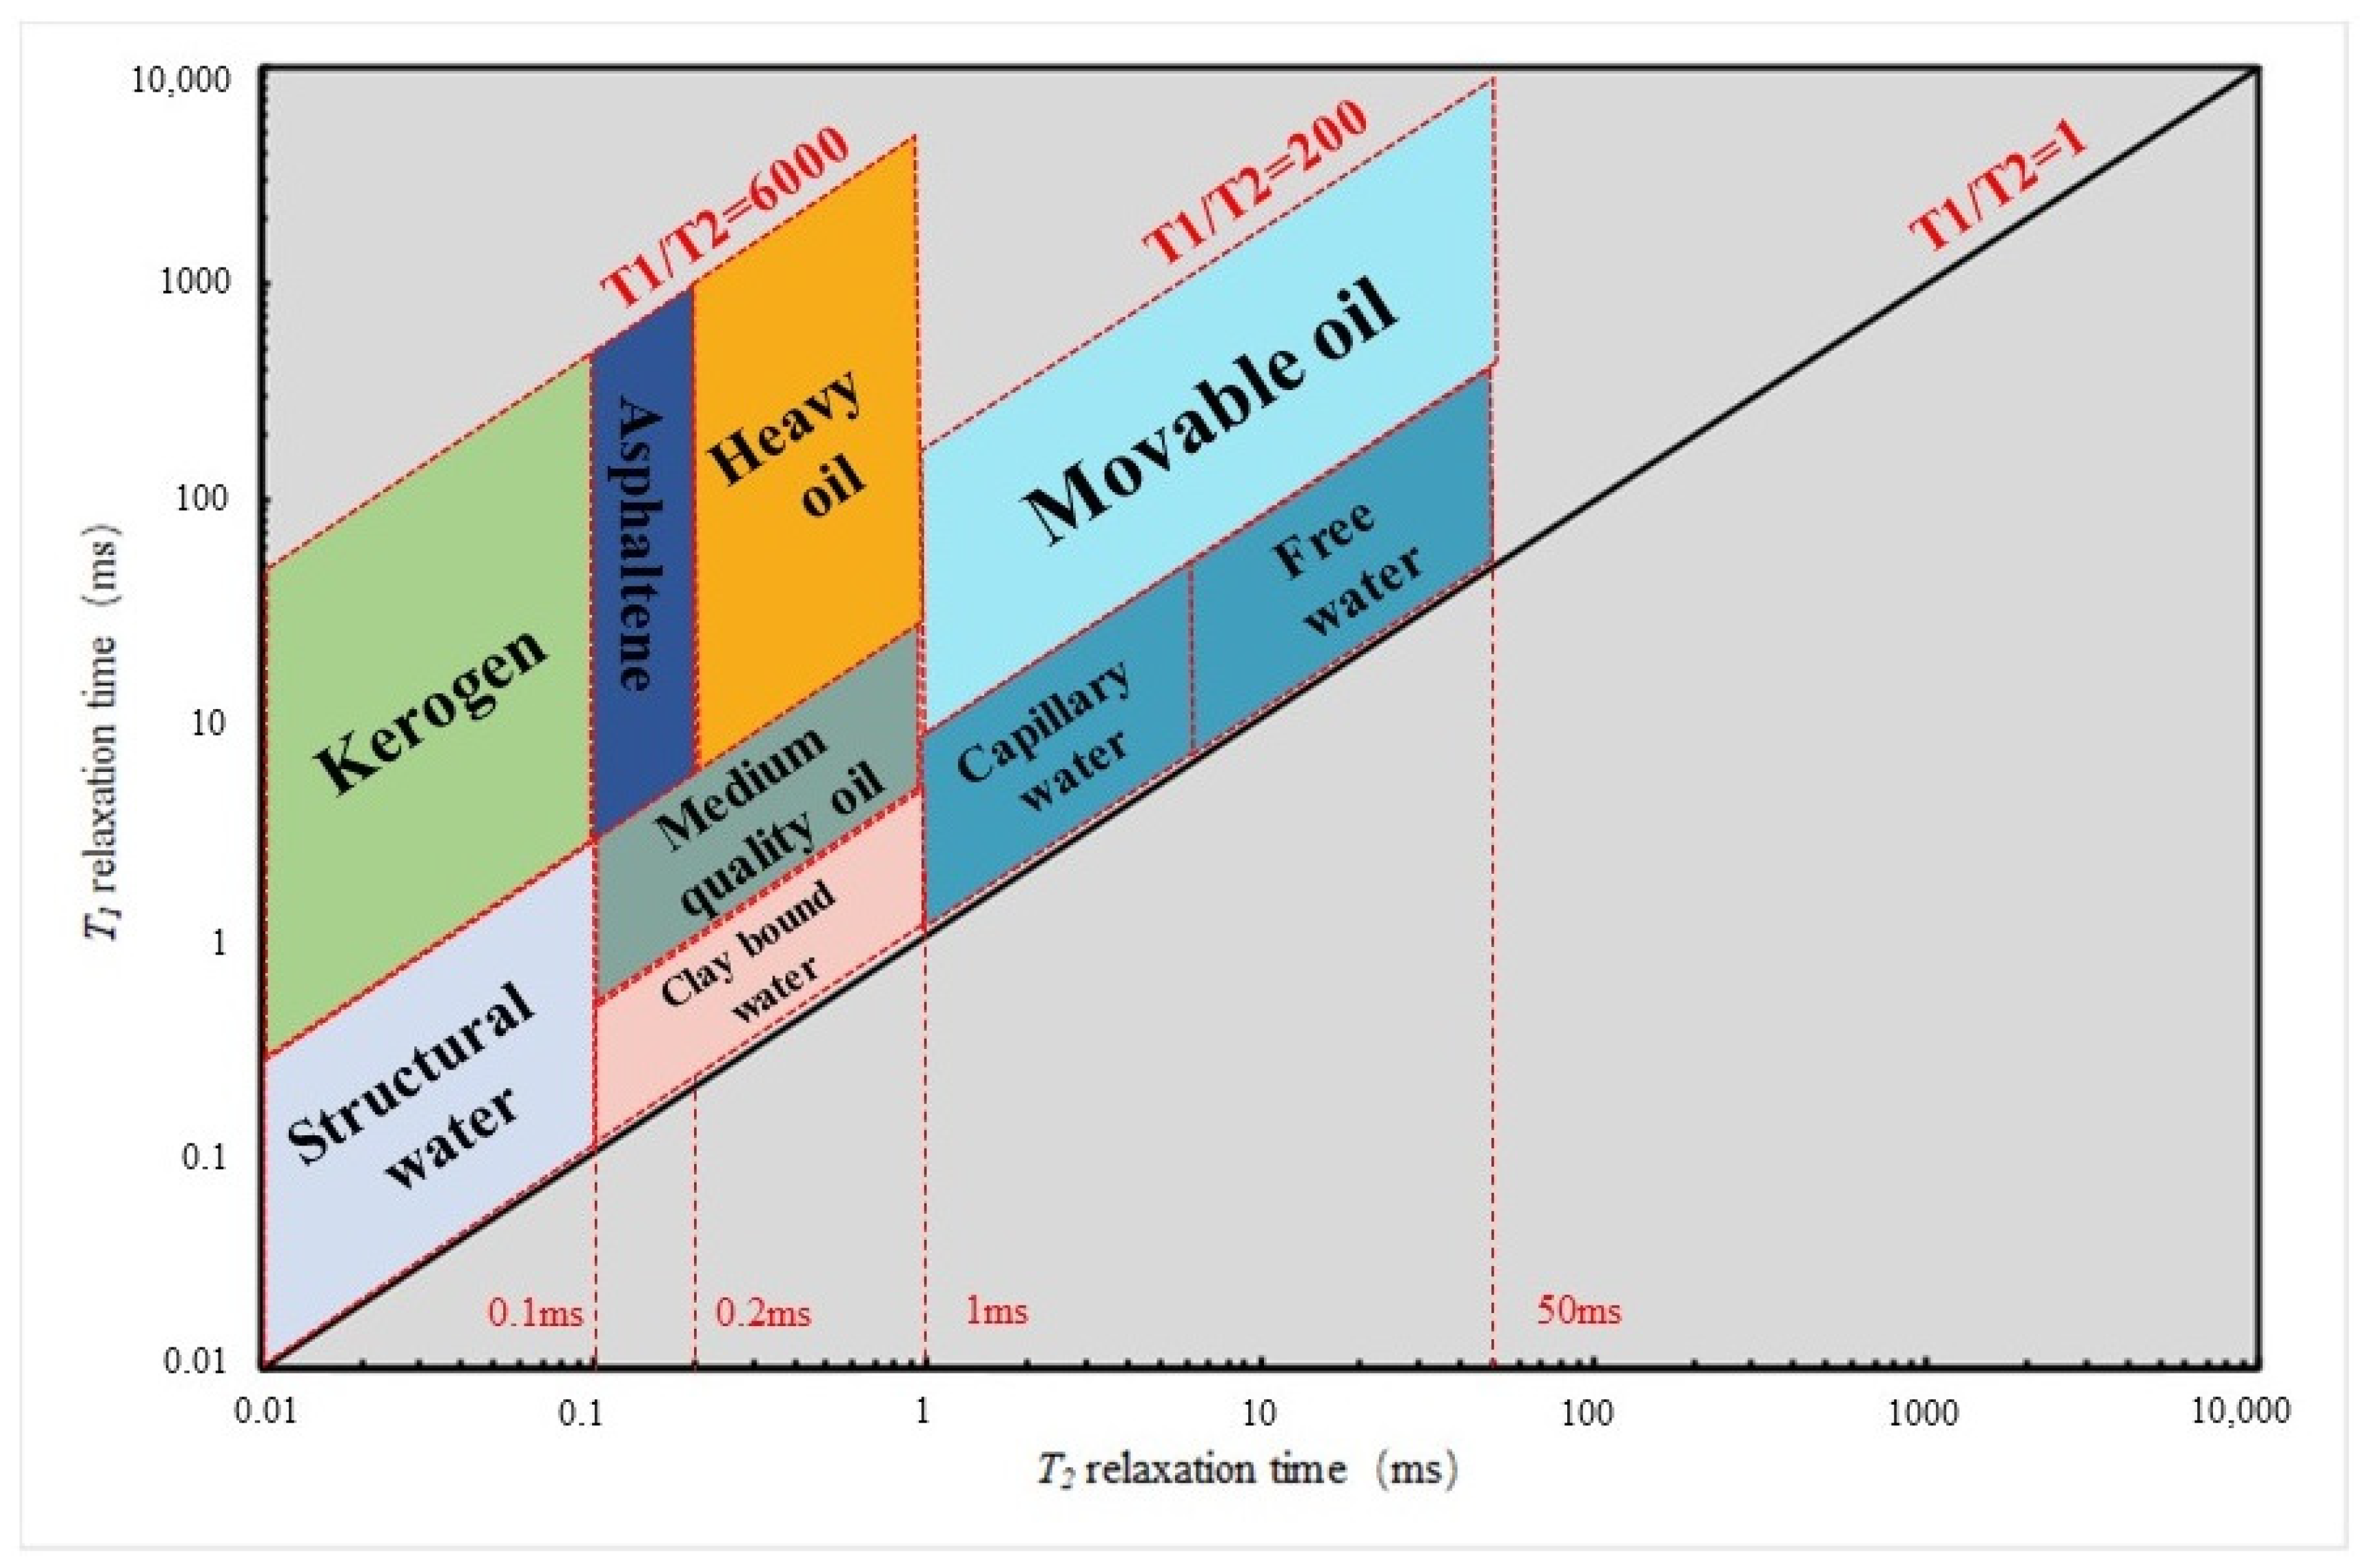
After determining the 2D NMR map distribution locations of different components, this study can segment the 2D map based on these distribution locations. This segmentation enables the establishment of a fluid component identification template specific to the region (Figure 13).

Figure 13.
Component identification template of Gulong shale.
The component identification template for the shale oil reservoir in the Gulong area contains eight distinct constituents: movable oil, free water, medium crude oil, asphaltenes, capillary water, clay-bound water, structural water, and kerogen. The analysis revealed unique characteristics of this template in the Gurung region. The distinct 2D NMR map features of the various components in the Gulong shale exhibit obvious temperature-dependent variations, suggesting an oil-rich and complex hydrocarbon composition, including a minor constituent of asphaltene. The coexistence of oil and water within the clay-bound spaces complicates the identification of components using 2D NMR. Although the content of free water is low, there is a notable amount of water bound to clay. The component template offers extensive coverage on the 2D map, ensuring its suitability for the intricate oil and gas distribution in the Gulong area. The 2D map also has distribution on the right side, suggesting the presence of hydrocarbons within larger pore spaces and involving a broader range of pore spaces. The component identification template derived from this study is capable of detecting components with T2 relaxation times less than 0.2 ms, which is crucial for assessing the kerogen content and maturity levels of the components in this region. The establishment and analysis of the component template for shale oil in the Gulong area validate the rationality and applicability of multi-state saturation, multi-temperature pyrolysis with NMR measurements, and multi-temperature QOWDEs for researching shale oil reservoir components. This methodology enables a more fine-grained classification of shale oil reservoir components, precisely locating their positions on 2D maps. The formulated template lays the foundation for future qualitative and quantitative analyses of shale oil components.
4.2. Porosity
After establishing the fluid component identification template, components within the shale’s 2D NMR map can be categorized into pore and non-pore components. These categories correspond to the pore space and non-pore space of the shale oil reservoir, respectively. Within the shale oil reservoirs of the Gulong area, the component template categorizes movable oil, free water, capillary water, clay-bound water, medium oil, and asphaltene as pore components that occupy the pore spaces. The remaining components are classified as non-pore components occupying the non-pore spaces. Once the pore and non-pore components are identified, the porosity of shale oil can be determined using 2D NMR spectroscopy.
The 2D NMR map from both the oil and water saturation experiments contains not only the introduced oil and water components but also all the residual components present in the original samples, rendering the most comprehensive 2D NMR map. Nonetheless, some pores may be saturated with both phases; thus, the resulting map from the oil and water cannot be directly summed to represent the complete 2D NMR map of the sample. This study superimposes the original data from the oil-saturated and water-saturated 2D NMR map. By selecting the maximum value in the overlapping region, this study establishes a composite 2D NMR map representing a dual-saturated state. This approach eliminates the effects of signal overlap, yielding a comprehensive 2D NMR map of all components. Then, the individual porosity components of each pore constituent can be calculated by revising the signal intensity of the 2D NMR map to porosity. The aggregate of these components provides the overall 2D NMR porosity.
Through this approach, this study calculated the 2D NMR porosity for 10 samples from the Gulong area and compared these results with the experiment porosity of the corresponding cores (Table 2). In the Gulong area, the porosity values obtained via 2D NMR and the QOWDE exhibit an average difference of 0.58%, with the maximum difference being 1.27% and the minimum being 0.08%. This indicates that the two methods are substantially consistent.
Table 2.
Porosity comparison table of 2D NMR and experiment.
The results also validate the feasibility of calculating shale porosity using the 2D NMR map and a component identification template. The 2D NMR effectively captures the majority of fluid components under experimental conditions, thus enhancing the accuracy of porosity calculations. This provides a novel approach for the accurate determination of shale porosity.
4.3. Movable Oil Saturation
Similarly, movable oil saturation in shale oil reservoirs can be calculated. Firstly, the 2D NMR maps from both oil-saturated and water-saturated samples are superimposed using the method introduced in Section 4.2, yielding a dual-saturated 2D NMR map. Based on the fluid identification template, fluid components, and movable oil components can be distinguished, where the ratio of the signal intensity of movable oil components to that of the fluid components indicates movable oil saturation. Through this approach, this study calculated the 2D NMR movable oil saturation for 10 samples from the Gulong area and compared these results with the experimental movable oil saturation of the corresponding cores (Table 3). The difference between the two methods was minor, with a maximum of 2.3%, a minimum of 0.7%, and an average of 1.39%.
Table 3.
Saturation comparison table of 2D NMR and experiment.
This validates the reliability of the approach for calculating shale’s movable oil saturation via integrating the 2D NMR map with the component identification template. The development of this template promotes the intuitiveness and precision of the saturation calculation.
5. Conclusions
This study made full use of 2D NMR and other rock physics experiments to characterize the fluid component of the Gulong shale reservoir and verified the experimental method and occurrence mechanism. According to the results, the following conclusions can be drawn:
- (1)
- This study designed a new heating sequence based on the properties of shale components to conduct pyrolysis experiments and QOWDEs on shale. By proposing the concept of hydrogen content and combining it with 2D NMR experiments, qualitative and quantitative calculations of shale components have been achieved.
- (2)
- Experiments using 2D NMR were conducted on shale samples in nine different states. By analyzing the T1-T2 maps, a component identification template that includes nine components for the Gulong shale reservoir was created. Compared to other templates, this template is more detailed and accurate. This helps to identify fluids in shale and guides to a better study of fluid occurrence states.
- (3)
- Based on the composition template, this study conducted porosity and saturation calculations by using 2D NMR, which is a new calculation method. As a result, this study provides new experimental ideas and technical support for the study of the porosity and saturation of shale.
- (4)
- Compared with previous studies, the results of this study qualitatively and quantitatively explain shale components, improving the accuracy of shale component research. Moreover, the identification template developed in this study can identify more fluids in shale reservoirs, expanding the applications of 2D NMR core analyses in order to better evaluate reservoirs.
Author Contributions
Conceptualization, F.S. and J.S.; data curation, M.W.; formal analysis, F.S. and J.S.; funding acquisition, F.S. and J.S.; investigation, F.S. and J.S.; methodology, F.S.; project administration, P.C. and J.S.; resources, J.S.; supervision, J.S.; validation, M.W. and P.C.; writing—original draft, F.S.; writing—review and editing, F.S. and J.S. All authors have read and agreed to the published version of the manuscript.
Funding
This research was funded by the National Natural Science Foundation of China (No. 42174143).
Data Availability Statement
The data presented in this study are available on request from the corresponding author.
Conflicts of Interest
The authors declare no conflicts of interest.
References
- He, W.Y.; Meng, Q.; Feng, Z.H.; Zhang, J.Y.; Wang, R. In-situ accumulation theory and exploration & development practice of Gulong shale oil in Songliao Basin. Acta Pet. Sin. 2022, 43, 1–14. [Google Scholar]
- Wang, G.Y.; Wang, F.L.; Meng, Q.A.; Gu, S.F. Strategic significance and research direction for Gulong shale oil. Pet. Geol. Oilfield Dev. Daqing 2020, 39, 8–19. [Google Scholar]
- He, W.; Feng, Z.; Zhang, J.; Bai, Y.; Fu, X.; Zhao, Y.; Cheng, X.; Gao, B.; Liu, C. Characteristics of geological section of W ell GY 8HC in Gulong Sag, Northern Songliao Basin. Pet. Reserv. Eval. Dev. 2022, 12, 1–9. [Google Scholar]
- Tian, C.; Li, Y.; Li, D.; Zhang, W.; Zhong, K.; Zhou, S.; Luo, C.; Jiang, W.; Li, D.; He, L.; et al. Selection and recommendation of shale reservoir porosity measurement methods. Nat. Gas Ind. 2023, 43, 57–65. [Google Scholar]
- Tian, H.; Zou, C.; Liu, S. Reservoir porosity measurement uncertainty and its influence on shale gas resource assessment. Acta Geol. Sin. -Engl. Ed. 2020, 94, 233–242. [Google Scholar] [CrossRef]
- Siswandani, A.; Nurhandoko, B. Development of porosity measurement method in shale gas reservoir rock. J. Phys. Conf. Ser. 2016, 01, 012019. [Google Scholar] [CrossRef]
- Sun, M.; Yu, B.; Hu, Q. Pore characteristics of Longmaxi shale gas reservoir in the Northwest of Guizhou, China: Investigations using small-angle neutron scattering (SANS), helium pycnometry, and gas sorption isotherm. Int. J. Coal Geol. 2017, 171, 61–68. [Google Scholar] [CrossRef]
- Yuan, Y.; Rezaee, R. Comparative porosity and pore structure assessment in shales: Measurement techniques, influencing factors and implications for reservoir characterization. Energies 2019, 12, 2094. [Google Scholar] [CrossRef]
- Fu, Y.; Jiang, Y.; Chen, H.; Zhou, K.; Qiu, X.; Zhang, H.; Liu, X.; Gu, Y.; Jiang, Z. Analysis and enlightenment of porosity differences between shale plug samples and crushed samples. Pet. Geol. Exp. 2020, 42, 302–310. [Google Scholar]
- Sun, D.; Wang, X.; Feng, Z.; Shao, H.; Zeng, H.; Gao, B.; Jiang, H. Formation mechanisms of nano-scale pores/fissures and shale oil enrichment characteristics for Gulong shale, Songliao Basin. Oil Gas Geol. 2023, 44, 1350–1365. [Google Scholar]
- Wang, X.E.; Li, Q.C.; Tian, F.L. The promotion and application of pyrolysis chromatography analysis technology in the evaluation of reservoir oil and gas properties. Fault-Block Oil Field 2005, 05, 26–31. [Google Scholar]
- Li, J.; Jin, W.; Wang, L.; Wu, Q.; Lu, J.; Hao, S. Quantitative evaluation of organic and inorganic pore size distribution by NMR: A case from the Silurian Longmaxi Formation gas shale in Fuling a area, Sichuan Basin. Oil Gas Geol. 2016, 37, 129–134. [Google Scholar]
- Ma, R.; Wang, M.; Li, J.B.; Lu, S.F.; Guo, Z.Q.; Cao, Y.X. Experimental discussion of heating release method in quantitative evaluation of adsorbed shale oil. Pet. Geol. Eng. 2019, 33, 9–14. [Google Scholar]
- Xu, C.; Xie, R.; Guo, J.; Jin, J.; Jin, G.; Fan, W.; Xiao, L. Comprehensive characterization of petrophysical properties in shale by solvent extraction experiments and 2D NMR. Fuel 2023, 335, 114–126. [Google Scholar] [CrossRef]
- Jiang, Q.; Li, M.; Qian, M.; Li, Z.; Li, Z.; Huang, Z.; Zhang, C.; Ma, Y. Quantitative characterization of shale oil in different occurrence states and its appl ication. Pet. Geol. Exp. 2016, 38, 842–849. [Google Scholar]
- Liu, N.; Zheng, S.L. Core fluorescence image acquisition and fluorescence analysis technology. Pet. Geol. Eng. 2021, 35, 1–5. [Google Scholar]
- Wu, X.H.; Teng, Q.Z.; Wang, Z.Y. The mosaic technology of core fluorescent image with low illumination. J. Sichuan Univ. (Nat. Sci. Ed.) 2008, 10, 96–100. [Google Scholar]
- Chen, C.X.; Xiu, L.C.; Gao, Y. Research on date processing of core spectral scanner. Spectrosc. Spectr. Anal. 2019, 39, 1630–1636. [Google Scholar]
- Xie, R.H.; Xiao, L.Z. The (T2,D) NMR logging method for fluids charaterization. Chin. J. Geophys. 2009, 52, 2410–2418. [Google Scholar]
- Xie, R.H.; Xu, C.Y.; Guo, J.F.; Jin, G.W.; Fu, J.W. Simulation experiment of shale fluid saturation evaluation using two-dimensional nuclear magnetic resonance. Res. Explor. Lab. 2024, 43, 94–98. [Google Scholar]
- Zhang, P.F.; Lu, S.F.; Li, J.Q.; Chang, X.C. 1D and 2D Nuclear magnetic resonance (NMR) relaxation behaviors of protons in clay, kerogen and oil-bearing shale rocks. Mar. Pet. Geol. 2020, 114, 104210. [Google Scholar] [CrossRef]
- Ma, Y.; Wang, H.T.; Wang, W.M.; Zhou, S.X.; Ding, Y.; Pan, J.L.; Fu, D.L.; Li, J. The application of nuclear magnetic resonance T1-T2 maps in the research of sedimentary organic matter: A case study of early mature shale with type I kerogen. J. Pet. Sci. Eng. 2020, 194, 107447. [Google Scholar] [CrossRef]
- Ge, X.M.; Fan, Y.R.; Chen, H.; Deng, S.G.; Cao, Y.C.; Zahid, M. Probing the influential factors of NMR T1–T2 spectra in the characterization of the kerogen by numerical simulation. J. Magn. Reson. 2015, 260, 54–66. [Google Scholar] [CrossRef]
- Du, Q.J.; Xiao, L.Z.; Zhang, Y.; Liao, G.Z.; Liu, H.B.; Guo, J.F. A novel two-dimensional NMR relaxometry pulse sequence for petrophysical characterization of shale at low field. J. Magn. Reson. 2020, 310, 106643. [Google Scholar] [CrossRef]
- Michal, C.A. Low-cost low-field NMR and MRI: Instrumentation and applications. J. Magn. Reson. 2020, 319, 106800. [Google Scholar] [CrossRef]
- Golsanami, N.; Sun, J.; Zhang, Z. A review on the applications of the nuclear magnetic resonance (NMR) technology for investigating fractures. J. Appl. Geophys. 2016, 133, 30–38. [Google Scholar] [CrossRef]
- Liu, Z.; Liu, D.; Cai, Y.; Yao, Y.; Pan, Z.; Zhou, Y. Application of nuclear magnetic resonance (NMR) in coalbed methane and shale reservoirs: A review. Int. J. Coal Geol. 2020, 218, 103261. [Google Scholar] [CrossRef]
- Hu, F.; Zhou, C.; Li, C.; Xu, H.; Zhou, F.; Si, Z. Fluid identification method based on 2D diffusion-relaxation nuclear magnetic resonance (NMR). Petrol. Explor. Dev. 2012, 39, 591–596. [Google Scholar] [CrossRef]
- Medina-Rodriguez, B.X.; Reilly, T.; Wang, H.; Smith, E.R.; Garcia-Olvera, G.; Alvarado, V.; Aryana, S. Time-domain nuclear Magnetic resonance determination of wettability alteration: Analysis for low-salinity water. Appl. Sci. 2020, 10, 1017. [Google Scholar] [CrossRef]
- Yan, W.; Sun, J.; Golsanami, N.; Li, M.; Cui, L.; Dong, H.; Sun, Y. Evaluation of wettabilities and pores in tight oil reservoirs by a new experimental design. Fuel 2019, 252, 272–280. [Google Scholar] [CrossRef]
- Khatibi, S.; Ostadhassan, M.; Xie, Z.H.; Gentzis, T.; Bubach, B.; Gan, Z.; Carvajal-Ortizb, H. NMR relaxometry a new approach to detect geochemical properties of organic matter in tight shales. Fuel 2019, 235, 167–177. [Google Scholar] [CrossRef]
- Zhang, S.L.; Wang, M.; Zhu, X.J.; Li, C.H.; Cai, J.G.; Yan, J.P. Oil saturation quantitative evaluation in lacustrine shale: Novel insights from NMR T1-T2 and displacement experiments. Fuel 2024, 371, 132062. [Google Scholar] [CrossRef]
- Sun, J.; Chen, J.; Yang, Z.; Liu, X.; Liu, Y. Experimental study of the NMR characteristics of shale reservoir rock. Sci. Technol. Rev. 2012, 30, 25–30. [Google Scholar]
- Shi, Y.; Cai, W.; Liu, G.; Yuan, C.; Zhang, W.; Zhi, S.; Li, S.; Wang, S. Full diameter core 2D NMR spectrum characteristics of pore fluid in shale oil reservoir and evaluation method. China Pet. Explor. 2023, 28, 132–144. [Google Scholar]
- Yan, W.; Sun, J.; Cheng, Z.; Li, J.; Sun, Y.; Shao, W.; Shao, Y. Petrophysical characterization of tight oil formations using 1D and 2D NMR. Fuel 2017, 206, 89–98. [Google Scholar] [CrossRef]
- Fleury, M.; Romero-Sarmiento, M. Characterization of shales using T1–T2 NMR maps. J. Pet. Sci. Eng. 2016, 137, 55–62. [Google Scholar] [CrossRef]
- Dong, H.M.; Sun, J.M.; Zhu, J.J. Quantitative characterization and characteristic analysis of pore structure of shale-gas reservoir in Sichuan Basin, China. Interpretation 2019, 7, 23–32. [Google Scholar] [CrossRef]
- Zhang, Y.; Yang, J.; Hu, M.; Qin, D.; Feng, T. Microscopic pore structure of shale reservoir in Member 1 of Qingshankou Formation, Daan Area of southern Songliao Basin. Spec. Oil Gas Reserv. 2023, 30, 58–66. [Google Scholar]
- Liu, B.; Sun, J.; Zhang, Y.; He, J.; Fu, X.; Yang, L.; Xing, J.; Zhao, X. Reservoir space and enrichment model of shale oil in the first member of Cretaceous Qingshankou Formation in the Changling Sag, southern Songliao Basin, NE China. Pet. Explor. Dev. 2021, 48, 521–535. [Google Scholar] [CrossRef]
- Liu, B.; Shi, J.; Fu, X.; Lv, Y.; Sun, X.; Gong, L.; Bai, Y. Petrological characteristics and shale oil enrichment of lacustrine fine-grained sedimentary system: A case study of organic-rich shale in first member of Cretaceous Qingshankou Formation in Gulong Sag, Songliao Basin, NE China. Pet. Explor. Dev. 2018, 45, 828–838. [Google Scholar] [CrossRef]
- Yan, W.; Zhang, Z.; Chen, L.; Zhao, Z.; Wang, W. New evaluating method of oil saturation in Gulong shale based on NMR technique. Pentroleum Geol. Oilfield Dev. Daqing 2021, 40, 78–86. [Google Scholar]
- Chen, B.; Pan, S.; Fang, L.; Zhang, Q.; Li, C.; Liang, S. Reservoir characteristics of mud shale layers in the Qingshankou Formation of the Qijia-Gulong Depression in the Songliao Basin. Nat. Gas Geosci. 2016, 27, 298–308. [Google Scholar]
- Liu, S.K.; Wang, S.X.; Jiang, Q.; Zhao, L.X.; Jiang, Y.A.; Zhao, M.L. Method for determining the hydrogen content index of rock samples using thermal neutron transmission. Well Logging Technol. 1981, 6, 25–28. [Google Scholar]


Disclaimer/Publisher’s Note: The statements, opinions and data contained in all publications are solely those of the individual author(s) and contributor(s) and not of MDPI and/or the editor(s). MDPI and/or the editor(s) disclaim responsibility for any injury to people or property resulting from any ideas, methods, instructions or products referred to in the content. |
© 2024 by the authors. Licensee MDPI, Basel, Switzerland. This article is an open access article distributed under the terms and conditions of the Creative Commons Attribution (CC BY) license (https://creativecommons.org/licenses/by/4.0/).