Article

Taking Advantage of Spare Battery Capacity in Cellular Networks to Provide Grid Frequency Regulation

by
Leonardo Dias
1,
Brigitte Jaumard
1,2,* and
Lackis Eleftheriadis
3
1
Department of Computer Science and Software Engineering (CSSE), Concordia University, Montreal, QC H3G 1M8, Canada
2
Confiance IA Consortium, Montreal, QC H3G 1M8, Canada
3
Cognitive Automation Lab, Ericsson Research, Kista, 164 83 Stockholm, Sweden
*
Author to whom correspondence should be addressed.
Energies 2024, 17(15), 3775; https://doi.org/10.3390/en17153775
Submission received: 13 May 2024 / Revised: 15 July 2024 / Accepted: 25 July 2024 / Published: 31 July 2024
(This article belongs to the Section D: Energy Storage and Application)

Abstract

:
The increasing use of renewable energies places new challenges on the balance of the electricity system between demand and supply, due to the intermittent nature of renewable energy resources. However, through frequency regulation (FR) services, owners of battery storage systems can become an essential part of the future smart grids. We propose a thorough first study on the use of batteries associated with base stations (BSs) of a cellular network, to participate in ancillary services with respect to FR services, via an auction system. Trade-offs must be made among the number of participating BSs, the degradation of their batteries and the revenues generated by FR participation. We propose a large-scale mathematical programming model to identify the best participation periods from the perspective of a cellular network operator. The objective is to maximize profit while considering the aging of the batteries following their usage to stabilize the electrical grid. Experiments are conducted with data sets from different real data sources. They not only demonstrate the effectiveness of the optimization model in terms of the selection of BSs participating in ancillary services and providing extra revenues to cellular network operators, but also show the feasibility of ancillary services being provided to cellular network operators.

1. Introduction

The recent increase in the integration of renewable energy sources into the power grid presents several challenges for utility companies. With renewable energy sources that are intermittent natural resources, such as wind and solar, the electricity grid becomes more volatile. They make the power grid more difficult to control and operate and, in particular, create an imbalance between production and consumption [1]. In this context, ancillary services (ASs) are receiving increasing attention to ensure the stability and reliability of the power grid. ASs refer to services provided by various actors within the power grid to support the continuous flow of electricity, beyond electricity generation and transmission. Traditionally, these services were supported by large production units; however, with the development of smart grid technologies, ASs can be scaled up and extended to enable the participation of smaller distributed units with inter-operated clusters to behave as one entity.
Along this direction, an Ericsson study [2] proposed the use of distributed access points (and their associated batteries) of communication service providers (CSPs) to support the electrical grid via ASs with a response mechanism for power adjustments toward the power grid. Furthermore, the Ericsson study describes the need to efficiently inter-operate BSs to participate in ASs and details technologies/functionalities to enable such a service on a cellular network infrastructure. See also [3] for another preliminary study with Vodafone.
Therefore, there is unexplored potential for CSPs to participate in power system ancillary services, creating a novel business opportunity with a new revenue opportunity. The objective of this paper is to go beyond this preliminary study and examine in more detail what this implies in terms of the battery use of BS clusters, as well as the expected revenues gained from participation in auctions related to ancillary services provided by BSs.

2. Background

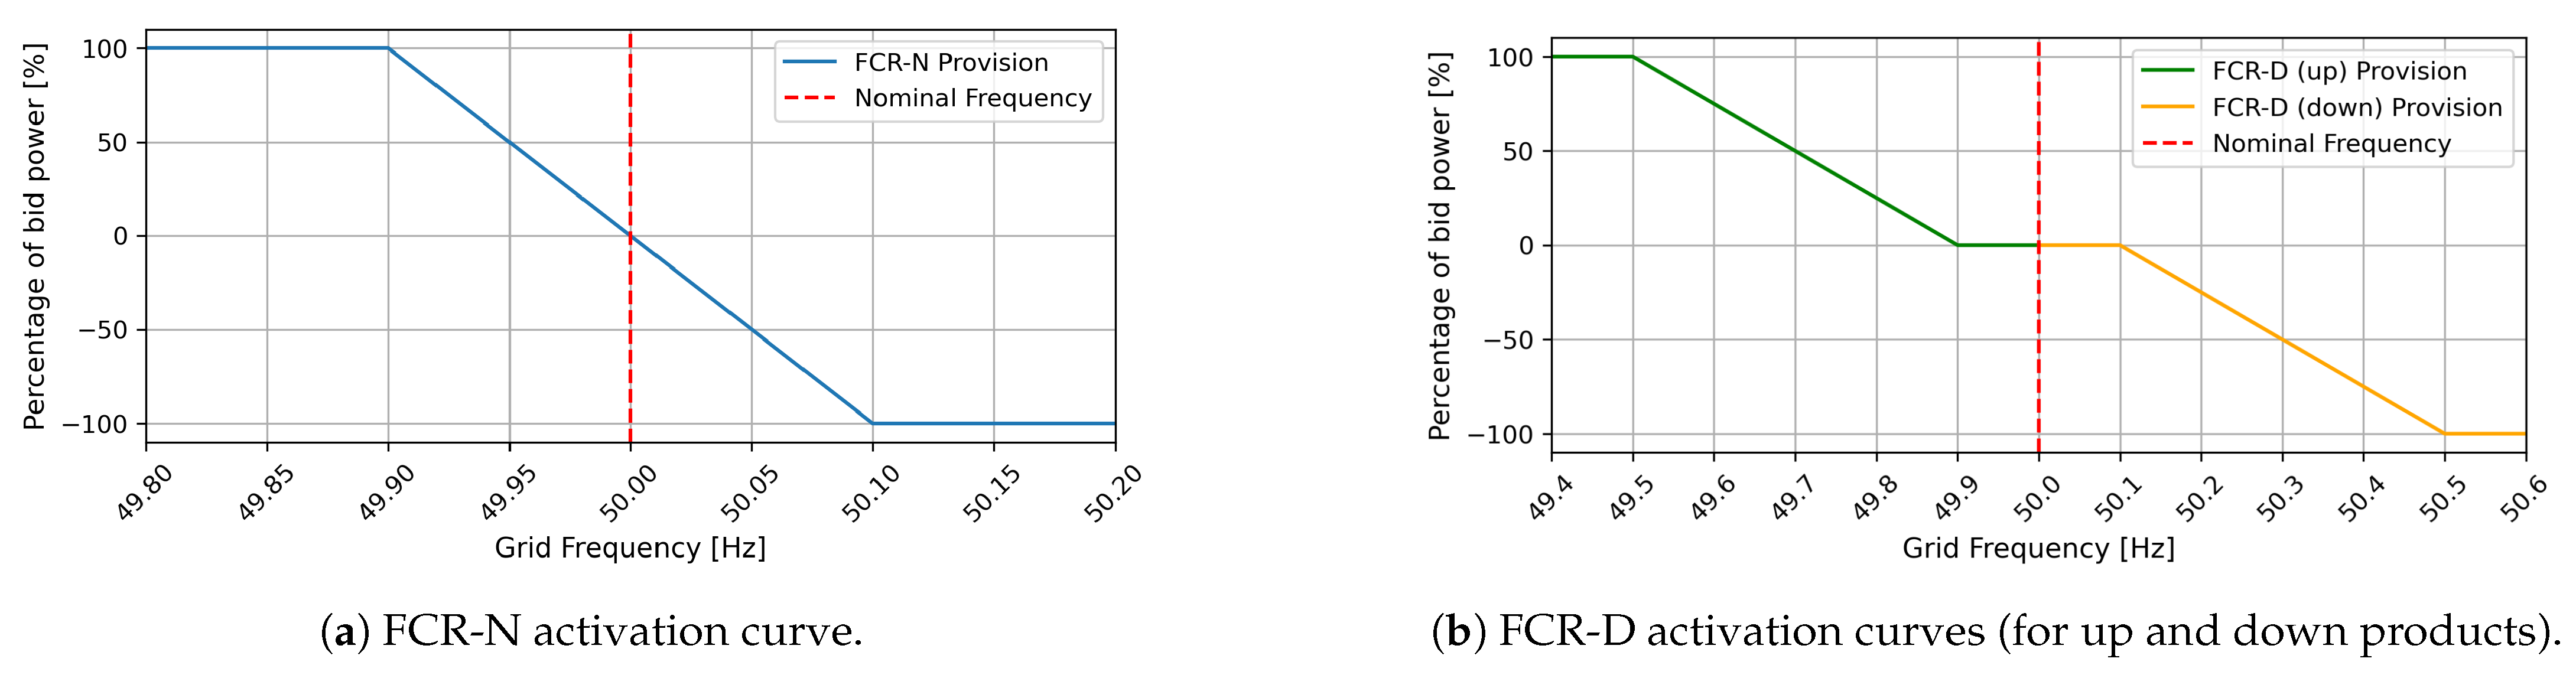
2.1. Frequency Regulation in Modern Power Systems

Among the ASs, the frequency regulation (FR) service is the mechanism for power adjustments within a grid, responding to locally sensed changes in power grid frequency [4]. In other words, customers trade energy to receive special incentives, by increasing or decreasing their grid energy production (or consumption) [5] adding a new revenue stream. This involves supporting the network to stabilize the nominal frequency (50 Hz/60 Hz) within the required thresholds. These adjustments are intended to maintain the balance between generation and consumption and are essential for utility power distribution systems to ensure reliable operation of the power grid [6].
Nowadays, CSPs are heavily investing in fifth-generation (5G) infrastructure and considerably expanding their base stations (BSs) in a distributed fashion. According to [7], the average density of 5G base stations (BS) is expected to be three times higher than that of the fourth generation (4G), and, by 2025, the worldwide number of 5G BSs is anticipated to be 65 million. Considering the increased demand for energy, CSPs could utilize their backup network assets as local energy storage during different time periods of the day, to enable support for the power grid providing ASs to the grid. As stated in [8], from a technical point of view, battery energy storage systems have proven to be highly suitable for providing FR due to their fast response capability. Thus, CSPs could extend their business to new industries and reduce their energy operational costs by providing ASs.
In FR services, in order to ensure a stable frequency around its nominal value, the transmission system operator (TSO), via the distribution system operators (DSOs), typically defines three balancing services: primary, secondary, and tertiary frequency control. Each balancing service depends on the time frame in which they should be activated on a specific amount of power capacity that is provided for the regulation. The purpose of the different services and an overview of the requirements for each balancing service available in the Swedish market can be found in [9]. It is worth mentioning that since the rules and requirements may differ among TSOs and countries, from now on, we will adopt the example of the Svenska Kraftnät (Swedish TSO).
As the primary frequency control service (i.e., frequency containment reserve (FCR)) requires a faster reaction time with lower energy content, battery energy storage systems (BESSs) have been advocated as excellent candidates for such services [10]. In this paper, we focus on FCR services. For the Swedish case, two different FCR services are offered: FCR-N (Normal) and FCR-D (Disturbance) for small and larger frequency fluctuations, respectively. Both products are automatically activated by local frequency measurements (when possible) or by a central control (e.g., cloud management system). These measurements are made in a time frame of seconds and reported to the central management system. Further details can be found in the FCR agreement released by Svenska Kraftnät in [11]. Table 1 describes the main requirements and characteristics of both FCR-N and FCR-D products.
As can be noted, FCR-N is an automatic and symmetrical service, which means that volumes for up- and down-regulation may be requested. As such, FCR-N is activated continuously during the entire settled period, following a linear curve when within the “normal operating band” of 50 ± 0.1 Hz. For cases of larger frequency deviations, the service should be fully activated (see Figure 1a). It is worth mentioning that if linear regulation is not possible, step-wise regulation can also be pre-approved (during the pre-qualification step) by the TSO [11]. In order to fulfill the requirements, at least 63% of the capacity must be activated within 60s and 100% within 3 min. Another requirement is service endurance, where providers need to be able to fully activate the service continuously for at least 15 min [11].
On the other hand, FCR-D is divided into two independent and unsymmetrical products, named FCR-D up and FCR-D down (for the upward and downward directions, respectively) [11]. Both products are automatically activated and follow a linear curve when the frequency drops below 49.9 Hz (FCR-D up) or when the frequency is higher than 50.1 Hz (FCR-D down). For cases of deviations higher than ±0.5 Hz, each product should be fully activated (depending on the deviation direction; see Figure 1b). In terms of activation, since FCR-D is a reserve designed for disturbed operation, the requirement is more strict; 50% needs to be activated within 5 s and 100% within 30 s and for the related service endurance, and FCR-D needs to be able to supply the requested power for, at least, 20 min [12,13].
FCR capacities are auctioned on day-ahead bases, on one-hour bidding time-slots with a 0.1 MW minimum power capacity. This means that to be able to participate, a group of small units (or one single larger unit) need to be activated to operate as one entity in order to achieve the minimum required power capacity.
The participants are compensated in a pay-as-bid manner for the procured capacity, while the remuneration for the balancing energy (available only in FCR-N) is calculated hourly based on the activated reserves [1]. It is worth mentioning that if an FCR provider fails to provide the energy promised on the day-ahead market, they must pay a penalty equal to the missing capacity fee. Table 2 shows the mean clearing prices (and standard deviation) of the Swedish FCR market from January 2017 to September 2022. Significant variability in price can be observed during these years. Note that the FCR-D (down) service was implemented only in January 2022.

2.2. Frequency Regulation Market

We focus here on the Swedish electricity market, more specifically on FCR services (FCR-N and FCR-D). Although differences exist from country to country, there are many similarities, and the results of this study should be easy to adapt to the regulations of other countries. Both FCR-N and FCR-D products are negotiated one day (D-1) or two days (D-2) prior to the delivery day in electricity markets organized at a national level by TSOs and negotiated in the Nord Pool platform. Auctions between the providers and retailers are carried out to set the price for each time-slot of the next day, and time-slots are auctioned on hourly basis. The maximum block sizes are three and six hours for D-1 and D-2, respectively. On the next day (adjustment day), winning bidders must constantly monitor the grid frequency and, in case of deviations, should activate the pre-accorded capacity based on a linear activation curve (see Figure 1).
Note that prior to any bid being submitted, potential participants must be approved by a pre-qualification step, throughout a series of checks and tests followed by the TSO. Therefore, to be eligible to participate in an FCR, providers must follow a set of minimum technical requirements and protocols. The main technical requirements are presented in Table 1. Although relatively similar, each FCR service has different requirements.
Regarding remunerations, as mentioned before, participants are compensated in a pay-as-bid manner for the procured capacity in both products. However, for the supplied balancing energy, only FCR-N ensures payment. The latter is calculated hourly based on the activated reserves, and the compensation is defined in accordance with the price of the regulating power market [1].

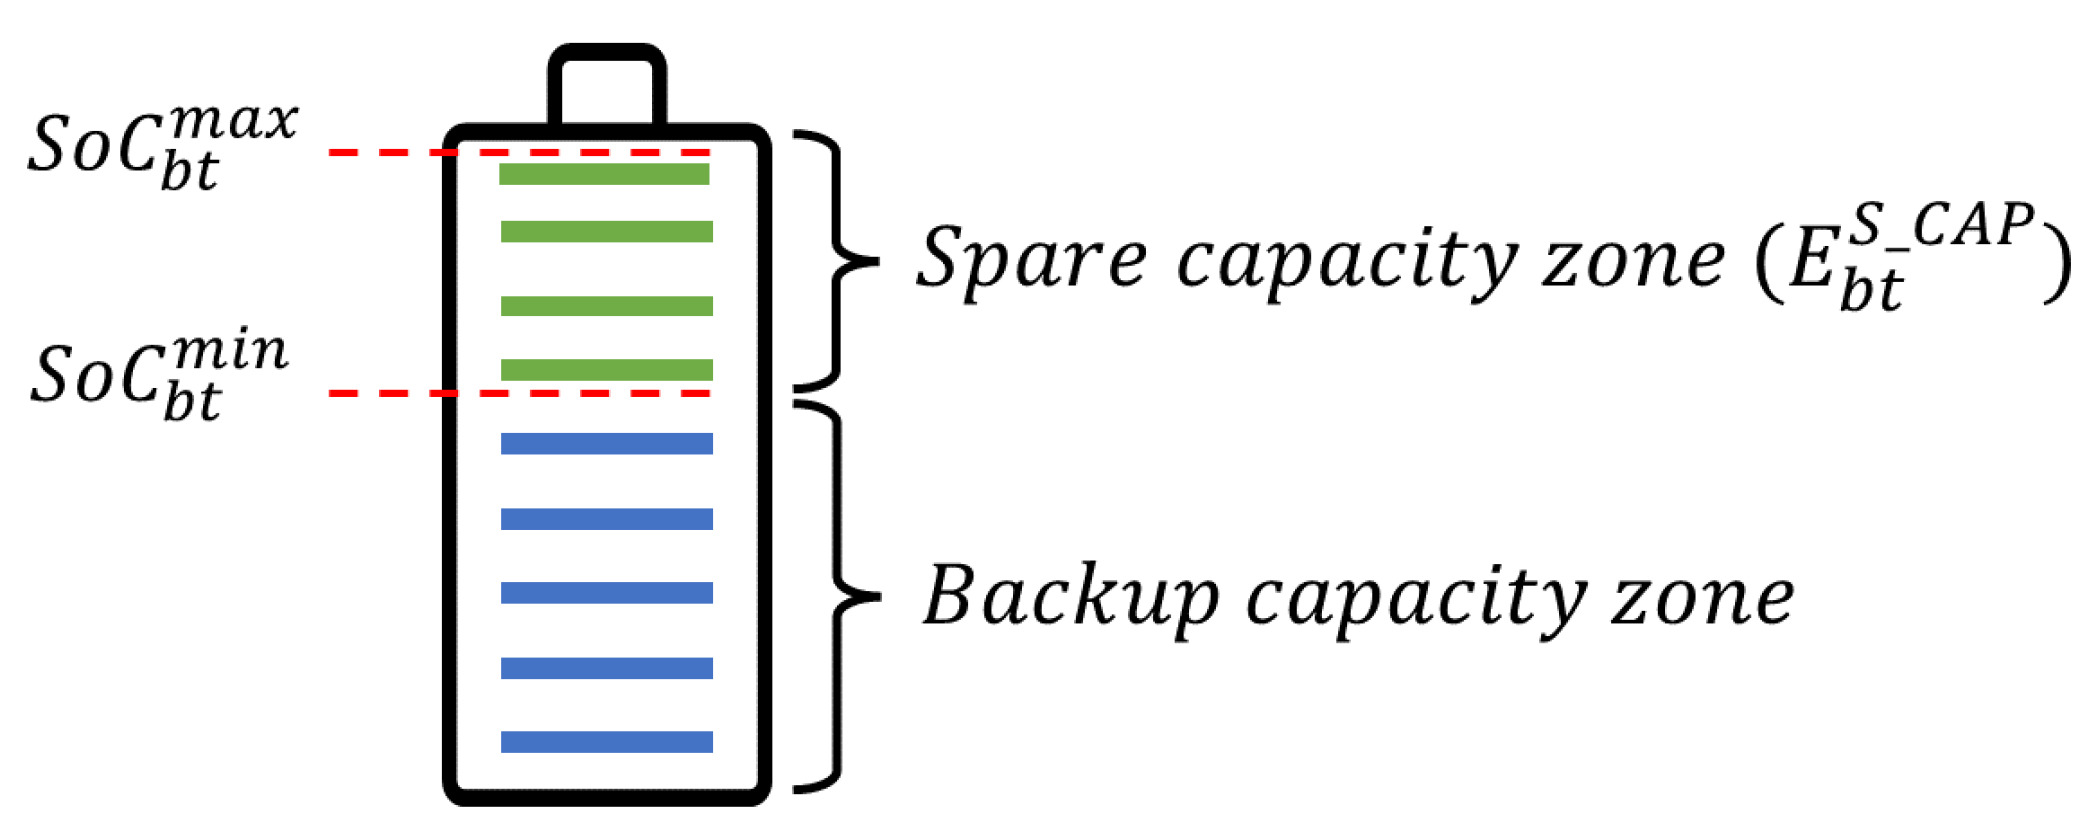
2.3. Battery Characteristics of BSs

Besides connecting to the utility power grid, each radio BS is also equipped with backup battery units to maintain high service availability in case of a power outage. Thus, when a power outage happens, the battery unit discharges to support the communication infrastructure until the electrical grid recovers. Note that CSPs are obligated by local authorities to provide some backup power to BSs during emergency situations, with a typical requirement of three hours of battery life.
In terms of batteries, lead-acid is the most used technology in BS systems due to its maturity, high capacity, and low cost. However, in the past few years, CSPs have started to use lithium-ion (Li-ion) batteries as well. Li-ion batteries represent the latest development in battery technology due to their smaller size, lower weight, high efficiency, and high density, but one major drawback is their higher initial cost (e.g., compared to lead-acid) [15].
A typical battery system for a BS consists of two or four strings of four 12 V batteries ranging between 100 Ah and 200 Ah in capacity [2]. It should be highlighted that the battery capacity is dimensioned to meet the site’s load and power autonomy requirements. However, in practice, BSs’ battery systems are often over-dimensioned due to the modularity, redundancy, degradation, and future additional load requirements [4]. Additionally, in cellular networks, power consumption is directly related to network traffic and the number of active radio units installed (i.e., when the communication traffic varies during the day, the power load changes accordingly). Therefore, the minimum reserved energy capacity for contingency situations varies over time, leading to a spare capacity that could be used for other purposes (such as providing ASs) during low-traffic periods.

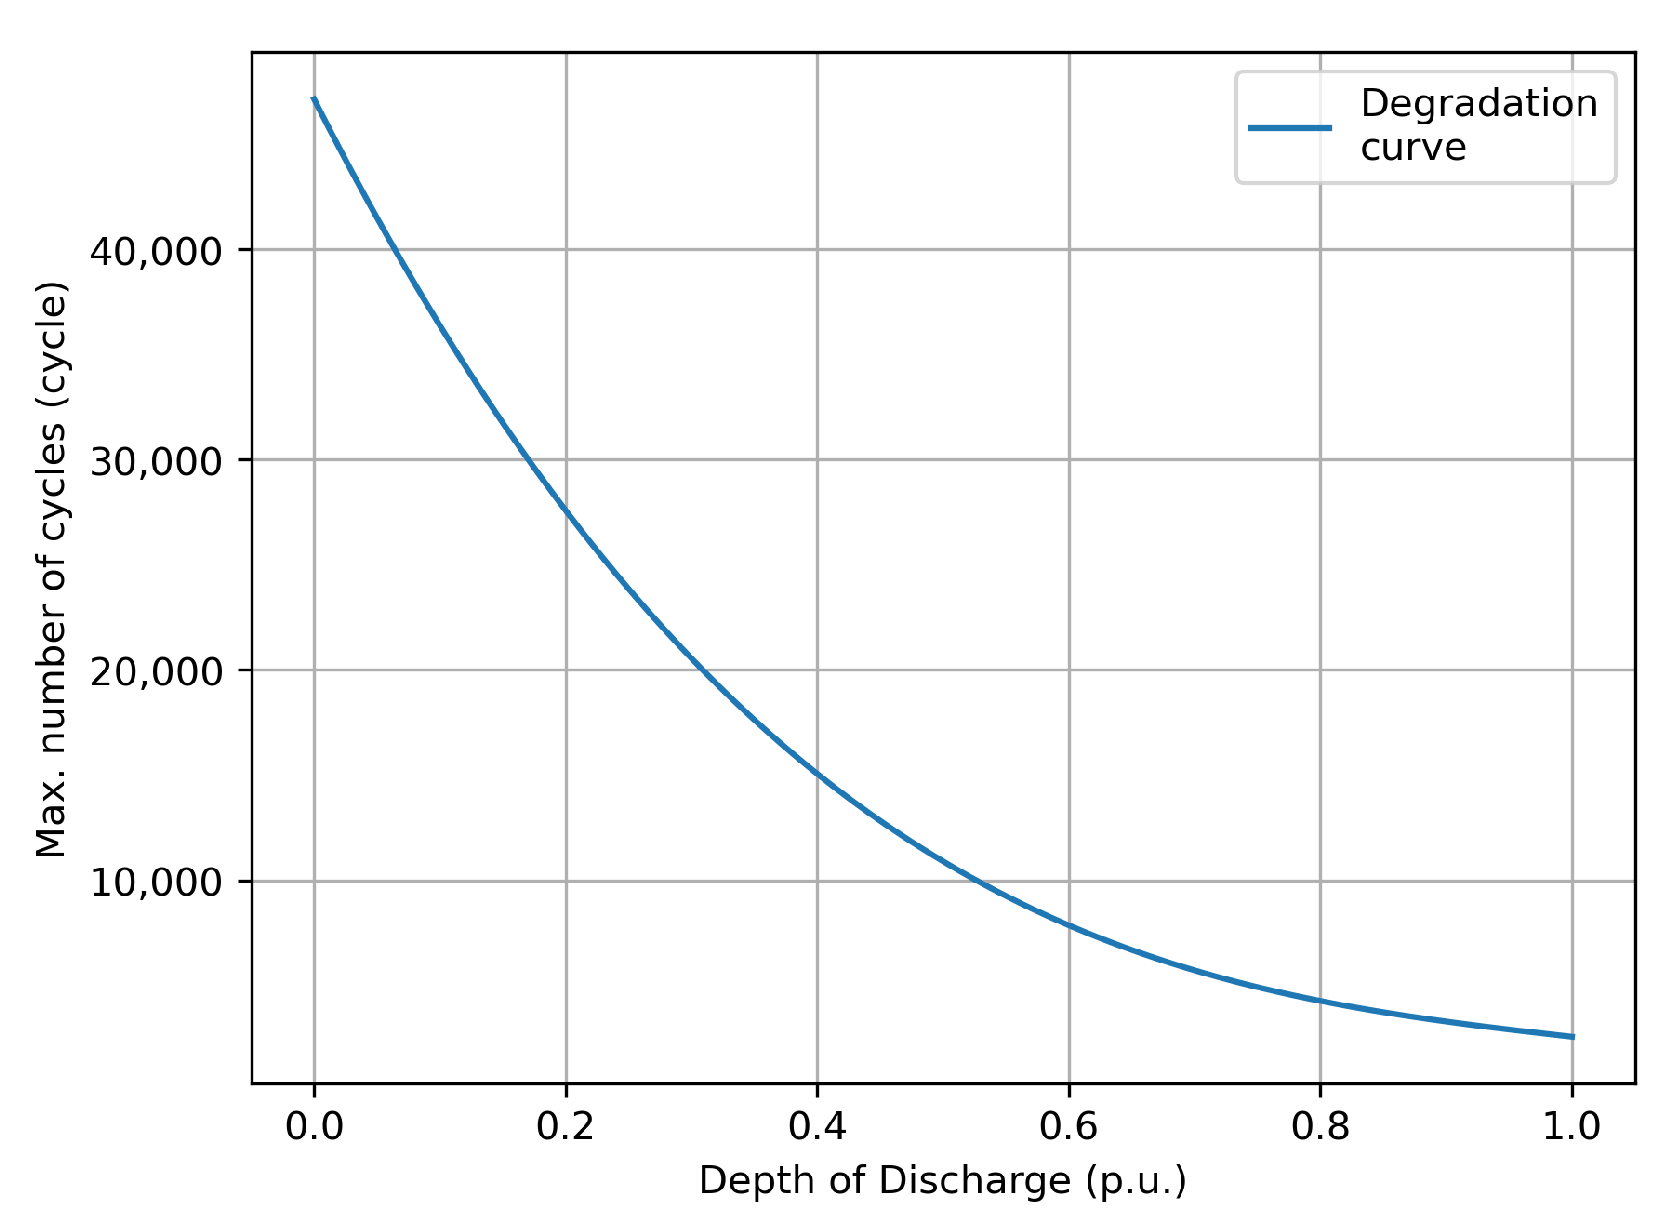
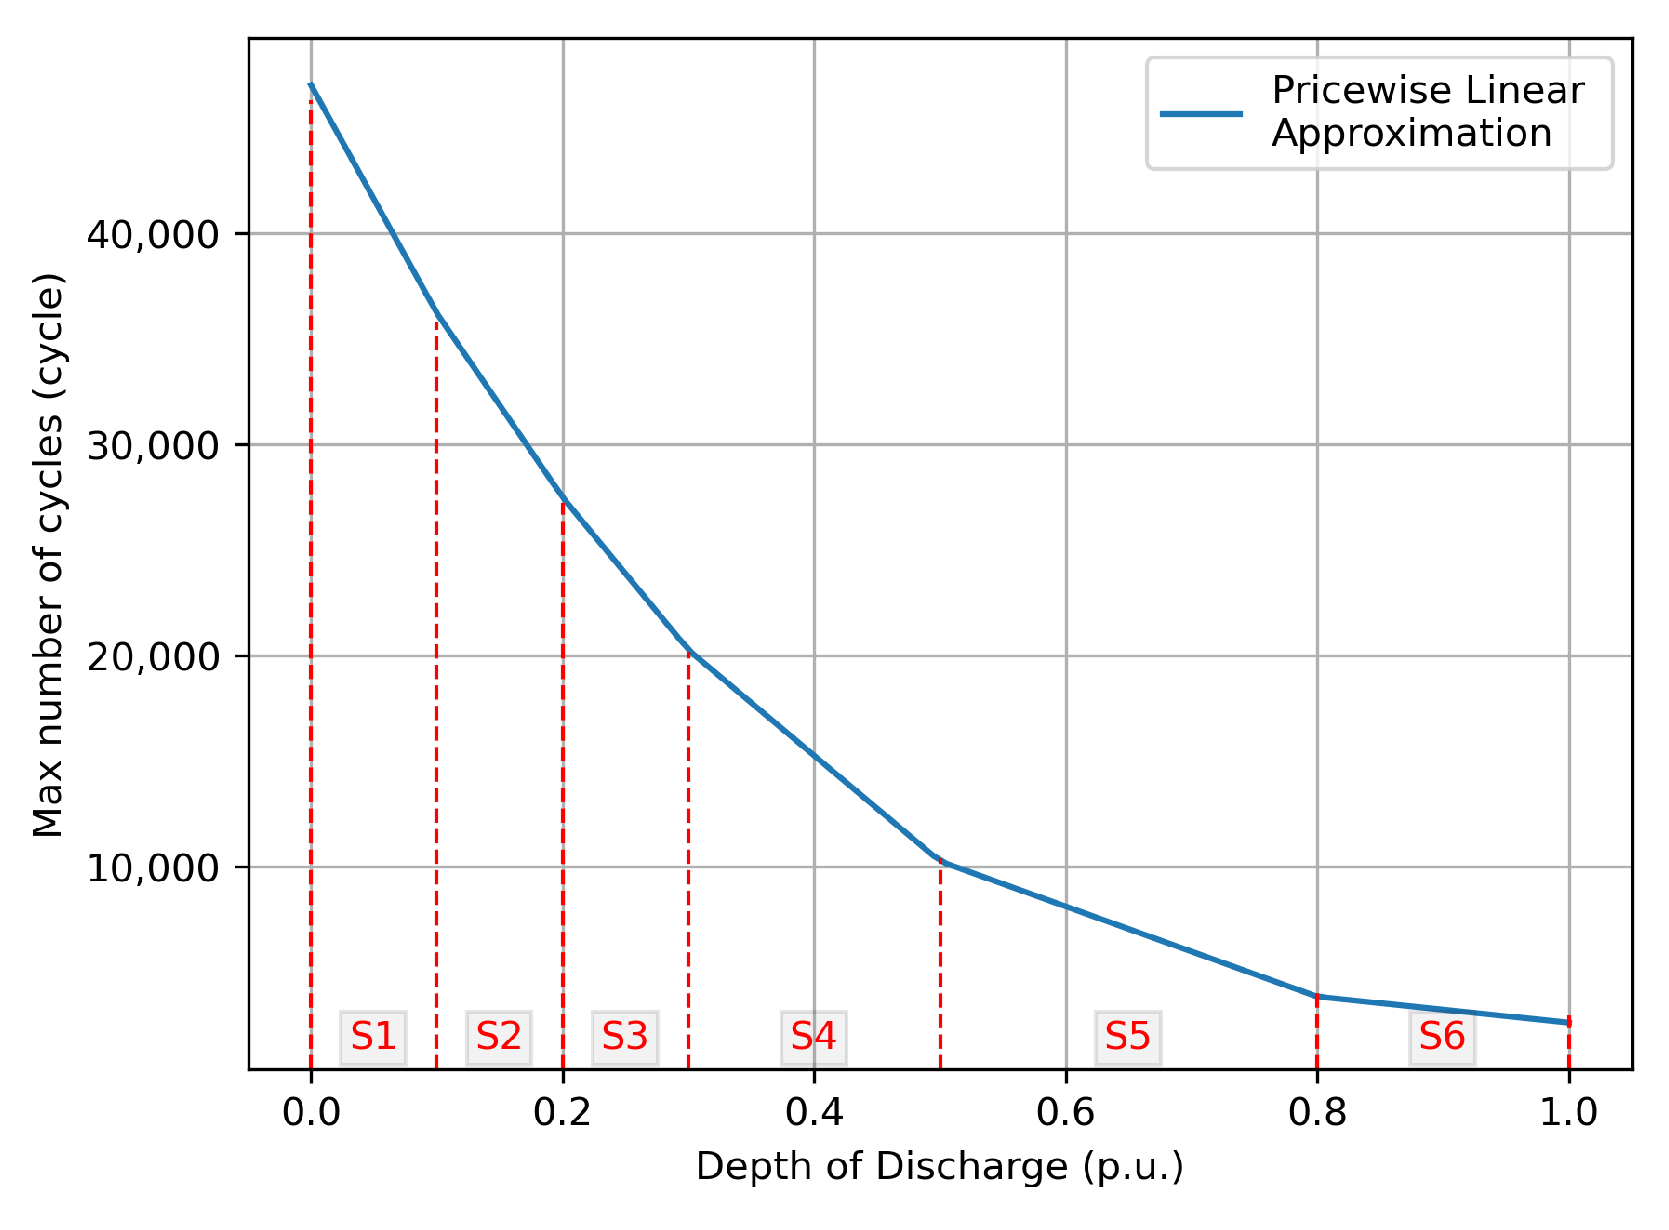
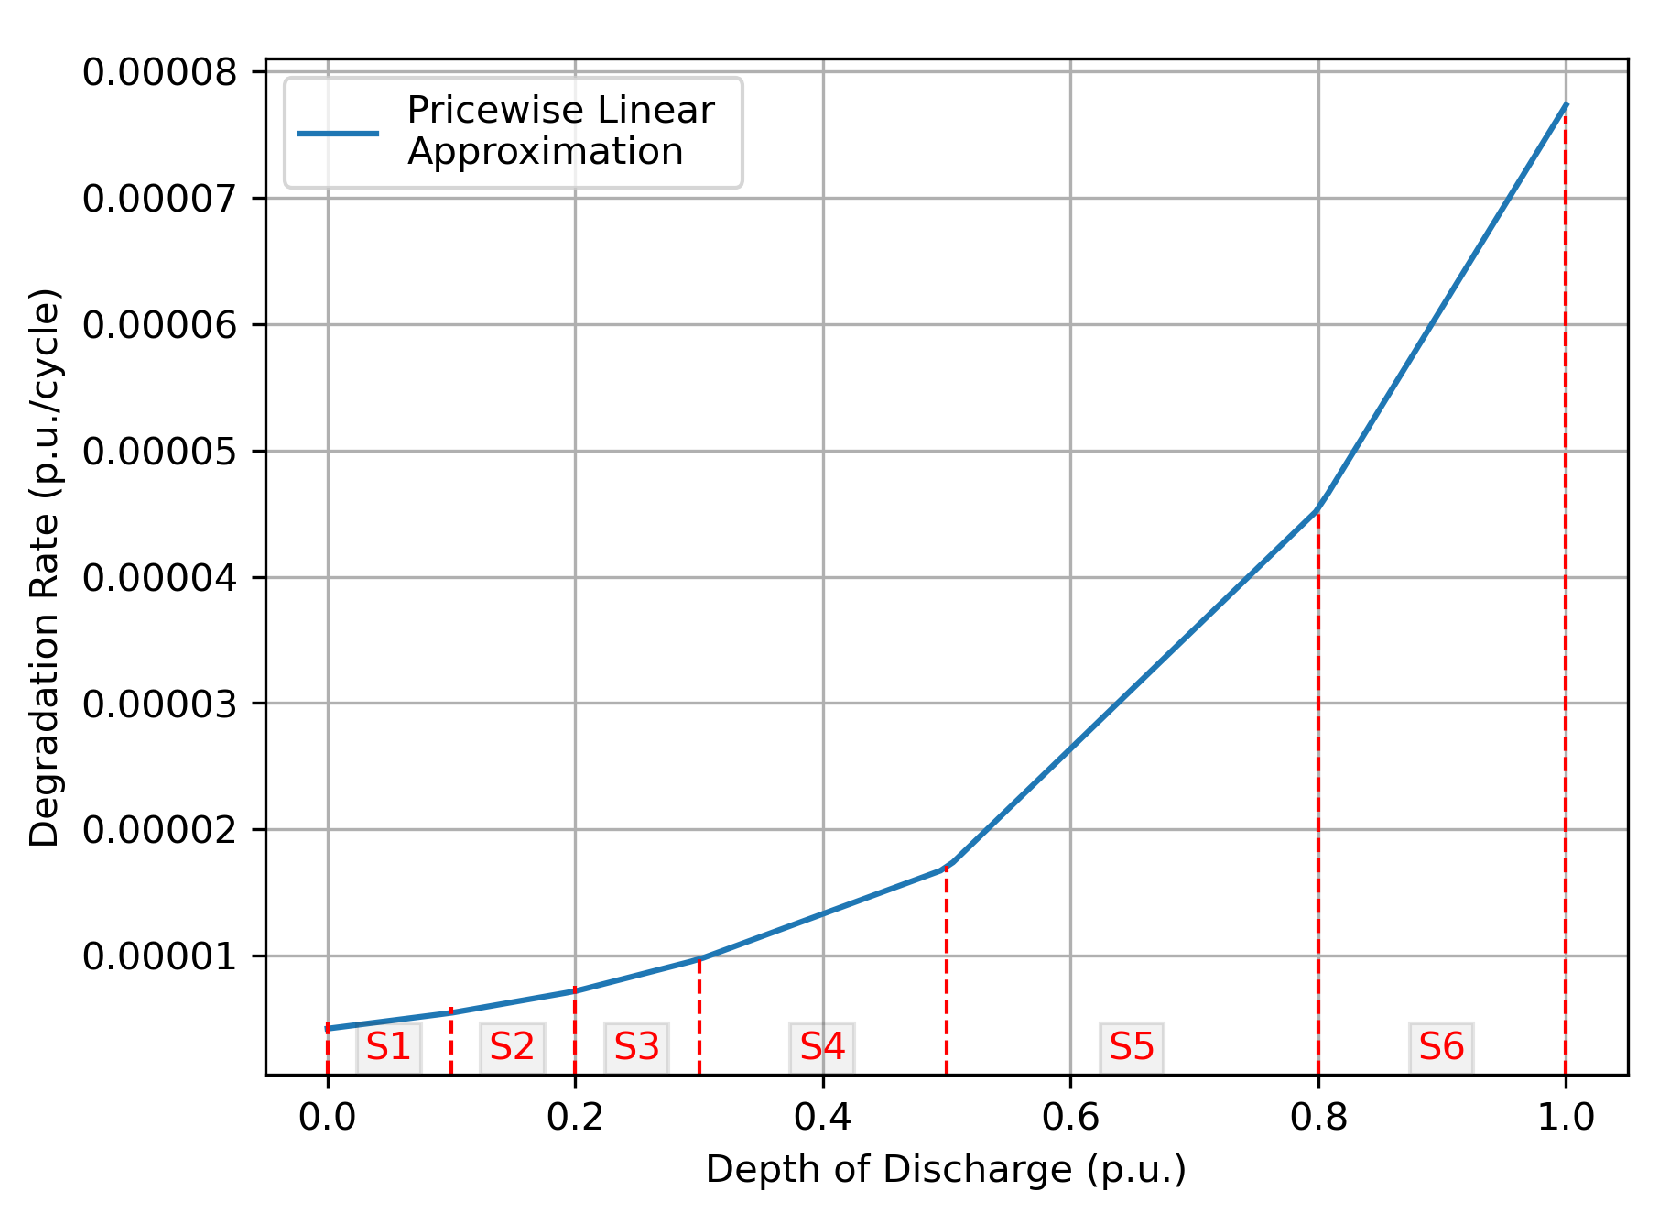
2.4. Battery Degradation Model

One important element when studying and operating batteries is battery degradation. This phenomenon is responsible for decreasing the battery’s capacity over time (with respect to its original state). Their irreversible degradation is made up of two fundamental factors: aging due to the consumed lifetime (calendar aging) and cycles of use (cycle aging) [16]. Calendar aging occurs due to the inevitable decomposition of the compounds present in each cell [17] and depends on the SoC, but mostly on the temperature [18,19]. On the other hand, cycle aging happens only with the use of the battery and depends mostly on the depth-of-discharge (DoD), the SoC range in which it operates, and the charge/discharge current ratio [19].
Battery degradation models can be categorized as theoretical models, empirical models, or semi-empirical models [20]. Theoretical models are grounded on clear principles (physical and chemical mechanisms) and give a profound understanding of battery degradation. Conversely, empirical models are generally developed by a curve fitting a large dataset. Most empirical models address either calendar aging or cycle aging (or both). Semi-empirical models are a combination of mechanism analysis and experimental results. Although theoretical models tend to have higher accuracy (at the expense of time and complexity), empirical and semi-empirical models are usually preferred for system planning and operation studies due to their simplicity in terms of implementation.
In this paper, as presented in Section 6.2, we adopt an empirical model for a Li-ion battery to estimate the degradation cost associated with FR participation. The degradation model and the battery data are adapted from [21], where a degradation curve is derived from the manufacturer data.

2.5. Cellular Network Providing AS

This study examines the case of a CSP contributing to the power grid with several BSs (equipped with energy storage units) which can be grouped together to operate as a single entity, meeting all the requirements of the FCR, while maintaining the same quality of service for the users of the cellular network.
Note that a typical BS equipped with multiple radios has power consumption of around 5 kW. Therefore, several BSs need to be grouped (clustered) in order to operate as one entity and to fulfill the minimum FCR power capacity. Note that not all BSs need to be activated at the same time. Consequently, new functions for management and orchestration are needed to enable coordination in the cellular network. These dedicated functions enable the efficient selection of multiple BSs based on location, the selection of energy storage (each with different site specifications), and performance in order to obtain the maximum profit under operating conditions.
It is worth mentioning that the energy storage units of the BSs are energy-constrained and therefore can fail to provide FCR if the state-of-charge (SoC) limits are reached. Therefore, in addition to providing or consuming power from the grid during grid regulation requests, the energy storage units must recover their SoC to a proper level in order to be able to answer future requests (ensuring the procured FCR capacity), while at the same time preserving their backup responsibility in the event of a power grid outage failure.
In this paper, we propose a large-scale optimization model to identify the required BSs for the most profitable one-hour bidding. In other words, based on (i) historical data of the BSs’ traffic demand and power consumption profile, (ii) the local installed battery capacity, (iii) the location of the BSs, (iv) the historical data of the FCR, and (v) the historical data of FCR bid prices, the mathematical model is able to achieve the following:
  • Decide prior to the bidding, day-ahead, the most profitable time-slot to bid.
  • Select, during the intra-day period, according to the grid request, the most efficient cluster of BSs (the answer is made up of one entity) and manage its infrastructure efficiently.
  • Maintain, during the intra-day period, the quality of service (QoS) provided by the cellular network and the required energy storage capacity for both the utility service and the backup power of the BSs (in case of a power outage).
  • Minimize the activation delay of the selected BS cluster thorough the minimization of the BSs cluster range.
In summary, this paper aims to incorporate CSPs’ infrastructure into power system frequency regulation entities, fulfilling all the technical requirements. All components of an actual system are taken into account, such as the consumed energy for each BS, power grid frequency variation, FCR bid prices, battery SoC variation, battery aging cost, and activation/synchronization latency time. Hence, the system frequency regulation resources are increased (supporting the stability of the power system), and, at the same time, the CSPs can add an extra value stream by participating in the frequency market (while increasing their sustainability).
It is worth mentioning that predictions for both BS energy consumption and FCR behavior are very challenging. However, relevant improvements have been achieved in recent years with the use of predictive models such as machine learning methods (e.g., neural artificial network and random forest regressor, as presented in, e.g., [22,23,24]). It is also important to note that the proposed optimization model supports the CSPs only during the FCR participation planning phase (day-ahead, presenting the most profitable time-slot to bid). Therefore, during the intra-day period, due to potential prediction inaccuracies, a real-time tuning scheme would be needed in order to fine-tune the system when answering grid requests.

3. Literature Review

A wide range of different approaches have proven effective in providing FR support using battery systems. For example, Thien et al. [25] and Marchgraber et al. [26] present algorithms to optimally control battery energy storage systems (BESS) providing FR. Along the same lines, Divshali and Evens [27], He et al. [28], and Peñaranda et al. [21] also proposed BESS, but including a detailed measure of battery degradation. On the other hand, in [29,30,31], the economic benefits of using electric vehicles (EVs) to participate in the primary FR markets (from the EV owner’s perspective) are assessed. In [32], data center resources are explored, and in [22], photovoltaic battery energy storage working together with power–heat coupling is proposed. For the above-mentioned works, approaches based on heuristics and/or exact algorithms were proposed in order to efficiently control the battery systems while providing FR. It should be noted that there is a trade-off between these two approaches. Exact algorithms guarantee finding the optimal solution but come at the cost of slower convergence and being computationally expensive. On the other hand, heuristics are simpler and often provide much faster solutions, making them suitable for real-time or large-scale problems. However, heuristics do not guarantee optimality, and their performance may vary depending on the problem instance and initial conditions. Therefore, the appropriate choice depends on the characteristics of the problem, the requirements of the solution, and the available resources.
Regarding the balancing markets, Khodadadi et al. [1] conduct a thorough literature review on Nordic systems and summarize the market rules and requirements. Similarly, other relevant and updated information about ASs and FCR in the Swedish market is provided by its TSO, Svenska Kraftnät, in [9,11].
In the mobile telecommunications field, this context has been discussed within some studies; however, there are still opportunities for further enhancements. In [5], Hassan et al. perform a theoretical assessment of AS support through cellular network systems. A base station powered by the smart grid, equipped with a local photovoltaic panel and energy storage units, is used to respond to grid requests (increasing or decreasing the power consumption). The results show potential cost savings with negligible degradation in QoS. However, there is minimal or no reference to important parameters such as battery degradation and synchronization (control) signals for power infrastructure control of the BS. In addition, the model is oversimplified, considering a single BS (in practice, not enough to meet actual minimum requirements) as well as grid requests only every 30 min. Alaperä et al. [2] explore the potential and feasibility of using existing battery systems in telecommunications BSs as an aggregated and highly distributed asset for providing FCR-D. However, the authors do not investigate potential multiple control of BS clusters, or revenues. The study includes simulations, showing a negligible impact on the battery systems when performing FCR-D (in terms of their expected lifetime and ability to protect the critical telecommunications loads). On the other hand, Yong et al. [33] propose a framework to coordinate the use of massive distributed BSs (equipped with backup batteries) aiming to participate in FR. A rule-based mechanism is constructed to explore backup batteries’ spare capacity while system reliability is guaranteed. An illustrative case is performed on a test system to investigate the improvement in the grid frequency by utilizing BSs’ dispatch potential toward frequency regulation. Nonetheless, from a CSP perspective, there is only a superficial analysis of the potential revenue and battery degradation cost. More recently, a white paper released by Ericsson [4] proposes the use of the CSP’s infrastructure to support the TSO with various ASs. Regarding FR, it is advocated that by acting as an entity (from a utility perspective) and using a cloud platform to orchestrate and distribute the grid requests to multiple BSs, all FCR requirements can be satisfied. Thus, new revenue streams for the CSPs could be activated while still maintaining the ability to deliver mobile services as well as bringing benefits to the power system infrastructure.
Despite the research efforts presented above, the literature lacks in-depth studies on measuring, testing, and evaluating the performance of cellular networks providing FR and meeting all the requirements of a true smart grid. This is particularly critical for key parameters such as aggregated operation schemes, battery degradation’s impact on revenue and synchronization (control) signals, and local and/or centralized control. Simulation results can significantly differ from real-world implementation if the environment is not modeled accordingly.

4. Problem Statement

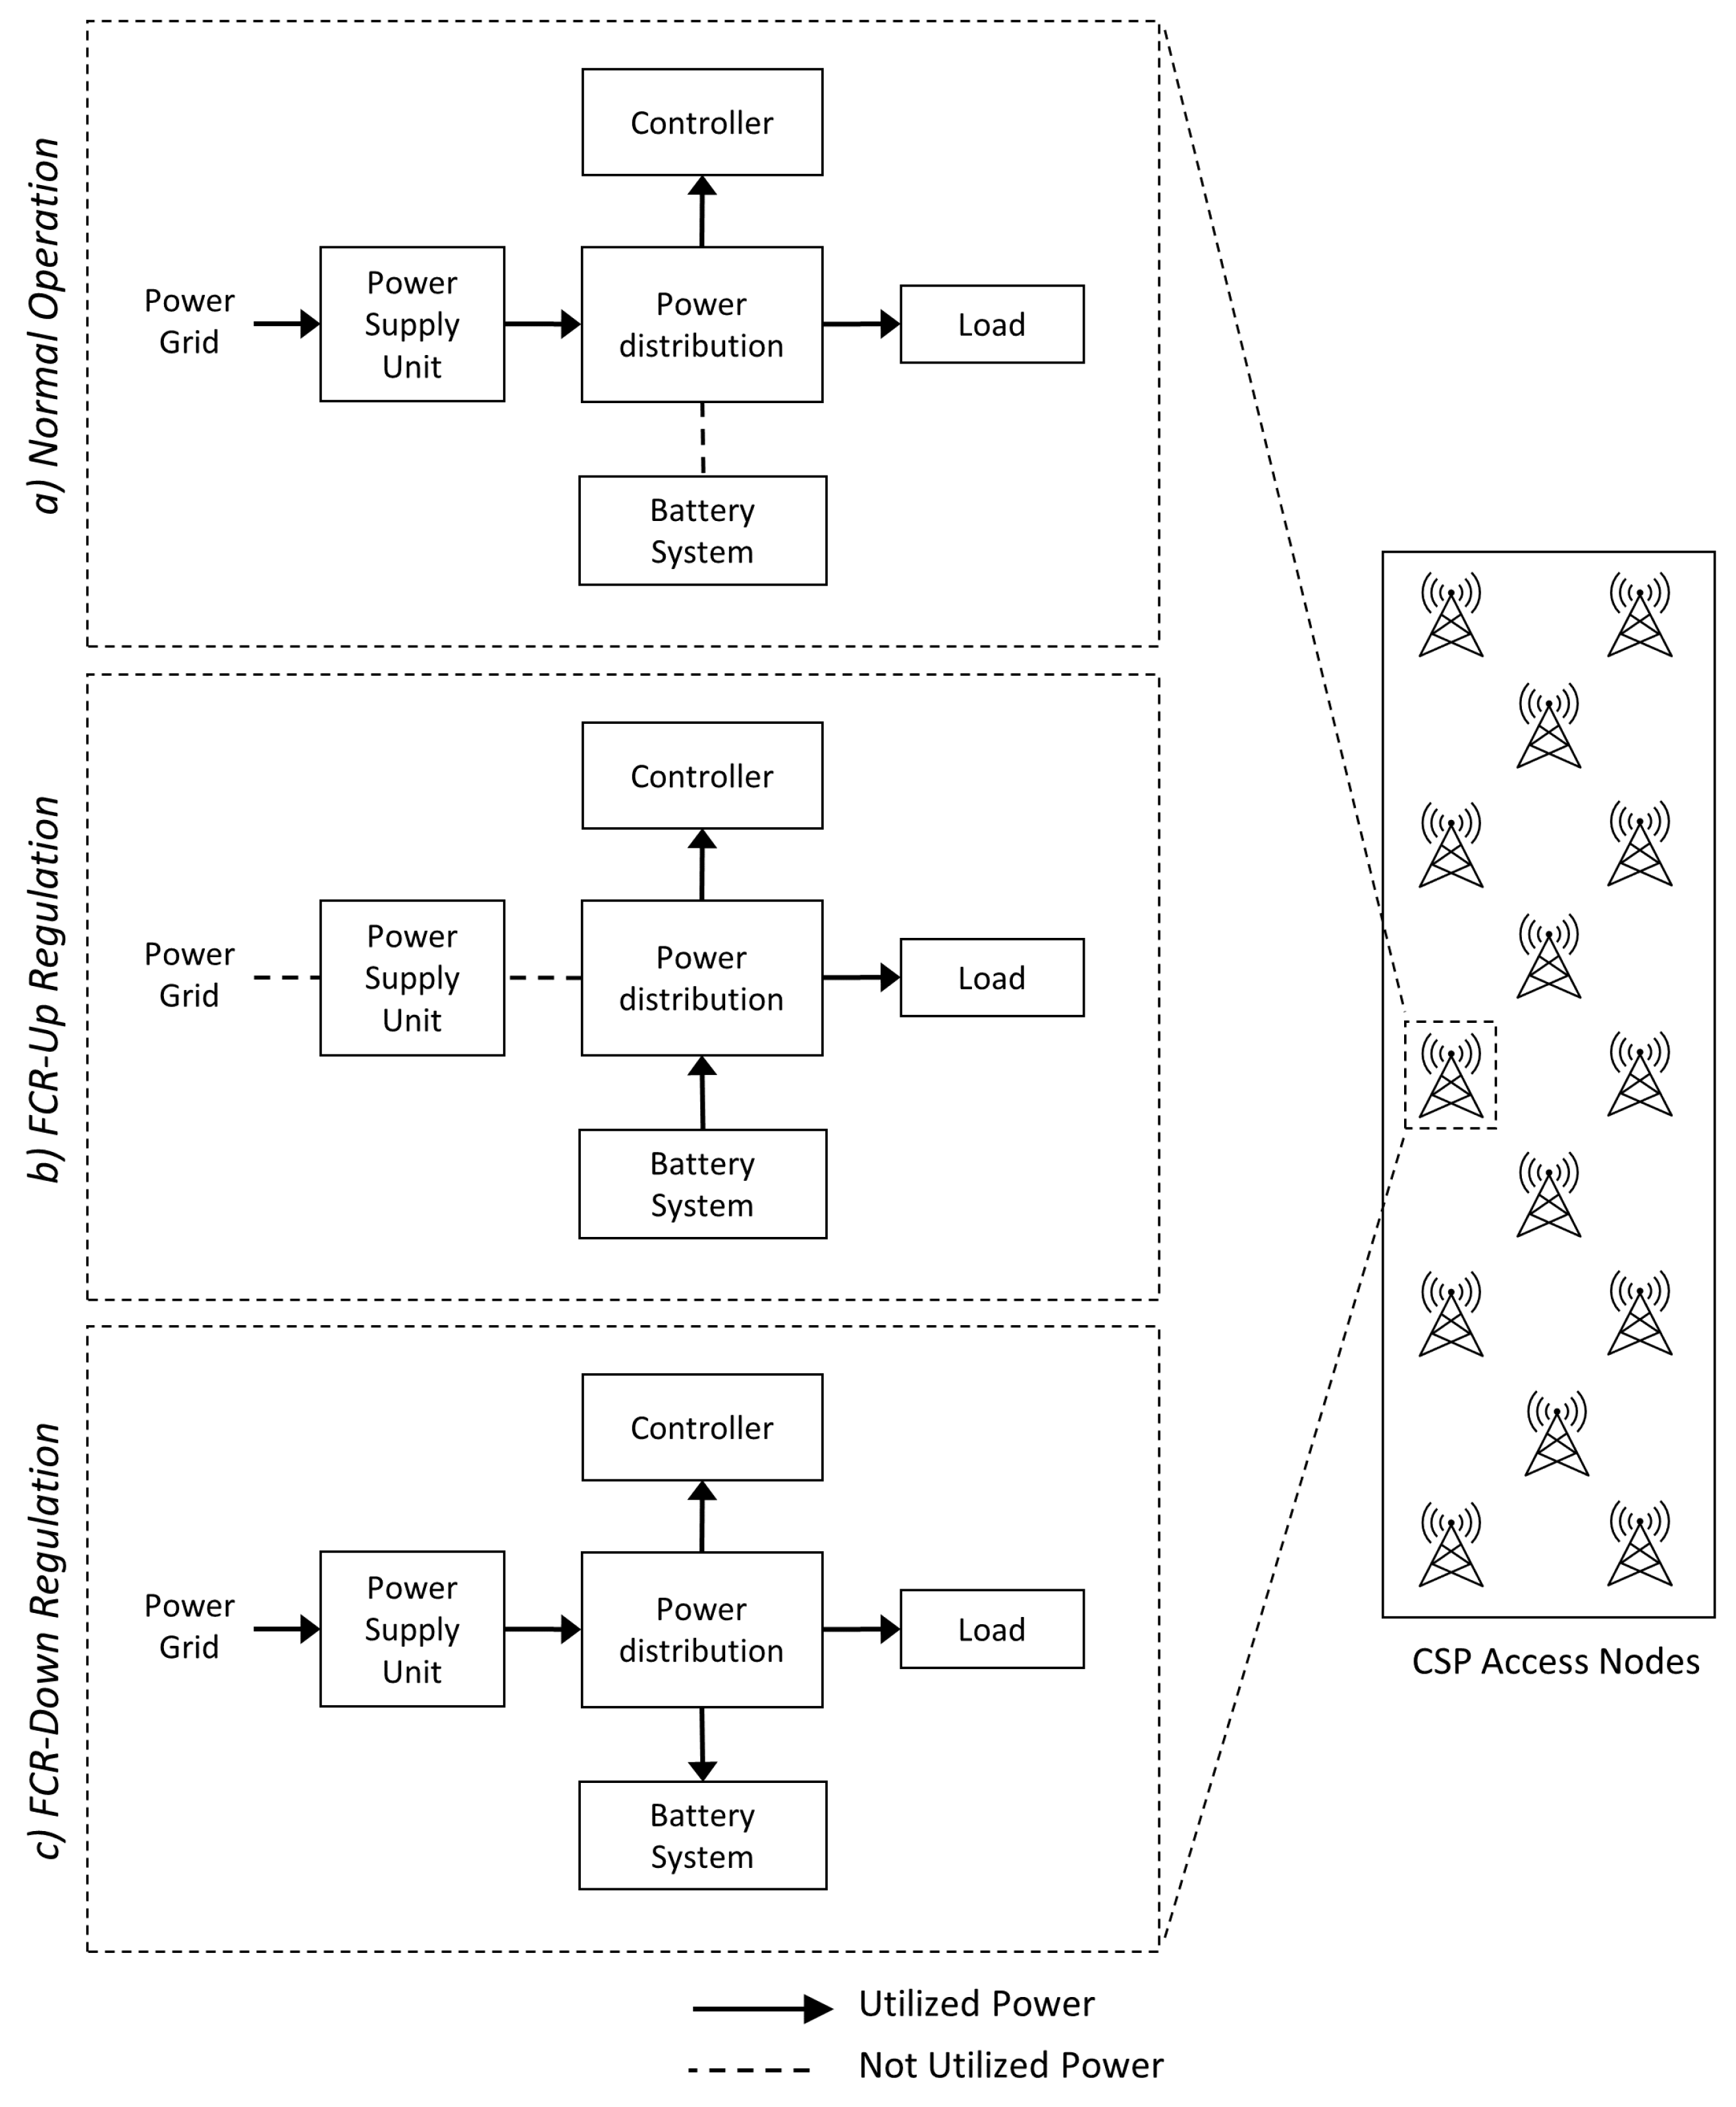
4.1. Controlling the Power Flow Using the Battery System of BSs

In order to answer FCR grid requests using the batteries of BSs, the system has to be able to adjust its internal power flows according to the FCR activation signals coming from a local or central management system. The main idea is to control the power flow on the power supply unit (PSU), increasing or decreasing the grid power consumption through the associated battery usage on a BS. Three operational modes can be identified.
(1) Normal Operation: In the first operational mode, there is no regulation request coming from the utility (or no local signal), and in such cases, the BS is supplied only with power from the power grid. Figure 2a depicts this scenario. Note that the battery is unused.
(2) FCR Up-Regulation: The second operational mode occurs when answering FCR upward regulation requests. In this case, the utility sends signals to the CSP (or is locally generated) that contains the activation power level instructions following grid frequency deviation according to Figure 1, or, optionally, the frequency can be measured via local linear control. Thus, to answer each upward regulation request, the CSP needs to increase the energy production or—having the same effect on the grid—to decrease the grid energy consumption. In our approach, this is achieved by supplying the BS load with energy from the battery, as shown in Figure 2b.
(3) FCR Down-Regulation: The last operational mode occurs during FCR downward regulation requests. Similarly to the previous mode, the utility sends signals to the CSP following frequency deviation. These instructions are to decrease the energy production (or, with the same effect on the grid, increase the grid energy consumption). In our proposal, this is achieved by recharging the BS’s batteries, as presented in Figure 2c.
It is worth mentioning that in the proposed scheme, no energy is injected back into the power grid. This means that in order to activate this new functionality in existing BS systems, only minor software modifications are needed. In addition, as only the spare capacity of the battery is used, the primary task of BS backup availability is still guaranteed during the entire service time.

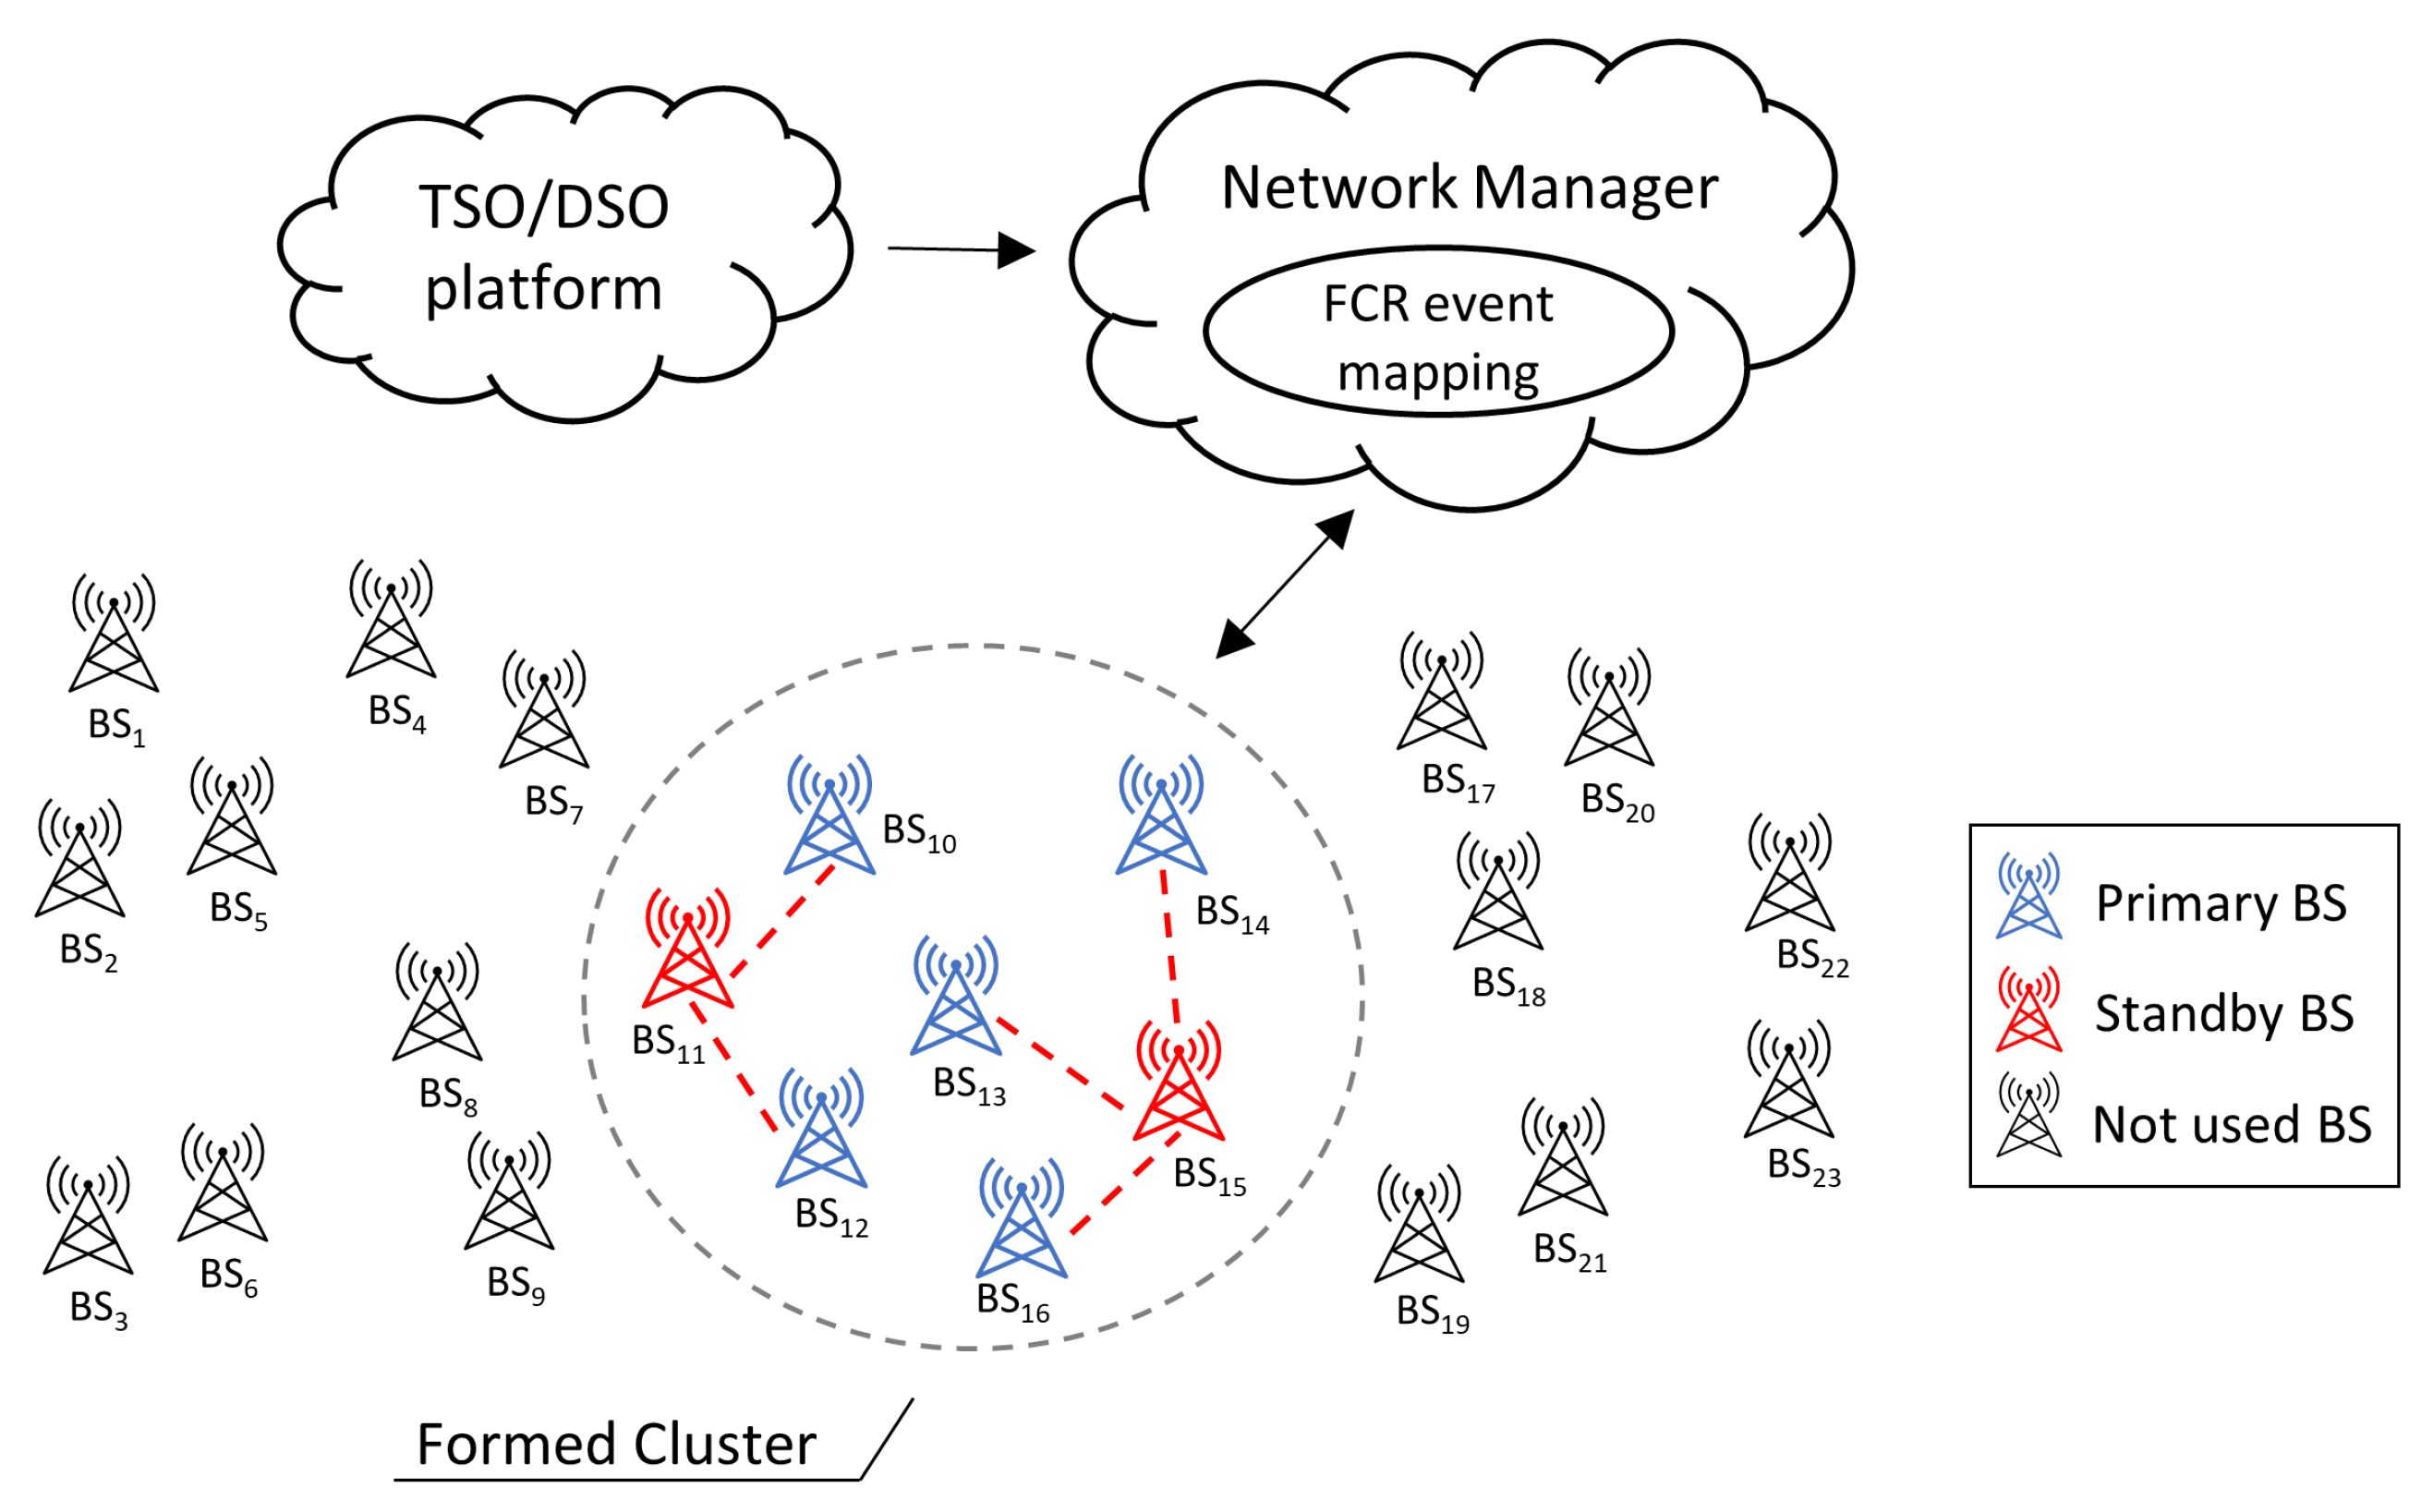
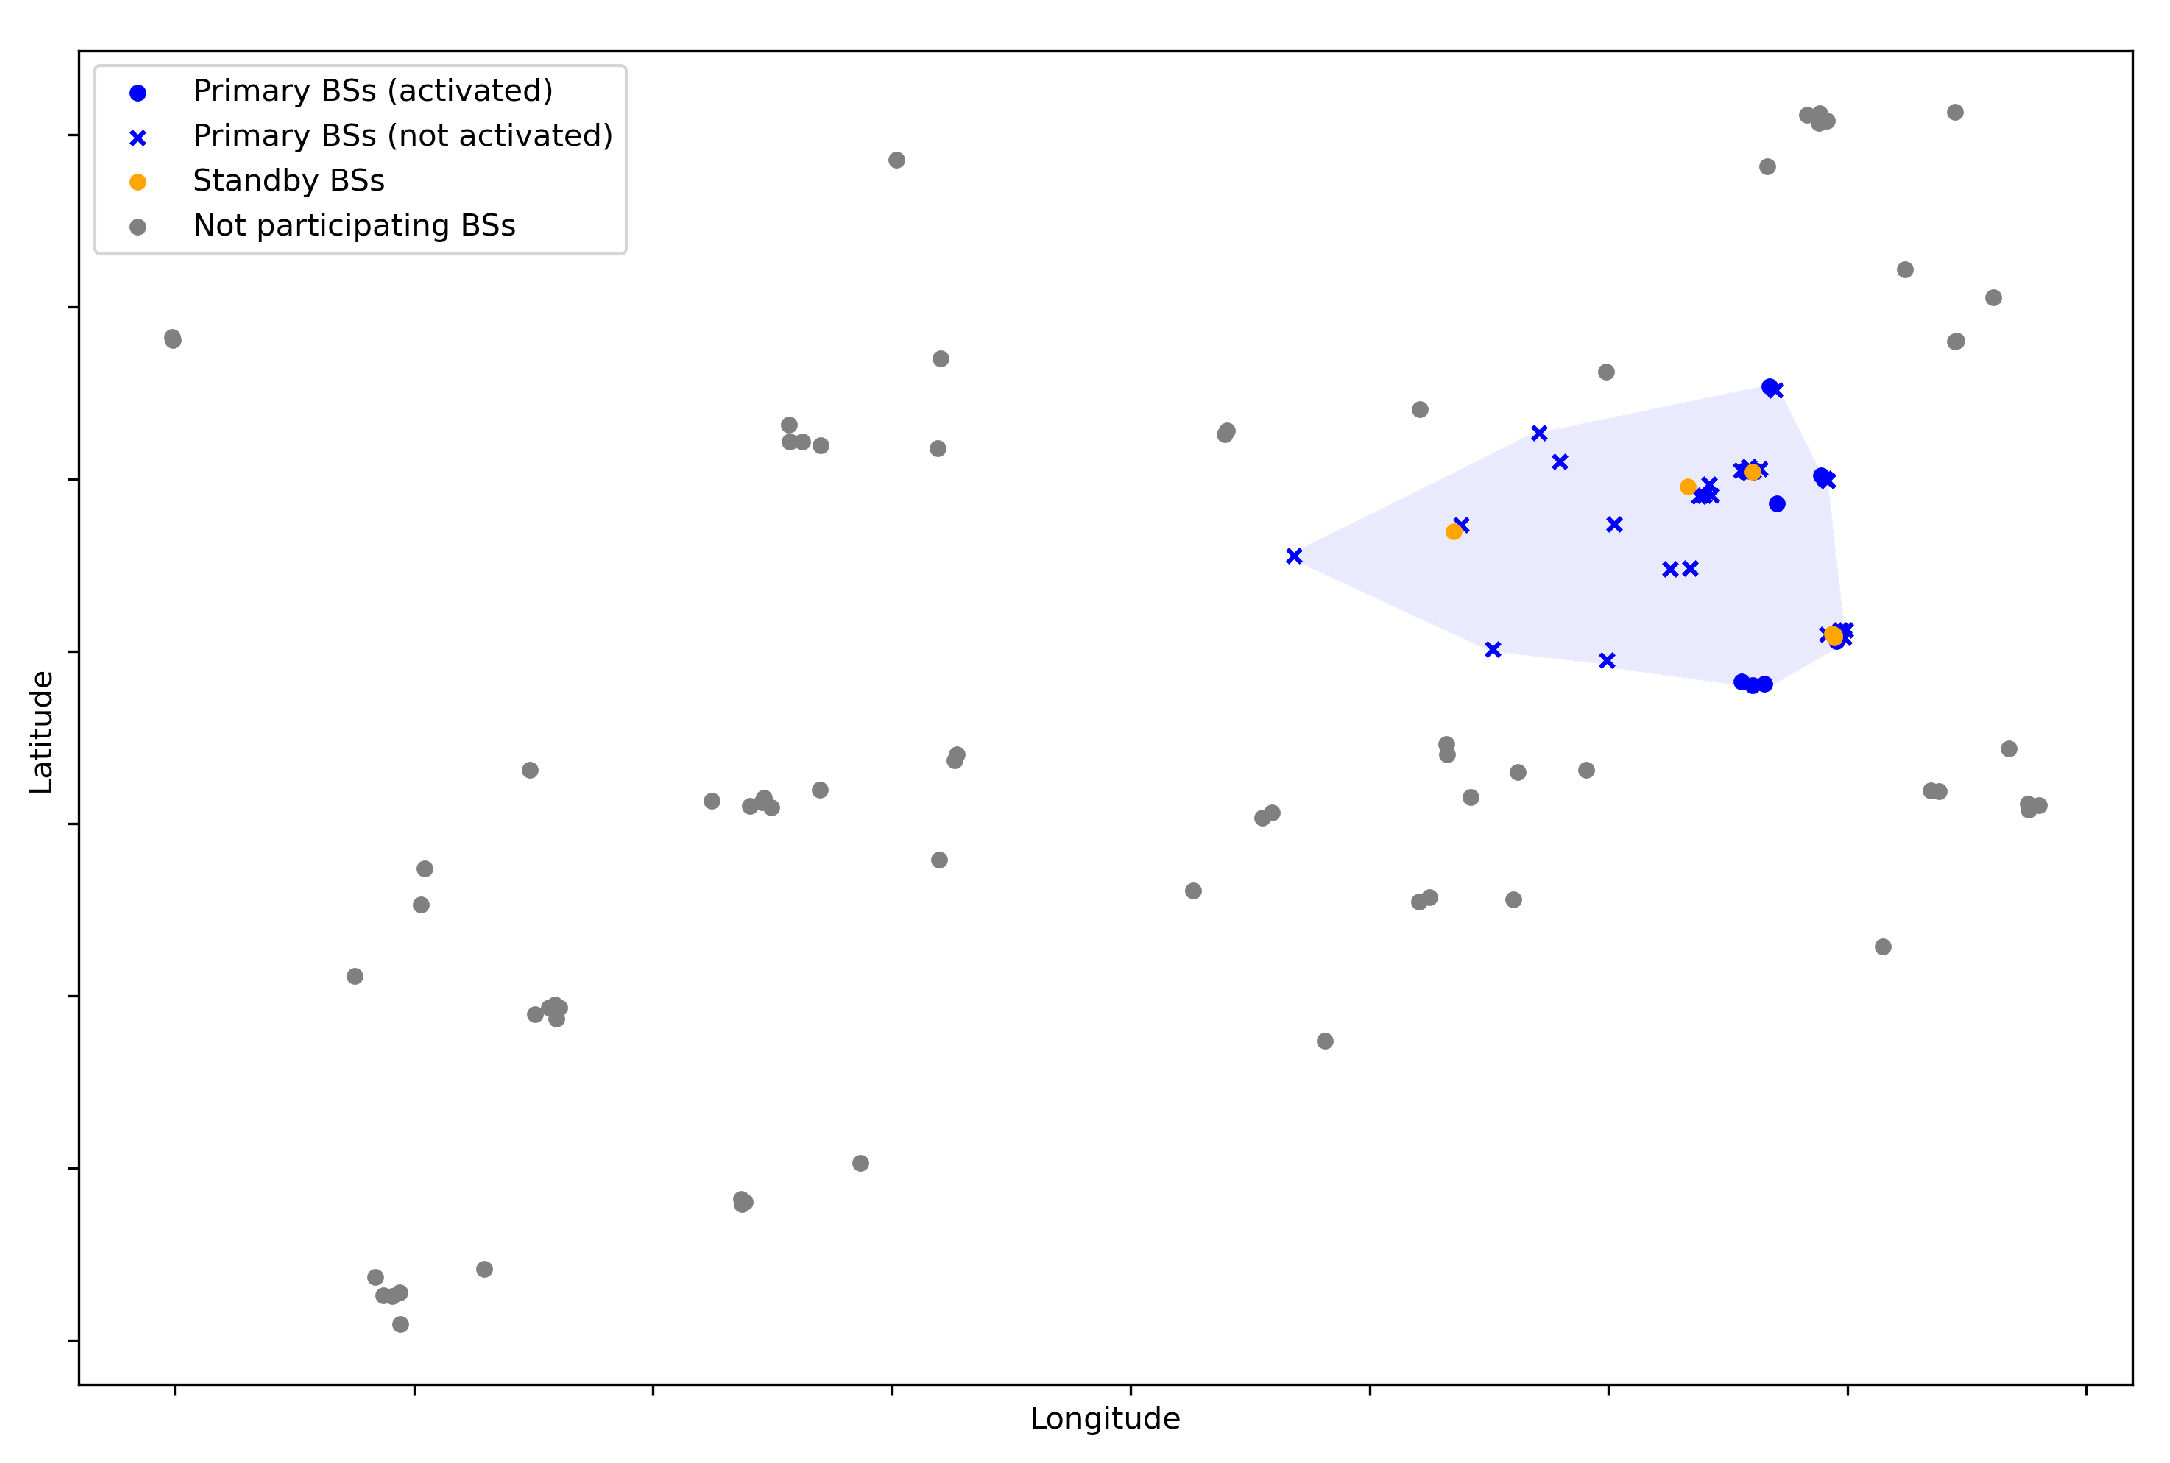
4.2. Cluster Formation and Synchronization

To participate in the FCR market, a minimum power capacity of 0.1 MW is required (as shown in Table 1). This is a boundary for BSs because their systems can only provide, individually, FCR of some kilowatts (due to the capacity and power consumption of the batteries). Therefore, in order to be able to participate in FCR services and to meet the minimum requirements, a cluster formation of BSs is required based on (i) power levels, (ii) battery capacity, (iii) latency and location (proximity to one another), (iv) PSU capacity, and (v) the BSs’ power consumption. The new functionality is proposed to run inside the network manager (in a cloud platform, e.g., Ericsson Network Manager/Operation Support Systems (ENM/OSS)) and would enable the orchestration of the multiple BSs. Figure 3 illustrates the proposed scheme.
After finding the most efficient clusters to participate in the bidding hour, the network manager enables, during the intra-day, synchronization signals or local control when running the service. These signals align the participating BSs and continually check their conditions. Thus, synchronization is crucial for system performance, and signal delays may contribute to late start-up activation, bringing undesired technical effects during operation. Such signals may include (a) the synchronization of PSUs’ operation and (b) the operational condition of PSUs or information related to power controllers. Note that operational signals may be set to other units in the power infrastructure that inter-operate with the PSUs, such as batteries.

4.3. Problem Definition

We consider a market period with discrete finite intervals t T , and each time-slot has a single clearing price defined as p t . Each time t has a set of FCR events e E , defined in terms of seconds. Each event e has an associated regulation request value (regarding the bid value and the actual grid frequency deviation; see Figure 1). At the end of t, the participant receives a reward (or penalty) based on p t and on how accurate their response to each regulation instruction.
National power grids are usually divided into smaller regions, and bids are made with respect to a given electric region or a defined price area. In other words, during regulation requests, the area of the provided energy should match the electric region chosen for the bid. In this work, electric regions are defined as a, with a A ELEC .
We assume a CSP providing mobile services in a large region with a set B of BSs, indexed by b. Each BS b is connected to the power grid and has a given average power consumption P b t BS - CONS for its operation at time-slot t. All activated BSs need to be part of the same electricity area (or price area) a in order to provide an FCR service properly.
In addition to the power grid supply, each BS is also equipped with a set of batteries (whose total capacity is denoted as E b CAP ). Each battery has a given ability to absorb (charge) and release (discharge) power, defined, respectively, as P b CH and P b DC . However, note that in practice, when answering up-regulation requests (supplying the BS with a battery), the power discharge boundary will be determined by P b t BS - CONS (as P b DC is designed to always be ≥ P b t BS - CONS ).
The spare battery capacity of each BS b varies in time and is defined as E b t S CAP . It can be determined as
E b t S - CAP = E b CAP τ = t t + n b P b τ BS - CONS · Δ h b B , t T ,
where Δ h is the absolute time (in our case, one hour) and n b is the mandatory minimum autonomy time (in hours) of BS b. Therefore, to operate only in the spare region, the minimum and maximum charge level (battery boundaries) as well as the initial charge level need to be determined. They are represented by S o C b t min , S o C b t max , S o C b t INIT and are defined as follows:
S o C b t min = E b CAP E b t S - CAP , S o C b t max = E b CAP , S o C b t INIT = E b CAP E b t S - CAP / 2 b B , t T .
Note that since regulations in both directions may be requested in FCR-N, S o C b t INIT is defined with half of the spare capacity. However, for FCR-D, S o C b t INIT should be adjusted to the maximum or minimum charge level of the spare region (depending on the selected service product).
It should be noted that the proposed scheme only takes advantage of the reserve capacity of the battery, which means no or minimal impact on the availability of the cellular network. In other words, the required backup capacity is always available throughout the day (ready to be used in case of power outage events). Figure 4 depicts the battery usage in our proposed scheme. In addition, to fully consider the operational cost, the cost of battery degradation is also estimated in the model.

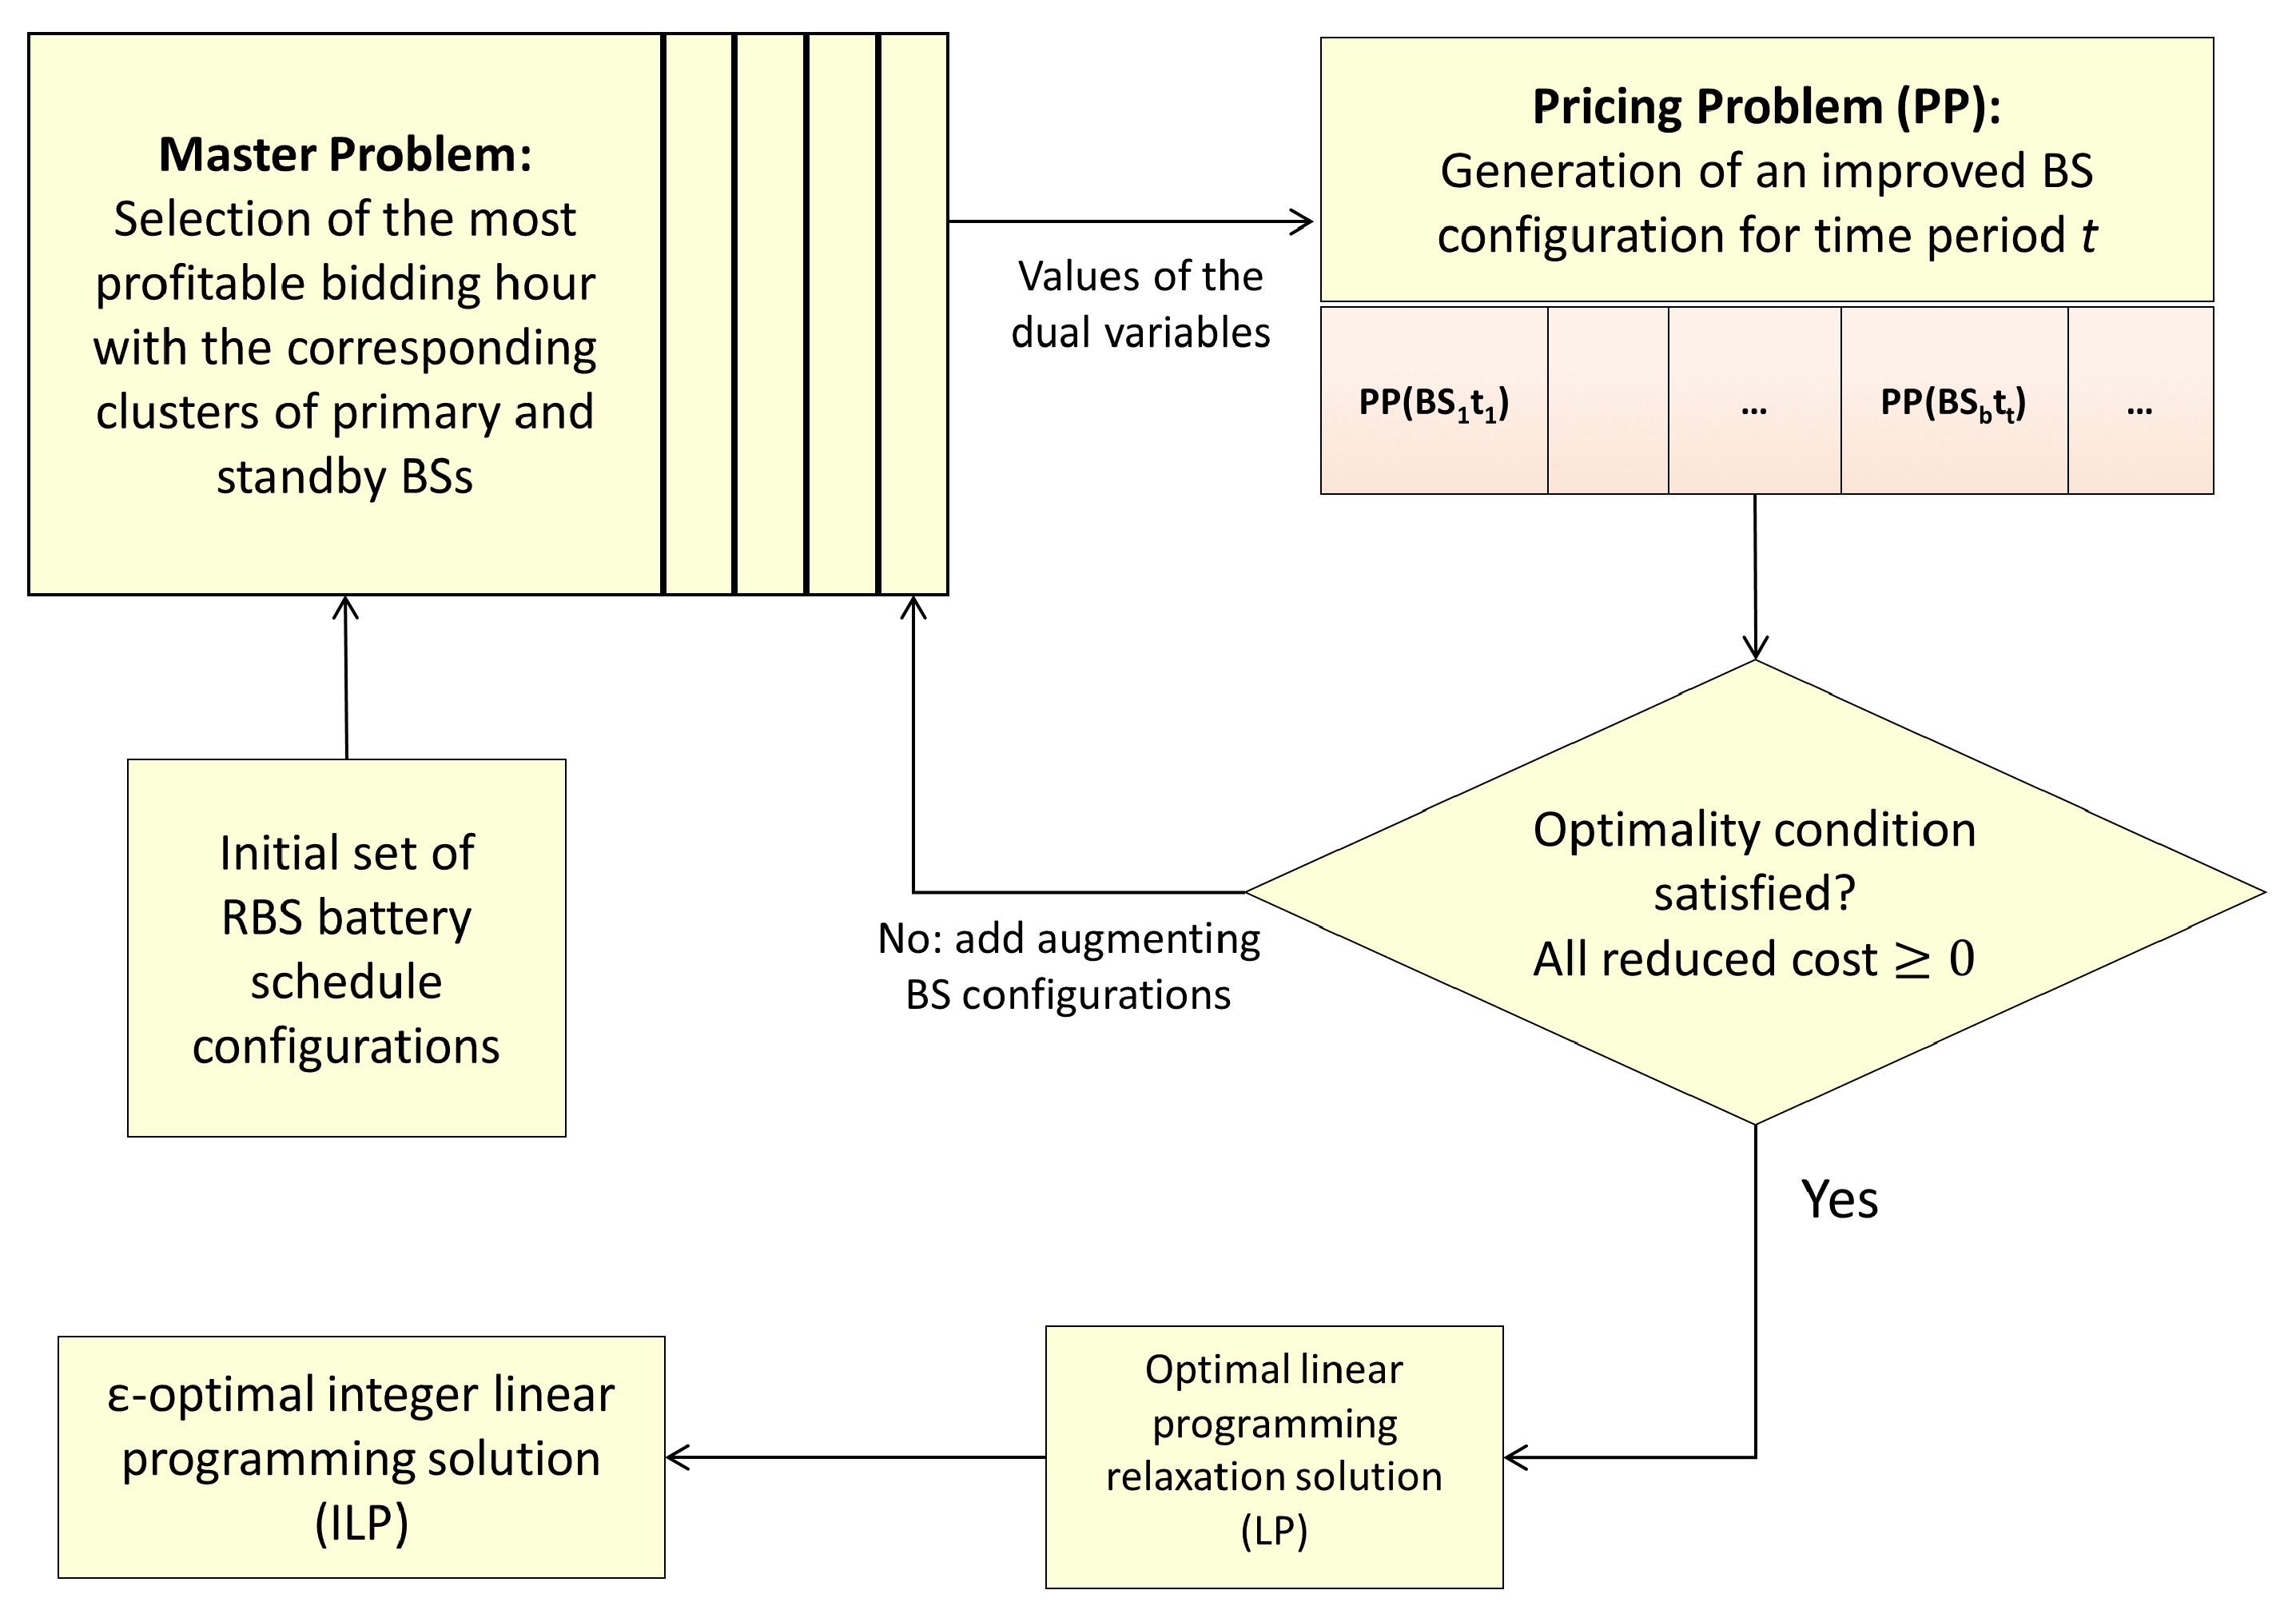
5. Decomposition Model

In order to solve the problem of identifying the most profitable one-hour bidding, we propose a large scale optimization model, which can be solved by column generation techniques (see, e.g., [34], chap. 5 or the books of Lasdon [35] or of Desaulniers, Desrosiers, and Solomon [36]). As the model has an exponential number of variables, and therefore is not scalable if solved using classical ILP (Integer Linear Programming) tools, column generation techniques are applied. In summary, the proposed mathematical model consists of a master problem coordinating a set of pricing problems. The first step is to solve the model’s continuous relaxation: the master and pricing problems are solved alternately until the optimality condition is satisfied (as shown in the flowchart in Figure 5). The next step is to derive a Mixed Integer Linear Programming (MILP) solution using a branch-and-bound algorithm. The formulation is detailed for the FCR-N case and can easily be adapted for FCR-D products with minor modifications.

5.1. Master Problem: Base Station/Battery Configuration

Every bidding hour is composed of multiple FCR events. As aforementioned, depending on the grid frequency deviation, the FCR event can be upward, downward, or null. Thus, in order to participate in a given bidding hour, we need to identify a set of potential BSs and define how they would contribute to each FCR event. Note that BSs may not participate in each individual FCR event, but as an entire entity, must be able to answer all FCR events during the one-hour bidding (avoiding penalty costs). Figure 6 illustrates, for a given t, a sequence of grid requests (FCR events) and BS participation. Each potential instance of BS participation (configuration) is iteratively generated by the pricing problem, in order to improve the configurations and reach the optimality condition. Therefore, throughout the optimization process, multiple configurations are created for each BS, even for the same hour t. Such a configuration γ Γ is characterized by the following:
E b t FCR - UP , γ = reduction in energy grid consumption (obtained by supplying BS b partially or totally with its battery) in time period t (during up-regulation request);
E b t FCR - DOWN , γ = energy drained from the grid and stored in the battery of BS b in time period t (during down-regulation request);
D b t γ = battery degradation rate of BS b in time period t.
The cluster selection of BSs is divided into primary and backup BSs. The primary BSs actively participate in the service (answering grid requests), while the backup ones work as an extra asset (for redundant purposes in case of a BS outage). In other words, in case of the failure of a primary BS providing FCR, one backup BS can be activated to promptly cover the malfunctioning BS and provide the FCR service. Figure 3 represents a set of base stations working as primary and backup BSs. Each primary BS has at least one backup BS. A backup BS has to be selected in the neighborhood of the protected primary BS. Note that one backup BS may protect more than one primary BS (according to its battery capacity and SoC); see, e.g., B S 11 .

5.2. Parameters

  • B: set of base stations, indexed by b.
  • T: set of time-slots t within a market day.
  • A ELEC : set of electric zones, indexed by a.
  • p t FCR : clearing FCR price at hour t.
  • p t PENAL : penalty FCR price at hour t.
  • RE Q t FCR - UP : sum of FCR up-regulation request at hour t.
  • RE Q t FCR - DOWN : sum of FCR down-reg. request at hour t.
  • P b ch : ability of the battery of BS b to absorb energy.
  • P b dc : ability of the battery of BS b to discharge energy.
  • p b REP : battery replacement cost of BS b.
  • E b CAP 
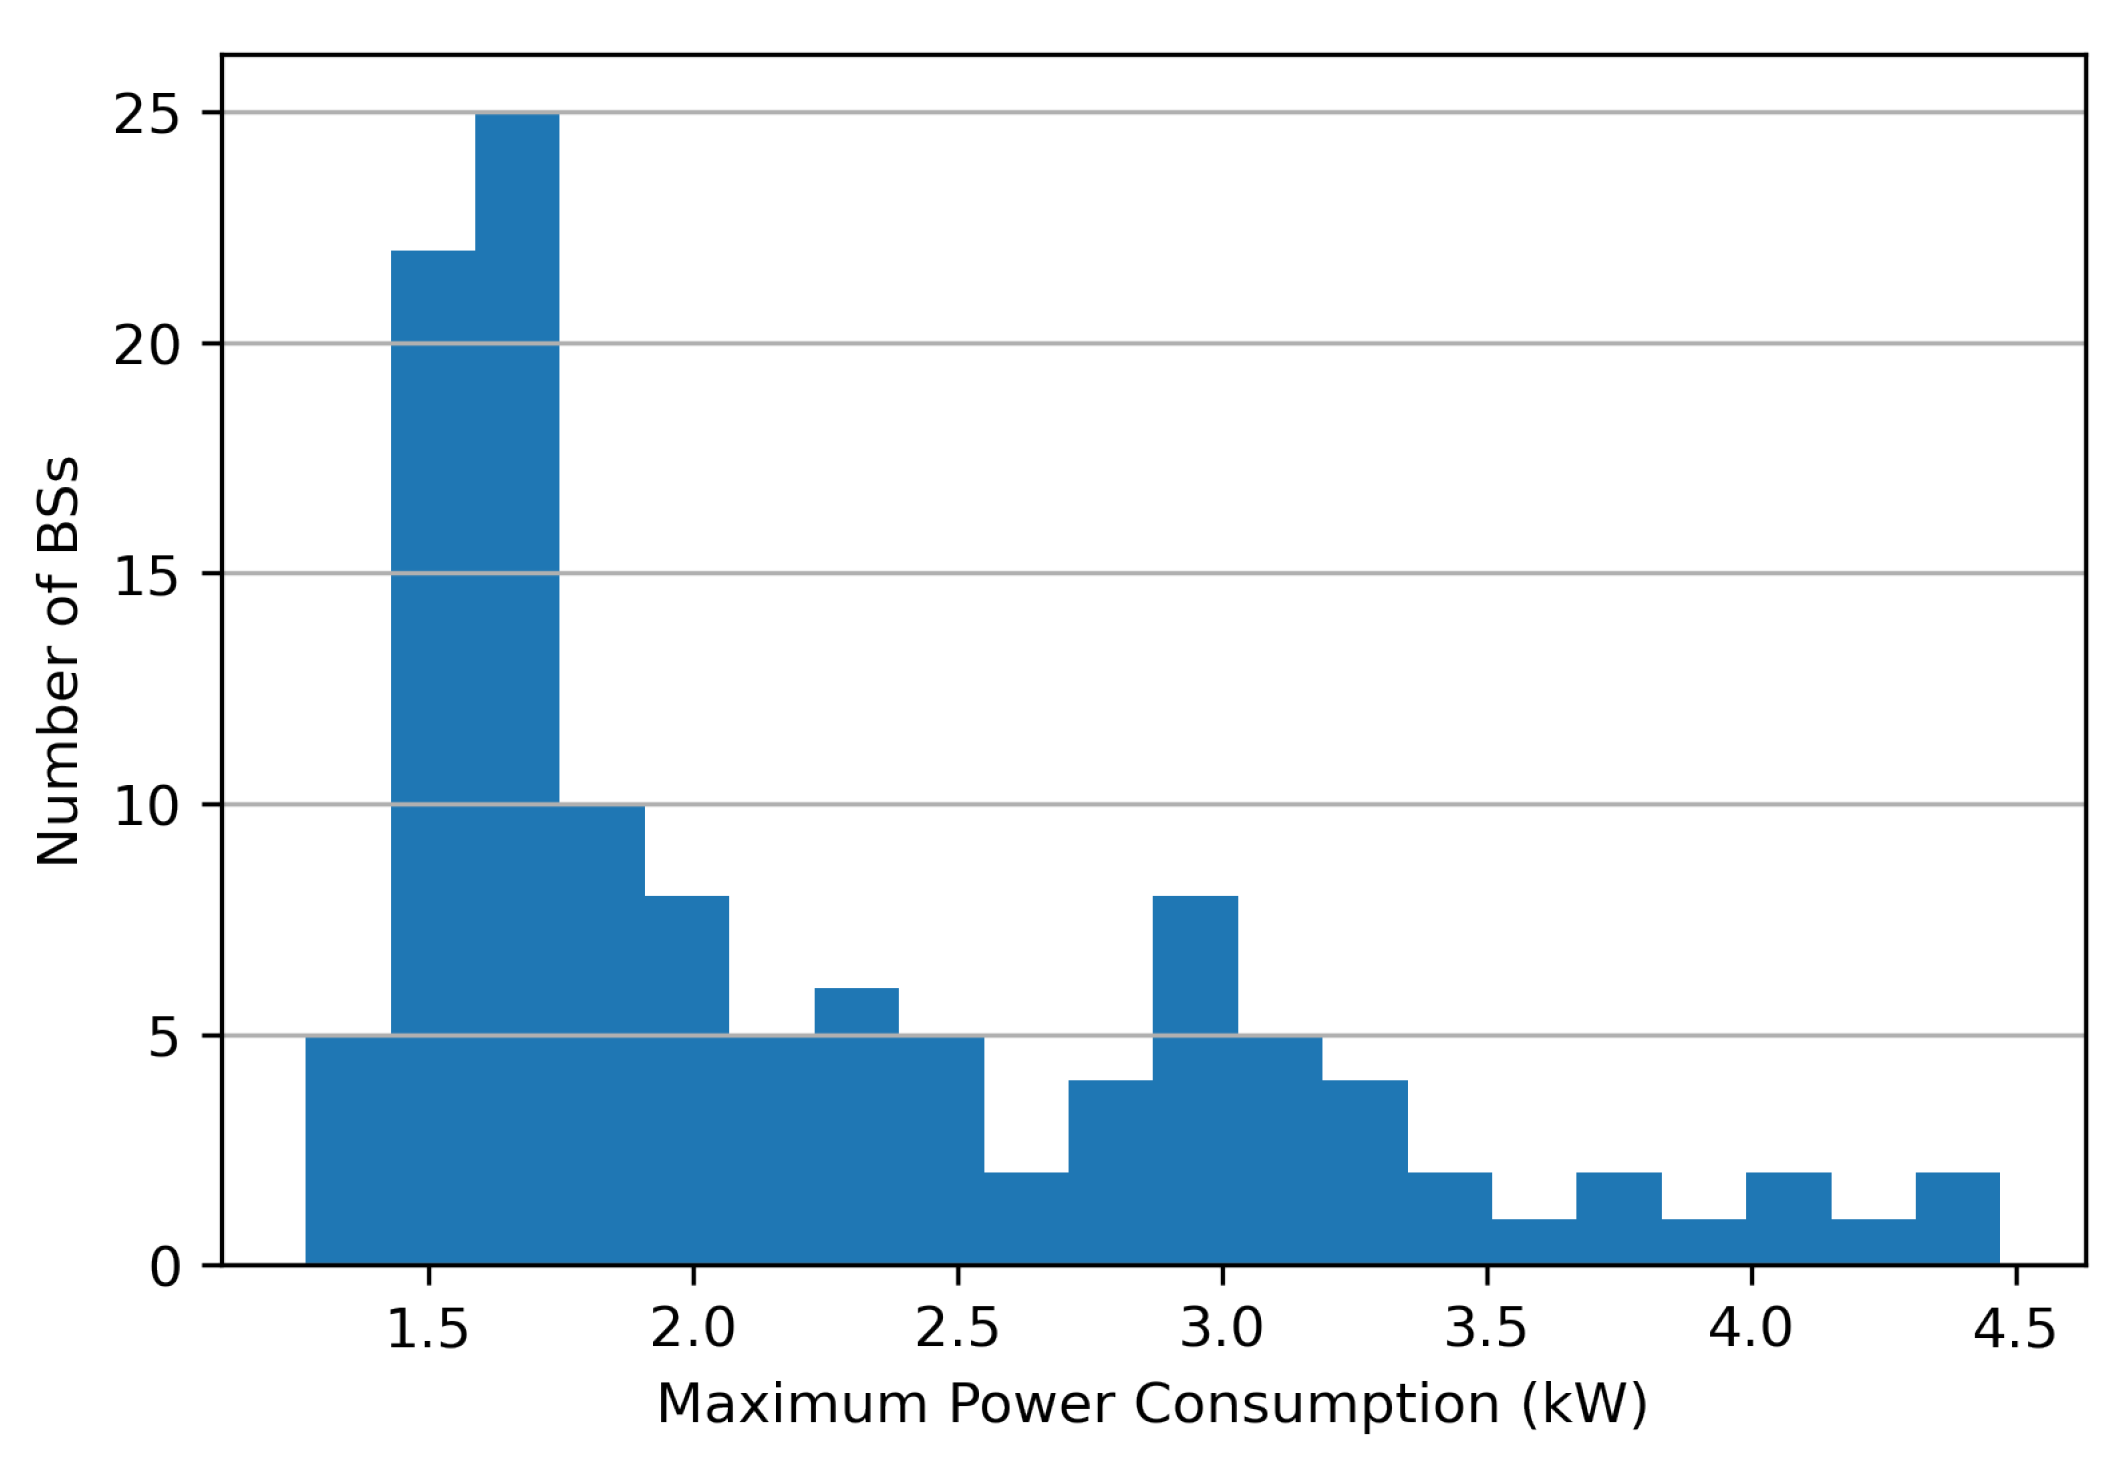
: battery capacity of BS b.
  • S o C b t max : battery max charge level of BS b at time t.
  • S o C b t min : battery min charge level of BS b at time t.
  • S o C b t INIT : initial battery charge level of BS b at time t.
  • P b t BS - CONS 
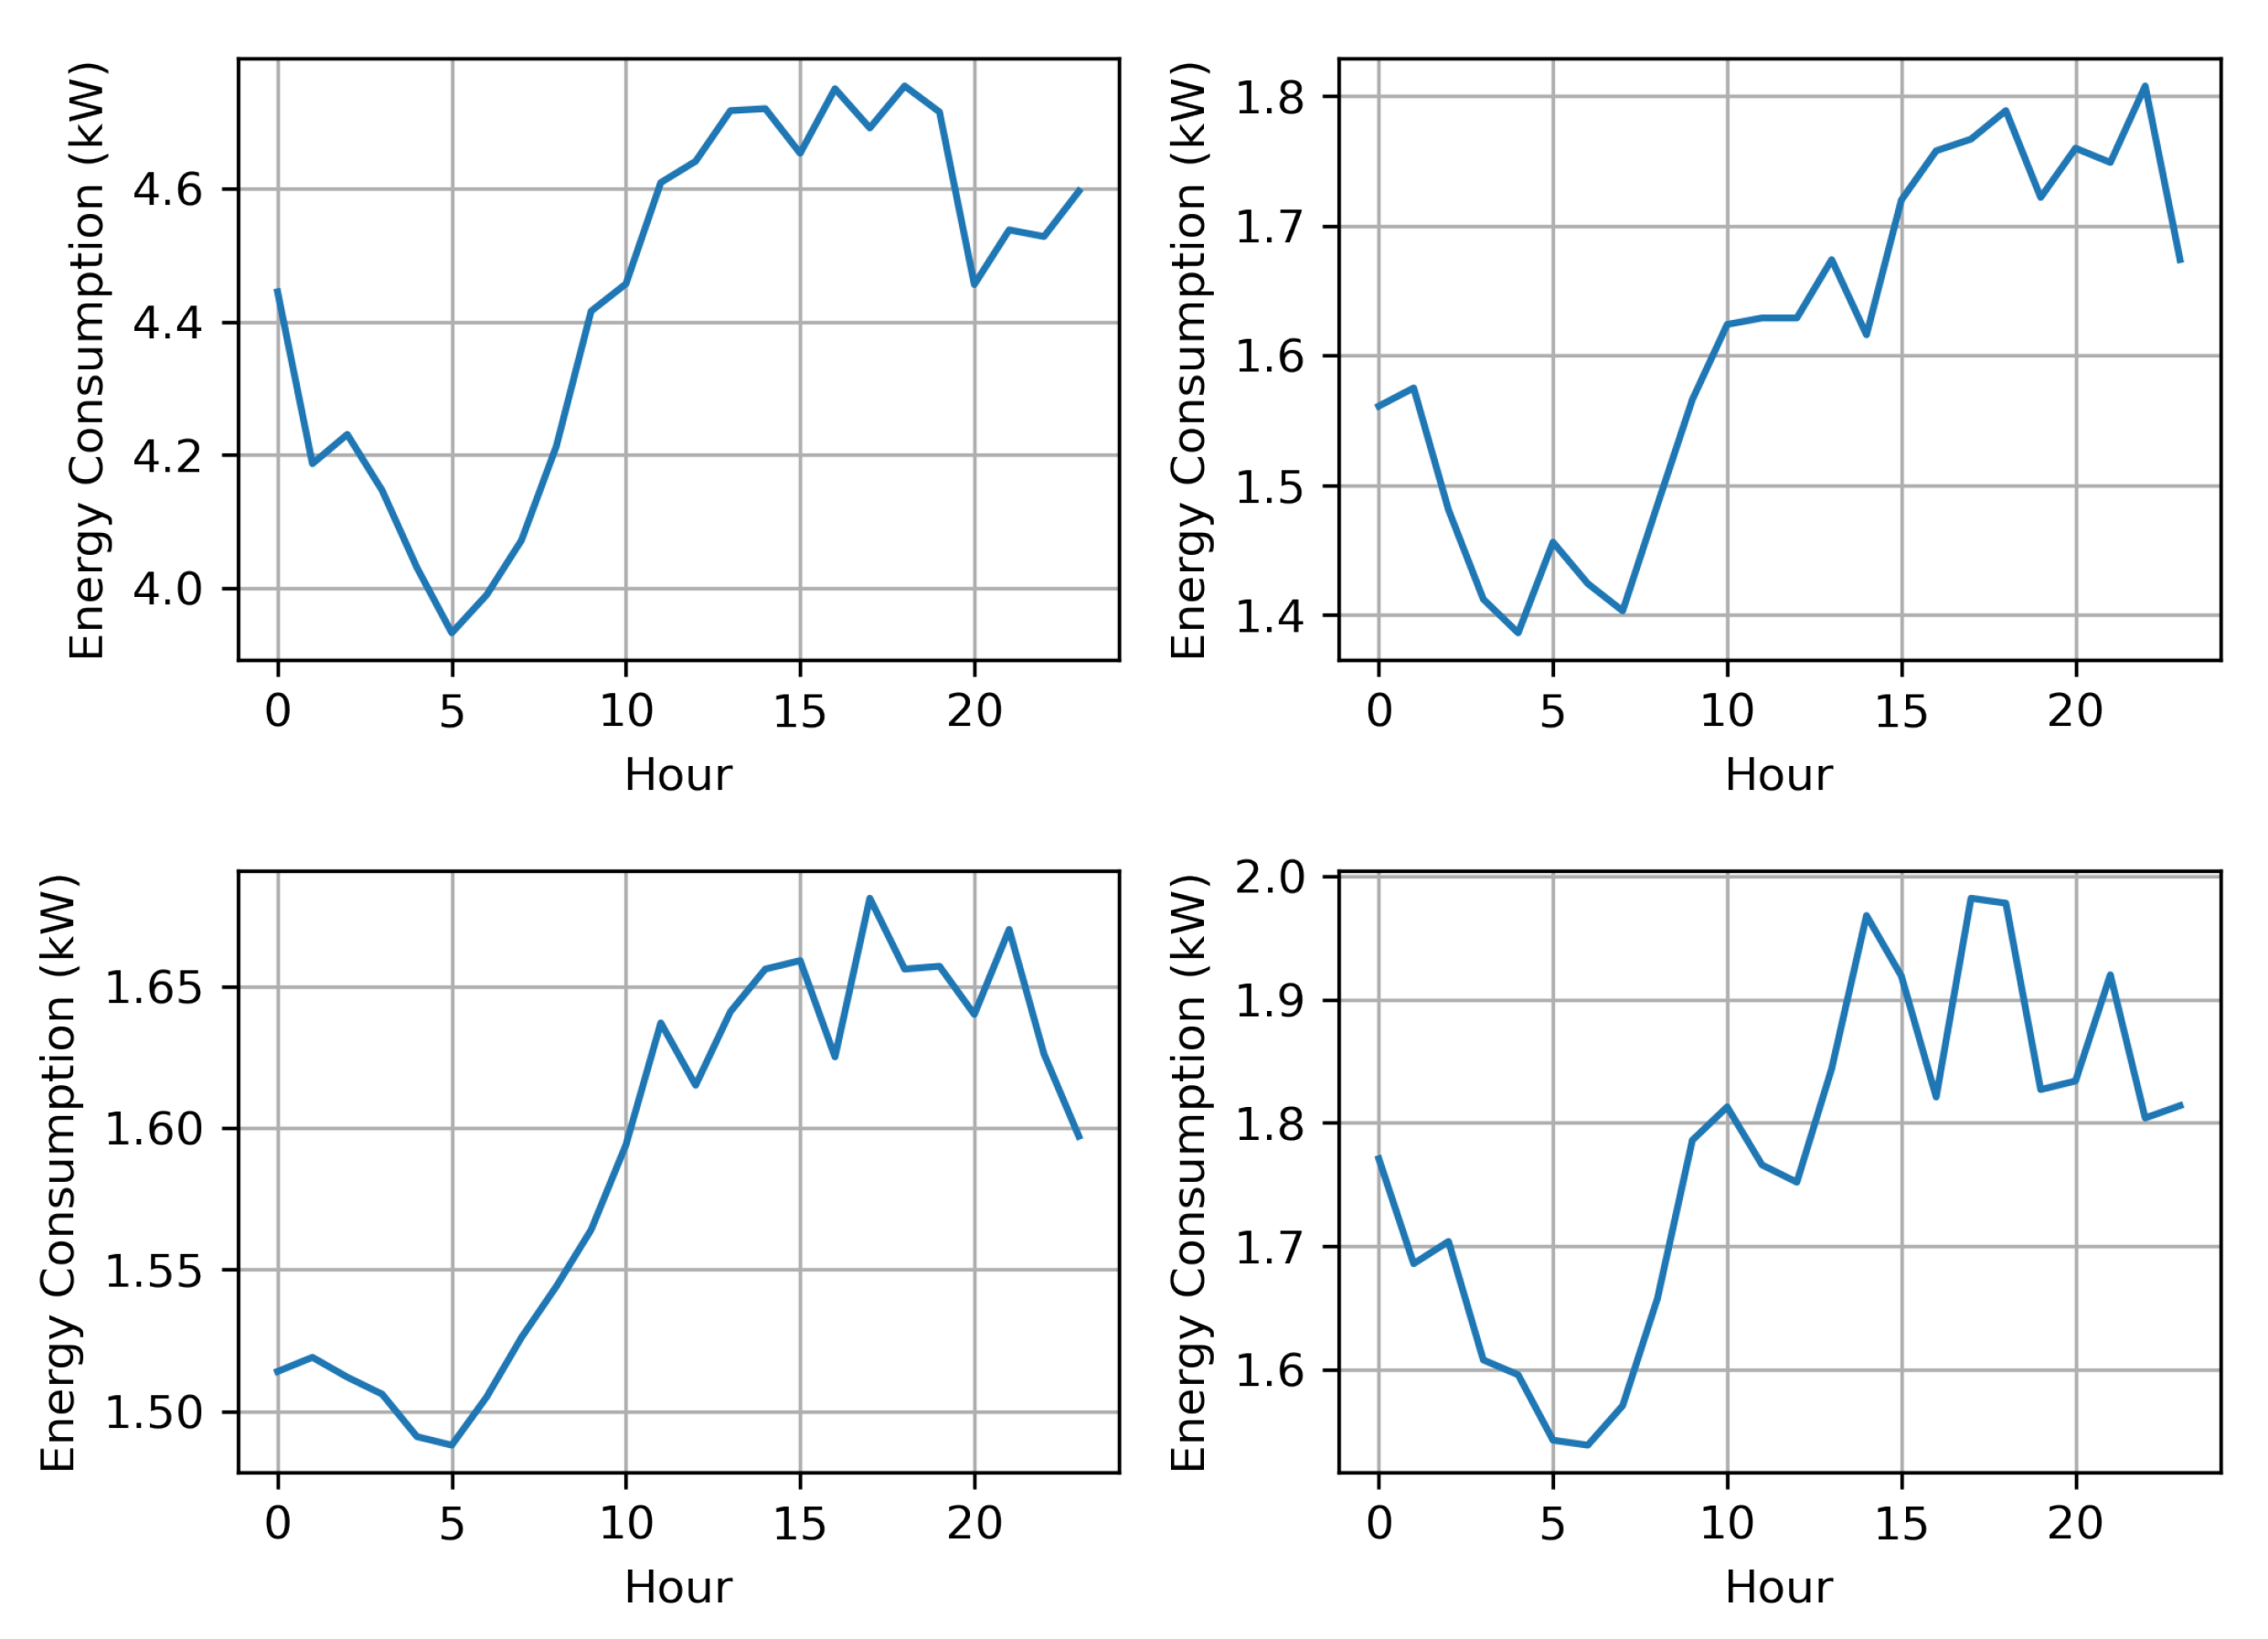
: power consumption of BS b during hour t.
  • N ( b ) : neighborhood of base station b. Each N ( b ) is formed by the k nearest BSs to b (k is also a parameter).
  • DIS T b , b : distance (in meters) between BS b and b .
  • w 1 and w 2 : weight values of the last two components of the optimization objective.
  • P BID : agreed power bid value.

5.3. Variable Definition

  • z γ { 0 , 1 } : 1 if configuration γ is selected; 0 otherwise.
  • x b P { 0 , 1 } : 1 if base station b is participating in the bidding as a primary BS; 0 otherwise.
  • x b S { 0 , 1 } : 1 if base station b is participating in the bidding as a backup BS; 0 otherwise.
  • x b t P { 0 , 1 } : 1 if base station b is participating in the bidding as a primary BS during time period t; 0 otherwise.
  • x b t S { 0 , 1 } : 1 if base station b is participating in the bidding as a backup BS during time period t; 0 otherwise.
  • y t { 0 , 1 } : 1 if t is the most profitable time for bidding participation; 0 otherwise.
  • s a { 0 , 1 } : 1 if some base stations are selected for bidding participation in electricity area a; 0 otherwise.
  • δ DIAM R 0 : cluster diameter.

5.4. Optimization Model: One Bidding Hour

Objective: maximize profit (capacity and energy compensation profit) and minimize penalty, battery degradation cost, cluster range (diameter), and number of selected BSs.
m a x i m i z e t T p t FCR · P BID · y t Capacity   ( availability )   profit + t T E t FCR - UP + E t FCR - DOWN · p t FCR Energy   compensation   profit t T E t PENAL - UP + E t PENAL - DOWN · p t PENAL Penalty   cost t T D t Battery degradation   cost w 1 · δ DIAM Cluster diameter w 2 · b B ( x b P + x b S ) , Number   of selected   BSs
where the following are true for t T and b B :
  • The overall FCR-UP and FCR-DOWN contribution per hour of time:
    E t FCR - UP = b B γ Γ b t E b t FCR - UP , γ · z γ , E t FCR - DOWN = b B γ Γ b t E b t FCR - DOWN , γ · z γ ,
Penalty for not meeting requested FCR demand:
E t PENAL - UP = RE Q t FCR - UP · y t E t FCR - UP ,
E t PENAL - DOWN = RE Q t FCR - DOWN · y t E t FCR - DOWN ,
Calculating the sum of all batteries’ degradation costs:
D t = b B γ Γ b t D b t γ · p b REP · z γ .
The objective function can be rewritten as follows:
m a x i m i z e t T b B γ Γ b t COS T b t γ · z γ + t T p t FCR · P BID · y t t T ( RE Q t FCR - UP + RE Q t FCR - DOWN ) · p t PENAL · y t w 1 δ DIAM b B w 2 ( x b P + x b S ) ,
where           COS T b t γ = E b t FCR - UP , γ + E b t FCR DOWN , γ p t FCR + p t PENAL D b t γ · p b REP .
Constraints:
Selection of participating BSs (primary and backup):
γ Γ b t z γ = x b t P b B , t T ,
x b P = t T x b t P x b S = t T x b t S b B .
Selection of the single bidding hour participation:
x b t P + x b t S y t b B , t T ,
t T y t = 1 .
Guarantee that the entity does not provide more energy than what was requested in up- or down-regulation
b B γ Γ b t E b t FCR - UP , γ · z γ RE Q t FCR - UP t T ,
b B γ Γ b t E b t FCR - DOWN , γ · z γ RE Q t FCR - DOWN t T .
Ensuring that the entity is capable of answering requests with the maximum agreed power bid (in MW) in both directions:
b B t T P b t BS - CONS · x b t P P BID ,
b B t T P b ch · x b t P P BID .
Guarantee that the entity has enough available energy (in MWh) to be fully activated for at least 15 min in both directions:
b B t T ( So C b t INIT So C b t min ) x b t P P BID · Δ h / 4 ,
b B t T ( So C b t max So C b t INIT ) x b t P P BID · Δ h / 4 .
Guarantee at least one backup BS for each primary BS:
x b t P b N ( b ) x b t S b B , t T .
Backup BSs must be prepared to accommodate, with their SoC, all FCR requests related to their primary BSs:
γ Γ b t E b t FCR - UP , γ · z γ b N ( b ) So C b t INIT So C b t min x b t S b B , t T ,
γ Γ b t E b t FCR - DOWN , γ · z γ b N ( b ) So C b t max So C b t INIT x b t S b B , t T .
Selection of BSs in the same geographical area:
DIS T b b ( x b P + x b P + x b S + x b S 1 ) δ DIAM b , b B .
Selection of BSs in the same electricity area:
b B e ( x b P + x b S ) M · s a a A ELEC ,
a A ELEC s a 1 .
Domains of the variables:
x b P , x b S { 0 , 1 } , b B
x b t P , x b t S { 0 , 1 } , b B , t T
y t { 0 , 1 } , t T
s a { 0 , 1 } , a A ELEC
z γ { 0 , 1 } , γ Γ
δ DIAM R 0 .
Constraint (6) decides on the selection of one BS battery configuration for a given base station and time period. Variable x b t P = 1 if the base station b participates in the bidding event during time period t; it is 0 otherwise.
The left set of constraints in (7) takes care of the consistency of the values of variables x b P and x b t P , i.e., that variable x b t P = 1 for at least one time-slot if variable x b P = 1 . On the other hand, x b P = 0 if variables x b t P are all equal to 0 for t T .
It is similar for the right set of constraints in (7): they ensure consistency between x b S and x b t S .
Constraints (8) and (9) select the hour of participation. Variable y t = 1 when the base station b participates in the bidding event of time period t, either as a primary or a backup (but not both); it is 0 otherwise.
Constraints (10) and (11) guarantee that all selected BSs working as primary BSs will not provide more energy than what was requested in up- or down-regulation.
Constraints (12) and (13) ensure that the entity (all selected primary BSs) has a greater discharge power capacity than the bid value and also has a greater absorption power capacity than the bid value (respectively, meeting the up- and down-regulation power requirements).
Constraints (14) and (15) guarantee that the entity (all selected primary BSs) has enough energy to, respectively, discharge (up-regulation) and recharge (down-regulation) with the power bid value for the entire bidding period. However, according to [11], units with limited energy reserves should be capable of being fully activated for at least 15 min in the bidding hour. Note that Δ h is the absolute time (in our case, one hour).
Constraint (16) assures that at least one backup BS will be selected for each primary BS.
Constraints (17) and (18) guarantee that the selected backup BSs have enough energy to deal with all FCR requests related to the primary BS (up and down requests). In other words, when b fails, b is prepared to contribute to the bidding, replacing b.
Constraint (19), together with the objective function (see (3)), ensures that the cluster diameter δ DIAM is minimized considering all distances DIS T b b among all pairs of the selected BSs b and b .
Constraints (20) and (21) guarantee that all selected primary and backup BSs belong to the same electricity zone.
Finally, constraints (22)–(27) take care of the domains of the variables.

6. Solution Scheme of the Decomposition Model

6.1. Pricing Problem: Generation of Hourly FCR Pattern for a Given Participating BS

This scheme is written for a given BS b and a given time period (hour) t, so that we can omit b and t indices to alleviate the notation. It describes the contribution of the BS under study regarding its participation in a set of FCR requests (events) of t.
Let E be the set of FCR non-zero events, indexed by e. Set E is partitioned into E DOWN and E UP (for downward and upward regulation requests, respectively). Each FCR event is associated with a given requested amount of energy, E e REQ , UP or E e REQ , DOWN . Figure 6 illustrates a sequence of events e at time t and potential BS participation. Note that BS b may only contribute partially to what was requested in event e and may not participate in all events.
The pricing problem allows the computation of the contribution E b t FCR - UP and E b t FCR - DOWN and its related battery degradation D b t for a given BS b and time t. As described in (29) and (30), contributions are defined and computed taking into account participation in all events. The output of the pricing problem is associated with an FCR configuration τ during time period t. Each new generated configuration is inserted in the master problem only if it is capable of improving the solution (see flowchart of Figure 5).
  • Variables
So C e = the state of charge of the battery of the base station under consideration after the FCR event e.
E e FCR - UP = the reduction in energy grid consumption (obtained by supplying the BS under investigation with its battery) for the FCR event e.
E e FCR - DOWN = the energy drained from the grid and stored in the battery of the BS under investigation for the FCR event e.
D t = the battery degradation rate associated with the current time t (see Section 6.2).
  • Example: Consider a given BS b during time period t and a set of FCR events E = { e 1 , e 2 , . . . e 10 } . At the end of time t, the output of the lower-level pricing can be represented by t E b t FCR - UP , E b t FCR - DOWN and D b t .
  • Objective: Reduced cost
The reduced cost associated with each variable z γ can be written as follows (see, e.g., Chvatal [34] if not familiar with linear programming concepts):
RCOS T b t γ = COS T b t γ u ( 6 ) u ( 10 ) E b t FCR - UP u ( 11 ) E b t FCR - DOWN u ( 17 ) E b t FCR - UP u ( 18 ) E b t FCR - DOWN ,
where COST γ is described in Equation (5), and u ( 6 ) 0 , u ( 10 ) 0 , u ( 11 ) 0 , u ( 17 ) 0 and u ( 18 ) 0 are the dual-value vectors of constraints (6), (10), (17), and (18), respectively.
E b t FCR - UP and E b t FCR - DOWN are defined as the sum of the energy of each instance of FCR event participation of b in t:
E b t FCR - UP = e E t E e FCR - UP ,
E b t FCR - DOWN = e E t E e FCR - DOWN ,
After replacing COS T b t γ by its expression (see (5)) and substituting the above expressions (29) and (30) in (28) and in (5), we obtain:
RCOS T b t γ = e E t E e FCR - UP + e E t E e FCR - DOWN p t FCR + p t PENAL p REP D t u ( 6 ) ( u ( 10 ) + u ( 17 ) ) e E t E e FCR - UP ( u ( 11 ) + u ( 18 ) ) e E t E e FCR - DOWN = e E t p t FCR + p t PENAL u ( 10 ) u ( 17 ) E e FCR - UP + e E t p t FCR + p t PENAL u ( 11 ) u ( 18 ) E e FCR - DOWN u ( 6 ) p REP D t .
Constraints: The constraints are written as follows.
  • A non-zero FCR event is associated with either upward or downward regulation. Thus, the set E can be represented by
    E = E UP E DOWN , E UP E DOWN = .
    In addition, assume that So C e 0 = So C INIT , where e 0 is an artificial event that contains the initial state of charge of the battery of BS b. Also, So C PRED ( e ) denotes the SoC value at the end of the previous FCR event.
  • Updating of SoC value:
    So C e = So C PRED ( e ) + E e FCR - DOWN , e E DOWN { e 0 }
    So C e = So C PRED ( e ) E e FCR - UP , e E UP { e 0 } .
    Participation in FCR down-regulation events:
    E e FCR - DOWN So C max So C PRED ( e ) , e E DOWN { e 0 } .
    Participation in FCR up-regulation events:
    E e FCR - UP E BS - CONS , e E UP ,
    E e FCR - UP So C PRED ( e ) So C min , e E UP { e 0 } .
    Variable bounds:
    So C min So C e So C max , e E ,
    0 E e FCR - UP E e REQ , UP , e E UP ,
    0 E e FCR - DOWN E e REQ , DOWN , e E DOWN .
Constraints (32) and (33) take care of the SoC value update after each instance of FCR participation. Note that an artificial event e 0 , representing the initial SoC, was included in the set. Thus, after each instance of FCR participation, denoted by E e FCR - DOWN and E e FCR - UP , the SoC value at the end of the current event is updated. If there is no participation, the SoC value remains unchanged.
Constraint (34) deals with the down- regulation requests, which means decreasing energy production or increasing consumption (in our case, carried out through battery charging). As batteries have limited storage capacity, (34) ensures that the battery does not receive more energy than its remaining capacity, i.e., So C max So C e .
On the other hand, constraints (35) and (36) deal with the up- regulation requests, which means increasing energy production or decreasing consumption. In our proposal, in order to reduce the energy consumption, we supply BS b, partially or fully, with its battery. More specifically, constraint (35) assures that the reduction in energy consumption is less or equal to the current energy consumption of the BS under analysis. Constraint (36) ensures that the battery does not discharge further than the So C min value.
Constraint (37) guarantees that SoC remains within its allowed boundaries. Constraints (38) and (39) ensure that no more energy than what was requested will be provided.
To simplify the model, charging/discharging losses (regarding battery efficiency) are not considered in this work.

6.2. Battery Degradation

We now estimate the battery degradation D b t related to the FCR participation of BS b at time period t. The calculation can be performed based on the battery degradation curve, as proposed in [21]. Note that the relationship between the number of cycles (cycle life) and depth of discharge (DoD) is logarithmic in nature. In this work, we used the cycle life data of a Li-ion battery described in [21], and its degradation curve is depicted in Figure 7.
As the curve is non-linear and can not be directly integrated into a Mixed Integer Linear Programming (MILP) problem, we linearize it using a piece-wise approximation. The curve is divided into d linear sections; see Figure 8 and Figure 9 an illustration of the degradation and degradation rate, respectively. Assuming that the batteries’ end of life (EoL) occurs when their nominal capacity is decreased by 20%, the degradation rate is D = 0.2 / N max _ cycles , where D is the degradation rate (in p.u./cycle) and N max _ cycles is the maximum number of cycles at each specific DoD .
Then, each segment of the degradation rate can be described as D d = D d M D o D t , d + D d B , where D d is the degradation rate value (p.u./cycle) for a specific DoD in segment d, D o D t , d is the D o D  d at time t, D d M is the slope of d, and D d B is the y-intercept point of d. Moreover, D o D d min D o D t , d D o D d max , where the parameters D o D d min and D o D d max are the minimum and maximum values of D o D of each segment d, respectively. Lastly, we have the following restrictions:
e E t DOWN E e FCR - DOWN / E CAP = d D D o D t , d ,
D o D t , d D o D d min S t , d D o D , d D ,
D o D t , d < D o D d max S t , d D o D , d D ,
d D S t , d D o D 1 ,
D t = d D D d M D o D t , d + D d B S t , d D o D ,
where S t , d D o D is a binary variable indicating the segment to which the battery discharge corresponds, E CAP indicates the battery’s total capacity, and D t is the degradation rate at time t. Equation (40) defines the relationship between the energy discharge and DoD . Constraints (41)–(43) assign the total DoD , obtained with Equation (40), to a specific segment of the curve. Equation (44) determines the degradation rate associated with the current time t.

7. Numerical Results

To demonstrate the effectiveness of the proposed scheme, we carried out numerical experiments on a cellular network with the capability of providing an FCR service. In Section 7.1, we briefly explore the grid frequency dataset. In Section 7.2, we describe the simulation setup. In the remaining Section 7.3 and Section 7.5, we present the experimental results.

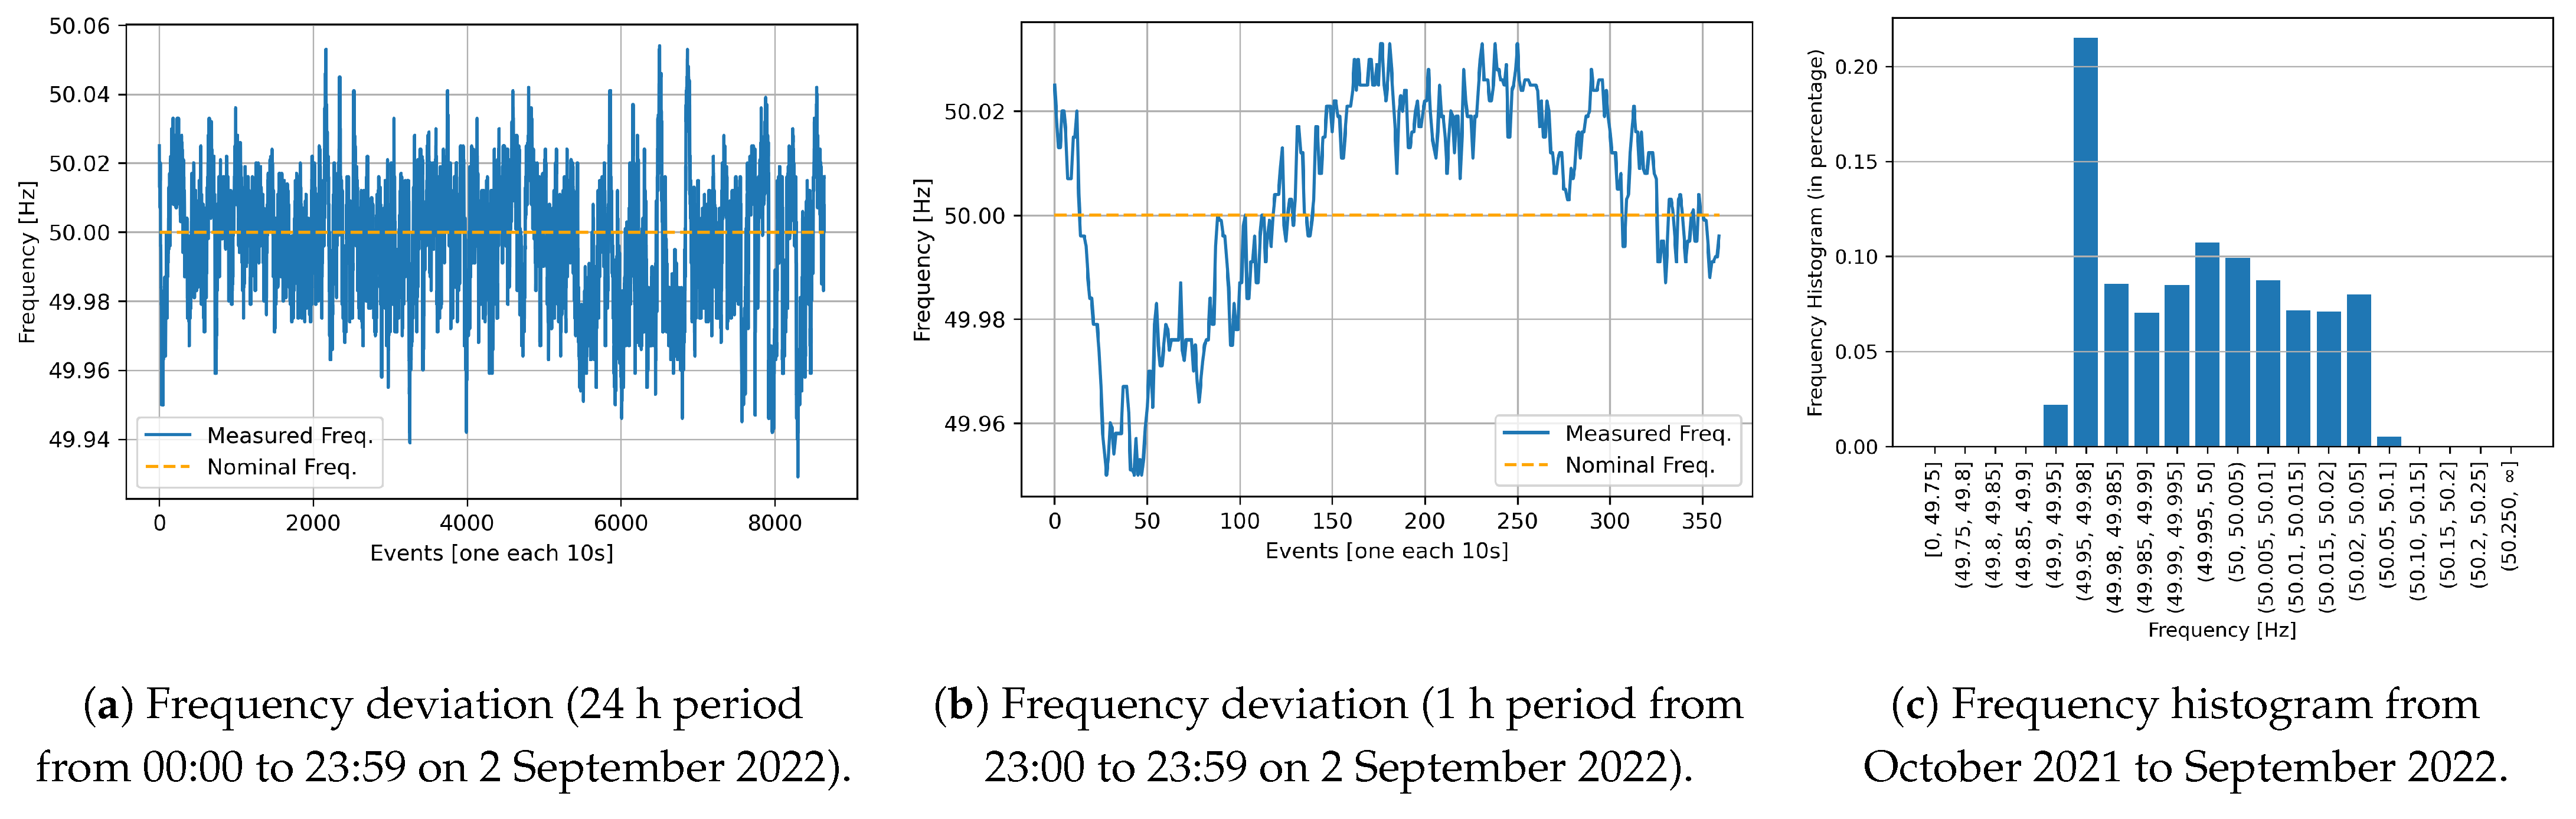
7.1. Frequency Dataset

We use the frequency deviation data provided by the Belgium TSO [37], with the grid deviations monitored daily from 1 October 2021 until 2 September 2022, with a ten-second interval. For the purpose of better perception, Figure 10a,b show the grid frequency deviation for one day and one hour, respectively.
Regarding the grid behavior for the entire above-mentioned period, Figure 10c shows a frequency histogram. As can be noted, most of the time (99.94%), the frequency was within the FCR-N limits (from 49.9 to 50.1 Hz). Thus, as the frequency rarely went beyond the FCR-N limits, the product was rarely fully activated. In addition, 97.2% of the time, the frequency deviation was lower than ±0.05 Hz (i.e., half or less of the auctioned power was requested). With respect to the predominant regulation direction, the frequency went below 50 Hz 54.86% of the time. Thus, upward regulations were requested slightly more often. Regarding FCR-D services, it is worth mentioning that the frequency went beyond ±0.1 Hz only approximately 0.05% of the analyzed time, meaning that FCR-D was rarely activated (the battery was not used).
In order to identify some trends in the frequency deviation over the study period, we plotted a boxplot across the months. As shown in Figure 11, we can notice that the median is slightly below 50 Hz for all months, and the interquartile range is similar. Note a small difference in the pattern from the last month (September) due to fewer days being available in the dataset for this time period. Additionally, outliers with higher values can be noted in late fall and winter for the downward regulation direction (≥50 Hz). On the other hand, for the direction of upward regulation, this same pattern is not so clear.

7.2. Simulation Setup

To simulate the CSP’s infrastructure, data from a real European CSP was used. A group of 120 georeferenced BSs and their hourly average energy consumption were considered. As an illustration, Figure 12 depicts four different BSs’ energy consumption throughout a day. In general, we observed a maximum power consumption within a range of 1 kW to 5 kW (depending on the BSs’ load as well as their network traffic). Figure 13 illustrates the distribution of the maximum power consumption of the 120 BSs participating in the experiments.
Regarding BS batteries, we assumed that all BSs were equipped with Li-ion batteries. Three standard battery systems for mobile base stations consisting of two strings of four 12 V batteries with a capacity of 75 Ah, 100 Ah, or 150 Ah were considered (Type I, II, and III, respectively). Each choice of battery capacity was made taking into account the maximum hourly consumption of the BS ( P b t BS - CONS , max ) and a minimum autonomy of three hours. They were defined as follows:
E b CAP = Type I if P b BS - CONS , max 2 kWh , Type II if 2   kWh < P b BS - CONS , max 3 kWh , Type III if P b BS - CONS , max 3 kWh .
The batteries’ ability to absorb ( P b ch ) and discharge power ( P b dc ) was set to 5 kW. The battery replacement cost ( p b REP ) was set to USD 137 per kWh.
Regarding the eligibility to provide FCR, we assume that the CSP was already pre-approved and, thus, was capable of meeting all the requirements described in Table 1. We also considered that the FCR price, FCR events (grid requests), and BSs’ energy consumption was correctly predicted and were available to be used a day-ahead. To solve the linear and mixed integer linear models involved in the solution of the proposed large-scale optimization model, we used Gurobi Python v.9.5 solver software running on an i7-8650U CPU @ 1.90 GHz processor with 32 GB RAM.

7.3. Experiment I (FCR-N)

In our first experiment, we investigated the model and solution’s efficiency on the FCR-N service. We selected three days in different seasons of the year. The key results are summarized in Table 3. As can be noted, besides selecting the most profitable hour to bid, the algorithm was able to deliver all the requested energy, resulting in near-zero missing energy in all scenarios. Thus, maximum profit was achieved without any penalties. In addition, the energy payment was considerably superior compared to the battery degradation cost. Note that the activated energy tends to be relatively small. Therefore, the most significant revenue lies in the capacity provision rather than the remuneration of activated energy. Among the three selected dates, the seasons with the highest activated energy are spring, winter, and summer. However, as depicted in the boxplot of Figure 11, the frequency deviation distribution per month is similar; therefore it is not so much related to the seasons but is more dependent on what happened in the selected hour. Lastly, it can be noted that the cluster selection was constrained by the upward power capacity.
Regarding the BS cluster selection, as illustrated in Figure 14, most of the selected BSs were not used. In other words, they were selected (in order to guarantee the bid capacity) but were not activated (as, in the intraday period, the energy requested was much lower than the bid capacity). The variation in the number of selected BSs to provide the same 0.1 MW can be explained by the clusters’ available power capacity regarding each hour (system bottleneck). For example, for the bid on 10/04/22 at 6 a.m. bid, 46 BSs were needed to reach 0.1 MW in power capacity, while for the bid on 10/01/22 at 4 p.m., a time where usually BSs have higher power consumption (see Figure 12), the same value was reached with 40 BSs. With respect to the number of primary BSs (activated BSs), the values were related to the requested energy and BSs’ capacity. Backup BSs varied according to their capacity and the protected participation of the primary BSs.
Figure 15 depicts the geolocation of the selected BSs in an area. Note that in order to reduce the activation signal latency, the cluster diameter was minimized in the optimization process. It is worth mentioning that the latitude and longitude values were omitted in order to keep the confidentiality of the data.

7.4. Experiment II (FCR-D)

Our second experiment regards FCR-D. With a few adjustments in the optimization model, we were able to simulate scenarios for up- and down-regulated products. Note that, differently from FCR-N, the initial battery charge level ( S o C b t INIT ) was set to S o C b t max and S o C b t min for FCR-D up- and down-regulation, respectively (to maximize the energy availability). Table 4 summarizes the results. Although FCR-D was rarely activated with the available frequency dataset, we selected two days where the frequency went into the FCR-D activation limits.
Similarly to the FCR-N experiment, the algorithm was capable of finding the most profitable time. With respect to the number of selected BSs, as illustrated in Figure 14, fewer BSs were necessary to reach the same 0.1 MW of power capacity in the FCR-D down-regulation when compared to the FCR-D up-regulation service. This can be justified by the fact that in FCR-D, each service must guarantee the auctioned power capacity only in its respective regulation direction. Thus, as more power capacity is available in downward direction (it does not depend on the BSs’ energy consumption), fewer BSs are necessary. It is important to highlight that as FCR-D does not offer energy compensation, the profit relies only on the capacity payment. Therefore, depending on the clearing price value and the battery degradation cost associated with the FCR-D activation, the most profitable hour may have no energy request, leading to no activated BSs within the bid hour (as occurred in both simulations of Experiment II).

7.5. FCR Potential and Scaling Up CSP Participation

While the potential profit of a single bid with minimum capacity (0.1 MW) is limited, there is an opportunity to scale the bids, activating more resources (multiple clusters or larger clusters) to expand FCR participation to several MW.
In order to estimate this potential, let us estimate the yearly profit of a typical medium–large CSPs interested in providing FCR services. Based on the Experiment I results, to form a cluster capable of reaching a 0.1 MW power capacity, a total of 46 BSs is needed (worst experimental case), giving us a rate of 460 BSs/MW. However, a typical CSP runs a number of BSs in the order of thousands, allowing a significant increment in terms of offered power capacity.
A CSP running ten thousand BSs, where only 40% are ready/suitable to provide FCR services, could reach an aggregated power capacity of nearly 9 MWh. With an FCR-N average price (37.62 USD/MWh in 2021; see Table 2) and six bids per day, it represents a capacity (availability) profit of USD 741,490.20. To simplify the estimation, neither the energy payment gain nor the battery degradation cost have been taken into account in this analysis. In practice, since energy profit tends to exceed battery degradation, the estimated annual revenue would be even higher.

8. Conclusions

In this study, we propose a large-scale optimization model to investigate the potential scenario of cellular networks providing FCR services. Through the use of the BSs’ batteries spare capacity, a novel formulation for identifying the best bidding period, considering the selection of the BSs that offer the highest profit, is presented. All requirements for FCR participation in the Swedish market and all components of a typical cellular system are taken into account.
Our experiments demonstrated the effectiveness of our formulation for FCR-N and FCR-D services. In all scenarios, the system was able to identify the most profitable bid hour, forming effective clusters with a minimum diameter and answering all grid requests correctly. In addition, our results indicated that the degradation cost represents only a small fraction of the obtained profit and, while providing FCR services, a negligible impact on the ability to protect the critical telecommunications loads was observed.
Furthermore, the present study shows a novel alternative to providing ancillary services, which opens a new revenue stream for CSPs.

9. Future Work

This research will continue to improve the proposed optimization algorithm in terms of scalability and convergence, enabling it to handle multiple bids and a larger number of BSs. In addition, research activities can continue in the following directions:
(i)
Development of algorithms (e.g., machine learning) to predict, a day ahead, all required input values.
(ii)
Finding a faster but still efficient optimization method, e.g., heuristics, especially for cases of several BSs.
(iii)
Investigating similar optimization methods for other FR services such as fast frequency reserve (FFR).
(iv)
Investigating a new approach to automatically identify and select the most profitable FR service for each hour.
(v)
Investigating the impact on CSPs’ FR operations and profits when equipping BSs with a renewable energy source (such as solar and/or wind).

Author Contributions

Conceptualization, B.J.; Methodology, L.D. and B.J.; Validation, L.D.; Investigation, L.D.; Resources, B.J.; Data curation, L.E.; Writing—original draft, L.D. and B.J.; Visualization, L.D.; Supervision, B.J.; Funding acquisition, B.J. All authors have read and agreed to the published version of the manuscript.

Funding

The work of Leonardo Dias was funded and supported by the Ericsson Global Artificial Intelligence AI Accelerator (GAIA), Mitacs Accelerate Grant IT26240, and FRQNT Grant B2X-351518.

Data Availability Statement

The original contributions presented in the study are included in the article, further inquiries can be directed to the corresponding author.

Conflicts of Interest

Lackis Eleftheriadis was employed by Ericsson. The remaining authors declare that the research was conducted in the absence of any commercial or financial relationships that could be construed as a potential conflict of interest.

Nomenclature

Acronyms
ASsAncillary services
BSsCellular base stations
BESSBattery energy storage system
CSPCommunication service srovider
D-1/D-2One day ahead/two days ahead
DSODistribution system sperator
DoDBattery septh of sischarge
ENM/OSSEricsson Network Manager/Operation Support Systems
FCRFrequency Containment Reserve
FCR-DFrequency Containment Reserve for Disturbances
FCR-NFrequency Containment Reserve for Normal Operation
FRFrequency regulation
ILPInteger Linear Programming
MILPMixed Integer Linear Programming
PSUPower supply unit
SoCBattery state of charge
TSOTransmission system operator
4G/5GFourth/fifth generation of cellular network
Indexes and sets
BSet of cellular base stations, indexed by b
TSet of time-slots within a market day, indexed by t
A ELEC Set of electric zones, indexed by a
Γ Set of configurations, indexed by γ
ESet of FCR events, indexed by e
Parameters
p t FCR Clearing FCR price at hour t
p t PENAL Penalty FCR price at hour t
RE Q t FCR - UP Sum of FCR up-regulation requests at hour t
RE Q t FCR - DOWN Sum of FCR down-reg. requests at hour t
P b ch Ability of the battery of BS b to absorb energy
P b dc Ability of the battery of BS b to discharge energy
p b REP Battery replacement cost of BS b
E b CAP Battery capacity of BS b
E b t S - CAP Battery spare capacity of BS b at time t
S o C b t max Battery max charge level of BS b at time t
S o C b t min Battery min charge level of BS b at time t
S o C b t INIT Initial battery charge level of BS b at time t
P b t BS - CONS Power consumption of BS b during hour t
N ( b ) Neighborhood set of base station b. Each N ( b ) is formed by the k
nearest BSs to b (k is also a parameter)
DIS T b , b Distance (in meters) between BS b and b
w 1 and w 2 Weight values of the last two components of the optimization objective
P BID Agreed power bid value.
Variables of the master problem
z γ { 0 , 1 } 1 if configuration γ is selected; 0 otherwise
x b P { 0 , 1 } 1 if base station b is participating in the bidding as a primary BS;
0 otherwise
x b S { 0 , 1 } 1 if base station b is participating in the bidding as a backup BS;
0 otherwise
x b t P { 0 , 1 } 1 if base station b is participating in the bidding as a primary BS
during time period t; 0 otherwise
x b t S { 0 , 1 } 1 if base station b is participating in the bidding as a backup BS
during time period t; 0 otherwise
y t { 0 , 1 } 1 if t is the most profitable time for bidding participation;
0 otherwise
s a { 0 , 1 } 1 if some base stations are selected for bidding participation in
electricity area a; 0 otherwise
δ DIAM R 0 Diameter value of the formed cluster of BSs
E t FCR - DOWN R 0 Overall FCR contribution for downward direction during time t
E t FCR - UP R 0 Overall FCR contribution for upward direction during time t
E t PENAL - DOWN R 0 Penalty for not providing requested FCR demand in downward
direction during time t
E t PENAL - UP R 0 Penalty for not providing requested FCR demand in upward
direction during time t
Variables of the pricing problem
So C e State of charge of the battery of BS b after FCR event e.
E e FCR - UP Reduction in energy grid consumption (obtained by supplying BS b
under investigation with its battery) for FCR event e.
E e FCR - DOWN Energy drained from the grid and stored in the battery of BS b
under investigation for FCR event e.
D t Battery degradation rate associated with the current participation
at time t (see Section 6.2)

References

  1. Khodadadi, A.; Herre, L.; Shinde, P.; Eriksson, R.; Söder, L.; Amelin, M. Nordic balancing markets: Overview of market rules. In Proceedings of the International IEEE Conference on the European Energy Market (EEM), Stockholm, Sweden, 16–18 September 2020; pp. 1–6. [Google Scholar] [CrossRef]
  2. Alaperä, I.; Manner, P.; Salmelin, J.; Antila, H. Usage of telecommunication base station batteries in demand response for frequency containment disturbance reserve: Motivation, background and pilot results. In Proceedings of the IEEE International Telecommunications Energy Conference (INTELEC), Broadbeach, Australia, 22–26 October 2017; pp. 223–228. [Google Scholar] [CrossRef]
  3. Pardo, M.; Madina, C.; Marroquin, M.; Estrade, E. Use of Radio Base Stations to Provide Services to the DSO through Local Flexibility Markets. In Proceedings of the 25th International Conference on Electricity Distribution, Madrid, Spain, 3–6 June 2019; pp. 1–5. [Google Scholar] [CrossRef]
  4. Eleftheriadis, L.; Pettersson, J.; Hallberg, H.; Palma-Serrano, M. Ancillary Services to Utilities Using Mobile Network Power Infrastructure; Technical Report; Ericsson Research: Stockholm, Sweden, 2021. [Google Scholar]
  5. Hassan, H.A.H.; Renga, D.; Meo, M.; Nuaymi, L. A novel energy model for renewable energy-enabled cellular networks providing ancillary services to the smart grid. IEEE Trans. Green Commun. Netw. 2019, 3, 381–396. [Google Scholar] [CrossRef]
  6. Hashmi, M.U.; Labidi, W.; Bušić, A.; Elayoubi, S.E.; Chahed, T. Long-term revenue estimation for battery performing arbitrage and ancillary services. In Proceedings of the IEEE International Conference on Communications, Control, and Computing Technologies for Smart Grids (SmartGridComm), Aalborg, Denmark, 29–31 October 2018; pp. 1–7. [Google Scholar] [CrossRef]
  7. I, C.-L.; Han, S.; Bian, S. Energy-efficient 5G for a greener future. Nat. Electron. 2020, 3, 182–184. [Google Scholar] [CrossRef]
  8. Draheim, P.; Schlachter, U.; Wigger, H.; Worschech, A.; Brand, U.; Diekmann, T.; Schuldt, F.; Hanke, B.; von Maydell, K.; Vogt, T. Business case analysis of hybrid systems consisting of battery storage and power-to-heat on the German energy market. Util. Policy 2020, 67, 101110. [Google Scholar] [CrossRef]
  9. Svenska Kraftnät. Information on Different Ancillary Services. 2023. Available online: https://www.svk.se/en/stakeholders-portal/electricity-market/provision-of-ancillary-services/information-on-different-ancillary-services/ (accessed on 22 July 2023).
  10. Zhu, D.; Zhang, Y.J.A. Optimal coordinated control of multiple battery energy storage systems for primary frequency regulation. IEEE Trans. Power Syst. 2018, 34, 555–565. [Google Scholar] [CrossRef]
  11. Svenska Kraftnät. Balance Responsible Party (BRP) Agreement. 2022. Available online: https://www.svk.se/en/stakeholders-portal/electricity-market/balance-responsibility/balance-responsibility-agreement/ (accessed on 22 July 2023). (In Swedish).
  12. Svenska Kraftnät. Frequency Containment Reserve Disturbance Upregulation, FCR-D up. 2022. Available online: https://www.svk.se/aktorsportalen/bidra-med-reserver/om-olika-reserver/fcr-d-upp/ (accessed on 22 July 2023). (In Swedish).
  13. Svenska Kraftnät. Frequency Containment Reserve Disturbance Downregulation, FCR-D down. 2022. Available online: https://www.svk.se/aktorsportalen/bidra-med-reserver/om-olika-reserver/fcr-d-ned/ (accessed on 22 July 2023). (In Swedish).
  14. Svenska Kraftnät. Mimer—Primary Regulation Statistics. 2022. Available online: https://mimer.svk.se/PrimaryRegulation/PrimaryRegulationIndex (accessed on 22 July 2023). (In Swedish).
  15. Fan, X.; Wang, F.; Liu, J. On backup battery data in base stations of mobile networks: Measurement, analysis, and optimization. In Proceedings of the ACM International on Conference on Information and Knowledge Management, Indianapolis, IN, USA, 24–28 October 2016; pp. 1513–1522. [Google Scholar] [CrossRef]
  16. Saldaña, G.; San Martin, J.I.; Zamora, I.; Asensio, F.J.; Oñederra, O. Electric vehicle into the grid: Charging methodologies aimed at providing ancillary services considering battery degradation. Energies 2019, 12, 2443. [Google Scholar] [CrossRef]
  17. Ahmadian, A.; Sedghi, M.; Elkamel, A.; Fowler, M.; Golkar, M.A. Plug-in electric vehicle batteries degradation modeling for smart grid studies: Review, assessment and conceptual framework. Renew. Sustain. Energy Rev. 2018, 81, 2609–2624. [Google Scholar] [CrossRef]
  18. Wang, D.; Coignard, J.; Zeng, T.; Zhang, C.; Saxena, S. Quantifying electric vehicle battery degradation from driving vs. vehicle-to-grid services. J. Power Sources 2016, 332, 193–203. [Google Scholar] [CrossRef]
  19. Schoch, J.; Gaerttner, J.; Schuller, A.; Setzer, T. Enhancing electric vehicle sustainability through battery life optimal charging. Transp. Res. Part B Methodol. 2018, 112, 1–18. [Google Scholar] [CrossRef]
  20. Guo, J.; Yang, J.; Lin, Z.; Serrano, C.; Cortes, A.M. Impact analysis of V2G services on EV battery degradation - A review. In Proceedings of the IEEE Milan PowerTech, Milan, Italy, 23–27 June 2019; pp. 1–6. [Google Scholar] [CrossRef]
  21. Peñaranda, A.; Romero-Quete, D.; Cortés, C. Grid-Scale Battery Energy Storage for Arbitrage Purposes: A Colombian Case. Batteries 2021, 7, 59. [Google Scholar] [CrossRef]
  22. Angenendt, G.; Zurmühlen, S.; Figgener, J.; Kairies, K.P.; Sauer, D.U. Providing frequency control reserve with photovoltaic battery energy storage systems and power-to-heat coupling. Energy 2020, 194, 116923. [Google Scholar] [CrossRef]
  23. Han, X.; Hong, Z.; Su, Y.; Wang, Z. Optimal operations of energy storage systems in multi-application scenarios of grid ancillary services based on electricity price forecasting. Int. J. Energy Res. 2021, 45, 7145–7160. [Google Scholar] [CrossRef]
  24. Zhang, S.; Zhao, S.; Yuan, M.; Zeng, J.; Yao, J.; Lyu, M.R.; King, I. Traffic prediction based power saving in cellular networks: A machine learning method. In Proceedings of the ACM SIGSPATIAL International Conference on Advances in Geographic Information Systems, Redondo Beach, CA, USA, 7–10 November 2017; pp. 1–10. [Google Scholar] [CrossRef]
  25. Thien, T.; Schweer, D.; vom Stein, D.; Moser, A.; Sauer, D.U. Real-world operating strategy and sensitivity analysis of frequency containment reserve provision with battery energy storage systems in the german market. J. Energy Storage 2017, 13, 143–163. [Google Scholar] [CrossRef]
  26. Marchgraber, J.; Gawlik, W.; Wailzer, G. Reducing SoC-Management and losses of battery energy storage systems during provision of frequency containment reserve. J. Energy Storage 2020, 27, 101107. [Google Scholar] [CrossRef]
  27. Divshali, P.H.; Evens, C. Optimum operation of battery storage system in frequency containment reserves markets. IEEE Trans. Smart Grid 2020, 11, 4906–4915. [Google Scholar] [CrossRef]
  28. He, G.; Chen, Q.; Kang, C.; Pinson, P.; Xia, Q. Optimal bidding strategy of battery storage in power markets considering performance-based regulation and battery cycle life. IEEE Trans. Smart Grid 2015, 7, 2359–2367. [Google Scholar] [CrossRef]
  29. Tepe, B.; Figgener, J.; Englberger, S.; Sauer, D.U.; Jossen, A.; Hesse, H. Optimal pool composition of commercial electric vehicles in V2G fleet operation of various electricity markets. Appl. Energy 2022, 308, 118351. [Google Scholar] [CrossRef]
  30. Hashemi, S.; Arias, N.; Andersen, P.B.; Christensen, B.; Træholt, C. Frequency regulation provision using cross-brand bidirectional V2G-enabled electric vehicles. In Proceedings of the IEEE International Conference on Smart Energy Grid Engineering (SEGE), Oshawa, ON, Canada, 12–15 August 2018; pp. 249–254. [Google Scholar] [CrossRef]
  31. Arias, N.B.; Hashemi, S.; Andersen, P.B.; Træholt, C.; Romero, R. Assessment of economic benefits for EV owners participating in the primary frequency regulation markets. Int. J. Electr. Power Energy Syst. 2020, 120, 105985. [Google Scholar] [CrossRef]
  32. Alaperä, I.; Honkapuro, S.; Paananen, J. Data centers as a source of dynamic flexibility in smart grids. Appl. Energy 2018, 229, 69–79. [Google Scholar] [CrossRef]
  33. Yong, P.; Zhang, N.; Liu, Y.; Hou, Q.; Li, Y.; Kang, C. Exploring the Cellular Base Station Dispatch Potential Towards Power System Frequency Regulation. IEEE Trans. Power Syst. 2021, 37, 820–823. [Google Scholar] [CrossRef]
  34. Chvatal, V. Linear Programming; Freeman: Dallas, TX, USA, 1983. [Google Scholar]
  35. Lasdon, L. Optimization Theory for Large Systems; MacMillan: New York, NY, USA, 1970. [Google Scholar]
  36. Desaulniers, G.; Desrosiers, J.; Solomon, M.M. (Eds.) Column Generation; GERAD 25th Anniversary Series; Springer: New York, NY, USA, 2005. [Google Scholar]
  37. Elia. Elia Open Data Portal. 2022. Available online: https://external-elia.opendatasoft.com/ (accessed on 22 July 2023).
Figure 1. Relationship between requested power and grid frequency in FCR provision. The requested power varies according to the frequency deviation.
Energies 17 03775 g001
Figure 2. Three possible operational states of a BS providing FCR.
Energies 17 03775 g002
Figure 3. Radio base stations participating in FCR. For each bidding hour, a group of BSs is selected. The primary BSs actively participate in the service, while the backup BSs must supplement the primary in the event of a breakdown (in case of failure).
Energies 17 03775 g003
Figure 4. Battery usage in the proposed model: only matches the spare capacity area while preserving the backup one throughout the day.
Energies 17 03775 g004
Figure 5. Column generation ILP flowchart. The master and pricing problems are solved alternately until the optimality condition is satisfied. In such a case, the optimal solution of the linear programming relaxation (LP) has been reached and we derive an ϵ -optimal integer linear programming solution for the last ILP master problem.
Energies 17 03775 g005
Figure 6. Example of grid requests for time period t and its associated BS contributions. Note that each grid request can be answered by multiple BSs.
Energies 17 03775 g006
Figure 7. Degradation curve of a Li-ion battery, based on [21].
Energies 17 03775 g007
Figure 8. Linear segments of the Li-ion battery degradation curve.
Energies 17 03775 g008
Figure 9. Linear segments of the Li-ion battery degradation rate curve.
Energies 17 03775 g009
Figure 10. Frequency deviations in Belgian power grid.
Energies 17 03775 g010
Figure 11. Frequency deviation vs. months during the investigated period.
Energies 17 03775 g011
Figure 12. Examples of BSs’ energy consumption throughout the day.
Energies 17 03775 g012
Figure 13. Maximum power consumption of the BSs participating in the experiments.
Energies 17 03775 g013
Figure 14. Number of selected BSs in Experiments I and II.
Energies 17 03775 g014
Figure 15. Georeferenced map of Experiment I, day one. A cluster of BSs is formed in order to participate in the FCR-N service.
Energies 17 03775 g015
Table 1. Technical requirements of FCR services in Sweden [11,12,13].
FCR-NFCR-D (up)FCR-D (down)
Minimum
bid size
0.1 MW0.1 MW0.1 MW
Activation
frequency
deviations from
50.00 Hz
≤49.90 Hz≥51.10 Hz
Maximum
activation
≤49.90 Hz (up)
≥50.10 Hz (down)
≤49.50 Hz≥50.50 Hz
Activation
Type
AutomaticAutomaticAutomatic
Activation63%: 60 s50%: 5 s50%: 5 s
start-up time100%: 3 min100%: 30 s100%: 30 s
Volume
in Sweden
∼200 MW∼536 MW∼530 MW
SymmetricYesNoNo
Capacity
(availability)
payment
yes
(pay-as-bid)
EnergyYes (up-downNoNo
compensationregulating price)
GeneralApproved prequalification; Real-time measurement
requirementsElectronic communication; Endurance
Table 2. FCR Clearing prices (mean and standard deviation) for the Swedish market. Data available in [14].
YearFCR-N
(EUR/MWh)
FCR-D Up
(EUR/MWh)
FCR-D Down
(EUR/MWh)
201723.50 ± 14.297.42 ± 4.92-
201838.51 ± 28.4918.30 ± 18.84-
201930.93 ± 16.9422.38 ± 15.95-
202017.04 ± 8.1616.27 ± 7.42-
202137.62 ± 20.8344.88 ± 17.17-
202258.76 ± 40.1957.48 ± 39.3923.79 ± 23.75
Table 3. Experiment I (FCR-N).
ExperimentFCR
Service
Bid
Value
Selected
Hour and
Bid Price
(USD/MW)
Requested
Energy
(Total)
Provided
Energy
(Total)
Missing
Energy
(%)
Capacity
(Availability)
Payment
Profit
Energy
Payment
Profit
Battery
Degrad.
Cost
Cluster
Power
Capacity
(Up/Down)
Cluster
Energy
Capacity
(Up/Down)
Day one
Winter
(10/01/22)
FCR-N0.1 MW4 p.m.
USD 53.69
31.93 kWh31.93 kWh∼0%USD 5.36USD 1.71USD 0.140.1 MW/
0.20 MW
56.07 kWh/
56.07 kWh
Day two
Spring
(10/04/22)
FCR-N0.1 MW6 a.m.
USD 32.05
44.39 kWh44.39 kWh∼0%USD 3.20USD 1.42USD 0.190.1 MW/
0.23 MW
78.17 kWh/
78.17 kWh
Day three
Summer
(10/07/22)
FCR-N0.1 MW0 a.m.
USD 86.68
22.78 kWh22.78 kWh∼0%USD 8.66USD 1.97USD 0.10.1 MW/
0.21 MW
65.79 kWh/
65.79 kWh
Table 4. Experiment II (FCR-D).
ExperimentFCR
Service
Bid
Value
Selected
Hour and
Bid Price
(USD /MW)
Requested
Energy
(Total)
Provided
Energy
(Total)
Missing
Energy
(%)
Capacity
(Availability)
Payment
Profit
Energy
Payment
Profit
Battery
Degrad.
Cost
Cluster
Power
Capacity
(Up/Down)
Cluster
Energy
Capacity
(Up/Down)
Day one
Fall
(08/10/21)
FCR-D 10.1 MW11 p.m.
USD 58.82
0 kWh0 kWh0%USD 5.88-USD 00.1 MW/
0.19 MW
124.59 kWh/
0 kWh
Day two
Winter
(25/01/22)
FCR-D 20.1 MW5 a.m.
USD 10.38
0 kWh0 kWh0%USD 1.03-USD 00.04 MW/
0.1 MW
0 kWh/
77.19 kWh
1 FCR-D up-regulation product; 2 FCR-D down-regulation product.
Disclaimer/Publisher’s Note: The statements, opinions and data contained in all publications are solely those of the individual author(s) and contributor(s) and not of MDPI and/or the editor(s). MDPI and/or the editor(s) disclaim responsibility for any injury to people or property resulting from any ideas, methods, instructions or products referred to in the content.

