
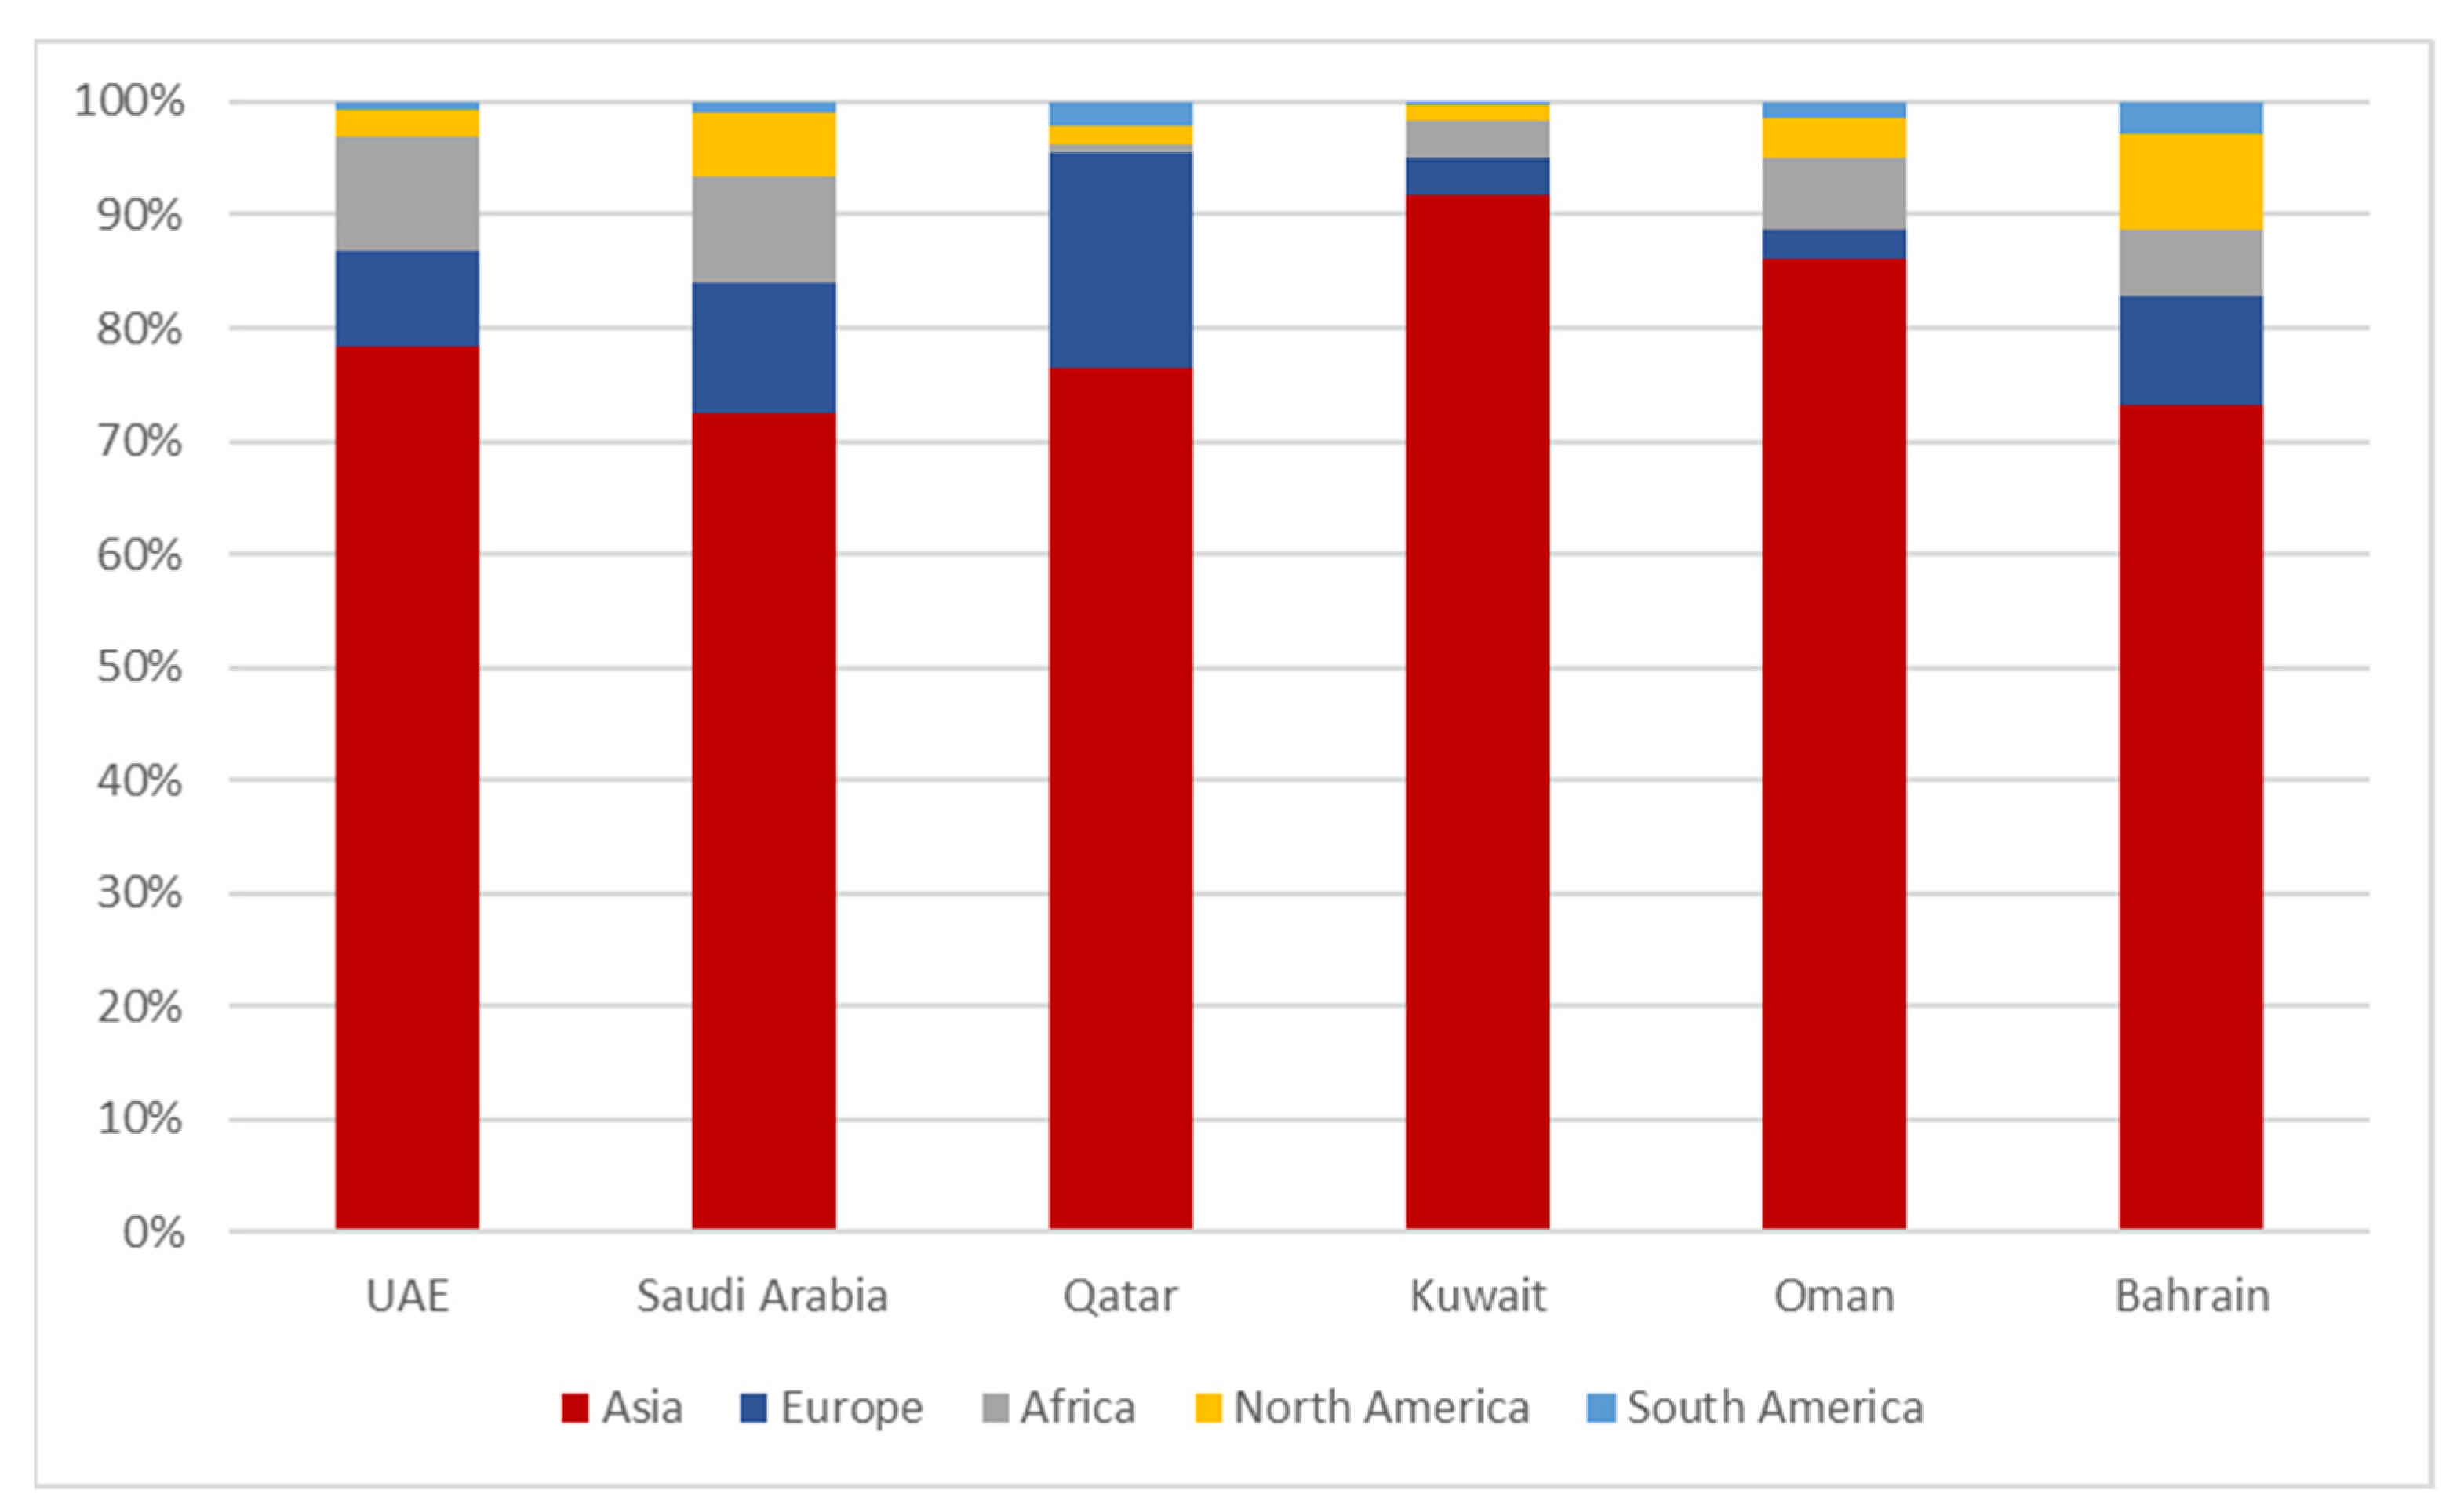
A Pan-Asian Energy Transition? The New Rationale for Decarbonization Policies in the World’s Largest Energy Exporting Countries: A Case Study of Qatar and Other GCC Countries

Abstract
:1. Introduction
2. Theoretical Framework and Methodology
2.1. Theoretical Framework
2.2. Methodology
3. Literature Review: Global Energy Transition and Recent Decarbonization Policies
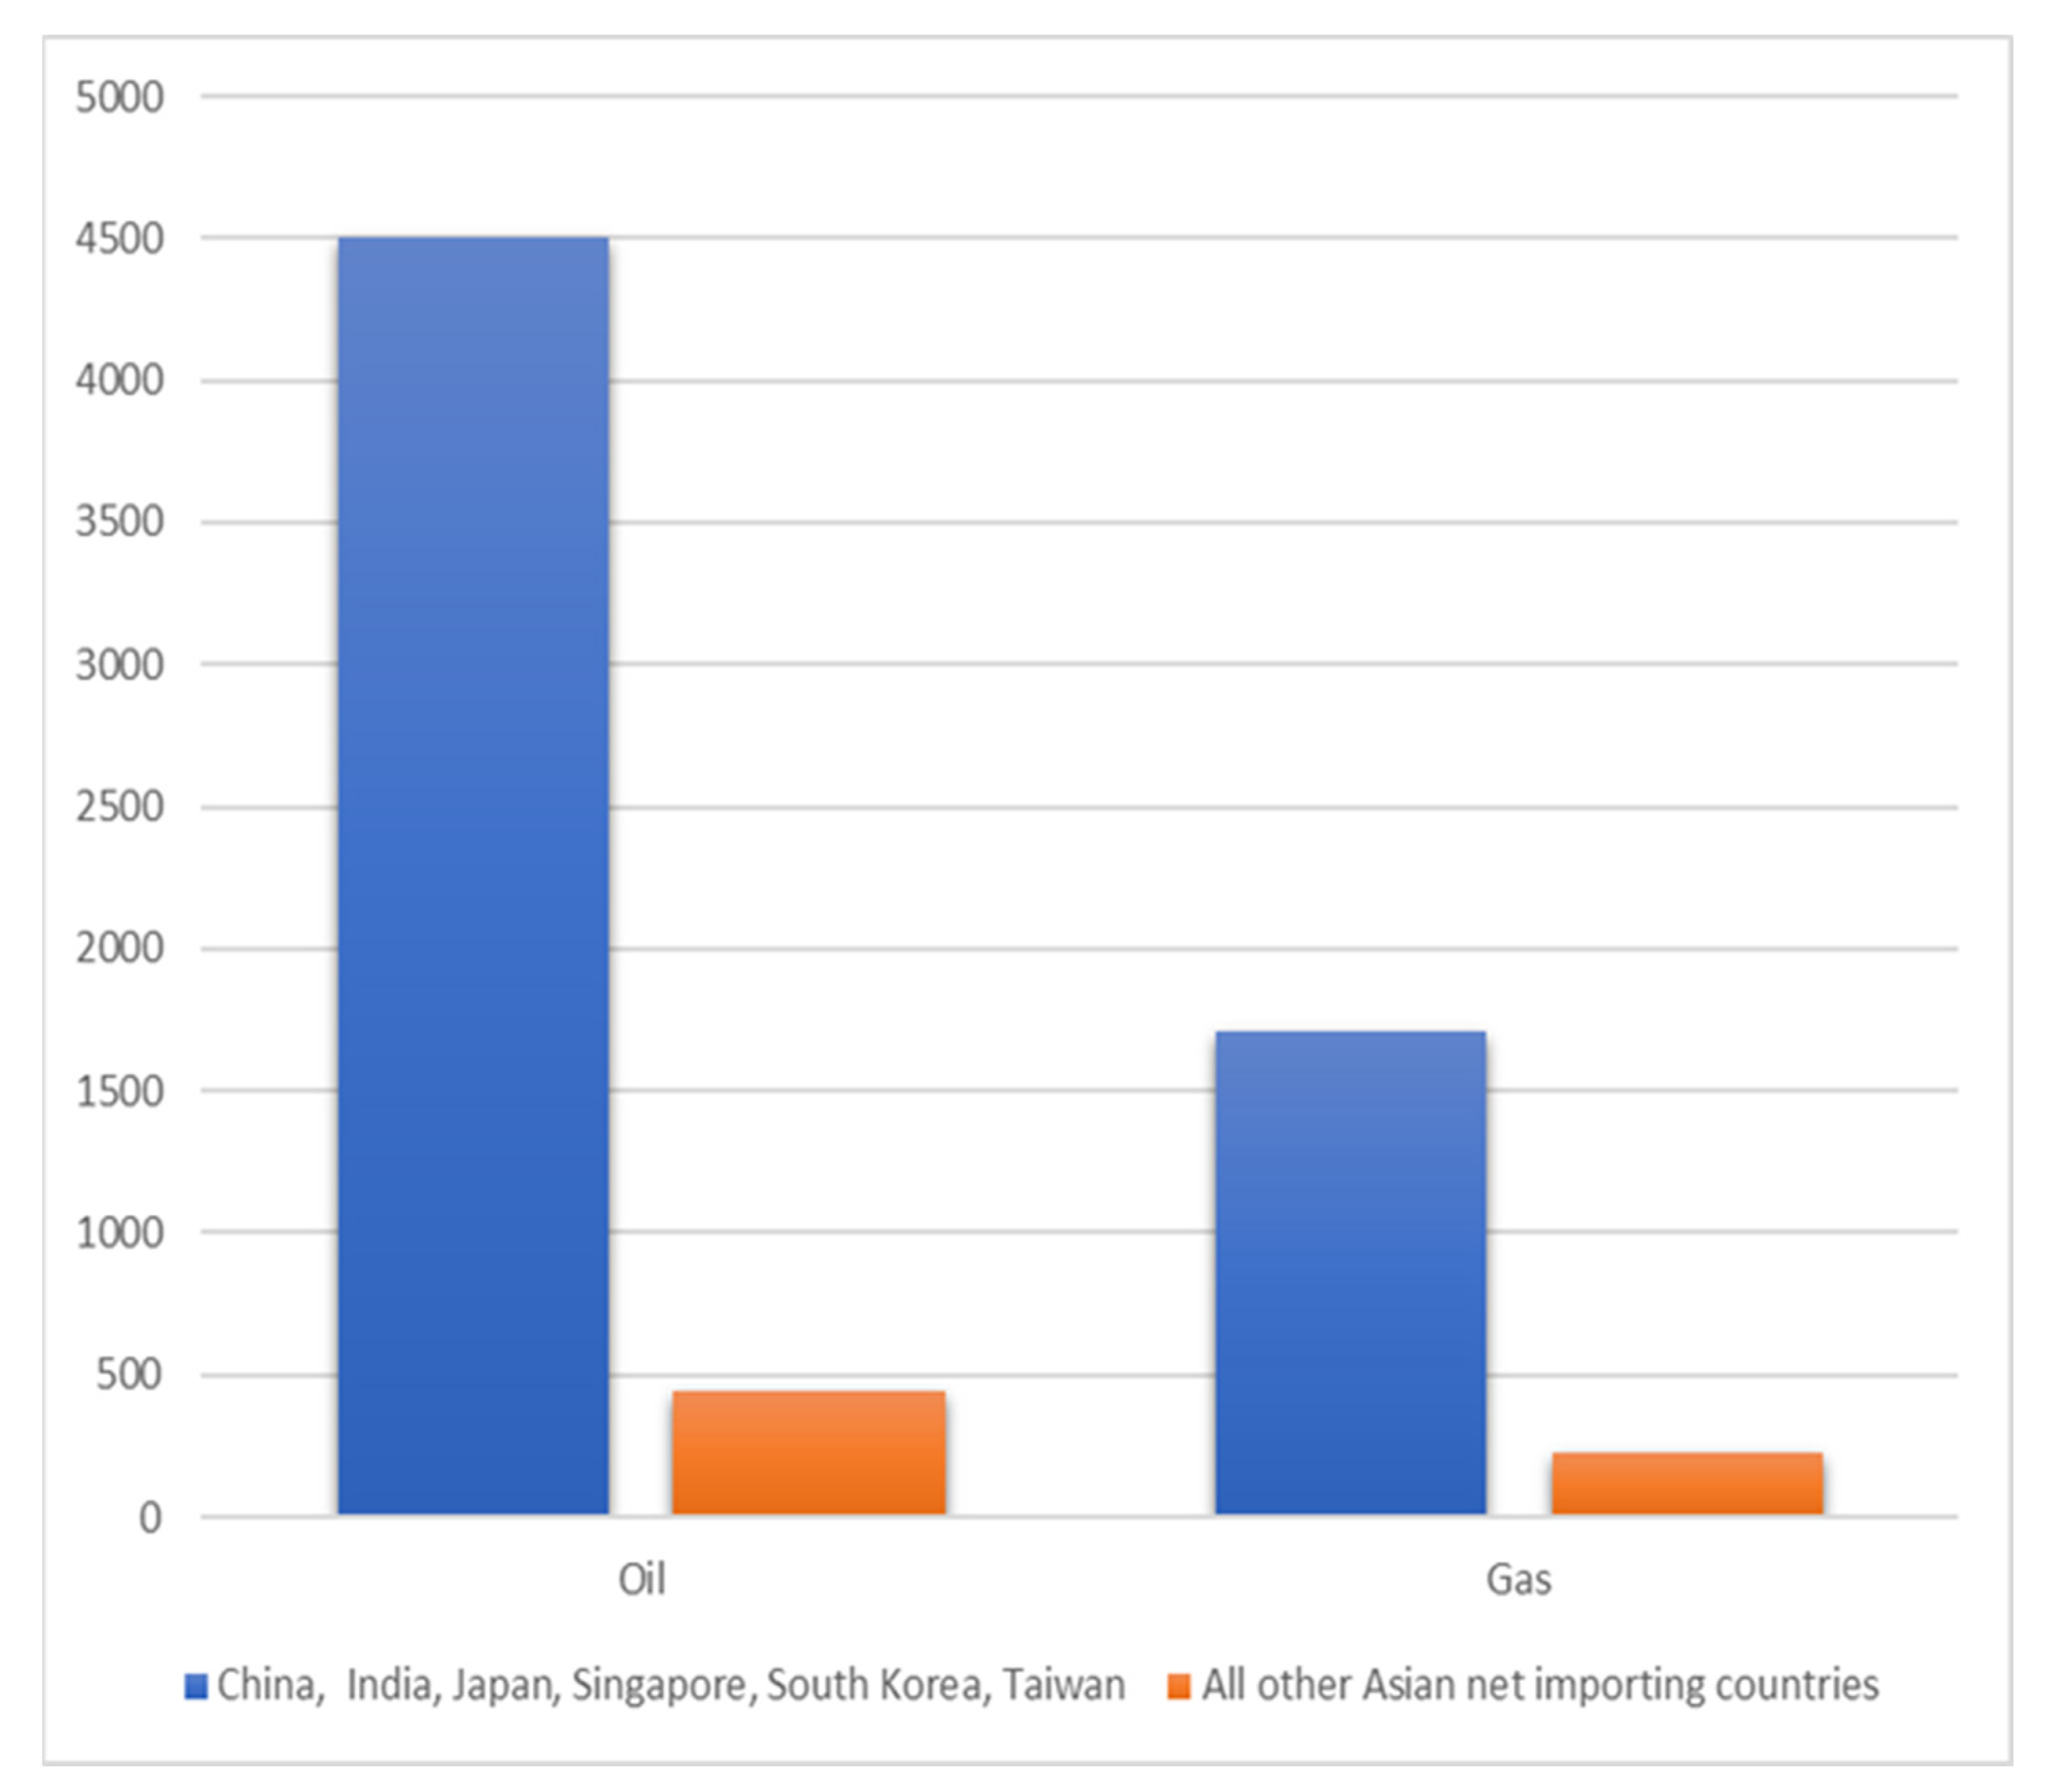
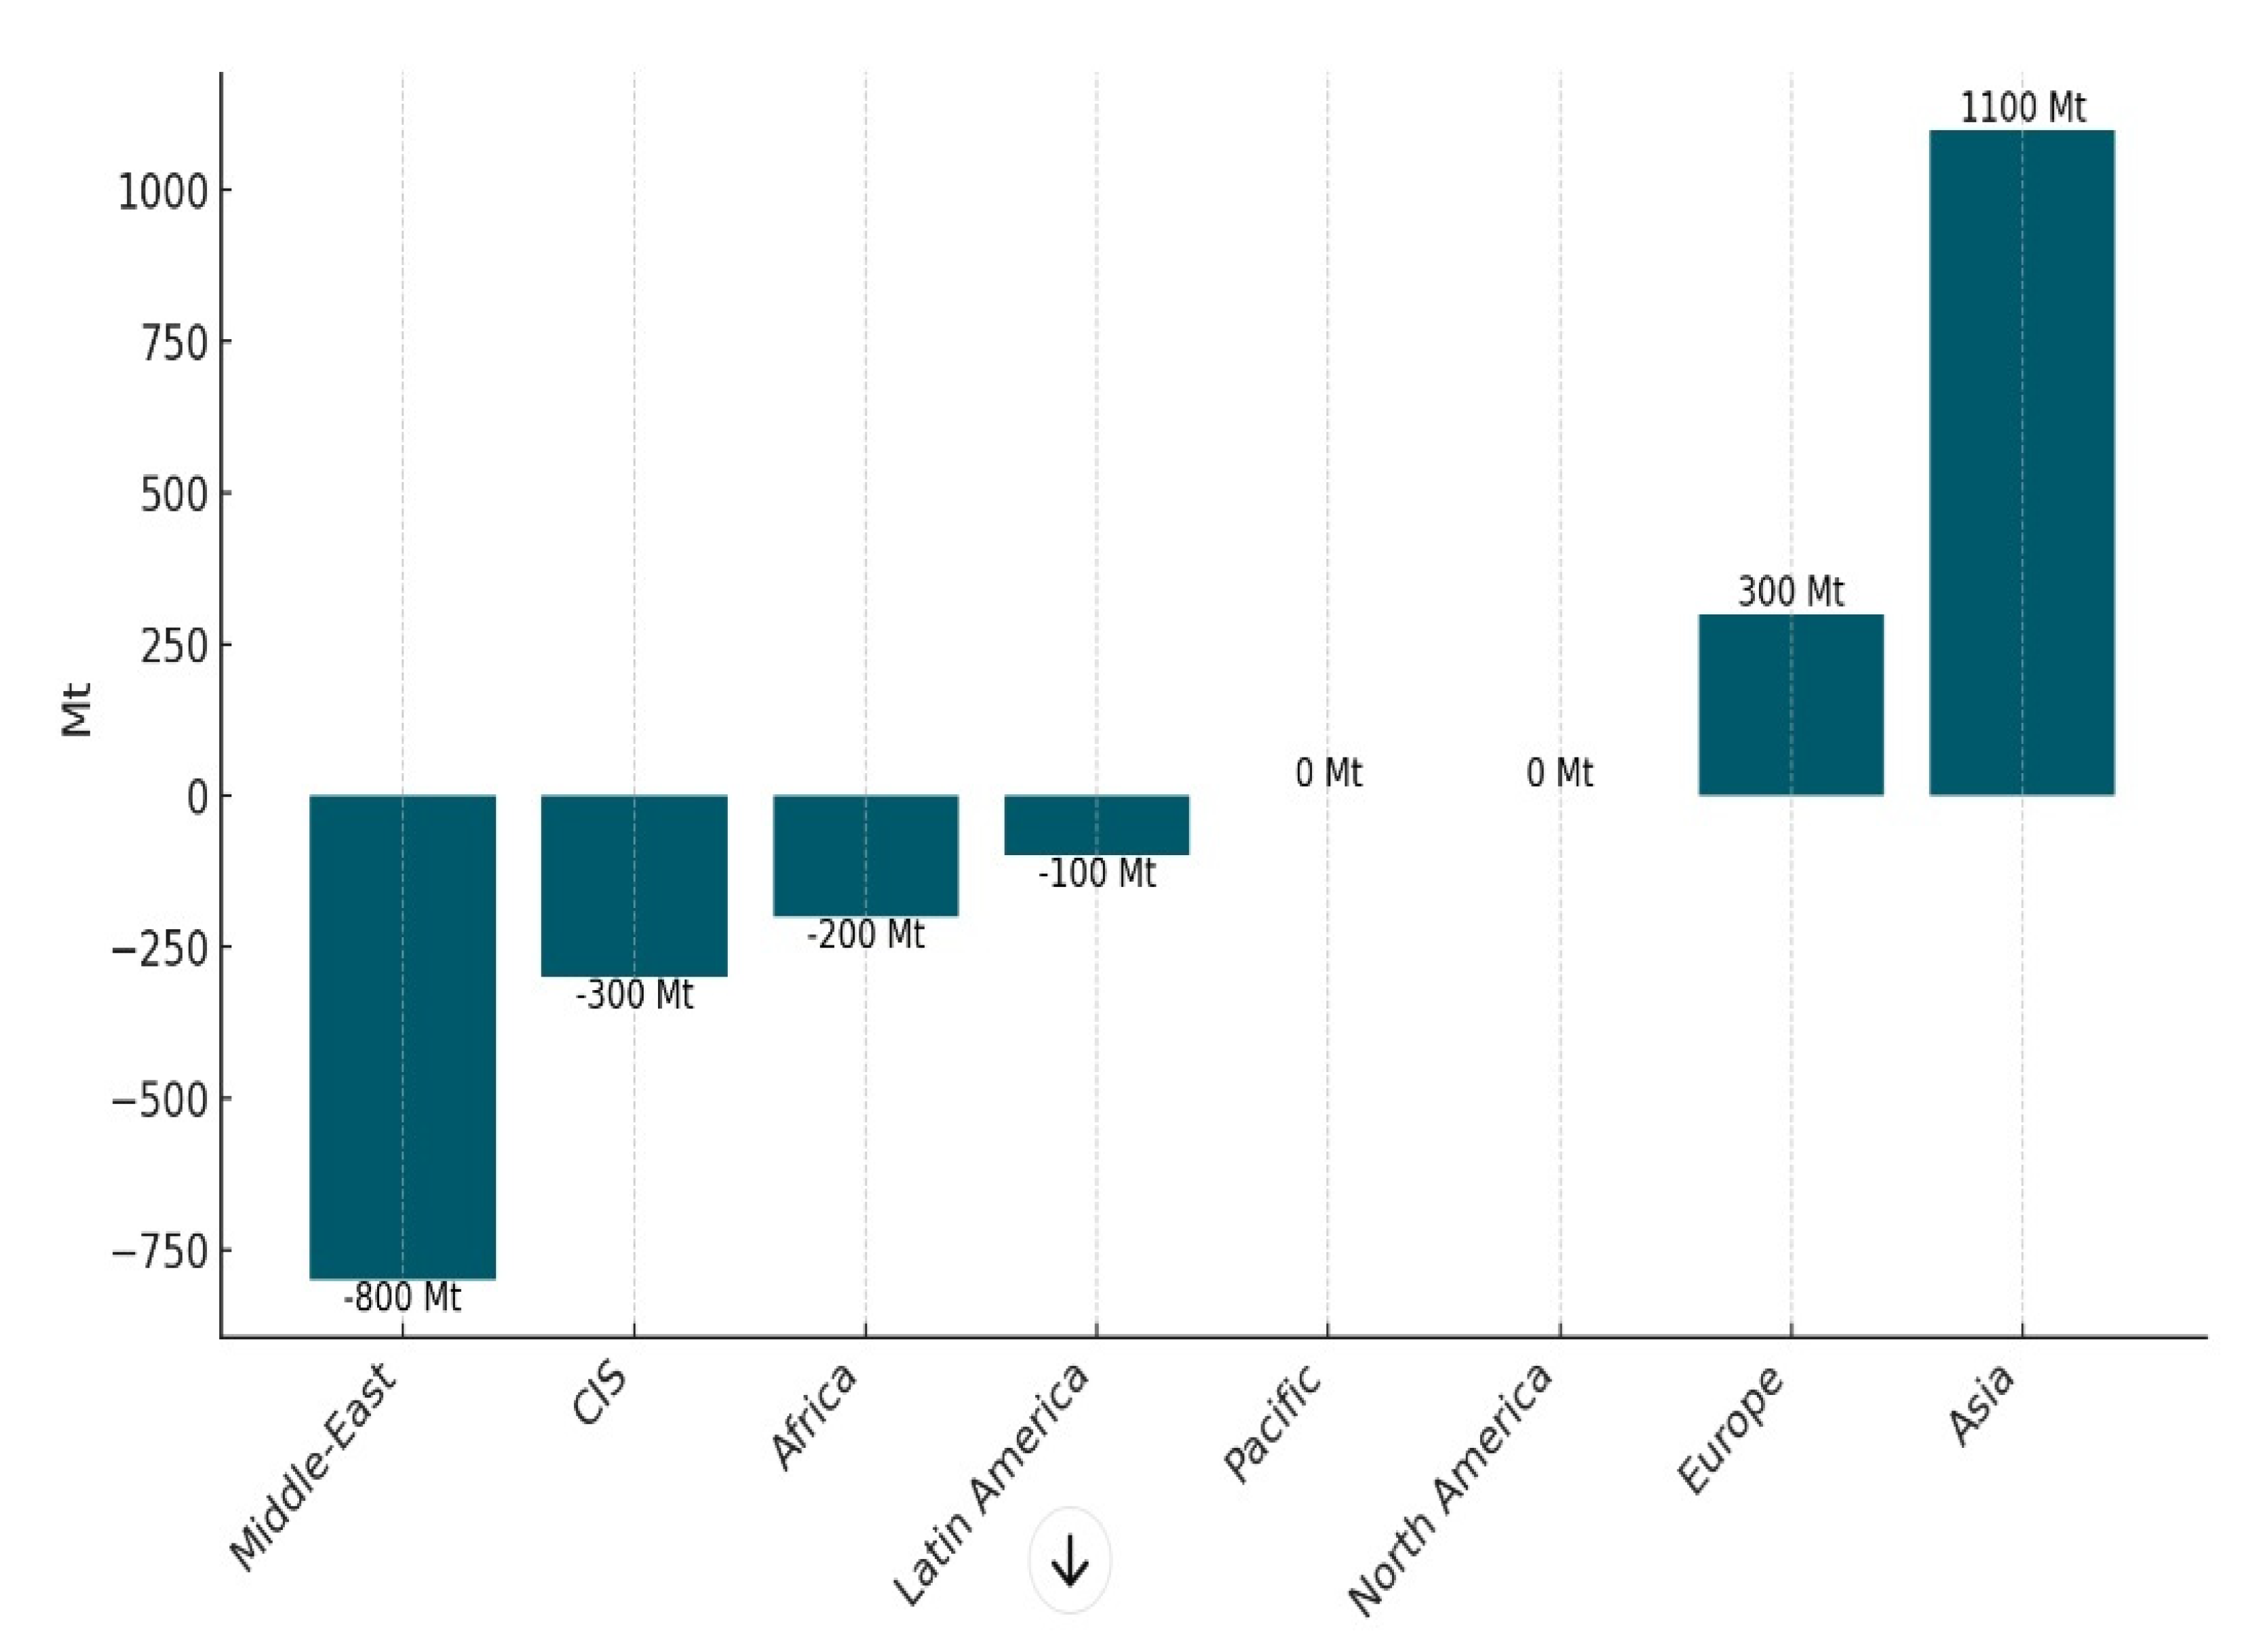
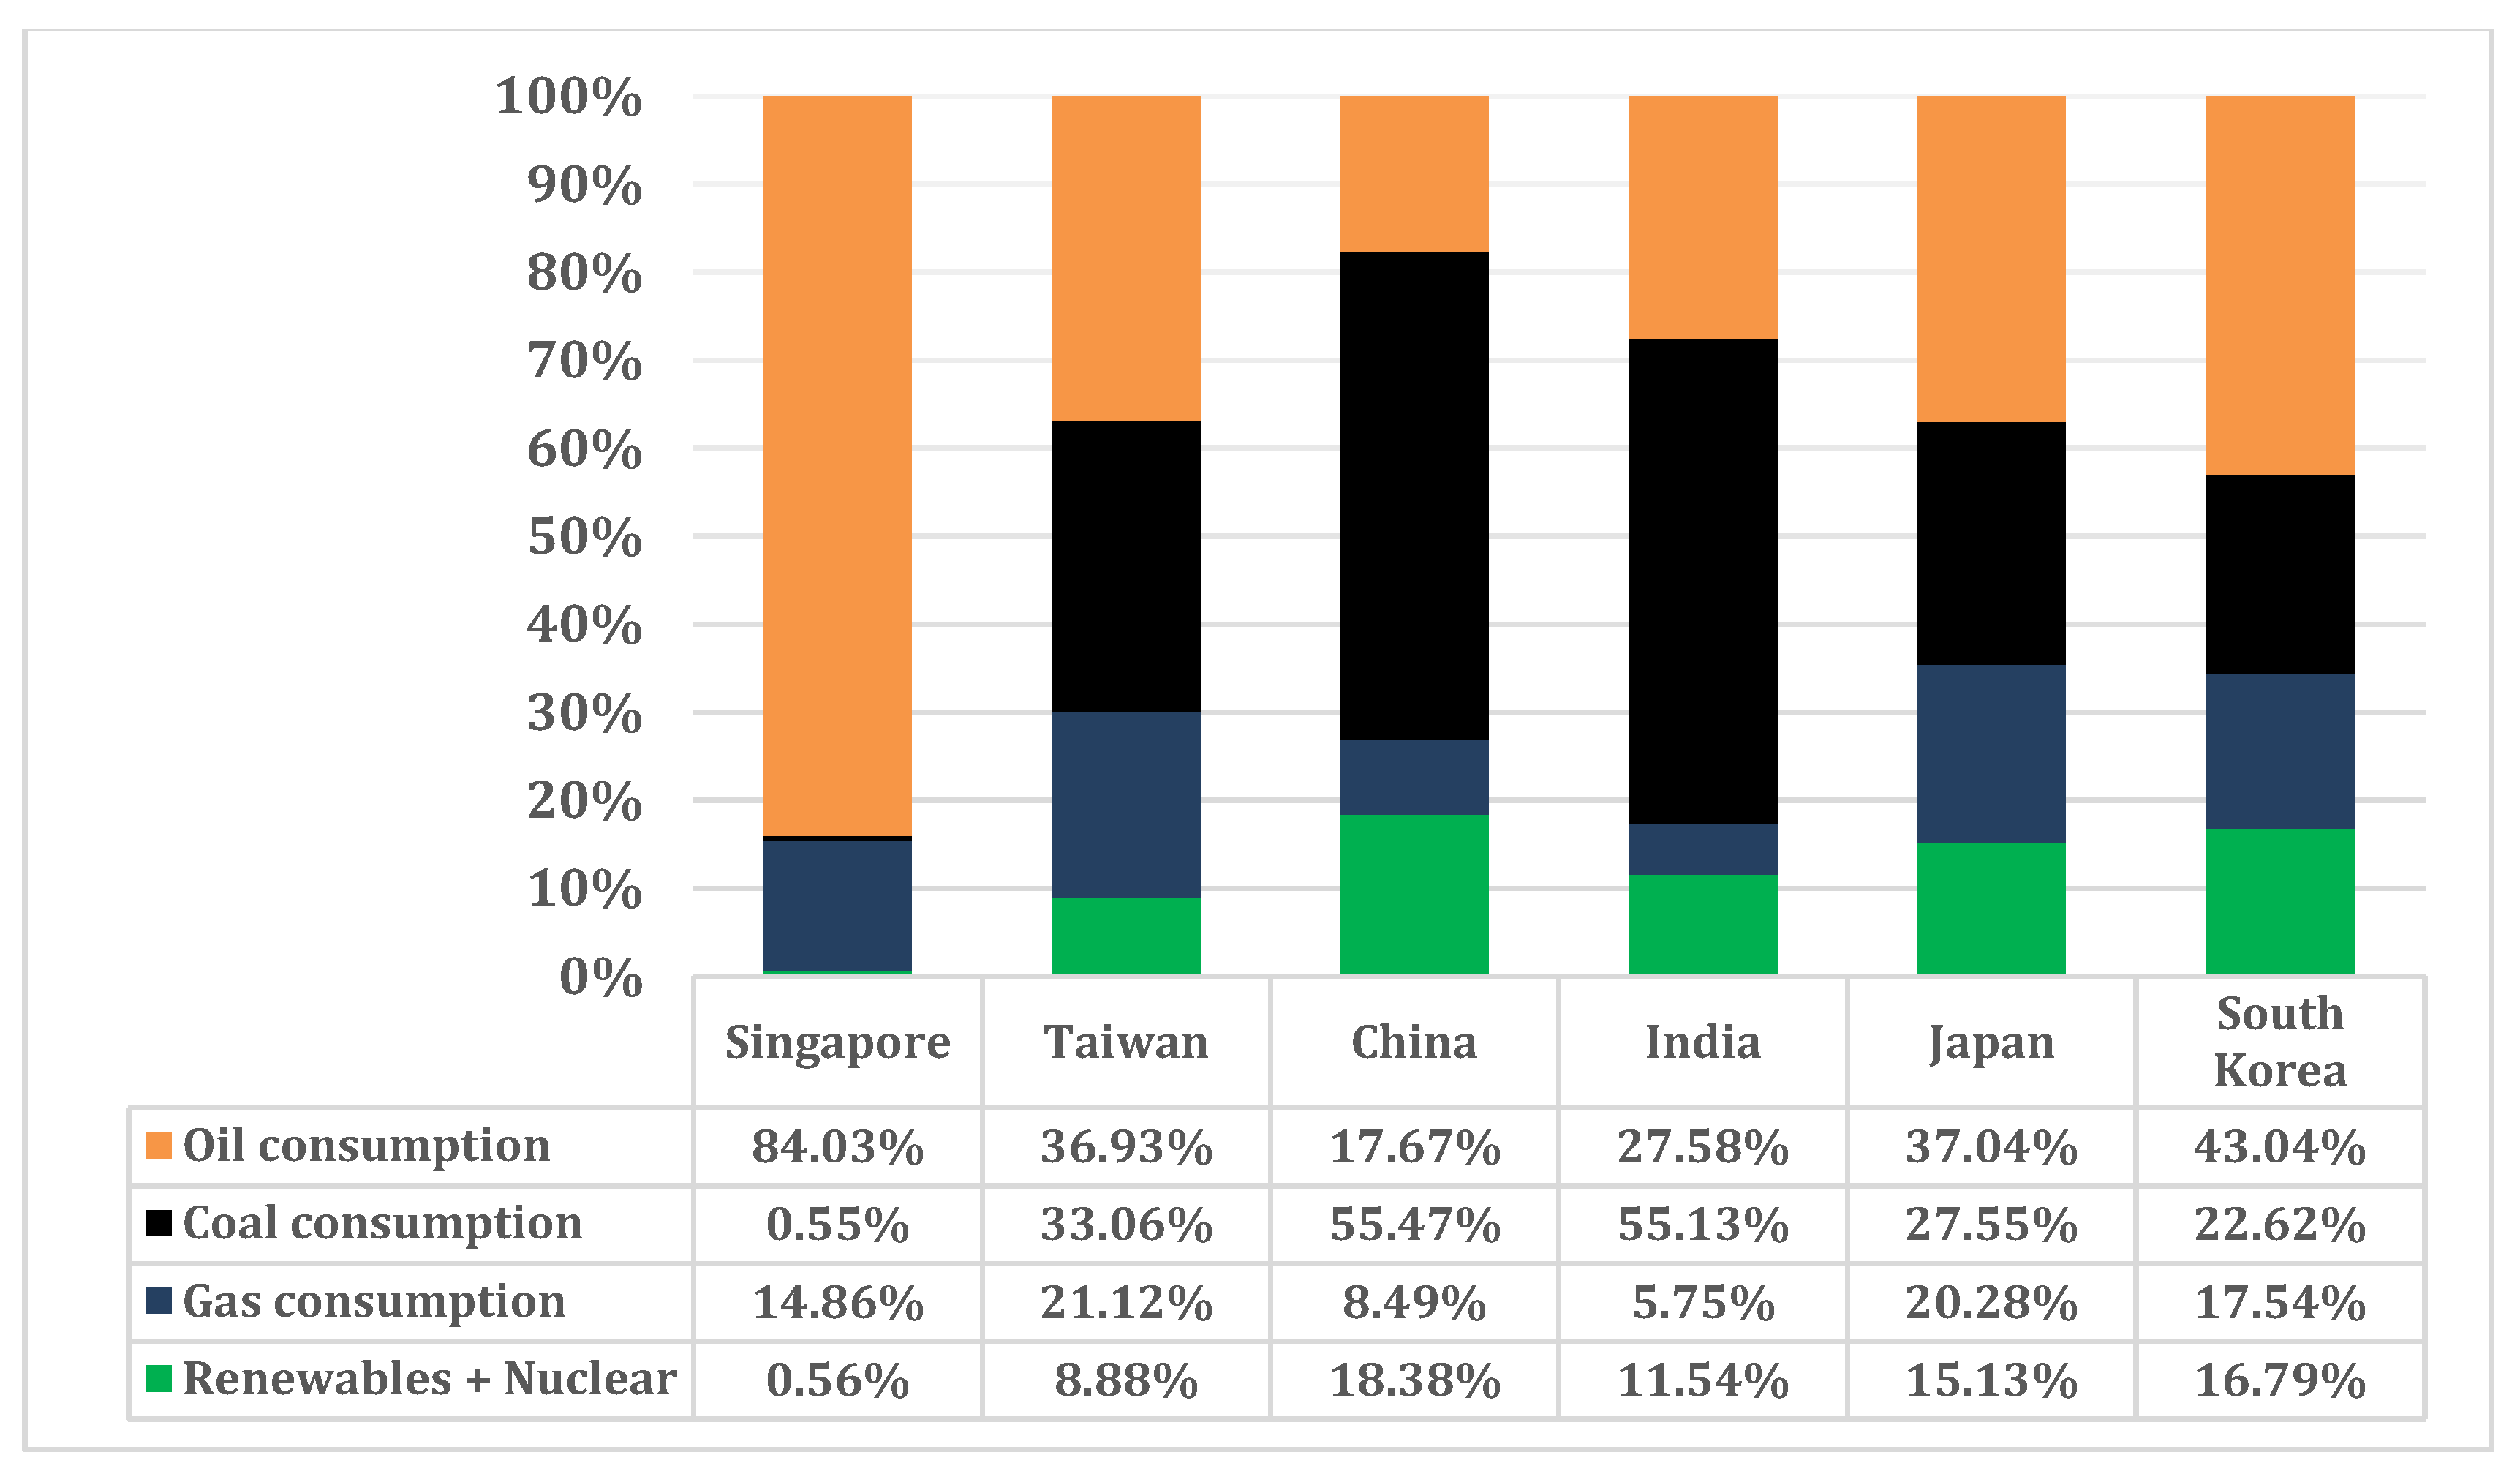
3.1. Energy Transitions around the World
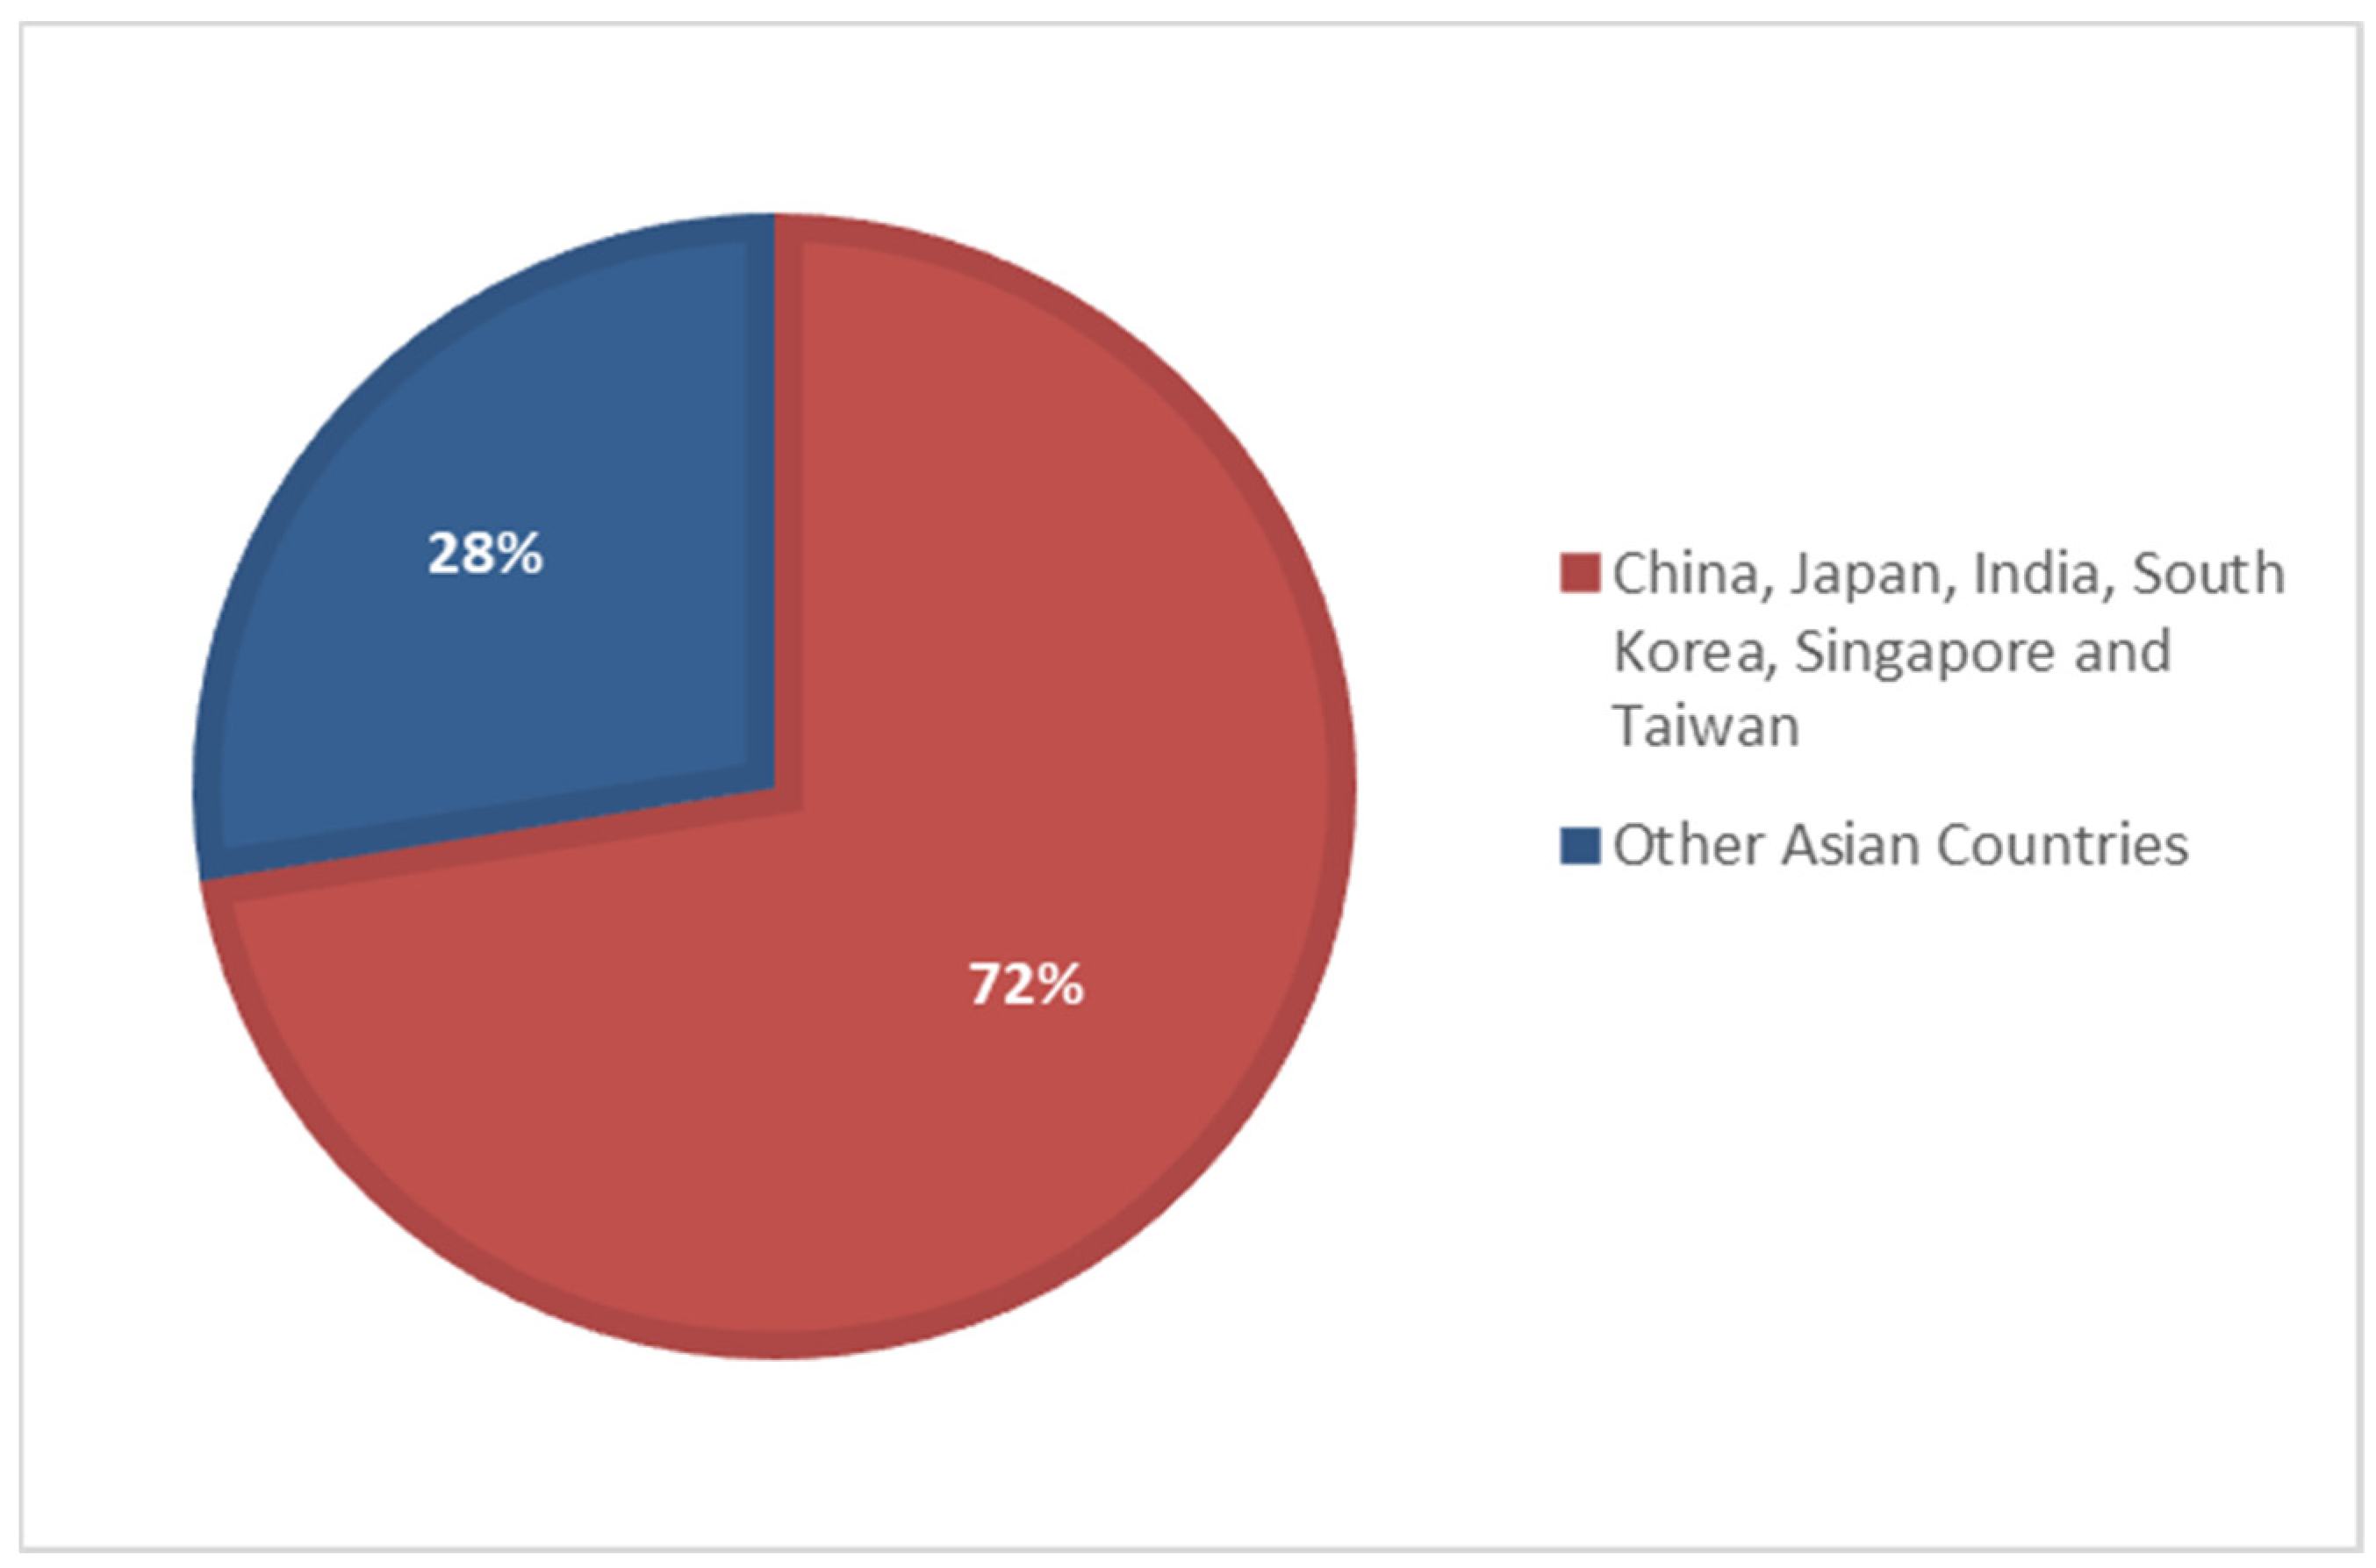
3.2. A Review of Decarbonization Policies across Major Asian Energy Importing Countries

| Country | Net Zero Target | Emission Reduction Target for 2030 | Renewables Targets (2030) | Nuclear Energy Targets (2030) |
|---|---|---|---|---|
| China [20] | 2060 | Peak CO2 emissions before 2030 | Increase its installed capacity of wind and solar power to 1.2 billion kilowatts by 2030 | 120–150 GW by 2030 |
| Chinese Taipei/Taiwan [25] | 2050 | GHG reduction by 50% from the business-as-usual level | Target of 17,250 MW in 2030 | The non-nuclear homeland policy |
| India [21] | 2070 | GHG reduction by 45 percent from 2005 level | 450 GW of renewable energy capacity by 2030 | Total nuclear capacity is likely to be around 22.5 GWe by 2031. |
| Japan (Ministry of Economy, Trade and Industry. (2018). (Basic energy plan (6th ed.). Retrieved from https://www.enecho.meti.go.jp/en/category/others/basic_plan/pdf/6th_outline.pdf) [27] Ministry of Economy, Trade and Industry. (2022). Clean Energy Strategy Interim Report (Outline). Retrieved from https://www.meti.go.jp/english/policy/energy_environment/global_warming/pdf/clean_energy_strategy.pdf) | 2050 | GHG reduction by 46% compared to the 2013 level | Renewable energy set to account for 36–38% of the energy mix by 2030 | 20–22% of the energy mix |
| [28] South Korea (the Ministry of Trade, Industry and Energy. (2017). 8th Basic Plan for Long-term Electricity Supply and Demand (2017–2031). Retrieved from https://policy.asiapacificenergy.org/sites/default/files/8th%20Basic%20Plan%20for%20Long-term%20Electricity%20Supply%20and%20Demand%20%282017%20-%202031%29.pdf) | 2050 | GHG reduction by 40% compared to the 2018 level | Producing 20% of electricity from renewables by 2030 | 23.4% by 2029 share of nuclear energy in the energy mix |
| Singapore [31] | 2050 | GHG reduction by 36% compared to the 2005 level (reaching 60 MtCO2) | The renewable in this case is mainly solar energy: reaching. 2 gigawatt-peak by 2030 | No information is available about the possible energy mix scenarios including nuclear power by 2030. However, by 2050 the Energy Market Authority of Singapore announced nuclear energy will make up about 10% of its energy mix. |
3.3. Toward an Energy Transition in the GCC Countries: The Case of Qatar
4. A Case Study of Qatar and Other GCC Countries: Gulf States and Qatar’s Policies for Decarbonized Exports
4.1. Decarbonization via Energy Export Sophistication: Qatar’s Decarbonization Policies and Changes
4.2. Green Hydrogen Investment in the GCC and the Potential for Partnerships

4.3. Ongoing Hydrogen Developments in the GCC
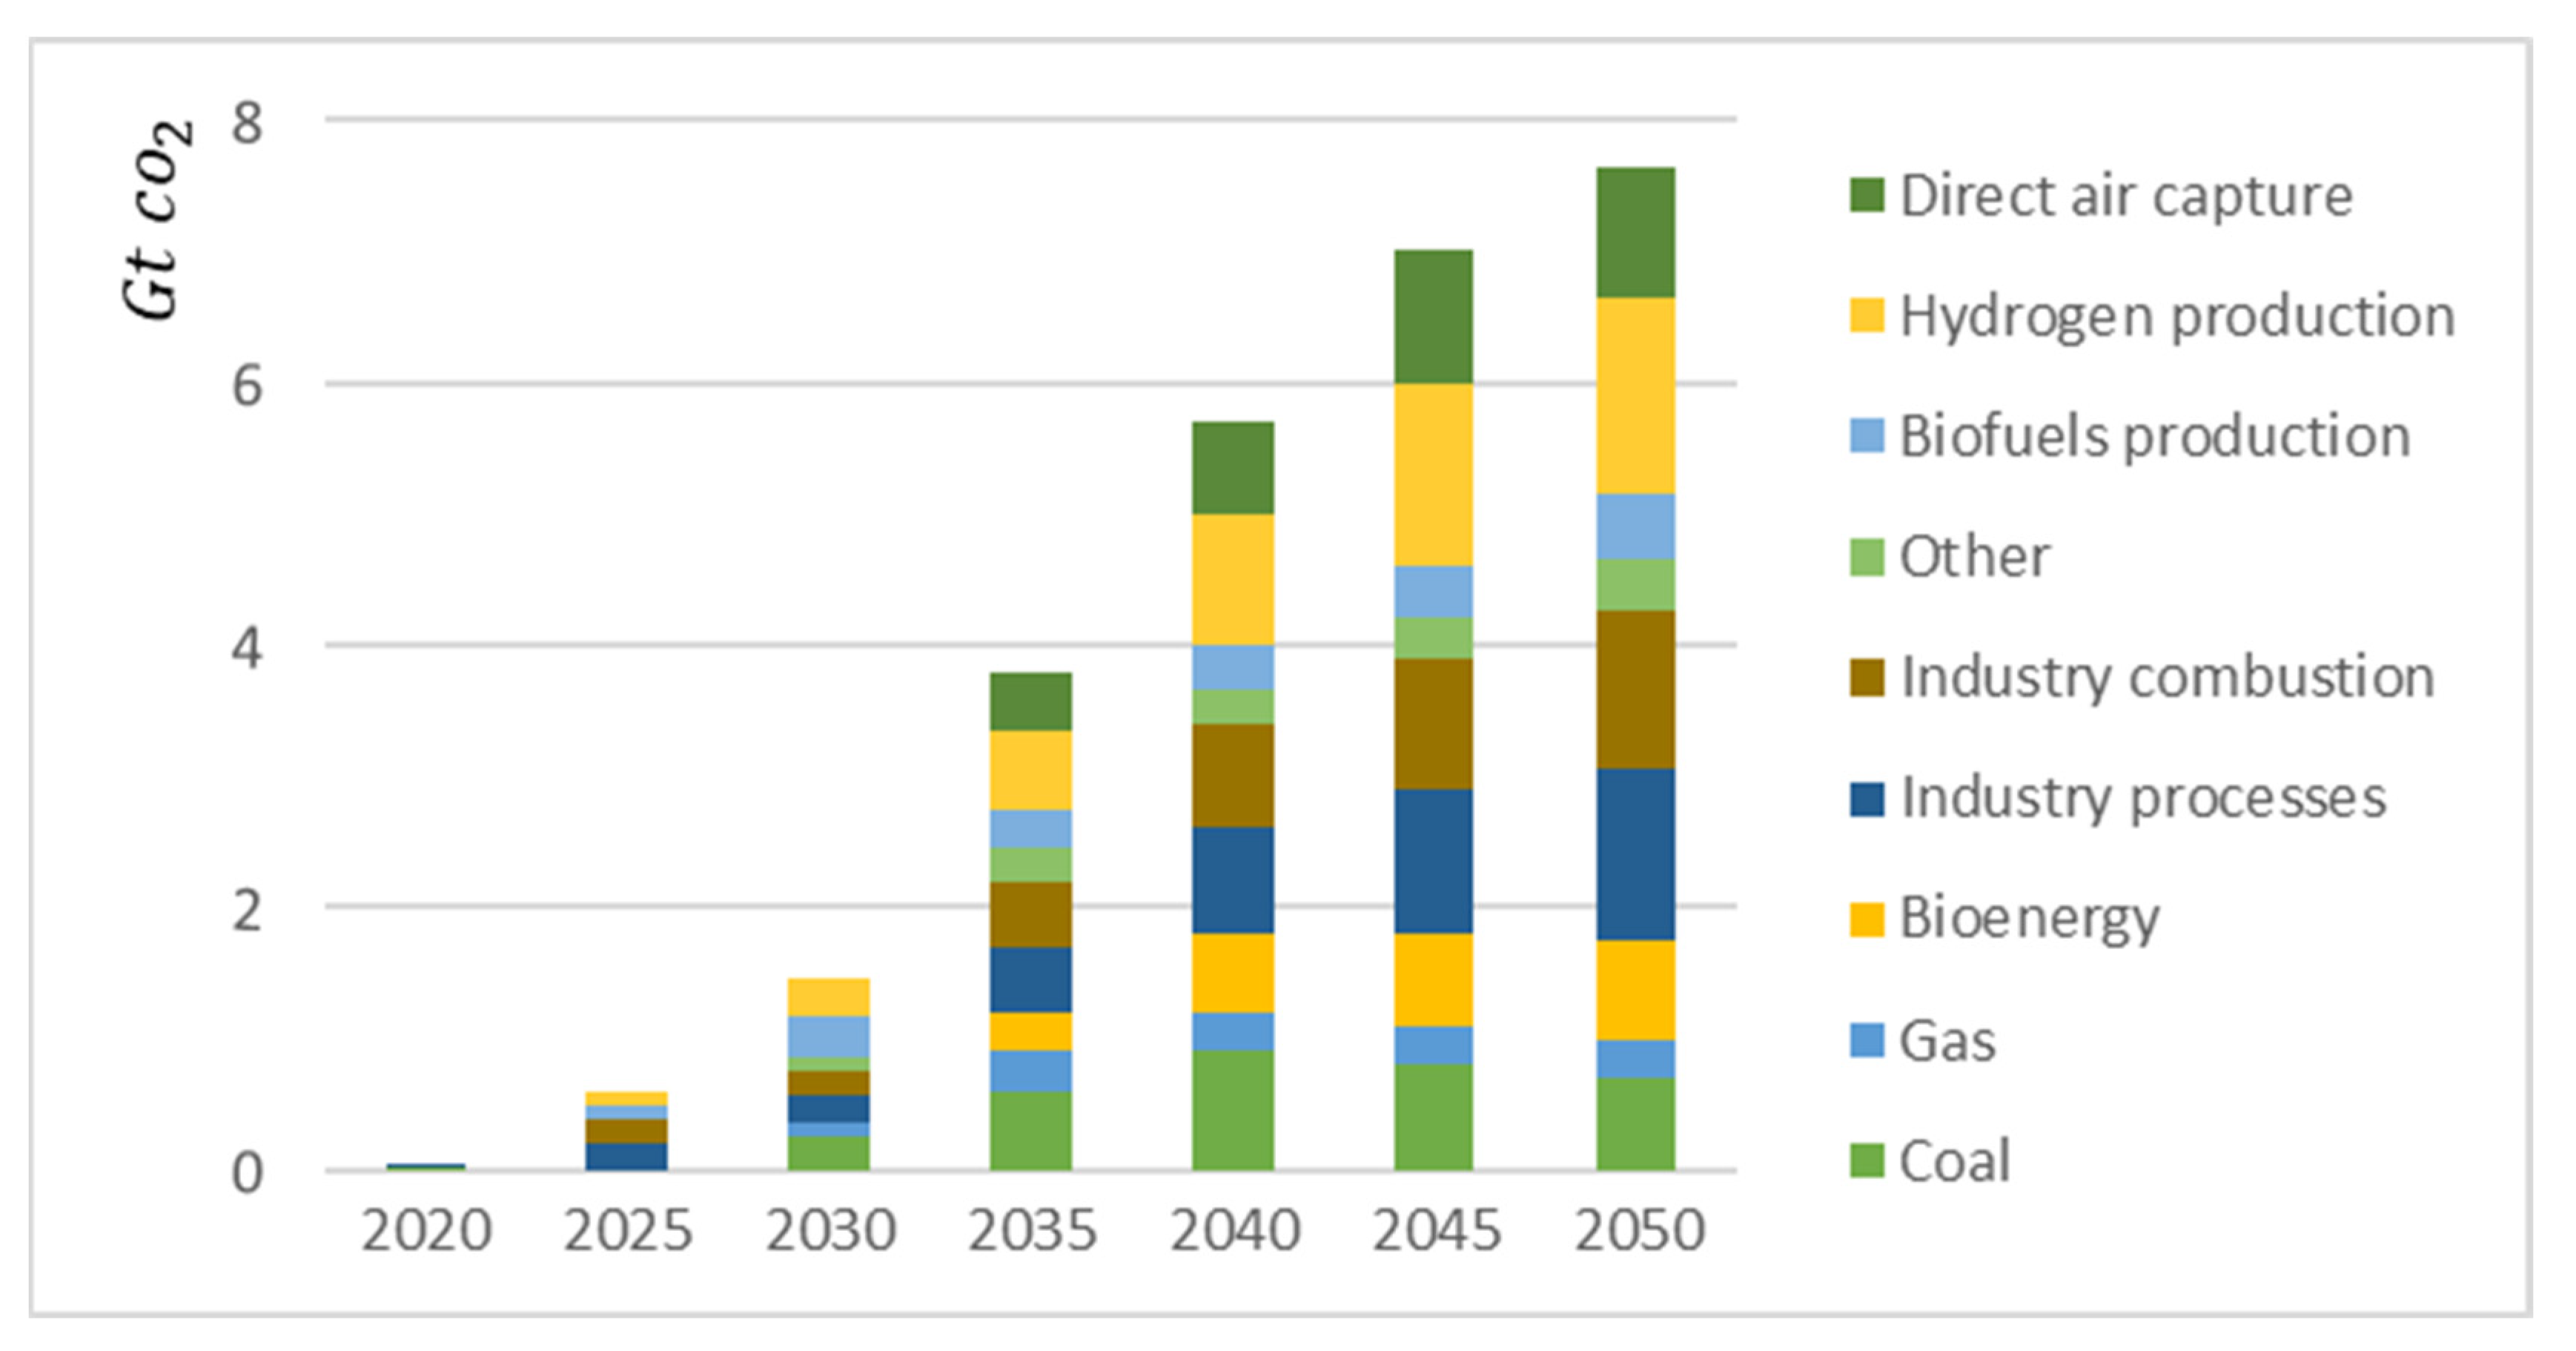
4.4. The Role and Potential of CCS/CCUS in the Decarbonization of the Energy Industry
4.5. CCS/CCUS in the GCC Region
4.6. CCS/CCUS in the Case of Qatar
4.7. Qatar Blue Hydrogen
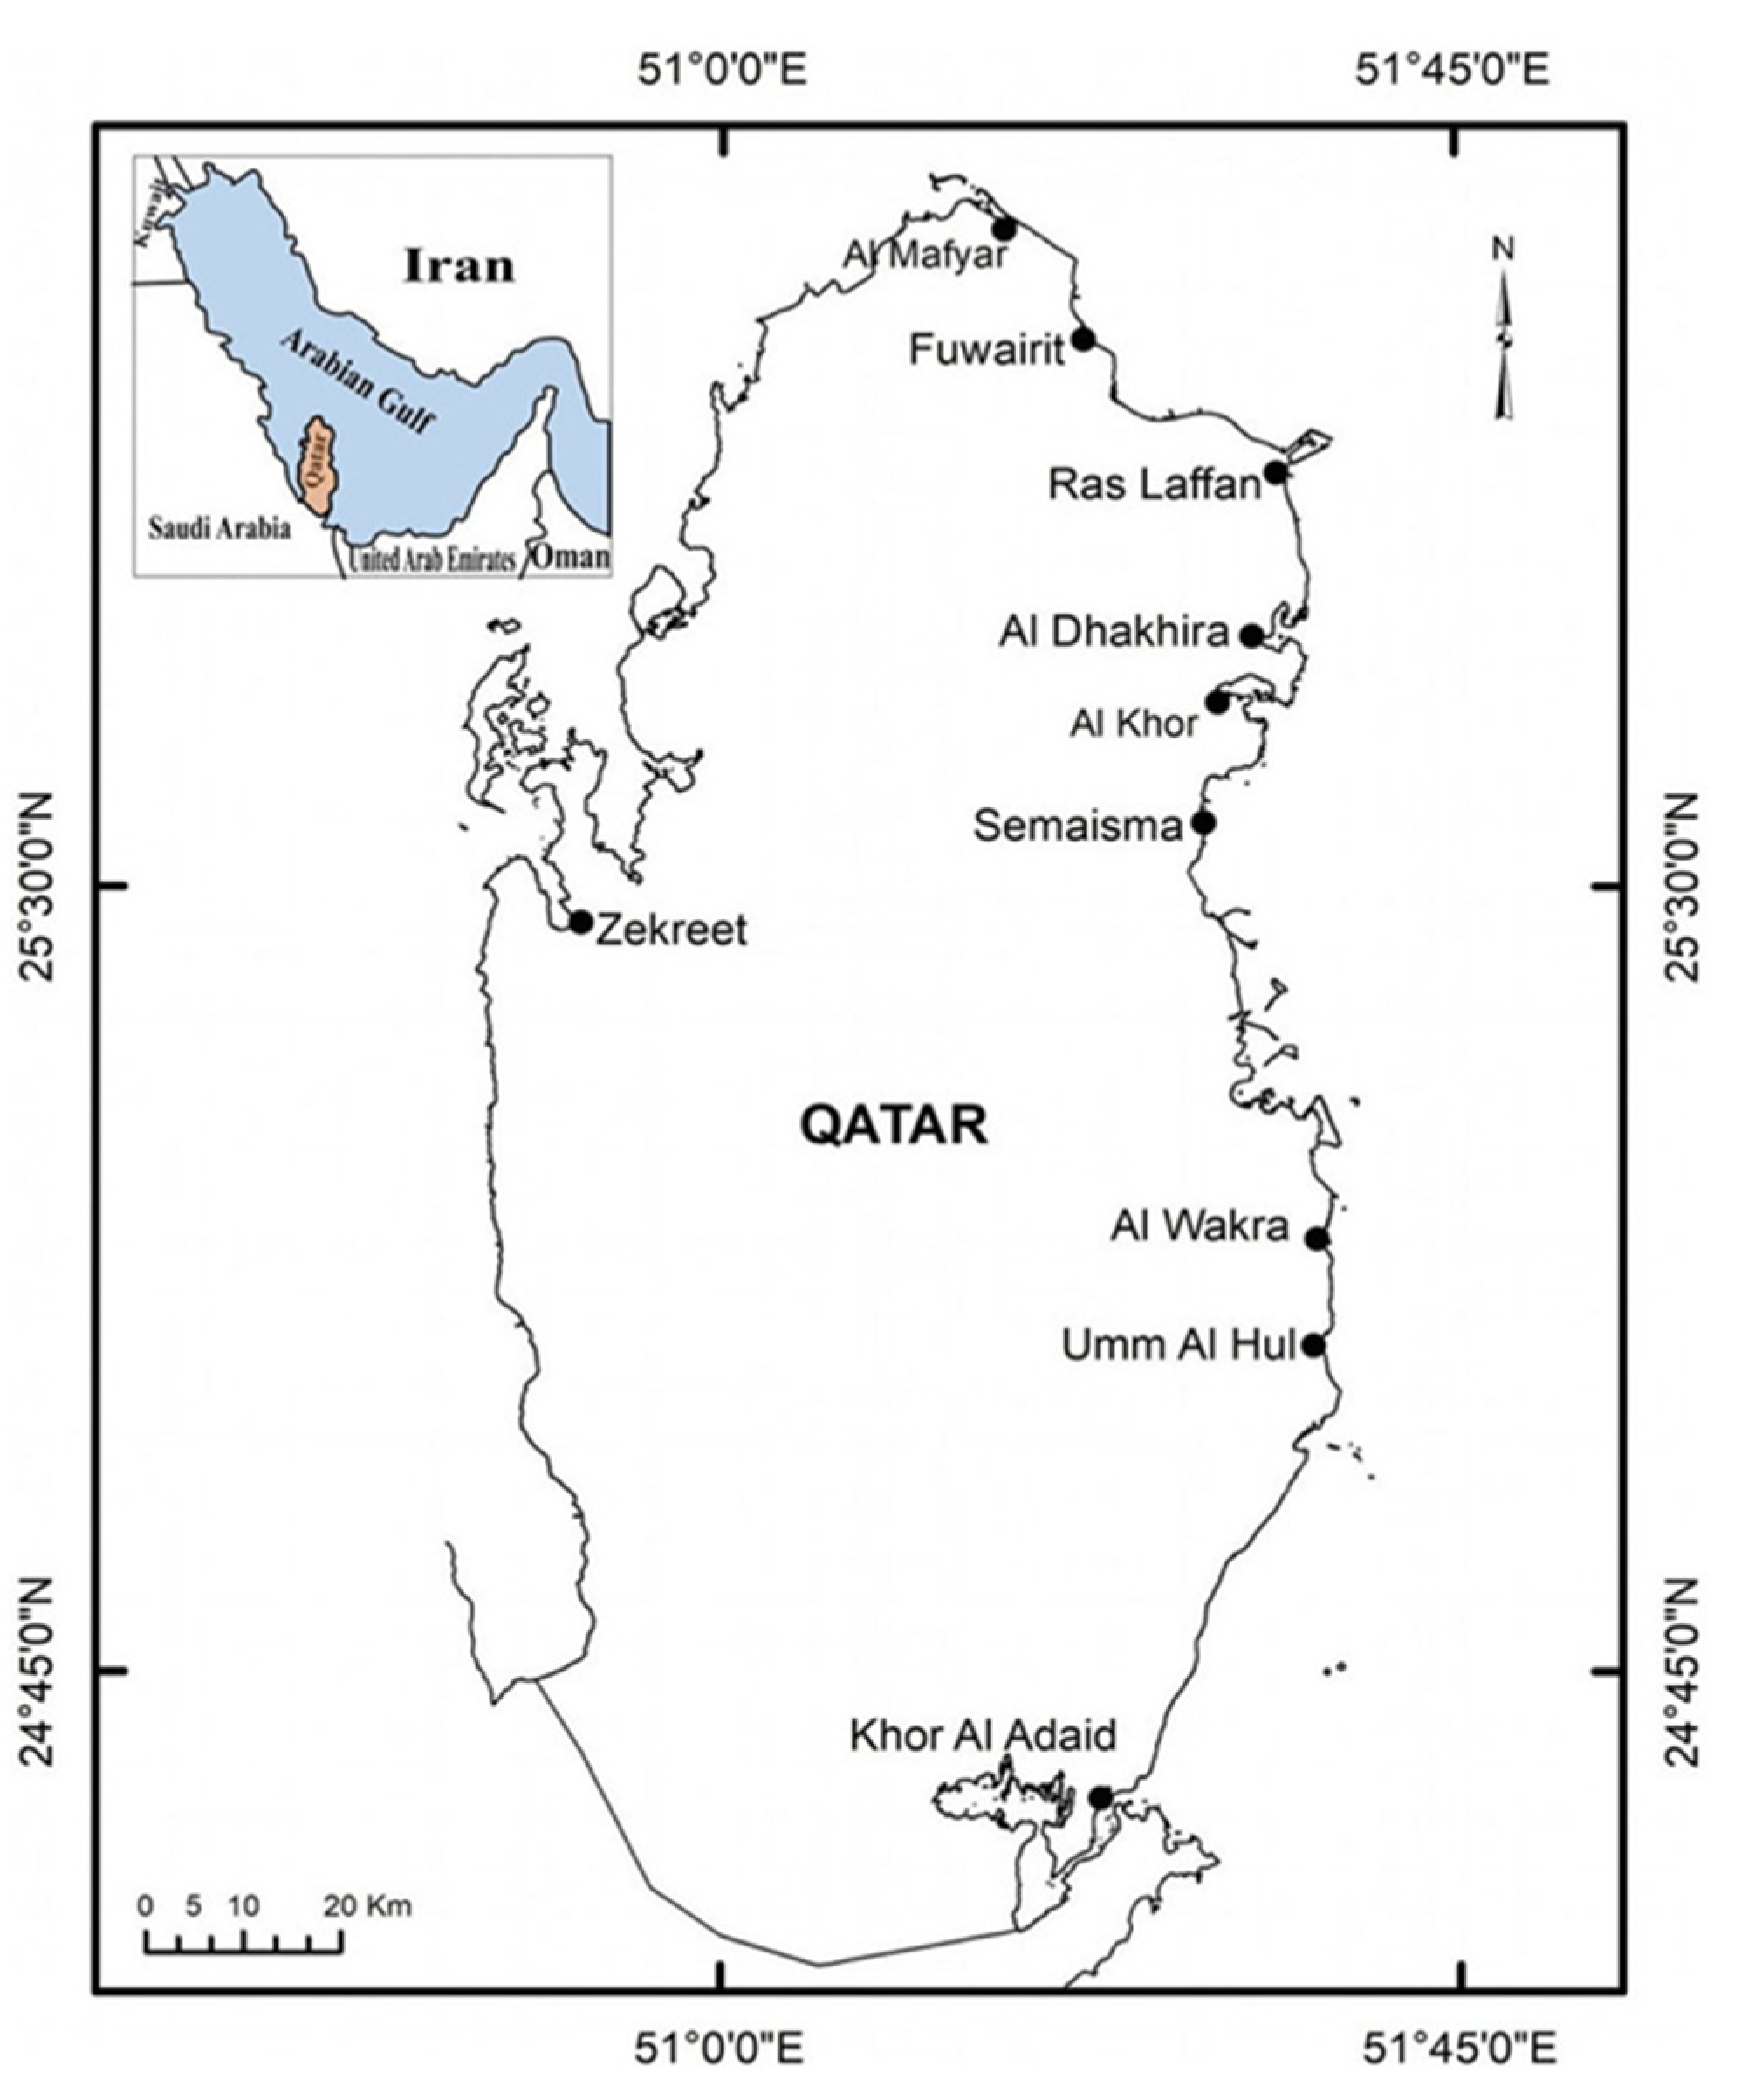
4.8. Decarbonization Potential of Natural Carbon Sinks in Hydrocarbons Exporting Countries: The Case of Mangrove Forestry in Qatar
5. Results and Conclusions
5.1. Emissions Accounting and Techno-Economic Analysis of GCC Countries
5.2. Emissions by Sectors in the GCC Region
5.3. Emissions Trajectories
5.4. Costs of the Reforms and Investment Costs by Country
5.5. The Economical Impact of the Reforms Due to the Reduction in Oil Exports
5.6. Conclusions
Author Contributions
Funding
Acknowledgments
Conflicts of Interest
References
- Lambert, L.A.; Tayah, J.; Lee-Schmid, C.; Abdalla, M.; Abdallah, I.; Ali, A.H.; Esmail, S.; Ahmed, W. The EU’s natural gas Cold War and diversification challenges. Energy Strat. Rev. 2022, 43, 100934. [Google Scholar] [CrossRef]
- O’Sullivan, M.L. Windfall: How the New Energy Abundance Upends Global Politics and Strengthens America’s Power; Simon & Schuster: New York, NY, USA, 2017. [Google Scholar]
- Robbins, P. Political Ecology: A Critical Introduction; Wiley-Blackwell: Hoboken, NJ, USA, 2012. [Google Scholar]
- Grossman, L.S.; Bryant, R.L.; Bailey, S. Third World Political Ecology; Routledge: London, UK, 1997. [Google Scholar]
- Zimmerer, K.S.; Bassett, T.J. Political ecology: An integrative approach to geography and environment—Development studies. Prof. Geogr. 2003, 55, 416–426. [Google Scholar]
- Peet, R.; Watts, M. (Eds.) Liberation Ecologies: Environment, Development, Social Movements; Routledge: London, UK, 1996. [Google Scholar]
- United Nations. UN Comtrade. Available online: https://comtradeplus.un.org/TradeFlow?Frequency=A&Flows=X&CommodityCodes=271111&Partners=392&Report-ers=all&period=2021&AggregateBy=none&BreakdownMode=plus (accessed on 25 April 2023).
- Crutzen, P.J. Geology of mankind. Nature 2016, 415, 23. [Google Scholar] [CrossRef] [PubMed]
- Intergovernmental Panel on Climate Change (IPCC). Climate Change 2023: The Physical Science Basis. Contribution of Working Group I to the Sixth Assessment Report of the Intergovernmental Panel on Climate Change; Cambridge University Press: Cambridge, UK, 2023. [Google Scholar]
- IPCC. Sixth Assessment Report: Impacts, Adaptation and Vulnerability; IPCC: Geneva, Switzerland, 2022. [Google Scholar]
- IPCC. Special Report on Climate Change and Extreme Weather Events; IPCC: Geneva, Switzerland, 2023. [Google Scholar]
- United Nations Framework Convention on Climate Change (UNFCCC). Paris Agreement. 2015. Available online: https://unfccc.int/process-and-meetings/the-paris-agreement/the-paris-agreement (accessed on 10 November 2023).
- IEA. Carbon Capture, Utilisation and Storage, IEA, Paris. 2022. Available online: https://www.iea.org/reports/carbon-capture-utilisation-and-storage-2 (accessed on 10 November 2023).
- IEA. Southeast Asia Energy Outlook 2022, IEA, Paris. 2022. Available online: https://www.iea.org/reports/southeast-asia-energy-outlook-2022 (accessed on 10 November 2023).
- IRENA. World Energy Transitions Outlook 2022: 1.5 °C Pathway; International Renewable Energy Agency: Abu Dhabi, United Arab Emirates, 2022. [Google Scholar]
- IPCC. Global Warming of 1.5 °C; An IPCC Special Report on the impacts of global warming of 1.5 °C above pre- industrial levels and related global greenhouse gas emission pathways, in the context of strengthening the global response to the threat of climate change; Intergovernmental Panel on Climate Change: Geneva, Switzerland, 2018. [Google Scholar]
- International Energy Agency (IEA). Energy Technology Perspectives 2017; IEA: Indianapolis, IN, USA, 2017. [Google Scholar]
- Global CCS Institute. What Is CCS? 2018. Available online: https://www.globalccsinstitute.com/wp-content/uploads/2018/12/Global-Status-of-CCS-Report-2018_FINAL.pdf (accessed on 10 November 2023).
- Enerdata. World Energy & Climate Statistics—Yearbook 2022. Available online: https://yearbook.enerdata.net/crude-oil/crude-oil-balance-trade-data.html (accessed on 15 December 2023).
- Government of China. Intended Nationally Determined Contribution. 2021. Available online: https://unfccc.int/sites/default/files/NDC/2022-06/China%E2%80%99s%20Achievements%2C%20New%20Goals%20and%20New%20Measures%20for%20Nationally%20Determined%20Contributions.pdf (accessed on 10 November 2023).
- Government of India. Intended Nationally Determined Contribution. 2022. Available online: https://unfccc.int/sites/default/files/NDC/2022-08/India%20Updated%20First%20Nationally%20Determined%20Contrib.pdf (accessed on 10 November 2023).
- Authors, based on each country’s national energy strategies and the nationally determined contributions (NDCs). The Paris Agreement and NDCs. Available online: https://unfccc.int/process-and-meetings/the-paris-agreement/nationally-determined-contributions-ndcs (accessed on 10 November 2023).
- Valentine, S.V.; Sovacool, B.K. The socio-political economy of nuclear power development in Japan and South Korea. Energy Policy 2010, 38, 7971–7979. [Google Scholar] [CrossRef]
- Hoon, H.T. The Singapore Economy: Dynamism and Inclusion, 1st ed.; Routledge: London, UK, 2021. [Google Scholar] [CrossRef]
- Government of Taiwan. Intended Nationally Determined Contribution. 2022. Available online: https://ghg.tgpf.org.tw/files/team/Submissiom_by_Republic_of_China_(Taiwan)INDC.pdf (accessed on 15 December 2023).
- Singapore’s Ministry of the Environment and Water Resources. Charting Singapore’s Low-Carbon and Climate Resilient Future. 2020. Available online: https://unfccc.int/sites/default/files/resource/SingaporeLongtermlowemissionsdevelopmentstrategy.pdf (accessed on 15 December 2023).
- Ministry of Economy, Trade and Industry. Green Growth Strategy Through Achieving Carbon Neutrality in 2050. Available online: https://www.meti.go.jp/english/policy/energy_environment/global_warming/ggs2050/pdf/ggs_full_en1013.pdf (accessed on 18 June 2021).
- Ministry of Environment, Republic of Korea. Republic of Korea Long-Term Strategy for Low Greenhouse Gas Emission Development (2020–2050). 2019. Available online: https://unfccc.int/sites/default/files/resource/LTS1_RKorea.pdf (accessed on 8 January 2024).
- Government of the Republic of Korea. Republic of Korea Long-Term Strategy under the Paris Agreement. United Nations Framework Convention on Climate Change. 2020. Available online: https://unfccc.int/sites/default/files/re-863source/LTS1_RKorea.pdf (accessed on 8 January 2024).
- Ministry of Sustainability and the Environment. the Singapore Green Plan 2030. 2021. Available online: https://www.greenplan.gov.sg/vision (accessed on 8 January 2024).
- Energy Market Authority. Charting the Energy Transition to 2050. 2022. Available online: https://www.ema.gov.sg/resources/industry-reports/energy-2050-committee-report (accessed on 25 March 2024).
- Gray, M. A Theory of ‘Late Rentierism’ in the Arab States of the Gulf. CIRS Occasional Papers. 2011. Available online: https://repository.library.georgetown.edu/bitstream/handle/10822/558291/CIRSOccasionalPaper7MatthewGray2011.pdf (accessed on 10 January 2024).
- Hertog, S. The political economy of distribution in the Middle East: Is there scope for greater regional integration? Int. Spect. 2016, 51, 43–59. [Google Scholar]
- Gengler, J.; Lambert, L. Renegotiating the ruling bargain: Selling fiscal reform in the GCC. MEJ 2016, 70, 321–329. [Google Scholar] [CrossRef]
- Tagliapietra, S. The impact of the global energy transition on MENA oil and gas producers. Energy Strateg. Rev. 2019, 26, 100397. [Google Scholar] [CrossRef]
- The Observatory of Economic Complexity (OEC). TGCC Countries Exports in 2021 by Products. Retrieved from OEC database. Available online: https://oec.world/en/profile/country/qat (accessed on 8 January 2024).
- Lambert, L.A.; D’Alessandro, C. Climate Change, Sea Level Rise, and Sustainable Urban Adaptation in Arab Coastal Cities. Online Research Review, MEJ, Washington, D.C.. 12 February 2019. Available online: www.mei.edu/publications/climate-change-sea-level-rise-and-sustainable-urban-adaptation-arab-coastal-cities (accessed on 8 January 2024).
- Lambert, L.A.; D’Alessandro, C. Sea Level Rise and the National Security Challenge of Sustainable Urban Adaptation in Doha and other Arab Coastal Cities. In Sustainable Qatar; Cochrane, L., Al Hababi, R., Eds.; Springer: Berlin/Heidelberg, Germany, 2022; pp. 147–165. Available online: https://link.springer.com/chapter/10.1007/978-981-19-7398-7_9 (accessed on 8 January 2024).
- International Energy Agency (IEA). World Energy Outlook 2022; IEA: Paris, UK, 2022. [Google Scholar]
- Gas Exporting Countries Forum (GECF). Global Gas Outlook 2022; GECF: Doha, Qatar, 2022. [Google Scholar]
- IPCC. Climate Change 2023: Mitigation of Climate Change; IPCC: Geneva, Switzerland, 2023. [Google Scholar]
- Ministry of Municipality and Environment. Qatar’s Environmental Strategy; Ministry of Municipality and Environment: Doha, Qatar, 2021. [Google Scholar]
- Bianco, C. Power Play: Europe’s Climate Diplomacy in the Gulf. 2021. Available online: https://ecfr.eu/publication/power-play-europes-climate-diplomacy-in-the-gulf (accessed on 8 January 2024).
- Kanso, H. Can Qatar’s Low-Carbon City Show a Greener Middle East Future? 2019. Available online: https://www.weforum.org/agenda/2019/03/can-qatars-low-carbon-city-show-a-greener-middle-east-future/ (accessed on 8 January 2024).
- TotalEnergies. Al Kharsaah, A Pioneering Solar Power Plant in Qatar. 2023. Available online: https://totalenergies.com/projects/solar/al-kharsaah-pioneering-solar-power-plant-qatar (accessed on 20 January 2024).
- Qatar News Agency. Qatar Increases Solar Power Plants Investments to QR 4 Billion to Diversify Production. 2022. Available online: https://www.qna.org.qa/en/News%20Area/News/2022-10/18/0027-qatar-increases-solar-power-plants-investments-to-qr-4-billion-to-diversify-production (accessed on 20 January 2024).
- IEA. How New Business Models Are Boosting Momentum on CCUS, IEA, Paris. 2023. Available online: https://www.iea.org/commentaries/how-new-business-models-are-boosting-momentum-on-ccus (accessed on 20 January 2024).
- Reuters. Qatar’s LNG Production Capacity to Reach 126 mln T a Year by 2027, Says Emir. 2022. Available online: https://www.reuters.com/business/energy/qatars-lng-production-capacity-reach-126-mln-t-year-by-2027-says-emir-2022-02-22/ (accessed on 10 January 2024).
- John, P. Renewables a Key Component of Qatar Petroleum’s Climate Roadmap. 2021. Available online: https://m.gulf-times.com/story/687260/Renewables-a-key-component-of-Qatar-Petroleum-s-climate-roadmap (accessed on 10 January 2024).
- QatarEnergy and GE to Develop Carbon Capture Roadmap and Low Carbon Solutions for Qatar’s Energy Sector|GE News. Available online: https://www.ge.com/news/press-releases/qatarenergy-and-ge-to-develop-carbon-capture-roadmap-and-low-carbon-solutions-for (accessed on 1 April 2023).
- Bohra, M.; Shah, N. Optimizing Qatar’s energy system for a post-carbon future. Energy Transit. 2020, 4, 11–29. [Google Scholar] [CrossRef]
- IEA. Net Zero by 2050, IEA, Paris. 2021. Available online: https://www.iea.org/reports/net-zero-by-2050 (accessed on 25 January 2024).
- Calabrese, J. Warming to a Multi-Colored Hydrogen Future? The GCC and Asia Pacific. 2021. Available online: www.mei.edu/publications/warming-multi-colored-hydrogen-future-gcc-and-asia-pacific (accessed on 25 January 2024).
- Bianco, C. Balance of Power: Gulf States, Russian, and European Energy Security. 2022. Available online: https://ecfr.eu/ar-ticle/balance-of-power-gulf-states-russia-and-european-energy-security/ (accessed on 25 January 2024).
- European Commission. REPowerEU: A Plan to Rapidly Reduce Dependence on Russian Fossil Fuels and Fast Forward the Green Transition. 2022. Available online: https://ec.europa.eu/commission/presscorner/detail/en/IP_22_3131 (accessed on 25 January 2024).
- European Commission. Hydrogen. 2022. Available online: https://energy.ec.europa.eu/topics/energy-systems-integration/hydrogen_en (accessed on 25 January 2024).
- European Commission. Communication from the Commission to the European Parliament, the Council, the European Economic and Social Committee and the Committee of the Regions on the REPowerEU Plan [COM(2023) 103 final]. January 2023. Available online: https://eur-lex.europa.eu/legal-content/EN/TXT/?uri=COM%3A2022%3A230%3AFIN (accessed on 25 January 2024).
- IEA. The Future of Hydrogen: Seizing Today’s Opportunities; IEA: Paris, France, 2018. [Google Scholar]
- Bianco, C. A Gulf Apart: How Europe Can Gain Influence with the Gulf Cooperation Council. 2020. Available online: https://ecfr.eu/publication/a_gulf_apart_how_europe_can_gain_influence_with_gulf_cooperation_council (accessed on 25 January 2024).
- Strategy. The Dawn of Green Hydrogen Maintaining the GCC’s Edge in a Decarbonized World. 2020. Available online: https://www.strategyand.pwc.com/m1/en/reports/2020/the-dawn-of-green-hydrogen.html (accessed on 5 February 2024).
- Meltzer, J.; Hultman, N.E.; Langley, C. Low-Carbon energy transitions in Qatar and the Gulf cooperation council region. Brookings papers on economic activity. 2014. Available online: https://ssrn.com/abstract=2408743 (accessed on 5 February 2024).
- Al-Khayat, J.; Balakrishnan, P. Avicennia marina around Qatar: Tree, Seedling and Pneumatophore Densities in Natural and Planted Mangroves Using Remote Sensing. IJS. 2014. Available online: https://ssrn.com/abstract=2573637 (accessed on 25 April 2024).
- ADNOC. ADNOC to Build World-Scale Blue Ammonia Project. 2021. Available online: https://www.adnoc.ae/news-and-media/press-releases/2021/adnoc-to-build-world-scale-blue-ammonia-project (accessed on 5 February 2024).
- European Commission. Clean Hydrogen Partnership Signs Cooperation Agreement with Japan’s NEDO. 2024. Available online: https://www.clean-hydrogen.europa.eu/media/news/clean-hydrogen-partnership-signs-cooperation-agreement-japans-nedo-2024-06-03_en (accessed on 5 February 2024).
- MEM. HYDROM MEETS TARGET TO DELIVER OVER 1 MILLION TPA OF RENEWABLE HYDROGEN WITH ROUND 2 AUCTION AWARD. 2024. Available online: https://mem.gov.om/en-us/Media-Center/News/ArtMID/608/ArticleID/1391/HYDROM-MEETS-TARGET-TO-DELIVER-OVER-1-MILLION-TPA-OF-RENEWABLE-HYDROGEN-WITH-ROUND-2-AUCTION-AWARD- (accessed on 1 April 2024).
- NEOM. NEOM GREEN HYDROGEN COMPANY COMPLETES FINANCIAL CLOSE AT A TOTAL INVESTMENT VALUE OF USD 8.4 BILLION IN THE WORLD’S LARGEST CARBON-FREE GREEN HYDROGEN PLANT. 2023. Available online: https://www.neom.com/en-us/newsroom/neom-green-hydrogen-investment (accessed on 1 April 2024).
- Nakano, J. Saudi Arabia’s Hydrogen Industrial Strategy. 2022. Available online: https://www.csis.org/analysis/saudi-ara-bias-hydrogen-industrial-strategy (accessed on 1 April 2024).
- Gas World. ADNOC and GAIL Sign MoU to Explore LNG Supply and Decarbonisation. 2022. Available online: https://www.gasworld.com/story/adnoc-and-gail-sign-mou-to-explore-lng-supply-and-decarbonisation/ (accessed on 1 April 2024).
- Ammonia Energy Association. Ammonia Project Features. 2023. Available online: https://www.ammoniaenergy.org/wp-content/uploads/2023/03/Project-Features-speaker-slides-March-2023.pdf (accessed on 1 April 2024).
- Reuters. Japan PM Laid Foundations for Hydrogen Supplies with Middle East Trip. Reuters. 2023. Available online: https://www.reu-ters.com/business/energy/japan-pm-laid-foundations-hydrogen-supplies-with-middle-east-trip-2023-07-27/ (accessed on 1 April 2024).
- Pinsent Masons. Japan and Middle East Sign Hydrogen Cooperation Agreements. 2023. Available online: https://www.pinsentmasons.com/out-law/news/japan-and-middle-east-sign-hydrogen-cooperation-agreements (accessed on 1 April 2024).
- Solar Quarter. Japanese Prime Minister’s Middle East Visit Spurs Hope for Green Energy Partnerships and Hydrogen Investments. 2023. Available online: https://solarquarter.com/2023/07/28/japanese-prime-ministers-middle-east-visit-spurs-hope-for-green-energy-partnerships-and-hydrogen-investments/ (accessed on 13 December 2023).
- Center for Strategic and International Studies. China’s Essential Role in Gulf States’ Energy Transitions. 2023. Available online: https://www.csis.org/analysis/chinas-essential-role-gulf-states-energy-transitions (accessed on 13 December 2023).
- South China Morning Post. China, Turkmenistan Vow to Strengthen Cooperation in Energy and Security. 2023. Available online: https://www.scmp.com/news/china/diplomacy/article/3243356/china-turkmenistan-vow-strengthen-cooperation-energy-and-security (accessed on 10 April 2024).
- Korea.net. Gov’t Signs First Joint Statement with S. Arabia in 43 Years. 2023. Available online: https://www.korea.net/Government/Current-Affairs/ForeignAffairs/view?affairId=2624&reviewId=240782&subId=137&viewId=68685 (accessed on 13 December 2023).
- McLaughlin, H.; Littlefield, A.A.; Menefee, M.; Kinzer, A.; Hull, T.; Sovacool, B.K.; Bazilian, M.D.; Kim, J.; Griffiths, S. Carbon capture utilization and storage in review: Sociotechnical implications for a carbon reliant world. Renew. Sustain. Energy Rev. 2023, 177, 113215. [Google Scholar] [CrossRef]
- Cabrera, G.; Dickson, A.; Nimubona, A.-D.; Quigley, J. Carbon capture, utilisation and storage: Incentives, effects and policy. Int. J. Greenh. Gas Control 2022, 120, 103756. [Google Scholar] [CrossRef]
- Global CCS Institute. Global Status of CCS 2022. 2022. Available online: https://www.globalccsinstitute.com/resources/global-status-of-ccs-2022 (accessed on 10 April 2024).
- Sovacool, B.K. Expanding carbon removal to the Global South: Thematic concerns on systems, justice, and climategovernance. Energy Clim. Chang. 2023, 4, 100103. [Google Scholar] [CrossRef]
- AFRY & GaffneyCline. CCUS Deployment Challenges and Opportunities for the GCC [White Paper]. OGCI, 2022. Available online: https://www.ogci.com/wp-content/uploads/2023/04/Gulf-CCUS-challenges-and-opportunities-Mar-2022_compressed.pdf (accessed on 10 April 2024).
- Global Carbon Project. Global Carbon Budget 2022. Available online: https://www.globalcarbonproject.org/carbonbudget/22/files/GCP_CarbonBudget_2022.pdf (accessed on 15 April 2024).
- Abu Zahra, M. Current Status of CCUS in the Middle East and North Africa (MENA) Region. Global CCS Institute, 2022. Available online: https://www.env.go.jp/earth/ccs/3rd_speech5.pdf (accessed on 15 April 2024).
- QatarEnergy. Your Energy Transition Partner (Sustainability Report 2021). 2021. Available online: https://www.qatarenergy.qa/en/MediaCenter/Publications/QatarEnergy%202021%20Sustainability%20Report.pdf (accessed on 15 April 2024).
- Global CCS Institute. Global Status of CCS 2021 CCS Accelerating to Net Zero. 2021. Available online: https://www.globalccsinstitute.com/wp-content/uploads/2021/10/2021-Global-Status-of-CCS-Report_Global_CCS_Institute.pdf (accessed on 15 April 2024).
- IEA [International Energy Agency]. Global Hydrogen Demand by Sector in the Net Zero Scenario, 2019–2030—Last Updated 16 Sep 2022—IEA Data and Statistics. 2022. Available online: https://www.iea.org/data-and-statistics/charts/global-hydrogen-demand-by-sector-in-the-net-zero-scenario-2019-2030 (accessed on 20 January 2024).
- UNFCCC. Glasgow Climate Pact. Secretariat of the United Nations Framework Convention on Climate Change. 2021. Available online: https://unfccc.int/sites/default/files/resource/cop26_auv_2f_cover_decision.pdf (accessed on 15 April 2024).
- Al-Khayat, J.A.; Alatalo, J.M. Relationship Between Tree Size, Sediment Mud Content, Oxygen Levels, and Pneumatophore Abundance in the Mangrove Tree Species Avicennia Marina (Forssk). Vierh. JMSE 2021, 9, 100. [Google Scholar] [CrossRef]
- Kandasamy, K.; Rajendran, N.; Balakrishnan, B.; Thiruganasambandam, R.; Narayanasamy, R. Carbon sequestration and storage in planted mangrove stands of Avicennia Marina. Reg. Stud. Mar. Sci. 2021, 43, 101701. [Google Scholar] [CrossRef]
- MSC Foundation. Programme to Conserve and Restore Qatar’s Coastal Ecosystems Announced. 2022. Available online: https://www.mscfoundation.org/news/qatar-foundation (accessed on 15 April 2024).


| Operational | In Construction | Advanced Development | Early Development | Operation Suspended | Total | |
|---|---|---|---|---|---|---|
| Number of Facilities | 30 | 11 | 78 | 75 | 2 | 196 |
| Capture Capacity (mtpa) | 42.5 | 9.6 | 97.6 | 91.8 | 2.3 | 243.9 |
| Project Name | Country | Facility Status | Operational Date | Capture Capacity (mtpa CO2) |
|---|---|---|---|---|
| Uthmaniyah CO2-EOR Demonstration (a) | Saudi Arabia | Operational | 2015 | 0.8 |
| Abu Dhabi CCS (Phase 1 Being Emirates Steel Industries) (a) | UAE | Operational | 2016 | 0.8 |
| Qatar LNG CCS (a) | Qatar | Operational | 2019 | 2.2 |
| Qatar Gas (b) | Qatar | Operational | 2021 | 1.18 |
| North Field East Project (NFE) CCS (a) | Qatar | In construction | 2025 | 1 |
| Abu Dhabi CCS Phase 2: Natural Gas Processing Plant (a) | UAE | Advanced development | 2025 | 2.3 |
| Ghasha Concession Fields (a) | UAE | Advanced development | 2025 | Under evaluation |
| Ammonia-7 Project (c) | Qatar | - | 2026 | 1.5 |
| All Costs in USD Per kg of Hydrogen | Dedicated Renewable Electricity Supply | Otherwise, Curtailed Renewable Electricity Supply | Steam Methane Reformation with Ccs | Black Coal Gasification with Ccs |
|---|---|---|---|---|
| CSIRO 2018 | USD 7.70 | USD 18.20 | USD 1.80 | USD 2.00 |
| IEA 2019 | USD 3.75 | - | USD 2.00 | USD 2.00 |
| IRENA 2019 | USD 4.10 | - | USD 2.50 | USD 2.00 |
| Hydrogen Council 2020 | USD 6.00 | - | USD 2.10 | USD 2.00 |
| Simple average of costs from these four reports | USD 5.40 | USD 18.20 | USD 2.10 | USD 2.00 |
| Country | Total GHG Emissions |
|---|---|
| Qatar | Around 90 million metric tons of CO2 equivalent annually. |
| Saudi Arabia | Around 600 million metric tons of CO2 equivalent annually. |
| United Arab Emirates | Around 250 million metric tons of CO2 equivalent annually. |
| Kuwait | Roughly 100 million metric tons of CO2 equivalent annually. |
| Oman | Around 50 million metric tons of CO2 equivalent annually. |
| Bahrain | Around 35 million metric tons of CO2 equivalent annually. |
| Country | Reform | Forecast |
|---|---|---|
| Qatar | National Climate Change Action Plan 2030: Energy efficiency and solar power for substantial reductions in emissions. | Reducing around 30 million metric tons of CO2 equivalent annually by 2030 |
| Saudi Arabia | Vision 2030: Generating 50% of its energy from renewable sources (significant investments in solar and wind energy) by 2030 | If the targets are achieved, emissions could be reduced by 130 million metric tons of CO2 per year by 2030. |
| United Arab Emirates | Energy Strategy 2050: Increasing the clean energy share in the total energy mix to 50% by 2050. | If the strategy is fully implemented, emissions could be lowered to about 70 million metric tons of CO2 equivalent annually by 2050. |
| Kuwait | Kuwait Vision 2035: Plans for renewable energy and energy efficiency improvements. | Emissions could be reduced by about 20 million metric tons of CO2 equivalent annually by 2035. |
| Oman | National Energy Strategy: Diversification of its energy sources and increasing the use of renewable energy sources. | Emissions might be reduced by 10–15 million metric tons of CO2 equivalent annually by 2030. |
| Bahrain | National Renewable Energy Action Plan: Targeting 5% renewable energy in the total energy mix by 2025 and 10% by 2035. | Emissions could be decreased by 5–10 million metric tons of CO2 equivalent annually by 2035. |
| Country | Cost of the Reforms |
|---|---|
| Qatar | National Climate Change Action Plan 2030 Renewable Energy Initiatives: About USD 10–15 billion for solar and other renewable energy projects. Energy Efficiency Programs: The cost estimation is around USD 5–10 billion. |
| Saudi Arabia | Vision 2030 Renewable Energy Projects: Estimated at about USD 30–50 billion to meet the target of 50% renewable energy by 2030. Energy Efficiency Measures: Investing to improve energy efficiency across different sectors with an expected cost of approximately USD 10–20 billion. CCS and Hydrogen Production: The estimated costs for CCS and green hydrogen production projects are about USD 5–10 billion. |
| United Arab Emirates | Energy Strategy 2050 Renewable Energy Investments: About USD 160 billion to increase the share of clean energy to 50% by 2050. Nuclear Power Plants: The cost of the Barakah nuclear power plant is about USD 24.4 billion. Energy Efficiency Improvements: The expected cost for investments is around USD 10–15 billion. |
| Kuwait | Kuwait Vision 2035 Renewable Energy Projects: The cost of developing renewable energy infrastructure is around USD 15–20 billion. Energy Efficiency Measures: The expected costs are about USD 5–8 billion. |
| Oman | National Energy Strategy Renewable Energy Development: The estimated cost for solar and wind projects is USD 5–10 billion. Energy Efficiency Improvements: The expected cost is around USD 2–4 billion. |
| Bahrain | National Renewable Energy Action Plan Renewable Energy Investments: About USD 2–5 billion is required to achieve the 2025 and 2035 targets. Energy Efficiency Measures: The expected costs are about USD 1–2 billion. |
| Country | Electricity Generation | Transportation | Housing | Agriculture | Other Sectors | Total Emissions |
|---|---|---|---|---|---|---|
| Qatar | 50 | 20 | 10 | 10 | 10 | 100 |
| Saudi Arabia | 300 | 150 | 80 | 70 | 70 | 670 |
| United Arab Emirates | 125 | 75 | 35 | 15 | 50 | 300 |
| Kuwait | 50 | 30 | 10 | 10 | 10 | 110 |
| Oman | 25 | 15 | 5 | 5 | 10 | 60 |
| Bahrain | 20 | 8 | 4 | 3 | 8 | 43 |
| Country | Current Emissions | Projected Reduction by 2030 | Projected Reduction by 2035 | Projected Reduction by 2050 | Emission in 2030 | Emission in 2035 | Emission in 2050 |
|---|---|---|---|---|---|---|---|
| Qatar | 100 million metric tons | 30 million metric tons | - | - | 70 million metric tons | - | - |
| Saudi Arabia | 670 million metric tons | 130 million metric tons | - | - | 540 million metric tons | - | - |
| United Arab Emirates | 300 million metric tons | - | - | 70 million metric tons | - | - | 70 million metric tons |
| Kuwait | 110 million metric tons | - | 20 million metric tons | - | - | 90 million metric tons | - |
| Oman | 60 million metric tons | 10–15 million metric tons | - | - | 45–50 million metric tons | - | - |
| Bahrain | 43 million metric tons | - | 5–10 million metric tons | - | - | 33–38 million metric tons | - |
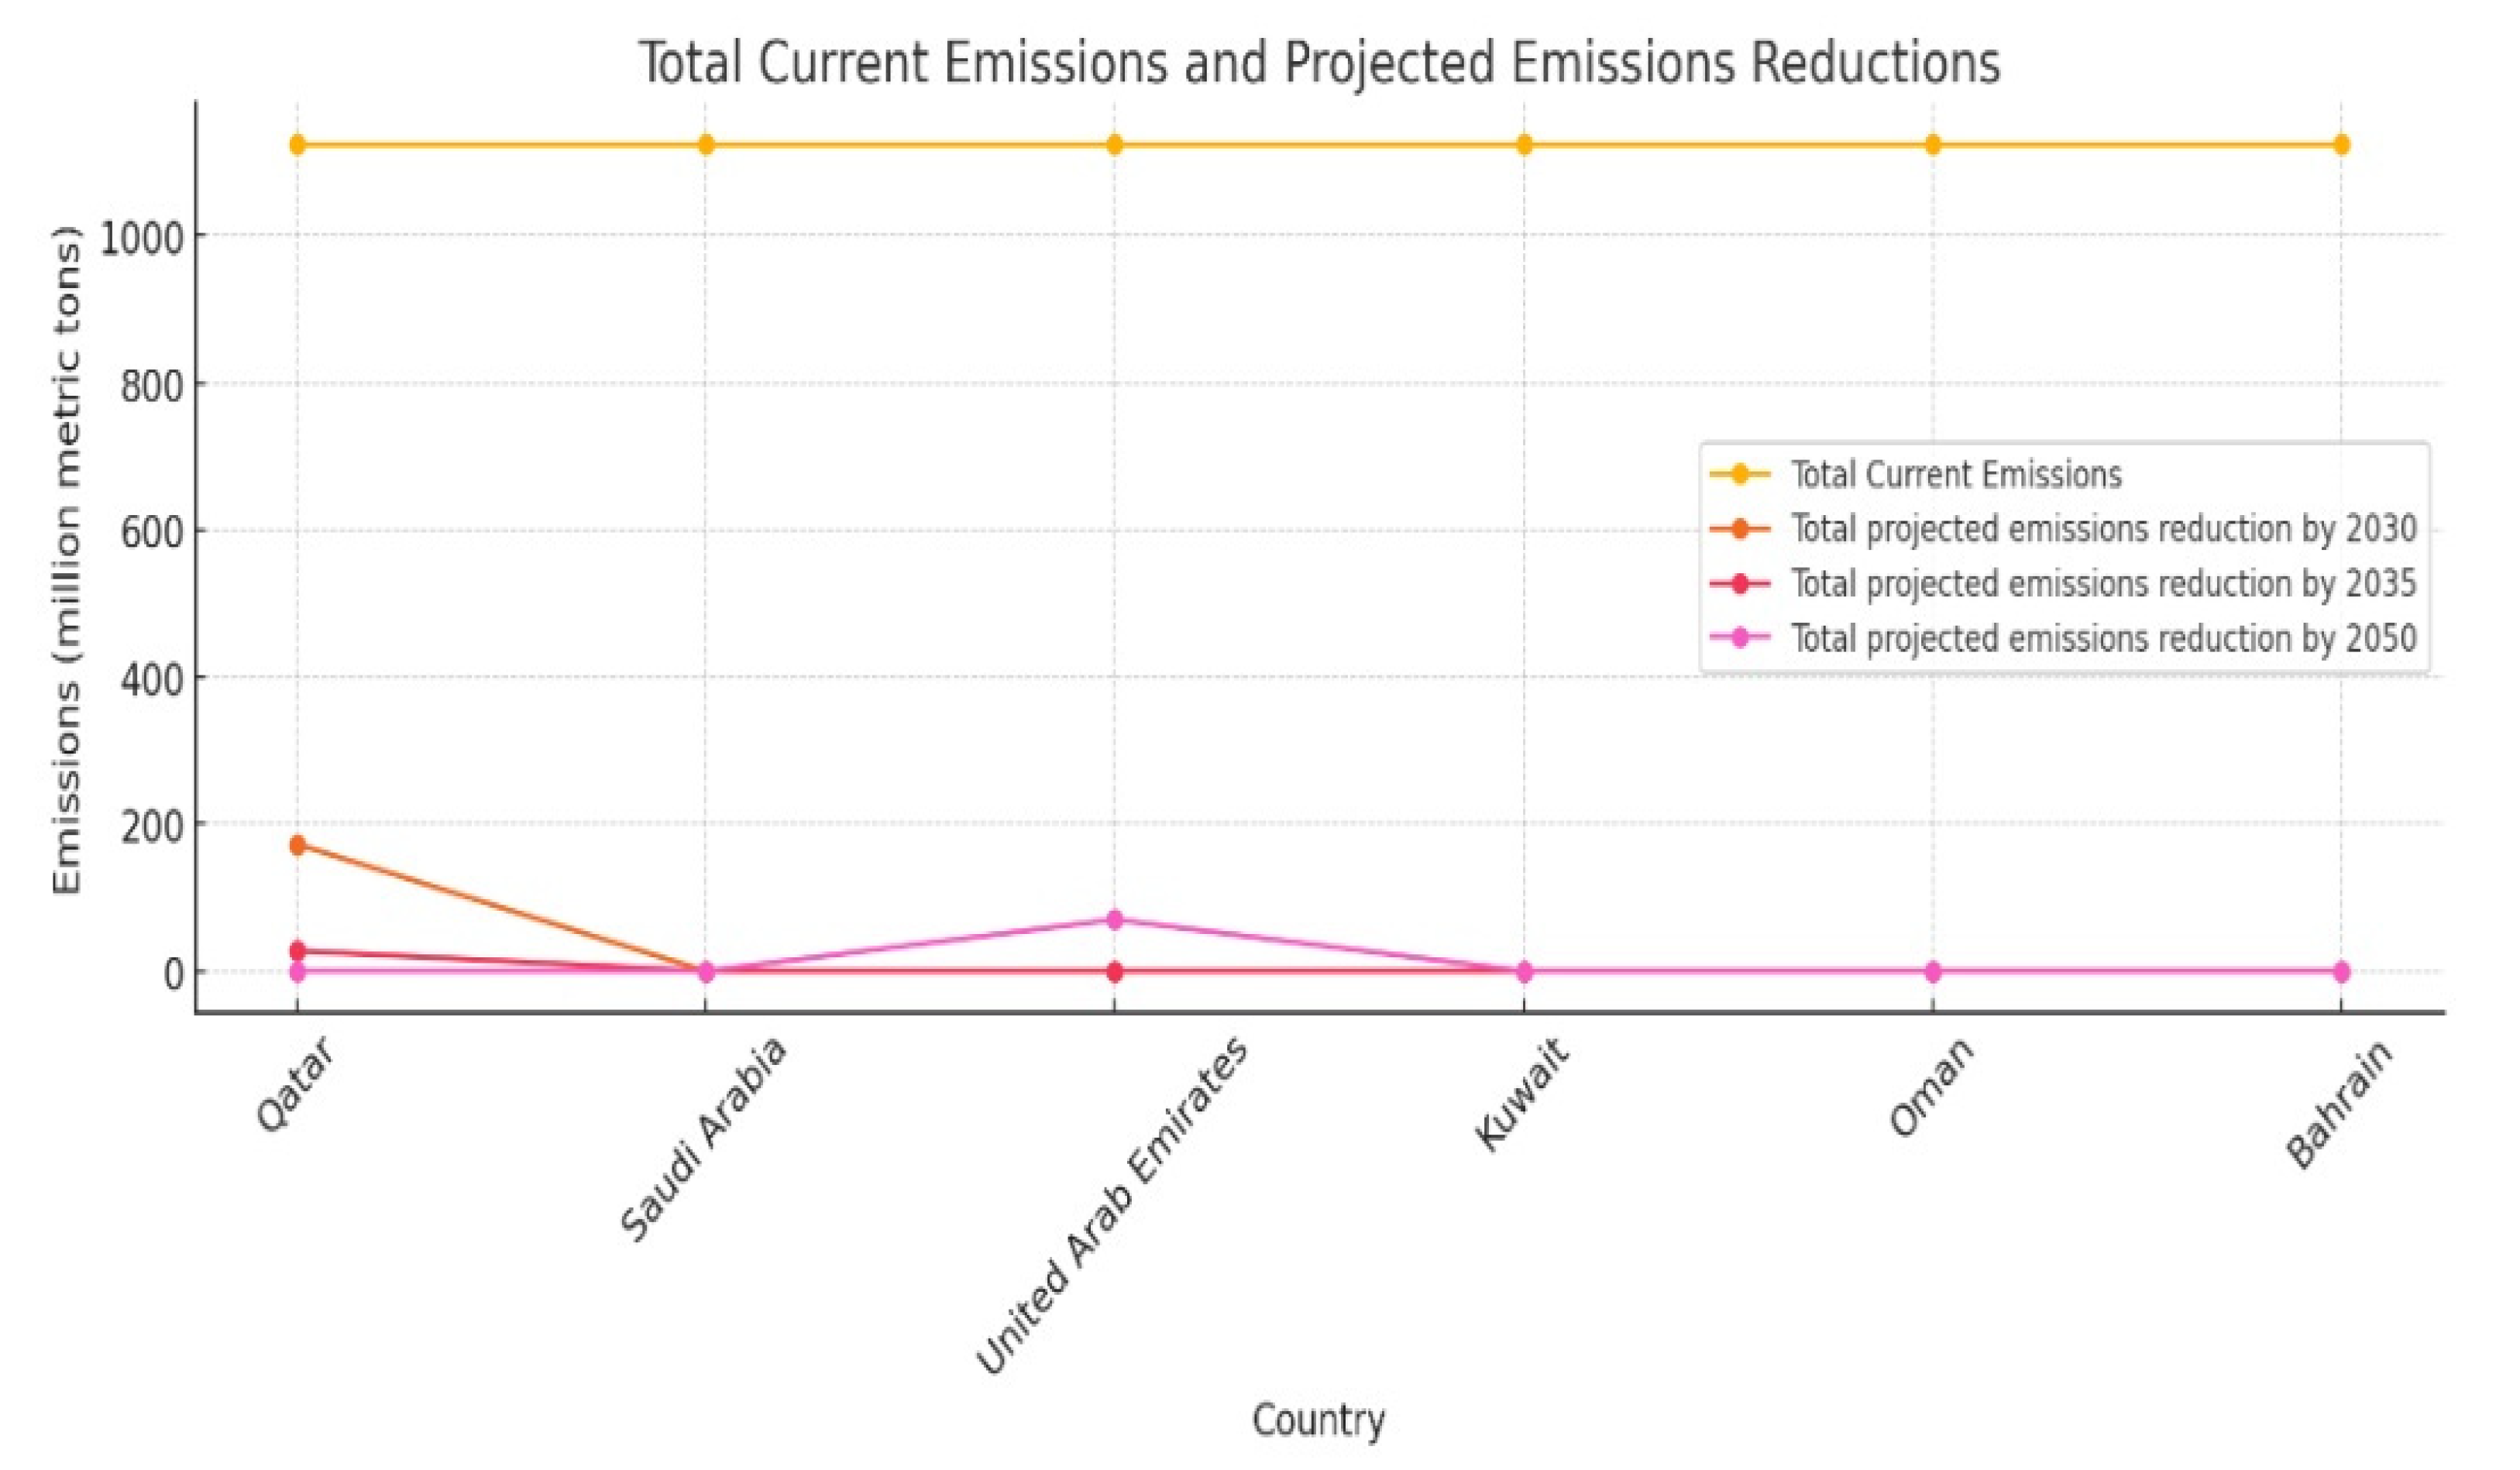
| Country | Total Cost | Total Current Emissions | Total Projected Emissions Reduction by 2030 | Total Projected Emissions Reduction by 2035 | Total Projected Emissions Reduction by 2050 | Total Investment Required |
|---|---|---|---|---|---|---|
| Qatar | USD 15–25 billion | 1125 million metric tons | 170–175 million metric tons | 25–30 million metric tons | - | USD 284.4–353.4 billion |
| Saudi Arabia | USD 45–80 billion | - | ||||
| United Arab Emirates | USD 194.4–199.4 billion | 70 million metric tons | ||||
| Kuwait | USD 20–28 billion | - | ||||
| Oman | USD 7–14 billion | - | ||||
| Bahrain | USD 3–7 billion | - |
Disclaimer/Publisher’s Note: The statements, opinions and data contained in all publications are solely those of the individual author(s) and contributor(s) and not of MDPI and/or the editor(s). MDPI and/or the editor(s) disclaim responsibility for any injury to people or property resulting from any ideas, methods, instructions or products referred to in the content. |
© 2024 by the authors. Licensee MDPI, Basel, Switzerland. This article is an open access article distributed under the terms and conditions of the Creative Commons Attribution (CC BY) license (https://creativecommons.org/licenses/by/4.0/).
Share and Cite
Abdallah, I.; Alhosin, H.; Belarabi, M.; Chaouki, S.; Mahmoud, N.; Tayah, J. A Pan-Asian Energy Transition? The New Rationale for Decarbonization Policies in the World’s Largest Energy Exporting Countries: A Case Study of Qatar and Other GCC Countries. Energies 2024, 17, 3776. https://doi.org/10.3390/en17153776
Abdallah I, Alhosin H, Belarabi M, Chaouki S, Mahmoud N, Tayah J. A Pan-Asian Energy Transition? The New Rationale for Decarbonization Policies in the World’s Largest Energy Exporting Countries: A Case Study of Qatar and Other GCC Countries. Energies. 2024; 17(15):3776. https://doi.org/10.3390/en17153776
Chicago/Turabian StyleAbdallah, Ismail, Hamed Alhosin, Mohamed Belarabi, Sanae Chaouki, Nousseiba Mahmoud, and Jad Tayah. 2024. "A Pan-Asian Energy Transition? The New Rationale for Decarbonization Policies in the World’s Largest Energy Exporting Countries: A Case Study of Qatar and Other GCC Countries" Energies 17, no. 15: 3776. https://doi.org/10.3390/en17153776