Article

Analysis of the Year-Round Operation of Enhanced Natural Ventilation Systems under Transient Weather Conditions in Europe

by
Rafał Andrzejczyk
Faculty of Mechanical Engineering and Ship Technology, Institute of Energy, Gdansk University of Technology, Narutowicza 11/12, 80-233 Gdansk, Poland
Energies 2024, 17(15), 3795; https://doi.org/10.3390/en17153795
Submission received: 30 April 2024 / Revised: 21 July 2024 / Accepted: 23 July 2024 / Published: 1 August 2024

Abstract

:
This study presents the potential of using a natural ventilation system integrated with different combinations of enhancement techniques. The focus was on the perspective of using such configurations of passive ventilation systems (PVSs) in buildings located in different European cities. This work presents the results of obtaining the level of volumetric air flow rate for considering natural ventilation systems. Furthermore, the influences of local weather conditions (temperature, solar radiation, wind speed) were analyzed. Moreover, the year-round operation of all systems was presented. Also noted was the limitation of using PVSs based on the natural draft effect, additionally assisted by wind turbine ventilators in all European localizations. However, for the cities located in the northern part of Europe, it was confirmed that such a system can still meet minimum hygienic recommendations. It was also noted that a system additionally supported by a solar chimney is a much better solution. The best system was a PVS supported by a wind turbine ventilator and solar chimney integrated with PCM accumulation mass. The system should be additionally supported by waste heat from low-temperature sources. In the presented study, a high potential to reduce CO2 emission from building stock by the recommended system is additionally highlighted. However, there is still a need to analyze the proposed solutions by additional field tests and experimental investigations.

1. Introduction and Theoretical Background

According to the conclusions highlighted in the last EU directive (EU/2023/1791), 85% of buildings in the EU were built before 2000 and, among those, 75% have poor energy efficiency. Generally, the building stock sector amounts to about 40% of the world’s total energy demand [1]. It should be also noted that 35% of this amount of energy is consumed by ventilation [2]. Moreover the consumption by ventilation systems is the least constant. It depends on hygiene requirements, local law regulations, the character of building objects, and safety requirements [3]. Many European countries are still dominated by natural ventilation. In Poland, according to the data for 2007, about 87% of buildings had natural ventilation. Furthermore, 90% of such systems are so-called ventilation with collective ducts [4]. A similar situation is found in other countries from Central and Eastern Europe like Romania, where up to 90% of houses made before 2008 have only natural ventilation. After 2010, this did not change very much, and 80% of new installations are still based on gravity air movement [5]. If we look at Western Europe, there are many more countries with an obligation to use mechanical ventilation in buildings, e.g., in France, such regulations were applied in 1969. However, France has the largest number of single- and multi-family houses in the EU (see Figure 1 and Figure 2) and about 19% of the existing buildings still have natural ventilation. So, in absolute numbers, the quantity of buildings with gravity ventilation in Poland and France is similar.
Figure 1. Number of single-family houses in selected European countries based on literature data [6].
Energies 17 03795 g001
Figure 2. Number of apartment blocks in selected European countries based on literature data [6].
Energies 17 03795 g002
Efficient ventilation is crucial for the health of a building [7]. Furthermore, properly working natural ventilation together with good insulation and shadowing systems is significantly important for reducing the total energy consumption of a building (by up to 59%) [8]. In this context, it should be noted that natural ventilation does not work well during hot weather when the ambient temperature is higher than the temperature inside buildings. Generally, the efficiency of natural ventilation is a function of localization (Figure 3). In northern and eastern parts of Europe, such systems work efficiently during the daytime in winter and partly during spring and autumn. However, this time is significantly reduced in the southern part of Europe. Despite this, during the summer, natural ventilation can work efficiently at night and has a large cooling potential (see Figure 4). This system also has big technical advantages: it is maintenance-free, does not need external energy, is low-cost, has no moving parts, has high reliability, and is environmentally friendly. Due to this, natural ventilation is still very popular. There are many literature studies focused on enhancing the efficiency of using double window facades, wind towers, Trombe walls, and solar chimneys [9]. This issue is also critical in the context of potential, especially for old building ventilation retrofitting.
One of the best solutions in this field seems to be solar chimneys (SCs). The solar chimney has been used for many centuries. Its popularity has increased visibly over the last two decades because of its economic and environmental benefits [10]. This device utilizes solar radiation energy to generate a buoyancy force for air movement. The air is driven through solar chimneys, where it is heated up and, due to lower-than-ambient air density, it is discharged into the atmosphere. In parallel, the fresh air is transported to the building by the intake system and the cycle is repeated. Solar chimneys as an element of natural ventilation systems were extensively studied in terms of optimization system performance. Lei Y. et al. [11] proposed a novel roof solar chimney with a perforated absorber plate to enhance the efficiency of building passive ventilation. Jing H. [12] experimentally investigated the influences of the gap-to-high ratio on solar chimney efficiency. Other significant parameters that influence solar chimney efficiency are inclination angles [13], tilt [14], solar collector area [15], chimney diameter [16], inlet and outlet area to the ventilation system [17], and cavity depth [18]. The main disadvantage of the traditional solar chimney is the fact that it does not operate during the night or on cloudy days. Moreover, it is very sensitive to solar radiation levels [19]. It should be noted that, e.g., in Central Europe, the direct utilization of solar energy typically lasts around 4–5 h per day during winter months and around 8–10 h per day during summer months [20]. Furthermore, there are significant seasonal disparities in solar radiation intensity in different parts of Europe. For example, in Poland, the average solar radiation intensity varies between approximately 200 W/m2 and 700 W/m2 from January to June, whereas, in Turkey, the average solar radiation intensity ranges from around 500 W/m2 to 1000 W/m2 from January to June. Additionally, there is a large disproportion between the average annual temperature in different countries and a great disproportion between daily temperature amplitude [21,22,23,24]. The solution could be the integration of solar chimneys with thermal energy storage. However, the thermal capacity of the conventional chimney (e.g., concrete, brick) is too small to store enough energy. A prospective material that could be used to solve this issue is phase change material (PCM). Thermal energy storage (TES) has a big potential to increase the efficiency of using renewable energy over days and seasons.
Figure 3. Europe climate map classification according to Köppen–Geiger classification [25].
Energies 17 03795 g003
Figure 4. Cooling potential at night in Europe [26].
Energies 17 03795 g004
S. Liua and Y. Lic experimentally and numerically investigated the influences of different technical parameters of solar chimneys and the properties of PCM on the efficiency of SCs. They noted that the main important parameters in the performance of the systems are the latent heat of the PCM, heat flux, the thermal conductivity of the insulation, the transmissivity of the glass, and ambient temperature [27]. J.C. Frutos Dordelly et al. experimentally investigated the SC integrated with a rectangular aluminum panel filled by PCM (paraffin RT42). The average total potential for energy storage by 21 used panels was up to 5.12 kWh. It was confirmed that even with a relatively low gain of solar radiation equal to 550 W/m2, it is possible to obtain a satisfactory level of air volumetric flow through the SC (70 m3/h). Furthermore, it is possible to keep the temperature inside the chimney at about 40 °C over 6 h after the absence of solar energy. During this period, it was possible to still keep a similar average volumetric flow of air equal to 60 m3/h [28]. A.A.M. Omara et al. revised the possibility of the performance enhancement of SCs by using PCMs. The authors noted a few limitations and directions for future studies. Firstly, there is still a need to optimize the thickness of PCM in solar chimneys. More focus should be put on the analysis of influences of SC integrated with PCM at the humidity level in buildings, which, together with temperature, is the basic parameter of comfort; the possibility to integrate LTES with sensible energy storage; and the integration of SC supported by PCM with a low-temperature source like a PV/T system to provide both thermal and electrical performance [29]. Yan Cao et al. numerically investigated the perspective of integrating PV modules with PCM storage and a solar chimney ventilation system (SCV-PV-PCM). It was confirmed that in the Hong Kong climate, such a system has the best performance during the summer and autumn. The largest economic benefit might be provided in June by saving $ 2.88/month. It should also be highlighted that the electrical performance of SCV-PV-PCM is better by about 14.8% than that of conventional systems based on a solar chimney integrated with a PV panel (SCV-PV).
An additional possibility of enhancing natural ventilation is through induced air movement by wind force. One of the most popular solutions is using a wind turbine ventilator due to the possibility of working independently from the wind direction and providing the possibility to flow air without wind force and only by a stack effect [30]. However, the efficiency of the combined system of the roof wind turbine ventilator and SC has not been well studied [31]. Numerical investigations have confirmed the significant influence of wind on solar chimneys with wind-induced channels [32].
Nevertheless, there is a big potential to use LTES systems to enhance the effective use of solar chimney technology, but this cannot solve all the issues. Firstly, in the case of low radiation for a longer time, the ventilation system efficiency drops significantly and does not provide the possibility to meet the technical requirements for such systems. A possible solution could be to connect the LTES to an additional heat source, which could be even temporarily available during the day or night time. This would give a chance to combine using free solar energy with additional waste heat. The largest possibilities for the application of such an idea might be in highly urban areas. According to recent research, each year in Europe there is around 1.2 EJ of low-temperature heat available from urban sources like data centers, metro stations, service sector buildings, and wastewater treatment plants. However, the main challenge of using such heat is that the temperature is usually less than 40 °C [33]. Nevertheless, there is also a large potential for individual air cooling and drying systems. According to the International Energy Agency, there are 1.6 billion HVAC units in the world. Due to climate change and the economic growth of countries such as China or India, it is expected that, by 2050, the total number of HVAC units will reach 4.5 billion. A good example could be waste heat from AC used for drying clothes. The available temperature range for condensers of such units varies between ~42 °C and 42.6 °C. In the case of refrigeration systems used for drying food like potatoes, the available temperature is between 34 °C and 44 °C. However, the most common method in urban areas seems to be waste heat from domestic refrigeration cooling systems, with a temperature of up to 52 °C (depending on ambient temperature) [34]. Furthermore, in the European industry, there is around 469 TWh of heat at a temperature below 100 °C [35]. The priority of using the higher temperature of heat is for, e.g., the production of domestic hot water or heat for space heating. Nevertheless, in general, the demand for heat is a function of ambient temperature. So, in the hot period of the year, most of the waste heat is not used. On the contrary, the demand for heat from passive ventilation systems grows with growing ambient temperatures. It has already been confirmed that waste heat improves the efficiency of SC power plants [36]; however, there is still a lack of data about integrating solar chimneys with low-temperature waste heat for passive ventilation (please see the summary of the presented literature in Table 1).
According to the presented literature sources, the main technologies that could be provided to enhance passive ventilation systems rely on using solar energy with accumulated mass (PCM). There are limited studies regarding the integration of solar and wind energy. The main disadvantage of using such a system is the periodic and intermittent character of renewable energy sources. The solution could be hybrid systems using both solar energy and wind forces. One of the best possibilities seems to be the integration of solar chimneys with wind turbine ventilators [31] and solar chimneys integrated with accumulated mass. However, it has already been confirmed that traditional chimney construction based on concrete cannot provide sufficient accumulation levels of thermal energy. The alternative is to use PCM as an additional accumulation mass in the solar chimney. The positive influence of the integration of waste heat energy sources with solar chimney power plants has also been confirmed. There are no studies about the integration of solar chimneys with wind turbine ventilators and PCM or the possibility of using waste heat energy in passive ventilation systems. There is also limited information about the year-round operation of passive ventilation systems in different European locations [37]. Due to these facts, the main purposes of the presented study were as follows:
  • Simulation of year-round operation of passive ventilation systems based on the use of renewable energy sources (solar, wind) and low-temperature waste heat.
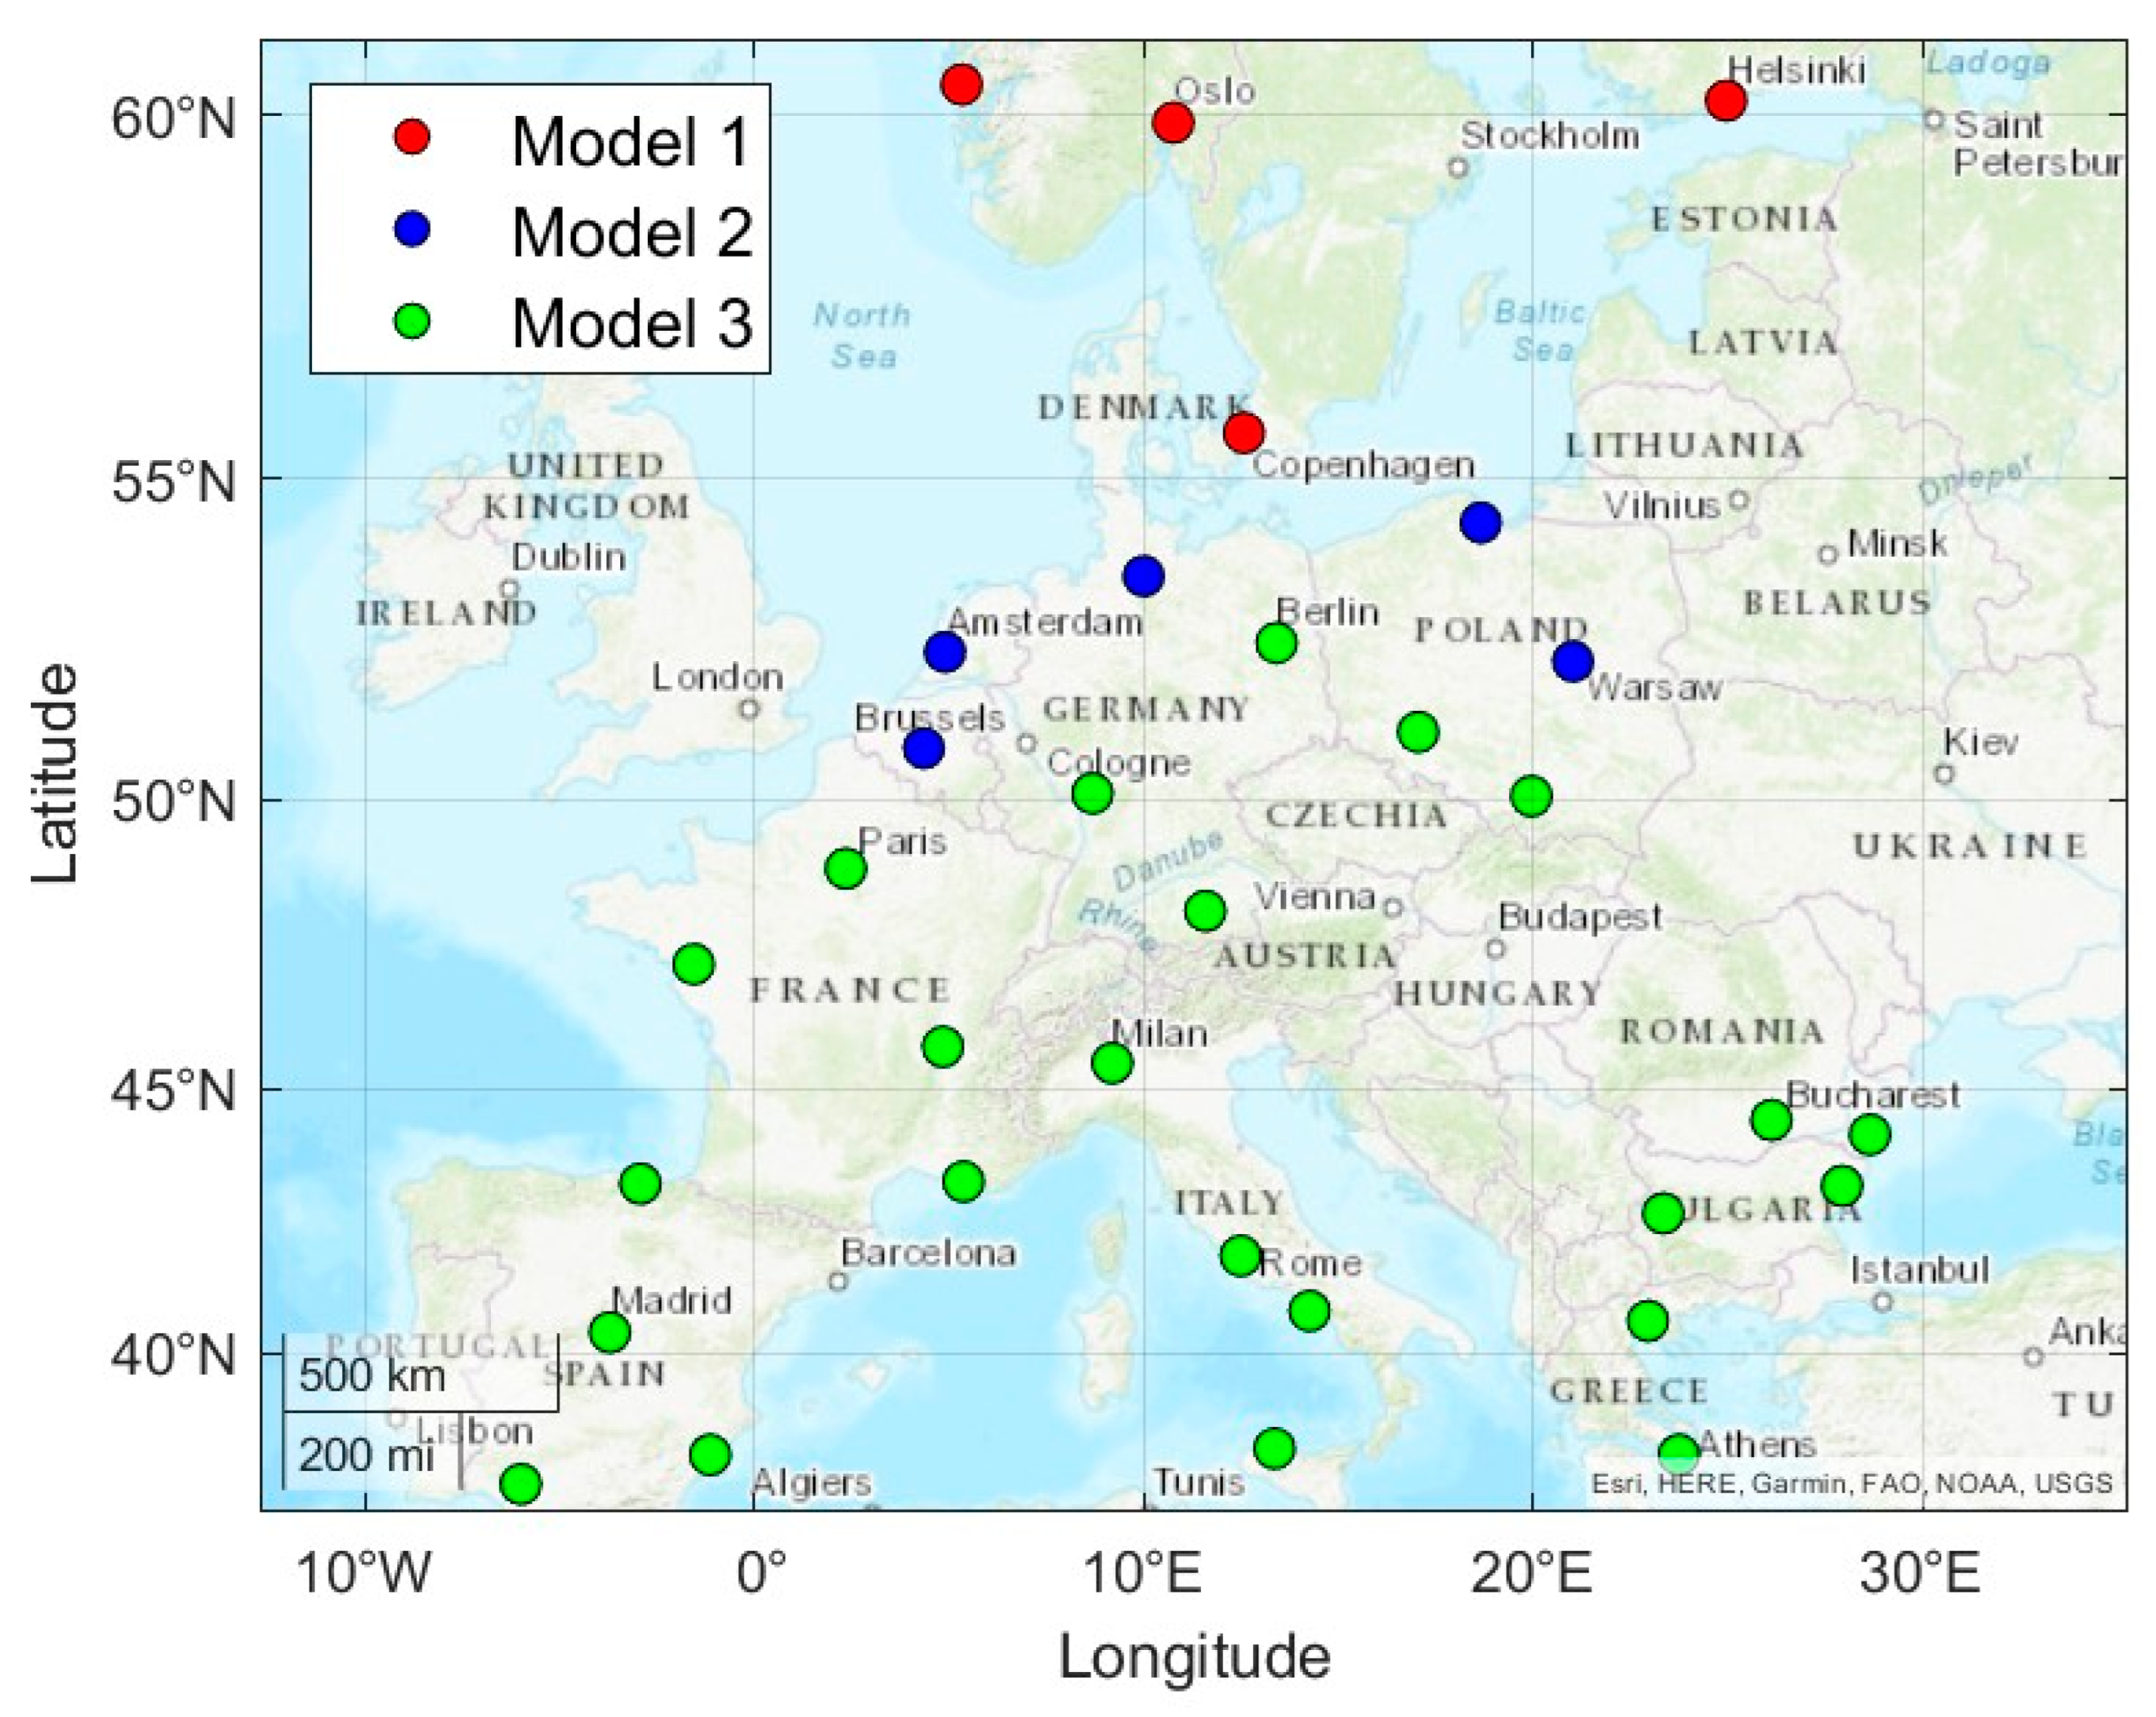
  • Providing comprehensive results for the different arrangements of natural ventilation systems in different European urban areas.
  • Presenting the comparisons of different ventilation strategies to avoid concentration of building indoor pollution in selected locations.
  • Analysis of the possibility for CO2 reduction by using a passive ventilation system.
The year-round operation of the system was presented by using object-oriented modeling in Modelica for selected cities in Europe. Three different scenarios were analyzed: natural ventilation using a wind turbine ventilator, solar chimney wind turbine ventilator, solar chimney with wind turbine ventilator, and PCM mass integrated with a waste heat source. Calculations were made for typical residential spaces in European conditions. This work will present the results for volumetric flow levels by analyzing natural ventilation systems. Furthermore, the influences of local weather conditions (temperature, solar radiation, wind speed) will be analyzed.

2. Simulation of Combined Natural Ventilation Techniques

2.1. Characteristics of Proposed Systems

This section introduces the procedure used to analyze the potential of using different combinations of natural ventilation techniques to enhance the performance of fresh air supplied to the building objects. The three different models of passive ventilation systems were selected. Figure 5 presents the model of passive ventilation with a roof wind turbine ventilator located at the end of the air chimney. This type of turbine is driven by wind and, compared to the different chimney cowls, could improve ventilation rates for all wind directions [40]. According to the definition of the American Society of Heating, Refrigerating and Air-Conditioning Engineers (ASHRAE, 1999), the main active forces are the wind induction and stack effect. The second model is presented in Figure 6. This is a natural ventilation system with a solar chimney also supported by a wind turbine. As has been already noted, the solar chimney is based on natural convective air movement created by the density differences between the air inside the chimney and the environment. Generally, it is based on using a solar heater as an integral element of one of the chimney walls. It generates air movement by bouncy force created by heating the air inside the chimney with solar energy. This system works until there is enough solar radiation to increase the air temperature to be higher than the ambient one [41]. However, in the case of using a roof wind turbine ventilator, it can also be operated by using wind forces. To mitigate the variability of the SC system performance and wind turbine ventilator, using additional storage mass, which could keep energy longer and heat the air for a longer period, was next analyzed. It seems that the best technology is based on PCM materials [42]. However, the reasonable range of operation time of LTES due to the limitations of space and mass and economic reasons should be no longer than a few hours [37]. Furthermore, the operation time of an SC with PCM is strongly related to the level of solar radiation, which is variable also due to weather conditions [28,43]. Also, the performance of wind turbine ventilators is strongly affected by the location [44]. As the European Environment Agency highlighted, the average wind speed is relatively higher in Northern Europe and along the coastline than in the southern part of the continent. Due to this fact, it was proposed to use for Model 3 (see Figure 7) a hybrid system relying on using SC with PCM supported by a wind turbine ventilator and integrated with low-temperature waste heat energy.

2.2. Mathematical Model

2.2.1. Volumetric Flow Rate Calculation

The proposed ventilation systems were mathematically modeled regarding select semi-theoretical correlations available in the literature. However, it should be noted that the accuracy of the presented correlations is confirmed by limited experimental data.
The average volumetric flow into the solar chimney as a function of solar radiation heat flux was calculated according to the model proposed by Long Shi et al. (see also Figure 8).
Figure 8. Schematic of SC for Equation (1).
Energies 17 03795 g008
V S C _ q = w ( sin θ r ) 1 / 3 q 1 / 2 d 0.7 H 2 / 3 S l o p e , S l o p e = 37 E + 50 M + 66 G 4 I + 82
where
w—cavity width (m);
θ—inclination angle from the horizontal (°);
q—heat input intensity (W/m2);
d—air gap thickness (m);
H—cavity height (m);
Slope—regressed slope;
E—environmental factors, 1 for outdoor test and 0 for indoor test;
M—cavity materials, 1 for metal structured cavity and 0 for others;
G—glazing, 1 for non-glazing and 0 for glazing;
I—insulation, 0 for heavy insulation with a thickness near 5 cm or above and 1 for normal insulation.
The average volumetric flow into the solar chimney as a function of PCM temperature was calculated according to the correlation proposed by Afonso and Oliveira [45] (see also Figure 9).
Figure 9. Schematic of SC for Equation (2).
Energies 17 03795 g009
V S C _ T = A o u t 2 β g T c T 0 H f H D h + k i n A o u t A i n 2 + k o u t
where
β—thermal expansion coefficient (1/K),
g—gravity (m2/s),
Tc—temperature in the cavity space (K),
To—ambient temperature (K),
f—wall friction coefficient,
Dh—hydraulic diameter (m),
kin—pressure loss coefficient at the inlet,
kout—pressure loss coefficient at the outlet.
In the case of natural draft volumetric flow into the ventilation duct, the equation below was used [46].
V N D = π D h 2 4 2 g ρ o ρ r h λ l ρ r d h + ξ ρ r 1 / 2
where
ρo—outside air density (kg/m3),
ρr—inside air density calculated according to room temperature (kg/m3),
h—height between outlet and inlet air (m),
λ—Darcy–Weisbach friction coefficient,
l—length of duct or pipe (m),
Tin—room temperature (C).
ρ o = 1.1614 0.00353 ( T o 300 )
ρ r = 1.1614 0.00353 ( T i n 300 )
Furthermore, an additional equation from the literature was used for extracted air flow rates in m3/h by wind turbine ventilators (Equation (4)) [47].
V t v = 0.0185 v w 2 + 11.819 v w 6.3174
where
Vw—wind flow velocity (m/s).
In the case of a combination effect of wind force and buoyancy force, the equation recommended by Walker and Wilson in 1993 was used [47].
V t = V t v 1 / n + V s c _ q 1 / n n f o r   M o d e l   2   if   V t v 1 n + V N D 1 n n < V t v 1 / n + V s c _ q 1 / n n
V t = V t v 1 n + V N D 1 n n   for   Model   2   if   V t v 1 n + V N D 1 n n > V t v 1 / n + V s c _ q 1 / n n a n d   M o d e l   1 , V t = V t v 1 n + V S C _ T 1 n n f o r   M o d e l   3   i f   V t v 1 n + V N D 1 n n < V t v 1 / n + V s c _ T 1 / n n , V t = V t v 1 n + V N D 1 n n f o r   M o d e l   3   i f   V t v 1 n + V N D 1 n n > V t v 1 / n + V s c _ T 1 / n n   o r   T o < 278   K
where
Vt—total volumetric flow (m3/h),
VSC—volumetric flow in the solar chimney (m3/h),
n—equal to ½ for large openings.
The total volumetric flow was calculated based on the superposition method. It assumed both the wind force and buoyancy force occurrence. In the case of buoyancy force, this was created based on simple indoor and outdoor temperature differences (ambient and room temperature) or by the additional influence of the solar chimney effect. Total volumetric flow was a function of air pumped by the wind turbine ventilator and buoyancy force (natural draft) for Model 1. This was also true in the case of Model 2 in the case of the absence or weak influence of solar radiation (see Equations (3), (6) and (7)). If the total volumetric airflow created by buoyancy force in the solar chimney and wind turbine ventilator was larger than in the case of the previous assumption, then the volumetric flow needed to be calculated for Model 2 regarding Equation (8) (see also Equations (1) and (6)). For Model 3, total volumetric flow was a function of wind speed and temperature from a stable low-temperature heat source (see Equations (2), (6) and (8)). However, if the volumetric flow calculated by the assumption for Model 1 was higher, that value was also set for Model 3. The presented logic was implemented into Modelica. The process is schematically presented on the flow chart in Figure 10.

2.2.2. Simulation of Passive Ventilation by Objected-Oriented Modeling

For modeling the year-round operation of different passive ventilation systems, objected-oriented language was used. The special programming procedure was prepared by using Modelica software version 3.2.3 (see Figure 11). Modelica Buildings Library Version 8.1.3 and Modelica Standard Library Version 3.2.3 were used to build the model.
All systems (Model 1, Model 2, Model 3) were analyzed for typical weather conditions throughout the year. Climate data were provided for selected cities in different geographic regions and climate zones in Europe according to Energy Plus weather (see Figure 12). The locations were chosen according to two assumptions. Firstly, they covered different urban areas in Europe located in different climate zones. However, the main factors that influenced the decision were the maximum and minimum air temperature (see Figure 13). The second factor was wind speed and wind stability (see Figure 14). It should be also noted that all the presented urban areas (cities) were located in countries that belong to the European Economic Area.
Figure 12. Geographical distribution of the selected European cities (map was created in Matlab version 2022a according to the geographical position presented in Google Maps).
Energies 17 03795 g012
Figure 13. Air shape temperature maps: (a) maximum, (b) minimum [48].
Energies 17 03795 g013
Figure 14. Average wind speed in Europe [49].
Energies 17 03795 g014
Calculations were made for changes in solar radiation, ambient temperature, and wind speed, with a time step of 0.5 h. The presented simulation covered 8760 h of the year from 1 January to 31 December. A constant room temperature equal to 297 K (24 °C) was assumed. Furthermore, the constant temperature of mass accumulated in the chimney (PCM) was set as equal to 323 K (50 °C). The solar chimney technical dimensions were H = 2 m, θ = 90°, w = 1 m, d = 0.075 m, and l = 3.5 m. As the reference value for the calculation was set, the recommended minimal amount of volumetric flow range by hour was equal to 128 m3/h. This value was calculated regarding the average area of the apartment in the EU (assumed to be 96 m2) and average height (assumed to be 2.65 m) [47]. Then, the final volumetric flow rate was calculated according to the typical apartment volume and typical minimal value of air change per hour for Europe, which is 0.5−1 [50].

3. Results and Discussion

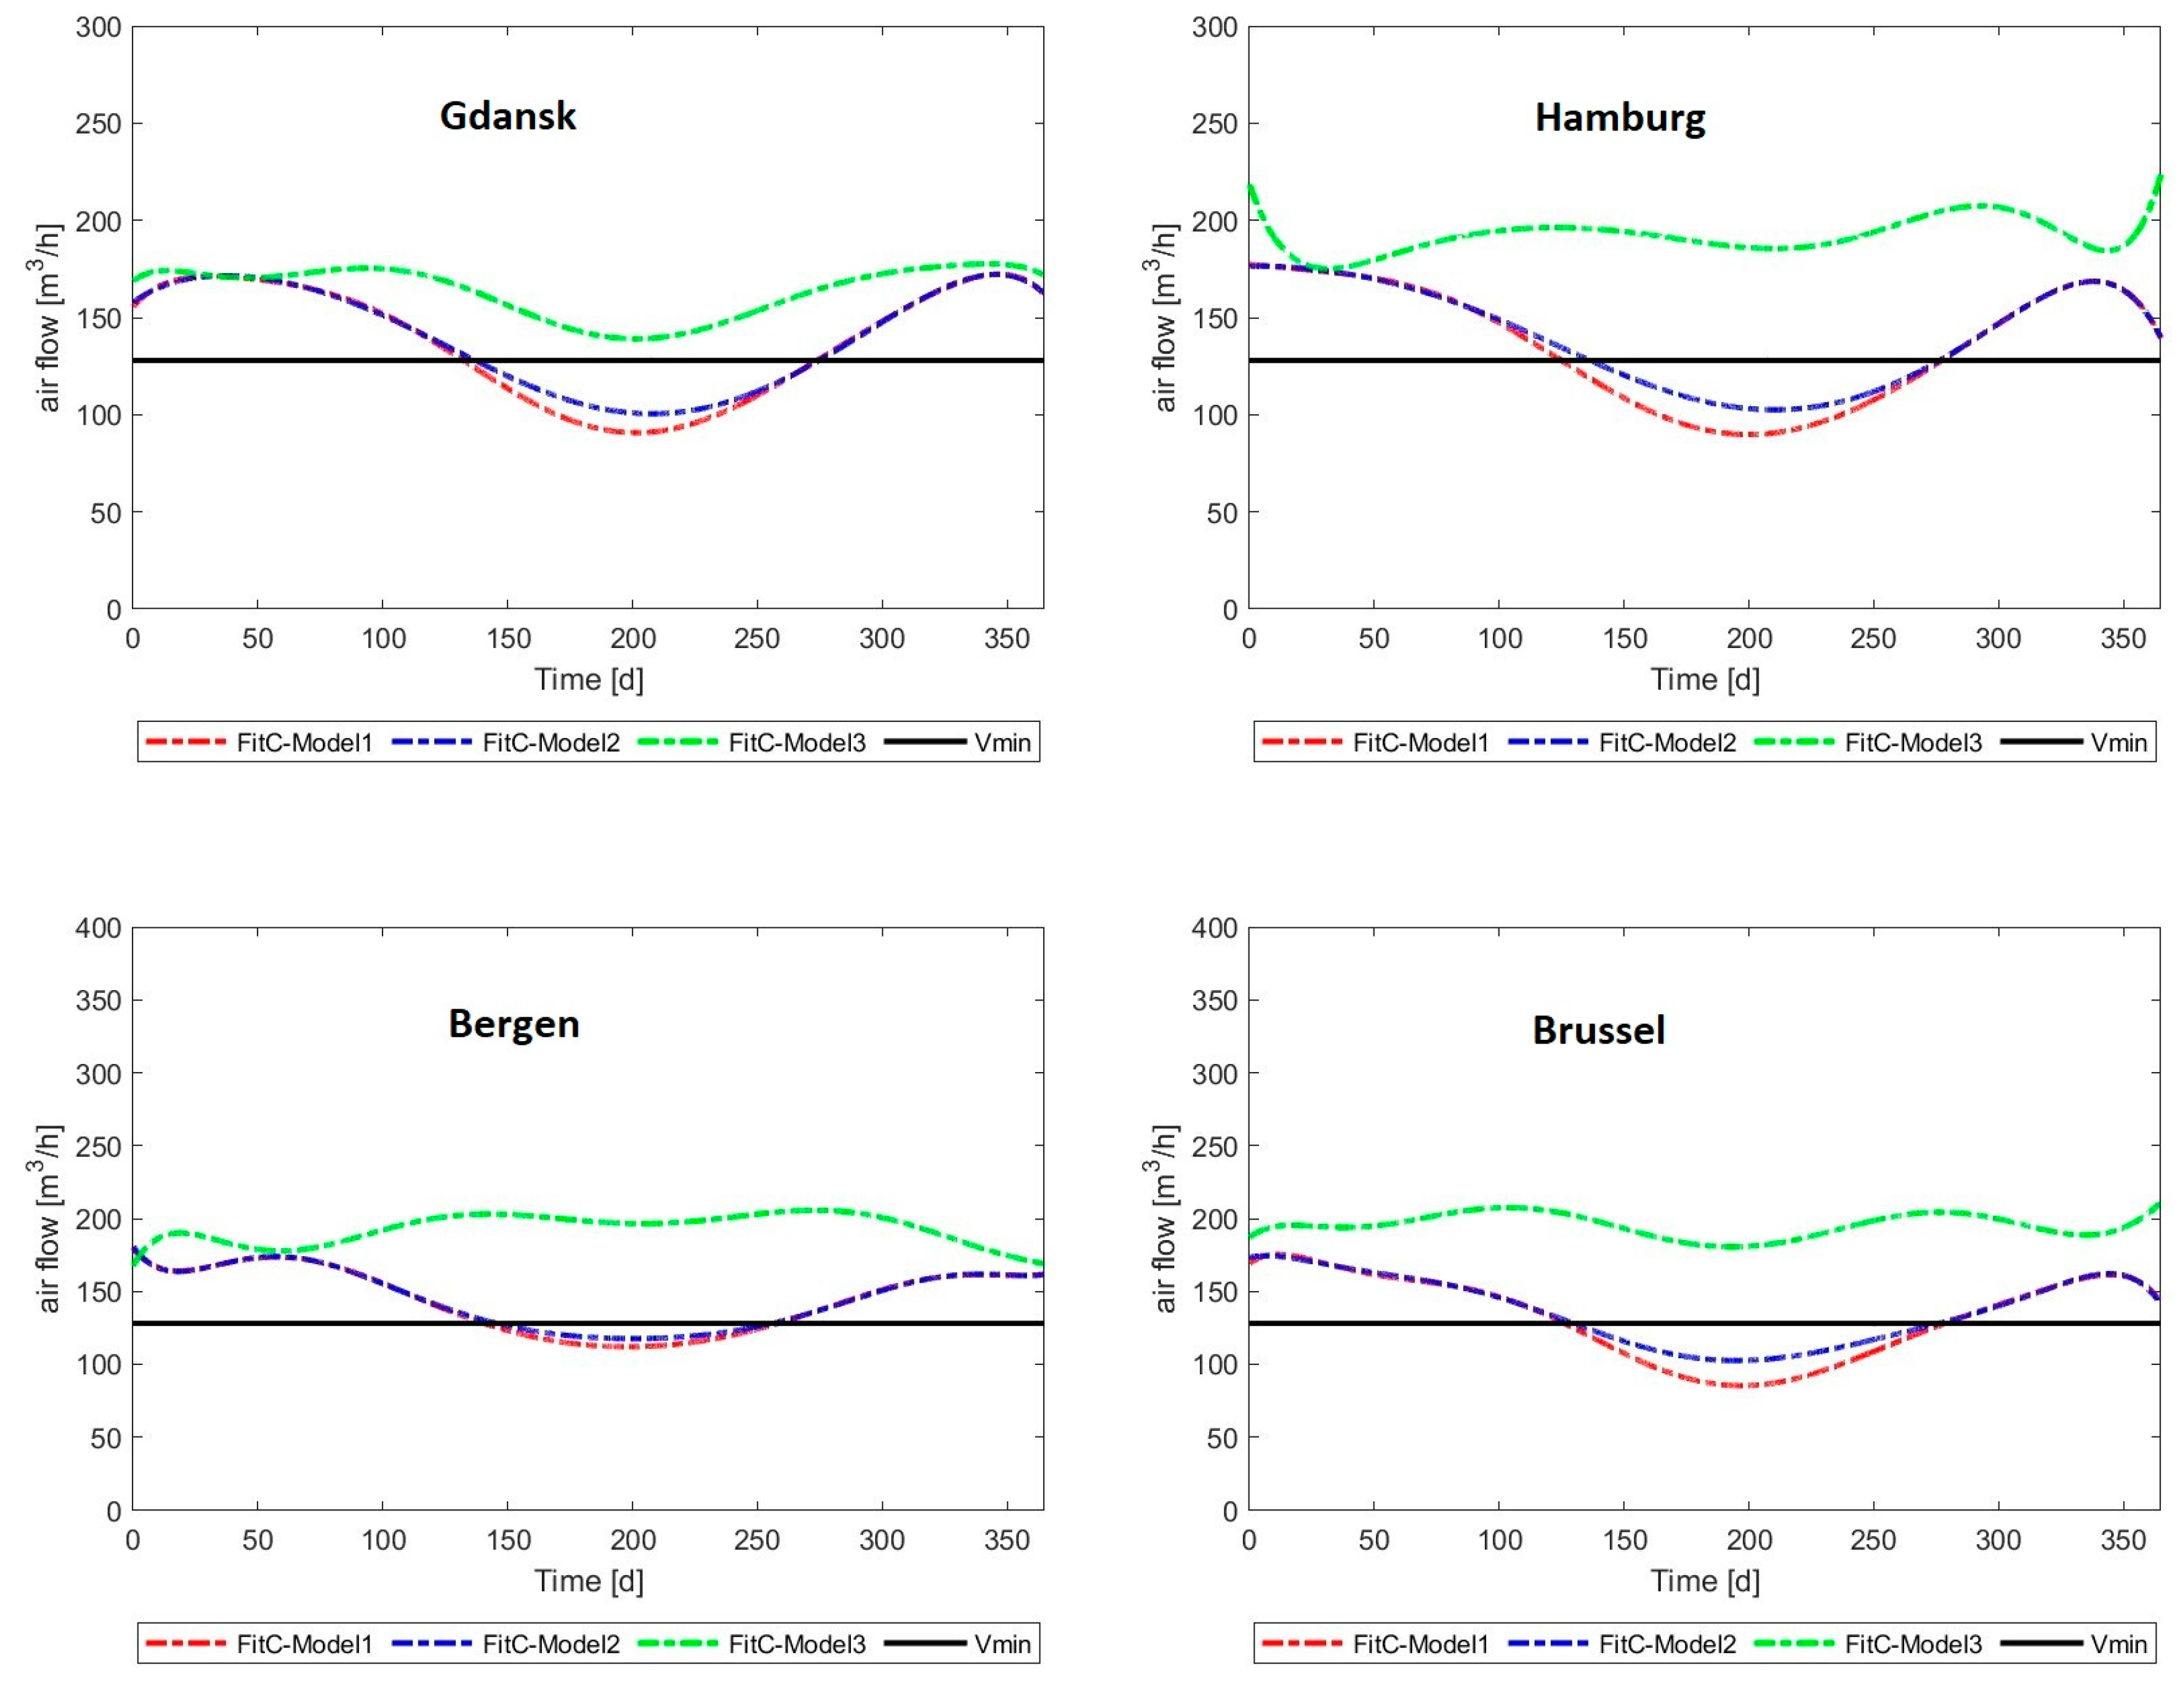
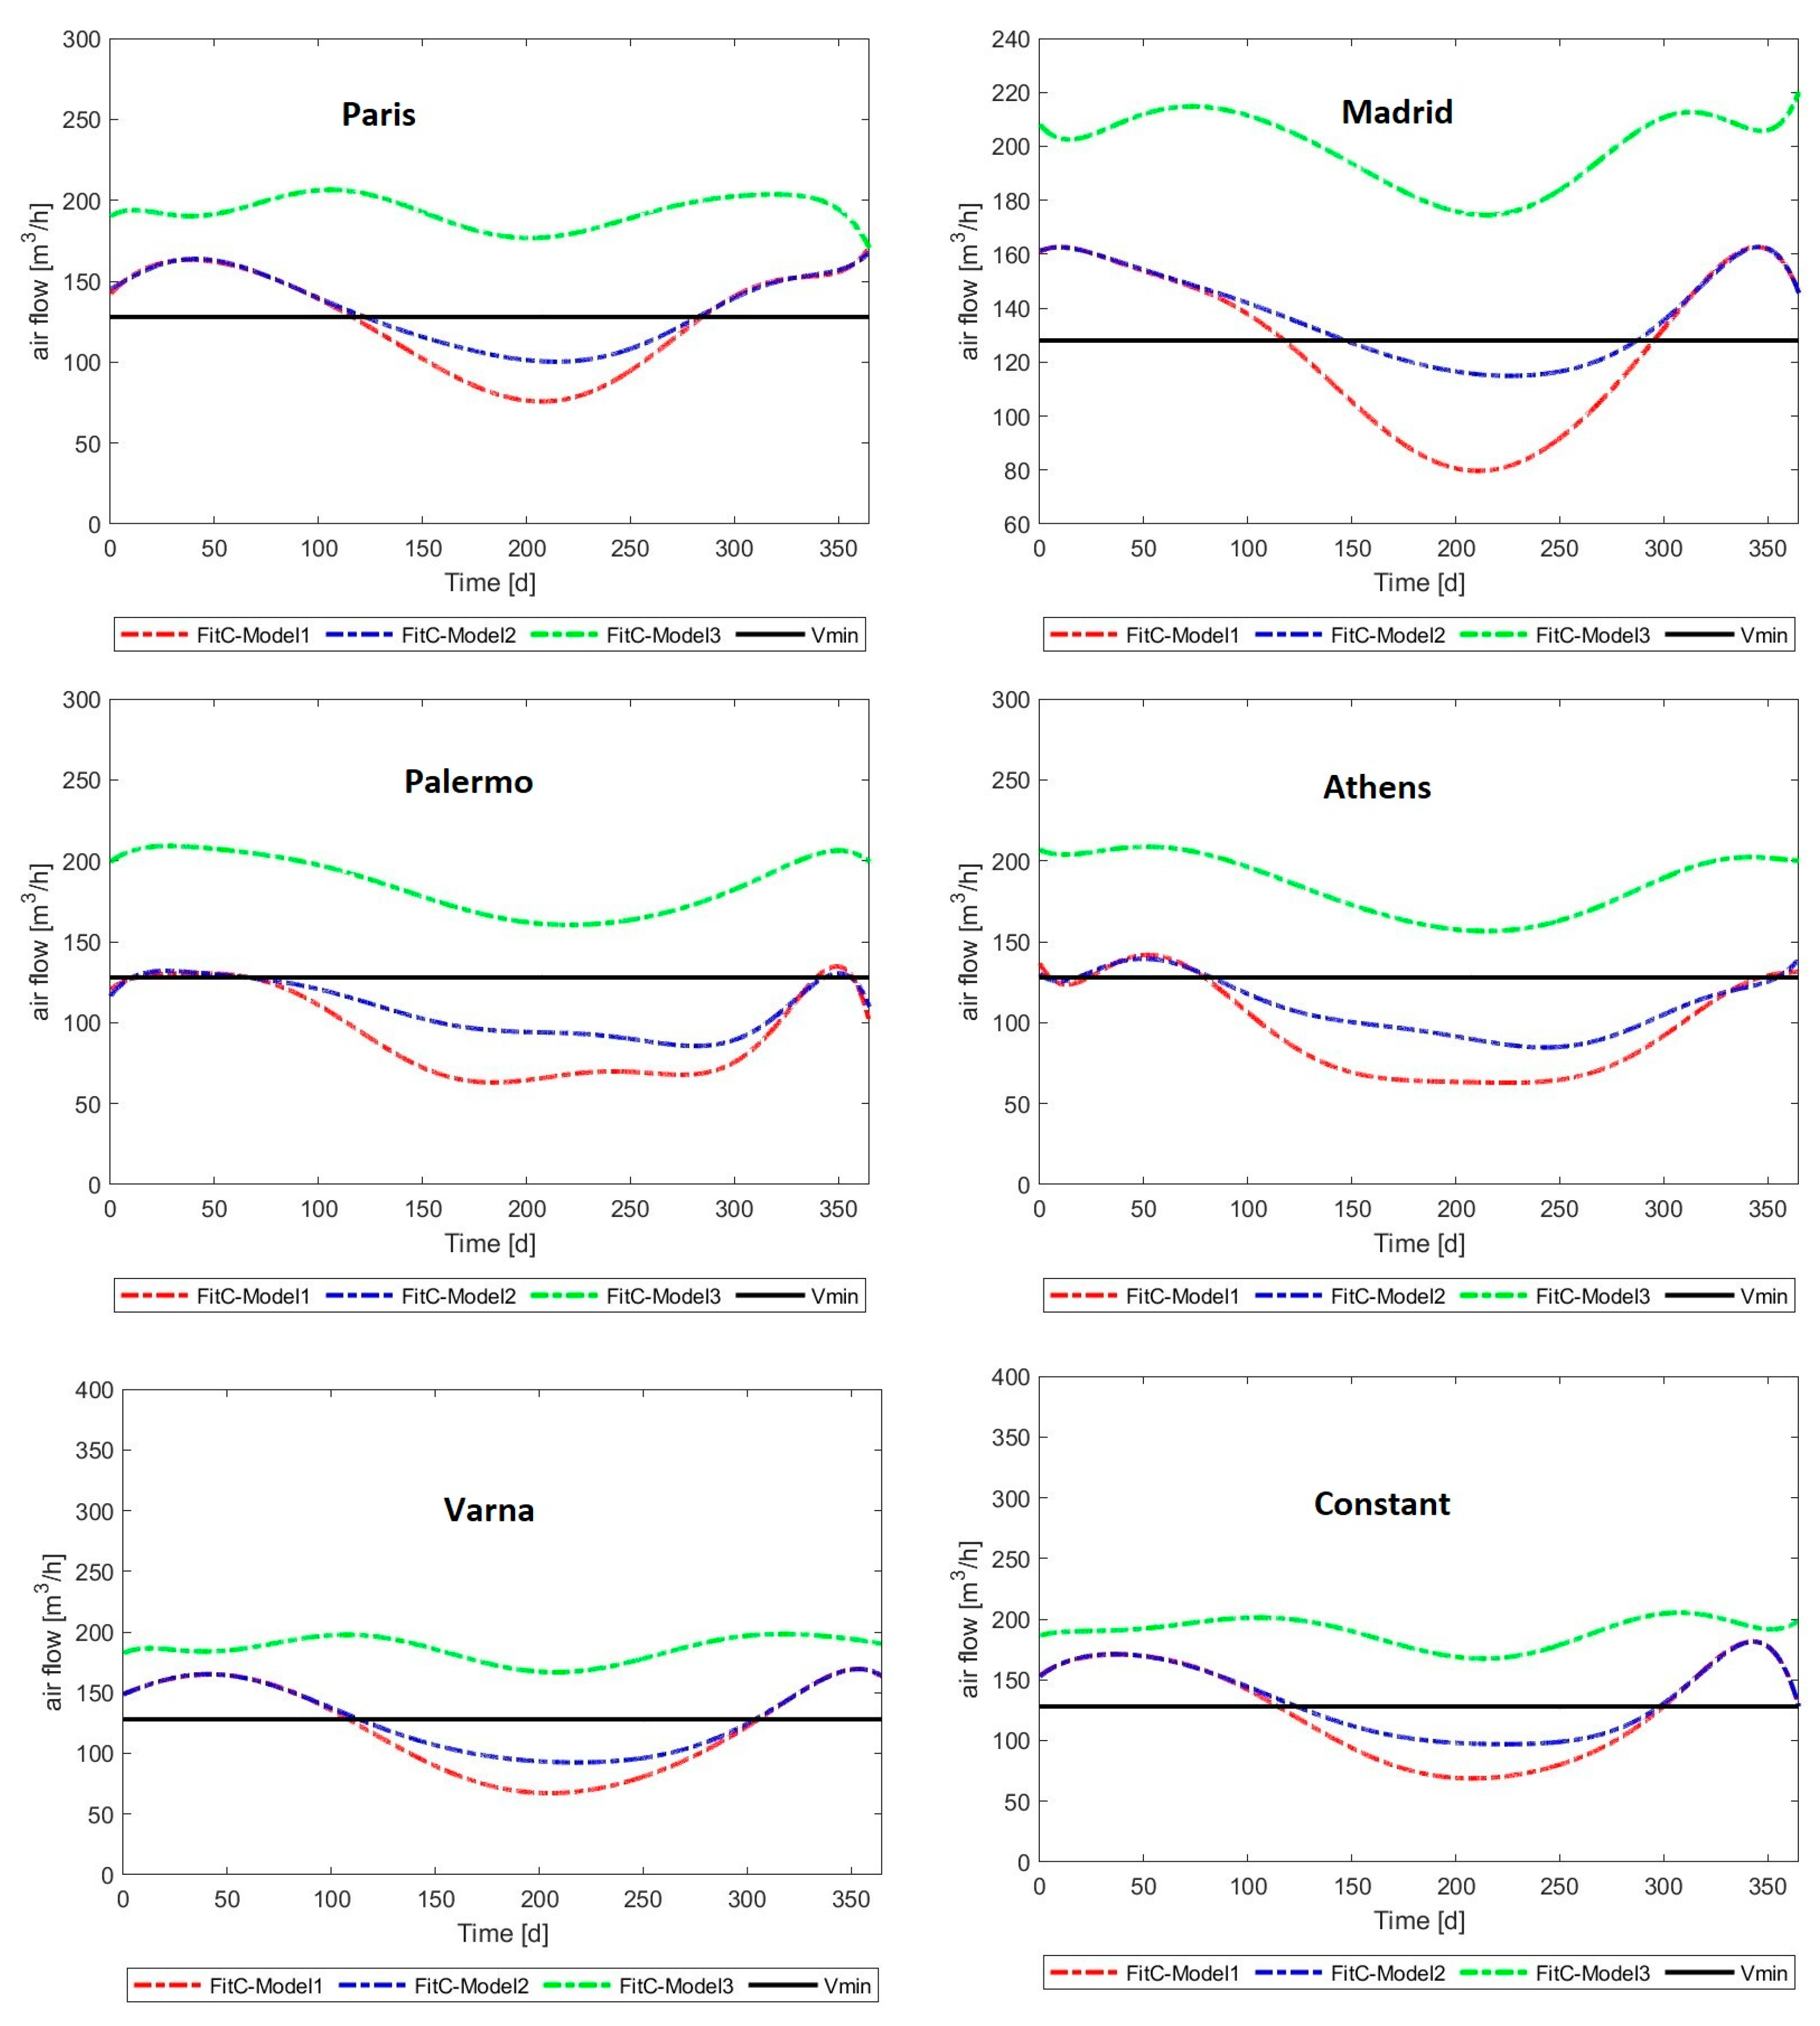
3.1. Potential of Using Different Passive Ventilation Technologies in Selected European Locations

The average percentage times in which the minimum required volume flow of fresh air could be provided by using approaches of Model 1, Model 2, and Model 3 are presented in Table 2.
Based on the results of the simulation, it can be noted that the passive ventilation system integrated with a wind turbine ventilator and solar chimney assisted by PCM (Model 3) has the biggest potential. Such a system could provide the required amount of fresh air for more than 99% of the time in all presented locations. In the case of passive ventilation supported by a wind turbine ventilator (Model 1), this has the biggest potential in cold regions of Europe (e.g., North Scandinavia, Benelux countries). However, even in these regions, the system can operate properly for about 60% up to 74% of the time. For the southern part of the continent, e.g., Sevilla, Athens, and Palermo, the system could provide the required amount of fresh air for not more than 20% of the time. The system with an additional solar chimney (Model 2) operated significantly better, but without PCM mass and based only on solar radiation availability. The differences between the results obtained for Model 1 and Model 2 for colder countries were not larger than a few percentages. For the cities located in the southern part of Europe, the difference could be significant (e.g., for Palermo, more than ×2).

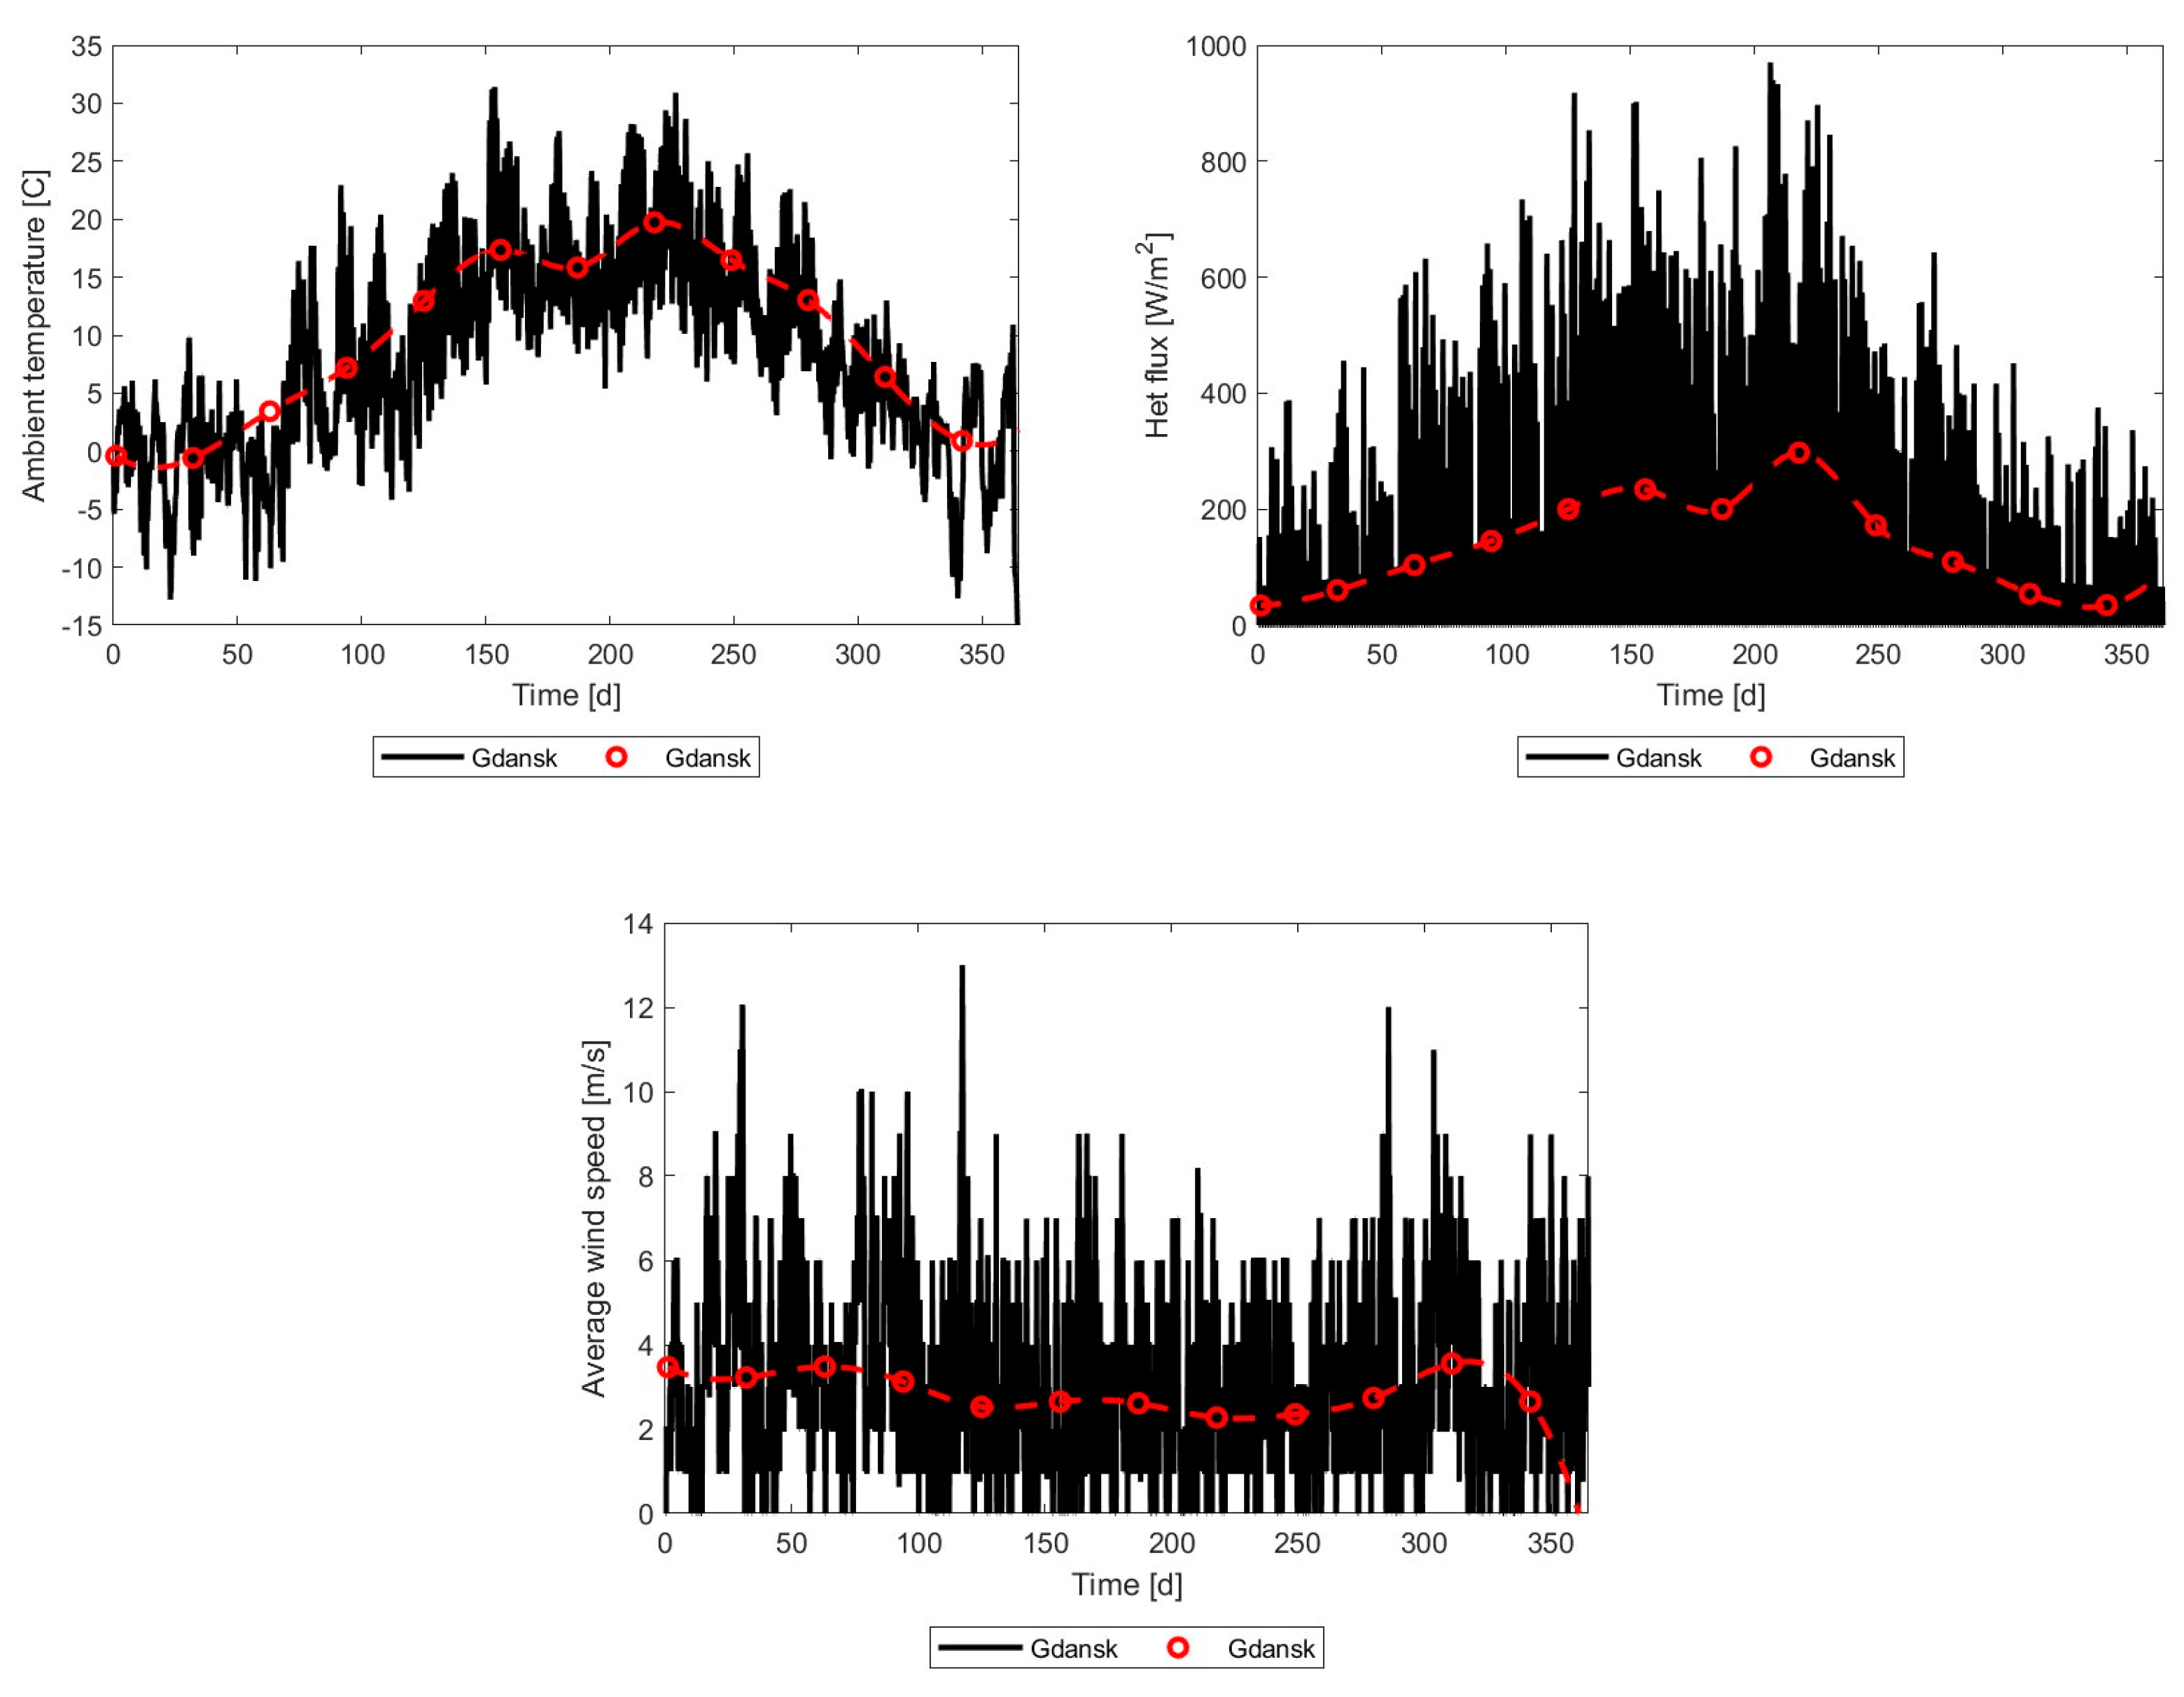
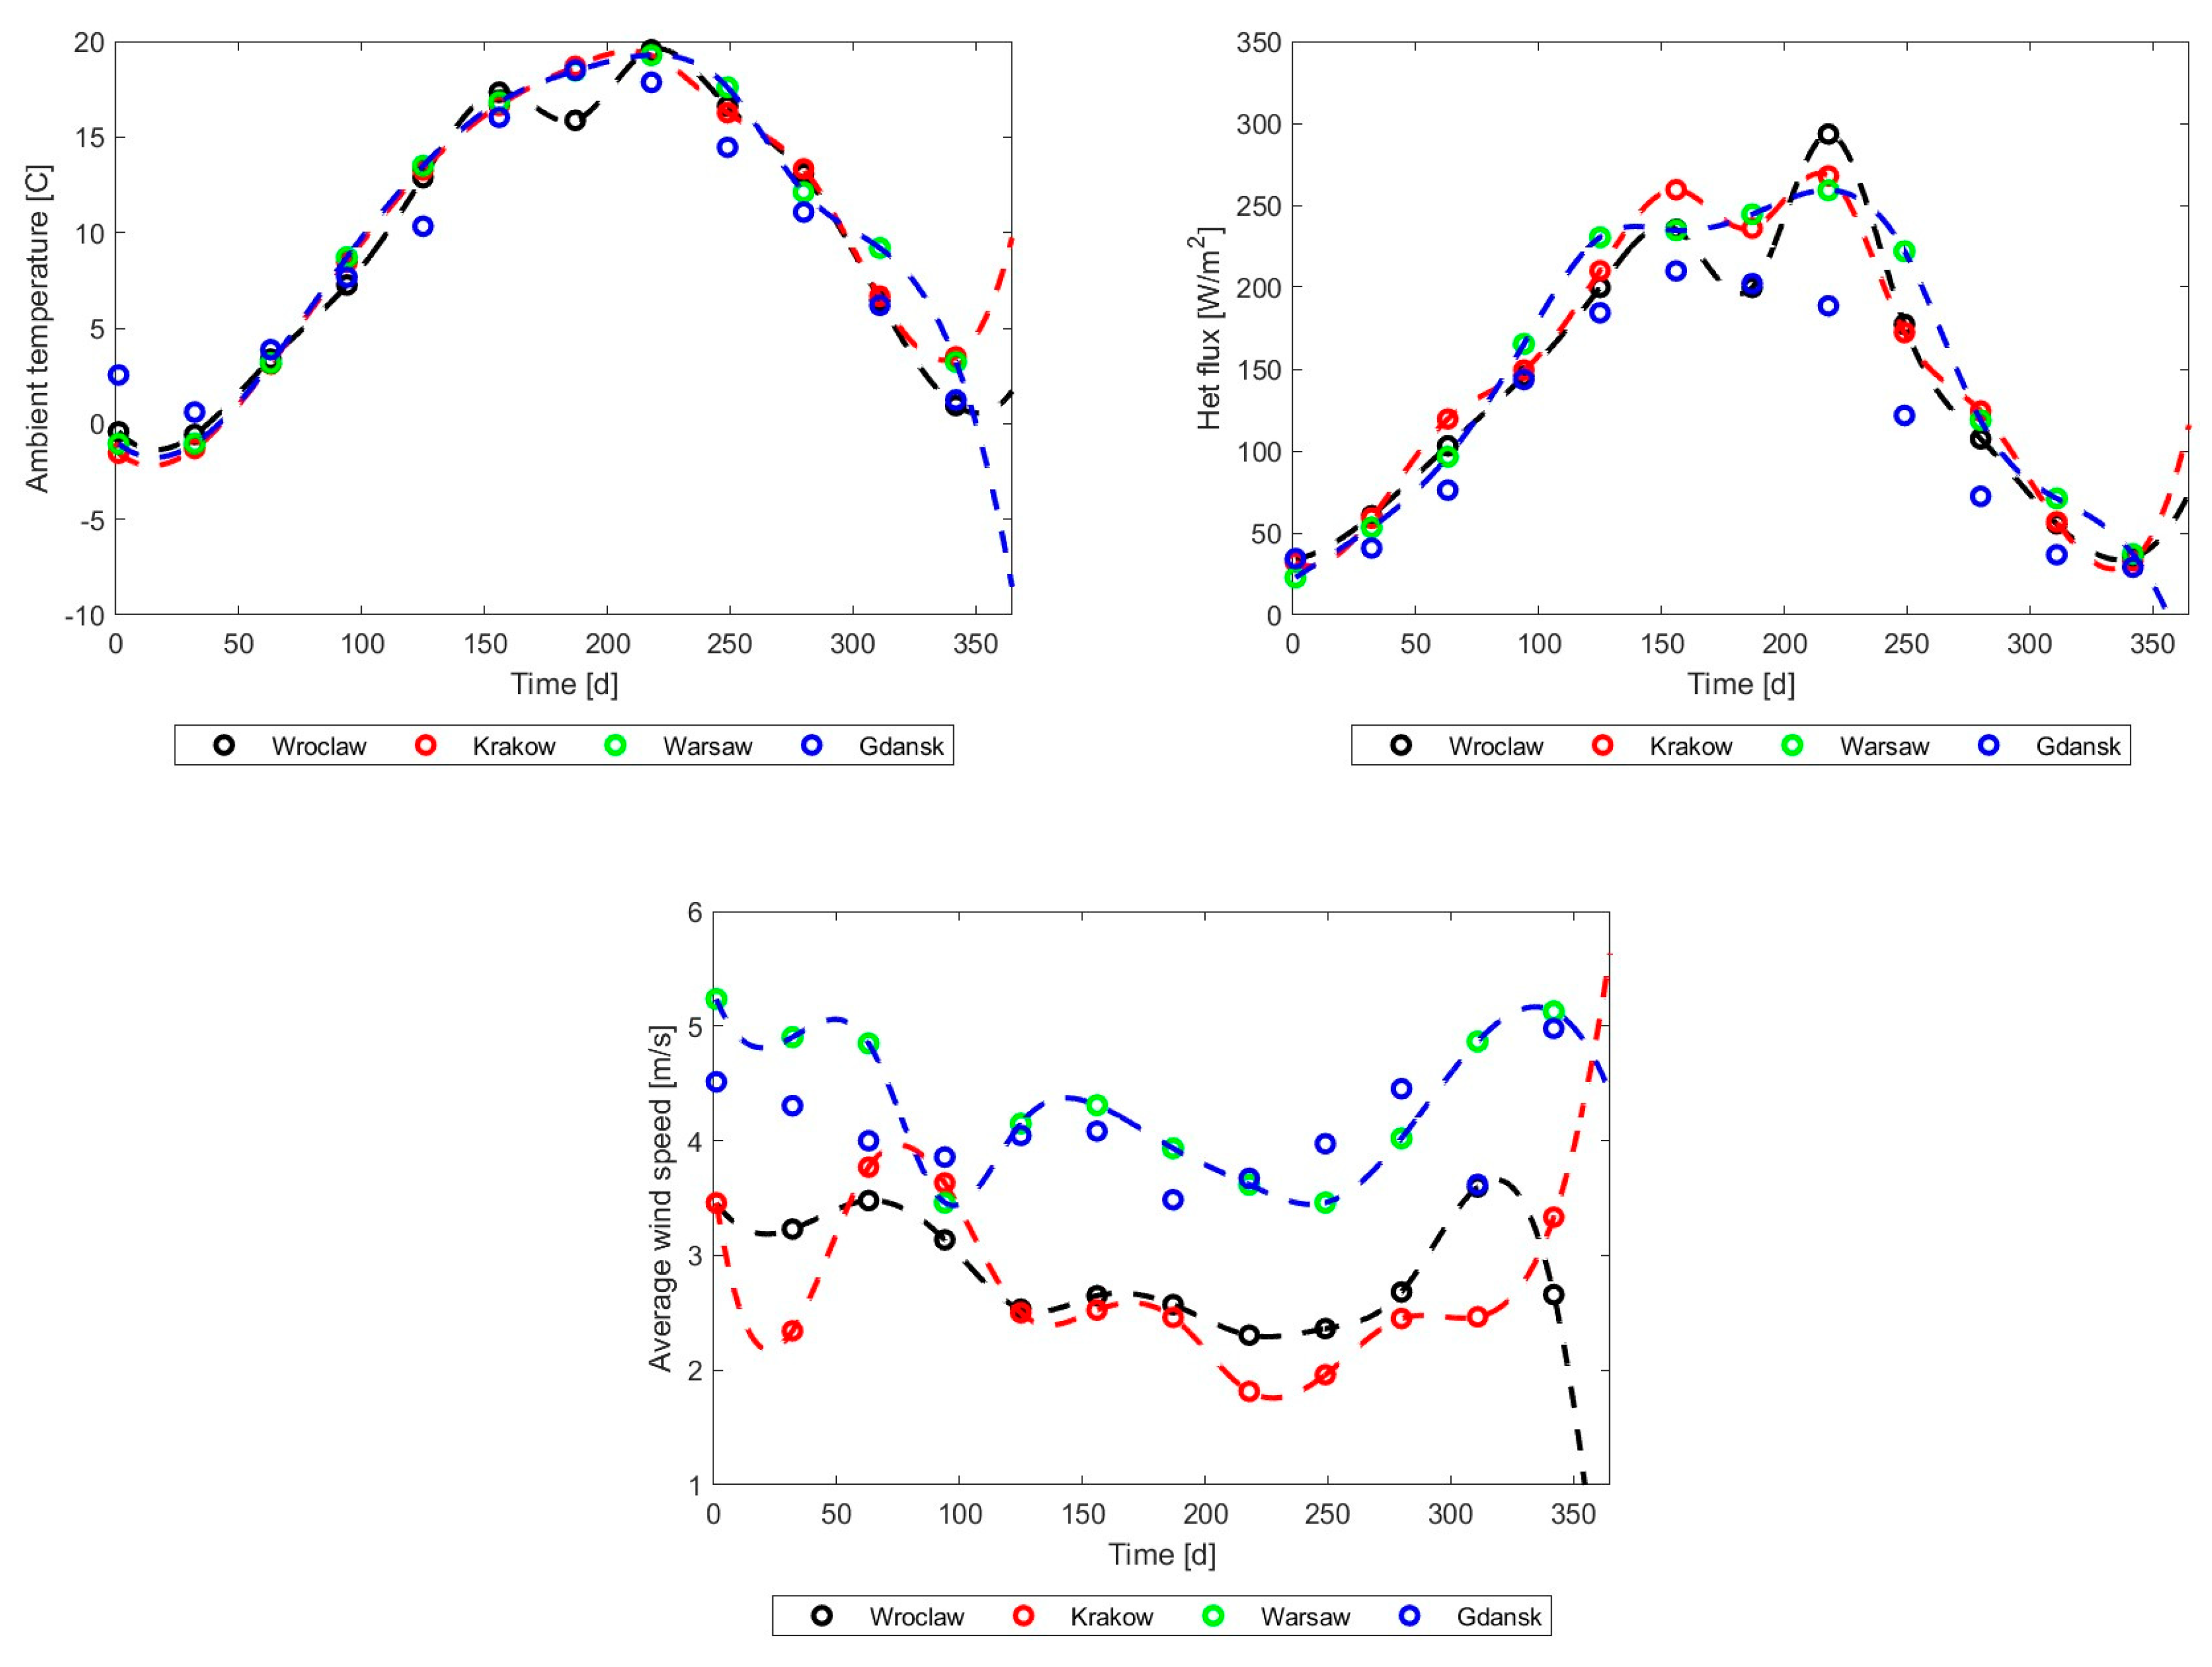
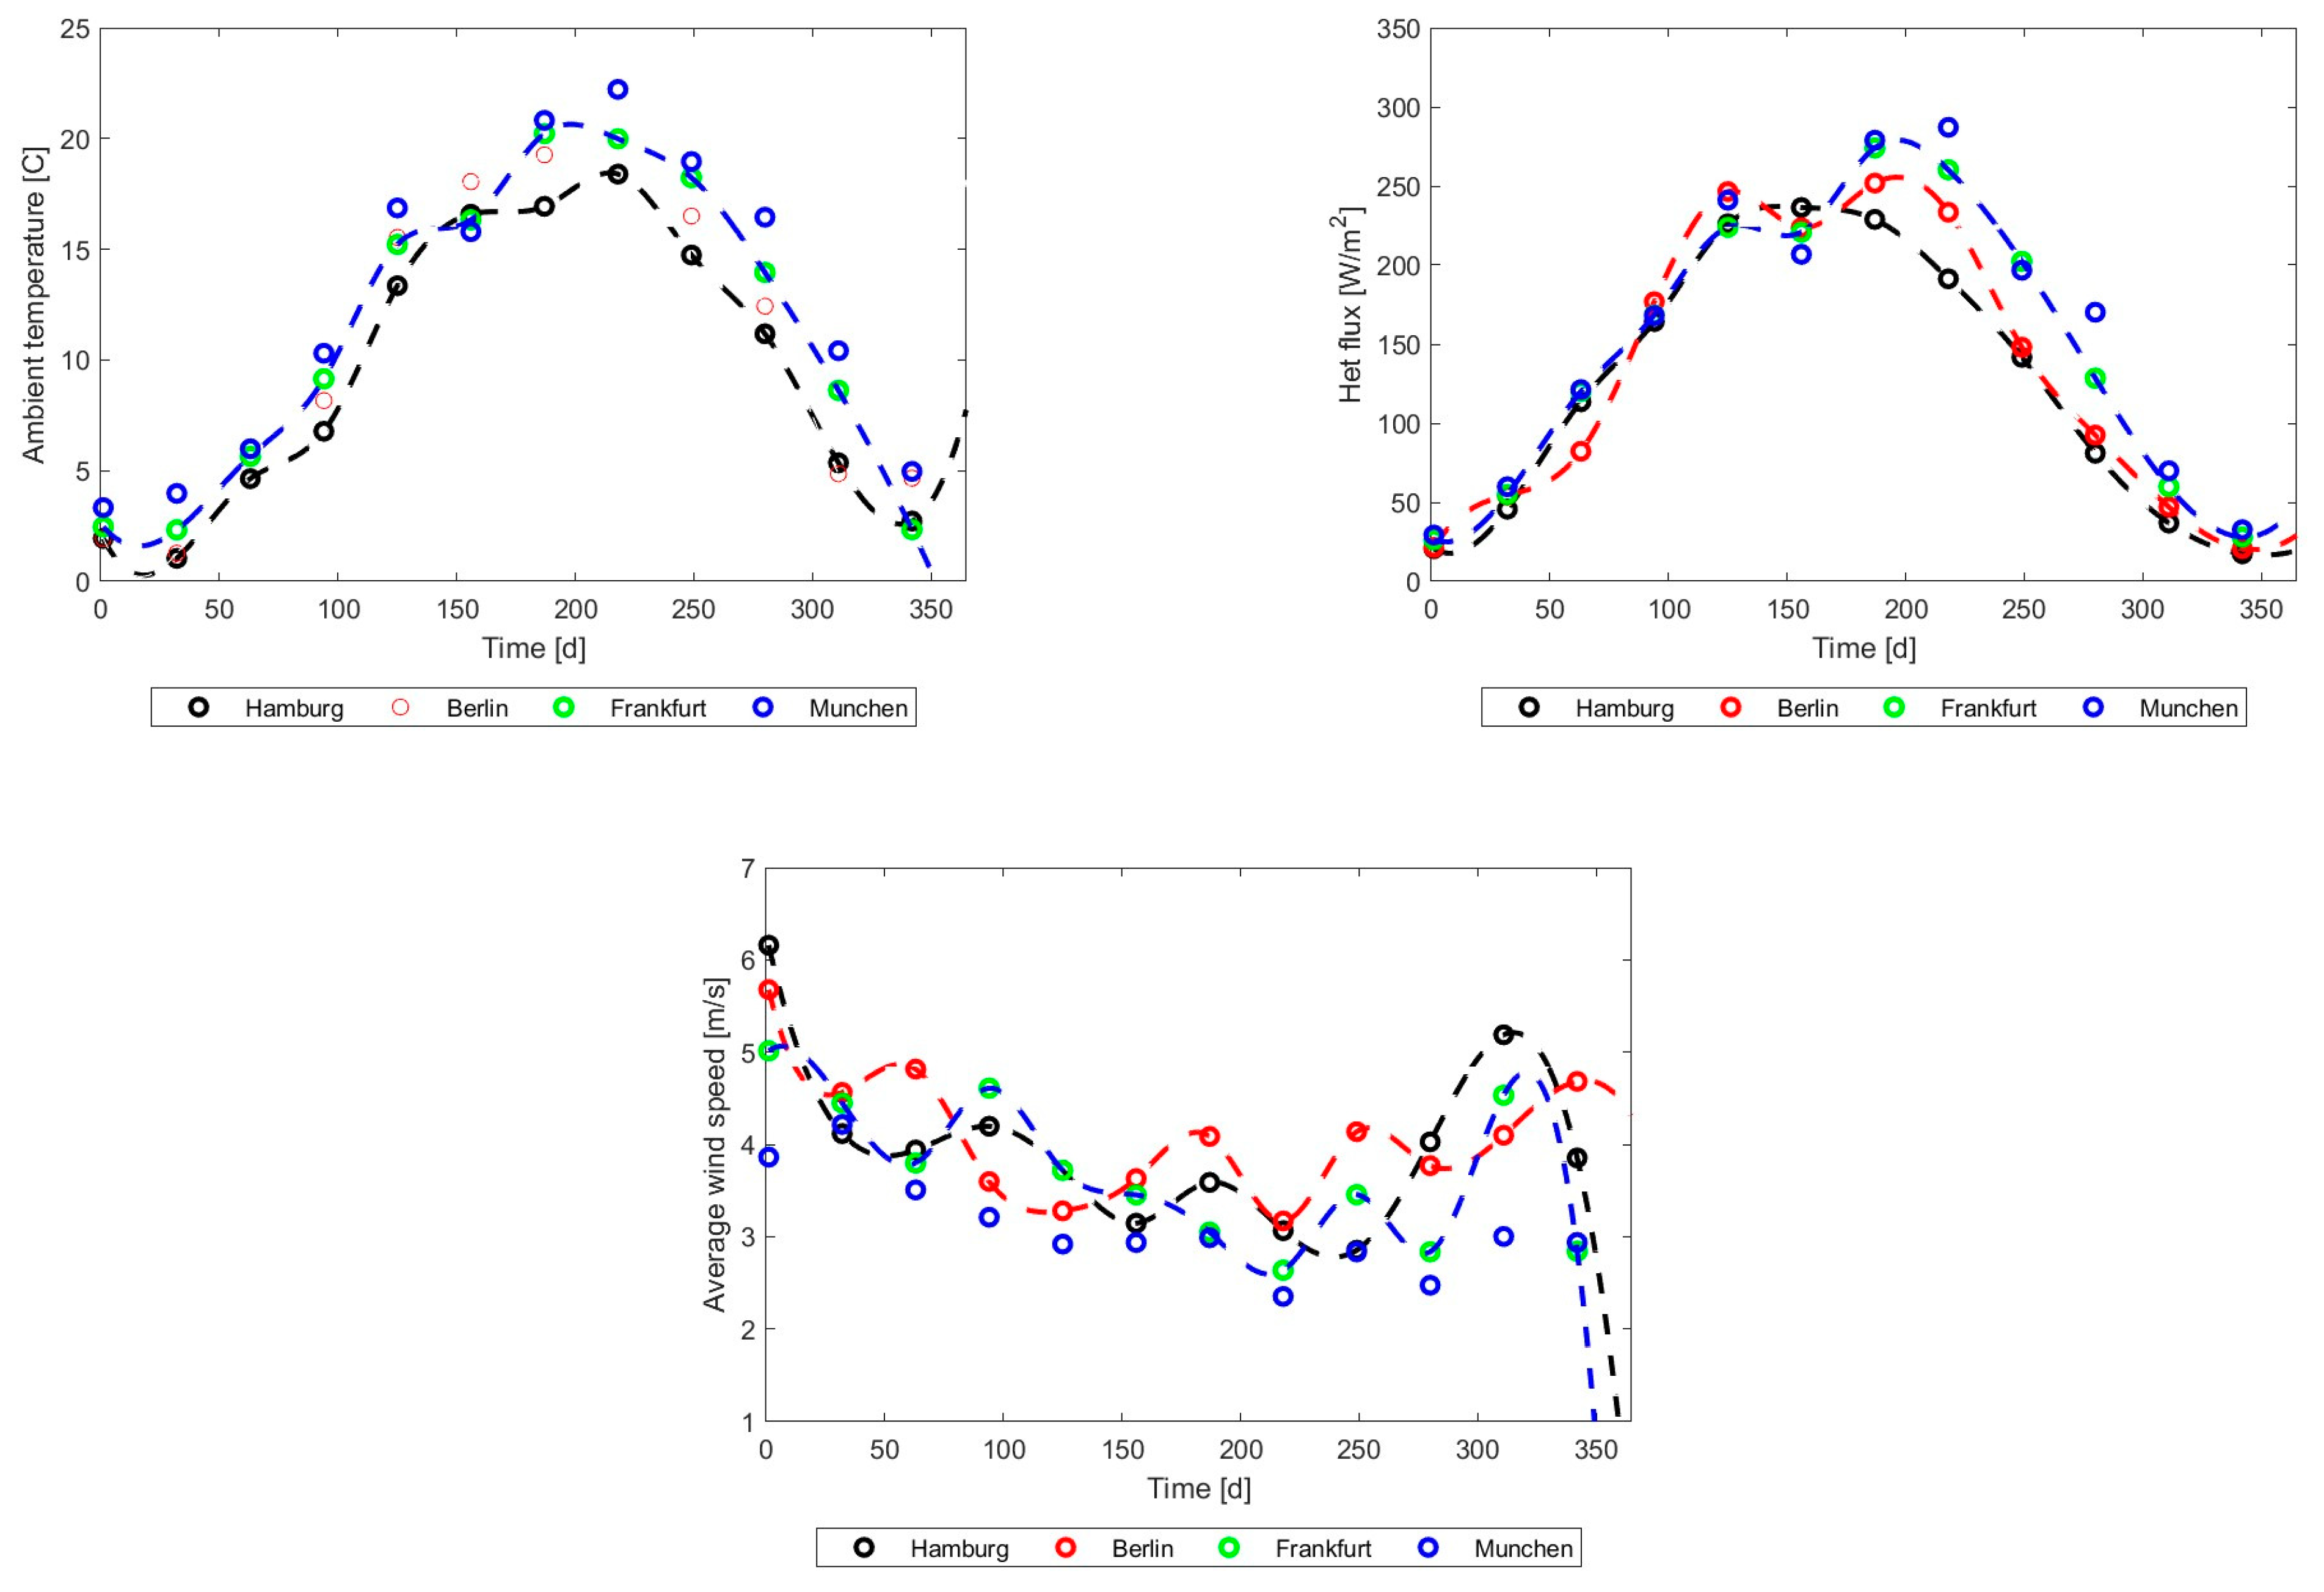
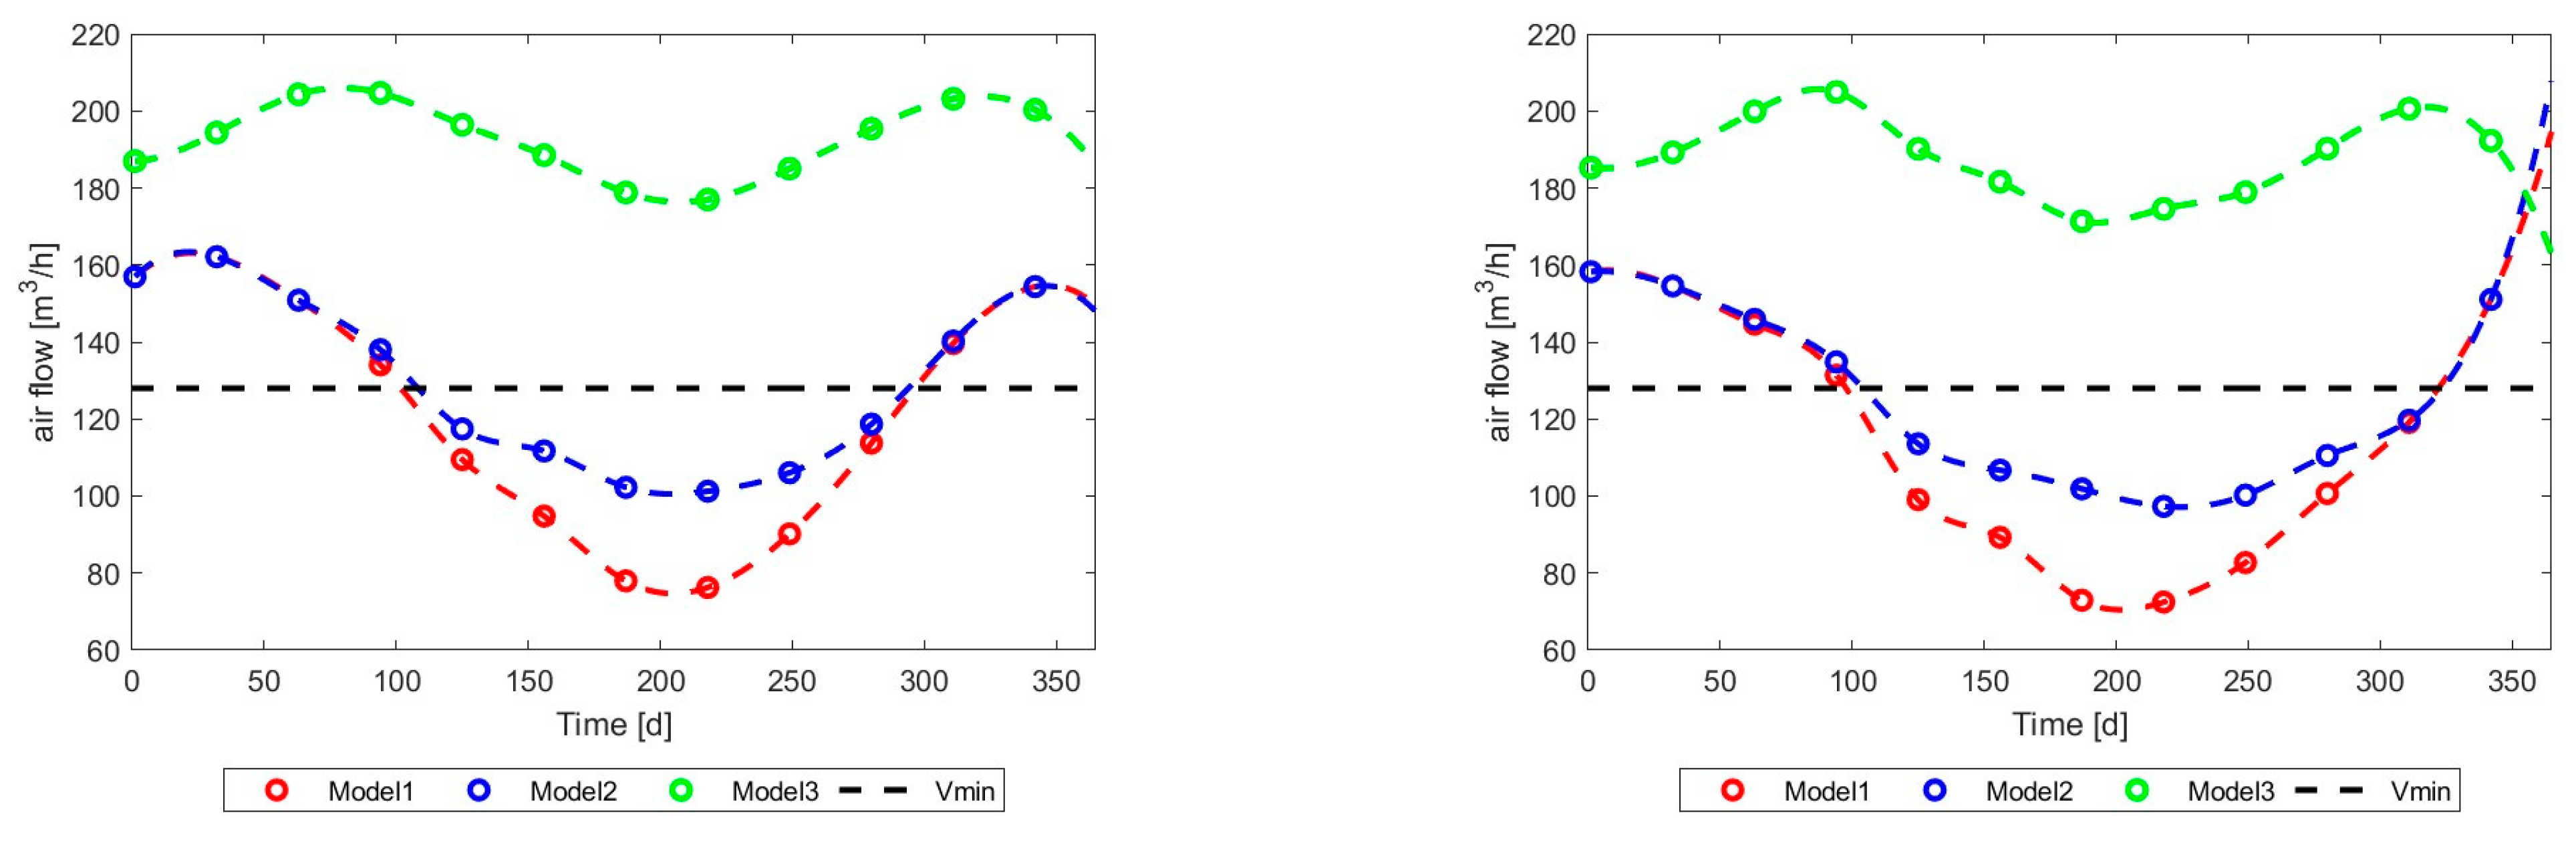
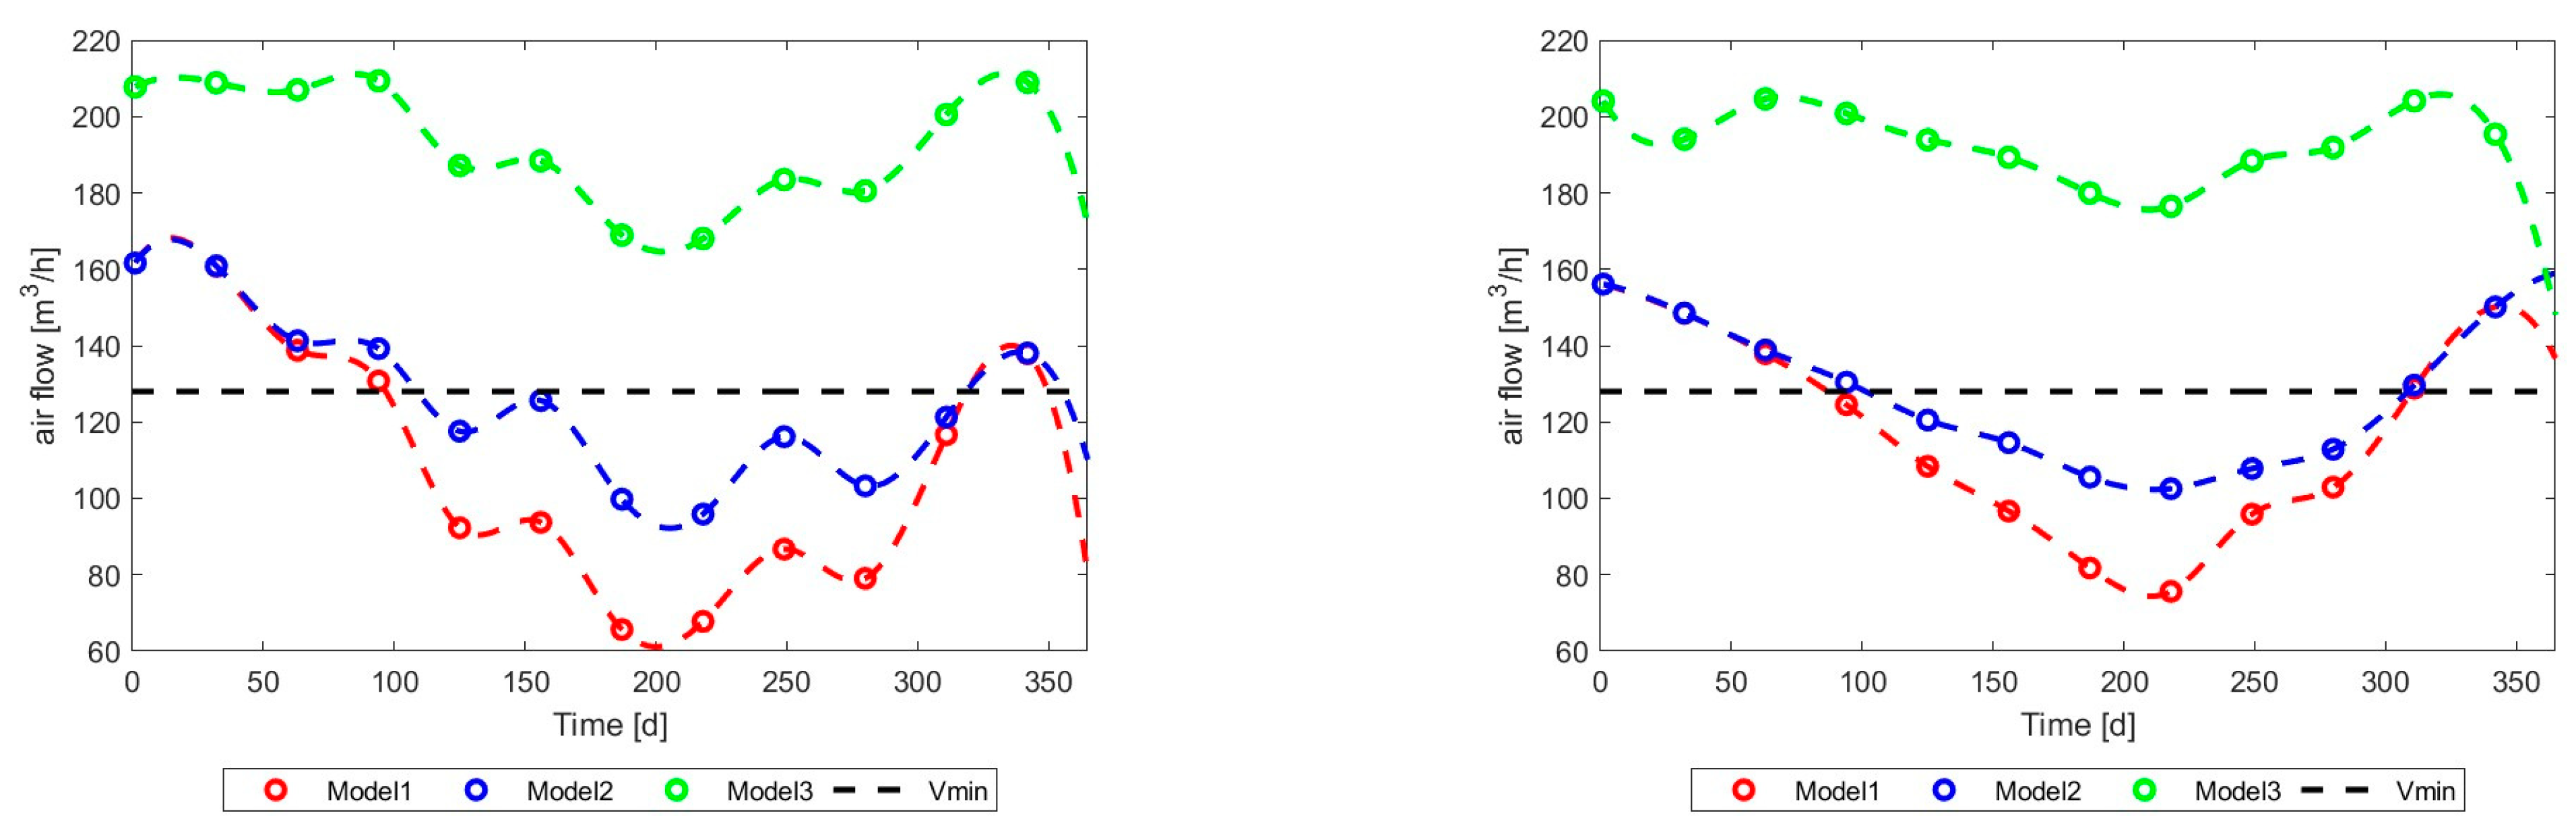
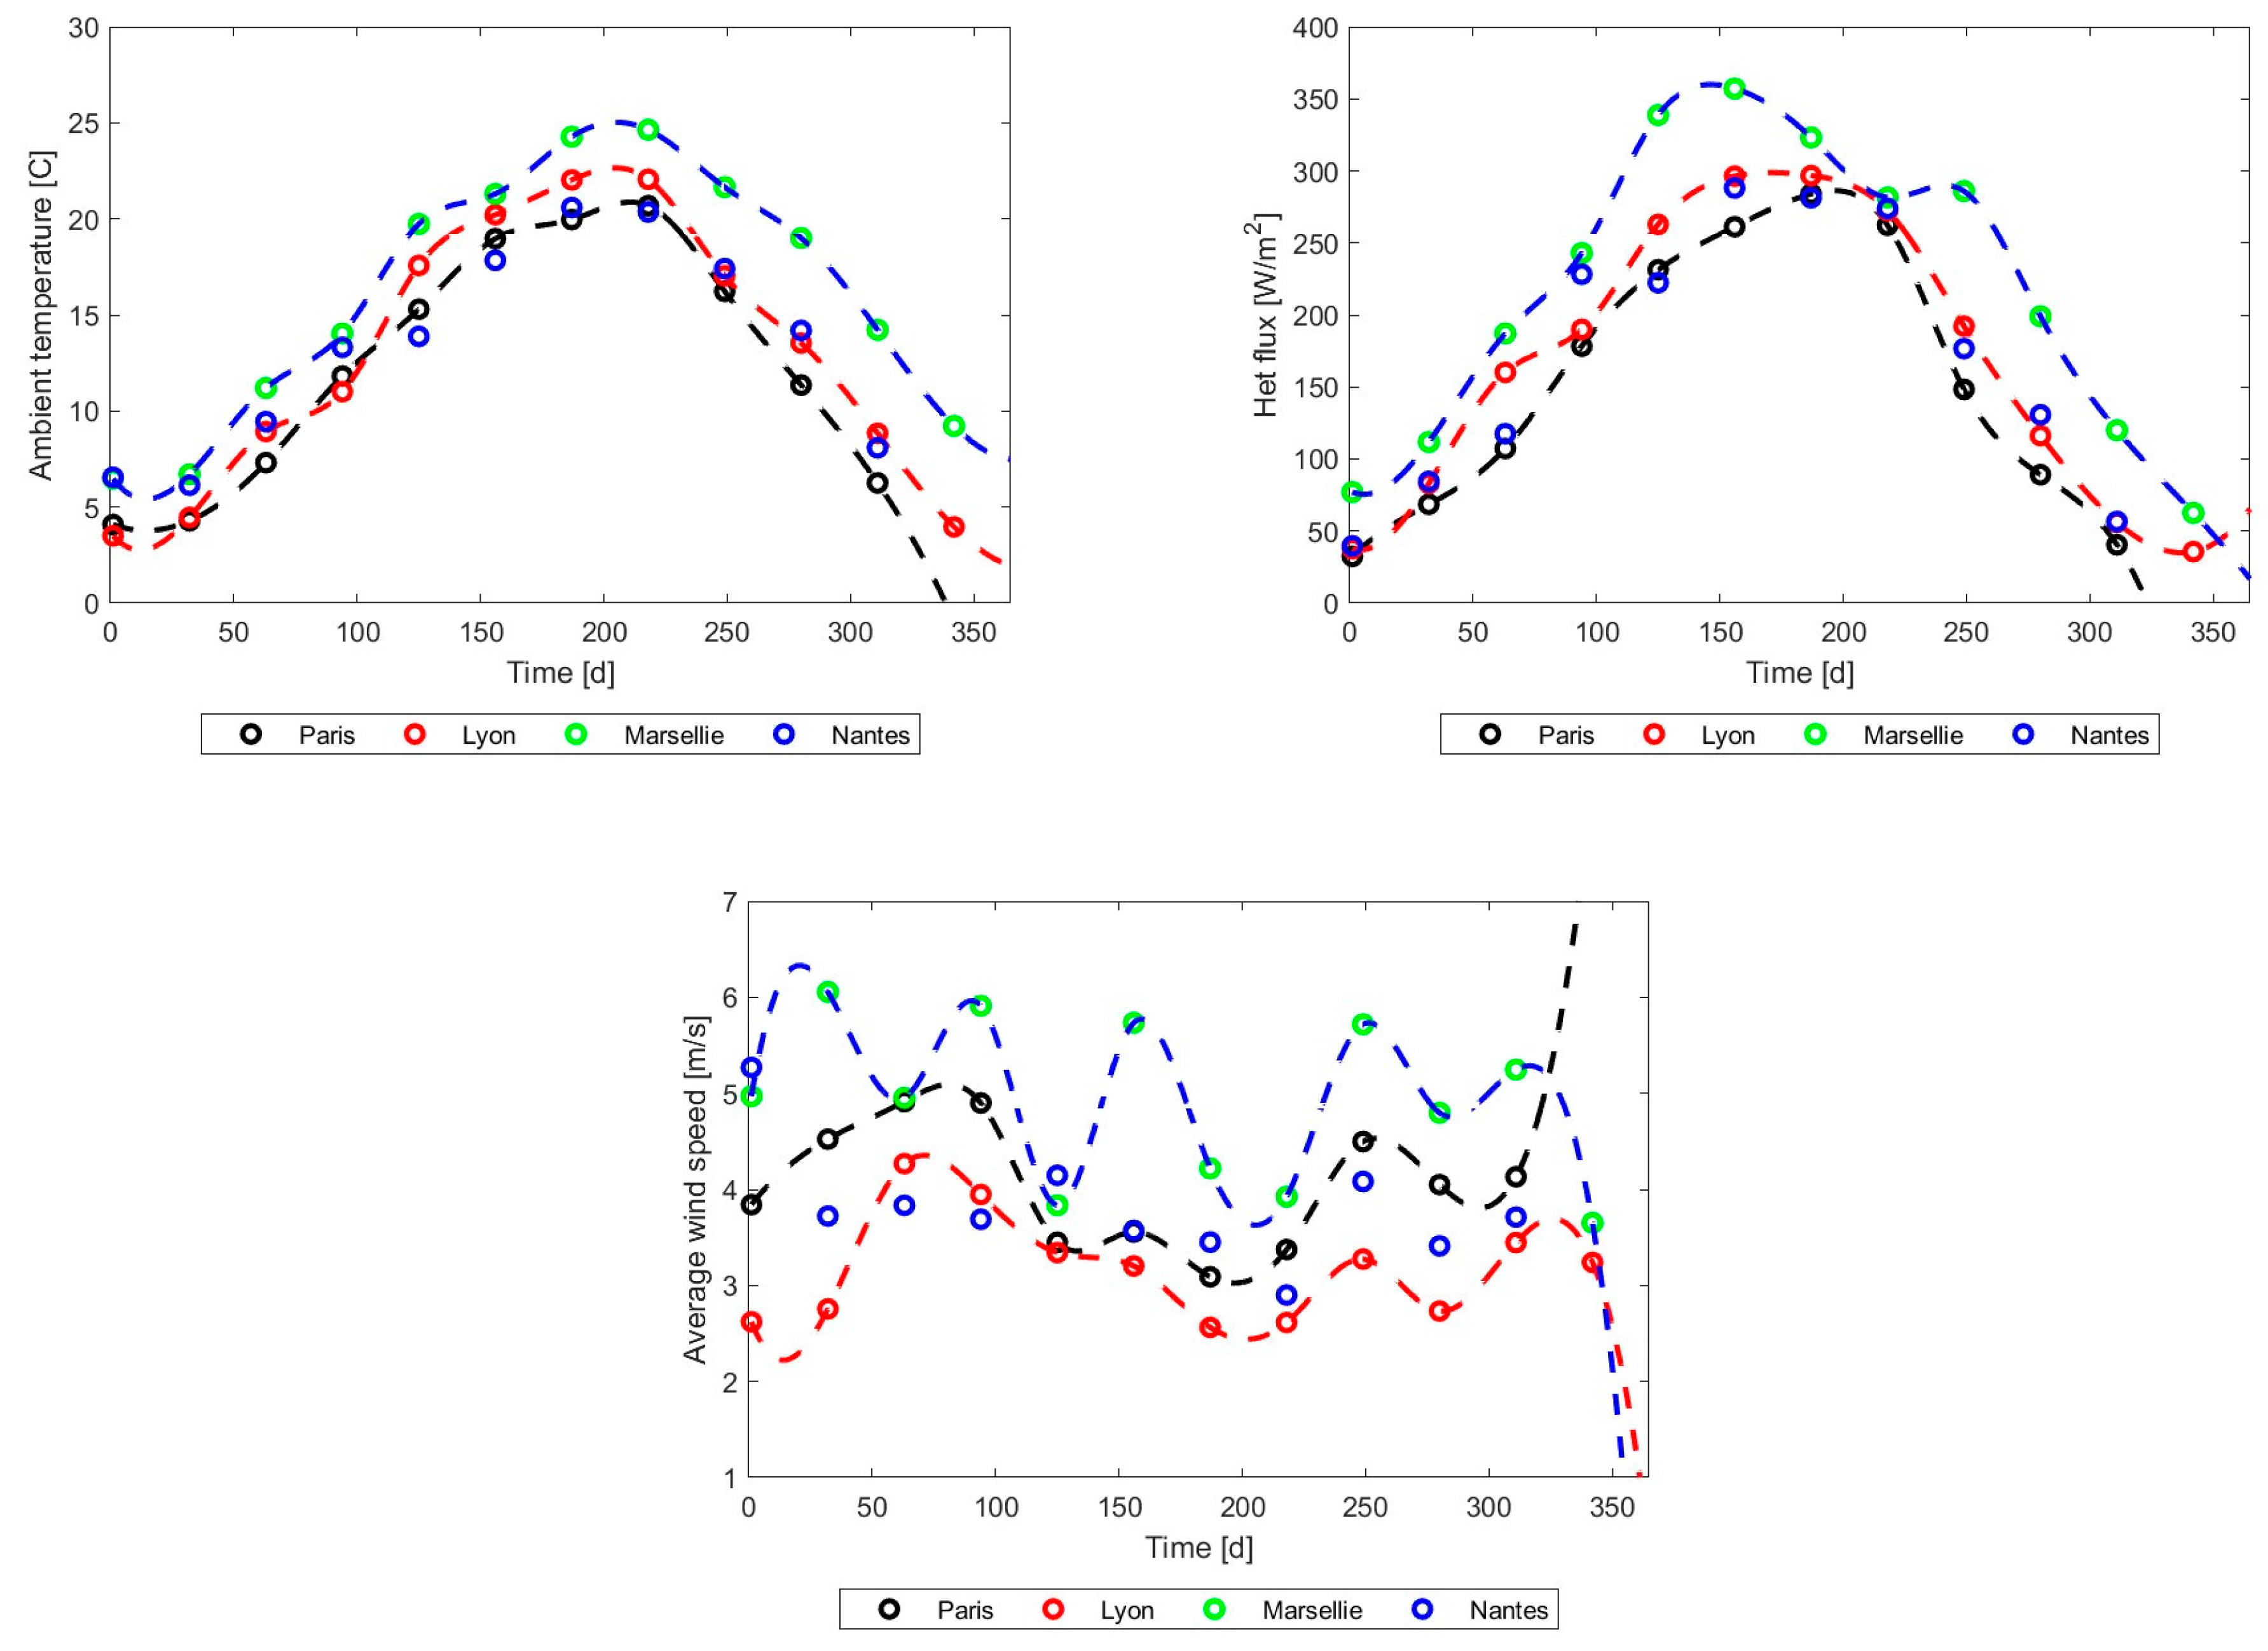
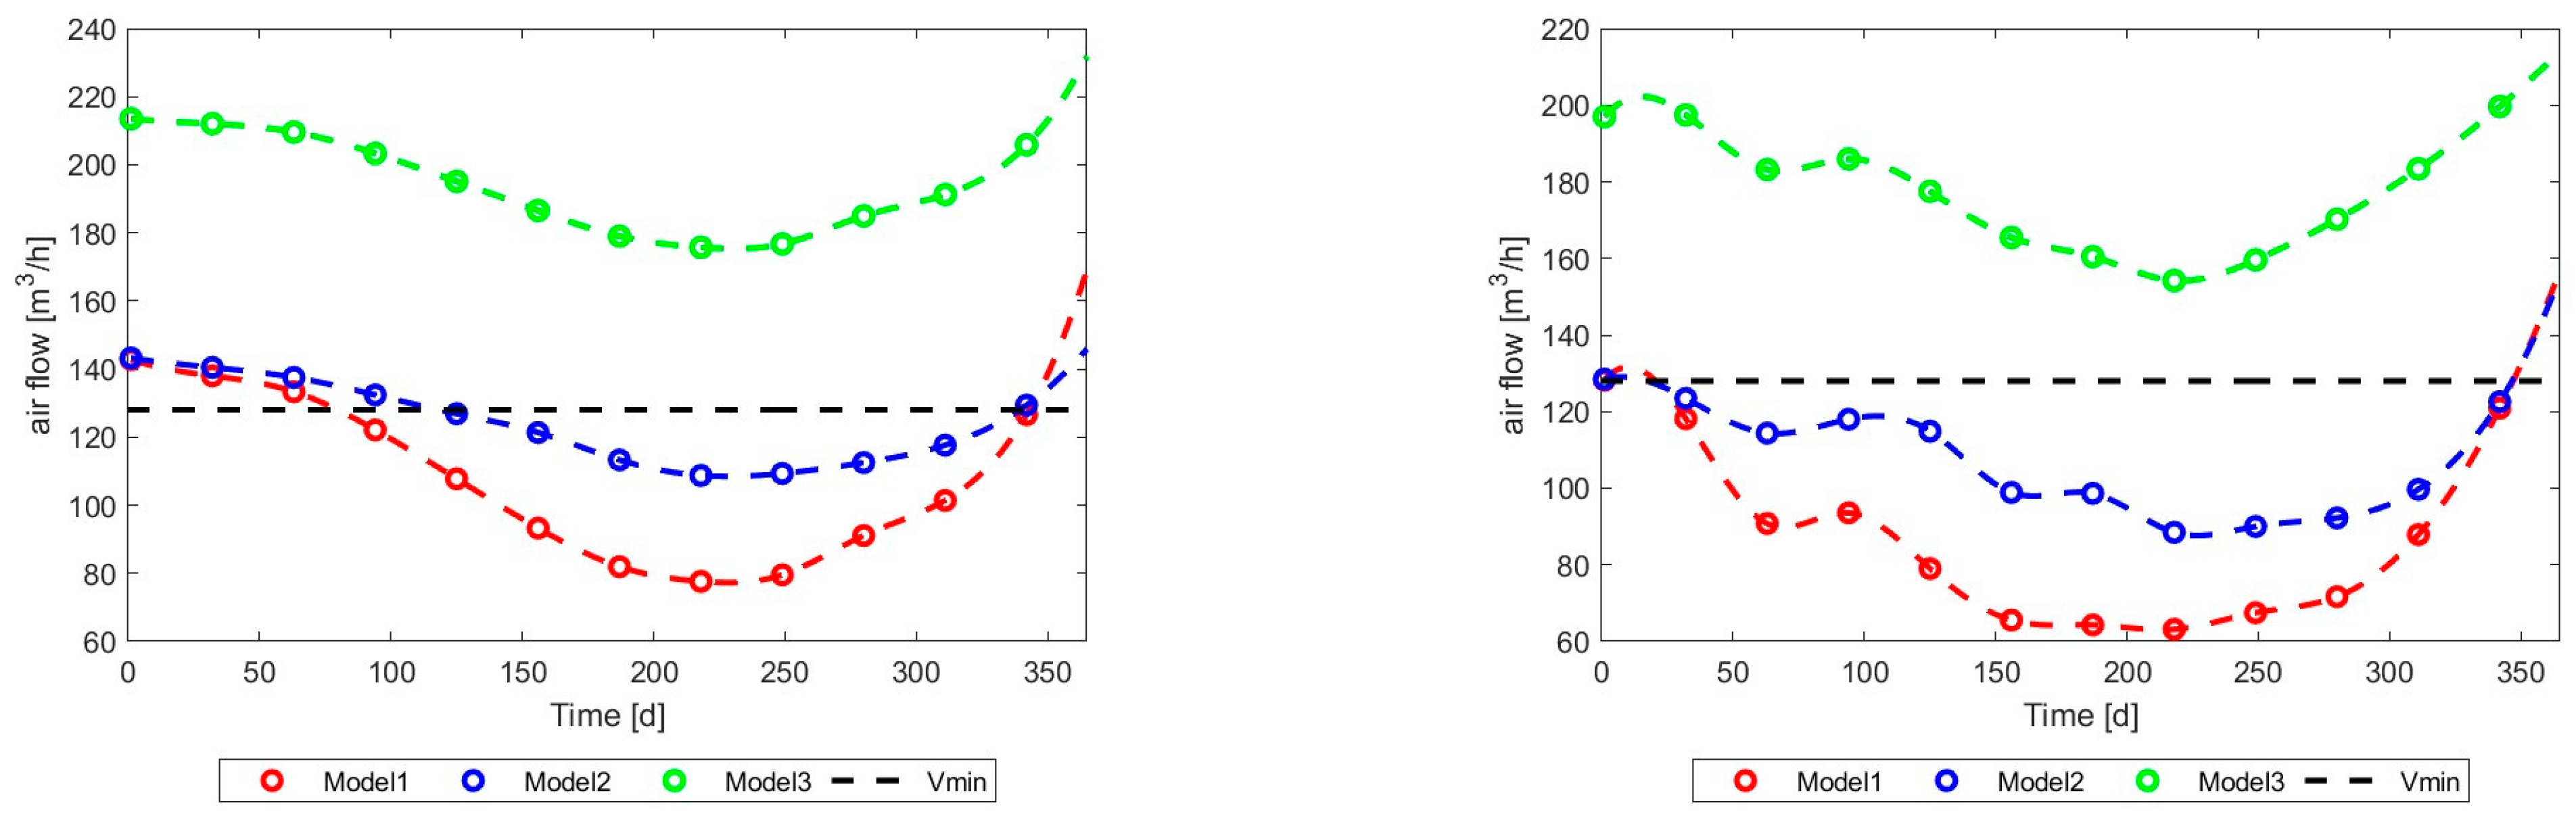
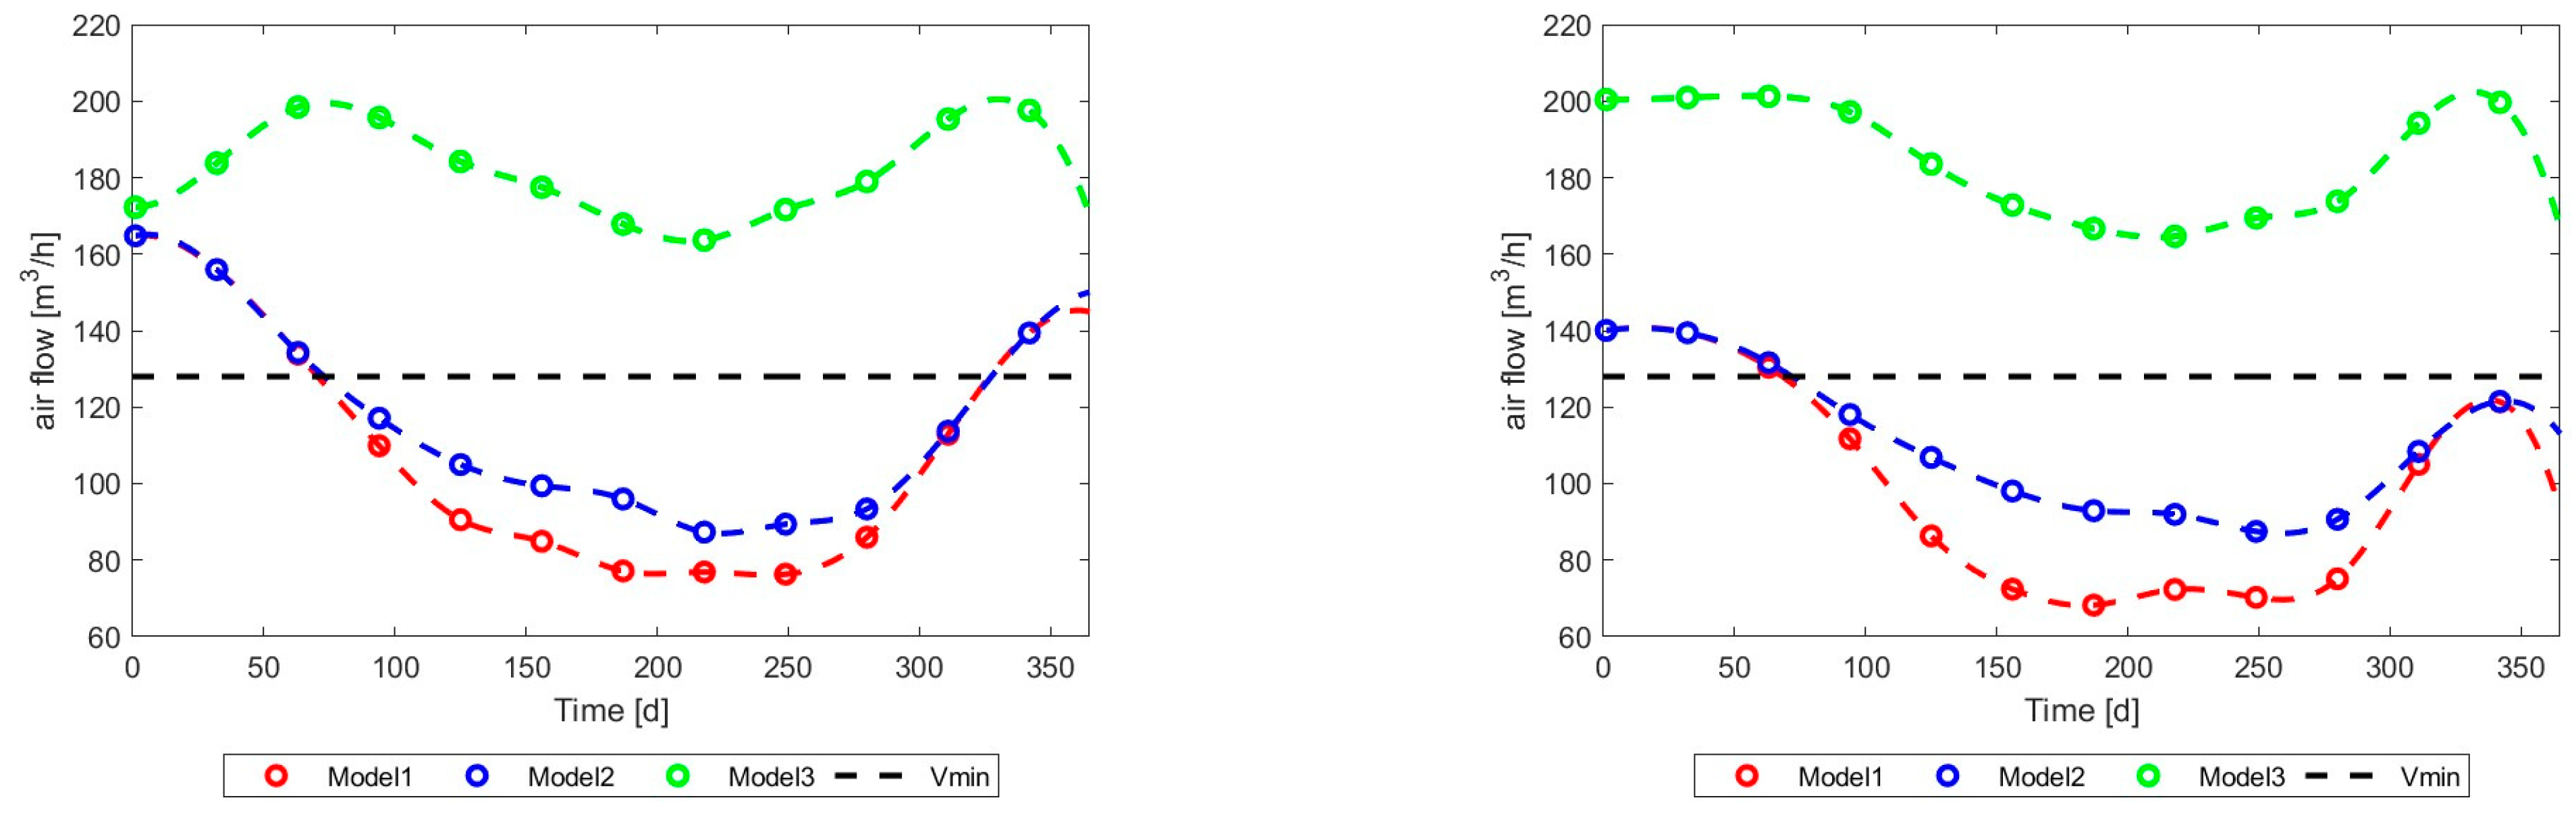
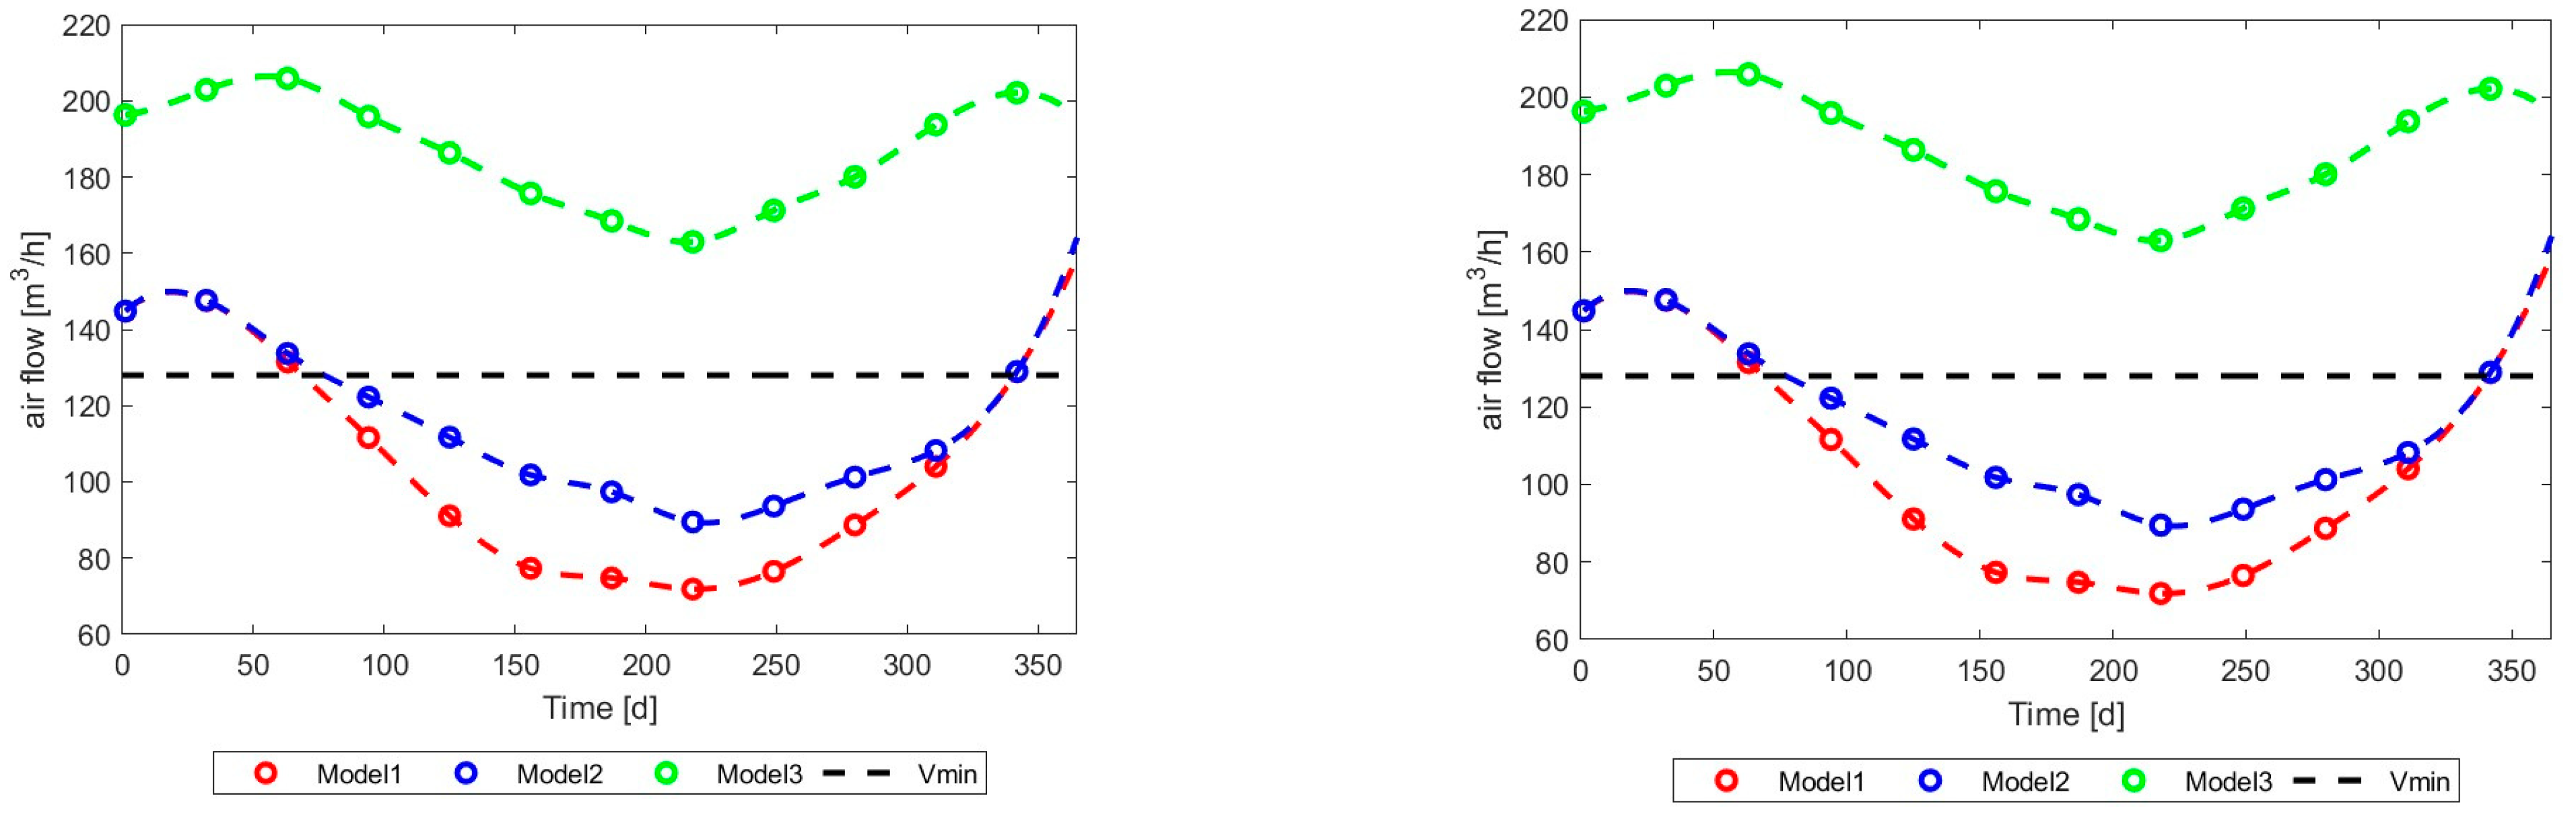
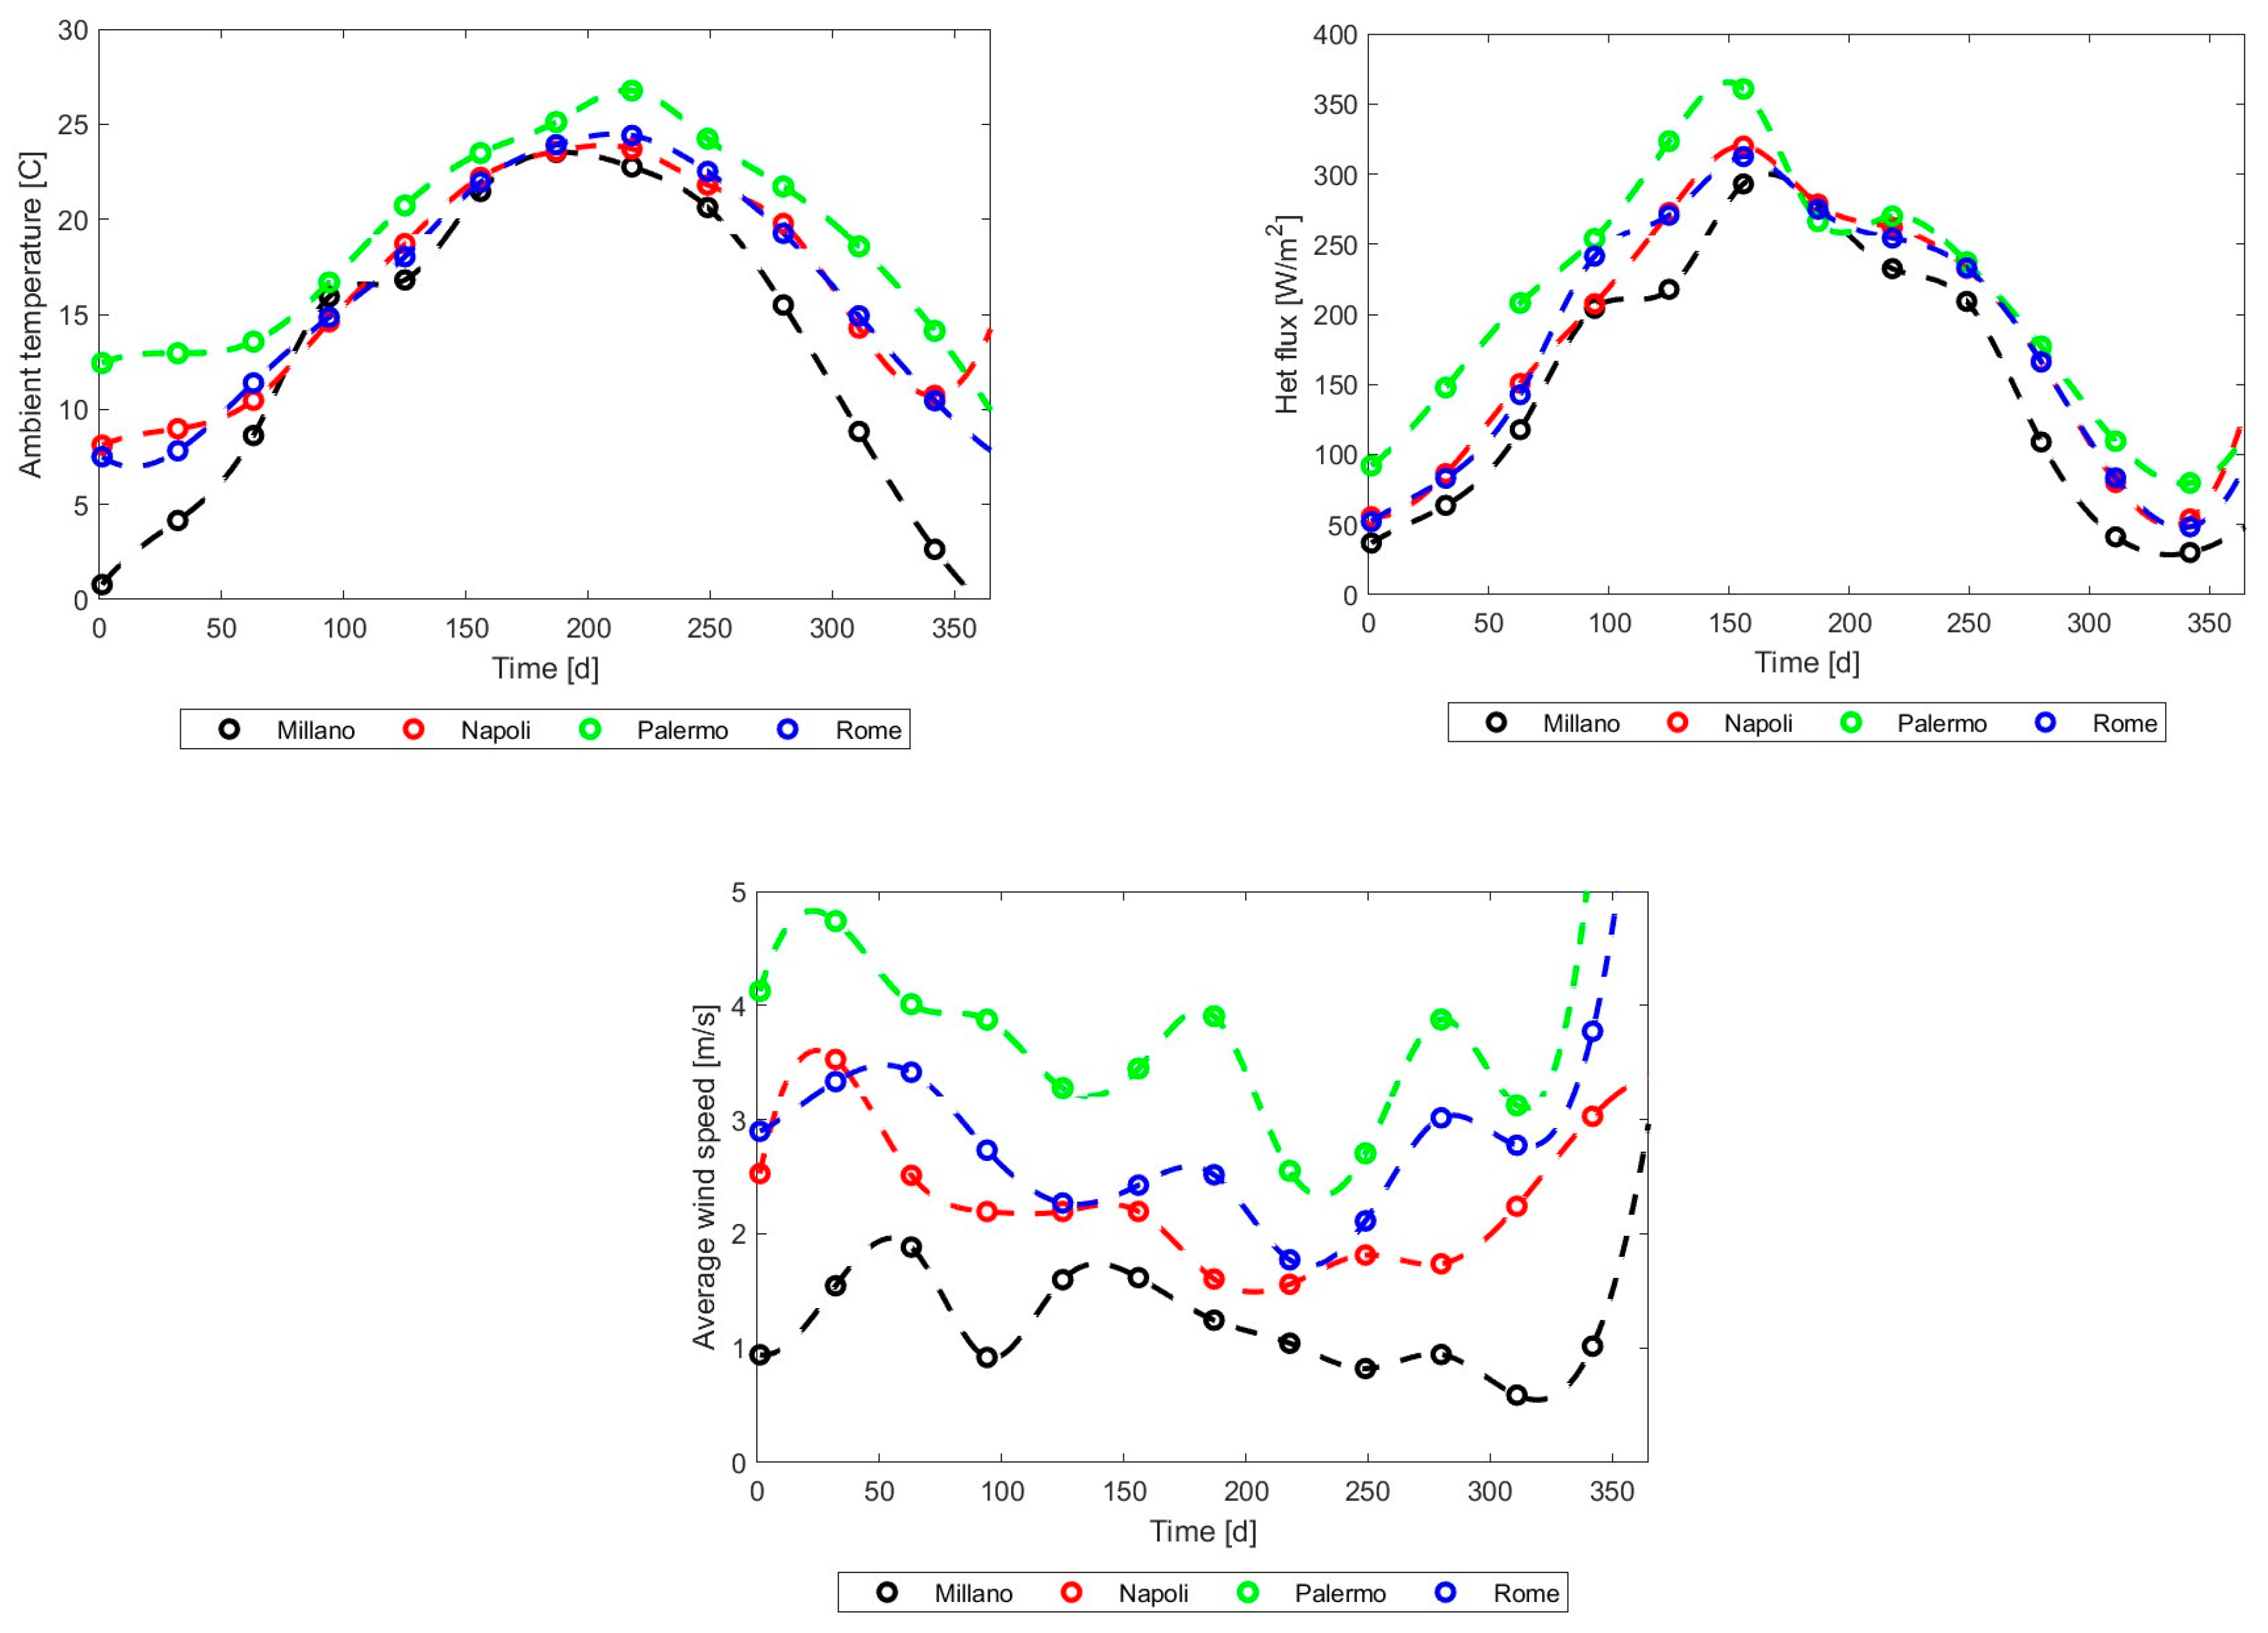
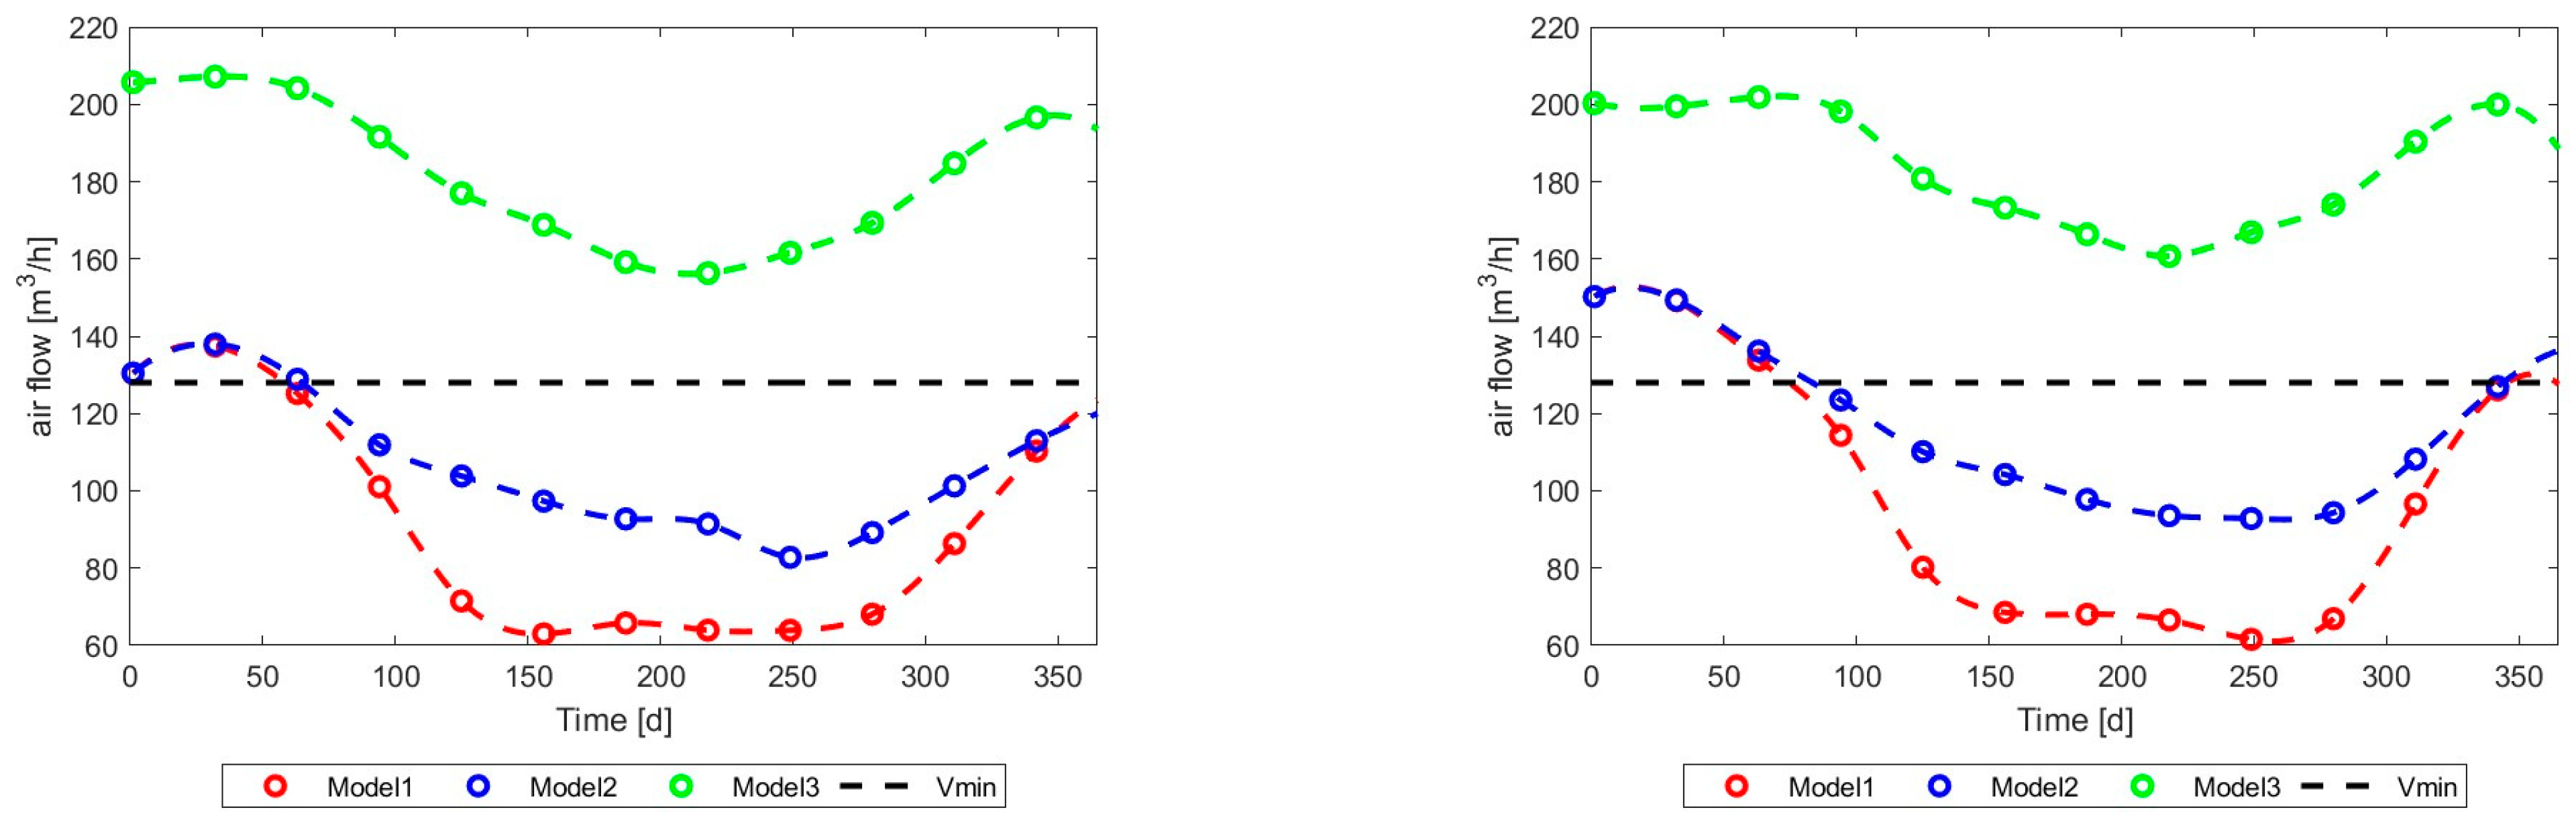
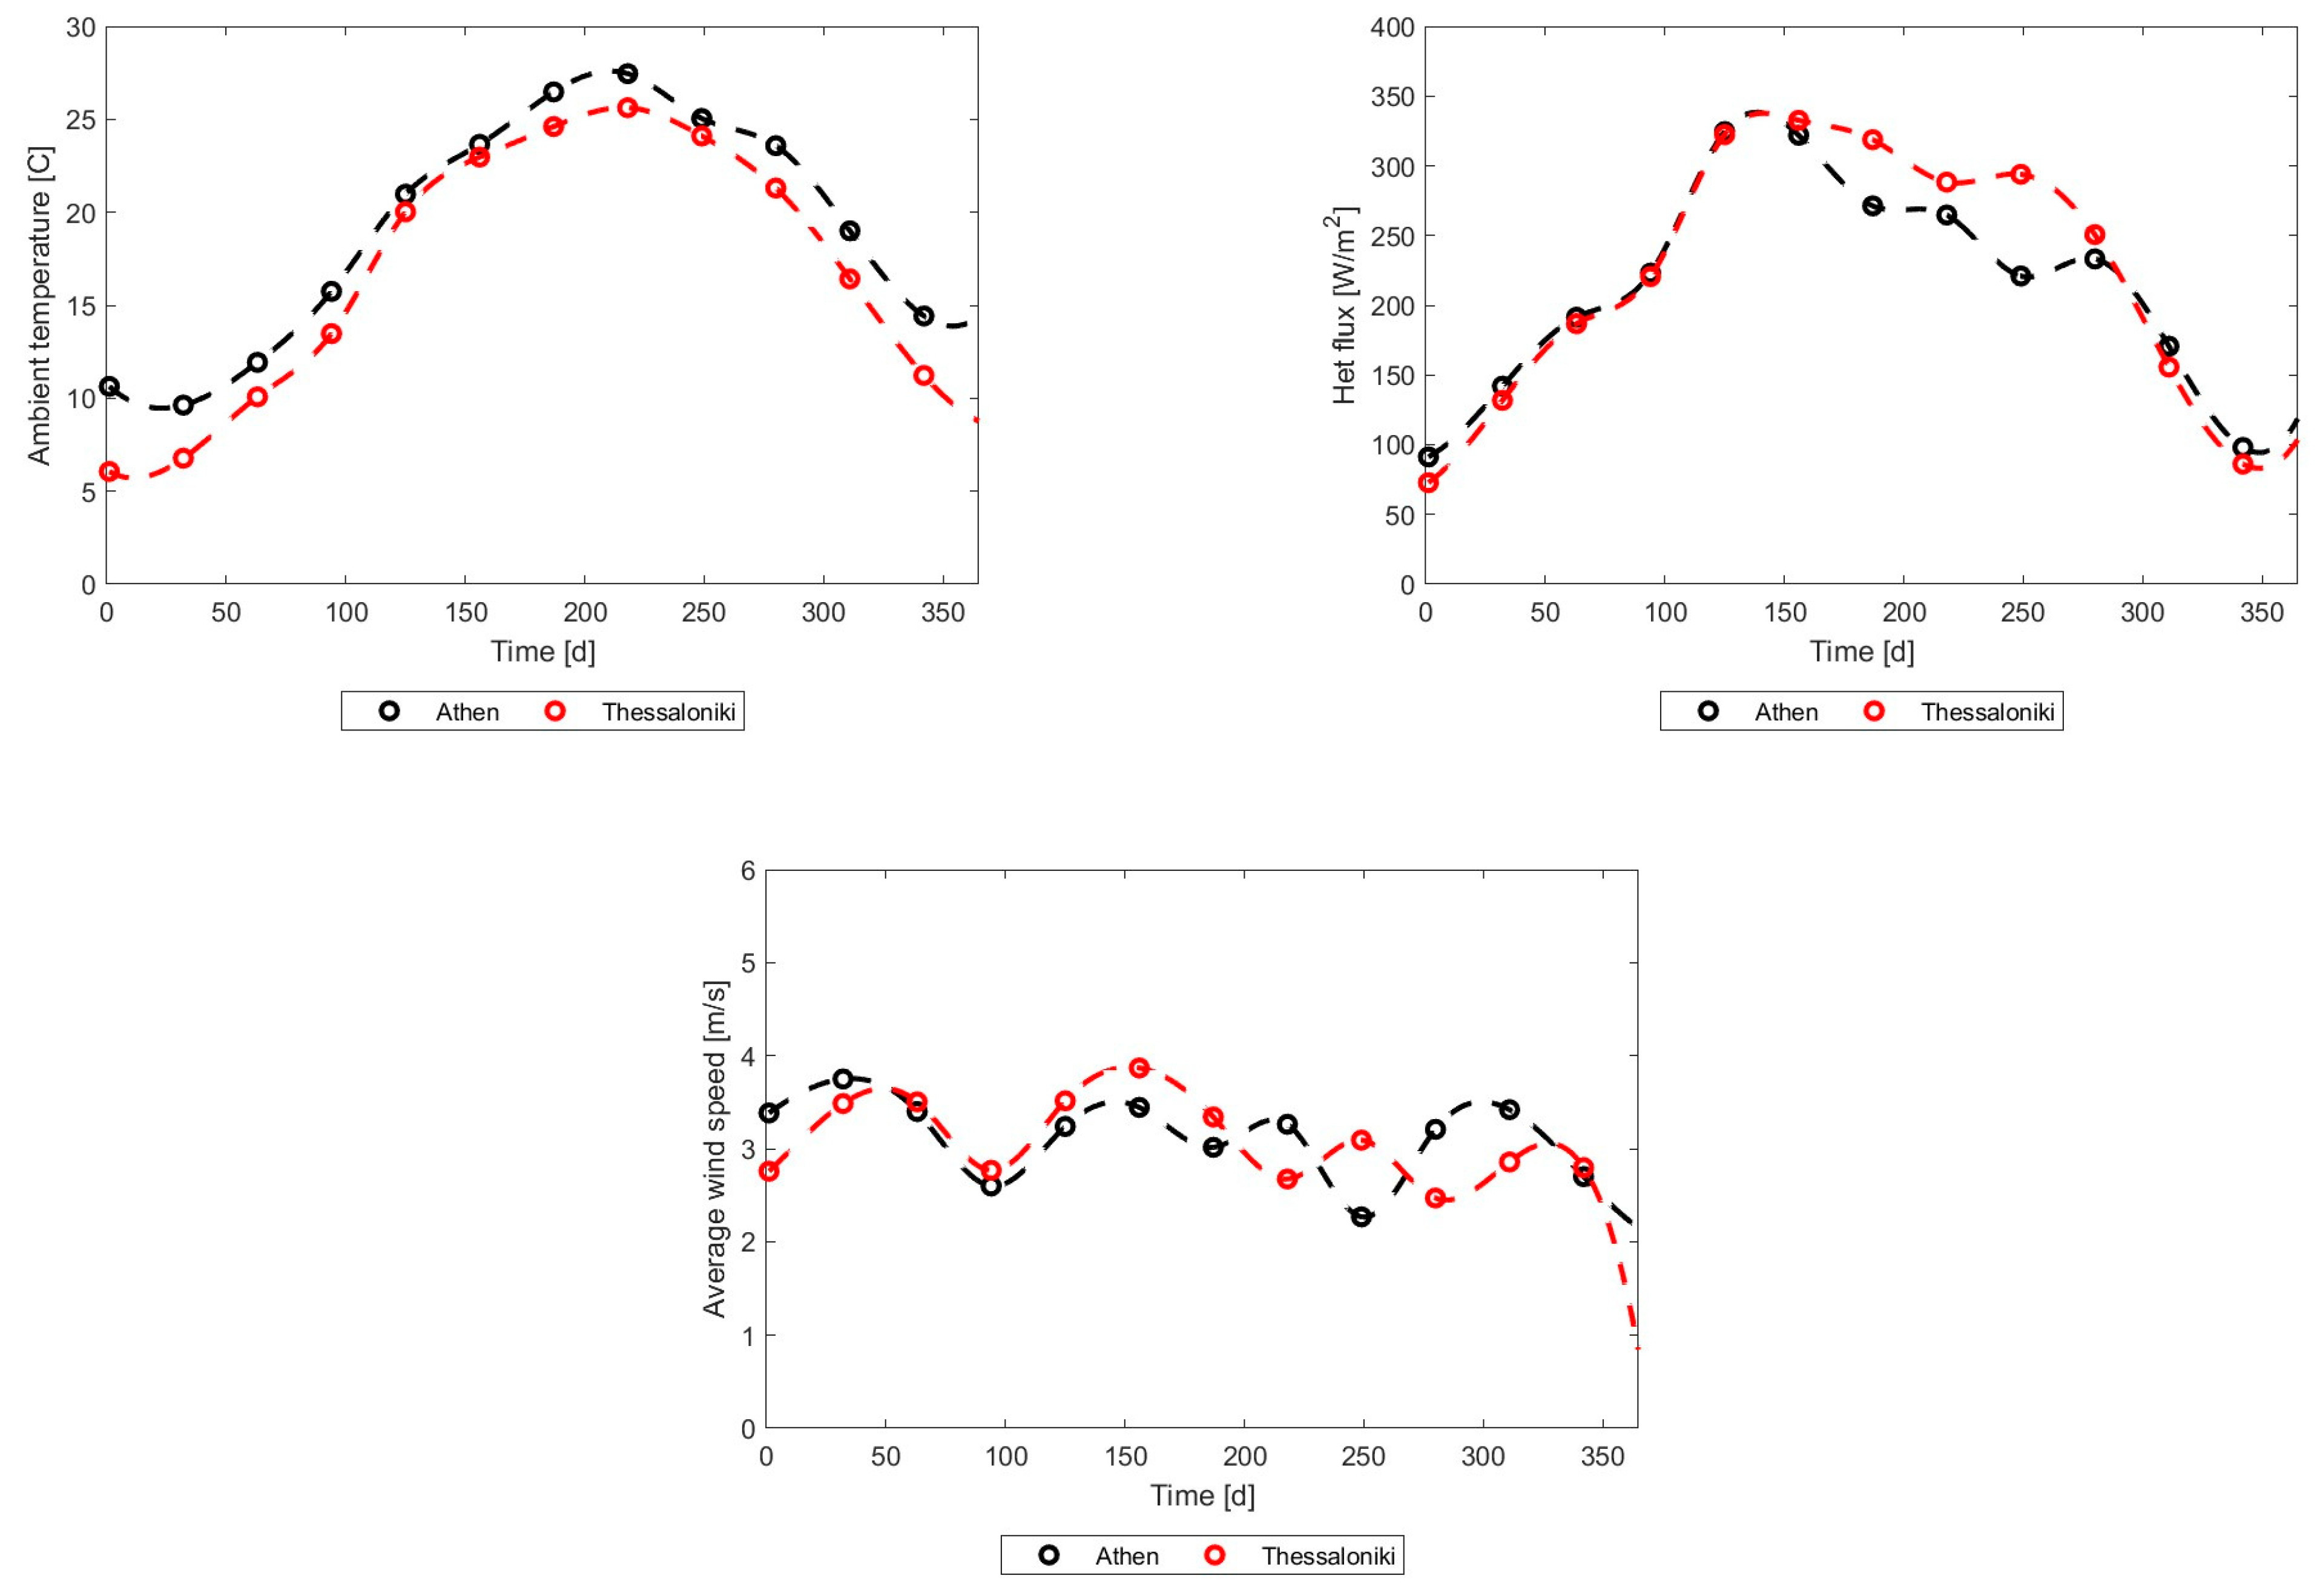
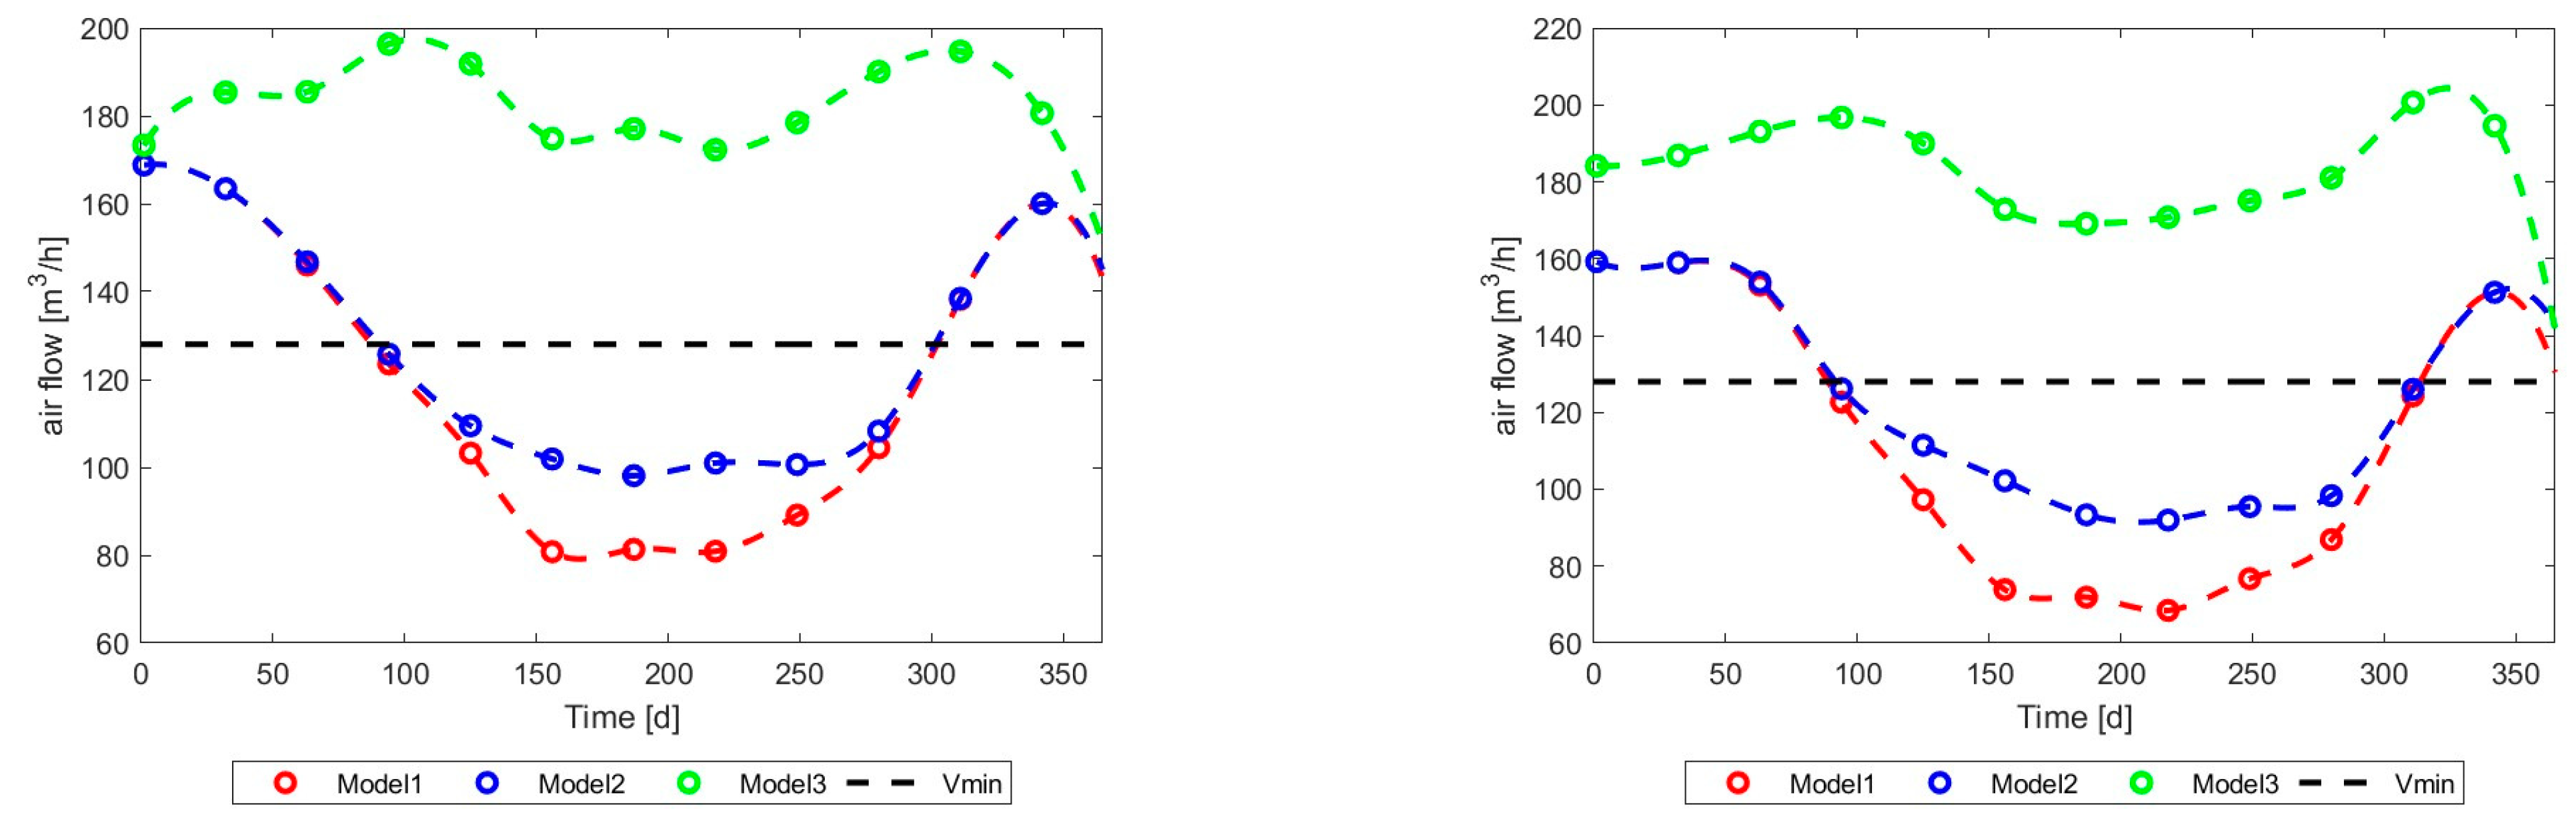
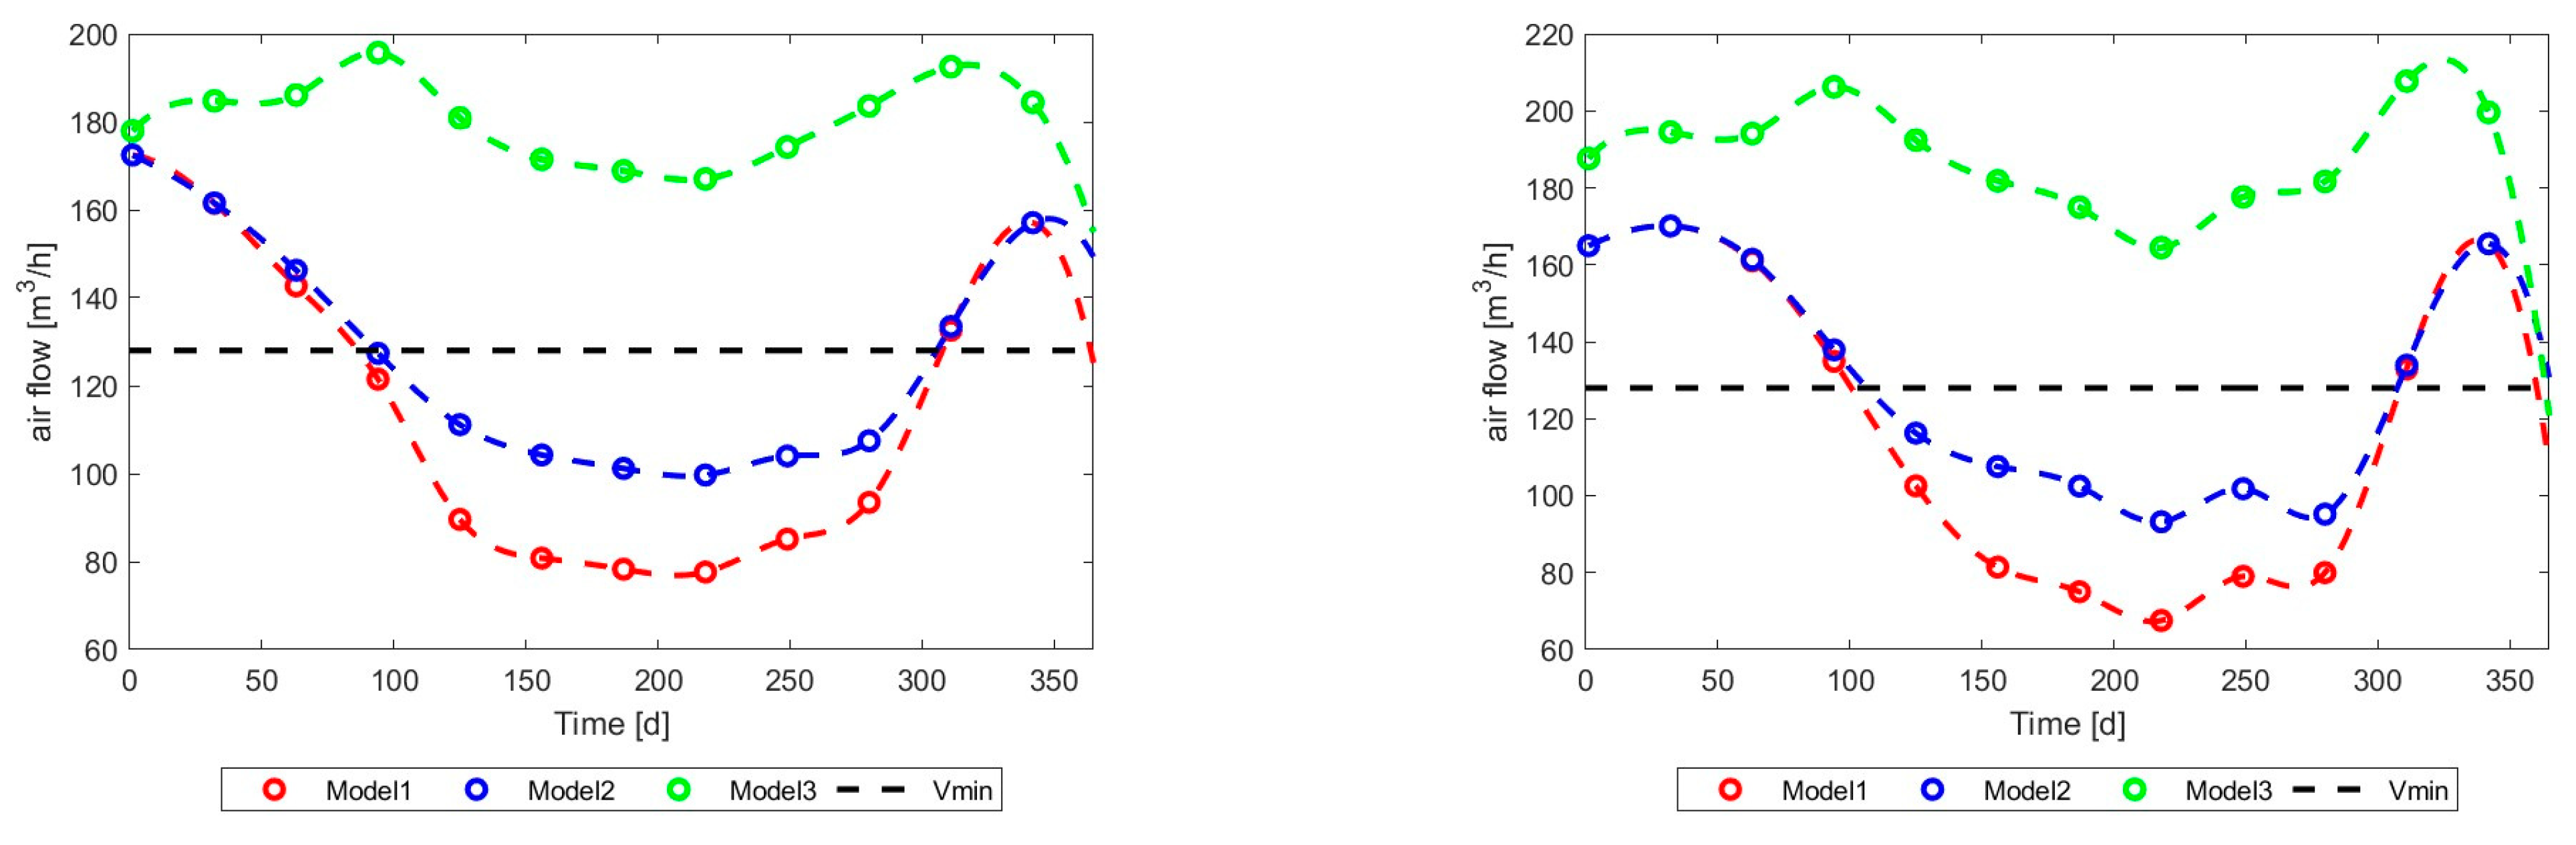
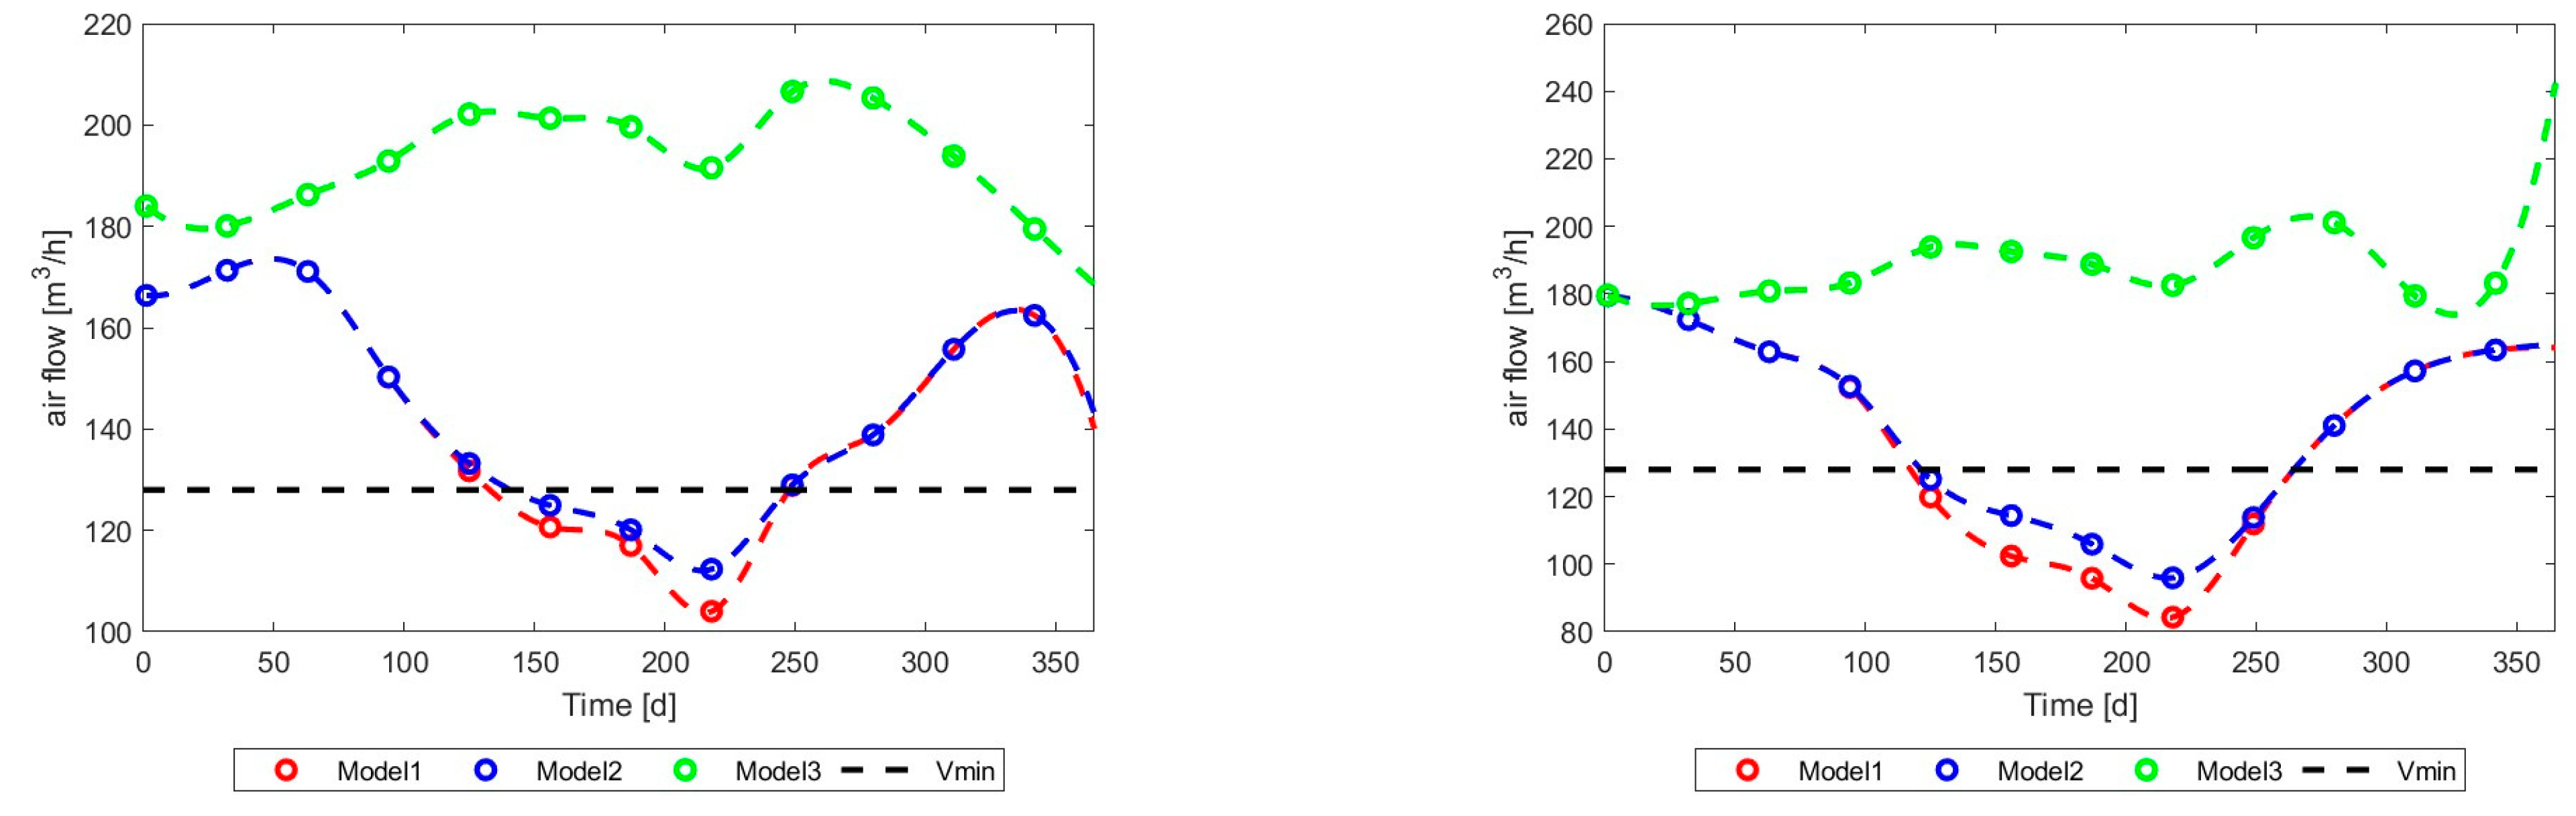
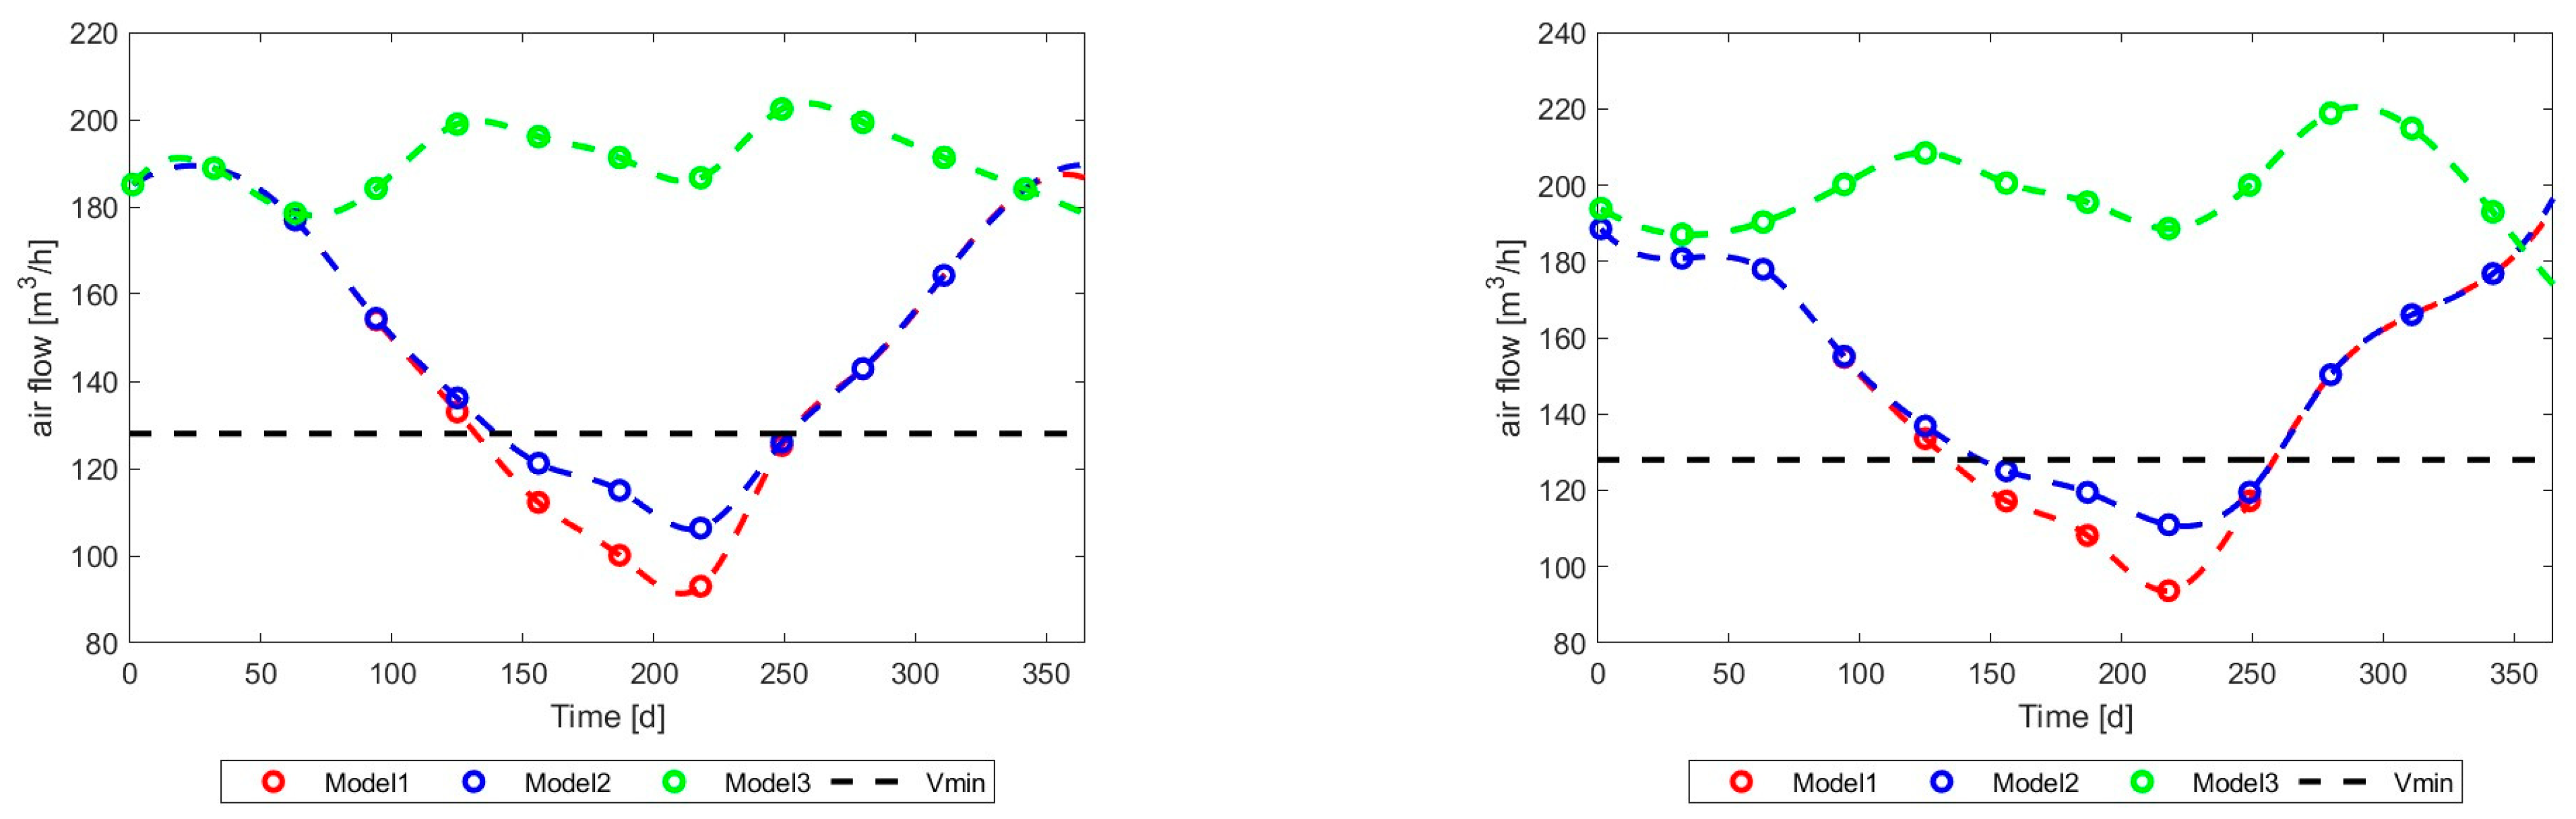
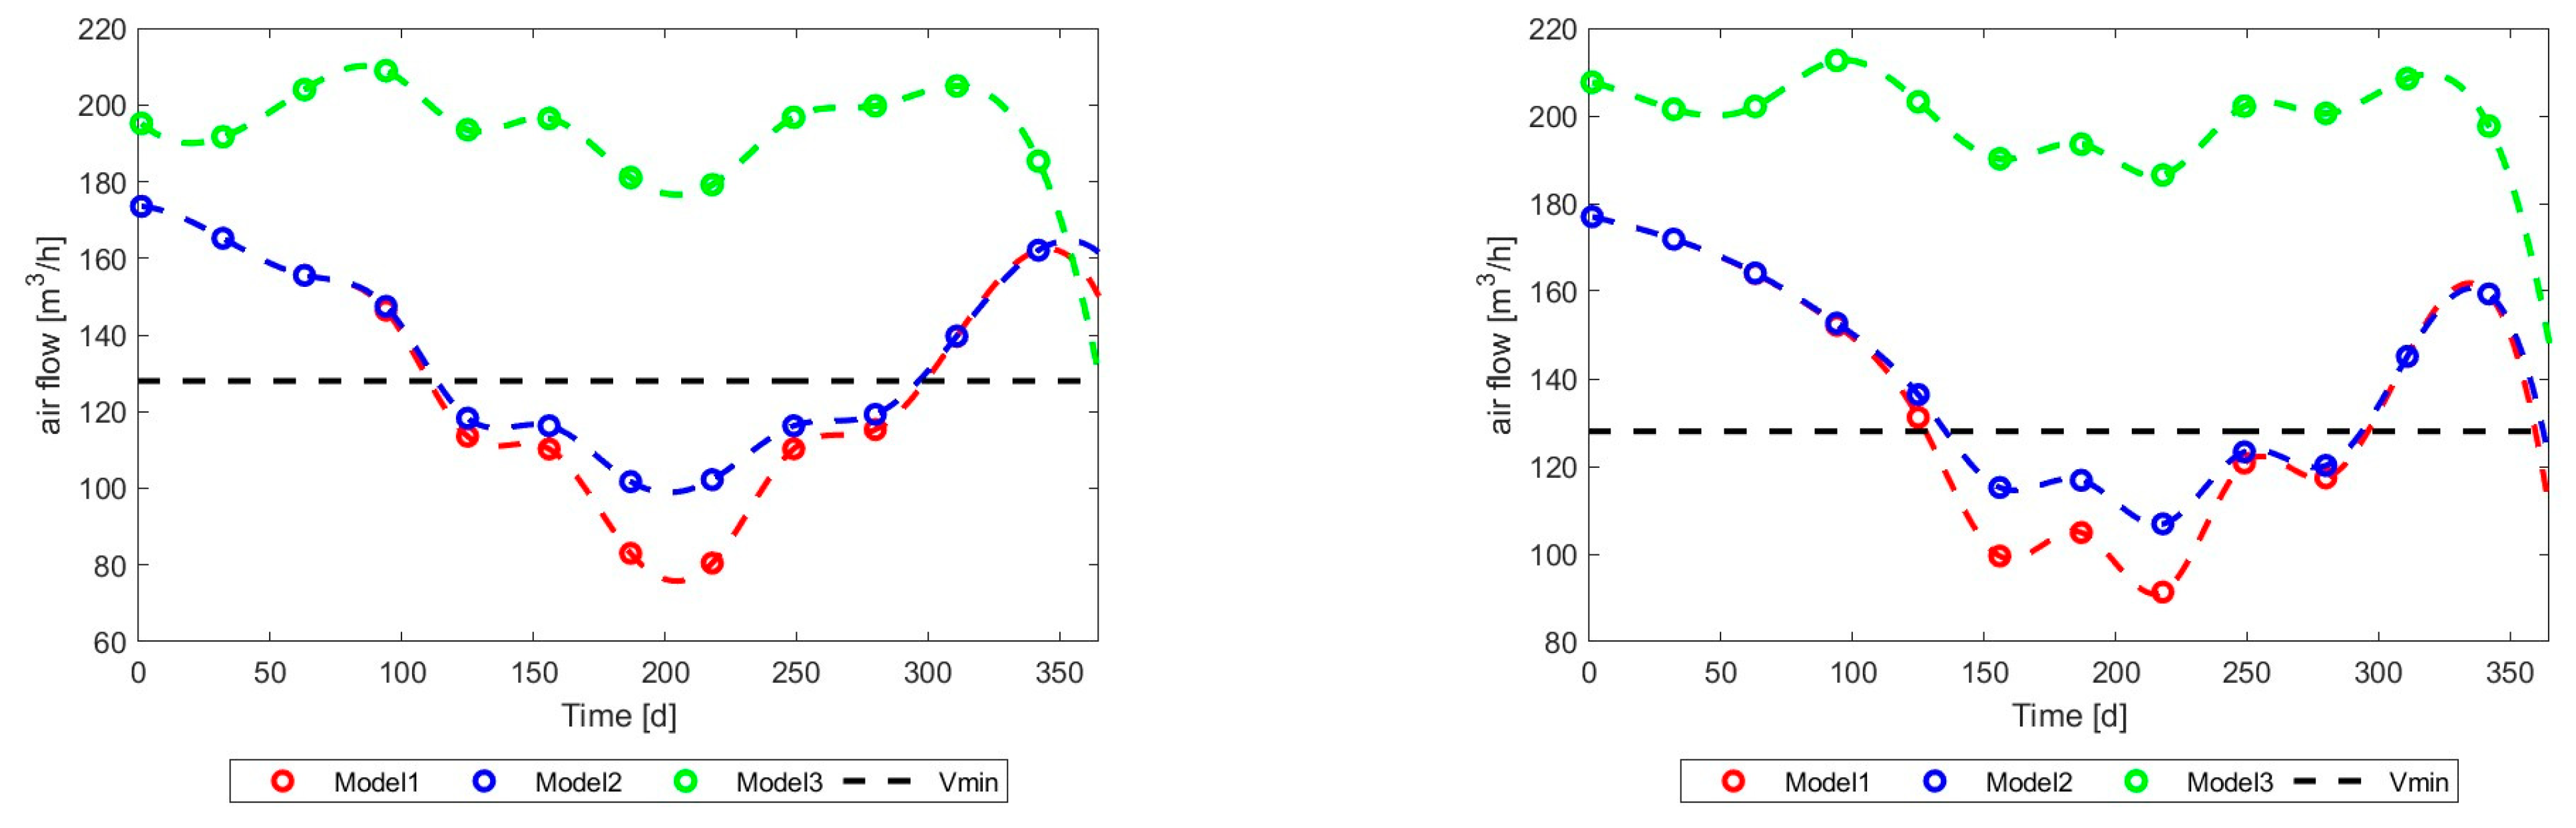
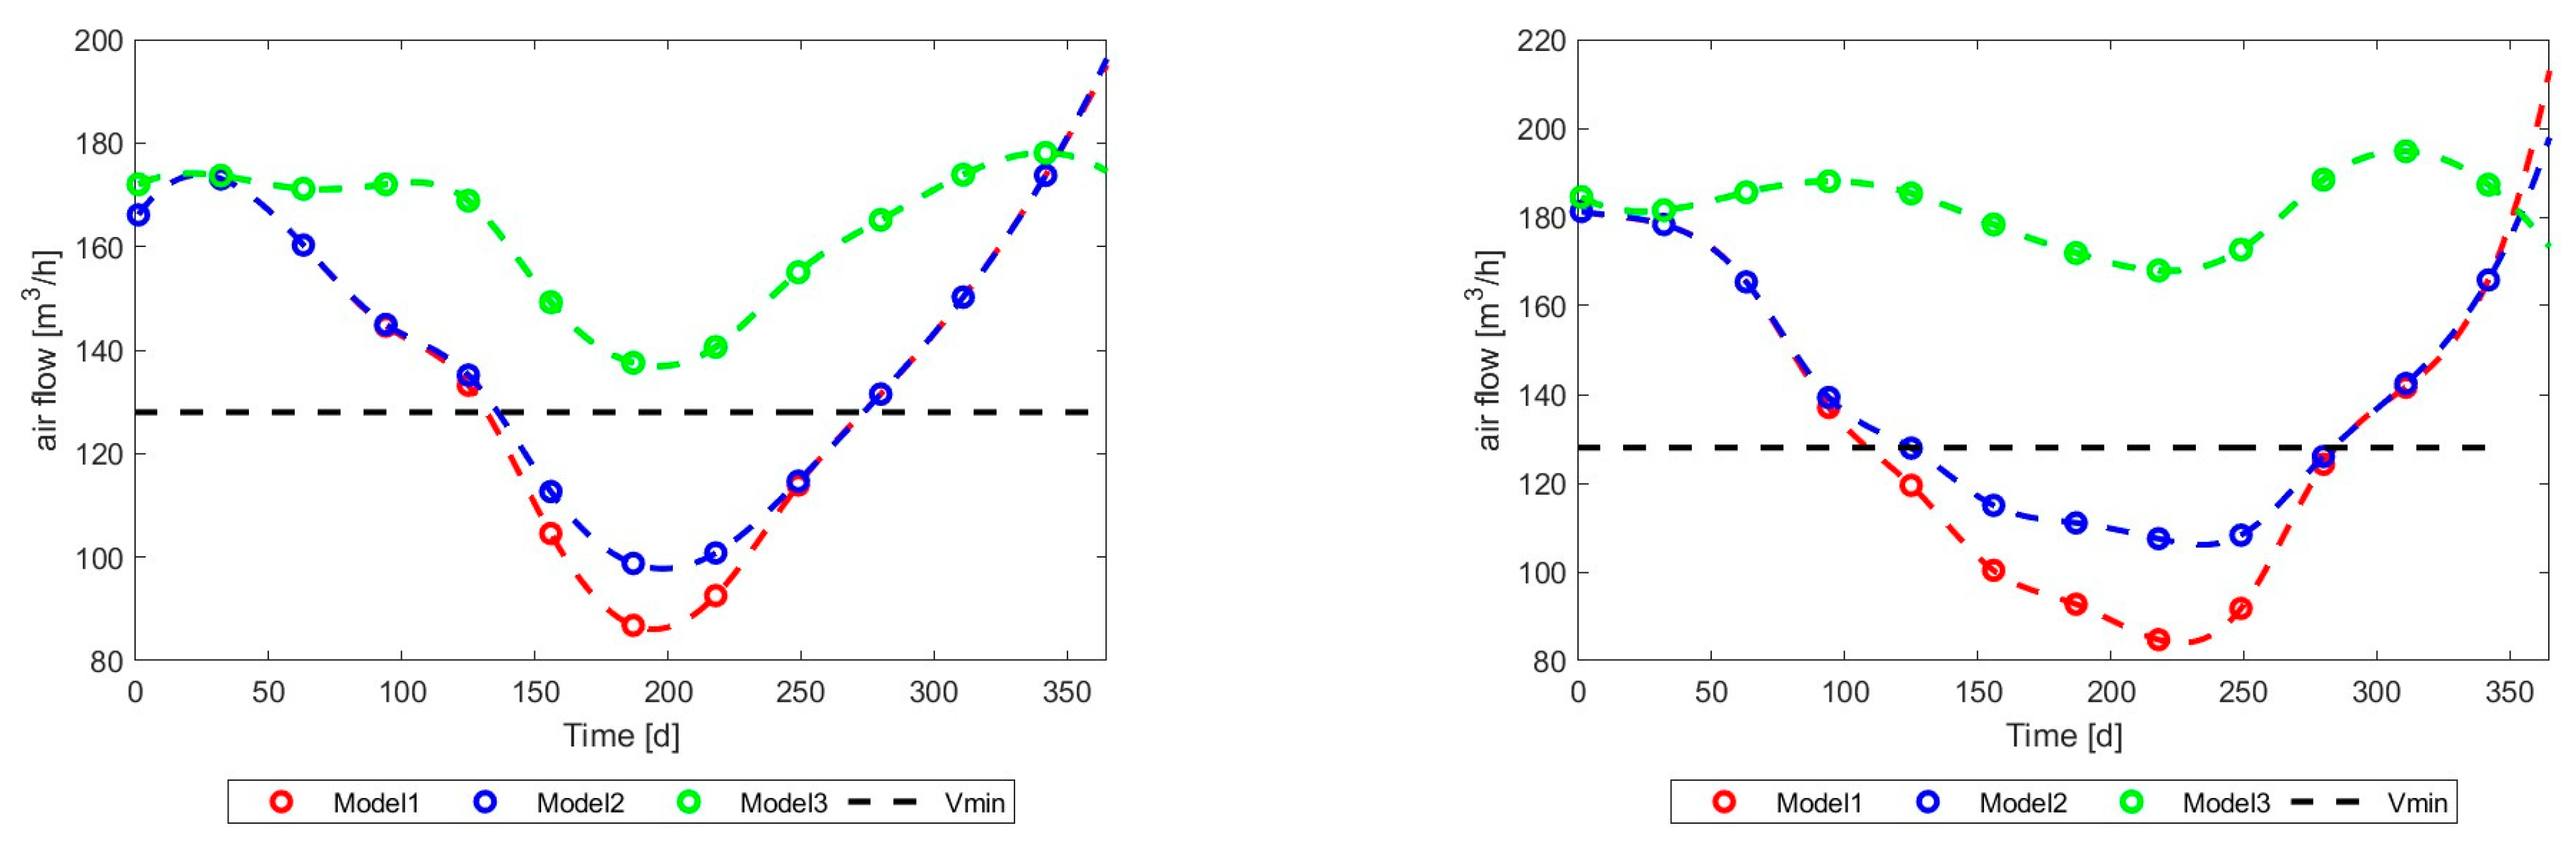
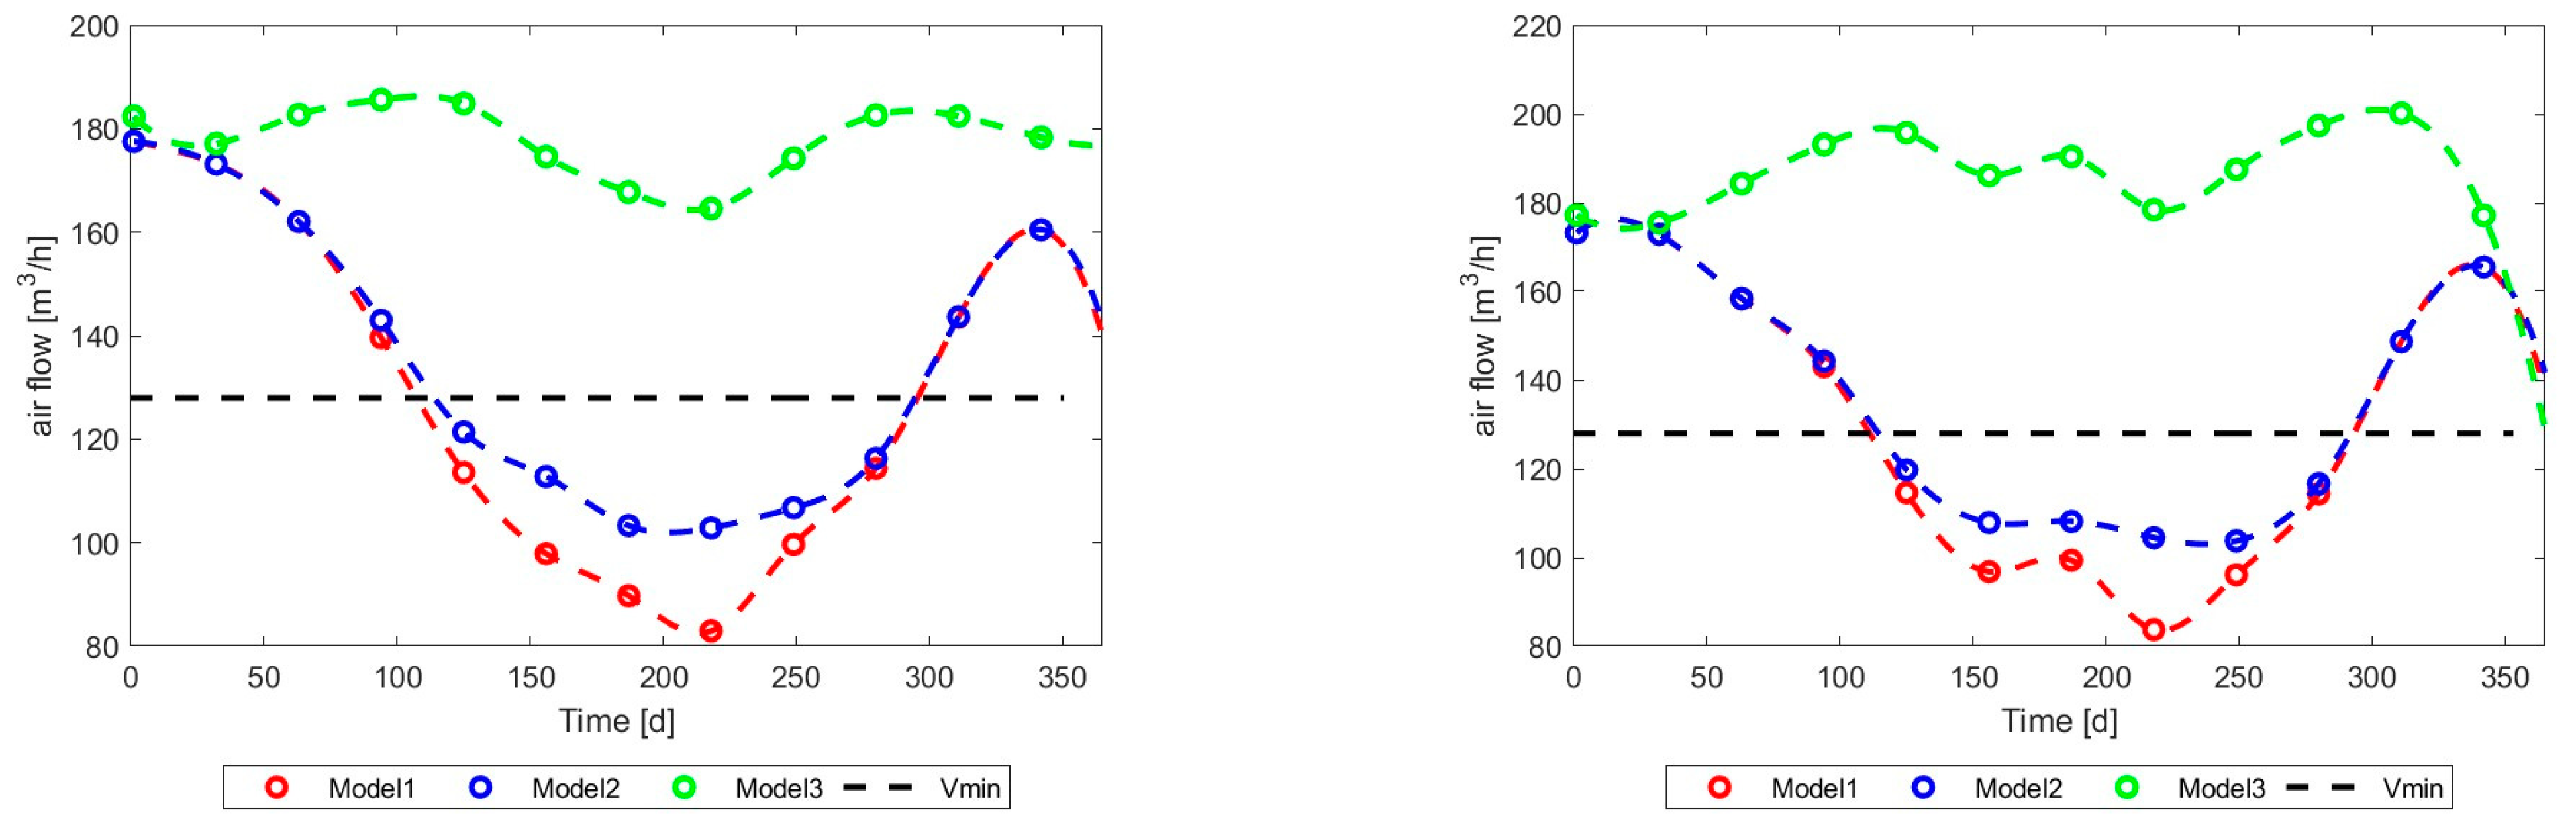
3.2. Detailed Results: Effect of Solar Radiation, Ambient Temperature, and Wind Speed

Due to the large amount of simulated data, it is problematic to show all the results of the simulations for every 0.5 h. For this reason, to simplify the interpretation process for readers, the following data presentation methodology is proposed:
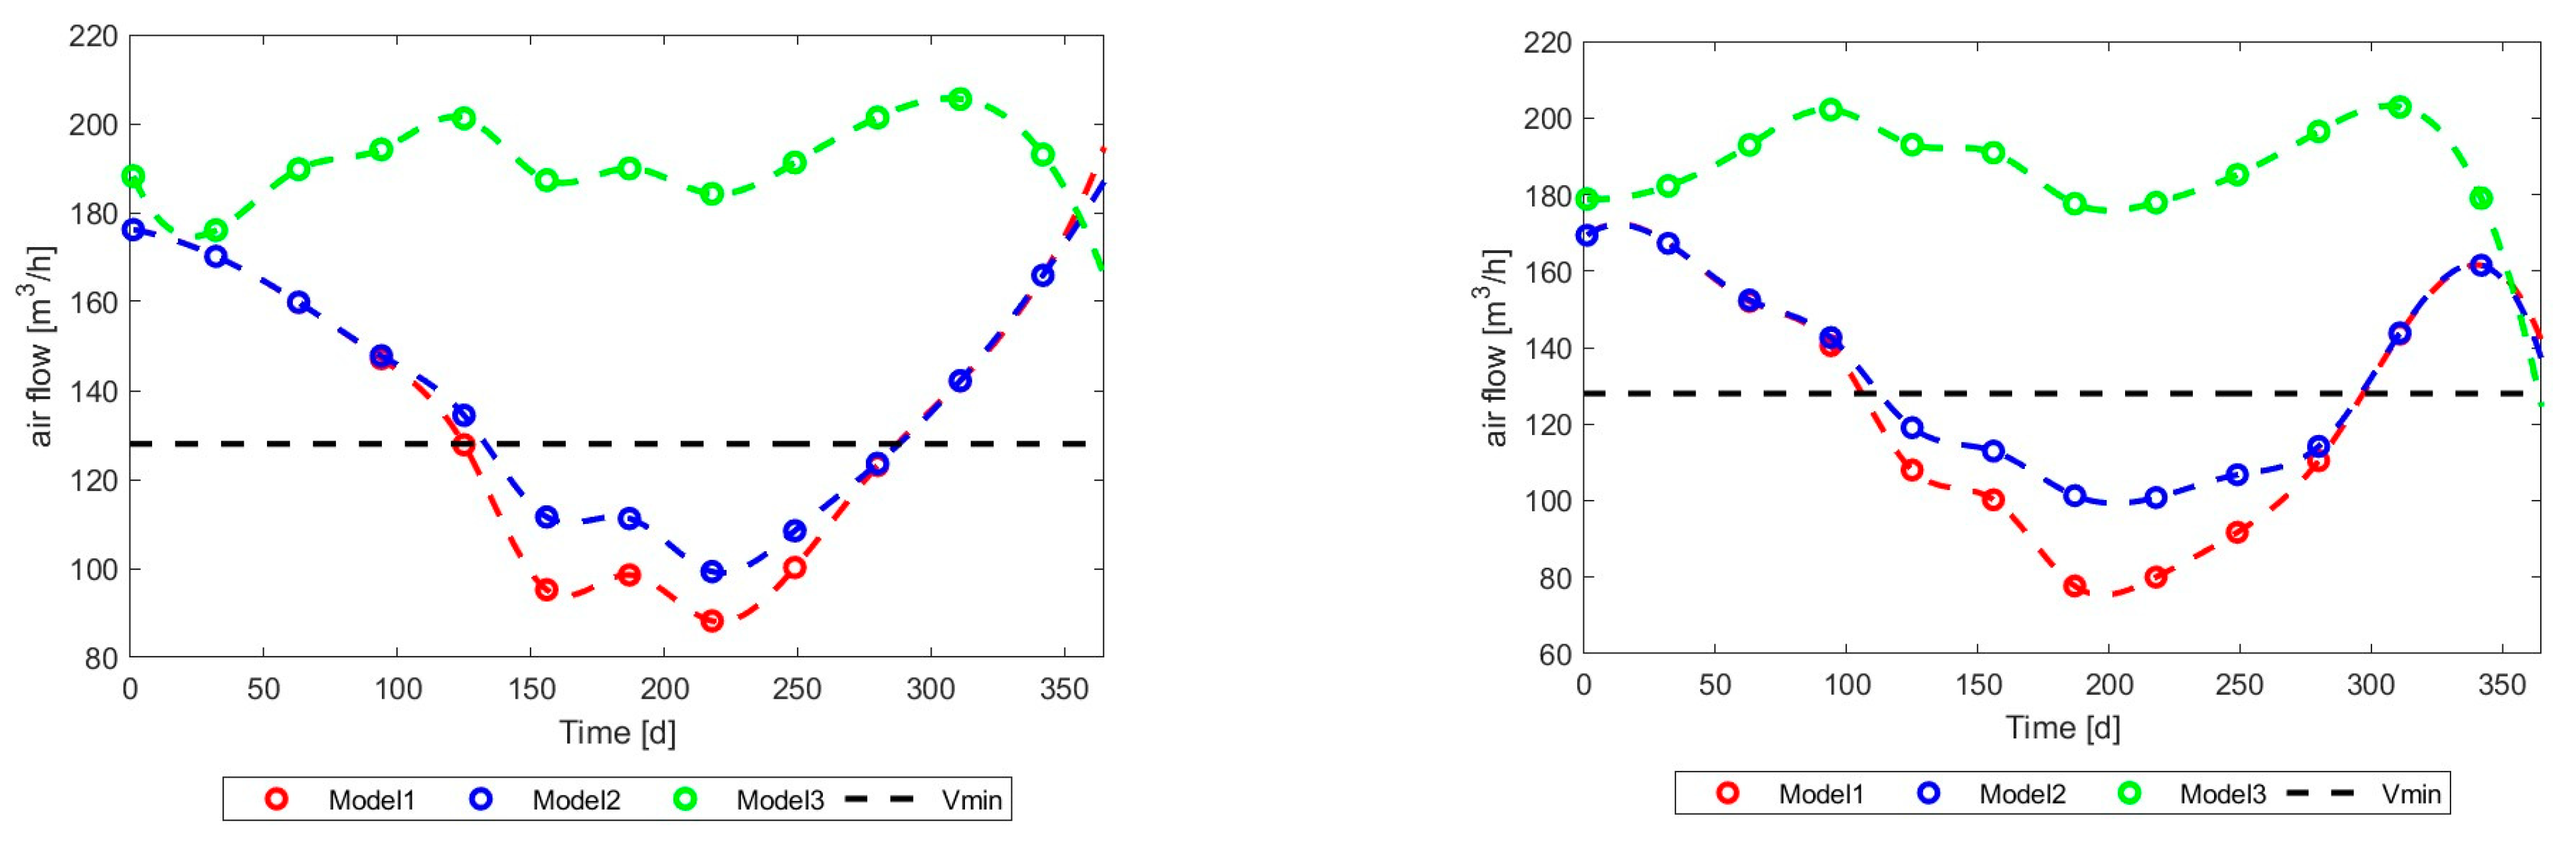
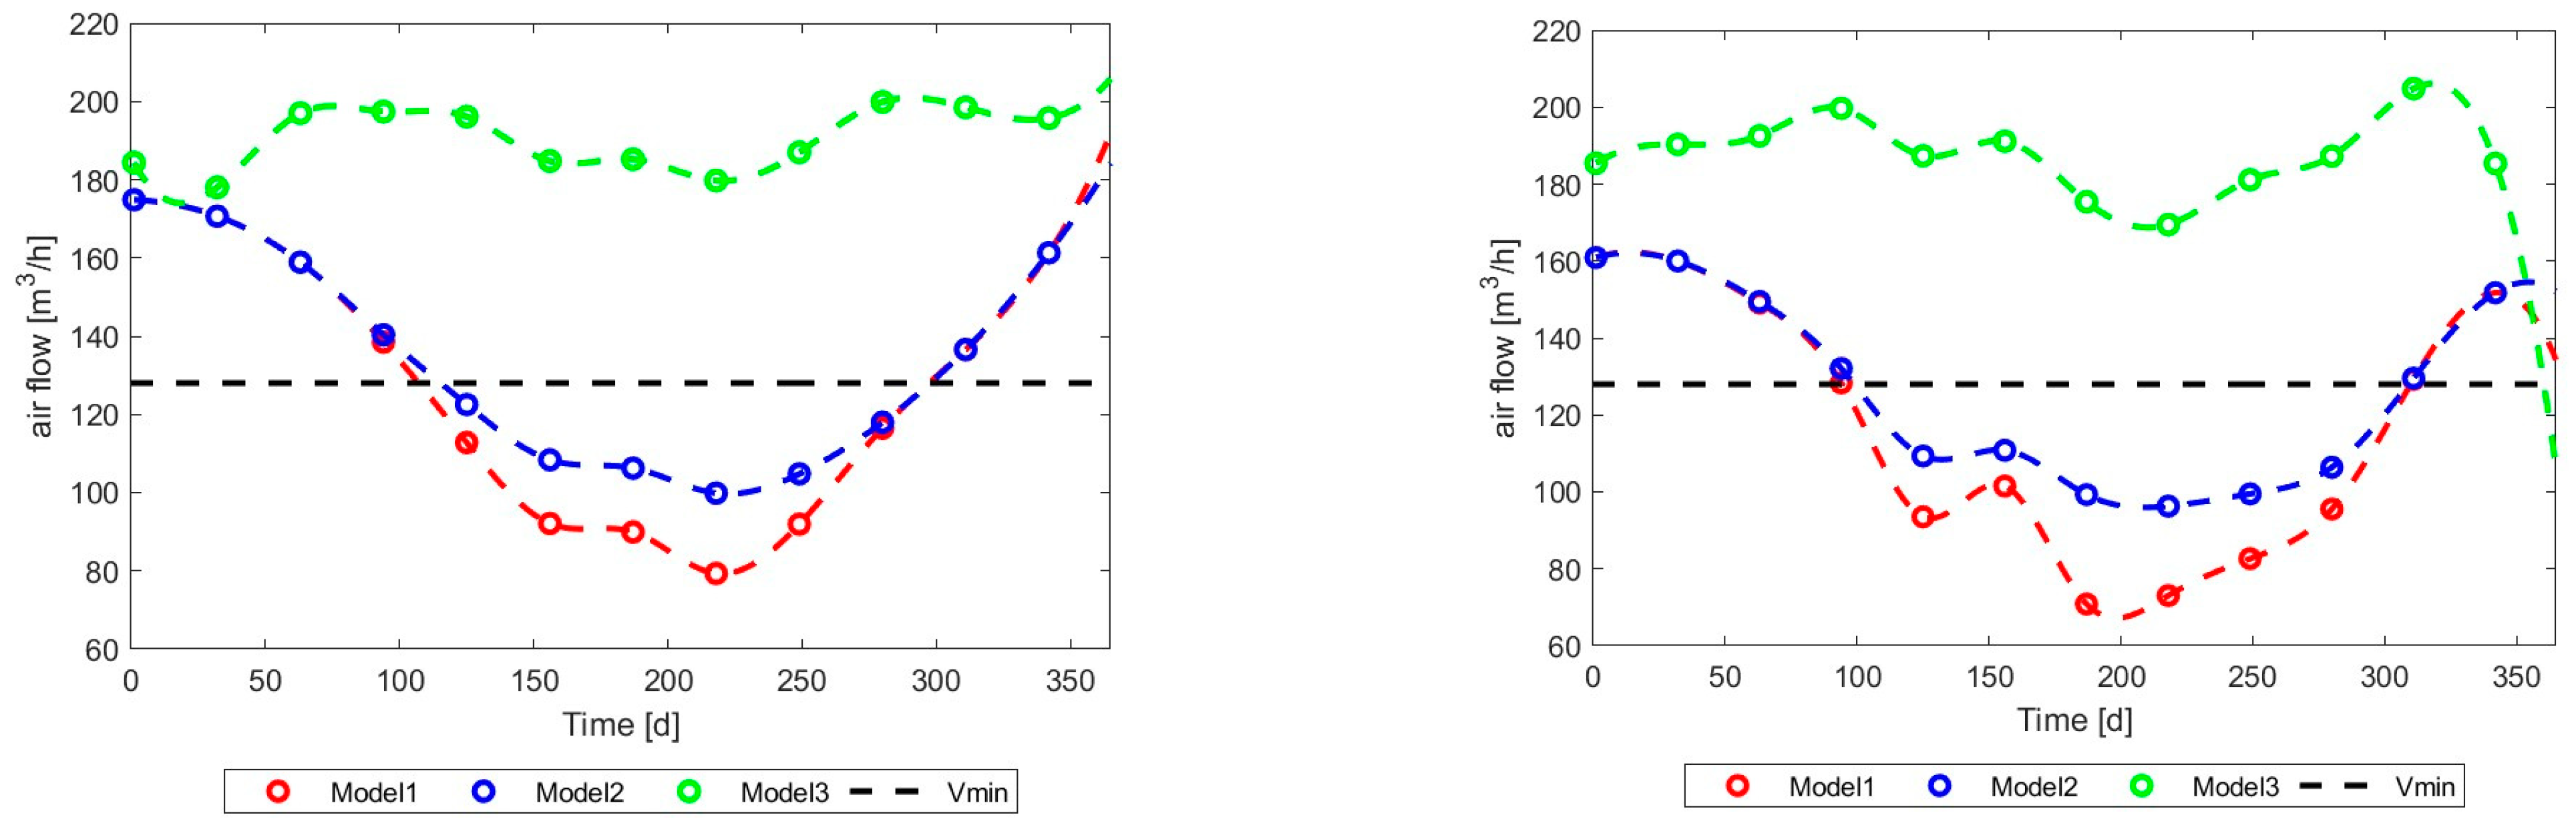
  • In the case of all the parameters such as volumetric flow, temperature, radiation level, and wind speed, the average values for every 30 days are shown.
  • The additional trend lines for presented data are proposed.
The proposed methodology makes it possible to still catch the character of changes, presented as an example of selected results for Gdansk City (see Figure 15 and Figure 16).
It should be emphasized that for all the presented cities, the ambient temperature for the first 100 days of the year was lower than room temperature (<20 °C). Furthermore, the wind speed was relatively higher in the first and last 100 days. On the contrary, the maximum radiation level occurred between the 100th and 250th days of the year (see Figure 17, Figure 18, Figure 19, Figure 20, Figure 21, Figure 22, Figure 23, Figure 24, Figure 25, Figure 26, Figure 27, Figure 28, Figure 29, Figure 30, Figure 31, Figure 32, Figure 33, Figure 34, Figure 35, Figure 36, Figure 37, Figure 38, Figure 39 and Figure 40). In the case of Poland, the largest amplitude of temperature was noted for Wroclaw and Cracow during the winter and summer periods. The solar radiation level varied significantly over the year; the minimum was recognized as less than 50 W/m2 in December and the maximum was between more than 250 W/m2 for Cracow and up to more than 300 W/m2 for Wroclaw (see Figure 17). The highest wind speeds were noted for Gdansk (located close to the Baltic Sea) and the lowest for Cracow, situated deep in the land (see Figure 17). Over the year, the variation of the average volumetric flow of air could be noted in all simulated system scenarios. Furthermore, a higher amplitude of volumetric flow change was visible during the hotter part of the year. The smallest amplitude was obtained for Gdansk, which seemed to be strictly related to the ambient temperature characteristic in this city (see Figure 41). Furthermore, it is noticeable that for all locations in Poland, the systems represented by Model 1 and Model 2 did not provide a minimum level of fresh air for a large part of the year, and, in the hottest months, the ventilation system was not effective (see Figure 41 and Figure 42). However, in Warsaw, the system based on integrating a wind turbine ventilator and solar chimney (Model 2) was characterized by visibly better use, even in summer, than in Wroclaw and Cracow. It can be concluded that the main climate parameter that influenced ventilation operation parameters was ambient temperature. Quite similar results were obtained for cities located in Germany (see Figure 18 and Figure 20). Only for the city of Munich (Figure 19), different characteristics of volumetric flow range could be noted in the results for Model 1 and Model 2. It is noticeable that, for this city, the efficiency of such systems was the lowest. There was a relatively longer period of sufficient ventilation operation in summer than in other analyzed cities. Even in spring and autumn, longer breaks could occur due to a lack of passive ventilation operation. Germany generally represents similar climate conditions to Poland but with relatively higher temperatures during the winter and longer periods with higher availability of solar radiation at higher levels.
In the case of cities located in France, especially Lyon and Marseille (Figure 21 and Figure 22), there was a long, stable period when passive ventilation represented by Model 1 and Model 2 did not work properly. Moreover, the level of fresh air transferred to the object could be less than 60 m3/h, less than 50% of the amount of air that is required to fulfill hygienic recommendations. This would visibly decrease indoor air quality. One of the most visible aspects of this would be the increased concentration of air pollution inside the object. This is especially important for highly polluted urban areas. The risk of higher levels of pollution concentration in indoor air than in outdoor air has been confirmed by a majority of studies [51]. Due to this fact, the possibility of using passive ventilation systems represented by Model 1 and Model 2 will be limited in such destinations. The problem is even more visible in Spanish cities like Madrid and Sevilla (Figure 24 and Figure 25) or Palermo in Italy (Figure 28) and cities in Greece (Figure 30). Even for relatively colder cities like Varna in Bulgaria (Figure 32) or Bucharest in Romania (Figure 33), such a system would be ineffective. For this reason, ventilation systems should not rely only on such solutions.
In the case of results for Italy (Figure 27 and Figure 28) and Greece (Figure 30), there was a clear disproportion between simulation results for Model 1 and Model 2. In Athens or Thessaloniki, about 30% more effectiveness for the ventilation system represented by Model 2 was observed. In the case of Italy, this difference was smaller, but could still reach about 20%. This can be explained by the more stable average wind speed for Greece conditions with relatively high levels of solar radiation (similar to Italy).
The relatively longer period of proper levels of natural ventilation performance represented by Model 1 and Model 2 was noted for the cities in Bulgaria and Romania (see Figure 32 and Figure 34). In the case of the Scandinavian region, the passive ventilation systems worked properly even without solar chimneys for most of the year, except in shorter heat wave episodes between June and August (Figure 36 and Figure 37). Nevertheless, even in these destinations, there could be a longer period with relatively weak ventilation performance. This situation was more obvious for cities located in the Benelux region (Figure 39). Even a minimum amount of fresh air related to hygienic requirements could be not provided by the system for a longer time (system represented by Model 1 and Model 2). The most optimal scenario for this region is to use the system represented by Model 3.

4. Comparisons of Different Ventilation Strategies to Avoid the Concentration of Building Indoor Pollution in Selected European Locations

In industrial countries, the time spent by people inside buildings could reach about 90%. Ventilation plays a significant role in ventilation air quality, reduces infectious diseases, decreases the relevance of Sick Building Syndrome, increases the productivity of people, and reduces generated pollutants [52]. According to many studies, indoor air pollution can be 2–4 times higher than outdoor air pollution. The direct involvement of the Sick Building with the level of air change per hour (ACH) has been confirmed [53]. To simplify the analysis, the simulated cities were divided into two groups: cities located in North Europe and those in South Europe. Furthermore, the trend lines for simulated results are shown (see Figure 43 and Figure 44). All of the propagation trend lines were obtained based on detailed year-round calculation results presented in the previous section. According to the American Society of Heating, Refrigeration, and Air-Conditioning Engineers, a minimum of 8.4 air exchanges per 24 h should be provided in a building to avoid the risk of the concentration of indoor air pollution. For the analyzed space (about 254.4 m3), the minimum level (ACH) would be about 89 m3/h. In the case of the first group of cities, all the analyzed systems met the minimum recommendations for air exchange levels for 24 h. In the case of Gdansk, Hamburg, and Brussels (Figure 45), it is recommended to choose passive ventilation integrated with at least a traditional solar chimney and wind turbine ventilator on the roof (Model 2). The same recommendation could be followed for some other cities with relatively low average ambient temperatures and high average wind speeds, e.g., Warsaw and Amsterdam (see Figure 27, Figure 39, Figure 40 and Figure 41). In the case of Bergen, a natural ventilation system supported by a wind turbine ventilator would also be sufficient (Model 1). This is similar to other locations in the northern part of Europe, especially in the Scandinavian region (see Figure 36 and Figure 38).
Still, in all the analyzed examples, there would be longer periods with an insufficient amount of fresh air inside the building, which could result in worse well-being. However, there would be no risk of Sick Building Syndrome [54]. Finally, the best choice would be to use passive ventilation integrated with a wind turbine ventilator and solar chimney supported by thermal energy storage with an additional source of waste heat, especially during warmer parts of the year. This would be particularly important for larger residential objects like schools, offices, etc., where the occupant density can be equal to or higher than 5 per 93 m2 [55].
In the case of the second group of cities, in the southern part of Europe, it should be highlighted that the minimum requirement for ACH is possible to reach in the systems presented in Model 1 and Model 2 only in the short, coldest periods of the year. This is clearly seen in the case of Palermo or Athens (Figure 44). In all presented cities, better operating systems included the involvement of solar chimneys. However, only the last proposed system (Model 3) could be used to meet minimal hygienic conditions.
Based on the results, it should be recommended to use different systems depending on the location (Figure 45). Generally, the best will be the system relying on the assumption of Model 3. However, in the case of colder regions, it is possible to use only natural ventilation supported by a wind turbine ventilator (Model 1) or, in the case of a high, stable level of solar radiation, it could be possible to use a natural ventilation system with a solar chimney supported by a wind turbine ventilator (Model 2). However, this assumption could be reasonable for residential buildings that are not occupied by people all day, and ventilation systems could be enhanced by using window ventilation. In this context, Model 1 or Model 2 can be recommended, especially regarding the visibly higher investment cost of the natural ventilation system represented by Model 3 or the absence of an available low-temperature waste heat source.

5. CO2 Reduction Using a Passive Ventilation System

To estimate the potential reduction of carbon dioxide emissions, it was assumed that the passive ventilation system presented in Model 3 could be compared with a hybrid ventilation base of using a roof wind turbine ventilator powered by wind and an electric motor [56]. Potential energy fan consumption for mechanical ventilation related to natural draft pressure created by the passive ventilation system presented in Model 3 was calculated according to the equations below. The fan efficiency was set as equal to 0.15 due to the relatively low flow rates of an axial-type fan [57]. The average density of ambient air was calculated as a function of the average ambient temperature for selected countries and regions of Europe.
p N D = g × ρ o ρ r × l
N p = ( V m i n × p N D ) / η
where
Np—pumping power (W),
ΔpND—natural draft pressure (Pa),
η—energy efficiency.
Next, the total saved emissions of CO2 were calculated according to Equation (11). The average CO2 emissions per KWh of electric energy were assumed referring to European Environment Agency data, where the average emission of CO2 from 1 kWh in the EU is equal to 295.8 g. The final emission was calculated only for periods where the ventilation system presented in Model 1 could not supply the required amount of air to the considered space. The calculations were made according to the previous results of volumetric flow for selected locations in European countries. For simplification, the mean value of volumetric flow for each country was taken into account.
M C O 2 = m × N p × ε × τ
where
m—emission CO2 per kWh,
MCO2—saved emissions of CO2 (kg),
ε—percentage relation of time when the ventilation system presented in Model 1 could not supply the required amount of air (%),
τ—time of operation (one year).
It should be noted that it was assumed that all the energy supplied to heat the air in the chimney was produced from the solar system (chimney solar collector) or supplied from waste heat sources. The highest potential savings were found for countries located in the southern part of Europe, like Italy and Romania, and the lowest were found for the Scandinavian region (Figure 46). If we additionally consider the example of Romania with more than 4 million single-family houses, where more than 90% of houses have only natural ventilation, the potential for passive ventilation system improvement is large, especially in the context of growing expectations regarding the indoor air quality of buildings. It should be highlighted that the presented potential of reduced CO2 emissions did not account for the reduction of cooling energy, which could reach up to 40% [58].

6. Conclusions

The presented study confirmed the limitations of using passive ventilation systems, both those supported by wind turbine ventilators and wind turbine ventilators integrated with traditional solar chimneys. Regarding the year-round simulations, the potential of using a passive ventilation system integrated with a wind turbine ventilator and solar chimney and supported by latent thermal energy storage and a low-temperature waste heat source was noted. There is currently a gap in the literature, with studies focused on the integration of SC assisted by PCM with low-temperature sources like PV/T systems or low-temperature urban heat sources, especially refrigeration systems. The presented procedure did not analyze all of the important issues related to passive ventilation system operation. More focus should be put on the analysis of passive ventilation influences at the internal humidity level in buildings, which is, together with the temperature, a crucial parameter of building comfort levels. Additional analyses should also be prepared regarding the cooling potential of passive ventilation and the reduction of cooling demand, as well as potential CO2 emissions reduction. Furthermore, it is recommended that future studies should focus also on the economic aspect of natural ventilation systems. Special care should be taken when considering the idea presented in Model 3 regarding the availability of different waste heat sources. Moreover, there is a literature gap regarding available correlations validated for a long period, e.g., a year of operation. In this context, future experimental investigations should focus on year-round testing.
By conducting simulations on the examined scenarios, the following results were obtained:
  • The domination of ambient temperature and solar radiation in passive ventilation performance was confirmed in locations deep in the land.
  • It is possible to meet minimal hygienic requirements by using natural ventilation supported by wind turbine ventilators and/or solar chimneys only in the northern part of Europe. However, in the case of public buildings (e.g., schools, offices) or non-residential objects, due to the higher requirements of ACH, such a system cannot be recommended.
  • The passive ventilation system presented in Model 3 can be used in all analyzed localizations. However, additional waste heat energy is required.
  • The biggest potential for CO2 reduction by using an improved passive ventilation system (Model 3) is in the southern part of Europe.

Funding

Internal project of Gdansk University of Technology no. 9/1/2023/IDUB/II.1b/Am.

Data Availability Statement

Data will be available upon request.

Conflicts of Interest

The author declares no conflicts of interest.

References

  1. O’connor, D.; Calautit, J.K.S.; Hughes, B.R. A Review of Heat Recovery Technology for Passive Ventilation Applications. Renew. Sustain. Energy Rev. 2016, 54, 1481–1493. [Google Scholar] [CrossRef]
  2. González-Torres, M.; Pérez-Lombard, L.; Coronel, J.F.; Maestre, I.R.; Yan, D. A Review on Buildings Energy Information: Trends, End-Uses, Fuels and Drivers. Energy Rep. 2022, 8, 626–637. [Google Scholar] [CrossRef]
  3. Asikainen, A.; Hänninen, O.; Brelih, N.; Bischof, W.; Hartmann, T.; Carrer, P.; Wargocki, P. The Proportion of Residences in European Countries with Ventilation Rates below the Regulation Based Limit Value. Int. J. Vent. 2013, 12, 129–134. [Google Scholar] [CrossRef]
  4. Le Dean, P.; Febvre, B.; Bernard, A.M. Proceedings CLIMA 2007—Wellbeing Indoors (10–14 June Helsinki). In Proceedings of the Survey of Ventilation Systems in Europe, Helsinki, Finland, 14 June 2007; pp. 1–4. [Google Scholar]
  5. Litiu, A. Ventilation System Types in Some EU Countries. REHVA J. 2012, 1, 18–23. [Google Scholar]
  6. EU Commission. EU Building Stock Observatory; EU Commission: Brussels, Belgium, 2023. [Google Scholar]
  7. Carrer, P.; Wargocki, P.; Fanetti, A.; Bischof, W.; De Oliveira Fernandes, E.; Hartmann, T.; Kephalopoulos, S.; Palkonen, S.; Seppänen, O. What Does the Scientific Literature Tell Us about the Ventilation-Health Relationship in Public and Residential Buildings? Build. Environ. 2015, 94, 273–286. [Google Scholar] [CrossRef]
  8. Mushtaha, E.; Salameh, T.; Kharrufa, S.; Mori, T.; Aldawoud, A.; Hamad, R.; Nemer, T. The Impact of Passive Design Strategies on Cooling Loads of Buildings in Temperate Climate. Case Stud. Therm. Eng. 2021, 28, 101588. [Google Scholar] [CrossRef]
  9. Xamán, J.; Vargas-López, R.; Gijón-Rivera, M.; Zavala-Guillén, I.; Jiménez, M.J.; Arce, J. Transient Thermal Analysis of a Solar Chimney for Buildings with Three Different Types of Absorbing Materials: Copper Plate/PCM/Concrete Wall. Renew. Energy 2019, 136, 139–158. [Google Scholar] [CrossRef]
  10. Li, Y.; Liu, S. Experimental Study on Thermal Performance of a Solar Chimney Combined with PCM. Appl. Energy 2014, 114, 172–178. [Google Scholar] [CrossRef]
  11. Lei, Y.; Zhang, Y.; Wang, F.; Wang, X. Enhancement of Natural Ventilation of a Novel Roof Solar Chimney with Perforated Absorber Plate for Building Energy Conservation. Appl. Therm. Eng. 2016, 107, 653–661. [Google Scholar] [CrossRef]
  12. Jing, H.; Chen, Z.; Li, A. Experimental Study of the Prediction of the Ventilation Flow Rate through Solar Chimney with Large Gap-to-Height Ratios. Build. Environ. 2015, 89, 150–159. [Google Scholar] [CrossRef]
  13. Harris, D.J.; Helwig, N. Solar Chimney and Building Ventilation. Appl. Energy 2007, 84, 135–146. [Google Scholar] [CrossRef]
  14. Sakonidou, E.P.; Karapantsios, T.D.; Balouktsis, A.I.; Chassapis, D. Modeling of the Optimum Tilt of a Solar Chimney for Maximum Air Flow. Sol. Energy 2008, 82, 80–94. [Google Scholar] [CrossRef]
  15. Al-Kayiem, H.H.; Sreejaya, K.V.; Gilani, S.I.U.H. Mathematical Analysis of the Influence of the Chimney Height and Collector Area on the Performance of a Roof Top Solar Chimney. Energy Build. 2014, 68, 305–311. [Google Scholar] [CrossRef]
  16. Ghalamchi, M.; Kasaeian, A.; Ghalamchi, M.; Mirzahosseini, A.H. An Experimental Study on the Thermal Performance of a Solar Chimney with Different Dimensional Parameters. Renew. Energy 2016, 91, 477–483. [Google Scholar] [CrossRef]
  17. Shi, L.; Zhang, G.; Cheng, X.; Guo, Y.; Wang, J.; Chew, M.Y.L. Developing an Empirical Model for Roof Solar Chimney Based on Experimental Data from Various Test Rigs. Build. Environ. 2016, 110, 115–128. [Google Scholar] [CrossRef]
  18. Arce, J.; Jiménez, M.J.; Guzmán, J.D.; Heras, M.R.; Alvarez, G.; Xamán, J. Experimental Study for Natural Ventilation on a Solar Chimney. Renew. Energy 2009, 34, 2928–2934. [Google Scholar] [CrossRef]
  19. Li, Y.; Liu, S.; Lu, J. Effects of Various Parameters of a PCM on Thermal Performance of a Solar Chimney. Appl. Therm. Eng. 2017, 127, 1119–1131. [Google Scholar] [CrossRef]
  20. Liu, W.; Bie, Y.; Xu, T.; Cichon, A.; Królczyk, G.; Li, Z. Heat Transfer Enhancement of Latent Heat Thermal Energy Storage in Solar Heating System: A State-of-the-Art Review. J. Energy Storage 2022, 46, 103727. [Google Scholar] [CrossRef]
  21. Huld, T.A.; Šúri, M.; Dunlop, E.D.; Micale, F. Estimating Average Daytime and Daily Temperature Profiles within Europe. Environ. Model. Softw. 2006, 21, 1650–1661. [Google Scholar] [CrossRef]
  22. Szmyd, J.; Milewski, P. Daily Amplitude of Air Temperature in Poland and Bulgaria-a Comparative Study. Eur. XXI 2015, 29, 85–94. [Google Scholar] [CrossRef]
  23. Rebetez, M. Changes in Daily and Nightly Day-to-Day Temperature Variability during the Twentieth Century for Two Stations in Switzerland. Theor. Appl. Clim. 2001, 69, 13–21. [Google Scholar] [CrossRef]
  24. Katavoutas, G.; Founda, D.; Varotsos, K.V.; Giannakopoulos, C. Diurnal Temperature Range and Its Response to Heat Waves in 16 European Cities—Current and Future Trends. Sustainability 2023, 15, 12715. [Google Scholar] [CrossRef]
  25. Szabó-Takács, B.; Farda, A.; Skalák, P.; Meitner, J. Influence of Bias Correction Methods on Simulated Köppen-Geiger Climate Zones in Europe. Climate 2019, 7, 18. [Google Scholar] [CrossRef]
  26. Vilà, R.; Medrano, M.; Castell, A. Mapping Nighttime and All-Day Radiative Cooling Potential in Europe and the Influence of Solar Reflectivity. Atmosphere 2021, 12, 1119. [Google Scholar] [CrossRef]
  27. Liu, S.; Li, Y. Heating Performance of a Solar Chimney Combined PCM: A Numerical Case Study. Energy Build. 2015, 99, 117–130. [Google Scholar] [CrossRef]
  28. Frutos Dordelly, J.C.; El Mankibi, M.; Roccamena, L.; Remion, G.; Arce Landa, J. Experimental Analysis of a PCM Integrated Solar Chimney under Laboratory Conditions. Sol. Energy 2019, 188, 1332–1348. [Google Scholar] [CrossRef]
  29. Omara, A.A.M.; Mohammed, H.A.; Al Rikabi, I.J.; Abuelnour, M.A.; Abuelnuor, A.A.A. Performance Improvement of Solar Chimneys Using Phase Change Materials: A Review. Solar Energy 2021, 228, 68–88. [Google Scholar] [CrossRef]
  30. Al-Obaidi, K.M.; Ismail, M.; Abdul Rahman, A.M. A Review of the Potential of Attic Ventilation by Passive and Active Turbine Ventilators in Tropical Malaysia. Sustain. Cities Soc. 2014, 10, 232–240. [Google Scholar] [CrossRef]
  31. Sung, L.L.; Suffian bin Misran, M.; Tarek Ur Rahman Erin, M.; Rahman, M.M. Solar Chimney and Turbine-Assisted Ventilation System. In Cold Inflow-Free Solar Chimney: Design and Applications; Springer: Singapore, 2021. [Google Scholar]
  32. Gao, N.; Yan, Y.; Sun, R.; Lei, Y. Natural Ventilation Enhancement of a Roof Solar Chimney with Wind-Induced Channel. Energies 2022, 15, 6492. [Google Scholar] [CrossRef]
  33. Lygnerud, K.; Wheatcroft, E.; Wynn, H. Contracts, Business Models and Barriers to Investing in Low Temperature District Heating Projects. Appl. Sci. 2019, 9, 3142. [Google Scholar] [CrossRef]
  34. Panggabean, S.; Sibarani, D.M.; Sigalingging, R.; Rindang, A. Study on Waste Heat Potential of Commercial Refrigerator Condenser. In Proceedings of the International Conference of Science, Technology, Engineering, Environmental and Ramification Researches; SciTePress: Setúbal, Portugal, 2020. [Google Scholar]
  35. Bianchi, G.; McGinty, R.; Oliver, D.; Brightman, D.; Zaher, O.; Tassou, S.A.; Miller, J.; Jouhara, H. Development and Analysis of a Packaged Trilateral Flash Cycle System for Low Grade Heat to Power Conversion Applications. Therm. Sci. Eng. Prog. 2017, 4, 113–121. [Google Scholar] [CrossRef]
  36. Hassan, H.Z. Performance Enhancement of the Basic Solar Chimney Power Plant Integrated with an Adsorption Cooling System with Heat Recovery from the Condenser. Energies 2023, 17, 136. [Google Scholar] [CrossRef]
  37. Salari, A.; Ashouri, M.; Hakkaki-Fard, A. On the Performance of Inclined Rooftop Solar Chimney Integrated with Photovoltaic Module and Phase Change Material: A Numerical Study. Sol. Energy 2020, 211, 1159–1169. [Google Scholar] [CrossRef]
  38. Moosavi, L.; Zandi, M.; Bidi, M.; Behroozizade, E.; Kazemi, I. New Design for Solar Chimney with Integrated Windcatcher for Space Cooling and Ventilation. Build. Environ. 2020, 181, 106785. [Google Scholar] [CrossRef]
  39. Saifi, N.; Baadi, A.; Ghedamsi, R.; Guerrout, A.; Settou, N. An Experimental Study and Numerical Simulation of Natural Ventilation in a Semi-Arid Climate Building Using a Wind Catcher with Evaporative Cooling System and Solar Chimney. J. Build. Eng. 2024, 85, 108475. [Google Scholar] [CrossRef]
  40. Dale, J.D.; Ackerman, M.Y. Evaluation of the Performance of Attic Turbine Ventilators. In Proceedings of the ASHRAE Transactions, Chicago, IL, USA, 23–27 January 1993; Volume 99. [Google Scholar]
  41. Shi, L.; Zhang, G.; Yang, W.; Huang, D.; Cheng, X.; Setunge, S. Determining the Influencing Factors on the Performance of Solar Chimney in Buildings. Renew. Sustain. Energy Rev. 2018, 88, 223–238. [Google Scholar] [CrossRef]
  42. Hassan, F.; Jamil, F.; Hussain, A.; Ali, H.M.; Janjua, M.M.; Khushnood, S.; Farhan, M.; Altaf, K.; Said, Z.; Li, C. Recent Advancements in Latent Heat Phase Change Materials and Their Applications for Thermal Energy Storage and Buildings: A State of the Art Review. Sustain. Energy Technol. Assess. 2022, 49, 101646. [Google Scholar] [CrossRef]
  43. Li, Y.; Liu, S. Numerical Study on Thermal Behaviors of a Solar Chimney Incorporated with PCM. Energy Build. 2014, 80, 406–414. [Google Scholar] [CrossRef]
  44. Khan, N.; Su, Y.; Riffat, S.B.; Biggs, C. Performance Testing and Comparison of Turbine Ventilators. Renew. Energy 2008, 33, 2441–2447. [Google Scholar] [CrossRef]
  45. Afonso, C.; Oliveira, A. Solar Chimneys: Simulation and Experiment. Energy Build. 2000, 32, 71–79. [Google Scholar] [CrossRef]
  46. The Engineering ToolBox. Natural Draft—Air Flow Volume and Velocity; The Engineering ToolBox: 2003. Available online: https://www.engineeringtoolbox.com/natural-draught-ventilation-d_122.html (accessed on 22 July 2024).
  47. Rimdžius, D.; Bielskus, J.; Martinaitis, V.; Motuzienė, V.; Streckienė, G. Experimental Evaluation of Turbine Ventilators Performance under Different Test Conditions. In Proceedings of the E3S Web of Conferences (2018 3rd International Conference on Power and Renewable Energy), Berlin, Germany, 21–24 September 2018; Volume 64. [Google Scholar]
  48. Croce, P.; Formichi, P.; Landi, F. Evaluation of Current Trends of Climatic Actions in Europe Based on Observations and Regional Reanalysis. Remote Sens. 2021, 13, 2025. [Google Scholar] [CrossRef]
  49. Chirosca, A.M.; Rusu, L. Characteristics of the Wind and Wave Climate along the European Seas Focusing on the Main Maritime Routes. J. Mar. Sci. Eng. 2022, 10, 75. [Google Scholar] [CrossRef]
  50. Dimitroulopoulou, C. Ventilation in European Dwellings: A Review. Build. Environ. 2012, 47, 109–125. [Google Scholar] [CrossRef]
  51. Chen, C.; Zhao, B. Review of Relationship between Indoor and Outdoor Particles: I/O Ratio, Infiltration Factor and Penetration Factor. Atmos. Environ. 2011, 45, 275–288. [Google Scholar] [CrossRef]
  52. Rosbach, J.; Krop, E.; Vonk, M.; Van Ginkel, J.; Meliefste, C.; De Wind, S.; Gehring, U.; Brunekreef, B. Classroom Ventilation and Indoor Air Quality-Results from the FRESH Intervention Study. Indoor Air 2016, 26, 538–545. [Google Scholar] [CrossRef] [PubMed]
  53. Fisk, W.J.; Mirer, A.G.; Mendell, M.J. Quantitative Relationship of Sick Building Syndrome Symptoms with Ventilation Rates. Indoor Air 2009, 19, 159–165. [Google Scholar] [CrossRef] [PubMed]
  54. Jafari, M.J.; Khajevandi, A.A.; Najarkola, S.A.M.; Yekaninejad, M.S.; Pourhoseingholi, M.A.; Omidi, L.; Kalantary, S. Association of Sick Building Syndrome with Indoor Air Parameters. Tanaffos 2015, 14, 55–62. [Google Scholar]
  55. ASHRAE Standard 62.1-2010; Ventilation for Acceptable Indoor Air Quality. ASHRAE: Melbourne, Australia, 2010.
  56. Shieh, T.H.; Chang, P.C.; Chiang, C.M.; Lai, C.M. Potential Assessment of an Innovative Hybrid Ventilator for Building Ventilation. J. Mech. Sci. Technol. 2010, 24, 2341–2345. [Google Scholar] [CrossRef]
  57. Dąbrowski, P.; Andrzejczyk, R.; Wacławik, M.; Mikielewicz, D. Window Frame Integrable Air Recuperation Minichannel/Minigap Heat Exchanger. Appl. Therm. Eng. 2024, 247, 123116. [Google Scholar] [CrossRef]
  58. Schulze, T.; Eicker, U. Controlled Natural Ventilation for Energy Efficient Buildings. Energy Build. 2013, 56, 221–232. [Google Scholar] [CrossRef]
Figure 5. The idea of Model 1. Natural ventilation supported by a roof wind turbine ventilator.
Energies 17 03795 g005
Figure 6. The idea of Model 2. Natural ventilation supported by a solar chimney.
Energies 17 03795 g006
Figure 7. The idea of Model 3. Natural ventilation supported by a solar chimney with latent thermal energy storage connected to a heat source.
Energies 17 03795 g007
Figure 10. Flow chart to predict PVS volumetric flow rates.
Energies 17 03795 g010
Figure 11. Schematic model of passive ventilation systems: 1—submodel prepared for simulation of different passive ventilation systems (Model 1, Model 2, Model 3), 2—package containing models to read weather data, 3—expandable connector used to implement the weather data bus, 4—mathematical component representing minimum value for volumetric flow supplied to residential building objects.
Energies 17 03795 g011
Figure 15. Volumetric flow of fresh air simulated for Gdansk: black continuous line presents the simulated data with a frequency of 0.5 h; red dots present the average value of volumetric fresh flow for every 30 days.
Energies 17 03795 g015
Figure 16. Average climate parameters for Gdansk: black continuous line presents the simulated data with a frequency of 0.5 h; red dots present the average value for each 30 days.
Energies 17 03795 g016
Figure 17. Average climate parameters for selected cities in Poland.
Energies 17 03795 g017
Figure 18. Volumetric flow of fresh air simulated for (left) Hamburg and (right) Frankfurt.
Energies 17 03795 g018
Figure 19. The volumetric flow of fresh air simulated for (left) Berlin and (right) Munich.
Energies 17 03795 g019
Figure 20. Average climate parameters for selected cities in Germany.
Energies 17 03795 g020
Figure 21. Volumetric flow of fresh air simulated for (left) Paris and (right) Lyon.
Energies 17 03795 g021
Figure 22. Volumetric flow of fresh air simulated for (left) Marseille and (right) Nantes.
Energies 17 03795 g022
Figure 23. Average climate parameters for selected cities in France.
Energies 17 03795 g023
Figure 24. Volumetric flow of fresh air simulated for (left) Bilbao and (right) Madrid.
Energies 17 03795 g024
Figure 25. Volumetric flow of fresh air simulated for (left) Murcia and (right) Sevilla.
Energies 17 03795 g025
Figure 26. Average climate parameters for selected cities in Spain.
Energies 17 03795 g026
Figure 27. Volumetric flow of fresh air simulated for (left) Milano and (right) Napoli.
Energies 17 03795 g027
Figure 28. Volumetric flow of fresh air simulated for (left) Rome and (right) Palermo.
Energies 17 03795 g028
Figure 29. Average climate parameters for selected cities in Italy.
Energies 17 03795 g029
Figure 30. Volumetric flow of fresh air simulated for (left) Athens and (right) Thessaloniki.
Energies 17 03795 g030
Figure 31. Average climate conditions for selected cities in Greece.
Energies 17 03795 g031
Figure 32. Volumetric flow of fresh air simulated for (left) Sofia and (right) Varna.
Energies 17 03795 g032
Figure 33. Average climate conditions for selected cities in Bulgaria.
Energies 17 03795 g033
Figure 34. Volumetric flow of fresh air for (left) Bucharest and (right) Constanta.
Energies 17 03795 g034
Figure 35. Average climate conditions for selected cities in Romania.
Energies 17 03795 g035
Figure 36. Volumetric flow of fresh air for (left) Bergen and (right) Oslo.
Energies 17 03795 g036
Figure 37. Volumetric flow of fresh air for (left) Helsinki and (right) Copenhagen.
Energies 17 03795 g037
Figure 38. Average climate conditions for selected cities in the Scandinavia region.
Energies 17 03795 g038
Figure 39. Volumetric flow of fresh air for (left) Brussels and (right) Amsterdam.
Energies 17 03795 g039
Figure 40. Average climate conditions for selected cities in Benelux countries.
Energies 17 03795 g040
Figure 41. Volumetric flow of fresh air simulated for (left) Gdansk and (right) Warsaw.
Energies 17 03795 g041
Figure 42. Volumetric flow of fresh air simulated for (left) Cracow and (right) Wroclaw.
Energies 17 03795 g042
Figure 43. Comparison of propagation trend lines for selected cities located in the northern part of Europe.
Energies 17 03795 g043
Figure 44. Comparison of propagation trend lines for selected cities located in the southern part of Europe.
Energies 17 03795 g044
Figure 45. Geographical distribution of selected European cities (map was created in Matlab according to the geographical position presented in Google Maps) with a recommended type of ventilation system.
Energies 17 03795 g045
Figure 46. The potential of CO2 emissions saved by using a passive ventilation system presented in Model 3.
Energies 17 03795 g046
Table 1. Summary of presented literature regarding the different enhancement methods in natural ventilation systems: WC—wind catcher.
YearPublicationSCSC-PCM-WCSC-PCMSC-WTV-PCMNovelty
2016[11] roof solar chimney equipped with a perforated absorber plate
2015[12] experimental study for a solar chimney with large gap-to-height ratios
2007[13] design of a solar chimney to induce natural ventilation in a residential building
2008[14] mathematical modeling of optimal till for maximizing air flow rate through solar chimney referring to daily solar radiation level
2014[15] mathematical model for rooftop solar chimney
2016[17] a universal empirical model for volumetric airflow at the solar chimney
2009[18] experimental results for solar chimney operated in real conditions
2017[19] numerical simulation of solar chimney integration with PCM material for different operation parameters
2015[27] numerical simulation of heating performance for solar chimney integration with PCM for different parameters
2019[28] experimental investigations in laboratory conditions of a solar chimney integrated with PCM
2021[31] experimental investigations of solar chimney integration with a wind turbine ventilator
2020[37] possibility of integrating rooftop solar chimneys with waste heat from PV panels
2020[38] integration of solar chimneys with an accumulated wall (filled by PCM) and windcatcher
2024[39] determining the efficiency of passive solar systems based on using solar chimneys integrated with a wind catcher
Table 2. Percentage times in which the minimum required flow of fresh air was provided by different simulated passive ventilation technologies for different European cities.
PolandModel/CityGdanskWarsawWroclawCracow
Model 161.30%55.34%54.45%51.65%
Model 261.32%60.74%57.35%56.1%
Model 399.40%99.81%99.73%99.58%
GermanyModel/CityHamburgBerlinFrankfurtMunich
Model 159.09%55.00%54.21%48.34%
Model 262.63%60.00%59.51%53.54%
Model 399.88%99.79%99.61%99.59%
FranceModel/CityParisLyonMarseilleNantes
Model 152.08%%46.00%39.28%44.10%
Model 258.15%53.52%52.08%51.40%
Model 399.69%99.56%99.37%99.64%
SpainModel/CityBilbaoMadridMurciaSevilla
Model 149.19%47.99%31.93%13.64%
Model 258.71%65.54%50.45%29.86%
Model 399.24%99.41%99.31%96.30%
ItalyModel/CityMilanoNapoliPalermoRome
Model 137.69%25.91%12.52%30.82%
Model 242.56%33.34%25.91%39.42%
Model 399.49%99.41%99.49%99.35%
Scandinavian CountriesModel/CityBergenOsloHelsinkiCopenhagen
Model 174.45%63.97%69.82%70.46%
Model 275.49%66.45%73.41%74.54%
Model 399.95%99.95%99.92%99.95%
GreeceModel/CityAthensThessaloniki
Model 119.85%33.01%
Model 232.82%45.46%
Model 399.25%99.31%
BulgariaModel/CitySofiaVarna
Model 147.05%41.86%
Model 252.75%48.03%
Model 399.57%99.36%
RomaniaModel/CityBucharestConstanta
Model 143.92%46.84%
Model 254.12%57.62%
Model 399.07%99.59%
BeneluxModel/CityBrusselsAmsterdam
Model 157.59%63.20%
Model 260.54%67.39%
Model 399.81%99.88%
Disclaimer/Publisher’s Note: The statements, opinions and data contained in all publications are solely those of the individual author(s) and contributor(s) and not of MDPI and/or the editor(s). MDPI and/or the editor(s) disclaim responsibility for any injury to people or property resulting from any ideas, methods, instructions or products referred to in the content.

