Abstract
As a key project of China’s western development, the West-East Natural Gas Transmission Project (WENGT) has effectively alleviated China’s uneven energy distribution and supply-demand issues. It has promoted the optimization of China’s energy structure and sustainable development in the new era, helping to achieve the goal of “double carbon”. Based on pollution data from Chinese industrial enterprises from 2000 to 2012, this paper analyzes the impact of the West-East Natural Gas Pipeline Project on the air pollution emissions of industrial enterprises using a difference-in-difference model and explores the moderating role of local government environmental regulations. The findings indicate that the project significantly reduced air pollutant emissions from industrial enterprises in cities along the route, with a more pronounced reduction effect in areas with higher environmental regulation intensity. Additionally, the emission reduction effect varied among different types of enterprises and regions, with private enterprises showing the smallest reduction impact and the eastern coastal region exhibiting the most significant effect. This paper delves into the relationship between sustainable cross-regional energy development and air pollution emissions from industrial enterprises, providing a theoretical basis for energy conservation and emission reduction policies in China.
1. Background of the Study
In the context of China’s rapid economic development, adhering to the transformation of industrial greening and promoting the greening and decarbonization of economic and social development is a key link in achieving high-quality development [1]. However, with the rapid development of the economy, the environmental pollution problem has become increasingly serious, and industrial enterprises have become one of the main sources of environmental pollution, especially in terms of air pollution, including the emission of pollutants such as sulfur dioxide, nitrogen oxides, and soot, which not only affects the quality of life of the people but also causes serious damage to the environment and ecosystems [2]. In the face of this serious situation, the Chinese government has increased its emphasis on environmental protection, energy conservation, and emission reduction and put forward a series of specific environmental protection goals and measures, such as promoting the construction of an ecological civilization, strengthening the prevention and control of atmospheric pollution, and implementing stricter environmental protection policies. The report of the 20th Party Congress highly emphasized the importance and urgency of reducing emissions [3]. Energy saving and emission reduction work is not only conducive to the protection of the environment and an improvement in ecology but also a key part of realizing sustainable economic development.
There is an obvious regional imbalance in the distribution of energy resources in China. The eastern region is relatively resource-poor but has a high level of industrial development and a strong demand for energy, while the western region is rich in resources but has a low energy utilization rate due to lagging infrastructure construction and insufficient market development [4]. This imbalance exacerbates the uneven economic development between regions and puts more pressure on the environment. As industrialization accelerates, energy demand continues to grow, and the conflict between energy supply and demand between regions is becoming increasingly acute, further increasing the challenge of reducing emissions. Therefore, it is of great significance to solve the problem of imbalanced regional distribution of resources and the economy and to promote the balanced and effective utilization of energy to achieve the goal of emission reduction [5].
In response to the above problems, the government put forward the strategy of western development, and cross-regional energy dispatch is an important part of it. The western region is rich in resources, especially clean energy such as natural gas and hydropower, while the eastern region faces the problems of an insufficient energy supply and environmental pollution [6]. By transferring the abundant clean energy from the western region to the eastern region, this not only meets the growing energy demand of the eastern region but also improves the environmental quality of the eastern region and reduces the air pollution emissions from industrial enterprises. The West-to-East Gas Transmission Project, which mainly transports natural gas resources from the western region to the eastern region, is the largest natural gas transmission project in China, and its pipeline length ranks among the longest in the world. The project consists of several gas transmission pipelines spanning several provinces and finally arriving at the major cities and industrial bases in the eastern region, which greatly improves the energy supply capacity of the eastern region and provides clean energy options for industrial enterprises, reducing air pollution emissions from traditional coal-fired industries [7]. At the same time, the West-to-East Gas Pipeline Project has also promoted economic development of the western region, upgraded the living standards of the local residents, and realized the complementary advantages of the resources of the eastern and western regions and their common development. In the process of implementation, the government has strengthened pipeline safety management and environmental protection and taken a series of measures to ensure the safe operation of the project and environmental protection, which has achieved significant economic and environmental benefits. Therefore, as an important part of China’s energy strategy, the West-East Natural Gas Pipeline Project is of great significance in promoting optimization of the energy structure and reducing the emission of air pollution from industrial enterprises, and it has also made positive contributions to China’s economic development and environmental protection.
The main purposes of this study are to analyze the impact of the West-East Natural Gas Transmission Project on the air pollutant emissions of industrial enterprises and to explore the moderating effect of local government environmental regulation. The following two hypotheses are made. Firstly, the West-East Natural Gas Transmission Project can significantly reduce the level of air pollutant emissions from industrial enterprises in cities along the route, and secondly, the intensity of local government environmental regulation will have a moderating effect on the emission reduction effect of the West-East Natural Gas Transmission Project. By demonstrating these hypotheses, this paper will provide a theoretical basis for the relationship between sustainable cross-regional energy development and air pollution emissions from industrial enterprises as well as provide policy recommendations for the effective promotion of energy conservation and emission reduction in China.
2. Literature Review
In the 20th Party Congress, it was proposed that “by continuing to promote green transformation, improve the efficiency of China’s energy and resource utilization, and accelerate the development of green and low-carbon industries, it will help China to comprehensively advocate the concept of green development, and explore a development path that is low in energy consumption, high in efficiency, and strong in sustainability”, which has played an crucial role in the sustainable and stable development of China’s economy [8,9]. China’s inter-regional economy has a close correlation, but the regional distribution of energy resources is unbalanced. In order to promote the optimization of energy resource allocation, China has implemented major energy projects such as west-east gas transmission, west-east power transmission, and north-south coal transportation [10,11,12,13]. The primary goal of the West-East Gas Transmission Project is to transfer substantial energy from the western region to the economically developed eastern coast, meeting their energy consumption needs. Thus far, the first and second lines of the West-East Natural Gas Transmission Project have been put into full operation, and the construction of the third line is still in progress. As of 2021, the annual gas transmission capacity of the West-East Natural Gas Transmission Project has exceeded 100 billion cubic meters, the cumulative gas transmission capacity has reached 700 billion cubic meters, and the scope of the gas supply has covered more than 400 cities, more than 3000 large- and medium-sized enterprises, and nearly half a billion people of the Yangtze River Delta, Pearl River Delta, and central Chinese population [14]. According to the existing research, according to the amount of natural gas delivered annually by the West-East Natural Gas Pipeline I and II projects, the supplied natural gas can replace 120 million tons of coal and reduce carbon dioxide emissions by 200 million tons and sulfur dioxide emissions by 2.26 million tons, which is a great impetus for the improvement of China’s energy structure and enhancement of the quality of the environment [15]. This alleviates the lack of energy in the eastern part of China and is of great significance to the high-quality development of China’s economy [16,17,18].
Some scholars have noted that the practical application of natural gas in the power industry has significantly reduced carbon emissions from coal-fired power plants [19,20]. Additionally, studies have demonstrated a long-term feedback mechanism between carbon dioxide and sulfur dioxide emissions, as well as natural gas and renewable energy consumption. Specifically, for every 1% increase in natural gas and renewable energy consumption, carbon dioxide and sulfur dioxide emissions decrease by 0.1641% and 0.2601%, respectively [21]. The West-East Natural Gas Transmission Project not only satisfies the energy demands of industrial economic development and reduces the emission of related pollutants [22], but it also resolves transportation bottlenecks for enterprises in the Middle East to utilize energy from the western region, fostering synergistic development from west to east across different regions of China [23]. This initiative is critical for promoting China’s energy transformation and sustainable economic development [24,25]. In recent years, Chinese governments at all levels have enacted a range of environmental laws, regulations, and policies and have implemented numerous specific measures in regional environmental management, pollution prevention, control, and management [26,27,28]. Environmental regulations have prompted enterprises to adopt cleaner production technologies, reducing pollutant emissions during the production process and thus minimizing environmental losses per unit of product [29]. Furthermore, these policies have incentivized enterprises to pursue green innovations, promoting technological advances in green industries, improving competitive capabilities, enhancing production efficiency, and increasing profits [30]. With stricter environmental regulations, enterprises are increasingly choosing natural gas—a cleaner energy source with lower emissions per unit of pollutant—as a replacement for traditional, highly polluting energy sources [31]. The vigorous promotion of natural gas usage not only supports energy security and controls air pollutant emissions but also plays a significant role in promoting the upgrading of industrial structures and achieving green economic growth [32,33]. Therefore, the West-East Natural Gas Transmission Project has enhanced the natural gas supply capacity and optimized the energy consumption structure of enterprises. Although natural gas is more expensive than coal, it reduces the emission of sulfur dioxide and soot, lowering the pollution level per unit of enterprise output [34]. As a crucial energy deployment project in China, the West-East Natural Gas Transmission Project effectively promotes the optimization of spatial energy resource allocation, which is conducive to China’s overall economic growth and the achievement of emission reduction goals [35].
To summarize, this paper focuses on the West-East Natural Gas Pipeline Project (WEGP) to explore how the WEGP affects the air pollutant emissions of industrial enterprises along the pipeline and how the strength of a local government’s environmental regulation regulates the emission reduction effect of the WEGP. Using the double difference model, the 32 prefecture-level cities along the pipeline of the West-East Natural Gas Pipeline Project are considered the treatment group, while the other prefecture-level cities or regions in China (excluding Hong Kong, Macao, and Taiwan) are considered the control group, and the impacts of different regions and types of enterprises are also analyzed. This helps promote the harmonious development of the region and construction of the energy system, and it provides a theoretical basis for the green and low-carbon development of China in the new era.
3. Research Hypothesis
Under China’s coal-based energy consumption structure [36], the price of natural gas is much higher than that of the cheaper coal resources. Therefore, industrial enterprises often tend to use the cheaper coal as the main energy supply. However, coal combustion produces a substantial amount of air pollutants. Implementation of the West-East Natural Gas Pipeline Project has provided cities along the route with abundant natural gas, thereby reducing the cost of using natural gas and influencing industrial enterprises to shift their energy choices. The natural gas unit combustion value is higher than those of traditional energy sources such as coal and emits fewer pollutants when burned. Industrial enterprises are more inclined to adopt clean natural gas to replace coal in the face of environmental pressure and the cost considerations brought about by coal [37]. West-east gas transmission has effectively increased the proportion of natural gas resources in China’s energy consumption structure [38,39]. The implementation of this project provides a relatively inexpensive clean energy option, which is expected to reduce air pollutant emissions from industrial enterprises in the cities along the route and make an important contribution to the realization of environmental protection goals. As a result, the first hypothesis of this paper is as follows:
Hypothesis 1.
The West-East Natural Gas Transmission Project can reduce the level of air pollutant emissions from industrial enterprises in cities along the route.
The varying intensity of environmental regulation by local governments may have a moderating effect on the emission reduction effect of the WEGP. Specifically, regions with higher intensities of environmental regulations may impose stricter emission standards and restrictions on industrial enterprises, thus prompting them to further shift to cleaner energy sources and reduce pollutant emissions, which may improve the emission reduction effect of the WEGT project [40]. On the contrary, in regions with lower intensities of environmental regulations, industrial enterprises may still use traditional and highly polluting energy sources due to the lack of external pressure, limiting the emission reduction effect of the West-East Natural Gas Transmission Project [41]. At the same time, local governments which pay more attention to environmental issues may take more active actions, enhancing the emission reduction effect of the West-East Gas Pipeline Project. Therefore, the intensity of environmental regulation by local governments may affect the emission reduction effect of the West-East Natural Gas Pipeline Project to a certain extent. This study will examine the moderating role of local government environmental regulations by measuring and comparing their strength in different regions and analyzing changes in air pollutant emissions from industrial enterprises following the project’s implementation. An in-depth study of the implementation of local government environmental regulatory policies and their impact on the emission behavior of industrial enterprises can provide a better understanding of the role of local governments in the emission reduction effect of the West-East Natural Gas Pipeline Project and provide references and suggestions for the development of more effective environmental management policies. This leads to the second hypothesis of this paper:
Hypothesis 2.
The intensity of local governments’ environmental regulations will moderate the emission reduction effect of the West-East Natural Gas Pipeline Project.
4. Data Selection and Empirical Methods
4.1. Data Sources and Processing
4.1.1. Data Sources
The enterprise-level data used in this paper were sourced from multiple databases, including the China Industrial Enterprises Database, the China Industrial Enterprises Pollution Database, the CSMAR China Economic and Financial Research Database, the Pollutant Emission Database for the Manufacturing Industry, and the Zhongjing.com Enterprise Large Database. Among them, the database of China’s industrial enterprises is mainly set up by the National Bureau of Statistics, and its data mainly come from the quarterly and annual summaries of the sample enterprises, while its sample scope is all of the state-owned industrial enterprises as well as the non-state-owned industrial enterprises with a main business income (i.e., sales) of CNY 5 million and above, where its statistical unit is the enterprise legal person. The statistical caliber of “industry” here includes the three categories of “manufacturing industry”, “extractive industry”, and “electric power, gas and water production and supply industry” in the classification of national economic industries. The classification of “industry” in this database includes three categories—manufacturing, extractive industries, and the production and supply of electricity, gas, and water—with a focus primarily on the manufacturing sector. The data indicators include basic enterprise information and financial data, China’s industrial enterprise pollution database approved by the Bureau of Statistics, and the Ministry of Environmental Protection, with a total of 27 industrial pollutant emissions and pollution control indicators [42]. These cover pollution emission data for state-owned and large-scale non-state-owned industrial enterprises, detailing the types of emissions, amounts, and treatment status. The data sample includes industrial enterprises whose pollutant emissions account for more than 85% of the total local pollutant emissions [43]. In this paper, we use the unique identifier corresponding to the enterprise identity information and the data year to match the Chinese industrial enterprise database and the Chinese industrial enterprise pollution database together to form the panel data at the industrial enterprise level.
4.1.2. Sample Selection
In this paper, when delineating the scope of the cities along the route of the West-East Natural Gas Pipeline Project, the primary sources are the China Gas Pipeline Distribution Map 2013, published by the Editorial Board of the China Gas Industry Yearbook, and information from the West-East Natural Gas Pipeline Project article on Wikipedia. In addition, this paper cross-checks this scope delineation based on the local government’s annual report about whether it receives natural gas supplied by the West-East Natural Gas Pipeline to ensure the reasonableness of the scope delineation. In order to examine the moderating effect of local governments’ environmental regulation intensity on the emission reduction effect of the West-East Natural Gas Pipeline Project, we needed to construct appropriate governmental environmental regulation intensity variables for their measurement. There have been many methods for constructing variables to measure the strength of environmental governance in the existing literature, such as using the number of environmental protection workers, R&D investment in the field of environmental protection, and the level of sewage taxes and fees [44,45]. However, these variables can only measure one aspect of environmental governance and not the whole picture of environmental governance. Every year, governments at all levels report their achievements for the past year and their plans for the coming year to the General Assembly during the “Two Sessions” at the beginning of the year, which plays a key role in guiding the government’s work for the whole year. The frequency and proportion of environment-related terms in these reports can effectively reflect the government’s commitment to and actions in environmental governance. By analyzing the use of environment-related vocabulary in government work reports, it is possible to better grasp the whole picture of the government’s environmental governance policies and understand the extent to which the government attaches importance to environmental issues as well as the strength of local environmental regulatory policies. In this paper, we refer to Chen et al. (2016) [46] and Chen Shiyi et al. (2018) [29] and construct a proxy variable for the strength of environmental regulation of each prefecture-level municipal government based on the frequency of keywords related to “environmental protection” in the whole text of the government’s work report each year (Figure 1).
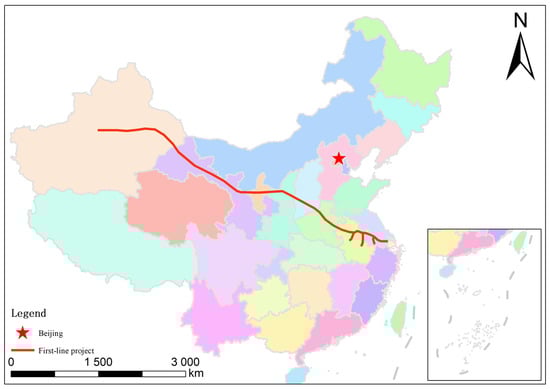
Figure 1.
Location map of west-east natural gas pipeline project. The red line represents the first line of the West-East Gas transmission project, and the other colors represent the administrative divisions of different provinces in China.
4.1.3. Data Processing
This paper focuses on the impact of the first line of the West-East Natural Gas Pipeline Project on air pollutant emissions from enterprises. Since the second line of the project was officially commissioned at the end of 2012, to avoid its influence and define the control scope accurately, this study limited the enterprise data sample period to 2000–2012. Additionally, all industry standards were unified to the 2002 version. To ensure data reliability, several treatments were applied to the merged corporate pollution panel data. Samples with negative or missing sales revenues, total assets, total liabilities, and total fixed assets were excluded; samples with fewer than eight employees were removed; all nominal variables were deflated to the base year of 2000; and any firms founded before 1949 were excluded from the sample.
4.2. Model Design
4.2.1. Basic DID Model
In this paper, whether the pipeline of the West-East Natural Gas Pipeline Project passes through the prefecture-level cities where the enterprises are located or not is regarded as a quasi-natural experiment, the 32 prefecture-level cities where the pipeline passes through are regarded as the treatment group, and the other prefecture-level cities or regions in the whole country (excluding Hong Kong, Macao, and Taiwan) are regarded as the control group. Double-difference modeling is used to identify the emission reduction effect of the West-East Natural Gas Pipeline Project on air pollutants in the cities along the pipeline. Since the first line of the West-East Natural Gas Pipeline Project was completed and put into operation on 1 October 2004, this paper argues that the pollution abatement effect of the project on enterprises mainly started to play a role from 2005 onward:
where denotes the air pollutant emission level of firm in prefecture-level city in year . In this paper, we use sulfur dioxide emissions and soot emissions to measure the air pollutant emission levels of firms and take the logarithmic form of the two, where denotes the double-difference estimator (i.e., it indicates whether or not one of the cities in which firm is located in year t is along the first line of the West-East Natural Gas Pipeline Project); denotes firm-level control variables which may have an impact on the level of air pollutant emissions; then indicates the year’s fixed effects; denotes the city’s fixed effects; and denotes the random error term. In order to eliminate the effects of the heteroskedasticity problem and the autocorrelation problem, this paper clusters the standard errors to the individual firm level. The coefficient is the focus of this paper, which portrays the policy impact of the first phase of the West-East Natural Gas Pipeline Project, and if it is significantly less than zero, then this means that the completion of the project can significantly reduce the level of air pollutant emissions from industrial enterprises in the cities along the route, and its emission reduction effect is verified.
4.2.2. Moderated Effects Model
Equation (1) mainly discusses the average treatment effect of the policy. In fact, there are large differences in the degree of importance attached to environmental issues by local governments. Local governments which pay more attention to environmental issues are likely to impose stricter controls on pollution emissions from local industrial enterprises. This will lead to a greater likelihood that local firms will switch to cleaner energy sources, such as the use of natural gas instead of coal. Due to transportation cost considerations, this impact is likely to be more significant along the West-East Gas Pipeline. In addition, if local governments pay more attention to environmental issues, then they are likely to introduce policy measures such as equipment conversion subsidies and gas subsidies during the period of “coal-to-gas” conversion. These policy measures have the potential to make it easier for businesses to accept the use of natural gas as their primary energy source, which in turn will drive their emissions reductions. For firms located in cities farther away from the WEG pipeline, the cost of transportation and use of natural gas makes it difficult to attribute the mitigation effect of the WEG project in these cities, even if the local government’s environmental controls have produced some degree of mitigation. As a result, on the basis of Equation (1), this paper proposes a model of the moderating effect of the government’s environmental regulation intensity on the emission reduction effect of the West-East Natural Gas Transmission Project, which is specifically expressed as shown in Equation (2):
Here, denotes the strength of government environmental regulation in city in year . This variable is calculated based on the frequency of keywords related to “environmental protection” in the government work reports of each prefecture-level city in each year. The coefficient estimate measures the size of the moderating effect of the environmental regulation intensity of prefecture-level municipal governments, and if it is significantly negative, then this indicates that the stronger the government’s environmental regulation intensity, the stronger the emission reduction effect of the West-East Natural Gas Pipeline Project on the industrial enterprises in the cities along the pipeline; that is, the government’s environmental regulation intensity has a significant reinforcing effect on the emission reduction effect of the West-East Natural Gas Pipeline Project. In assessing the impact of the air pollution reduction effect of the West-East Natural Gas Pipeline, it is necessary to comprehensively consider the influence of a variety of factors in order to more fully understand its actual effect on the reduction of emissions by industrial enterprises in cities along the route.
4.3. Variable Description
4.3.1. Explanatory Variable
The explanatory variable of this paper is the level of air pollutant emissions from industrial companies. Air pollutant emissions are one of the common environmental problems in industrial activities, usually including emissions of sulfur dioxide, nitrogen oxides, soot, and other harmful gases and particulate matter. In this paper, we focus on the impact of the West-East Natural Gas Pipeline Project, while natural gas is often used as an energy alternative to coal in industrial enterprises, and natural gas, as a clean energy source, replaces coal as a source of energy which can significantly reduce the sulfur dioxide and soot produced during the combustion of coal. Therefore, this paper chooses to measure the level of air pollutant emissions from industrial enterprises from two perspectives—sulfur dioxide emissions () and soot emissions ()—and takes the logarithmic form for both. By studying and analyzing the changes in emissions, it is possible to understand the actual impact of the West-East Natural Gas Pipeline Project on the pollution emissions of industrial enterprises in the cities along the route and provide a scientific basis for the formulation of future environmental protection policies.
4.3.2. Core Explanatory Variables
Based on the previous section, this paper delineates the scope of the cities along the West-East Natural Gas Pipeline Project. In the sample period, if the city c of enterprise i is a city along the West-East Natural Gas Pipeline Project, then is set, and it is 0 for the opposite case. If the sample time is after the opening of the whole line of the West-East Natural Gas Pipeline Project (i.e., in 2005), then is set, and it is 0 for the opposite case. The cross-multiplication term of the two is the core explanatory variable of the double-difference model in this paper.
4.3.3. Adjustment Variables
Environmental protection work has a strong systematic nature, and thus we could not simply select environmental terms with slogans, such as environmental protection, green, or emission reduction. We had to start from the specific aspects of environmental protection work and comprehensively analyze the terms which may be related to environmental protection work in the government’s work report. Therefore, with reference to Zhang Jianpeng et al. (2021) [47], this paper selected a total of 27 environmental vocabulary terms related to the government’s environmental protection work from the three aspects of environmental protection objectives, environmental protection work objects, and environmental protection measures, as shown in Table 1. Subsequently, based on this vocabulary collection, the government work reports of each prefecture-level city in each year of the sample period were textually analyzed, and the frequency of occurrence of each relevant term was counted.

Table 1.
Perspectives of government environmental protection work and related terms.
4.3.4. Control Variables
In order to minimize the influence of factors other than the core independent variables which may have an impact on the dependent variable, and to ensure comparability between the treatment and control groups, this paper refers to the studies of Jin Hao and Sheng Dan et al. [48,49], and it set a series of enterprise-level control variables which may affect the emission of air pollutants, which specifically include the squared term of the year of the enterprise, the logarithm of the enterprise’s total asset value, the proportion of fixed assets, the debt ratio, the holding status, and the industry category.
4.4. Summary and Limitations of the Research Methodology
4.4.1. Summary of Research Methodology
The following is a chart summarizing the research methodology of this paper (Table 2), including the construction steps of the data sources, sample selection, model design, and main variables, which is mainly used to show the steps of this research.
Table 2.
Summary of research methods.
4.4.2. Limitations of Analytical Methods
In the course of this paper, although our analytical approach is useful, there are some limitations. First, the double-difference model relies on the treatment and control groups having similar trends prior to policy implementation (the parallel trend assumption), an assumption which may be affected by a variety of factors in practical applications. In order to enhance the robustness of the results, this paper controlled for potential confounding factors as much as possible in the model design and data processing. Second, the time period studied in this paper is 2000–2012, which is the implementation time of the first phase of the West-East Natural Gas Transmission Project, but it does not include the data of the second phase and beyond. Therefore, in future studies, consideration could be given to expanding the data timeframe to assess the long-term impacts of the project. Third, the environmental governance intensity variable used in this paper is based on the frequency of keywords in government work reports, a method which better reflects the government’s attention to environmental governance, but this may fail to comprehensively capture the actual governance force.
5. Empirical Findings
5.1. Base DID Model Regression Results
In Table 3, columns (1–6) report the estimation results of the underlying DID model. Among them, columns (1) and (2) incorporate only the core independent variables; columns (3) and (4) incorporate the control variables; and columns (5) and (6) control for city-fixed effects and year-fixed effects along with the control variables, respectively. According to the regression results, it can be found that the coefficients of all core independent variables were significantly negative, which indicates that the West-East Natural Gas Pipeline Project has a significant emission reduction effect and can significantly reduce the level of air pollutant emissions from industrial enterprises in cities along the route. Brandt et al. (2008) found [1] that the introduction of clean energy significantly reduced pollutant emissions during China’s industrial development, which was further demonstrated by the West-East Gas Transmission Project. In addition, Wei et al. (2023) showed [2] that the use of natural gas significantly reduced sulfur dioxide and nitrogen oxide emissions, and the results of this study are consistent with them, proving the effectiveness of the West-East Gas Transmission Project. Similarly, according to Li Hui et al. (2023) [43], the West-East Natural Gas Transmission Project significantly reduces the level of pollution emissions from industrial enterprises along the route by providing clean energy, optimizing the structure of energy consumption, improving the efficiency of energy use, and enhancing the capacity of pollution control, which is consistent with the results of this study and further validates the effectiveness of the West-East Natural Gas Transmission Project.
Table 3.
Regression results of the base DID model.
5.2. Moderated Effects Model
In the moderating effects model, we explored the moderating role of the government’s environmental regulation intensity on the emission reduction effect of enterprises in the West-East Natural Gas Transmission Project, and Table 4 reports the estimation results of the moderating effects model. Among them, columns (1) and (2) include only the core independent variables; columns (3) and (4) include the control variables; and columns (5) and (6) control for the city-fixed effects and year-fixed effects along with the control variables, respectively. According to the regression results, it can be found that the coefficients of the cross-multiplier terms were significantly negative in all cases where the enterprise sulfur dioxide emissions were the dependent variable, while the coefficients of the cross-multiplier terms were insignificant in the cases where the enterprise soot emissions were the dependent variable, which suggests that an increase in the intensity of the government’s environmental regulation will further enhance the mitigation effect of the West-East Natural Gas Pipeline Project on the enterprise’s sulfur dioxide emission reduction, but the enhancement of the mitigation effect on soot was not significant. This result may reflect that local governments pay more attention to key pollutants such as sulfur dioxide and less attention to soot-based pollutants, which also implies a preference for different pollutants in environmental management policies. Overall, however, this result suggests that the intensity of government environmental regulation moderates the emission reduction effect of the West-East Natural Gas Pipeline Project and strengthens the impact of the project on firms’ emission reductions. This is compared with the findings of Chen et al. (2018) [46], who found that strict environmental regulation can effectively promote the adoption of clean energy and technology by enterprises and reduce pollution emissions. It also demonstrates the necessity of strengthening environmental regulation to achieve better environmental governance.
Table 4.
Moderated effects model regression results.
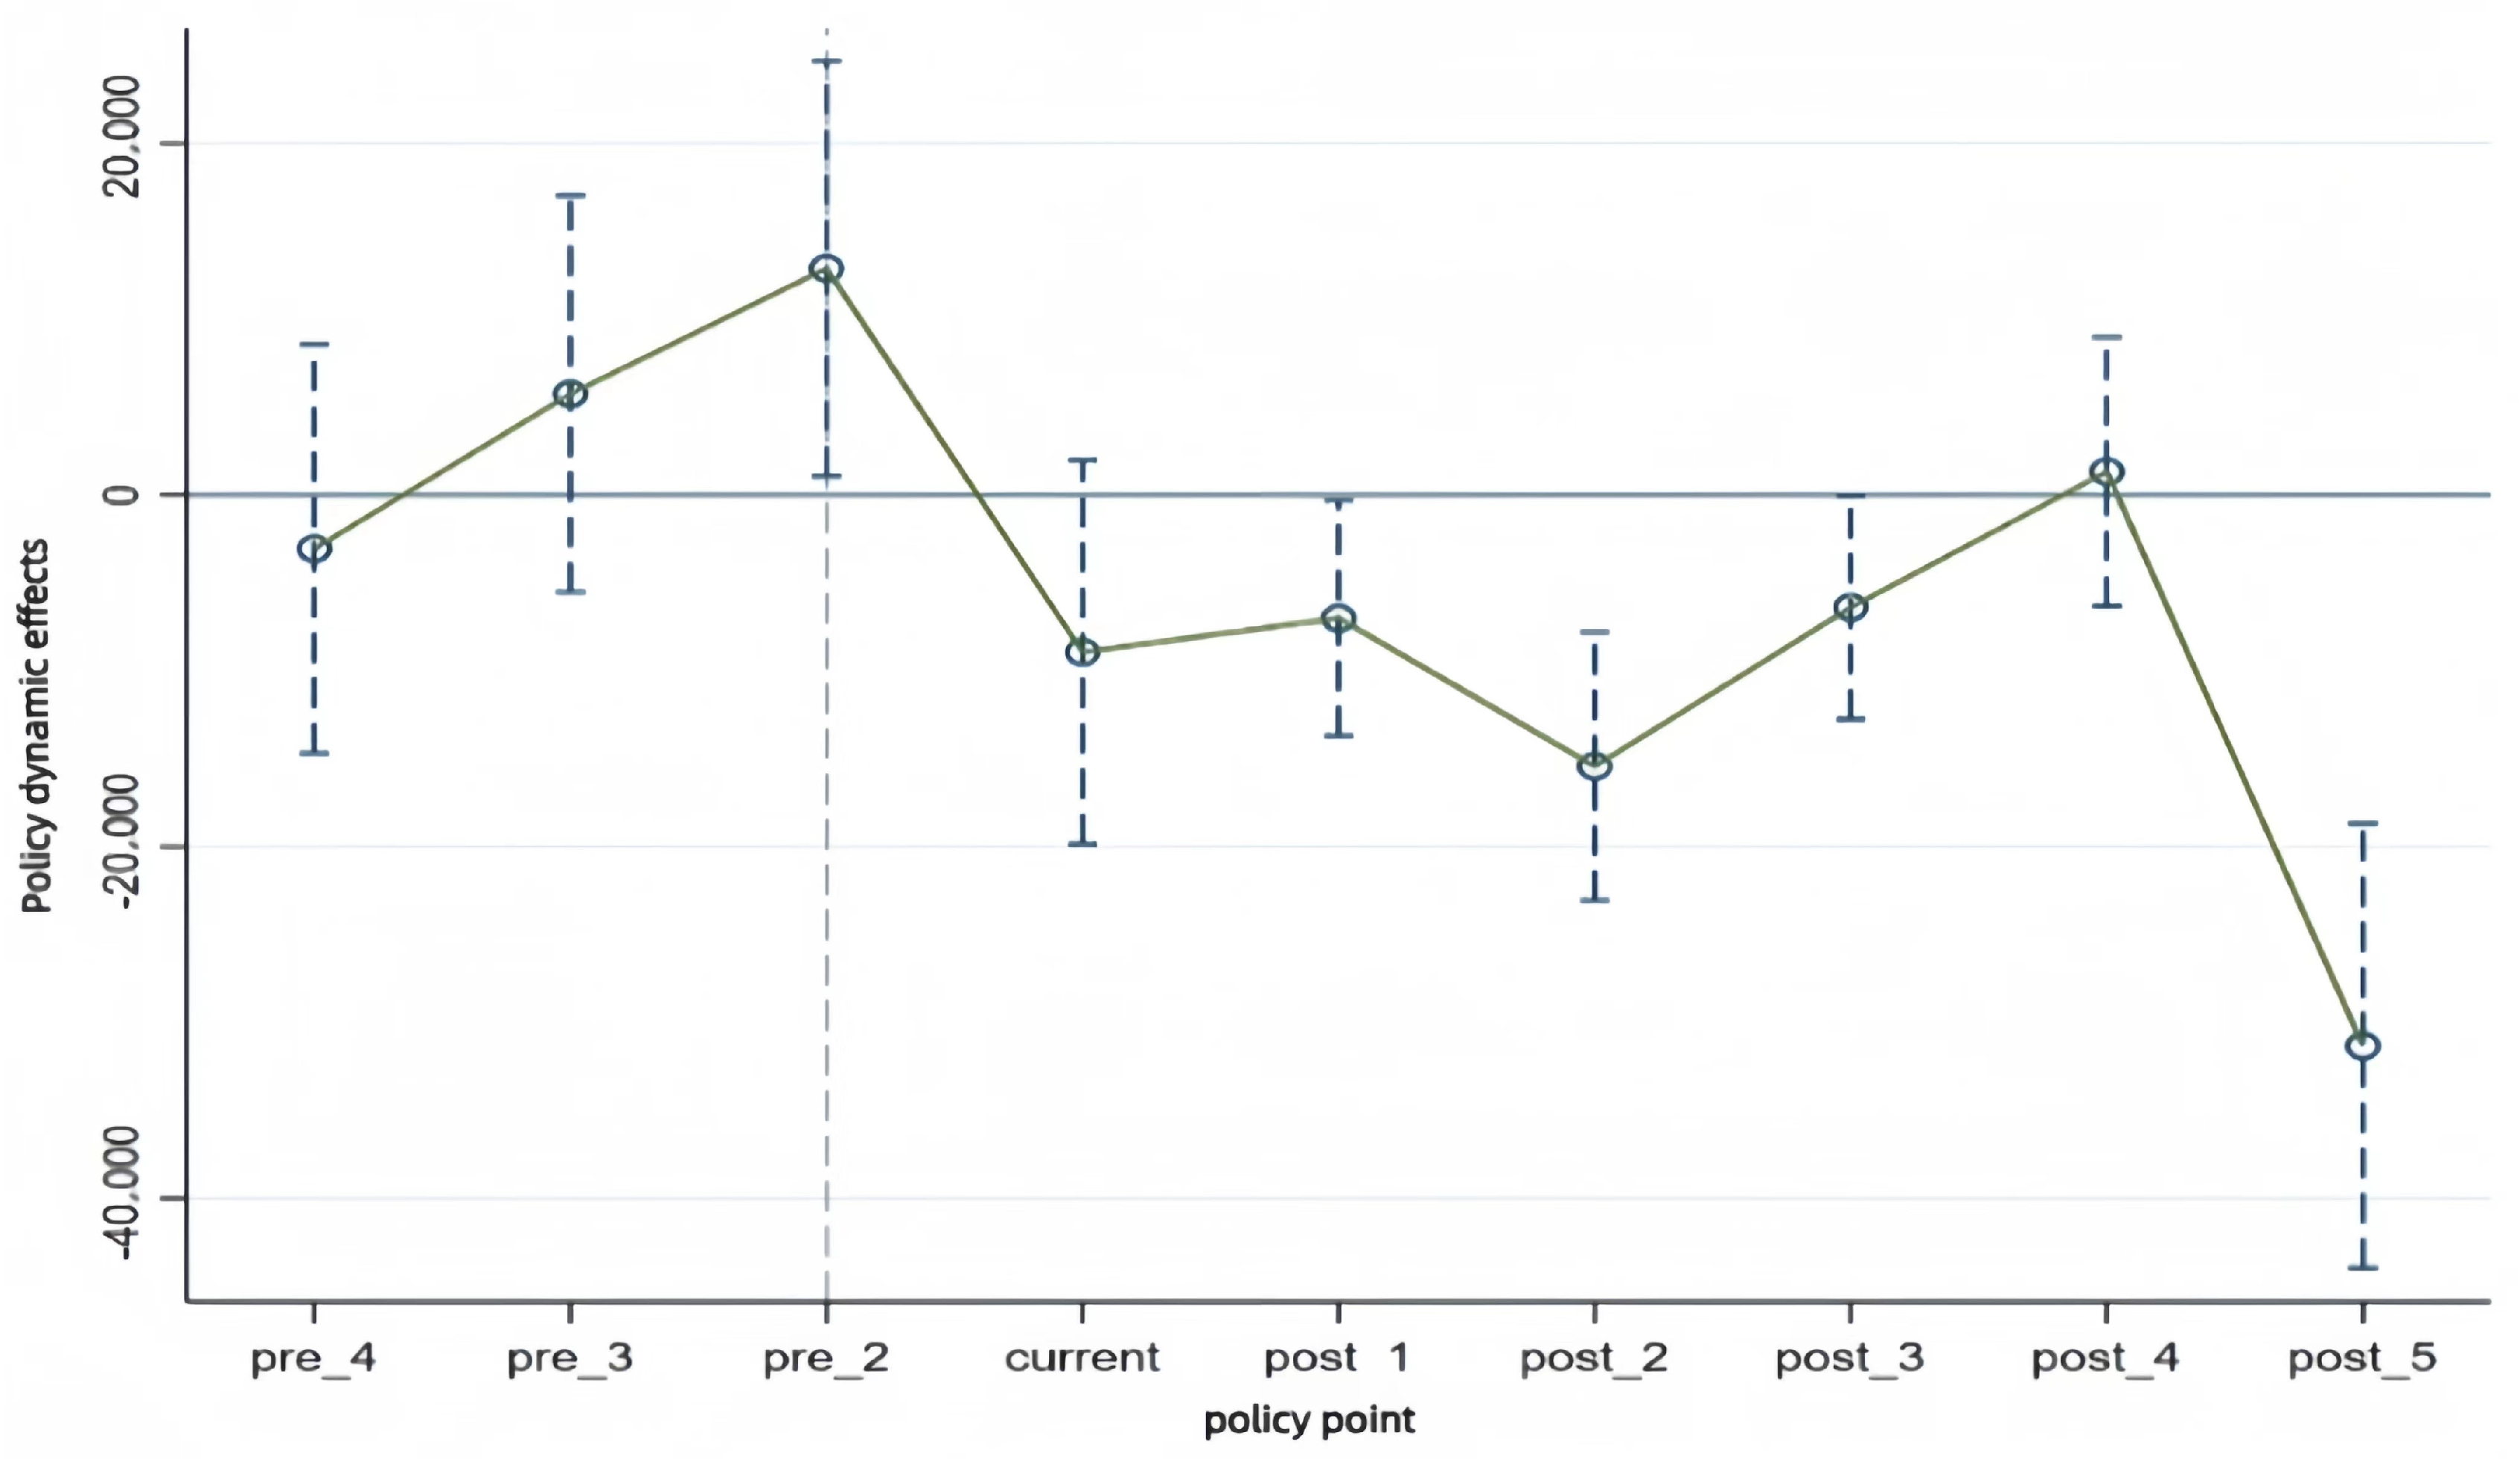
5.3. Parallel Trend Testing: An Event Study Approach
The parallel trend test is an important way to verify the validity of the double-difference model, and in this paper, we used the event study method to conduct the parallel trend test and ensure that the treatment group and the control group had similar trends before the intervention. This step is mainly to exclude the influence of other factors on the results of a study and ensure the reliability and validity of the DID model. If it is found that the trends of the treatment and control groups converge and are not significantly different before the intervention, it can be considered that the basic assumptions of the DID model are satisfied, and then the subsequent causal effect analysis can be carried out. The specific model design is shown in Equation (3) below:
In this paper, we chose 2005 as the time when the whole line of the West-East Natural Gas Pipeline Project was put into operation (i.e., the time when the policy started). Thus, let k = year − 2005. When k = −4, −3……6, 7, the corresponding and is zero otherwise, while k = 0 denotes the year of policy implementation. When is negative, it denotes the time before policy implementation, and when it is positive, it denotes the time after policy implementation. Taking the year before the full line was put into operation (i.e., year = −1) as the base period, the confidence intervals of comparing the coefficients could be observed to show the dynamic effect and parallel trend of the impacts of the first line of the West-East Natural Gas Pipeline Project being put into operation.
Figure 2 reports the results of the parallel trend test. It can be found that, in general, in the years before the implementation of the policy, the estimated coefficients of the year dummy variables were not significant, and the hypothesis of a parallel trend was established. In the years after the implementation of the policy, the coefficients of the treatment group were significantly smaller than those of the control group, and the difference gradually increased, which indicates that the air pollution reduction effect of the West-East Natural Gas Pipeline Project was persistent and gradually increased over time.
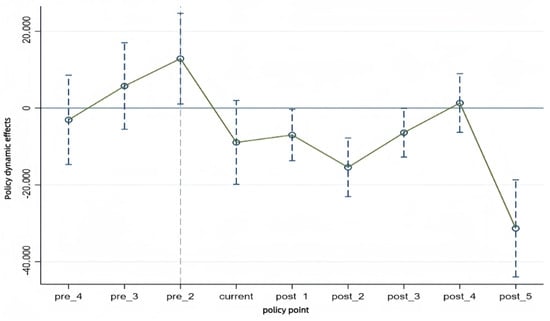
Figure 2.
Sulfur dioxide emissions.
5.4. Placebo Testing
In addition to the West-East Natural Gas Pipeline Project, other policy shocks may also have an impact on firms’ pollution emissions. To rule out these potential effects, a placebo test was designed in this paper. Considering that other policy shocks tend to affect all types of pollutant emissions of industrial firms at the same time, especially air pollutant and wastewater emissions, the West-to-East Gas Transmission Project mainly affects firms’ air pollutant emissions, and it has a limited impact on wastewater emissions. In this paper, we changed the dependent variable in the model from corporate air pollutant emissions (sulfur dioxide and soot) to corporate wastewater emissions (). If the coefficients of the original core independent variables were found to not be significant any longer after the placebo test was conducted, then this means that our findings are credible and further validate the air pollution abatement effect of the first line of the West-East Natural Gas Pipeline Project, and the regression results are displayed in column (7) of Table 3. It can be found that the coefficients of the core independent variables lost their significance, which can prove the reliability of the original experimental design.
5.5. Heterogeneity Analysis
5.5.1. Different Holdings
Subsequently, this paper conducted a heterogeneity analysis which first examined the differences in the impacts on firms with different holdings. In this way, we could gain a more comprehensive understanding of the effects of the West-East Natural Gas Transmission Project on different types of firms. This analysis helped to reveal the differences in the effects of the West-East Natural Gas Pipeline Project under different corporate governance structures, which in turn better guides the formulation and implementation of relevant policies. In this paper, the industrial enterprises in the data were categorized into three types: publicly held, foreign-owned, and privately held. According to previous studies, publicly owned enterprises usually respond more actively to government policies and calls due to their closer ties with local governments [50]. In addition, due to their special status, publicly owned enterprises are more likely to obtain government subsidies and policy concessions and therefore may be more proactive in the “coal-to-gas” process. Foreign-funded enterprises may be quicker to adopt natural gas as their primary energy source due to their more advanced environmental awareness and business philosophies. Particularly after the opening of the West-East Gas Pipeline, foreign-owned enterprises may switch to using natural gas more aggressively to reduce pollution emissions and improve productivity due to the advantages of natural gas, such as cleanliness and efficiency. The private sector may have a muted response to the West-East Natural Gas Pipeline Project due to the fierce competition they face in the domestic market and the pressure to control costs. In a competitive market environment, private companies tend to focus more on cost-effectiveness and market competitiveness. Although the WEG project provides them with natural gas as a cleaner and more efficient energy option, private companies may weigh the pros and cons and take into account factors such as investment costs, market demand, and competitive advantages before making a decision. Therefore, they may react relatively calmly to the implementation of the West-East Natural Gas Pipeline Project and adopt a more cautious attitude. The relevant empirical results are displayed in Table 5, and the regression results prove the above thesis.
Table 5.
Heterogeneity analysis: different holdings.
5.5.2. Different Regions
The West-to-East Gas Pipeline Project was originally designed to supply gas to the eastern coastal provinces, which are more industrially developed but relatively poor in energy resources. Given the limited supply capacity of the pipeline, the gas supply from the project may be prioritized to meet the demand of the eastern coastal cities. Therefore, we hypothesized that the emission reduction effect of the West-East Natural Gas Pipeline Project may be stronger in the eastern coastal areas. To test this hypothesis, we analyzed the heterogeneity of industrial enterprises in different regions along the West-East Gas Pipeline. We categorized the regions into the eastern coastal area and nationwide (the coastal area included Jiangsu Province, Zhejiang Province, Shanghai Municipality, and Fujian Province). By comparing the coefficients of the core independent variables in these two regions, we could assess the differences in the emission reduction effects of the West-East Natural Gas Transmission Project. The relevant regression results are displayed in Table 6. It can be observed that the coefficient in the eastern region is significantly smaller than the national average, indicating that the emission reduction effect of the West-East Gas Pipeline Project is more pronounced in the eastern region.
Table 6.
Heterogeneity analysis: different zones.
6. Research Findings and Policy Recommendations
6.1. Conclusions and Discussion of This Study
The West-East Natural Gas Transmission Project is one of the key initiatives for the development of western China, playing a pivotal role in optimizing and adjusting China’s energy structure and facilitating the green transformation and upgrading of its economy. This paper analyzed the relationship between the West-East Natural Gas Transmission Project and air pollutant emissions from industrial enterprises using a difference-in-differences model based on the pollution database of Chinese industrial enterprises from 2000 to 2012. This study revealed several key findings. Firstly, the West-East Natural Gas Transmission Project significantly reduced the intensity of air pollutant emissions from industrial enterprises in cities along the route, particularly sulfur dioxide and soot emissions. This indicates that the introduction of clean energy can effectively mitigate industrial pollution, thereby improving regional environmental quality. Secondly, environmental regulation plays a moderating role. As the intensity of government environmental regulation increased, the emission reduction effect became more pronounced. This suggests that stronger environmental regulations can effectively promote the use of clean energy and enhance the effectiveness of emission reduction efforts. Strengthening environmental regulation is thus crucial for achieving better environmental governance. Thirdly, the emission reduction effects of the West-East Natural Gas Transmission Project varied significantly across different corporate governance structures. Private enterprises exhibited the smallest emission reduction impact, while state-owned enterprises and foreign-funded enterprises responded more positively to government policies, showing more significant emission reduction effects. This highlights the need for the government to formulate differentiated policies for various types of enterprises. Finally, there were regional differences in the emission reduction effects, with the eastern coastal region experiencing significantly higher emission reduction effects compared with other regions. The developed industry and high energy demand in the eastern region made the emission reduction effect more pronounced following the introduction of clean energy. This underscores the importance and necessity of inter-regional energy dispatching to optimize resource allocation and promote synergistic development among regions.
6.2. Policy Recommendations
Based on the conclusions of this paper, the following policy recommendations are proposed. First, environmental regulation should be strengthened. The government should continue to enhance the rigor of environmental regulation and implement more stringent environmental protection policies, particularly in heavily polluted areas. It should formulate environmental policies tailored to local conditions in different regions, set appropriate pollution emission standards for various types of industrial enterprises, strengthen environmental supervision, and ensure effective policy implementation. Second, the environmental transformation of private enterprises should be supported. The government should encourage and support private enterprises in improving their governance frameworks and enhancing their environmental responsibility. By providing financial and technical assistance, the government can help private enterprises upgrade their research and development capabilities in clean technologies and products, thereby improving their effectiveness in reducing emissions. Third, cross-regional cooperation in environmental protection should be promoted. and region-specific environmental management strategies should be implemented. The eastern region should vigorously promote energy-saving and emission reduction technologies, while the central and western regions should leverage the West-East Natural Gas Transmission Project to improve their energy structure and promote the use of natural gas. Through cross-regional cooperation, optimal resource allocation and synergistic regional development can be achieved. Fourth, public awareness of environmental protection should be enhanced, and residents and enterprises in cities along the route should be encouraged to actively participate in environmental protection activities. Furthermore, increase environmental protection publicity, reduce reliance on traditional energy sources, and promote environmental protection awareness among the general population. The government can raise public awareness of clean energy and environmental protection through various means, including media campaigns, community activities, and educational programs.
6.3. Future Research Directions
Based on the above study, future research directions could include the following. First, the long-term emission reduction effects and economic impacts of the West-East Natural Gas Pipeline Project can be observed through the use of longer time series data. This will allow for an assessment of the project’s performance and sustainability across different economic cycles. Second, a more detailed analysis of various types of enterprises, such as state-owned enterprises, foreign-funded enterprises, and small- and medium-sized enterprises, can be conducted to evaluate their emission reduction effects under different intensities of environmental regulation. This will provide a basis for the government to formulate more targeted environmental policies. Third, the impact of the West-East Natural Gas Pipeline Project on the synergistic development of regions can be explored, particularly focusing on the balance between economic growth and environmental protection. Research can concentrate on cross-regional cooperation mechanisms and policy optimization to promote sustainable development. In addition to the above research directions, a comprehensive assessment of the socioeconomic benefits brought about by the West-East Natural Gas Pipeline Project, such as employment opportunities and improvements in the quality of life of residents, can be conducted. This will help fully understand the multi-dimensional impacts of the project. By studying these directions in depth, we can further deepen our understanding of the West-East Natural Gas Pipeline Project and its emission reduction effects, thereby providing stronger theoretical and empirical support for China’s energy policy and environmental sustainability.
Author Contributions
Conceptualization, J.Q. and X.H.; methodology, X.H.; software, J.Q.; validation, J.Q. and X.H.; formal analysis, J.Q.; investigation, M.Y.; resources, M.Y.; data management, J.Q.; writing—original draft preparation, J.Q. and X.H.; visualization, Y.L.; supervision, J.C.; project management, M.Y. All authors have read and agreed to the published version of the manuscript.
Funding
This study was funded by the Third Xinjiang Comprehensive Scientific Expedition Project (Project No. 2021xjkk0406).
Data Availability Statement
Data supporting the results of this study are available from the corresponding author upon reasonable request.
Acknowledgments
The authors would like to thank Xinjiang Normal University and Peking University for their support.
Conflicts of Interest
The authors declare no conflicts of interest.
Abbreviations
| Abbreviation | Explanation |
| BRICS | Brazil, Russia, India, China, and South Africa |
| CO | Carbon Monoxide |
| CSMAR | China Stock Market & Accounting Research Database |
| DID | Difference-in-Differences |
| ECK | Environmental Kuznets Curve |
| ESG | Environmental, Social, and Governance |
| GDP | Gross Domestic Product |
| Ⅱ | Phase II |
| LIN | Linear Interpolation |
| WEG | West-East Gas Pipeline |
| WEGP | West-East Gas Pipeline Project |
| WEGT | West-East Gas Transmission Test |
| WTO | World Trade Organization |
| SO2 | Sulfur Dioxide |
| NOX | Nitrogen Oxides |
| PM2.5 | Particulate Matter 2.5 |
| CO2 | Carbon Dioxide |
| EIA | Environmental Impact Assessment |
| R&D | Research and Development |
| WENGT | West-East Natural Gas Transmission Project |
| ER | Environmental Regulation |
| CSDB | China Industrial Enterprises Database |
References
- Brandt, L.; Rawski, T.G.; Sutton, J. China’s industrial development. In China’s Great Economic Transformation; Cambridge University Press: Cambridge, UK, 2008; pp. 569–632. [Google Scholar]
- Wei, J.; Li, Z.; Wang, J.; Li, C.; Gupta, P.; Cribb, M. Ground-level gaseous pollutants (NO2, SO2, and CO) in China: Daily seamless mapping and spatiotemporal variations. Atmos. Chem. Phys. 2023, 23, 1511–1532. [Google Scholar] [CrossRef]
- Antwi, H.A.; Zhou, L.; Xu, X.; Mustafa, T. Progressing towards Environmental Health Targets in China: An Integrative Review of Achievements in Air and Water Pollution under the “Ecological Civilisation and the Beautiful China” Dream. Sustainability 2021, 13, 3664. [Google Scholar] [CrossRef]
- Liu, W.; Fan, W.; Hong, Y.; Chen, C. A study on the comprehensive evaluation and analysis of China’s renewable energy development and regional energy development. Front. Energy Res. 2021, 9, 635570. [Google Scholar] [CrossRef]
- Yu, Z.; Li, W.; Duan, H. New Energy Technology Innovation and Industry Carbon Emission Reduction Based on the Perspective of Unbalanced Regional Economic Development. Sustainability 2023, 15, 15991. [Google Scholar] [CrossRef]
- Gao, Q.; Zhang, X.; Yang, M.; Chen, X.; Zhou, H. Fuzzy decision-based optimal energy dispatch for integrated energy systems with energy storage. Front. Energy Res. 2021, 9, 809024. [Google Scholar] [CrossRef]
- Zhang, J.; Zheng, H.; He, W.; Huang, W. West-east gas pipeline project. Front. Eng. Manag. 2020, 7, 163–167. [Google Scholar] [CrossRef]
- Cao, X.; Zhang, H.; Huang, X.; Li, P. Can the Belt and Road Initiative reduce pollution in enterprises?—Evidence from quasi-natural experiments. Energy Rep. 2022, 8, 11683–11694. [Google Scholar] [CrossRef]
- Miao, S.; Tuo, Y.; Zhang, X.; Hou, X. Green fiscal policy and ESG performance: Evidence from the energy-saving and emission-reduction policy in China. Energies 2023, 16, 3667. [Google Scholar] [CrossRef]
- Sun, J.; Li, G.; Wang, Z. Optimizing China’s energy consumption structure under energy and carbon constraints. Struct. Change Econ. Dyn. 2018, 47, 57–72. [Google Scholar] [CrossRef]
- Zhang, H.; Miao, B.; Chen, X.Y. The Proposal of the “Dual Carbon” Goals and Its Opportunities and Challenges for “West-to-East Electricity Transmission”. China Mark. 2023, 28, 9–12. [Google Scholar]
- Chen, M.; Bai, Z.; Wang, Q.; Shi, Z. Habitat quality effect and driving mechanism of land use transitions: A case study of Henan water source area of the middle route of the south-to-north water transfer project. Land 2021, 10, 796. [Google Scholar] [CrossRef]
- Introduction to the “Thirteenth Five-Year Plan” for Energy Development (Part II). Energy Energy Conserv. 2017, 7, 1. [CrossRef]
- Zhang, Y.G.; Bai, Y.J. The Foundation and Path of Regional Collaborative Low-Carbon Development. China Econ. 2022, 17, 69–92. [Google Scholar]
- West-East Gas Pipeline: Green Progress. 2016, December 30. China Petroleum News Center. Available online: http://news.cnpc.com.cn/system/2016/12/30/001628190 (accessed on 19 April 2024).
- Li, C.H.; Xie, J. Study on the Relationship between Cross-Regional Energy Dispatch and Economic Growth—Evidence from the West-East Gas Transmission Project. J. Ind. Technol. Econ. 2015, 34, 32–37. [Google Scholar]
- Chen, Y.; Zhao, J.; Lai, Z.; Wang, Z. Exploring the effects of economic growth, and renewable and non-renewable energy consumption on China’s CO2 emissions: Evidence from a regional panel analysis. Renew. Energy 2019, 140, 341–353. [Google Scholar] [CrossRef]
- Zhao, X.; Zhang, X.; Li, N.; Shao, S.; Geng, Y. Decoupling economic growth from carbon dioxide emissions in China: A sectoral factor decomposition analysis. J. Clean. Prod. 2017, 142, 3500–3516. [Google Scholar] [CrossRef]
- Kai, C.; Xiayun, S.; Zhongwen, T. Chinese energy consumption and carbon emission intensity on EKC effects under the constraint of energy-saving and emission-reduction. Sci. Technol. Manag. Res. 2015, 35, 206–209. [Google Scholar]
- Wang, D.; Li, T. Carbon emission performance of independent oil and natural gas producers in the United States. Sustainability 2018, 10, 110. [Google Scholar] [CrossRef]
- Dong, K.; Sun, R.; Hochman, G. Do natural gas and renewable energy consumption lead to less CO2 emission? Empirical evidence from a panel of BRICS countries. Energy 2017, 141, 1466–1478. [Google Scholar] [CrossRef]
- Jia, R.; Fan, M.; Shao, S.; Yu, Y. Urbanization and haze-governance performance: Evidence from China’s 248 cities. J. Environ. Manag. 2021, 288, 112436. [Google Scholar] [CrossRef]
- Wu, J.; Cui, C.; Guo, X. Impacts of the West–East Gas Pipeline Project on energy conservation and emission reduction: Empirical evidence from Hubei province in Central China. Environ. Sci. Pollut. Res. 2022, 29, 28149–28165. [Google Scholar] [CrossRef] [PubMed]
- Qiao, G.Y.; Chen, X.W.; Zhang, Z.E.; Han, X.L.; Wang, X.; Liao, B.; Xiao, F.R. Mechanical properties of high-Nb X80 steel weld pipes for the second west-to-east gas transmission pipeline project. Adv. Mater. Sci. Eng. 2017, 7409873. [Google Scholar] [CrossRef]
- Yuan, H.; Zhu, C.L. Have National High-tech Zones Promoted the Transformation and Upgrading of China’s Industrial Structure? China Ind. Econ. 2018, 8, 60–77. [Google Scholar]
- Han, C.; Chen, Z.; Wang, Z. A Study on the Mechanism of Pollution Reduction Effects of Enterprises Under the Constraint of Energy-Saving Targets. China Ind. Econ. 2020, 10, 43–61. [Google Scholar]
- Ju, B.; Shi, X.; Mei, Y. The current state and prospects of China’s environmental, social, and governance policies. Front. Environ. Sci. 2022, 10, 999145. [Google Scholar] [CrossRef]
- Chen, W.; Wu, Y. China’s new environmental protection law and green innovation: Evidence from prefecture-level cities. Complexity 2021, 1–13. [Google Scholar] [CrossRef]
- Chen, S.Y. Energy Consumption, Carbon Dioxide Emissions, and Sustainable Development of Chinese Industry. Econ. Res. J. 2009, 44, 41–55. [Google Scholar]
- Wang, X.; Lu, X.; Zhou, N.; Xiao, J.; Chen, J. Does Environmental Regulation Affect Natural Gas Consumption? Evidence from China with Spatial Insights. Sustainability 2020, 12, 3354. [Google Scholar] [CrossRef]
- Fan, F.; Lian, H.; Liu, X.; Wang, X. Can environmental regulation promote urban green innovation Efficiency? An empirical study based on Chinese cities. J. Clean. Prod. 2021, 287, 125060. [Google Scholar] [CrossRef]
- Xu, B.; Chen, Y.; Shen, X. Development of clean energy, carbon dioxide reduction, and regional economic growth. Econ. Res. J. 2019, 54, 188–202. [Google Scholar]
- Lin, T. Cleaner Production Environment Regulation and Enterprise Environment Performance An Empirical Test based on Pollution Discharge Data of Industrial Enterprises. J. Beijing Inst. Technol. (Soc. Sci. Ed.) 2022, 24, 43–55. [Google Scholar]
- Gao, Y.; Zheng, J. Clearing the air through pipes? An evaluation of the air pollution reduction effect of China’s natural gas pipeline projects. Energy Policy 2022, 160, 112649. [Google Scholar] [CrossRef]
- Xu, S.; Klaiber, H.A. The impact of new natural gas pipelines on emissions and fuel consumption in China. Resour. Energy Econ. 2019, 55, 49–62. [Google Scholar] [CrossRef]
- Shao, C. How does import competition affect corporate environmental performance?—A quasi-natural experiment from China’s accession to the WTO. Econ. (Q.) 2021, 21, 1615–1638. [Google Scholar]
- Azam, A.; Rafiq, M.; Shafique, M.; Zhang, H.; Yuan, J. Analyzing the effect of natural gas, nuclear energy and renewable energy on GDP and carbon emissions: A multi-variate panel data analysis. Energy 2021, 219, 119592. [Google Scholar] [CrossRef]
- Li, R.; Su, M. The role of natural gas and renewable energy in curbing carbon emission: Case study of the United States. Sustainability 2017, 9, 600. [Google Scholar] [CrossRef]
- Xiao, Z.; Cai, C.; Wang, L.; Ma, Y. Climate change, environmental regulations, and firms’ efforts to reduce pollutant emissions. Front. Ecol. Evol. 2023, 11, 1050642. [Google Scholar] [CrossRef]
- Gong, M.; You, Z.; Wang, L.; Cheng, J. Environmental regulation, trade comparative advantage, and the manufacturing industry’s green transformation and upgrading. Int. J. Environ. Res. Public Health 2020, 17, 2823. [Google Scholar] [CrossRef] [PubMed]
- Dong, X.; Zhong, Y.; Liu, M.; Qin, C. Research on the impacts of dual environmental regulation on regional carbon emissions under the goal of carbon neutrality-the intermediary role of green technology innovation. Front. Environ. Sci. 2022, 10, 993833. [Google Scholar] [CrossRef]
- Nie, H.; Jiang, T.; Yang, R. Current status and potential problems of the use of China’s industrial enterprise database. World Econ. 2012, 35, 142–158. [Google Scholar]
- Li, H.; Tong, M.; Zhang, G.; Zhao, J. Research on the emission reduction effects of cross-regional energy scheduling in enterprises. Quant. Tech. Econ. Res. 2023, 40, 156–178. [Google Scholar]
- Deng, J.; Zhang, N.; Ahmad, F.; Draz, M.U. Local government competition, environmental regulation intensity and regional innovation performance: An empirical investigation of Chinese provinces. Int. J. Environ. Res. Public Health 2019, 16, 2130. [Google Scholar] [CrossRef] [PubMed]
- Wang, F.; Sun, Z. Does the environmental regulation intensity and ESG performance have a substitution effect on the impact of enterprise green innovation: Evidence from China. Int. J. Environ. Res. Public Health 2022, 19, 8558. [Google Scholar] [CrossRef] [PubMed]
- Chen, Z.; Kahn, M.E.; Liu, Y.; Wang, Z. The consequences of spatially differentiated water pollution regulation in China. J. Environ. Econ. Manag. 2018, 88, 468–485. [Google Scholar] [CrossRef]
- Li, C.; Liu, X.; Bai, X.; Umar, M. Financial development and environmental regulations: The two pillars of green transformation in China. Int. J. Environ. Res. Public Health 2020, 17, 9242. [Google Scholar] [CrossRef] [PubMed]
- Jin, H.; Chen, S. The impact of geographic distance on government supervision of corporate pollution emissions—Discussing the role of data technology in regulation. Quant. Tech. Econ. Res. 2022, 39, 109–128. [Google Scholar]
- He, X.; Teng, R.; Feng, D.; Gai, J. Industrial Robots and Pollution: Evidence from Chinese Enterprises. Econ. Anal. Policy 2024, 82, 629–650. [Google Scholar] [CrossRef]
- Liu, M.; Liu, L.; Xu, S.; Du, M.; Liu, X.; Zhang, Y. The Influences of Government Subsidies on Performance of New Energy Firms: A Firm Heterogeneity Perspective. Sustainability 2019, 11, 4518. [Google Scholar] [CrossRef]

Disclaimer/Publisher’s Note: The statements, opinions and data contained in all publications are solely those of the individual author(s) and contributor(s) and not of MDPI and/or the editor(s). MDPI and/or the editor(s) disclaim responsibility for any injury to people or property resulting from any ideas, methods, instructions or products referred to in the content. |
© 2024 by the authors. Licensee MDPI, Basel, Switzerland. This article is an open access article distributed under the terms and conditions of the Creative Commons Attribution (CC BY) license (https://creativecommons.org/licenses/by/4.0/).