
Photovoltaics Energy Potential in the Largest Greek Cities: Atmospheric and Urban Fabric Effects, Climatic Trends Influences and Socio-Economic Benefits


Abstract
:1. Introduction
2. Materials and Methods
2.1. Data Sources
2.2. Solar Energy Simulation
2.3. Shadowing in Urban Environments
3. Results
3.1. Urban Fabric Density
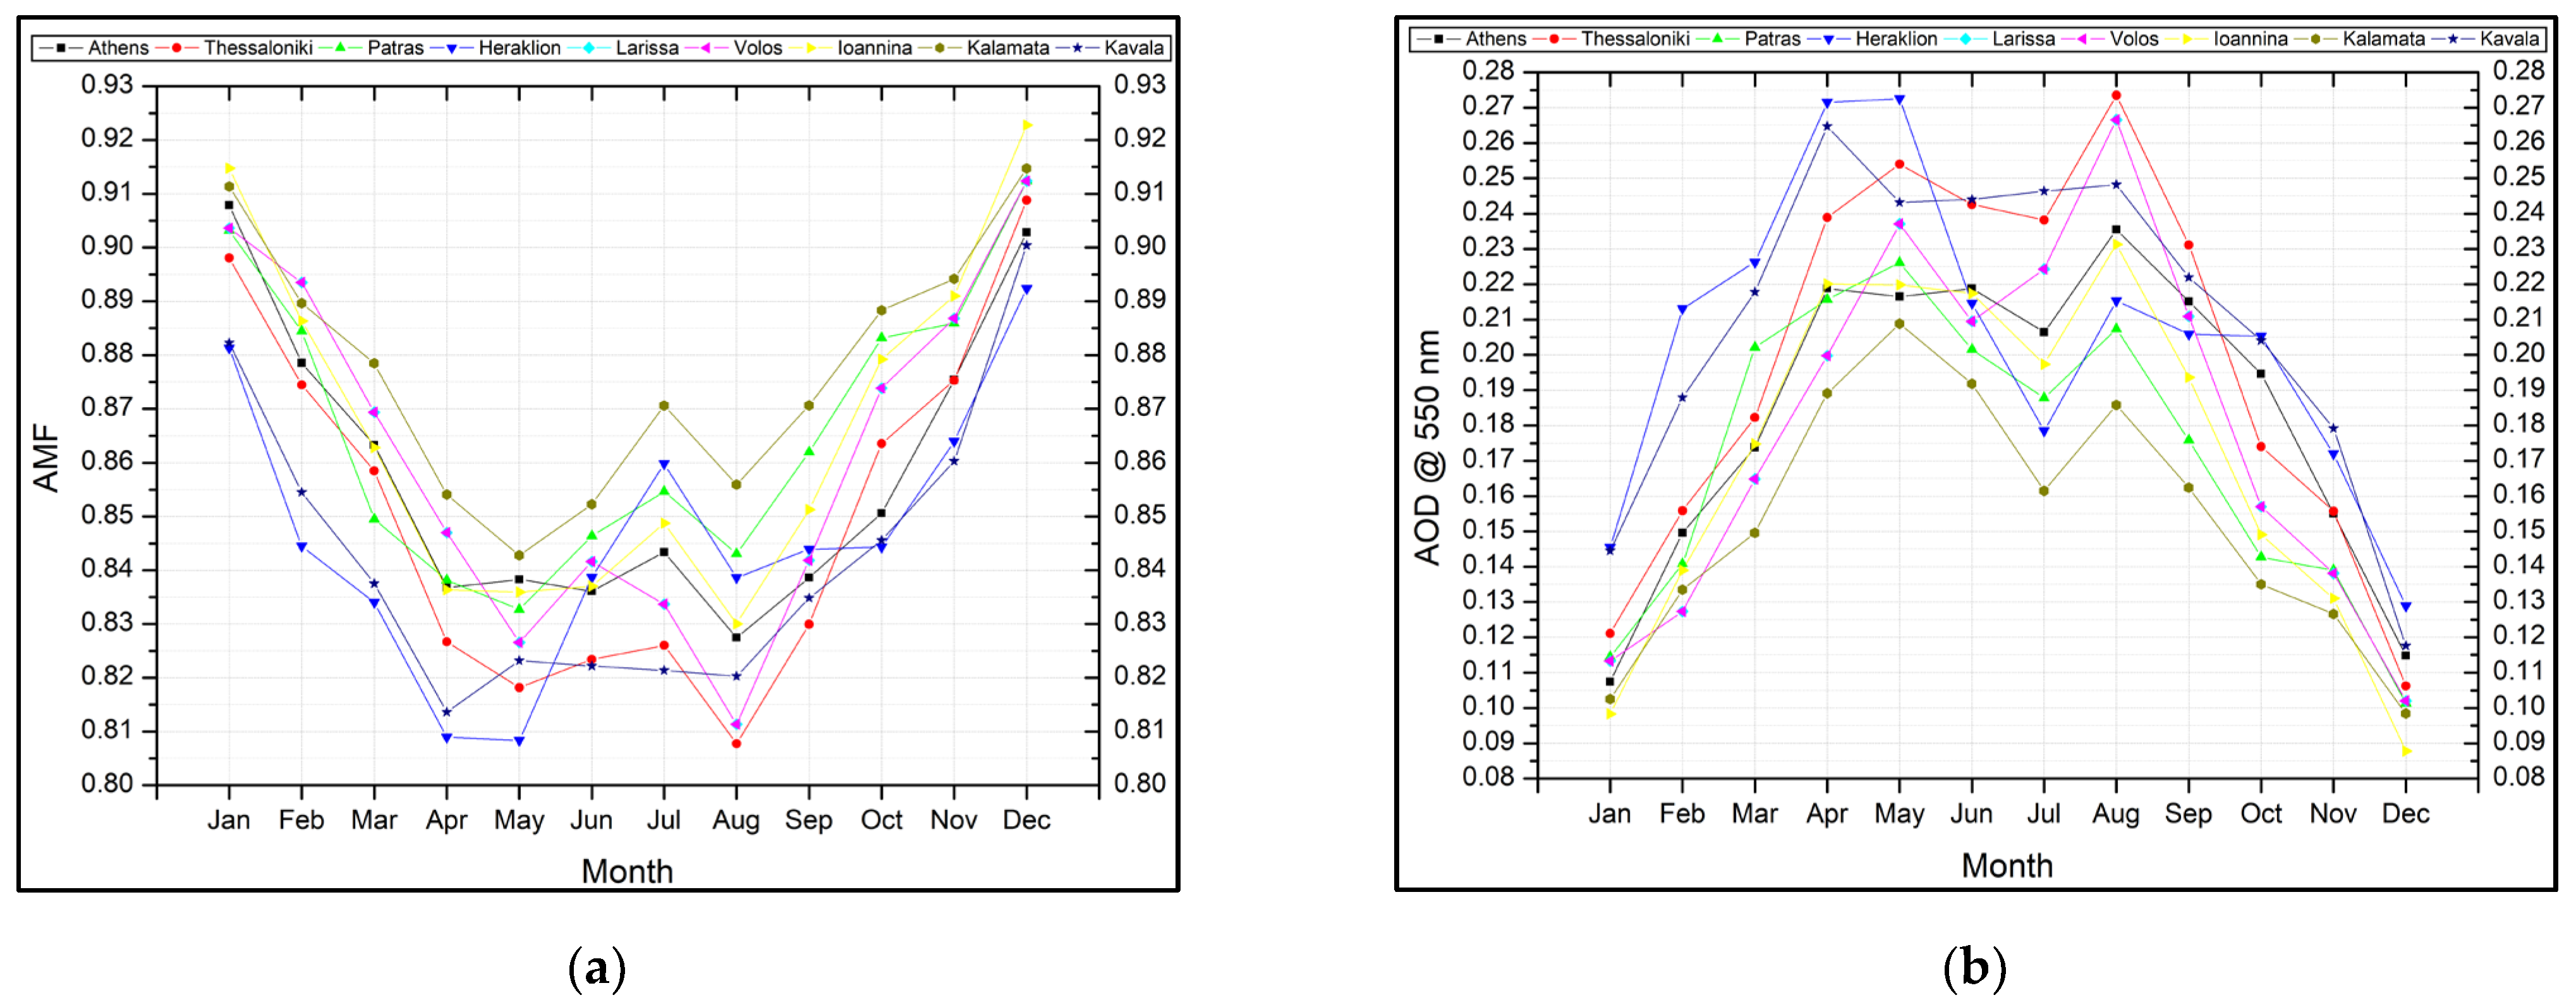
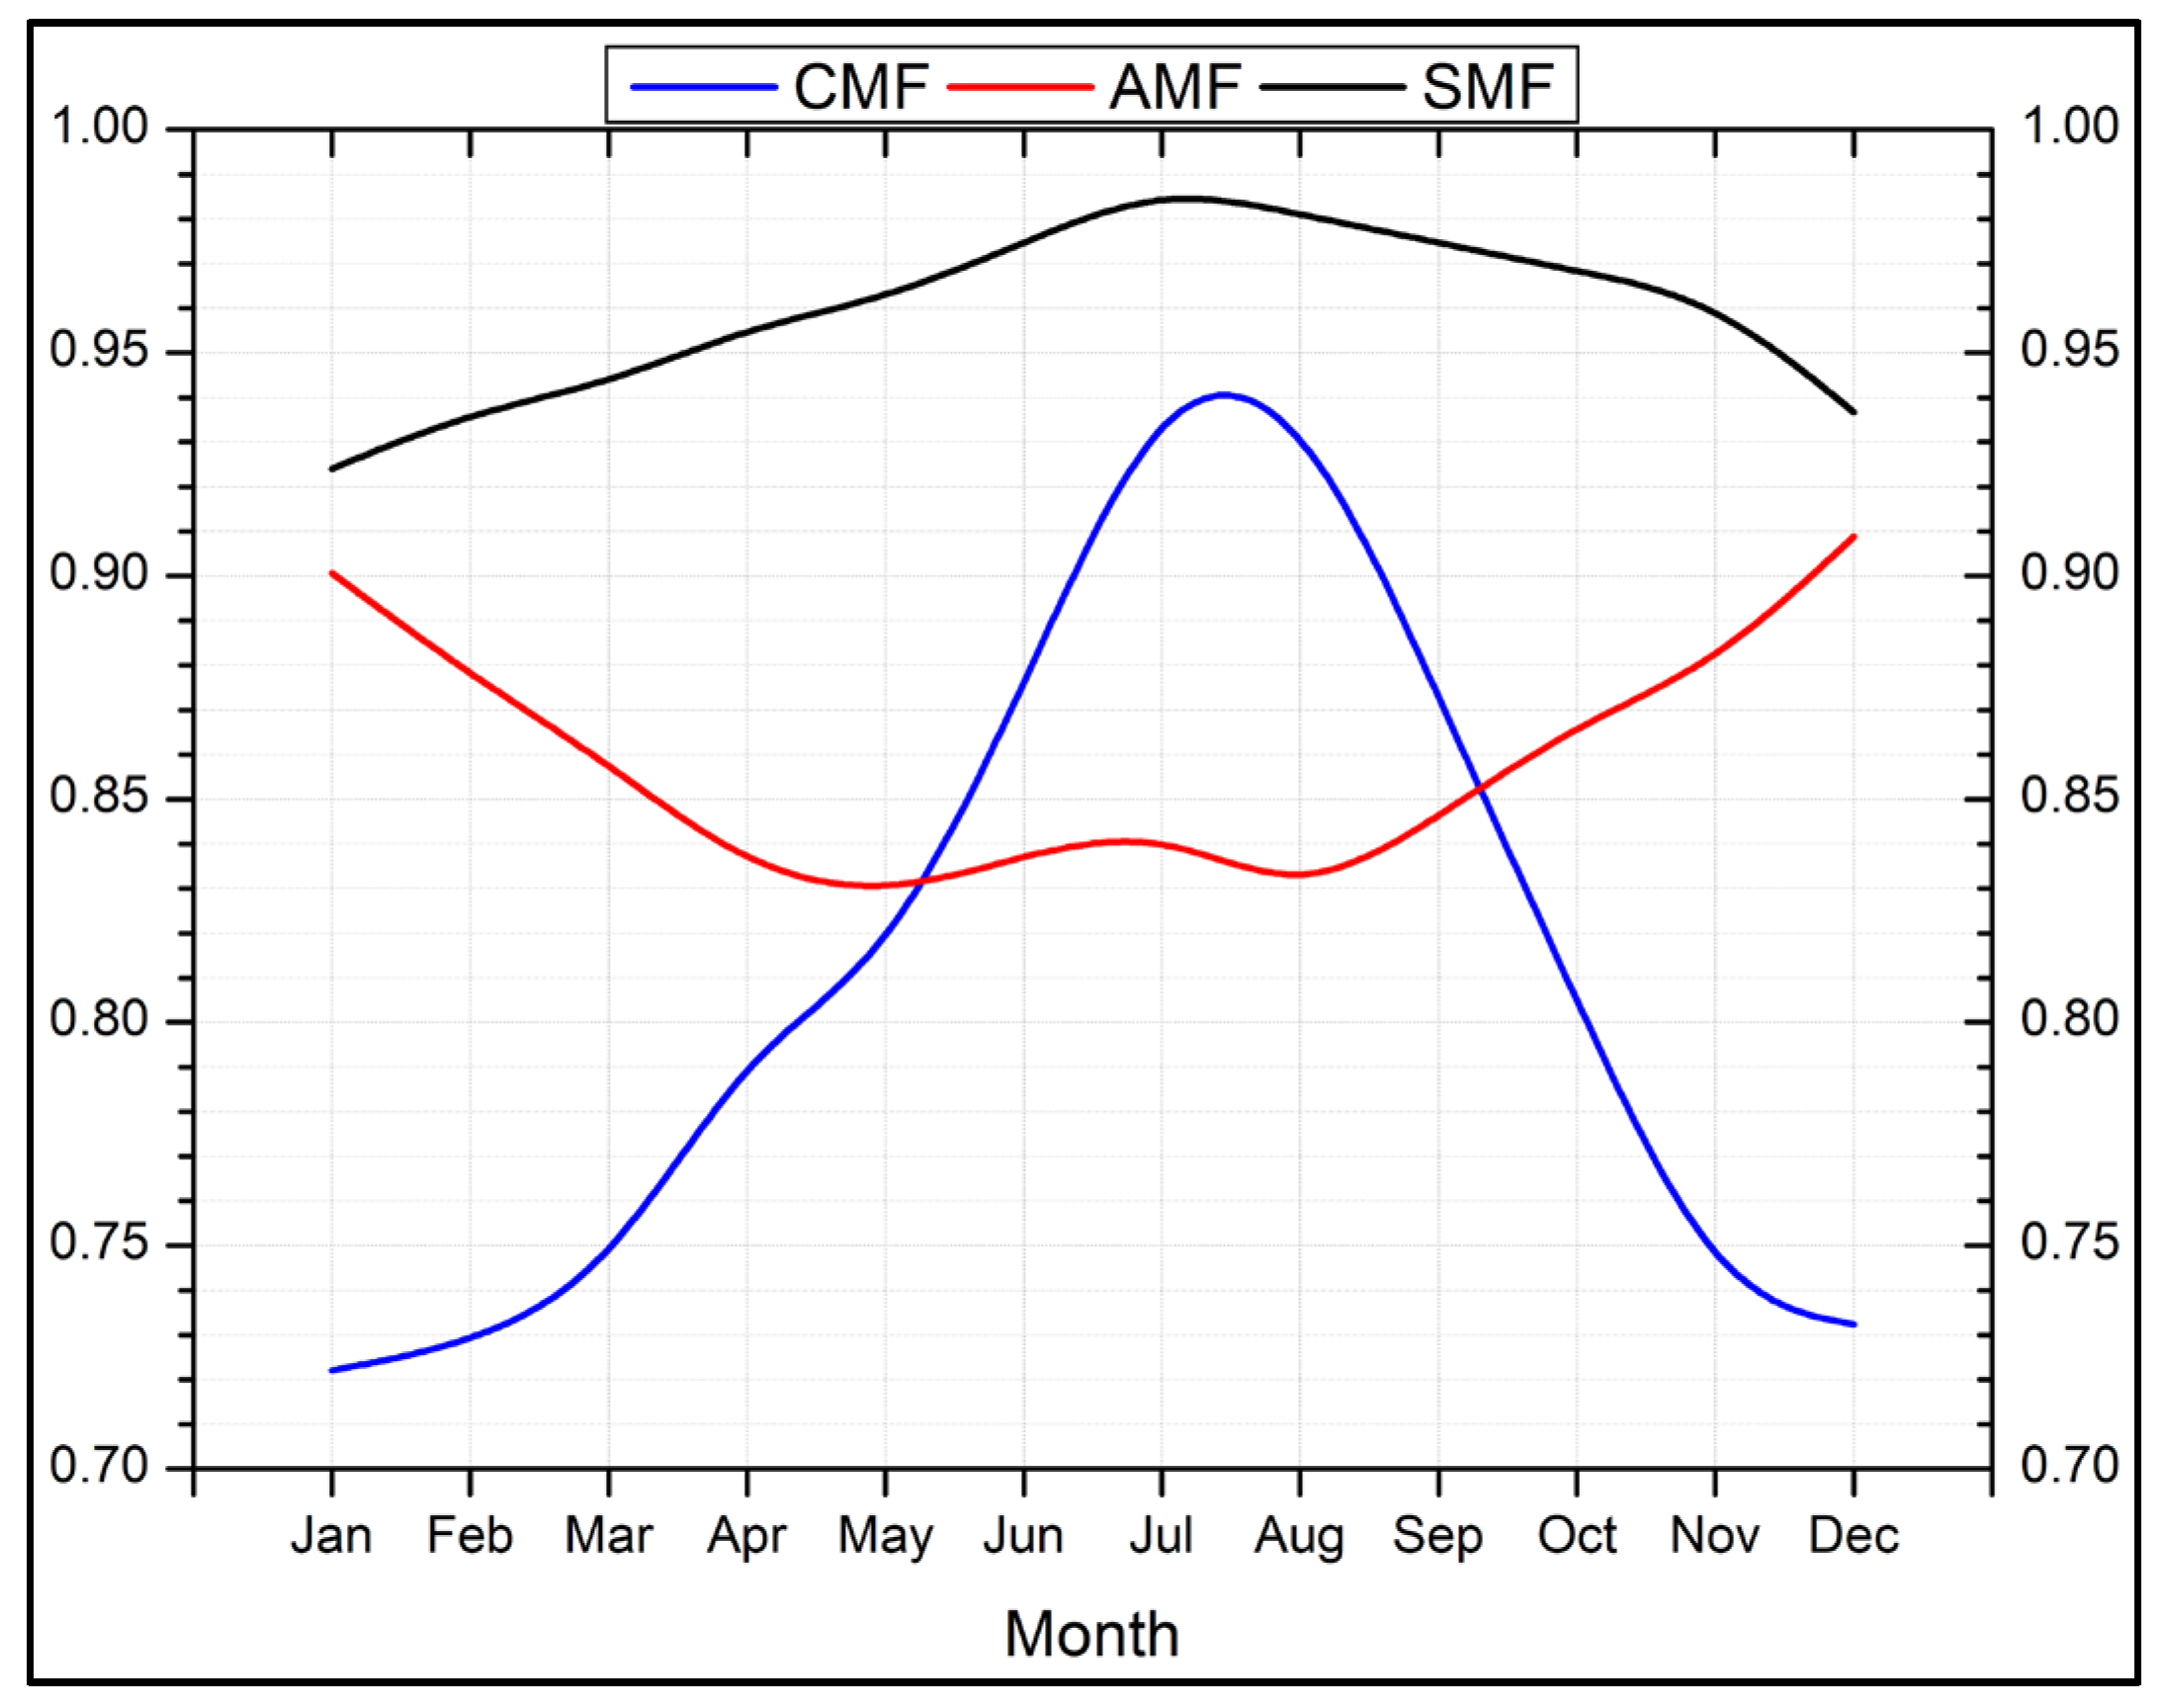
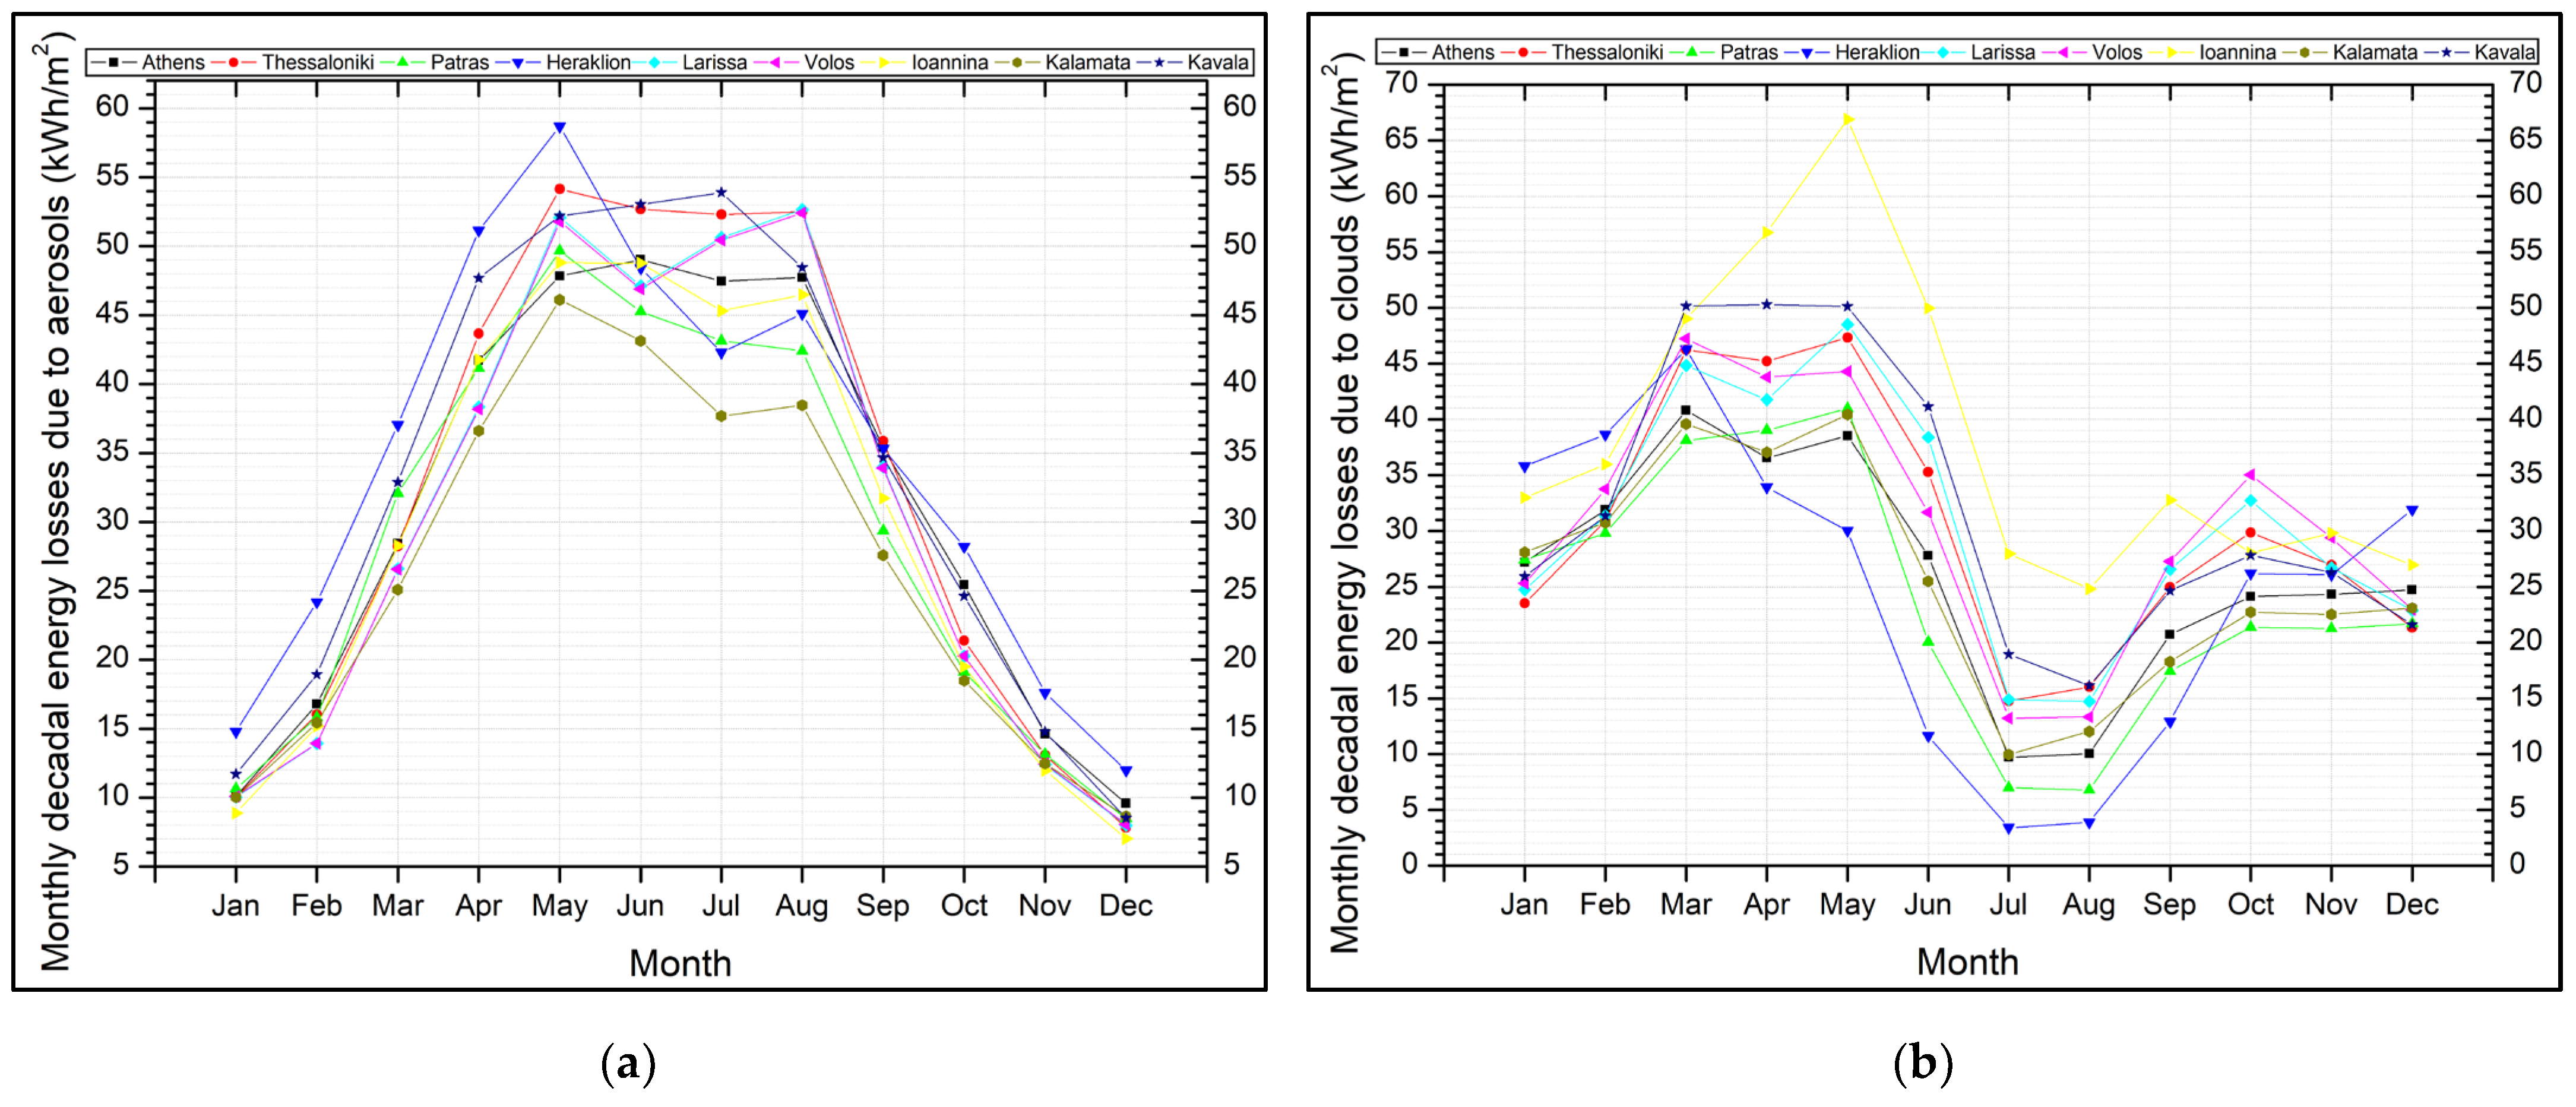
3.2. Aerosol and Cloud Effect on Solar Radiation
4. Discussion
4.1. Interpretation of the Urban Dense Fabric Data through QGIS
4.2. Climate, Sunlight, Aerosols, and Cloudiness Levels
4.3. Energy Planning Scheme
4.4. Financial Analysis
4.5. Solar Energy and Carbon Emission Savings
5. Conclusions
Author Contributions
Funding
Data Availability Statement
Acknowledgments
Conflicts of Interest
Appendix A

| City | GHI (kWh/m2) | PVGIS (kWh/kWp) |
|---|---|---|
| Athens | 1796.3 | 1537.3 |
| Thessaloniki | 1649.5 | 1404.2 |
| Patras | 1813.8 | 1475.3 |
| Heraklion | 1884.9 | 1494.5 |
| Larissa | 1707.0 | 1367.1 |
| Volos | 1703.5 | 1430.7 |
| Ioannina | 1623.8 | 1356.4 |
| Kalamata | 1818.0 | 1520.9 |
| Kavala | 1622.4 | 1362.3 |
References
- What Is Remote Sensing? Available online: https://www.earthdata.nasa.gov/learn/backgrounders/remote-sensing (accessed on 7 April 2024).
- Solar Radiation Basics. Available online: https://www.energy.gov/eere/solar/solar-radiation-basics (accessed on 7 April 2024).
- Müller, R.; Pfeifroth, U. Remote sensing of solar surface radiation—A reflection of concepts, applications and input data based on experience with the effective cloud albedo. Atmos. Meas. Tech. 2022, 15, 1537–1561. [Google Scholar] [CrossRef]
- The 100 Climate-Neutral and Smart Cities by 2030. Available online: https://eurocities.eu/latest/the-100-climate-neutral-and-smart-cities-by-2030/ (accessed on 7 April 2024).
- Green Transition. Available online: https://reform-support.ec.europa.eu/what-we-do/green-transition_en (accessed on 7 April 2024).
- REPowerEU. Affordable, Secure and Sustainable Energy for Europe. Available online: https://commission.europa.eu/strategy-and-policy/priorities-2019-2024/european-green-deal/repowereu-affordable-secure-and-sustainable-energy-europe_en (accessed on 7 April 2024).
- What Is the Green Transition? Available online: https://ym.fi/en/what-is-the-green-transition (accessed on 7 April 2024).
- Mitigation and Adaptation. Available online: https://climate.mit.edu/explainers/mitigation-and-adaptation (accessed on 7 April 2024).
- Solar Irradiance Data for Greece. Available online: https://solcast.com/solar-radiation-map/greece/ (accessed on 7 April 2024).
- Kosmopoulos, P.G.; Kazadzis, S.; Taylor, M.; Bais, A.F.; Lagouvardos, K.; Kotroni, V.; Keramitsoglou, I.; Kiranoudis, C. Estimation of the Solar Energy Potential in Greece Using Satellite and Ground-Based Observations. In Perspectives on Atmospheric Sciences; Springer International Publishing: Cham, Germany, 2017. [Google Scholar]
- Greece 2023 Executive Summary. Available online: https://www.iea.org/reports/greece-2023/executive-summary (accessed on 7 April 2024).
- Renewable Energy in Greece—Statistics & Facts. Available online: https://www.statista.com/topics/12083/renewable-energy-in-greece/ (accessed on 7 April 2024).
- Greece is World’s Second in Solar Energy Production Potential. Available online: https://greekreporter.com/2023/05/27/greece-world-second-solar-energy-production/ (accessed on 7 April 2024).
- Greece Launches €200 Million Residential Solar-Plus-Battery Subsidy Scheme. Available online: https://www.pv-magazine.com/2023/03/29/greece-launches-e200-million-residential-solar-plus-battery-subsidy-scheme-2/ (accessed on 7 April 2024).
- Copernicus Atmosphere Monitoring Service (CAMS). Available online: https://atmosphere.copernicus.eu/global-forecast-plots (accessed on 15 January 2024).
- Eskes, H.; Huijnen, V.; Arola, A.; Benedictow, A.; Blechschmidt, A.-M.; Botek, E.; Boucher, O.; Bouarar, I.; Chabrillat, S.; Cuevas, E.; et al. Validation of reactive gases and aerosols in the MACC global analysis and forecast system. Geosci. Model Dev. 2015, 8, 3523–3543. [Google Scholar] [CrossRef]
- Dee, D.P.; Uppala, S. Variational bias correction of satellite radiance data in the ERA-Interim reanalysis. Q. J. R. Meteorol. Soc. 2009, 135, 1830–1841. [Google Scholar] [CrossRef]
- Roebeling, R.A.; Fejit, A.J.; Stamnes, P. Cloud property retrievals for climate monitoring: Implications of differences between SEVIRI on METEOSAT-8 and AVHRR on NOAA-17. J. Geophys. Res. 2006, 111, 20210. [Google Scholar] [CrossRef]
- Geospatial Interactive Online Visualization ANd aNalysis Infrastructure. Available online: https://giovanni.gsfc.nasa.gov/giovanni/ (accessed on 12 February 2024).
- Kosmopoulos, P.; Dhake, H.; Kartoudi, D.; Tsavalos, A.; Koutsantoni, P.; Katranitsas, A.; Lavdakis, N.; Mengou, E.; Kashyap, Y. Ray-Tracing modeling for urban photovoltaic energy planning and management. Appl. Energy 2024, 369, 123516. [Google Scholar] [CrossRef]
- OpenStreetMap (OSM). Free, Open Geographic Database. Available online: https://www.openstreetmap.org/ (accessed on 10 January 2024).
- Quantum Geographic Information System (QGIS). Available online: https://qgis.org/en/site/ (accessed on 9 January 2024).
- CAMS Radiation Service—SoDa. Available online: https://www.soda-pro.com/web-services/radiation/cams-radiation-service (accessed on 15 January 2024).
- CAMS-AOD—SoDa. Available online: https://www.soda-pro.com/web-services/atmosphere/cams-aod (accessed on 15 January 2024).
- Photovoltaic Geographical Information System. Available online: https://re.jrc.ec.europa.eu/pvg_tools/en/ (accessed on 13 February 2024).
- Global Solar Atlas. Available online: https://globalsolaratlas.info/map (accessed on 15 January 2024).
- Global Monitoring Laboratory—Earth System Laboratory. Available online: https://gml.noaa.gov/ (accessed on 15 January 2024).
- Silva, M.; Roberts, J.J.; Prado, P.O. Calculation of the Shading Factors for Solar Modules with MATLAB. Energies 2021, 14, 4713. [Google Scholar] [CrossRef]
- Shading Losses in PV Systems, and Techniques to Mitigate them. Available online: https://aurorasolar.com/blog/shading-losses-in-pv-systems-and-techniques-to-mitigate-them/ (accessed on 1 April 2024).
- Morakinyo, T.; Kong, L.; Lau, K.; YUAN, C.; Ng, E. A study on the impact of shadow-cast and tree species on in-canyon and neighborhood′s thermal comfort. Build. Environ. 2017, 115, 1–17. [Google Scholar] [CrossRef]
- Orbit Urban Office Campus, Greece. Available online: https://darcawards.com/portfolio/orbit-urban-office-campus-greece/ (accessed on 22 May 2024).
- Vo, A.; Laefer, D. A Big Data Approach for Comprehensive Urban Shadow Analysis from Airborne Laser Scanning Point Clouds. ISPRS Ann. Photogramm. Remote Sens. Spat. Inf. Sci. 2019, IV-4/W8, 131–137. [Google Scholar] [CrossRef]
- Xu, L.; León-Sánchez, C.; Agugiaro, G.; Stoter, J. Shadowing Calculation on Urban Areas from Semantic 3D City Models. In International 3D GeoInfo Conference; Springer Nature: Cham, Germany, 2024. [Google Scholar] [CrossRef]
- Groves, P.; Wang, L.; Adjrad, M.; Ellul, C. GNSS Shadow Matching: The Challenges Ahead. In Proceedings of the 28th International Technical Meeting of The Satellite Division of the Institute of Navigation (ION GNSS+ 2015), Tampa, FL, USA, 14–18 September 2015. [Google Scholar]
- Raju, P.; Chaudhary, H.; Jha, A. Shadow Analysis Technique for Extraction of Building Height using High Resolution Satellite Single Image and Accuracy Assessment. ISPRS—Int. Arch. Photogramm. Remote Sens. Spat. Inf. Sci. 2014, XL-8, 1185–1192. [Google Scholar] [CrossRef]
- Xie, Y.; Feng, D.; Xiong, S.; Zhu, J.; Liu, Y. Multi-Scene Building Height Estimation Method Based on Shadow in High Resolution Imagery. Remote Sens. 2021, 13, 2862. [Google Scholar] [CrossRef]
- 7 Ways Shadow Studies Can Impact Building Design. Available online: https://cove.tools/blog/7-ways-shadow-studies-impact-building-design (accessed on 22 May 2024).
- Shadows and Angles: Measuring Object Heights from Satellite Imagery. Available online: https://www.geographyrealm.com/shadows-angles-measuring-object-heights-satellite-imagery/ (accessed on 22 May 2024).
- Hao, H.; Baireddy, S.; Bartusiak, E.; Gupta, M.; LaTourette, K.; Konz, L.; Chan, M.; Comer, M.; Delp, E. Building height estimation via satellite metadata and shadow instance detection. In Automatic Target Recognition XXXI; SPIE: Bellingham, WA, USA, 2021. [Google Scholar] [CrossRef]
- Wikipedia. The Free Encyclopedia. Athens. Available online: https://en.wikipedia.org/wiki/Athens (accessed on 16 April 2024).
- Climate Data for Cities Worldwide. Available online: https://en.climate-data.org/ (accessed on 16 April 2024).
- Weather Atlas. Available online: https://www.weather-atlas.com/ (accessed on 16 April 2024).
- Papadogiannaki, S.; Kontos, S.; Parliari, D.; Melas, D. Machine Learning Regression to Predict Pollen Concentrations of Oleaceae and Quercus Taxa in Thessaloniki, Greece. Environ. Sci. Proc. 2023, 26, 2. [Google Scholar] [CrossRef]
- Vasilatou, V.; Manousakas, M.; Gkini, M.; Diapouli, E.; Scoullos, M.; Eleftheriadis, K. Long Term Flux of Saharan Dust to the Aegean Sea around the Attica Region, Greece. Front. Mar. Sci. 2017, 4, 42. [Google Scholar] [CrossRef]
- Logothetis, I.; Tourpali, K.; Misios, S. The Evolution of Etesians: Trends in 20th Century and Future Projections. In Perspectives on Atmospheric Sciences; Karacostas, T., Bais, A., Nastos, P., Eds.; Springer Atmospheric Sciences: Cham, Switzerland, 2017. [Google Scholar] [CrossRef]
- Aktypis, A.; Kaltsonoudis, C.; Patoulias, D.; Kalkavouras, P.; Matrali, A.; Vasilakopoulou, C.N.; Kostenidou, E.; Florou, K.; Kalivitis, N.; Bougiatioti, A.; et al. Significant spatial gradients in new particle formation frequency in Greece during summer. Atmos. Chem. Phys. 2024, 24, 65–84. [Google Scholar] [CrossRef]
- Politikos, D.V.; Ioakeimidis, C.; Papatheodorou, G.; Tsiaras, K. Modeling the Fate and Distribution of Floating Litter Particles in the Aegean Sea (E. Mediterranean). Front. Mar. Sci. 2017, 4, 191. [Google Scholar] [CrossRef]
- Masoom, A.; Fountoulakis, I.; Kazadzis, S.; Raptis, I.-P.; Kampouri, A.; Psiloglou, B.E.; Kouklaki, D.; Papachristopoulou, K.; Marinou, E.; Solomos, S.; et al. Investigation of the effects of the Greek extreme wildfires of August 2021 on air quality and spectral solar irradiance. Atmos. Chem. Phys. 2023, 23, 8487–8514. [Google Scholar] [CrossRef]
- Vigkos, S.; Kosmopoulos, P.G.; Papayannis, A. Solar Photovoltaic Energy Production Conditions in the Urban Environment of Athens, Cairo, Granada and Vienna. Environ. Sci. Proc. 2023, 26, 24. [Google Scholar] [CrossRef]
- Climate Change Report Warns of More Heatwaves, Sea Level Rise in Greece. Available online: https://greekreporter.com/2021/08/17/climate-change-report-warns-greece-heatwaves-sea-level-rise/ (accessed on 6 April 2024).
- Kourtinos, C.; Pappas, V. Greek Cities and Formal Planning. In The Geography of Greece; World Regional Geography Book Series; Darques, R., Sidiropoulos, G., Kalabokidis, K., Eds.; Springer: Cham, Switzerland, 2024. [Google Scholar] [CrossRef]
- Karagianni, M. Making Thessaloniki Resilient? The Enclosing Process of the Urban Green Commons. Urban Plan. 2023, 8, 346–360. [Google Scholar] [CrossRef]
- Athens Bets on Green Infrastructure and Biodiversity. Available online: https://www.eib.org/en/stories/athens-climate-adaptation (accessed on 5 April 2024).
- Pitidis, V.; Tapete, D.; Coaffee, J.; Kapetas, L.; Porto de Albuquerque, J. Understanding the Implementation Challenges of Urban Resilience Policies: Investigating the Influence of Urban Geological Risk in Thessaloniki, Greece. Sustainability 2018, 10, 3573. [Google Scholar] [CrossRef]
- Poulicos, P.; Apostolos, L.; Nektarios, C. Using the Urban Atlas Dataset for Estimating Spatial Metrics. Methodology and application in urban areas of Greece. 2017. Available online: http://journals.openedition.org/cybergeo/28051 (accessed on 16 April 2024).
- Climate and Average Weather Year Round in Greece. Available online: https://weatherspark.com/countries/GR (accessed on 5 April 2024).
- Raptis, I.-P.; Kazadzis, S.; Amiridis, V.; Gkikas, A.; Gerasopoulos, E.; Mihalopoulos, N. A Decade of Aerosol Optical Properties Measurements over Athens, Greece. Atmosphere 2020, 11, 154. [Google Scholar] [CrossRef]
- Katsanos, D.; Bougiatioti, A.; Liakakou, E.; Kaskaoutis, D.G.; Stavroulas, I.; Paraskevopoulou, D.; Lianou, M.; Psiloglou, B.E.; Gerasopoulos, E.; Pilinis, C.; et al. Optical Properties of Near-Surface Urban Aerosols and their Chemical Tracing in a Mediterranean City (Athens). Aerosol Air Qual. Res. 2019, 19, 49–70. [Google Scholar] [CrossRef]
- Founda, D.; Nastos, P.T.; Pierros, F.; Kalimeris, A. Historical observations of cloudiness (1882–2012) over a large urban area of the eastern Mediterranean (Athens). Theor. Appl. Climatol. 2019, 137, 283–295. [Google Scholar] [CrossRef]
- Greece’s Record Rainfall and Flash Floods Are Part of a Trend—Across the Mediterranean, the Weather Is Becoming more Dangerous. Available online: https://theconversation.com/greeces-record-rainfall-and-flash-floods-are-part-of-a-trend-across-the-mediterranean-the-weather-is-becoming-more-dangerous-213164 (accessed on 6 April 2024).
- Esotc 2021|Europe Clouds and Sunshine Duration. Available online: https://climate.copernicus.eu/esotc/2021/clouds-and-sunshine-duration (accessed on 6 April 2024).
- Li, Q.; Groß, S. Satellite observations of seasonality and long-term trends in cirrus cloud properties over Europe: Investigation of possible aviation impacts. Atmos. Chem. Phys. 2022, 22, 15963–15980. [Google Scholar] [CrossRef]
- Papachristopoulou, K.; Raptis, I.-P.; Gkikas, A.; Fountoulakis, I.; Masoom, A.; Kazadzis, S. Aerosol optical depth regime over megacities of the world. Atmos. Chem. Phys. 2022, 22, 15703–15727. [Google Scholar] [CrossRef]
- More Sunshine in Europe Due to Cleaner Air. Available online: https://user.eumetsat.int/resources/case-studies/more-sunshine-in-europe-due-to-cleaner-air (accessed on 6 April 2024).
- Mortier, A.; Gliß, J.; Schulz, M.; Aas, W.; Andrews, E.; Bian, H.; Chin, M.; Ginoux, P.; Hand, J.; Holben, B.; et al. Evaluation of climate model aerosol trends with ground-based observations over the last 2 decades—An AeroCom and CMIP6 analysis, Atmos. Chem. Phys. 2020, 20, 13355–13378. [Google Scholar] [CrossRef]
- Kosmopoulos, P.G.; Mechilis, M.T.; Kaoura, P. Solar Energy Production Planning in Antikythera: Adequacy Scenarios and the Effect of the Atmospheric Parameters. Energies 2022, 15, 9406. [Google Scholar] [CrossRef]
- Ministerial Decision YPEN/DAPEEK/53563/1556/2023—Official Gazette 3328/B/19-5-2023. Available online: https://ypen.gov.gr/wp-content/uploads/2023/05/FEK-2023-Tefxos-B-03328-downloaded-22_05_2023.pdf (accessed on 17 April 2024).
- Anagnostopoulos, P.; Spyridaki, N.-A.; Flamos, A. A “New-Deal” for the Development of Photovoltaic Investments in Greece? A Parametric Techno-Economic Assessment. Energies 2017, 10, 1173. [Google Scholar] [CrossRef]
- Fountoukis, C.; Figgis, B.; Ackermann, L. Effects of atmospheric dust deposition on solar PV energy production in a desert environment. Sol. Energy 2018, 164, 94–100. [Google Scholar] [CrossRef]
- Hiroyuki, K.; Bing, G. Improvement of an electrostatic cleaning system for removal of dust from solar panels. J. Electrost. 2018, 91, 28–33. [Google Scholar] [CrossRef]
- Kosmopoulos, P.G.; Kazadzis, S.; El-Askary, H.; Taylor, M.; Gkikas, A.; Proestakis, E.; Kontoes, C.; El-Khayat, M.M. Earth-Observation-Based Estimation and Forecasting of Particulate Matter Impact on Solar Energy in Egypt. Remote Sens. 2018, 10, 1870. [Google Scholar] [CrossRef]
- Masoom, A.; Kosmopoulos, P.; Kashyap, Y.; Kumar, S.; Bansal, A. Rooftop Photovoltaic Energy Production Management in India Using Earth-Observation Data and Modeling Techniques. Remote Sens. 2020, 12, 1921. [Google Scholar] [CrossRef]
- Kurdi, Y.; Asadi, S. The Impact of Large Deployment of Distributed Solar Photovoltaic at the Urban Scale on the Building Performance and the Correlation Between Energy Supply and Demand Over the Grid. In Renewable Energy for Buildings. Green Energy and Technology; Sadat-Mohammadi, M., Nazari-Heris, M., Asadi, S., Mohammadi-Ivatloo, B., Jebelli, H., Eds.; Springer: Cham, Germany, 2022. [Google Scholar] [CrossRef]
- Brown, K.; Baniassadi, A.; Pham, J.; Sailor, D.; Phelan, P. Effects of Rooftop Photovoltaics on Building Cooling Demand and Sensible Heat Flux Into the Environment for an Installation on a White Roof. ASME J. Eng. Sustain. Build. Cities 2020, 1, 1–2. [Google Scholar] [CrossRef]
- Solar PV on Municipal Buildings: A Guide to Feasibility and Financial Analysis. Available online: https://www.c40knowledgehub.org/s/article/Solar-PV-on-municipal-buildings-a-guide-to-feasibility-and-financial-analysis?language=en_US (accessed on 17 April 2024).
- Solar Explained. Solar Energy and the Environment. Available online: https://www.eia.gov/energyexplained/solar/solar-energy-and-the-environment.php (accessed on 5 April 2024).
- Carbon Dioxide Emissions Coefficients. Available online: https://www.eia.gov/environment/emissions/co2_vol_mass.php (accessed on 5 April 2024).
- A Reality Check about Solar Panel Waste and the Effects on Human Health. Available online: https://insideclimatenews.org/news/12102023/inside-clean-energy-reality-check-solar-panel-waste/ (accessed on 5 April 2024).
- What Is the Carbon Footprint of Solar Panels? Available online: https://www.solar.com/learn/what-is-the-carbon-footprint-of-solar-panels/ (accessed on 5 April 2024).
- Yes, Solar Panels Produce Pollution, Here’s How? Available online: https://www.riddlelife.com/yes-solar-panels-produce-pollution-heres-how/ (accessed on 5 April 2024).
- Greenhouse Gas Equivalencies Calculator|US EPA. Available online: https://www.epa.gov/energy/greenhouse-gas-equivalencies-calculator (accessed on 28 March 2024).
- Greece Population 2024 (Live) World Population Review. Available online: https://worldpopulationreview.com/countries/greece-population (accessed on 23 May 2024).
- Rooftop Photovoltaics Paired with Energy Efficiency: The Key for Sustainable Cities around the World. Available online: https://joint-research-centre.ec.europa.eu/jrc-news-and-updates/rooftop-photovoltaics-paired-energy-efficiency-key-sustainable-cities-around-world-2024-01-18_en (accessed on 28 March 2024).
- Tapia, M.; Ramos, L.; Heinemann, D.; Zondervan, E. Power to the city: Assessing the rooftop solar photovoltaic potential in multiple cities of Ecuador. Phys. Sci. Rev. 2023, 8, 2285–2319. [Google Scholar] [CrossRef]
- Emissions More Per Acre Than Trees—And Much More Than Corn Ethanol. Available online: https://news.climate.columbia.edu/2022/10/26/solar-panels-reduce-co2-emissions-more-per-acre-than-trees-and-much-more-than-corn-ethanol/ (accessed on 5 April 2024).
- Fakhraian, E.; Alier, M.; Valls Dalmau, F.; Nameni, A.; Casañ Guerrero, M.J. The Urban Rooftop Photovoltaic Potential Determination. Sustainability 2021, 13, 7447. [Google Scholar] [CrossRef]
- Kozlovas, P.; Gudzius, S.; Ciurlionis, J.; Jonaitis, A.; Konstantinaviciute, I.; Bobinaite, V. Assessment of Technical and Economic Potential of Urban Rooftop Solar Photovoltaic Systems in Lithuania. Energies 2023, 16, 5410. [Google Scholar] [CrossRef]
- Alomoto, W.; Niñerola, A.; Pié, L. Social Impact Assessment: A Systematic Review of Literature. Soc. Indic. Res. 2022, 161, 225–250. [Google Scholar] [CrossRef]
- Evelyn, E.G.; David, M.B.; Max, C.N.C.; Daniel, L.C.; Peter, M.G.; Jackson, C.R.; John, S.K.; Debra, P.C.P.; Steward, T.A.P.; Julie, R.; et al. Long-Term Ecological Research and Evolving Frameworks of Disturbance Ecology. BioScience 2020, 70, 141–156. [Google Scholar] [CrossRef]
- Hong, T.; Lee, M.; Koo, C.; Jeong, K.; Kim, J. Development of a method for estimating the rooftop solar photovoltaic (PV) potential by analyzing the available rooftop area using Hillshade analysis. Appl. Energy 2017, 194, 320–332. [Google Scholar] [CrossRef]
- Angliviel de La Beaumelle, N.; Blok, K.; de Chalendar, J.; Clarke, L.; Hahmann, A.; Huster, J.; Nemet, G.; Suri, D.; Wild, T.; Azevedo, I. The Global Technical, Economic, and Feasible Potential of Renewable Electricity. Annu. Rev. Environ. Resour. 2023, 48, 419–449. [Google Scholar] [CrossRef]
- Renewable Energy Technical Potential. Available online: https://www.nrel.gov/gis/re-potential.html (accessed on 24 July 2024).
- Technical Potential and Meaningful Benefits of Community Solar in the United States. Available online: https://www.nrel.gov/docs/fy24osti/87524.pdf (accessed on 24 July 2024).
- Can Solar Rooftops Power the World? Available online: https://undecidedmf.com/can-solar-rooftops-power-the-world/ (accessed on 24 July 2024).
- The New Law 5037/2023 and the Changes It Brought about in the Energy Sector. Available online: https://yiannatsis.gr/o-neos-nomos-5037-2023-kai-oi-allages-poy-epefere-ston-tomea-tis-energeias/ (accessed on 15 April 2024).
- The New Regulations of Law 5037/2023 for Photovoltaics, Self-Consumption and Energy Communities. Available online: https://texnimon.gr/oi-nees-rythmiseis-tou-n-5037-2023-gia-fotovoltaika-aftokatanalosi-kai-energeiakes-koinotites/ (accessed on 15 April 2024).
- How APE almost Zeroed Electricity Prices for 5 Hours. Available online: https://www.in.gr/2024/04/08/in-science/perivallon-b-science/pos-oi-ape-sxedon-midenisan-tis-times-tou-reymatos-gia-5-ores/ (accessed on 10 April 2024).
- Solar Saves. Available online: https://www.solarpowereurope.org/advocacy/solar-saves (accessed on 10 April 2024).
- Urban Energy. Available online: https://unhabitat.org/topic/urban-energy (accessed on 11 April 2024).
- Hannah Ritchie, Pablo Rosado and Max Roser (2020)—“Energy Production and Consumption” Published online at OurWorldInData.org. Available online: https://ourworldindata.org/energy-production-consumption (accessed on 11 April 2024).
- IEA. Key World Energy Statistics 2021; IEA: Paris, France, 2021; Available online: https://www.iea.org/reports/key-world-energy-statistics-2021 (accessed on 11 April 2024).
- Energy 101—Cities & Rising Energy Consumption. Available online: https://studentenergy.org/energy-101-cities-rising-energy-consumption/ (accessed on 11 April 2024).
- Vokas, G.; Lagogiannis, K.V. PV Energy Production Over Greece: Comparison of Predicted and Measured Data of Medium-Scale Photovoltaic Parks. Int. J. Eng. Res. Technol. 2013, 2, 3005–3011. [Google Scholar]
- Solargis: Solar Irradiance Data. Available online: https://solargis.com/ (accessed on 30 March 2024).
- Solea|Solar Energy Applications. Available online: https://solea.gr/ (accessed on 15 February 2024).


| City | S.L. > 80% Area (km2) (1) | S.L.: 50–80% Area (km2) (2) | S.L.: 30–50% Area (km2) (3) | S.L.: 10–30% Area (km2) (4) | S.L. < 10% Area (km2) (5) | Building Density Factors | PV Exploit. and Compat. Factors | Total Exploit. and Compat. Area (km2) |
|---|---|---|---|---|---|---|---|---|
| Athens | 108.9 | 125.5 | 96.1 | 76.0 | 13.3 | 0.585 (1) | 0.168 (1) | 24.5 |
| Thessaloniki | 31.9 | 40.6 | 11.2 | 1.6 | 3.0 | 0.365 (2) | 0.154 (2) | 6.0 |
| Patras | 4.8 | 8.5 | 9.3 | 6.2 | 2.1 | 0.302 (3) | 0.147 (3) | 1.6 |
| Heraklion | 4.2 | 8.3 | 12.8 | 7.3 | 1.5 | 0.271 (4) | 0.112 (4) | 1.7 |
| Larissa | 10.5 | 17.3 | 6.5 | 1.2 | 0.4 | 0.171 (5) | 0.063 (5) | 2.3 |
| Volos | 6.6 | 5.4 | 2.5 | 3.2 | 1.0 | 1.2 | ||
| Ioannina | 4.5 | 16.5 | 8.0 | 3.8 | 1.4 | 1.9 | ||
| Kalamata | 1.9 | 2.7 | 3.1 | 3.9 | 2.0 | 0.6 | ||
| Kavala | 3.2 | 4.0 | 2.1 | 1.0 | 0.1 | 0.7 |
| City | Average S.L. > 80% Height (m) | Average S.L.: 50–80% Height (m) | Average S.L.: 30–50% Height (m) | Average S.L.: 10–30% Height (m) | Average S.L. < 10% Height (m) | Average All S.L.s Height (m) |
|---|---|---|---|---|---|---|
| Athens | 12.59 | 9.86 | 8.23 | 6.96 | 6.40 | 11.33 |
| Thessaloniki | 8.64 | 5.70 | 6.39 | 5.86 | 5.07 | 8.47 |
| Patras | 7.85 | 5.71 | 4.64 | 4.54 | 4.33 | 6.38 |
| Heraklion | 6.69 | 6.51 | 6.24 | 6.00 | 5.81 | 6.55 |
| Larissa | 6.15 | 5.13 | 4.19 | 3.43 | 3.61 | 5.88 |
| Volos | 6.79 | 4.52 | 3.92 | 3.42 | 4.52 | 6.31 |
| Ioannina | 7.14 | 5.71 | 5.05 | 5.38 | 5.29 | 6.42 |
| Kalamata | 7.47 | 6.42 | 5.09 | 4.36 | 3.89 | 6.29 |
| Kavala | 7.24 | 5.45 | 4.25 | 3.67 | 7.50 | 6.92 |
| Annual % Percentage Change during the Decade 2014–2023 | |||||
|---|---|---|---|---|---|
| City | CMF | AMF | GHI (kWh/m2) | Losses Due to Clouds (kWh/m2) | Losses Due to Aerosols (kWh/m2) |
| Athens | 0.25 | 0.13 | 35.31 | −25.82 | −26.13 |
| Thessaloniki | 0.59 | 0.21 | 92.31 | −74.91 | −36.89 |
| Patras | 0.45 | 0.04 | 72.31 | −63.22 | −10.38 |
| Heraklion | 0.34 | 0.14 | 57.07 | −38.64 | −29.25 |
| Larissa | 0.47 | 0.02 | 73.33 | −57.54 | −0.08 |
| Volos | 0.44 | 0.02 | 66.43 | −54.60 | −0.63 |
| Ioannina | 0.47 | 0.07 | 80.10 | −56.33 | −14.04 |
| Kalamata | 0.37 | 0.05 | 71.59 | −55.61 | −2.37 |
| Kavala | 0.36 | 0.19 | 55.95 | −39.18 | −36.10 |
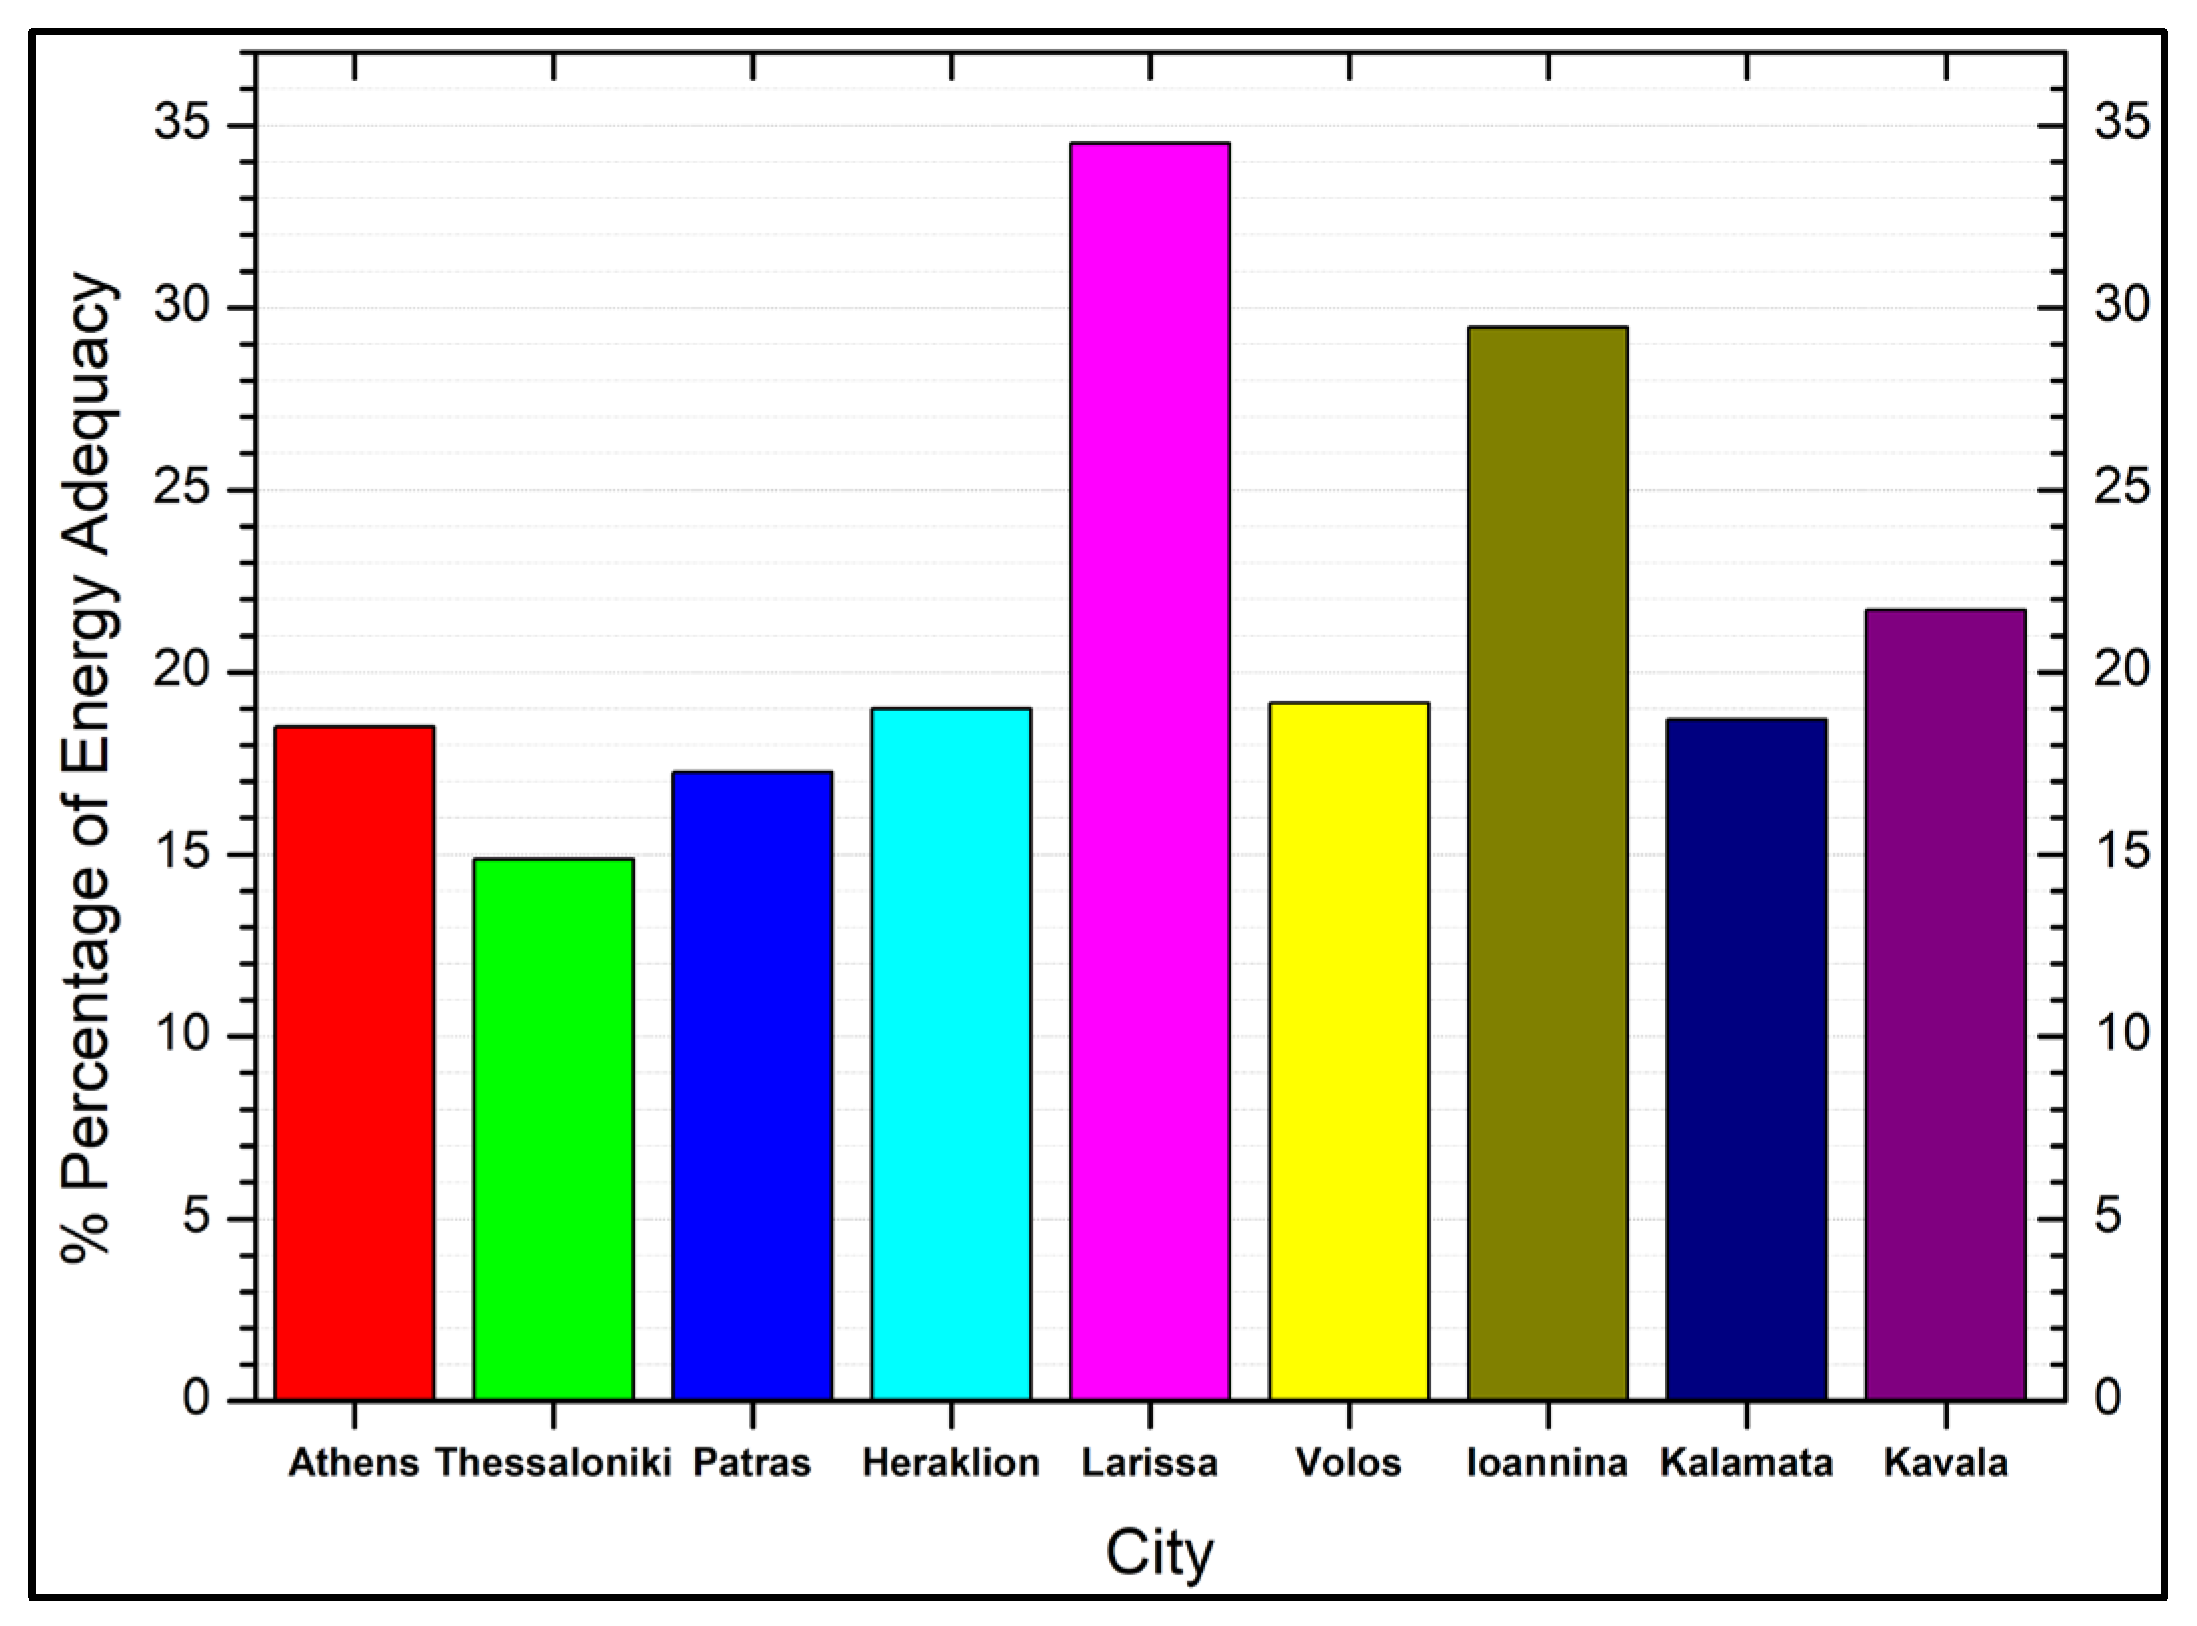
| City | Total Exploitable and Compatible Area (km2) | Consumption (GWh) | Production (GWh) | % Percentage of Energy Adequacy |
|---|---|---|---|---|
| Athens | 24.46 | 9920.93 | 1834.39 | 18 |
| Thessaloniki | 5.99 | 2759.83 | 410.38 | 15 |
| Patras | 1.57 | 656.72 | 113.32 | 17 |
| Heraklion | 1.68 | 645.12 | 122.50 | 19 |
| Larissa | 2.33 | 450.45 | 155.50 | 35 |
| Volos | 1.17 | 427.59 | 81.89 | 19 |
| Ioannina | 1.86 | 417.26 | 122.92 | 29 |
| Kalamata | 0.61 | 243.04 | 45.46 | 19 |
| Kavala | 0.66 | 202.44 | 43.95 | 22 |
| City | ML Due to Shadows (MEUR) | ML Due to Aerosols (MEUR) | ML Due to Clouds (MEUR) | Total ML (MEUR) | Earnings (MEUR) | Profit (MEUR) |
|---|---|---|---|---|---|---|
| Athens | 11.31 | 24.65 | 29.92 | 65.88 | 115.57 | 49.69 |
| Thessaloniki | 1.95 | 5.97 | 8.11 | 16.03 | 25.85 | 9.82 |
| Patras | 0.37 | 1.37 | 1.67 | 3.41 | 7.14 | 3.73 |
| Heraklion | 0.43 | 1.76 | 1.97 | 4.16 | 7.72 | 3.56 |
| Larissa | 0.49 | 2.03 | 2.90 | 5.42 | 9.80 | 4.38 |
| Volos | 0.28 | 1.07 | 1.52 | 2.87 | 5.16 | 2.29 |
| Ioannina | 0.45 | 1.63 | 2.91 | 4.99 | 7.74 | 2.75 |
| Kalamata | 0.15 | 0.50 | 0.67 | 1.32 | 2.86 | 1.54 |
| Kavala | 0.17 | 0.68 | 0.91 | 1.76 | 2.77 | 1.01 |
| City | Production (GWh) | CO2 Equivalent (Metric Tons) | Population [82] | Per Capita CO2 Emissions Avoided (Mt) |
|---|---|---|---|---|
| Athens | 1834.39 | 1,281,486 | 3,154,591 | 0.406 |
| Thessaloniki | 410.38 | 286,690 | 814,980 | 0.352 |
| Patras | 113.32 | 79,162 | 215,922 | 0.367 |
| Heraklion | 122.50 | 85,575 | 154,599 | 0.554 |
| Larissa | 155.50 | 108,633 | 175,995 | 0.617 |
| Volos | 81.89 | 57,207 | 90,972 | 0.628 |
| Ioannina | 122.92 | 85,868 | 85,803 | 1.001 |
| Kalamata | 45.46 | 31,760 | 54,027 | 0.588 |
| Kavala | 43.95 | 30,702 | 60,000 | 0.512 |
Disclaimer/Publisher’s Note: The statements, opinions and data contained in all publications are solely those of the individual author(s) and contributor(s) and not of MDPI and/or the editor(s). MDPI and/or the editor(s) disclaim responsibility for any injury to people or property resulting from any ideas, methods, instructions or products referred to in the content. |
© 2024 by the authors. Licensee MDPI, Basel, Switzerland. This article is an open access article distributed under the terms and conditions of the Creative Commons Attribution (CC BY) license (https://creativecommons.org/licenses/by/4.0/).
Share and Cite
Vigkos, S.; Kosmopoulos, P.G. Photovoltaics Energy Potential in the Largest Greek Cities: Atmospheric and Urban Fabric Effects, Climatic Trends Influences and Socio-Economic Benefits. Energies 2024, 17, 3821. https://doi.org/10.3390/en17153821
Vigkos S, Kosmopoulos PG. Photovoltaics Energy Potential in the Largest Greek Cities: Atmospheric and Urban Fabric Effects, Climatic Trends Influences and Socio-Economic Benefits. Energies. 2024; 17(15):3821. https://doi.org/10.3390/en17153821
Chicago/Turabian StyleVigkos, Stavros, and Panagiotis G. Kosmopoulos. 2024. "Photovoltaics Energy Potential in the Largest Greek Cities: Atmospheric and Urban Fabric Effects, Climatic Trends Influences and Socio-Economic Benefits" Energies 17, no. 15: 3821. https://doi.org/10.3390/en17153821