Article

Droop Frequency Limit Control and Its Parameter Optimization in VSC-HVDC Interconnected Power Grids

1
Global Energy Interconnection Development and Cooperation Organization, Beijing 100031, China
2
College of Electrical Engineering, Sichuan University, Chengdu 610065, China
*
Author to whom correspondence should be addressed.
Energies 2024, 17(15), 3851; https://doi.org/10.3390/en17153851
Submission received: 18 June 2024 / Revised: 20 July 2024 / Accepted: 21 July 2024 / Published: 5 August 2024

Abstract

:
With the gradual emergence of trends such as the asynchronous interconnection of power grids and the increasing penetration of renewable energy, the issues of ultra-low-frequency oscillations and low-frequency stability in power grids have become more prominent, posing serious challenges to the safety and stability of systems. The voltage-source converter-based HVDC (VSC-HVDC) interconnection is an effective solution to the frequency stability problems faced by regional power grids. VSC-HVDC can participate in system frequency stability control through a frequency limit controller (FLC). This paper first analyses the basic principles of how VSC-HVDC participates in system frequency stability control. Then, in response to the frequency stability control requirements of the sending and receiving power systems, a droop FLC strategy is designed. Furthermore, a multi-objective optimization method for the parameters of the droop FLC is proposed. Finally, a large-scale electromagnetic transient simulation model of the VSC-HVDC interconnected power system is constructed to verify the effectiveness of the proposed droop FLC method.

1. Introduction

As the proportion of new energy in the power grid gradually increases, the lack of flexible regulation resources in regional power grids has become a significant issue. This has highlighted the problem of weakened grid support and the increased risk of safe and stable operation. The expansion of regional power grid interconnections can effectively enhance the wide-scale interconnection and optimal allocation of clean energy. For instance, the strengthening of the China Northwest–Southwest power grid interconnection would facilitate the introduction of abundant clean energy from the Northwest into the Southwest. In particular, for the two regional grids based on wind, light, and water and wind, light, and fire, respectively, it is possible to interconnect them using VSC-HVDC in order to achieve cross-regional grid connection. This will result in an optimized overall power supply structure for the two regional grids, thereby enhancing the reliability of the power supply for the entire system. In fact, the interconnection of regional power grids can not only facilitate mutual assistance in the supply of power, but also enable the full coordination of frequency regulation resources on both sides, thereby effectively improving the frequency stability of the entire system. With regard to the Northwest Grid, the gradual withdrawal of thermal power in Northwest China and the gradual increase in the proportion of new energy installations will result in the emergence of two key issues. Firstly, the system will lack sufficient inertia, which will in turn lead to a high-frequency change rate after faults. Secondly, this will render the system susceptible to low-frequency load-shedding action. Concurrently, the proportion of hydropower installed in the southwestern region is considerable, and it is susceptible to frequency oscillation due to the “water hammer” effect in the process of regulating the speed of hydraulic turbines. The interconnection of two regional power grids and the implementation of mutual frequency support measures represent crucial strategies for addressing the frequency stability challenges faced by regional power grids. At present, ±500 kV Debao conventional DC has been constructed between the Northwest and Southwest power grids of China, which enables the realization of small-capacity inter-regional power interconnection. In order to reinforce regional collaboration and facilitate the growth of the Chengdu–Chongqing Economic Circle, a number of DC transmissions will be constructed between the Northwest and Southwest power grids in the future. These will include both conventional DC and VSC-HVDC [1,2]. Among these, the VSC-HVDC is capable of rapid tidal current adjustment and reversal, which is anticipated to be a pivotal component in the frequency regulation of the Northwest–Southwest interconnected power grid.
In the context of DC transmission, the traditional control strategy of DC transmission is unable to respond to the frequency change of the AC grid, thereby preventing the achievement of mutual support for frequency stability on both sides. The literature [3] has examined the analytical approach and calculation procedures involved in aggregating diverse units into a unified equivalent unit. Furthermore, in consideration of the frequency control of new energy sources and energy storage, the single equivalent unit method for aggregating multiple types of units was proposed. Nevertheless, the streamlined aggregation of each unit type within the equivalence model is inadequate for capturing the spatial and temporal distribution characteristics of the system frequency response.
In light of this, researchers have put forth the proposal of a DC additional frequency controller, also known as a frequency limit controller (FLC), which is capable of automatically adjusting the DC transmission power in accordance with the fluctuations in the AC system frequency, thus effectively suppressing the frequency fluctuations [4,5,6]. The FLC has been employed extensively in conventional high-voltage DC transmission, which does not necessitate intricate stabilization control strategies and is capable of instantaneous frequency adjustment with a rapid response time. The literature [7,8,9] investigated the role of FLC for conventional DC transmission in improving the system frequency, particularly the ability of interconnected systems to support each other after the occurrence of severe faults. It proposed a control strategy that takes into account both frequency and DC voltage regulation. The designed FLC significantly improves the frequency stability of the system. In the literature [10,11,12], the phenomenon of ultra-low-frequency oscillations generated in DC islanding systems of hydroelectric units was explored, and a method was proposed to reduce the dead zone of the FLC so that it starts before the unit governor. In the literature [13], the structure and characteristics of two typical FLCs are compared, and parameter design principles are proposed. In order to gain further insight into the effects of FLC spare capacity and deadband setting on the peak frequency and regulation process, the literature [14] employed a time-domain simulation. Based on the findings of this study, an optimal design scheme was proposed. The aforementioned literature primarily concentrates on the FLC for conventional DC, with a more comprehensive investigation. At present, there is a paucity of studies on the FLC for flex-straight. In the field of flexible linear compensation (FLC) for flexible straightening, the literature [15] conducted a comprehensive analysis of the FLC control strategy for back-to-back flexible straightening in LUXI. The literature [16,17] then proceeded to investigate the additional frequency control for back-to-back flexible straightening in YUE, as well as the controller optimization method. The aforementioned studies have primarily concentrated on the additional frequency controller for the back-to-back VSC-HVDC system. The literature [18] proposes the transmission of the frequency deviation information of the AC system at the receiving end to the rectifier side via the communication system between the converter stations. Additionally, the grid frequency signal is to be selected at either the sending end or the receiving end as the input signal of the additional frequency controller through the selection module. When the frequency of the receiving end grid is selected as the input signal, the LCC-HVDC is capable of providing frequency support for the receiving end AC system. The efficacy of this method is contingent upon the reliability of communication, which is typically situated at a considerable distance from the LCC-HVDC converter stations. Any communication delays or interruptions could have a detrimental impact on the control effect. In contrast to the back-to-back FDC, the coordination of the sending and receiving converter stations in long-distance VSC-HVDC necessitates the consideration of communication between the stations. However, this communication is particularly challenging in long-distance transmission due to the inherent complexities involved. Furthermore, the controller parameter tuning optimization method of the flexible direct FLC requires further in-depth study.
This paper proposes a VSC-HVDC additional droop frequency limit control strategy and its control parameter optimization method. Firstly, a frequency–DC voltage-power droop control strategy is proposed. On this basis, a two-layer optimization model of DC FLC parameters is established, taking into account the frequency regulation effect of DC FLC, the action characteristics, and the degree of influence on the frequency of the AC grid. Furthermore, a heuristic algorithm is employed to solve the optimization model in a hierarchical manner, thereby enabling the optimal design of the VSC-HVDC FLC parameters to be achieved. Finally, a simulation model of the two-region VSC-HVDC interconnected grid is constructed based on the CloudPSS Simstudio3.0 electromagnetic transient simulation platform to verify the effectiveness of the proposed method.

2. Principles of VSC-HVDC Involved in Frequency Stabilization Control

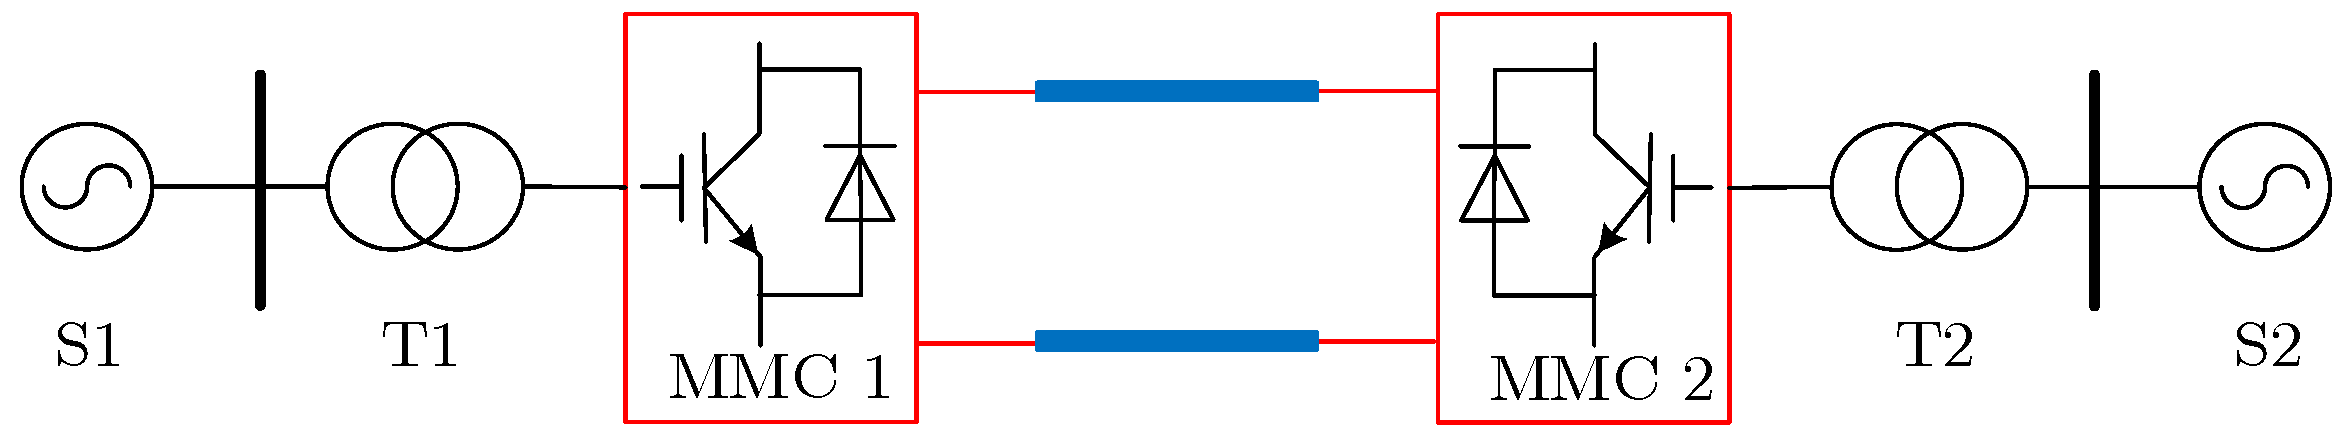
2.1. The Basic Structure of VSC-HVDC

The basic structure of the VSC-HVDC asynchronous transmission system is shown in Figure 1. Among them, MMC1 and MMC2 denote the VSC-HVDC converter at the sending and receiving ends, T1 and T2 denote the converter transformer, and S1 and S2 denote the AC grid at the sending and receiving ends, respectively.

2.2. VSC-HVDC in System Frequency Adjustment

When the AC asynchronous grid frequency changes, the traditional power system frequency control strategy employs the governor of the generator for frequency regulation. If the flexible transmission system is able to participate in the frequency regulation of the AC system on both sides, the frequency of the AC system will be more stable. In VSC-HVDC, active power and reactive power can be controlled independently, and an additional FLC can be designed in the active controller of the VSC-HVDC system to regulate the transmission power of the VSC-HVDC according to the AC grid frequency and improve the frequency stability of the interconnected system. A typical FLC structure is shown in Figure 2. In the event that the system frequency deviates from the upper or lower limits of the FLC dead zone, the FLC is triggered and automatically regulates the DC power in order to reduce the frequency fluctuations of the system to which the DC is connected. In practice, in order to avoid frequent regulation of the DC sending channel power, the deadband of the DC FLC is usually larger than the generator governor deadband.

2.3. The Role of FLC in VSC-HVDC

Once the DC FLC is operational, the frequency characteristics of the power grid at both the sending and receiving ends will be significantly enhanced. In particular, the FLC is capable of mitigating high-frequency/low-frequency phenomena and ultra-low-frequency oscillations within the system.
(1) FLC participates in the suppression of the high-frequency/low-frequency phenomenon of the system.
In the event of frequency fluctuations in the asynchronous power grid, the DC FLC adjusts the reference value signal of the DC current by tracking the frequency change of the AC asynchronous power grid at the DC sending and receiving ends. This enables the automatic adjustment of DC transmission power in response to changes in the power grid frequency. Consequently, asynchronous transmission HVDC can participate in the primary frequency adjustment of the power grid, thereby rapidly balancing the unbalanced power in the power grid. To date, the conventional DC FLC has been employed in a number of DC transmission projects for power grids, including those of the Yunnan Power Grid and the Southwest Power Grid, among others. Furthermore, the VSC-HVDC FLC has been employed in the Yu-E back-to-back VSC-HVDC project and the Ruxi back-to-back VSC-HVDC project.
(2) FLC participation in system ultra-low-frequency oscillation suppression
When active power fluctuation occurs in the system, the system frequency deviation may gradually increase due to the negative damping effect of the hydraulic turbine unit governor. Once the FLC has exceeded its dead zone, it is able to participate in the regulation process. When the system frequency is above the rated frequency, the FLC increases the DC-delivered power. Conversely, when the system frequency is below the rated frequency, the FLC reduces the DC-delivered power. By setting the FLC parameters in an appropriate manner, it is possible to configure the FLC to provide positive damping to the system, thereby counteracting the negative damping effect of the hydroelectric units in the system. This ultimately enables the suppression of ultra-low-frequency oscillations [19,20].

3. Additional Frequency Controller for VSC-HVDC Based on Droop Frequency Limit Control

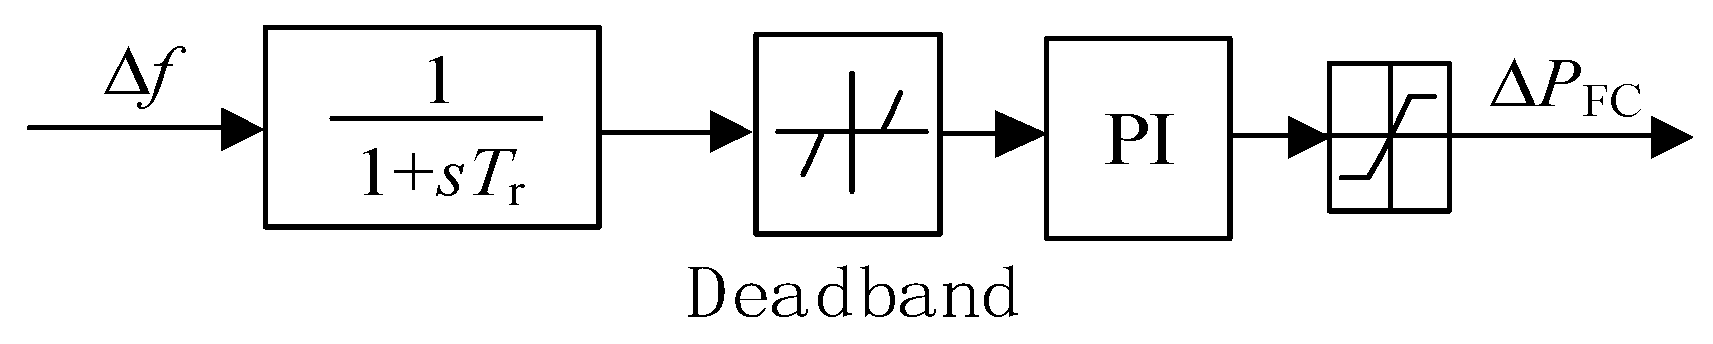
3.1. The Design of Additional Frequency Limit Controller

In general, the outer loop active class control of the two-terminal converter for VSC-HVDC employs two distinct control strategies: constant DC voltage control and constant active power control. For the two-terminal VSC-HVDC system depicted in Figure 1, it is postulated that MMC1 employs constant active power control, whereas MMC2 employs constant DC voltage control.
As the MMC2 converter station employs a constant DC voltage control mechanism, it is not feasible to regulate its active power directly. In order to permit subsystem S1 to participate in the frequency regulation of subsystem S2 via the VSC-HVDC system, it is possible to implement a droop frequency limit control strategy in the converter stations on either side of the VSC-HVDC system. Furthermore, the slope characteristic of the frequency–DC voltage (f-Udc) can be considered in the outer loop controller of the converter station MMC2, thereby enabling the DC voltage to vary with the frequency of subsystem S2. Concurrently, in order to facilitate the active power transmitted by the VSC-HVDC system to vary in accordance with the AC variation in the DC voltage, it is also necessary to incorporate the DC voltage-active power (Udc-P) droop characteristic into the active outer-loop controller of the converter station MMC1.
In order to enable subsystem S2 to participate in the frequency adjustment of subsystem S1 when the latter is subject to frequency fluctuations, the converter station MMC1 employs a frequency-active power (f-P) droop frequency limit control in the outer loop controller. The converter station MMC1 regulates the active power reference value of the regulator according to the frequency fluctuation of subsystem S1. This allows subsystem S2 to participate in the frequency adjustment of subsystem S1 through the VSC-HVDC system.
According to the aforementioned concept, the active outer loop controller of the converter stations situated on either side of the VSC-HVDC system can be designed as follows. The expression of the active outer loop controller for the converter station MMC2 is given by Equation (1):
0 = U dc 2 * U dc 2 + K f 2 ( f 2 f 2 * ) ,
where Kf2 is the frequency of the AC system and the slope coefficient between the power of the converter station and the DC voltage, Udc2 is the DC voltage of MMC2, f2 is the frequency of the AC system S2, and U*dc2 and f2* are their reference values, respectively.
For the MMC1 converter station, the active outer loop controller expression is shown in Equation (2):
0 = P 1 * P 1 + K f 1 ( f 1 f 1 * ) + K V 1 ( U dc 1 U dc 1 * ) ,
where Kf1 and Kv are the slope coefficients corresponding to the frequency droop frequency limit control and the DC voltage droop frequency limit control, respectively, P1 is the active power of MMC1, Udc1 is the DC voltage of MMC1, f1 is the frequency of the AC grid S1, and P1*, Udc1*, and f1* are their reference values, respectively.
In a steady state, the DC line is equivalent to a resistor. Accordingly, the relationship between the DC voltage of the MMC1 converter station and the DC voltage of the MMC2 converter station can be deduced:
U dc 1 = U dc 2 + R dc I dc ,
In this context, Rdc represents the equivalent resistance of the DC line, while Idc denotes the DC current. From Equation (3), it can be observed that there is a coupling of DC voltage at the converter station on both sides of the VSC-HVDC. According to Equations (1)–(3), it can be demonstrated that the AC grids on both sides of the VSC-HVDC system can provide a certain frequency support to each other.

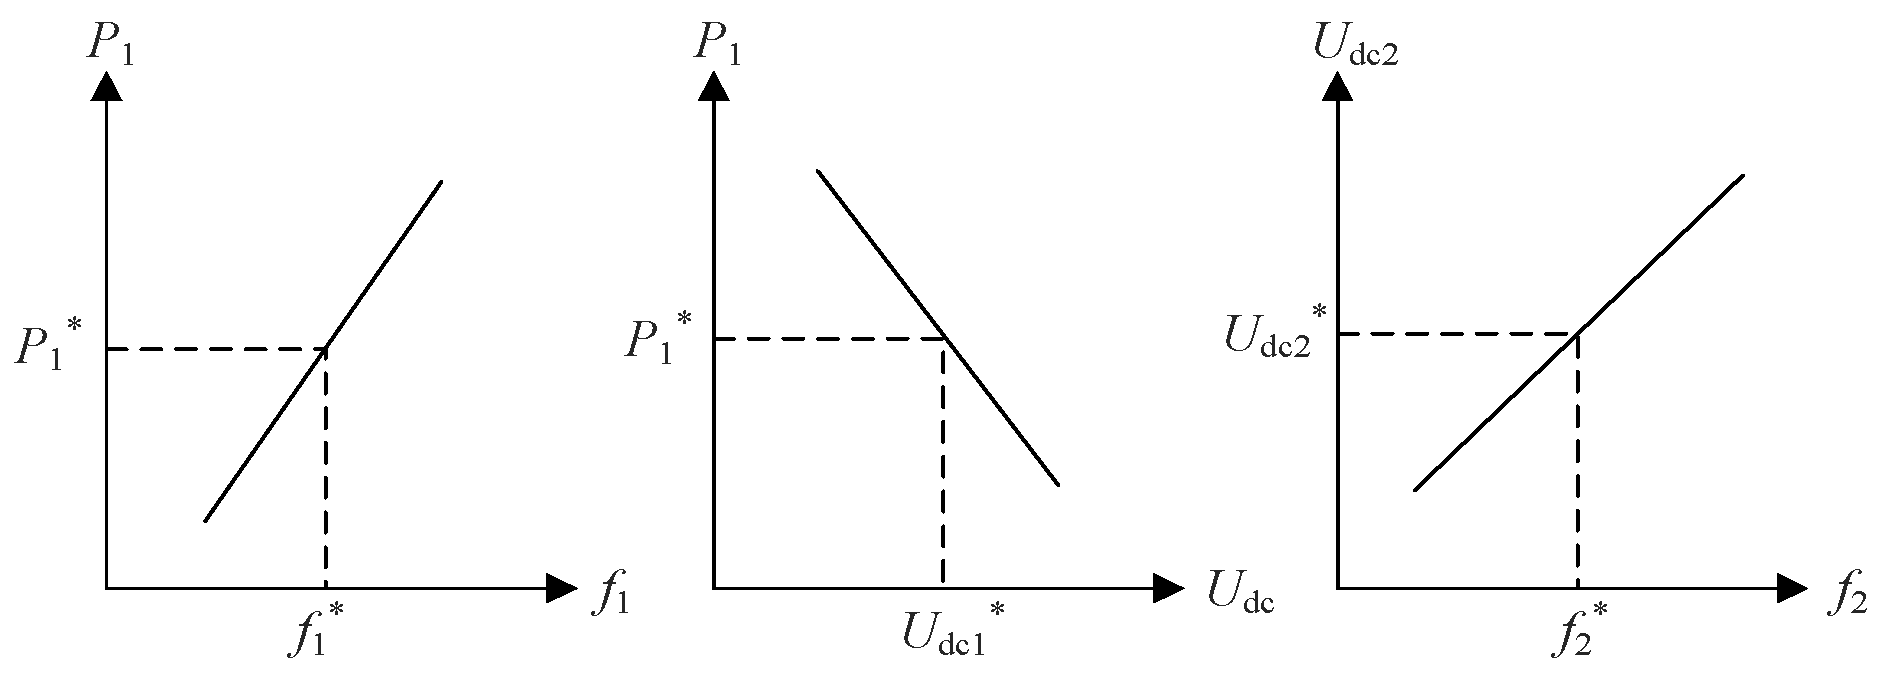
3.2. The Parameter Setting Principle of Additional Frequency Limit Controller

The value of Kf1 can be selected according to the active-frequency static characteristics of the AC grid S1, and its value is positive. The value of the coefficient Kf2 must take into account two key considerations. Firstly, Kf2 must ensure that the DC voltage remains within an acceptable range, and secondly, it must guarantee that the sensitivity of the DC voltage to changes in net measurement frequency is maintained. The sign of Kv1 is opposite to that of Kf2. Kv1 is taken to be positive, and the active power of the converter station MMC1 is increased with the increase in DC voltage when DC voltage is increased. This is equivalent to the decrease in DC voltage. The reduction in unbalanced power in the DC network, the reduction in fluctuations in DC voltage, and the maintenance of DC system stability are achieved by the control characteristics of the DC additional droop frequency limit controllers of MMC1 and MMC2, as shown in Figure 3.

3.3. The Design of Controller Limiting

To avoid the frequent operation of the DC additional droop frequency limit controllers of the VSC-HVDC, upper and lower limit action values are set in the slope characteristics of the additional frequency controllers of the MMC1 and MMC2 converter stations, as shown in Figure 4. If the upper and lower limit action values in the additional frequency controller are set too small, the dynamic response of the controller will be too sensitive, which will affect its steady-state operating characteristics, and if they are set too large, the dynamic response of the controller will be too sluggish. For this reason, the controller’s limiting parameters must be optimized.
Furthermore, in light of the additional frequency limit control illustrated in Figure 4, it is imperative to impose constraints on the active and DC voltages of the DC additional frequency controller, as depicted in Figure 5. The addition of a limit to the fixed power converter active controller serves to prevent the power modulation from exceeding the load of the converter station, and furthermore, prevents the generation of excessive frequency variations in the accident-free terminated AC system. The incorporation of a limiting link to the constant DC voltage controller can prevent the DC voltage of the double-ended flexible DC transmission system from exceeding the specified limit value. In order to obtain the optimum controller response characteristics, it is necessary to optimize the limiting parameters of the controller as follows.

4. Parameter Optimization of a VSC-HVDC Additional Frequency Controller Based on a Two-Layer Optimization Approach

In Section 2, a two-layer optimization method for the FLC parameters of the additional frequency controller is proposed for the VSC-HVDC additional droop frequency limit control. The flow of this method is illustrated in Figure 6. The objective of the initial layer of optimization is to design the control link parameters of the VSC-HVDC droop FLC in order to optimize the regulation effect of the VSC-HVDC droop FLC on the system frequency under the high-power step perturbation condition and the degree of influence on the system frequency at the other end. In the event of a high-power disturbance, the VSC-HVDC droop FLC must first ensure the effective suppression of the peak frequency change of the AC grid, while simultaneously minimizing the power regulation of the VSC-HVDC droop FLC in order to reduce the impact on the frequency of the AC grid at the other end. The second layer of optimization is based on the optimization results of the first layer of DC FLC control parameters. The frequency deadband parameters fdb+ and fdb of the DC FLC are designed with consideration of the frequency regulation effect of the DC FLC, the action characteristics, and the impact on the frequency of the other end of the grid simultaneously under the continuous small-power perturbation. In the event of a continuous small load disturbance, the system frequency is no longer at risk of instability. At this juncture, the VSC-HVDC droop FLC is tasked with enhancing its action characteristics and reducing the impact on the VSC-HVDC system. This section may be divided into subheadings. It is expected that the results of the experiment will be presented in a concise and precise manner, accompanied by an interpretation and a set of conclusions that can be drawn from the experiment.

4.1. The Optimization Model of VSC-HVDC FLC Control Parameters

The optimization model for the parameters of the VSC-HVDC FLC control link can be written in the following form:
min { F 1 ( x c ) } s . t . { g ( x c )   h ( x gen ) ,
where g(xc) denotes the constraints of the DC FLC and h(xgen) denotes the constraints of the conventional units in the system. In order to balance the control accuracy and convergence speed of the controller, the objective is to minimize the absolute value of the error multiplication time integration index of AC grid frequency and DC FLC power regulation under high power disturbances:
min F 1 ( x c ) = 0 t sim t | Δ f s |   d t + 10 α 0 t sim t | Δ P FLC |   d t ,
where xc is the control link parameter of the droop FLC for VSC-HVDC, tsim is the simulation time, ∆fs is the sum of the frequency deviations of the transmitter and receiver systems, and α is the order-of-magnitude adjustment factor to avoid the “overlay” phenomenon caused by order-of-magnitude differences in the optimization process.
The power control of the VSC-HVDC FLC is limited by the rated capacity of the VSC-HVDC system, so the power control constraint g(xc) of the DC FLC must also be considered in the optimization process can be expressed as [14]:
{ 0 Δ P FLC < Δ P up , lim Δ P low , lim < Δ P FLC 0 ,
where ΔPup,lim and ΔPlow,lim are the upper and lower limits of the power regulation of the VSC-HVDC FLC, and the larger the parameter is set, the stronger the frequency regulation ability of the VSC-HVDC droop FLC is indicated.
The VSC-HVDC FLC serves as an auxiliary means of primary frequency regulation of the grid. In order to avoid the normal primary frequency regulation of the conventional units being affected by the DC FLC action, frequency regulation of the grid must be coordinated with the conventional units. When optimizing the parameters of the FLC, the primary frequency regulation response of the conventional unit must satisfy the constraints of the grid guidelines h(xgen), which can be expressed as [14]:
{ T g i r < T g i r , max   P g i min < P g i < P g i max ,
where i is the i-th conventional unit participating in primary frequency regulation, Tgir is the rise time of primary frequency regulation power of conventional generating units, Tgir,max is the maximum rise time specified in the Directive, Pgi is the power of the conventional units participating in primary frequency regulation, and Pgimin,max are the upper and lower limits of the power of the conventional units participating in primary frequency regulation.

4.2. The Optimization Model of the VSC-HVDC FLC Deadband Parameter

The multi-objective optimization model for the deadband parameters of the second layer DC FLC can be written in the following compact form:
min { F 2 ( f db + , f db )   ,   F 3 ( f db + , f db )   } s . t . { g 2 ( x c )   ,   g 3 ( x c ) h ( x gen ) x c = x copt ,
where g3(xc) denotes the constraints on the DC FLC. It can be seen that the optimization of the deadband parameters is a multi-objective optimization with the first objective being the best frequency control of the VSC-HVDC FLC [14] and the objective function being the minimum standard deviation of the AC grid frequency under continuous small power disturbances:
min F 2 ( f db + , f db ) = 1 n 1 i = 1 n ( f s f N ) 2 ,
where n is the sampling frequency, fs is the measured frequency of the AC system, and fN is the rated frequency of the AC system. This objective can reflect the improvement effect of DC FLC on AC grid frequency under continuous small power disturbance. The second objective is the best action characteristics of DC FLC with the number of actions, and the objective function is set to minimize the total duration of DC FLC action:
min F 3 ( f db + , f db ) = i = 1 n α i t α i = { 0             Δ P FLC , i = 0 1             Δ P FLC , i 0 ,
where t is the sampling time interval and ∆PFLC,i is the DC FLC power control at the i-th sampling. Among the above three optimization objectives, Equation (9) directly reflects the degree of influence of DC FLC on the grid frequency stability. Equation (10) reflects the total duration of the DC FLC action.
In the actual power system, the input order of each FM resource to participate in the primary frequency regulation follows the principle that thermal power and hydropower are the main ones, and DC FLC is the auxiliary one. Therefore, the dead zone of DC FLC should be larger than that of the governor of a steam turbine and a hydraulic turbine. In general, the dead zone of the turbine governor is ±0.033 Hz, while that of the hydraulic turbine governor is ±0.05 Hz. Therefore, it is necessary to ensure that the absolute value of the dead zone of the VSC-HVDC FLC is greater than 0.05 Hz during the optimization process. In addition, if the VSC-HVDC FLC dead zone is set too large, the VSC-HVDC FLC may not be able to participate in grid frequency regulation in time. For this reason, the maximum value of the upper dead zone and the minimum value of the lower dead zone of the DC FLC are set to 0.5 Hz and −0.5 Hz, respectively:
{ 0.05 < f db + < 0.5 0.5 < f db < 0.05 ,
The optimization results of the initial layer remain unaltered when the DC FLC dead zone parameters are optimized in the subsequent layer.

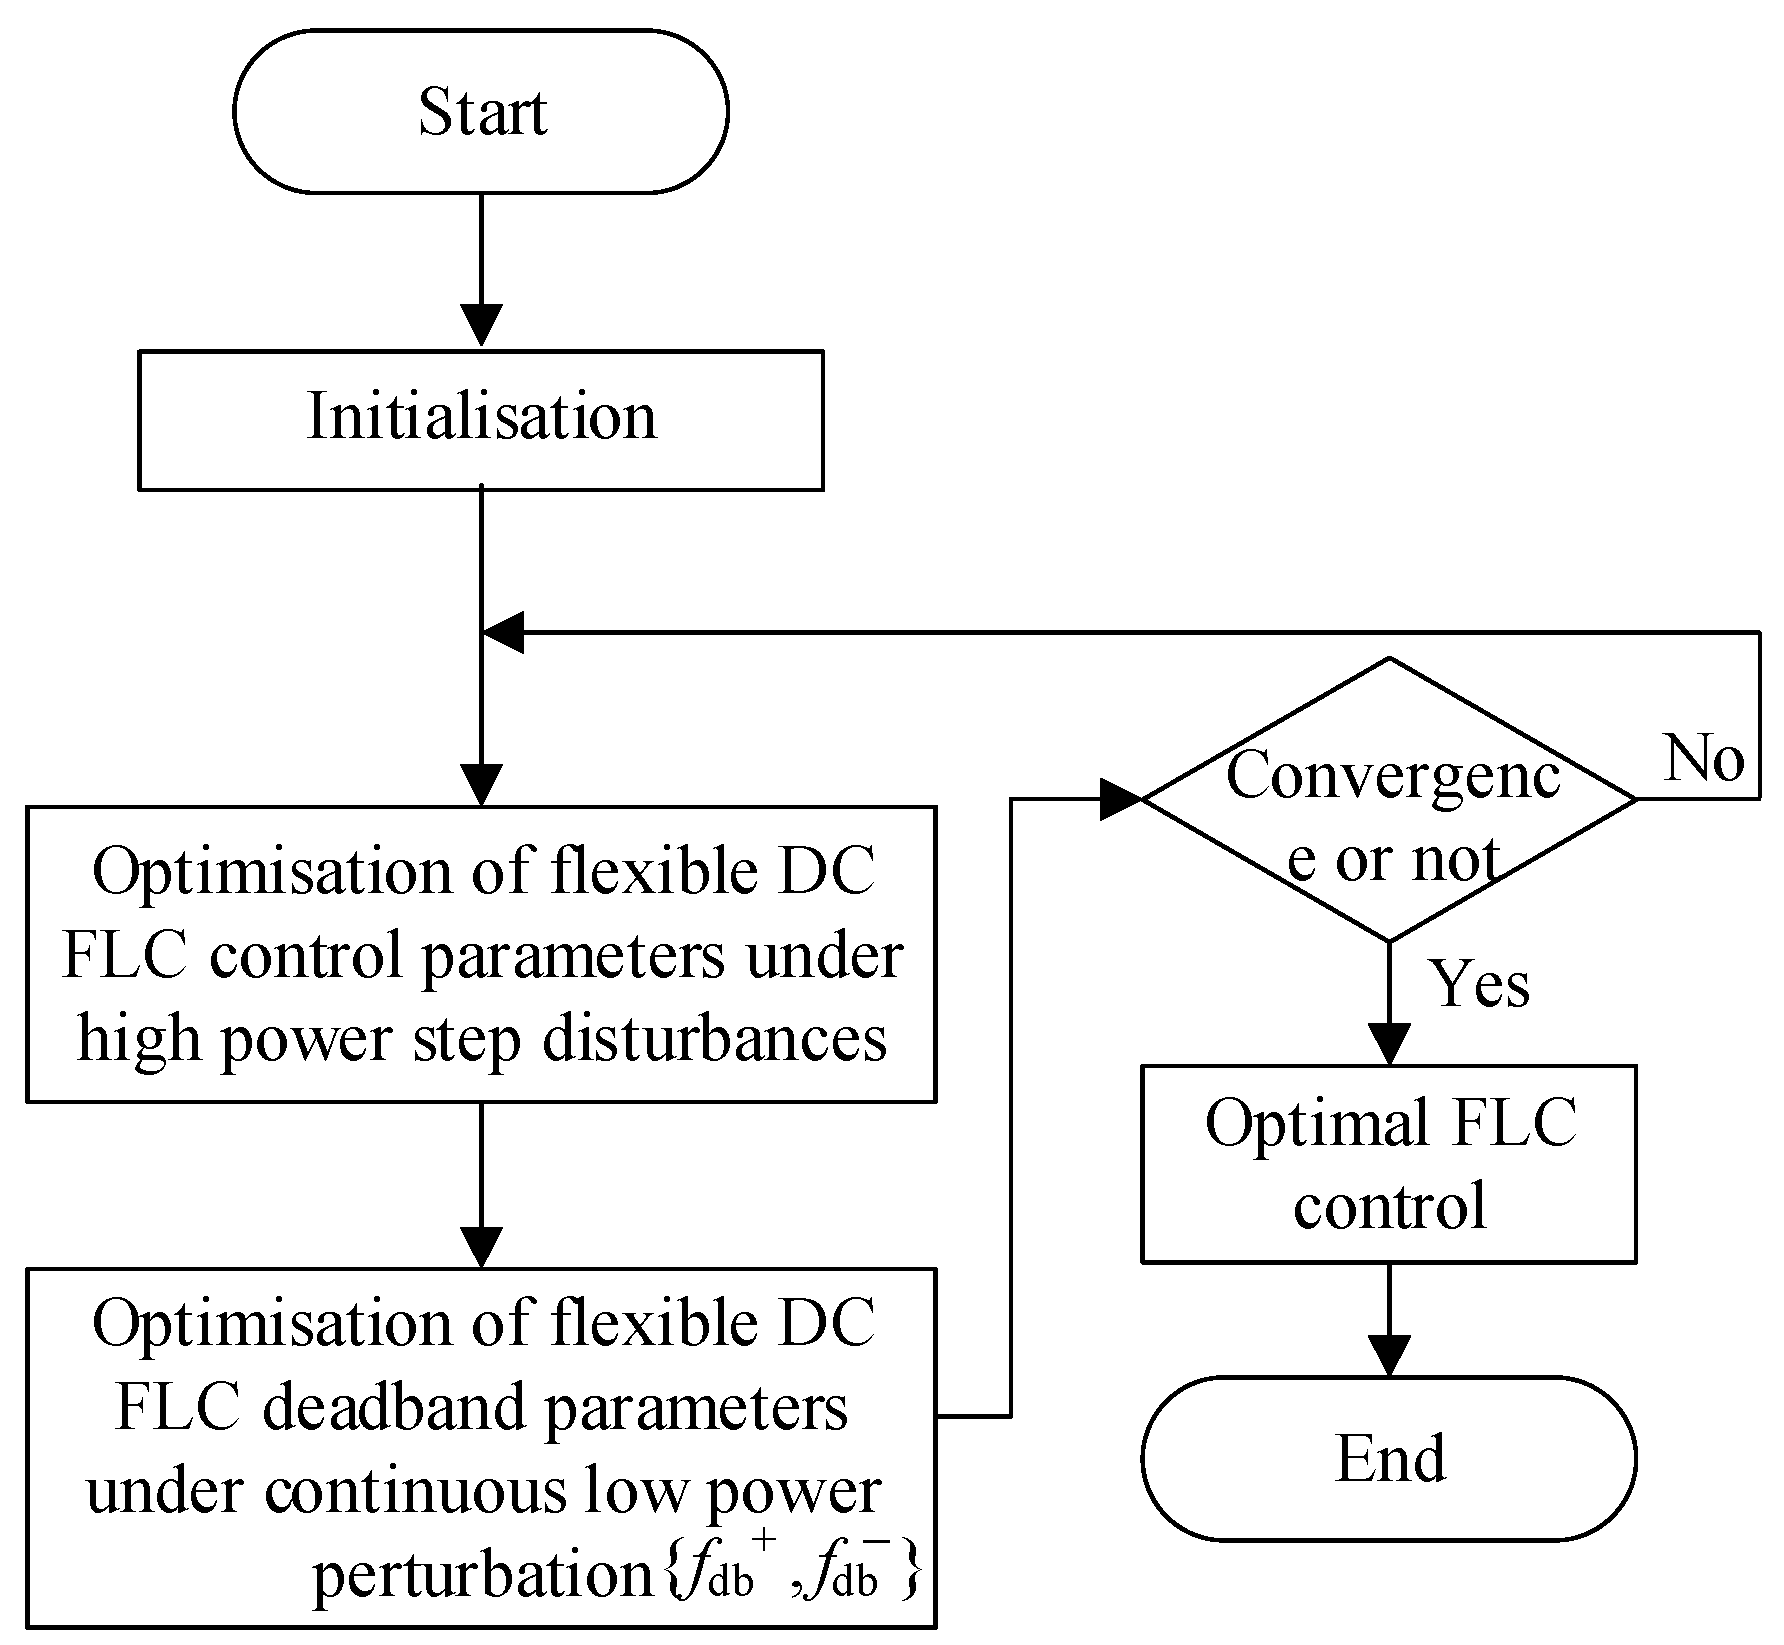
4.3. The Solution Methods of the Optimization Model

(1)
Layer 1 model solving
The optimization of the DC FLC control link parameter is a single-objective optimization problem. This paper is based on the results of time-domain simulation and analysis. The improved particle swarm algorithm is used to solve the first layer model. The flowchart is shown in Figure 7 below.
(2)
Layer 2 model solving
The optimization of the dead zone parameter is a multi-objective optimization problem. The enhanced MOEA/D algorithm can be employed to resolve the Pareto front of the second layer of the dead zone parameter optimization model. Subsequently, the entropy weight closeness ranking method, which incorporates subjective weight correction, can be utilized to identify the optimal compromise solution. The flowchart is shown in Figure 8 below.

5. Case Studies

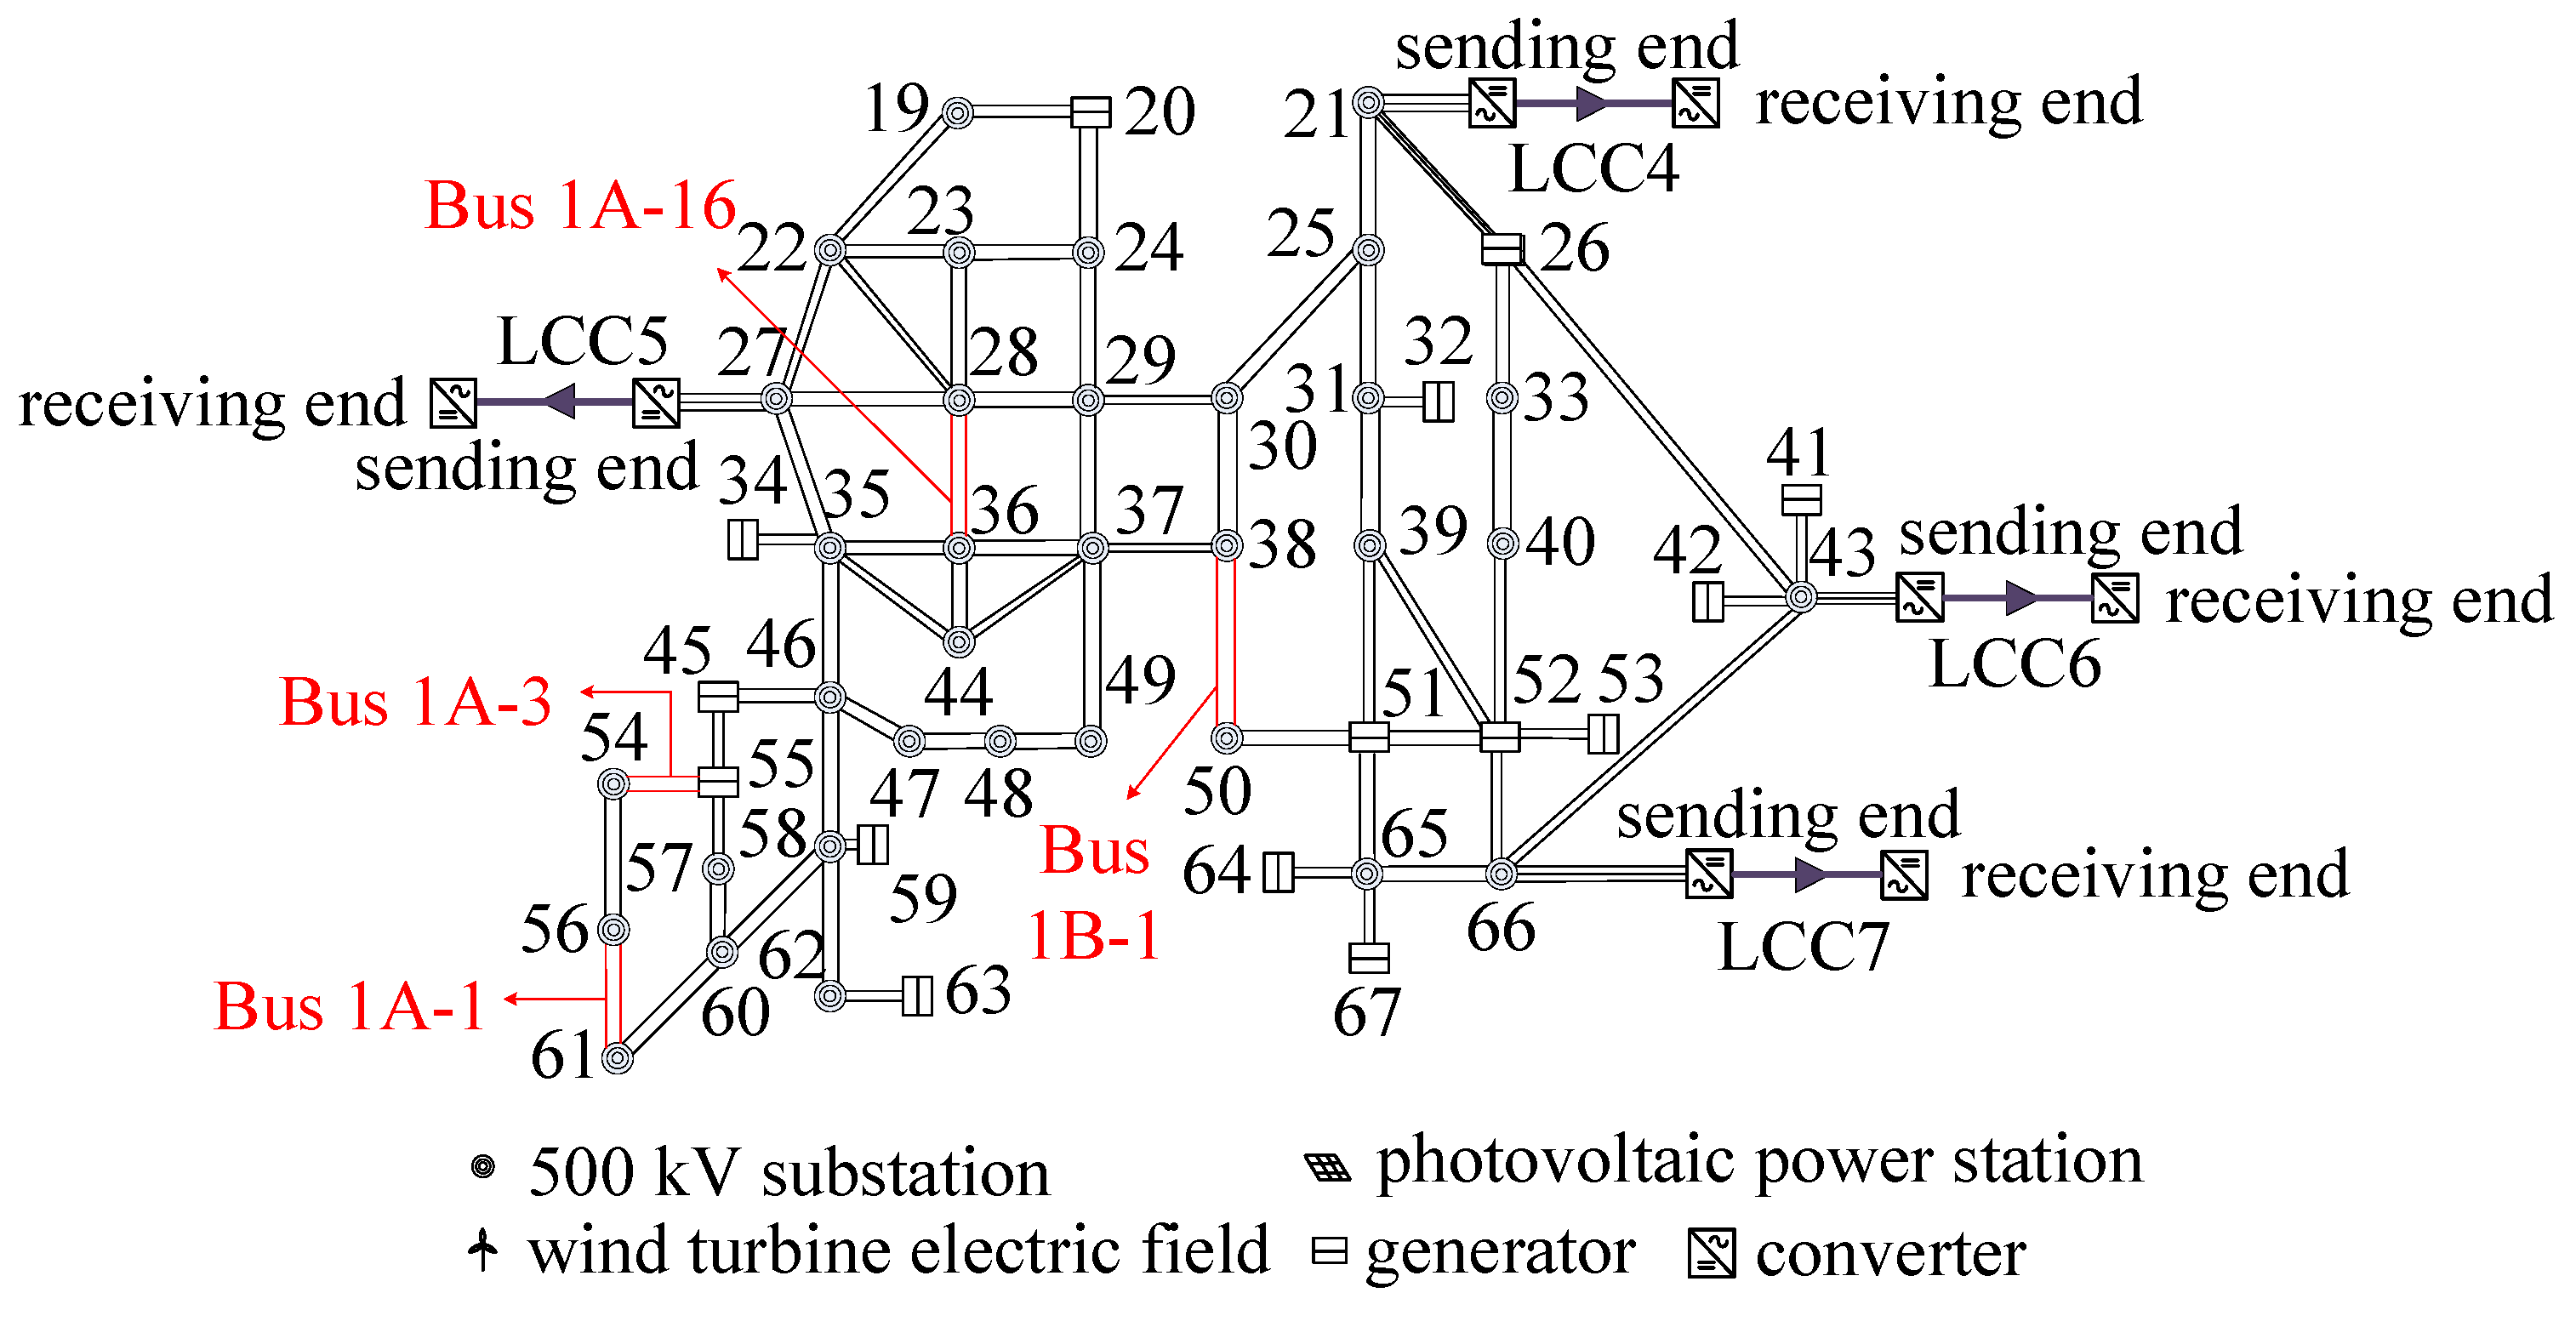
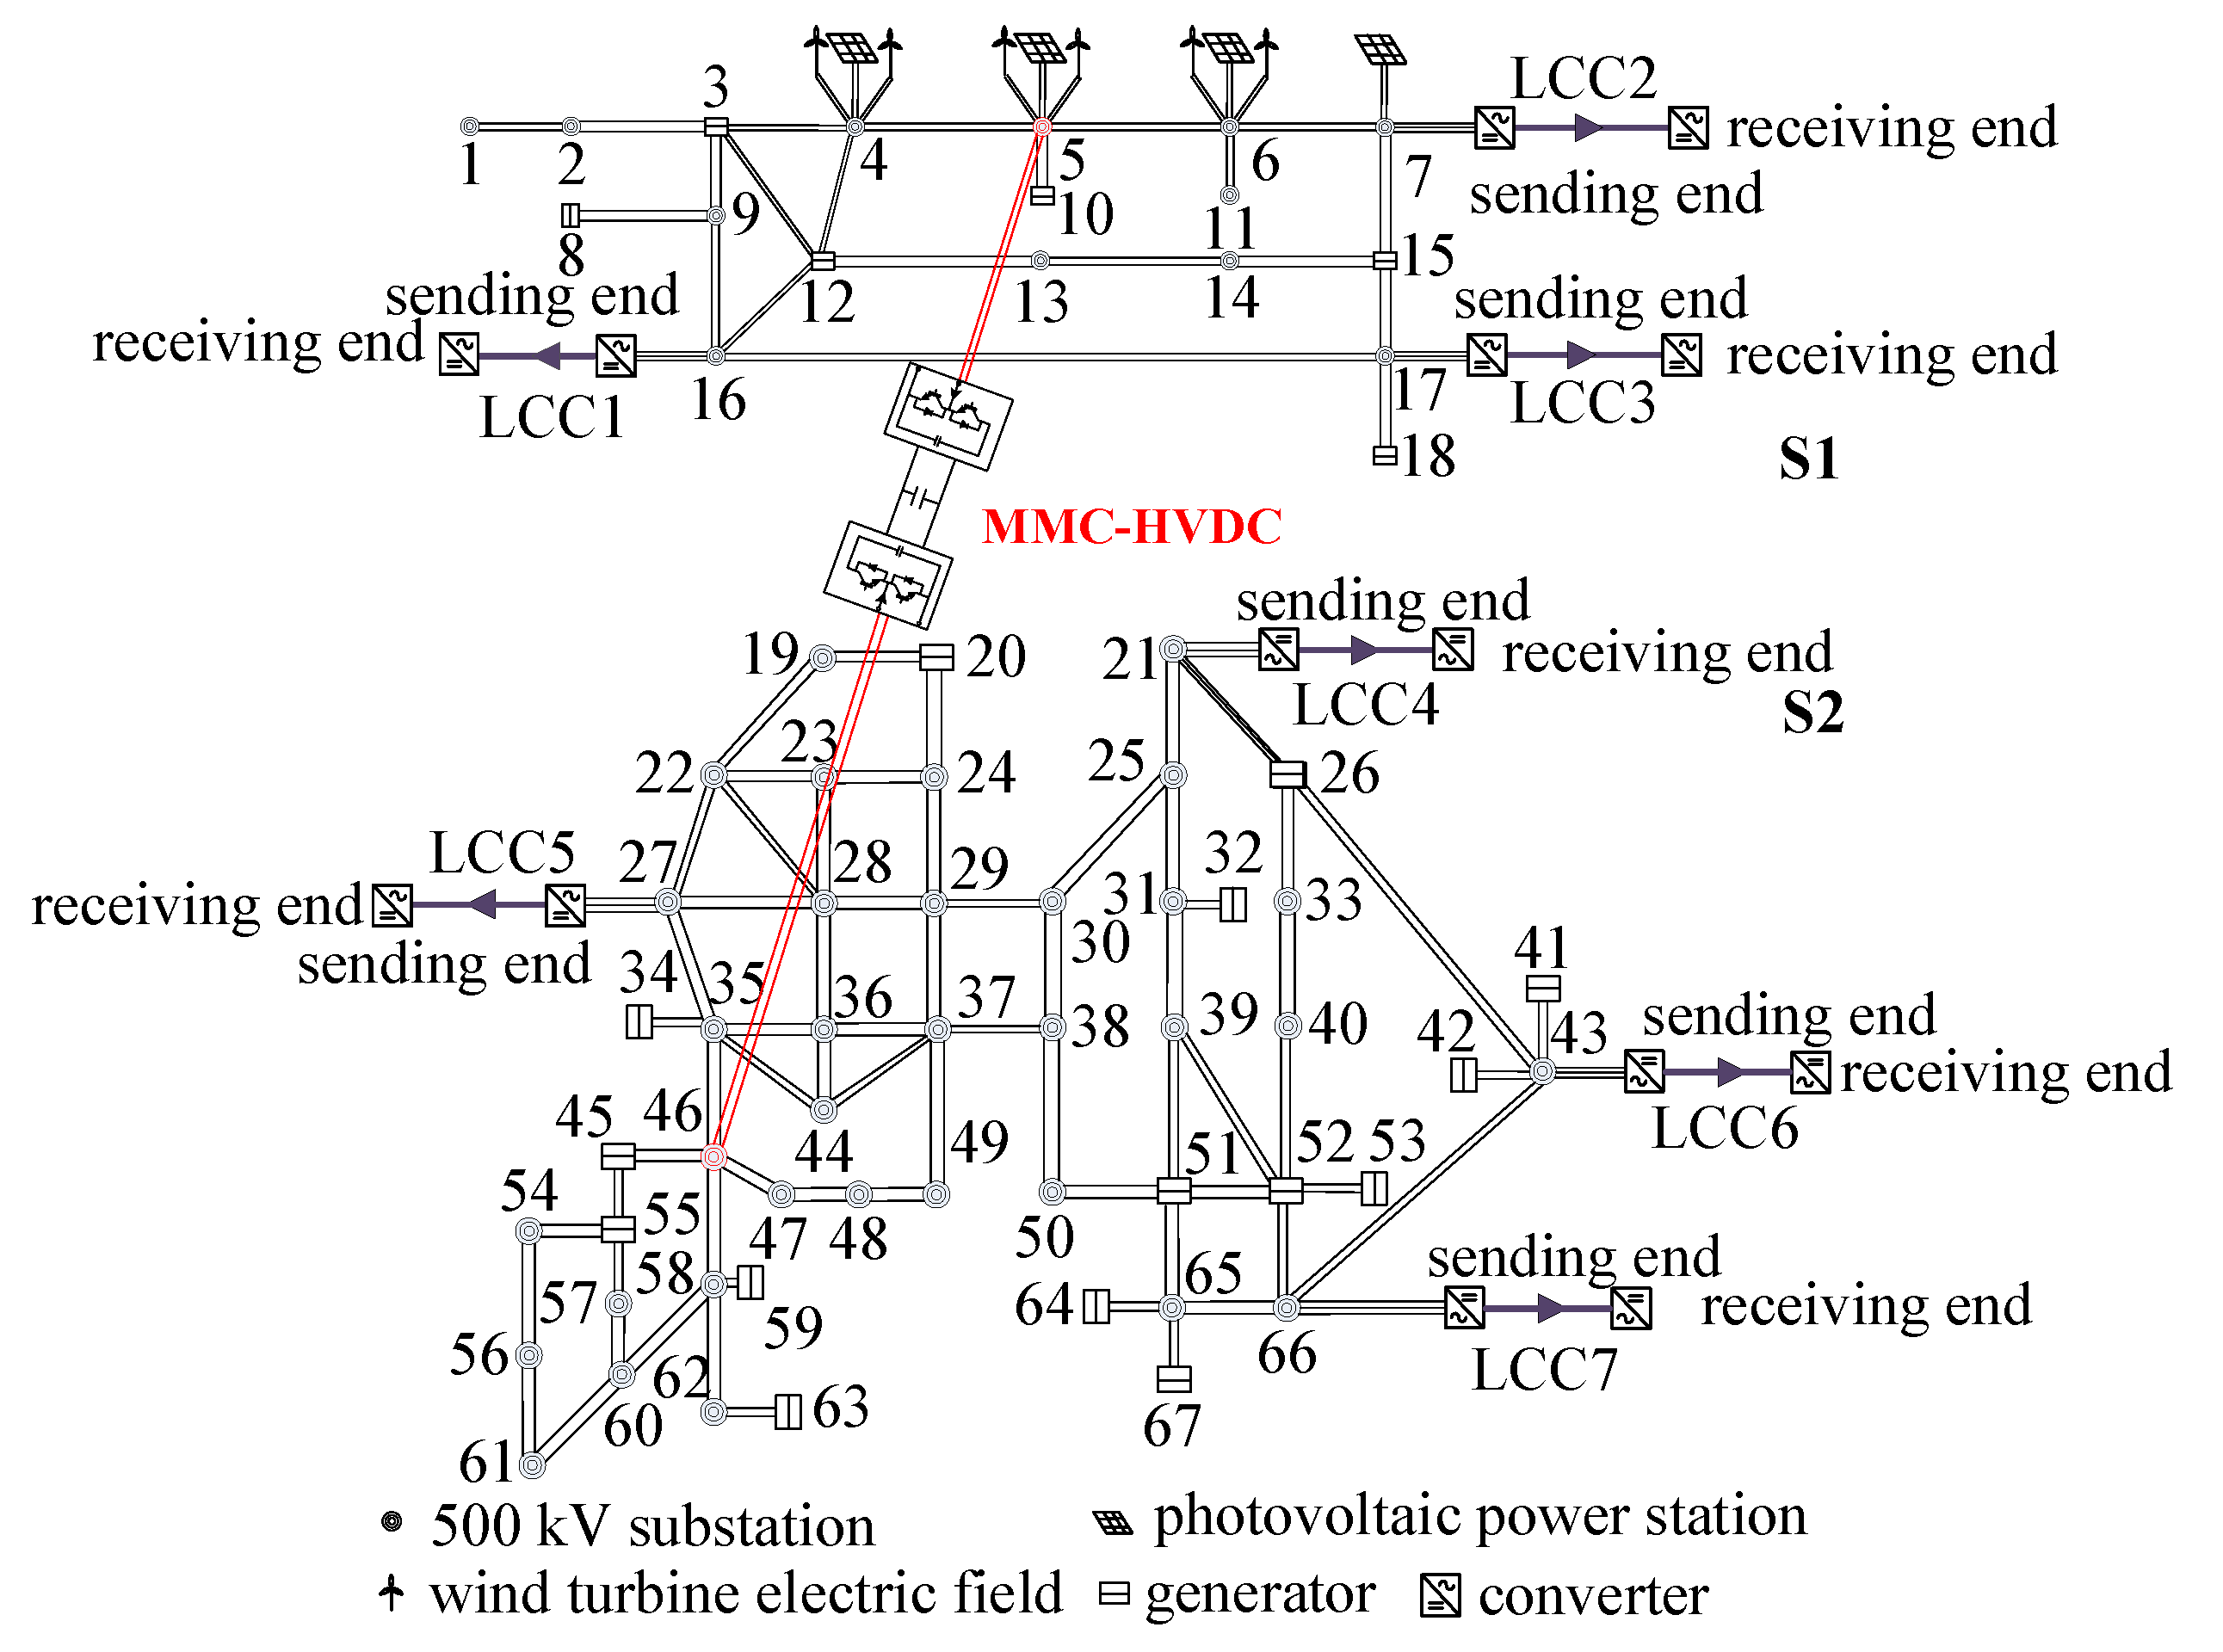
5.1. Introduction to the Test System

In order to validate the proposed frequency stabilization control method, electromagnetic transient simulation examples of large-scale regional power grids with low-frequency problems and ultra-low-frequency oscillation problems, designated as system S1 and system S2, respectively, are constructed on the electromagnetic transient simulation software CloudPSS.
(1)
Introduction to System S1
The topology of system S1 is depicted in Figure 9, and the transmission grid profile is presented in Appendix A, Table A1, while the line and transformer profile is shown in Table A2, which contains 105 nodes. The installed capacity ratio is 2400 MW of new energy to 5400 MW of conventional energy, which is equivalent to a ratio of 1:2.25. The new energy output is 900 MW, while the conventional unit output is 4100 MW. Of this, the conventional unit contains 3800 MW of thermal power and 300 MW of hydropower.
(2)
Introduction to System S2
The topology of System S2 is depicted in Figure 10. The transmission grid frame profile is presented in Appendix A, Table A3, and the line and transformer profile is shown in Table A4, which contains 195 nodes. The installed capacity of new energy in the system is 4800 MW, while the installed capacity of conventional units is 8400 MW. The output of new energy is 1200 MW, comprising 600 MW of wind power and 600 MW of photovoltaic. The output of conventional units is 7180 MW, with a load of 6660 MW. The installed capacity ratio for new energy (4800 MW) and conventional energy (8400 MW) is 1:1.75. A total of 1200 megawatts (MW) of new energy has been installed, while 7180 MW of conventional units have been constructed, of which 600 MW of thermal power and 6580 MW of hydropower are included in the conventional units.

5.2. Analysis of the Low-Frequency Problem of System S1

At t = 40 s, in system S1, the generator located at bus 18 experiences a dropout incident, resulting in a power deficit of 350 MW. The system frequency response is illustrated in Figure 11. The active power curves of the bus voltages at the LCC2 sender–receiver ends and the active power delivered by generator 3 are presented in Figure A1 and Figure A2 of Appendix B. Following the occurrence of the dropout fault, the system frequency declined rapidly to 48.77 Hz, which exceeded the system’s permissible range due to insufficient FM resources. The frequency response curves for a power deficit of 600 MW are presented in Figure A3 of Appendix B.

5.3. Analysis of Ultra-Low-Frequency Oscillations in System S2

At t = 40 s, a three-phase ground fault occurs at bus 28 of system S2, and the fault is removed at t = 40.06 s. The frequency at bus 61 before and after the fault is illustrated in Figure 12. As illustrated in Figure 12, the bus frequency exhibits oscillatory behavior following the fault occurrence, reaching peak frequencies of 49.91 Hz and 50.12 Hz at 51.2 s and 63.4 s, respectively. It can be demonstrated that the system experiences a perturbation, subsequently resulting in the onset of ultra-low-frequency oscillation. The bus voltages at the LCC5 sender and receiver, as well as the voltage curves at substations 50 and 54, are illustrated in Figure A4 and Figure A5 in Appendix B.

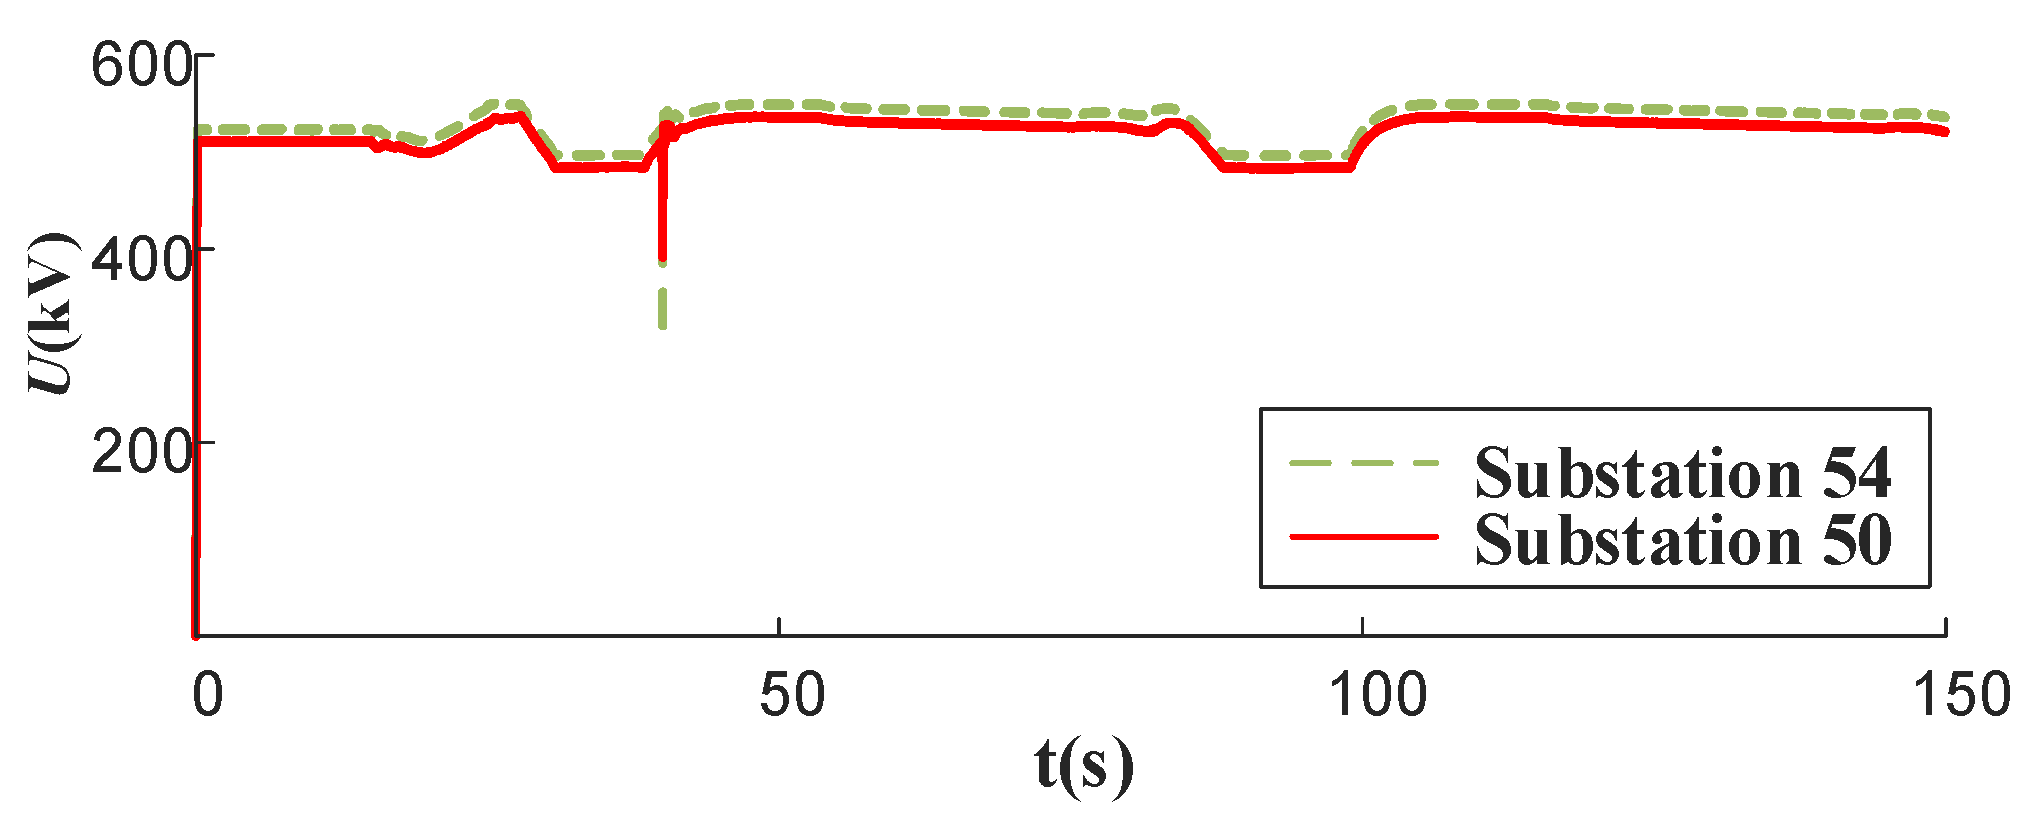
5.4. Analysis of Frequency Stabilization Problems in Flexible Interconnect Systems

Aiming at the frequency stabilization problems of system S1 and system S2, this paper adopts a VSC-HVDC system for the interconnection of systems S1 and S2, and uses the VSC-HVDC additional frequency controller based on droop frequency limit control designed in this paper to regulate the frequency of the system. The interconnection system topology is illustrated in Figure 13. The parameters of the MMC-HVDC are presented in Table A5 of Appendix A.
The initial layer model was solved using an improved particle swarm algorithm with an inertia weight of w = 0.9, a learning factor of 1, and a maximum number of iterations of 50. The second layer optimization model was solved using the MOEA/D algorithm with a population size of 50 and a number of iterations of 100. After several iterations of optimization, the optimized DC FLC controller parameters and dead zone parameters can be obtained. These are as follows: Kf1 = 365.8, Kf2 = 97.6, KV1 = 21.2, fdb1+ = 0.070, fdb1 = −0.066, fdb2+ = 0.063, fdb2 = −0.057.
Figure 14 and Figure 15 illustrate the power curves of the AC side of the flexible converter station for systems S1 and S2 in the steady-state condition. The blue curve represents the active power of systems S1 and S2, while the red curve represents the reactive power of systems S1 and S2. Figure 16 depicts the DC voltage of the MMC-HVDC, which is 500 kV in the steady state condition.

5.4.1. Suppression of Low-Frequency Problems in System S1

In order to address the low-frequency issue that arises in system S1 in Section 4.2, a droop FLC controller was incorporated into the controller of the VSC-HVDC, with the parameters of the FLC optimized in accordance with the relevant guidelines. At t = 40 s, the generator corresponding to bus 18 in system S1 is set to experience a dropout fault, and the frequency response of system S1 is illustrated in Figure 17. As illustrated in Figure 17, the frequency oscillation curve reaches its maximum values at 49.85 Hz and 50.07 Hz at 43.1 s and 47.2 s, respectively.
The results of the simulation in Section 5.2 and this Section demonstrate that when system S1 experiences a dropout fault, the frequency of system S1 declines to 48.77 Hz without any adjustment, resulting in a frequency stability issue. After considering the FLC and its parameter optimization of the VSC-HVDC system, it can be observed that the frequency stability of system S1 is improved by the VSC-HVDC power adjustment. This results in the frequency of system S1 falling to a maximum of 49.84 Hz. System S2 is capable of providing active power support for system S1. Upon adjustment of the system, the active power on the S1 side of the VSC-HVDC system, the active power on the S2 side, and the DC voltage are displayed in Figure 18, Figure 19 and Figure 20. In the event that the frequency of the AC grid on the S1 side falls below the dead zone threshold, the FLC of MMC1 is triggered, resulting in a reduction in the DC system’s transmission power in accordance with its droop characteristic. This action is intended to facilitate the adjustment of the frequency of system S1.
If the parameters of the FLC are not optimized, the VSC-HVDC drooping FLC can also provide frequency support and some relief to the low-frequency problem, but it is slightly less effective. The frequency response of system S1 is shown in Figure 21 when a set of parameters for the FLC droop control is given at random. As illustrated in Figure 21, the frequency oscillation curve reaches its peak frequency at 49.62 Hz and 50.23 Hz at 43.3 s and 47.4 s, respectively. It can be seen that the frequency stability of the system is worse than after optimization.

5.4.2. Ultra-Low-Frequency Oscillation Suppression for System S2

For the occurrence of the low-frequency problem of system S2 in Section 4.3, the ultra-low-frequency oscillation of system S2 is suppressed and no longer occurs by using the VSC-HVDC interconnection and the proposed droop FLC control and control parameter optimization method. The frequency response of system S2 is shown in Figure 22. It can be seen that the frequency of the system fluctuates within the permissible range and no longer oscillates, which avoids causing damage to the system.
For comparative analysis, the frequency response of the S2 system without FLC parameter optimization is analyzed. Given a random set of FLC droop control parameters, the frequency response of the system is shown in Figure 23. From Figure 23, it can be seen that if the parameters are not optimized, the ultra-low-frequency oscillation of the system can be suppressed to some extent, but the frequency response of the system is worse, and even the frequency may not meet the requirements of the system operation guidelines.
According to the simulation results in Section 5.4, it can be seen that the frequency stability of the system is improved after the two regional networks of S1 and S2 are flexibly interconnected.

6. Conclusions

In this paper, a VSC-HVDC additional droop frequency limit controller is designed for the frequency stability control requirement of the VSC-HVDC interconnected grid, and a multi-objective optimization method of the parameters of the flexible additional frequency controller is proposed. Through theoretical analysis and simulation experiments, the following main conclusions are obtained: (1) The DC additional frequency control using this flexible interconnected grid can effectively suppress ultra-low-frequency oscillations as well as low-frequency problems occurring in the regional grid. (2) The designed additional droop frequency limit controller can realize frequency stability control without considering communication between converter stations at the sender and receiver ends. (3) Optimizing the parameters of the controller with the proposed multi-objective optimization method will further enhance the frequency stability control of the flexible interconnected grid.

Author Contributions

Conceptualization, H.J. and S.G.; Data curation, Y.Z.; Formal analysis, H.J.; Funding acquisition, S.G.; Investigation, H.J.; Methodology, Y.Z.; Project administration, S.G.; Resources, Y.G.; Software, S.G.; Supervision, Y.Z.; Validation, H.J. and Y.Z.; Visualization, S.G. and Y.G.; Writing—original draft, Y.Z.; Writing—review and editing, S.G. All authors have read and agreed to the published version of the manuscript.

Funding

This work was partially supported by the National Natural Science Foundation of China (52307127, 62101362), the Project of State Key Laboratory of Power System Operation and Control (SKLD23KZ07), and the Fundamental Research Funds for the Central Universities (YJ202316).

Data Availability Statement

The original contributions presented in the study are included in the article, further inquiries can be directed to the corresponding author.

Conflicts of Interest

The authors declare no conflicts of interest.

Appendix A

Table A1. Overview of System S1 transmission network.
Voltage Level/kVNumber of NodesType of Node
50013alternating current (AC) transmission network
22017Medium/high voltage side of transformer
2106DC rectifier side
1996DC inverter side
Table A2. Overview of System S1 transmission lines and transformers.
Type of LineNumberVoltage Level/kVNote
AC line23 500 kV11 AC power transmission grids
220 kV12 renewable energy transmission lines
Two-winding transformers33 20/525 kV9 conventional unit step-up transformers
0.4/38.5 kV12 renewable energy box-type transformers
0.69/38.5 kV
38.5/230 kV12 step-up transformers for renewable energy stations
Three-winding transformers12 525/230/37 kV
DC line3 rated voltage /kV±500
rated power /MW5000
Table A3. Overview of System S2 transmission network.
Voltage Level/kVNumber of NodesType of Node
50034alternating current (AC) transmission network
22035Medium/high voltage side of transformer
2108DC rectifier side
1998DC inverter side
Table A4. Overview of System S2 transmission lines and transformers.
Type of LineNumberVoltage Level/kVNote
AC line53500 kV29 AC power transmission grids
220 kV24 renewable energy transmission lines
Two-winding transformers6220/525 kV14 conventional unit step-up transformers
0.4/38.5 kV24 renewable energy box-type transformers
0.69/38.5 kV
38.5/230 kV24 step-up transformers for renewable energy stations
Three-winding transformers24525/230/37 kV
DC line4rated voltage /kV±500
rated power /MW5000
Table A5. System Parameters of MMC-HVDC.
Parameter NameParameter Values on the Rectifier SideParameter Values on the Inverter Side
Rated capacity3000 MVA3000 MVA
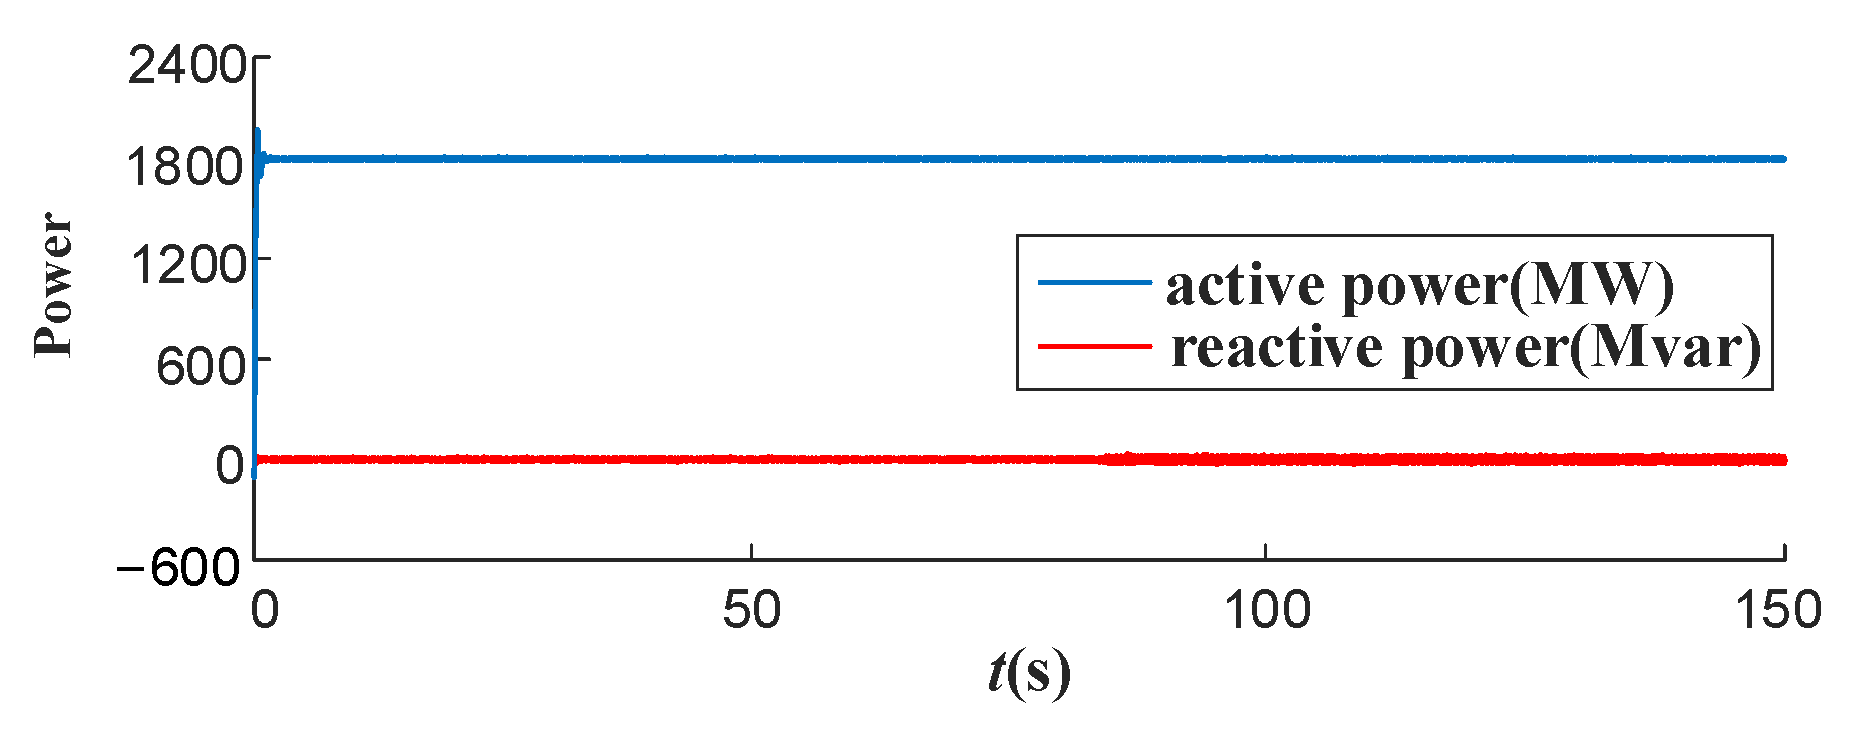
d-axis outer ring controller reference value P 1 * = 1800 MW U dc 2 * = ±500 kV
q-axis outer ring controller referenceQ = 0 MVarQ = 0 MVar
Inductors on bridge arms0.05 mH0.05 mH
Number of bridge arm submodules142142
Capacitance of bridge arm submodules0.015 F0.015 F
AC voltage at the PCC bus at both ends230 kV230 kV
Rated frequency of the AC grid at both ends50 Hz50 Hz
Rated voltage of the transformer230 kV/370 kV230 kV/370 kV
Standardized value of transformer leakage reactance0.4%0.4%
Initial voltage of the sub-module capacitor7.042 kV7.042 kV

Appendix B

Figure A1. Voltage Curves of LCC2 sending and receiving ends.
Energies 17 03851 g0a1
Figure A2. Active power curve for generator 3.
Energies 17 03851 g0a2
Figure A3. Frequency response of system S1 for a power deficit of 600 MW.
Energies 17 03851 g0a3
Figure A4. Voltage Curves of LCC5 sending and receiving ends.
Energies 17 03851 g0a4
Figure A5. Voltage curves for substations 5 and 6.
Energies 17 03851 g0a5

References

  1. Xu, Y.; Mili, L.; Sandu, A.; von Spakovsky, M.R.; Zhao, J. Propagating uncertainty in power system dynamic simulations using polynomial chaos. IEEE Trans. Power Syst. 2018, 34, 338–348. [Google Scholar] [CrossRef]
  2. Liu, Z.; Zhou, Y.; Li, J.; Meng, J.; Yu, X. The study on interconnection of northwest and southwest power grid in China. J. Glob. Energy Interconnect. 2023, 6, 341–352. [Google Scholar]
  3. Zhang, C.; Liu, L.; Cheng, H.; Liu, D.; Zhang, J.; Li, G. Frequency-constrained co-planning of generation and energy storage with high-penetration renewable energy. J. Mod. Power Syst. Clean Energy 2021, 9, 760–775. [Google Scholar]
  4. Liu, B.; Xiao, H.; Cai, Z.; Yang, Y. Study on frequency characteristics of receiving power system with large-scale offshore wind power generation. Energy Rep. 2023, 9, 596–607. [Google Scholar] [CrossRef]
  5. Li, Z.; Xue, Y.; Chen, N.; Lin, S. A coordinated frequency control of LCC-HVDC for quasi-synchronous operation of asynchronously interconnected power systems. In Proceedings of the 2023 Annual Meeting of CSEE Study Committee of HVDC and Power Electronics (HVDC 2023), Nanjing, China, 22–25 October 2023; pp. 162–168. [Google Scholar]
  6. Huang, J.; Chen, Y.; Gao, Q.; Zhang, Y.; Yang, R.; Yang, R.; Diao, H. Research on HVDC frequency limit control to improve frequency restoration in muti-HVDC asynchronous system. In Proceedings of the 8th Renewable Power Generation Conference (RPG 2019), Shanghai, China, 24–25 October 2019; pp. 1–6. [Google Scholar]
  7. Liu, C.; Liu, H.; Jiang, S.; Zheng, L. Dynamic Frequency Support and DC Voltage Regulation Approach for VSC-MTDC Systems. CSEE J. Power Energy Syst. 2023, 9, 645–658. [Google Scholar]
  8. Zhu, L.; He, Z.; Wu, X.; Yang, J.; Liu, D.; Kou, L. Influence of additional control strategy of back-to-back VSC-HVDC on system stability. Power Syst. Technol. 2018, 42, 2519–2527. [Google Scholar]
  9. Yuan, Z.C.; Wu, Z.L.; Jin, Q.; Jiang, S.G.; Huang, Y. Frequency stabilization control strategy with DC voltage secondary regulation of VSC-MTDC based interconnected systems. Autom. Electr. Power Syst. 2018, 42, 9–13+19. [Google Scholar]
  10. Chen, L.; Lu, X.M.; Chen, Y.P.; Min, Y.; Zhang, Y.; Tang, Z.Y. Analysis of ultra-low-frequency oscillations in multi-machine system and equivalent method. Autom. Electr. Power Syst. 2017, 41, 10–15. [Google Scholar]
  11. Chen, Y.; Xiao, L.; Gao, Q.; Zeng, K.; She, S.; Yang, R. Analysis of Frequency Oscillation Caused by AGC in Hydro-Dominant Power Grids using Piecewise Linearization Method. In Proceedings of the 2020 IEEE Power & Energy Society General Meeting (PESGM), Montreal, QC, Canada, 2–6 August 2020. [Google Scholar]
  12. Xing, C.; Liu, M.; Peng, J.; Wang, Y.; Zhou, Y.; Zheng, Z.; Gao, S.; Liao, J. FLC-Based Ultra-Low-Frequency Oscillation Suppression Scheme for Interconnected Power Grids. Energies 2024, 17, 1300. [Google Scholar] [CrossRef]
  13. You, G.; Guo, X.; Zhu, X.; Li, L.; Xiao, L.; Xu, Z.; Lu, S. Parameters tuning and coordination control of the frequency limit controller. J. Eng. 2019, 2019, 2102–2105. [Google Scholar] [CrossRef]
  14. Shi, H.; Chen, G.; Zhu, J.; Wang, Y.; Tai, K. FLC Dead band Optimization for HVDC System Stability Enhancement. In Proceedings of the 2020 IEEE Sustainable Power and Energy Conference (iSPEC), Chengdu, China, 23–25 November 2020; pp. 692–698. [Google Scholar]
  15. Li, J.; Xia, Y.; Yao, W.; Han, Q.; Wen, J. Additional frequency coordinated control for Chongqing-Hubei back to back VSC-HVDC and Longquan-Zhengping LCC-HVDC. South. Power Syst. Technol. 2023, 17, 134–144+152. [Google Scholar]
  16. Chen, Q.C.; Li, H.; Wu, W.C.; Zhang, Y.; Wang, F.; Zhang, W.Y. Optimization design of frequency limit controller of back-to-back VSC-HVDC. Power Syst. Technol. 2020, 44, 385–392. [Google Scholar]
  17. Yang, M.; Xiang, Q.; Wang, L.; Jiang, H.; Mo, Y.; Lin, K.; Liu, S. Application Analysis of FLC Function in Lu-xi VSC-HVDC System. Guangxi Electr. Power 2018, 41, 61–65. [Google Scholar]
  18. Liu, Y.; Shen, C.; Wang, Z.; Liu, F. Incentive mechanism design for emergency frequency control in multi-infeed hybrid AC-DC system. IEEE Trans. Power Syst. 2023, 39, 1867–1880. [Google Scholar] [CrossRef]
  19. Tang, H.; Wang, Y.; Wei, L.; Li, X. An additional frequency robust controller for HVDC transmission system under islanding operation. Power Syst. Technol. 2016, 40, 1066–1072. [Google Scholar]
  20. Liu, Q.; Yang, L.; Xin, Q.; Wang, Z.; Deng, J.; Wang, S.; Fu, C. Mechanism Analysis and Suppression Strategy of Ultra-low Frequency Oscillation in DC Asynchronous Networking. In Proceedings of the 16th Annual Conference of China Electrotechnical Society, Beijing, China, 24–26 September 2021; Lecture Notes in Electrical Engineering. Springer: Singapore, 2022; Volume 889. [Google Scholar]
Figure 1. Double-ended VSC-HVDC System Structure.
Energies 17 03851 g001
Figure 2. FLC Control Block Diagram.
Energies 17 03851 g002
Figure 3. Slope characteristics of droop FLC of MMC-HVDC.
Energies 17 03851 g003
Figure 4. Slope characteristics of the FLC controller with the limiter.
Energies 17 03851 g004
Figure 5. Slope characteristics of the FLC controller after active and voltage limiting.
Energies 17 03851 g005
Figure 6. Double-layer optimization framework for FLC of VSC-HVDC.
Energies 17 03851 g006
Figure 7. Flowchart for solving the multi-objective optimization model of the initial layer of DC FLC.
Energies 17 03851 g007
Figure 8. Flowchart for solving the multi-objective optimization model of the second layer of DC FLC.
Energies 17 03851 g008
Figure 9. The topology of system S1.
Energies 17 03851 g009
Figure 10. The topology of system S2.
Energies 17 03851 g010
Figure 11. Frequency response of system S1.
Energies 17 03851 g011
Figure 12. Frequency variation at bus 61.
Energies 17 03851 g012
Figure 13. Topology of the interconnected system.
Energies 17 03851 g013
Figure 14. The power curve of system S1.
Energies 17 03851 g014
Figure 15. The power curve of system S2.
Energies 17 03851 g015
Figure 16. Voltage profile of the system in steady state case.
Energies 17 03851 g016
Figure 17. The frequency response curve of system S1 after parameter optimization.
Energies 17 03851 g017
Figure 18. The active power curve of system S1.
Energies 17 03851 g018
Figure 19. The active power curve of system S2.
Energies 17 03851 g019
Figure 20. DC voltage profile of the system for low frequency problems.
Energies 17 03851 g020
Figure 21. The frequency response curve of system S1 before parameter optimization.
Energies 17 03851 g021
Figure 22. The frequency response curve of system S2 after parameter optimization.
Energies 17 03851 g022
Figure 23. The frequency response curve of system S1 without parameter optimization.
Energies 17 03851 g023
Disclaimer/Publisher’s Note: The statements, opinions and data contained in all publications are solely those of the individual author(s) and contributor(s) and not of MDPI and/or the editor(s). MDPI and/or the editor(s) disclaim responsibility for any injury to people or property resulting from any ideas, methods, instructions or products referred to in the content.

