Article

Hydroprocessing Microbial Oils for Advanced Road Transportation, Aviation, and Maritime Drop-In Fuels: Industrially Relevant Scale Validation

by
Athanasios Dimitriadis
,
Loukia P. Chrysikou
,
Ioanna Kosma
,
Nikos Tourlakidis
and
Stella Bezergianni
*
Chemical Process & Energy Resources Institute—CPERI, Centre for Research and Technology Hellas—CERTH, 6km Harilaou-Thermi, P.O. Box 57001 Thessaloniki, Greece
*
Author to whom correspondence should be addressed.
Energies 2024, 17(15), 3854; https://doi.org/10.3390/en17153854
Submission received: 2 July 2024 / Revised: 22 July 2024 / Accepted: 25 July 2024 / Published: 5 August 2024
(This article belongs to the Special Issue Renewable Fuels for Internal Combustion Engines: 2nd Edition)

Abstract

:
Triacylglycerides (TAGs) produced via the syngas fermentation of biogenic residues and wastes were evaluated as a potential feedstock for advanced road transportation, aviation, and maritime drop-in fuels via hydroprocessing technology. Due to the limited availability of TAGs, a simulated feedstock (SM TAGs) was utilized by blending various commercial oils, simulating the fatty acid composition of TAGs. At first, the simulated feedstock and the real TAGs were hydrotreated on a TRL 4 (technology readiness level) pilot plant to evaluate the potential of the SM feedstock to simulate the TAGs based on product quality. The hydrotreatment technology was evaluated and optimized on a TRL 4 plant. The research was further extended to a TRL 5 hydrotreatment plant with the optimum operating window for scaling up the technology. The resulting product was fractionated on a batch fractionation unit under vacuum to separate the jet and diesel fractions. The produced fuels were analyzed and evaluated based on the aviation Jet A1, EN590, EN15940, and marine diesel DMA specifications. The results show that the TAG composition was successfully simulated via a blend of vegetable oils. In addition, the hydrotreatment of the real TAGs and simulated feedstock resulted in similar-quality liquid products. The technology was successfully scaled up on a TRL 5 unit, leading to advanced, high-quality aviation and diesel drop-in fuels from TAGs, while the reaction pathways of hydrotreating can be controlled via the operating parameters of pressure, temperature, and H2/oil ratio. The hydrotreatment process’s optimum conditions were 13.8 MPa pressure, 643 K temperature, 1 h−1 liquid hourly space velocity (LHSV), and 5000 scfb hydrogen-to-oil ratio. Finally, a storage stability study of the hydrotreated liquid product showed that it can be stored for more than 6 months at ambient conditions without any noticeable changes to its properties.

1. Introduction

Triglycerides are characterized as suitable raw materials for high-quality fuel production. However, depending on the choice of the triacylglyceride source, the implementation of biofuel technology can have different economic and social outcomes [1]. First-generation biofuels were produced from fresh vegetable oils such as soybean, peanut, sunflower, palm, coconut oil, etc. However, the production cost of these types of lipids is high, and their availability is unstable due to the market competition. Furthermore, the increase in fresh-oil demands for biofuel production has led to an increase in food prices, leading to the well-known debate “Food versus Fuel” [2]. To that aim, the use of nonedible oils was promoted to face the drawbacks of fresh, edible oils. Nonedible oils are rapeseed, jatropha, and jojoba, while residual lipids (waste cooking oils), as well as animal fats from slaughterhouses, are also feedstocks for biofuels production. Thus, the exploration of alternative feedstocks and processing technologies is gaining interest in rendering biofuels or hybrid fuel production [3]. However, the aforementioned feedstocks are characterized by quantity limitations. As a result, recently, microalgae were found to constitute a promising feedstock for biofuels production [4,5], particularly in combination with genetic modification strategies that aim to enhance lipid productivity [6]. Another promising lipid-based feedstock is from microbial oils. Microbial oils can be produced via the fermentation of carbohydrate and protein fractions, which are rich in oil/fats, starch, and proteins, after the enzymatic hydrolysis of food wastes from restaurants. Microbial systems are more controllable, economical, and scalable for biorefining to renewable, advanced fuels and chemicals [7,8]. Microbial lipids are rich in storage lipids (mainly triacylglycerols, TAGs), making them an excellent feedstock for biofuel production. Due to the wide availability of this feedstock, local or centralized biorefineries could be developed in all countries for biofuel production. It is easily observed that the choice of feedstock affects the economic and social outcome. Thus, the minimization of the economic and social cost is the main factor that affects progress in biofuel technology. Therefore, the development of new technological pathways utilizing such feedstocks is being explored.
A very promising technology for the production of biofuels is catalytic hydroprocessing [9]. In particular, the catalytic hydroprocessing of lipids is focused on producing a high-quality biofuel that is compatible with the existing fossil fuel infrastructure. Hydroprocessing is a widespread technology commonly employed for the upgrading of fossil-based streams in a typical petroleum refinery. The current technology consists of two steps: one catalytic hydrotreatment step that produces normal paraffins, and one catalytic isomerization step that leads to a mixture of n- and iso-paraffins. The produced biofuels are also referred to as “renewable or advanced fuels” instead of “biodiesel”, which is a term usually reserved for FAME (fatty acid methyl ester). Catalytic hydroprocessing has already been applied for the production of HVOs (hydrotreated vegetable oil) fuels from vegetable oils, animal fats, and waste cooking oils [10]. However, the technology has to be focused on the nonfood sources of triglycerides that are produced sustainably. The optimization of lipid-producing species via blending or genetic modification can improve fuel performance [11]. An alternative feedstock is a microbial oil, containing biogenic residues and wastes, that is rich in lipids, mainly in triacylglycerols (TAGs), rendering it an excellent-quality feedstock for biofuel production without competing with edible oils and food production; however, today, there are limited studies in the literature that have investigated the catalytic hydroprocessing of microbial oils to renewable, advanced fuels, especially for the aviation and marine sectors. More specifically, there are two current studies in the literature to the best of the authors’ knowledge. Carmona-Cabello et al. [8] studied biodiesel production using microbial lipids derived from food waste discarded by catering services utilizing transesterification technology, which leads to first-generation FAME biodiesel, presenting many drawbacks compared to hydrogenated fuels. Furthermore, Liu et al. [12] investigated the catalytic hydrodeoxygenation of methyl stearate and microbial lipids to diesel-range alkanes over a Pd/HPA-SiO2 catalyst, while the experiments were performed on a small autoclave reactor of 15 mL capacity.
In this context, this research is focused on filling this gap in the literature by investigating the hydrotreatment of microbial oils in advanced aviation and marine biofuels, utilizing a TRL 5 hydroprocessing pilot plant, intending to scale up the process towards commercialization.
This study explores the hydrotreatment of a new type of microbial oil, derived from a two-step biological route and utilizing renewable hydrogen for catalytic reactions. The main challenge that the current manuscript is trying to address is the investigation of commercial catalysts and optimizing the hydrotreating process where the desired bioliquids (jet-like and diesel-like advanced fuels) will be produced. Towards this direction, the hydroprocessing technology was tested and optimized in the first phase, at a lab-scale TRL 4 hydrotreatment plant. In the second phase, the research was extended to a TRL 5 hydrotreatment plant targeting the production of larger volumes of hydrotreated products. In parallel, the storage stability of the hydrotreated products was evaluated via a 6-month study to identify the optimal storage conditions. In the last phase, the total organic liquid product was fractionated in a batch distillation unit, aimed at the separation of jet and diesel fuel fractions. The resulting renewable advanced drop-in fuels were evaluated and their properties were compared with the specifications of Jet A1 [13], DMA marine diesel [14], EN590 [15] for road transport diesel, and EN15940 for paraffinic HVO fuels [16]. As a result, this paper is trying to fill the gap in the literature of hydroprocessing microbial oils, targeting the production of advanced renewable drop-in fuels at a high TRL level.

2. Materials and Methods

2.1. Experimental Scope and Procedure

As was already mentioned, this study explores the hydrotreatment of a new type of microbial oil (TAGs), derived from a two-step biological route utilizing renewable hydrogen for the catalytic reactions. The hydroprocessing technology was tested and optimized in the first phase, at a lab-scale TRL 4 plant. However, due to the limited TAGs availability for the larger quantities of biofuel production in the TRL 5 hydrotreatment plant, a simulated feed microbial TAGs feed (SM TAGs) was developed, utilizing four commercial vegetable oils. Thus, the first target is to compare the SM TAGs with the real TAGs, and, secondly, to investigate the effect of the process operating parameters on product quality. The two reactors from the TRL 4 plant were operated in parallel mode. The same catalytic system was loaded in both reactors; however, in reactor A, the feedstock was the real TAGs from microbial oil, while the feedstock of reactor B was the SM TAGs. Similar operating conditions were applied in both reactors. To that aim, the efficiency of the SM TAGs to simulate the real TAGs was explored. In total, five conditions were investigated to optimize the technology for high jet and diesel fuel yields. The operating window is presented in Table 1. The effect of reaction temperature, LHSV (liquid hourly space velocity), and reaction pressure was investigated in terms of product quality. During the research, daily product samples were collected from each reactor for analysis. Each condition lasted three days on stream (DOS) to achieve good catalyst stabilization. The stabilization of the catalyst performance for each condition was evaluated by analyzing the sulfur content of the daily liquid products.
In the next phase, the research was extended by scaling up the process on a TRL 5 hydrotreatment plant, targeting the production of larger volumes of hydrotreated products utilizing the SM TAGs and the optimum operating window, as obtained from the TRL 4 plant experiments. In the last phase, the total organic liquid product from the TRL 5 unit was fractionated in a batch distillation unit aimed at the separation of jet and diesel fuel fractions. The resulting advanced fuels were evaluated and their properties were compared with the specifications of Jet A1, DMA marine diesel, EN590 for road transport diesel, and EN 15940 of paraffinic HVO fuels.

2.2. Feeds and Catalyst

For the current research, a microbial oil was explored as a potential feedstock for the production of advanced aviation and diesel fuels. The production of microbial oil was performed via several steps. The initial feedstock was biogenic residues; more specifically, they were waste straw and waste bark. In the first step, these biogenic residues were converted to syngas (CO, CO2, and H2) via a dual fluidized bed (DFB) gasifier (prior to this, the feedstock was prepared into pellets). The final result of this thermochemical process is a syngas stream. In the second step, the syngas was converted by a two-stage fermentation process to liquid products in the form of microbial oil consisting of triacylglycerides. For the first syngas fermentation step, the bacterial strain of Moorella thermoacetica was utilized for acetate production. For the second fermentation step, involving the production of TAGs via aerobic fermentation of acetate, the strain of Yarrowia lipolytica was utilized. After TAG production, a purification step, for the separation of TAGs from the oleaginous yeast, was necessary. The extraction of TAGs was performed via dewatering, mechanical/enzymatic treatment, concentration, and purification. The extracted TAGs constitute the feedstock of the current research. Moreover, oleaginous yeasts were genetically modified to convert the acetate derived from the first stage into C14 and C16–18 TAGs. The production of microbial oil is described in detail by Detsios et al. [17].
However, due to the limited microbial oil availability for the production of larger biofuel quantities at the TRL 5 hydrotreatment plant, an SM feed was developed to simulate the microbial oil. It is well known that vegetable oils consist of TAGs with different chain lengths depending on the source of the oil. A wide range of vegetable oils was reviewed to simulate the fatty acid composition of microbial oil. Four commercial vegetable oils were selected: palm oil, flaxseed oil, olive oil, and pumpkin oil. These oils were selected due to their appropriate chain lengths and their widespread availability in the Greek market, where this research was conducted. The fatty acid composition of the microbial oil and commercial vegetable oils is presented in Table 2.
To identify the best mix of commercial oils that would simulate the composition of the microbial oil (based on the FFAs chain length) as closely as possible, a mathematical solver from Microsoft Excel software (Office 2019 Professional) was employed. Based on the mathematical solver, the optimum blend that can simulate the TAGs of microbial oil is 42.89 wt% palm oil, 3.44 wt% flaxseed oil, 30.75 wt% olive oil, and 22.92 wt% pumpkin seed oil.
To identify the accuracy of the solver and also to examine how close the free fatty acid composition of the SM feed is compared to the real microbial TAGs, the fatty acid composition of the blend was analyzed and compared with that of the microbial oil. Figure 1 presents the free fatty acid composition of the microbial oil (TAGs) compared to the SM feed. It can be observed that the blended feed matches almost 80% of the composition of the real microbial oil TAGs. The prepared blended feed can almost perfectly simulate the two main acids of microbial oil TAGs, the palmitic acid and the oleic acid, with an error very close to the detectable limits of the measurement. From the above analysis, it can be observed that the SM feed that was created from a blend of various commercial vegetable oils has an acceptable free fatty acids composition that could properly simulate the composition of the microbial TAGs. From now on, the SM feed will be called SM TAGs, while the raw microbial oil will be called TAGs.
The properties of both TAGs and SM TAGs are presented in Table 3. It can be observed that the SM TAGs’ properties are similar to the properties of the real TAGs. More specifically, the densities of the two feedstocks are very similar, approximately ~0.91 g/mL. In addition, the elemental composition of the two feeds is very similar in terms of carbon, hydrogen, oxygen, and sulfur content. The sulfur content from both feeds is below 100 wppm; more specifically, for TAGs it is 65.4 wppm and for SM TAGs it is 2.84 wppm. However, the sulfur of the SM TAGs increased from 2.84 wppm to 854.1 wppm, and for the TAGs, it increased from 65.4 to wppm to 863.3 wppm during the experiments, due to the addition of the DMDS (dimethyl-disulfide), as the instructions from the catalyst provider demand a S content higher than 700 wppm (DMDS is added to increase the sulfur content of the feed when sulfided catalysts are utilized). DMDS was selected as a hydrogen sulfide source, which, in an industrial application, can be partially substituted by H2S recovered from the off-gas of conventional hydrotreating processes [18]. In addition, the nitrogen content from the SM TAGs was 9.3 wppm, while that from the TAGs was 87.6. To that aim, TBA (tetra-butyl-amine) was added to the SM TAGs feed to increase the nitrogen content to match that of the real TAGs. Thus, the nitrogen content of the SM TAGs was increased from 9.3 wppm to 83.2 wppm with the addition of TBA. Furthermore, the higher heating value (HHV) is close to 40 MJ/kg for both feedstocks. The total acid number (TAN) presents some deviations between the two feedstocks. Additionally, the mass recovery curve (distillation curve) of the two feedstocks indicates that they consist of heavy molecules that must be hydrocracked to produce jet and marine diesel-range hydrocarbons.
For the current investigation, a commercial catalytic system was explored, consisting of four different catalysts. Both reactors were loaded with the same catalytic system. The loading plan of the reactors from top to bottom is as follows: 10% v/v HDO (hydrodeoxygenation) catalyst, 30% v/v HDT (hydrotreating)-saturation catalyst, 10% v/v HDO catalyst (similar to first zone), 40% v/v dewaxing-isomerization catalyst, and 10% v/v hydrocracking catalyst. All catalysts utilized in the study are commercial. Consequently, no further details can be provided due to a nondisclosure agreement (NDA) signed with the catalyst company supplier. All catalysts were mixed with glass beads as an inert material to maintain the desired LHSV. The presulfiding procedure was performed according to the instructions of the catalyst provider, utilizing LAGO (light atmospheric gas oil) with DMDS.

2.3. Storage Stability Study

The hydrotreated product of TAGs (from condition 3) was stored for 6 months in a metal container under a shed at ambient conditions in order to evaluate its stability over time. The weather conditions during storage were mild (average annual temperature ~292 K, moisture content ~53.4 wt%). Samples were taken on a monthly basis and their stability was studied by analyzing the water content (WC), TAN, viscosity (at 313 K), and density (at 288 K). Before sampling, the container was shaken to ensure homogeneity.

2.4. Testing Infrastructure

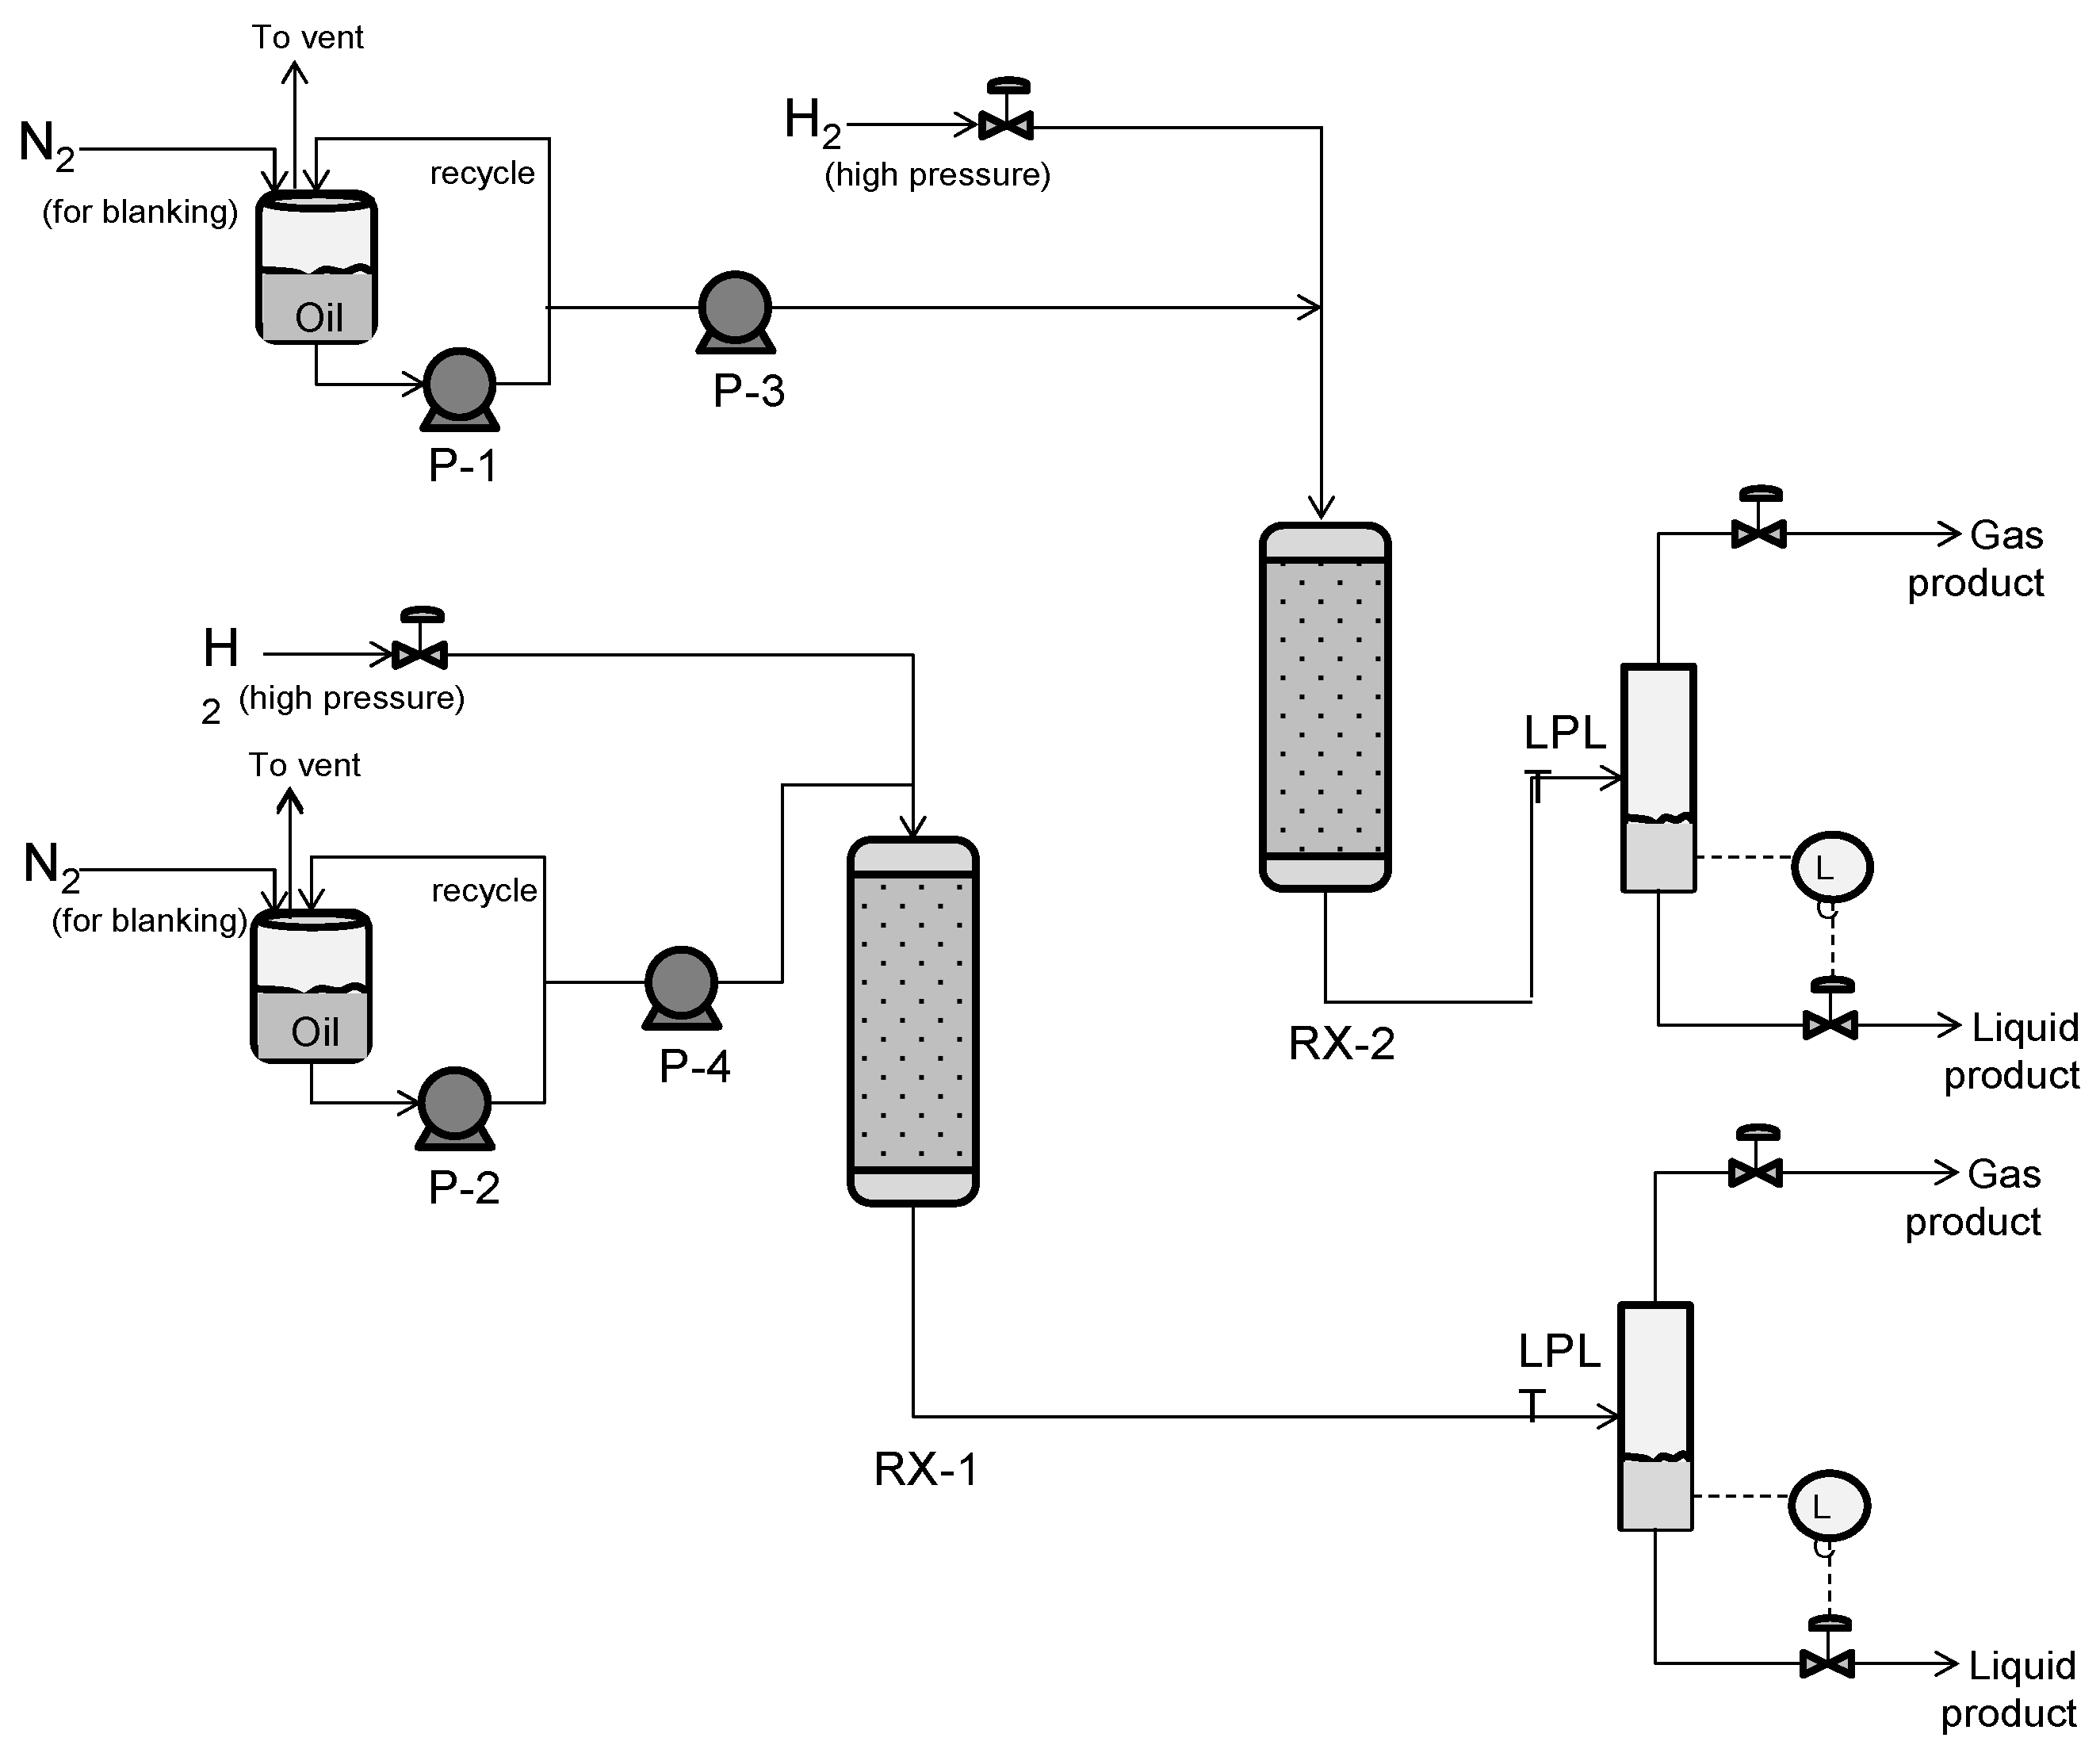
2.4.1. Hydroprocessing Equipment (TRL 4)

For this study, the experiments from the hydrotreatment optimization and SM TAGS evaluation were carried out in a small-scale pilot hydroprocessing plant (TRL 4), which is schematically depicted in Figure 2. This unit is a small industrial system designed to generate data on system behavior, which are used in the design of larger facilities.
The current unit consists of two reactors that can operate either in series or in parallel mode. For the purposes of the current study, the unit was operated in parallel mode. Each stainless-steel reactor operates continuously and consists of six independent heating zones, sustaining the desired temperature profile within the reactor. The volume of each reactor is ~300 mL, with an inlet diameter of 17.48 mm and a length of 1.289 m. Each reactor is equipped with six independent thermocouples that are placed inside a thermowell and are used to control the reactor temperature profile. The hydrogen flow is monitored via high-pressure flow controllers. More specifically, two hydrogen flow controllers for each reactor keep the hydrogen flow of the unit constant. In the case of the liquid feed flow, two high-pressure piston pumps are used, one for each reactor. Additionally, there is a spare pump available to serve as a backup during the maintenance of the main pumps. Liquid feeds are stored in two feed tanks (one for each reactor). Both feed tanks can be heated up to 373 K, while there is also a recycling line to maintain the homogeneity of the feed. The liquid feed is mixed with the hydrogen before the reactor. The products exit the reactor and pass through a low-pressure temperature (at 308–313 K) separator for the phase separation. There are two separators, one for each reactor. For the measurement of the gas product flow rate, the unit is equipped with a wet test meter. The gas products are analyzed via an online common Agilent 7890 series gas chromatograph analyzer. The liquid feed flow capacity of the unit is from 60 mL/h to 200 mL/h, depending on the catalyst volume and the desired LHSV.

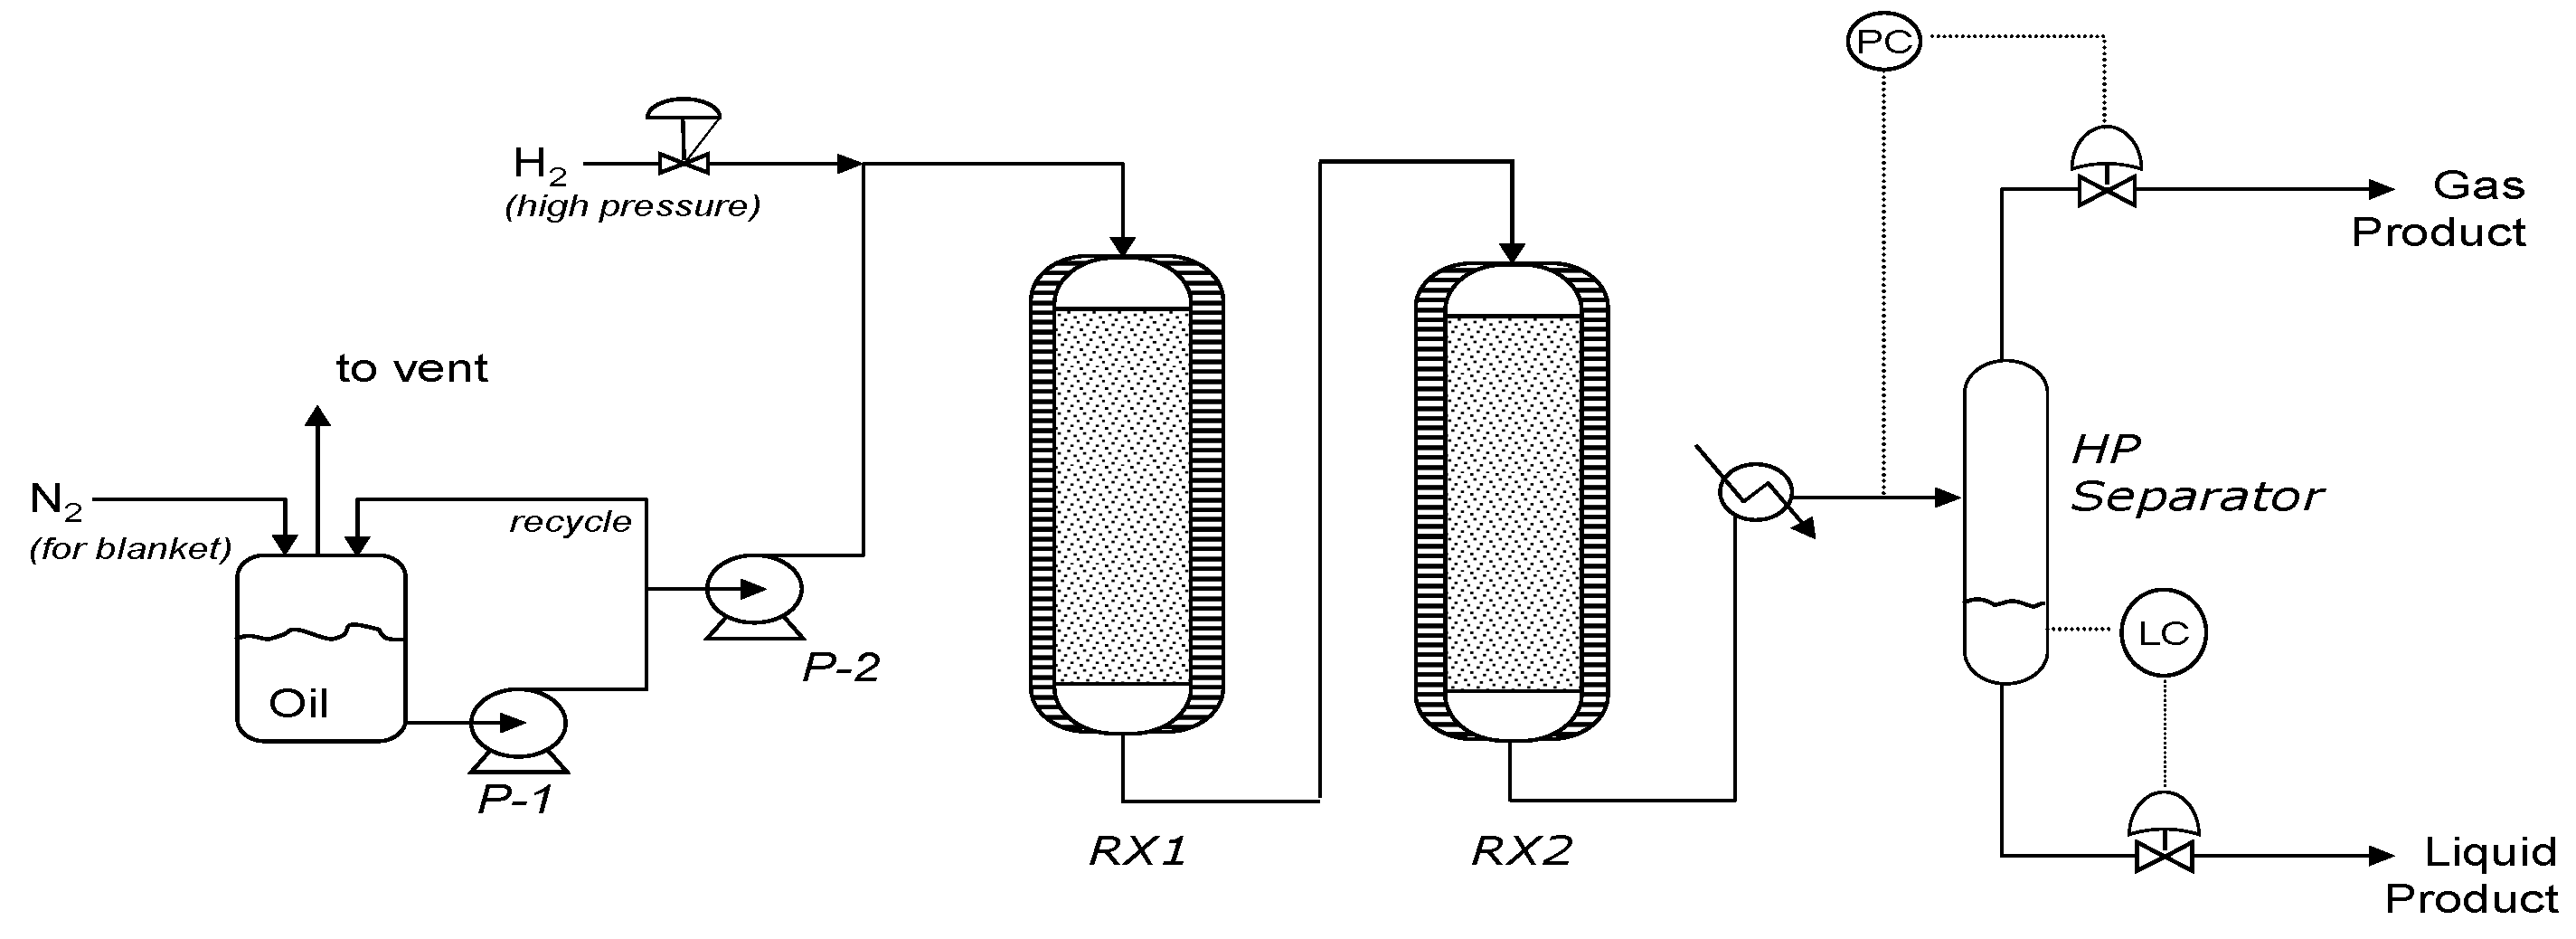
2.4.2. Hydroprocessing Equipment (TRL 5)

The optimized technology was further scaled up in a TRL 5 hydrotreatment plant utilizing the SM TAGs, rendering reliable large-scale research operation data. The pilot plant is schematically depicted in Figure 3 and includes two stainless-steel continuous downflow fixed-bed reactors operating in series (with an available volume of 555 cm3 each, 28 mm inside diameter and 955 mm length). The temperature control of the reactors is performed via five independent inlet thermocouples. Similar to the smaller TRL 4 unit, the hydrogen flow is controlled via two gas flow controllers, while the liquid feed is monitored via a high-pressure piston pump. The product exits the first reactor and enters the second downflow reactor. The products from the second reactor pass through a high-pressure, low-temperature separator where the liquid products are separated from the gas products. The flow of the gas products is measured via a wet test meter device, while their composition is measured via an off-line Agilent 7890 series gas chromatograph analyzer. The liquid feed flow capacity of the TRL 5 unit is from 250 mL/h to 600 mL/h, depending on the catalyst volume and the desired LHSV. It should be noted that the same catalytic system as that of the TRL 4 plant was utilized.

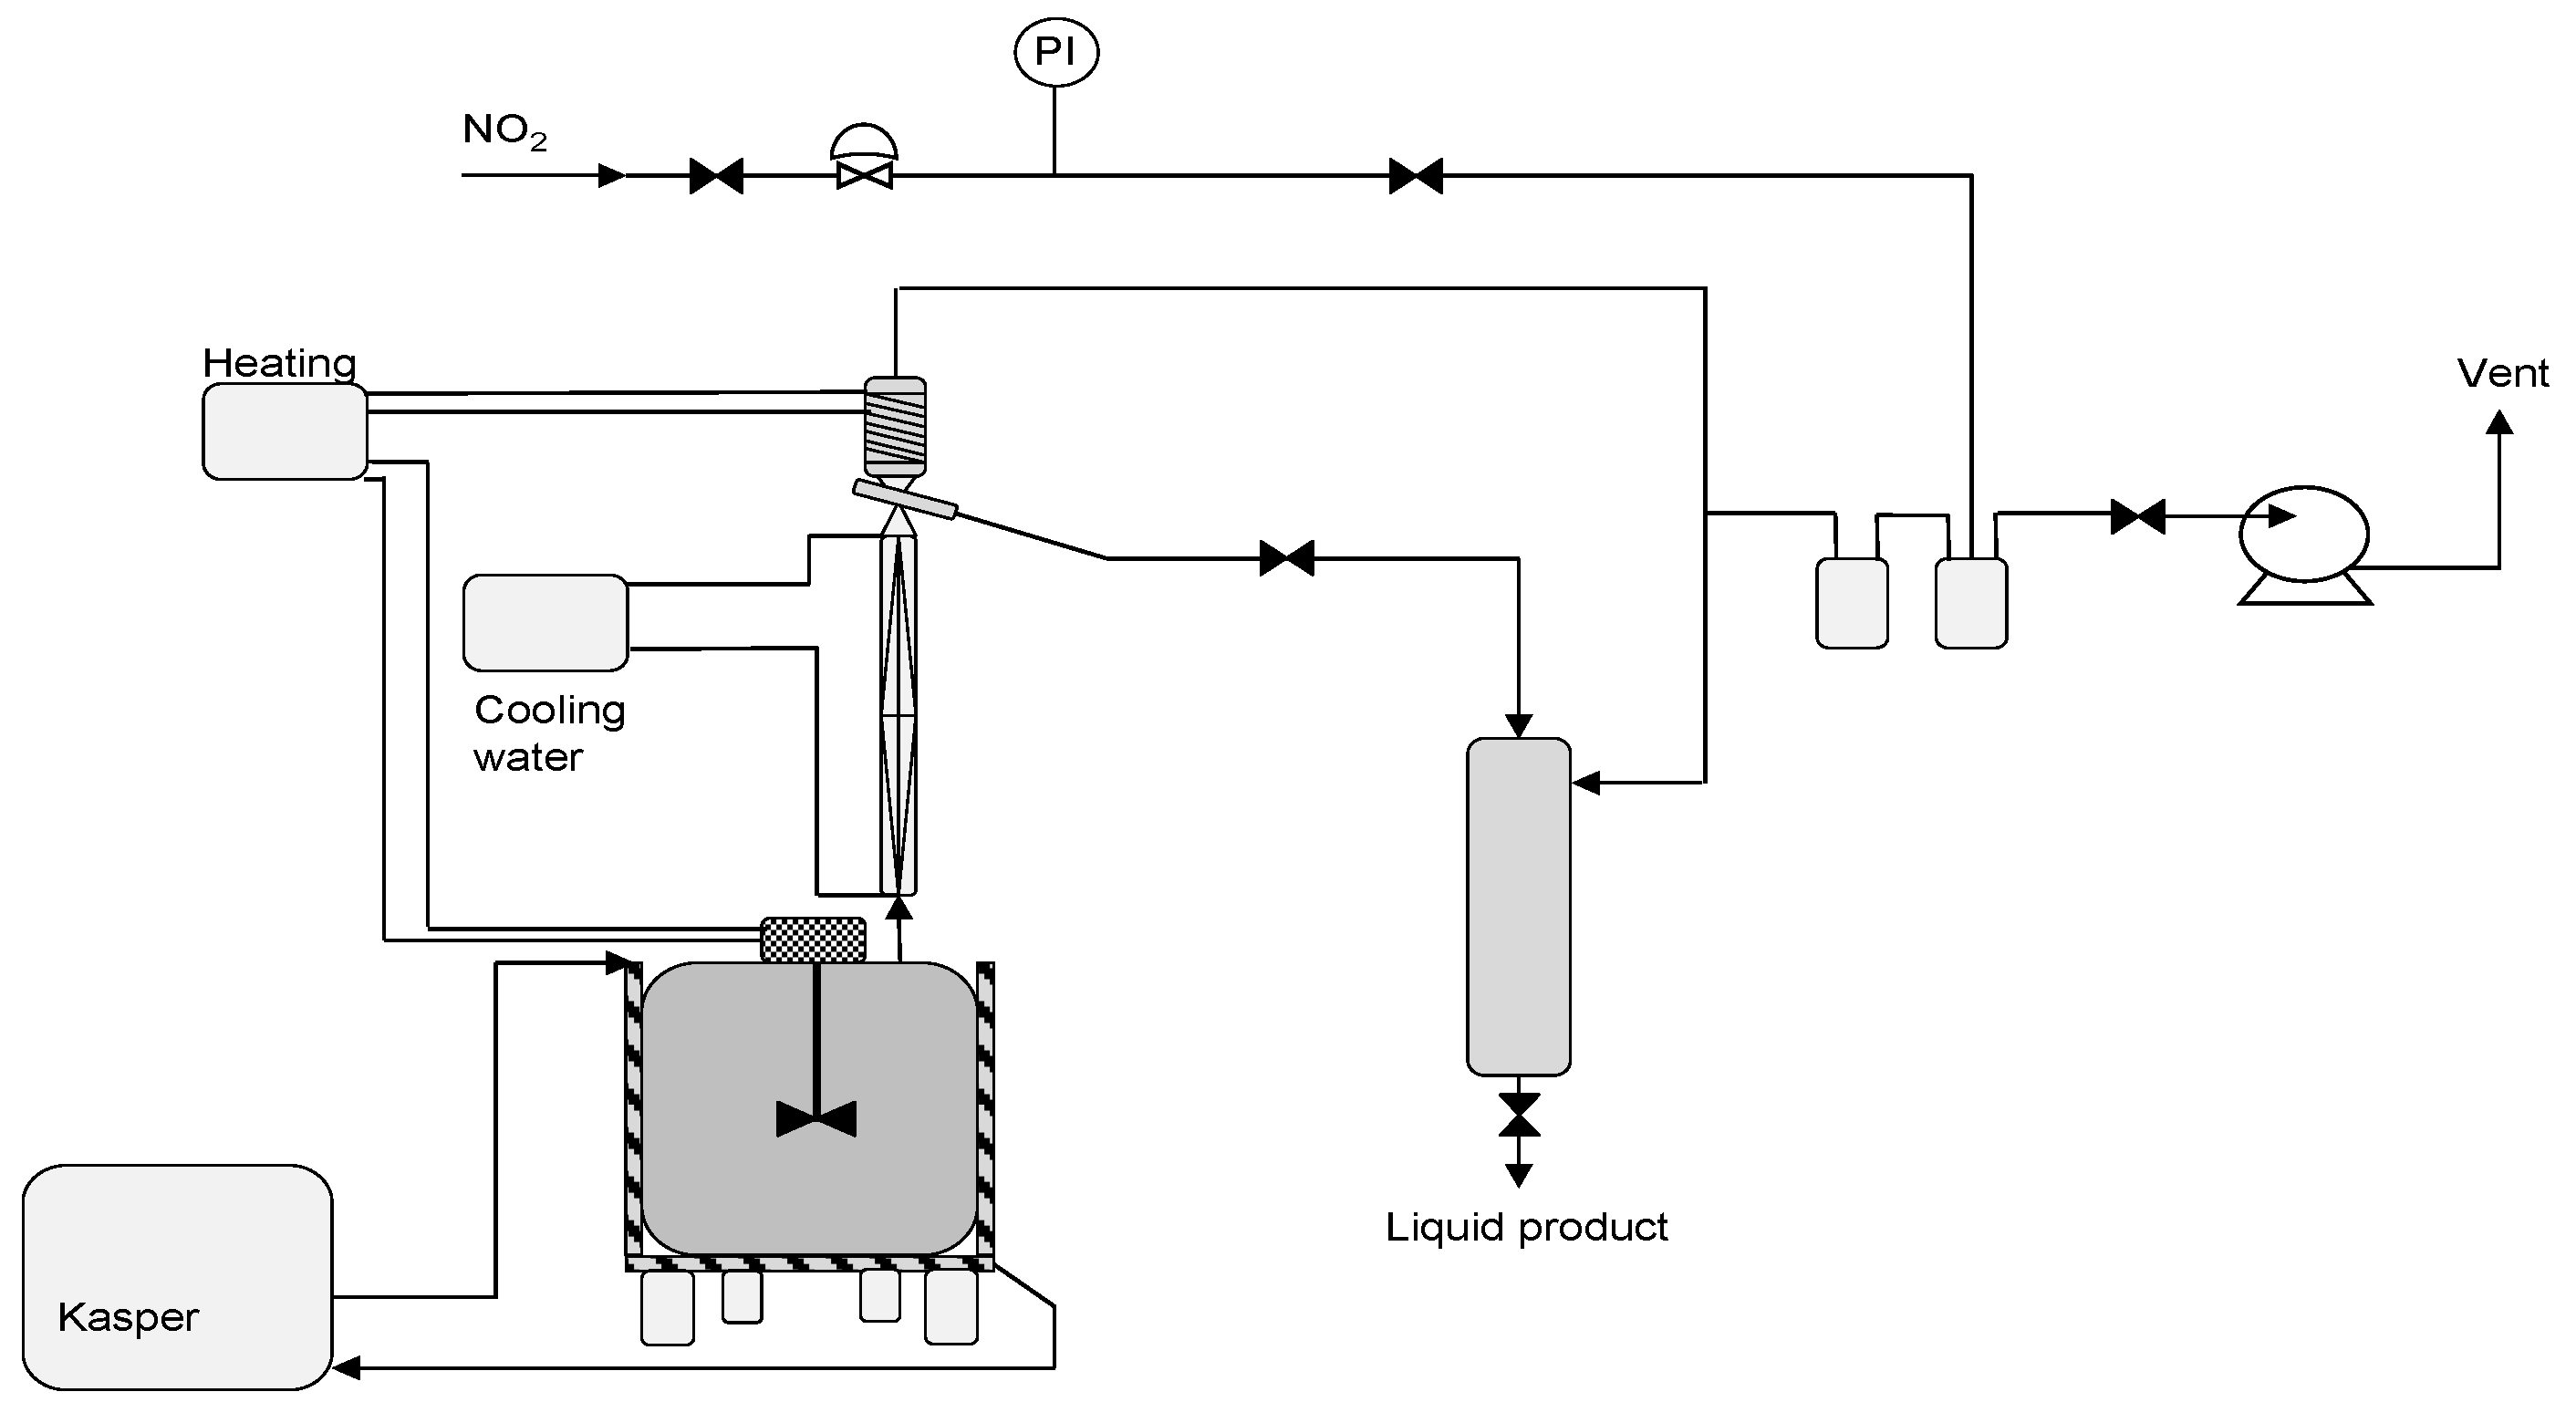
2.4.3. Fractionation Equipment

For the fractionation of the total organic liquid product obtained from the TRL 5 hydrotreatment plant, a batch fractionation unit of CERTH was employed. The simplified plot from the batch fractionation unit is presented in Figure 4. The current unit is a batch distillation unit with a minimum capacity of 10 L and a maximum capacity of 20 L per batch. The operation is based under vacuum conditions and can reach up to 638 K. The unit consists of the feed tank with a capacity of 30 L, the fractionation column, and the liquid product flask with a capacity of 20 L.

2.5. Analysis

Liquid and gas product samples were collected on a daily basis and analyzed in the analytical laboratory of CPERI/CERTH. In the TRL 4 unit, the gaseous products were analyzed online via an online GC 7890 Agilent analyzer (Agilent, St. Clara, CA, USA) that enables accurate estimation of the hydrogen consumption during oils hydrotreatment. On the other hand, the gaseous products from the TRL 5 unit were analyzed offline on the same GC 7890 Agilent analyzer (Agilent, St. Clara, CA, USA). In the case of the liquid products, several analyses were performed. A density measurement was performed according to ASTM D-4052 (DMA4500, Anton Paar GmbH, Grez, Austria) [20]. The simulated distillation curve of the liquid products was measured via ASTM D-7169 (6890N, Analytical Control, Rotterdam, Netherlands) [21]. The content of carbon and hydrogen was estimated according to the LECO ASTM D-5291 method (LECO CHN-628, St. Joseph, MI, USA) [22]. The sulfur content was determined using an XRFS analyzer via ASTM D-4294 (Lab-X3500S, Oxford Instruments, High Wycombe, UK) [23]. The oxygen concentration was indirectly calculated via difference, assuming a negligible concentration of all the other elements in the measuring liquid sample. The dissolved water content was found via the ASTM D-6304 (831 KF coulometer) [24] and ASTM E-203 (795 KFT Titrino) [25] depending on the type of the sample. The total acid number (TAN) was calculated via the ASTM D-664 (685 Dosimat/751 GPD Titrino, Metrohm Ltd., Herisah, Switzerland) [26]. Kinematic viscosity was determined via the ASTM D445 (TV 2000/AK PMT, Tamson Instruments, Biesmijk, The Netherlands) [27]. The Cetane index on the products was measured via the ASTM D-976 [28], oxidation stability via the ISO EN-15751 [29], and pour point via the ASTM D-97 [30].
The high heating value (HHV) was estimated according to Equation (1), provided by Channiwalla and Parikh, 2002 [19], and is given below:
H H V M J k g = 0.3491 C + 1.1783 H 0.1034 O 0.0151 N + 0.1005 S
where C, H, O, N, and S, represent the corresponding elemental (wt%) composition on a dry basis.

3. Results

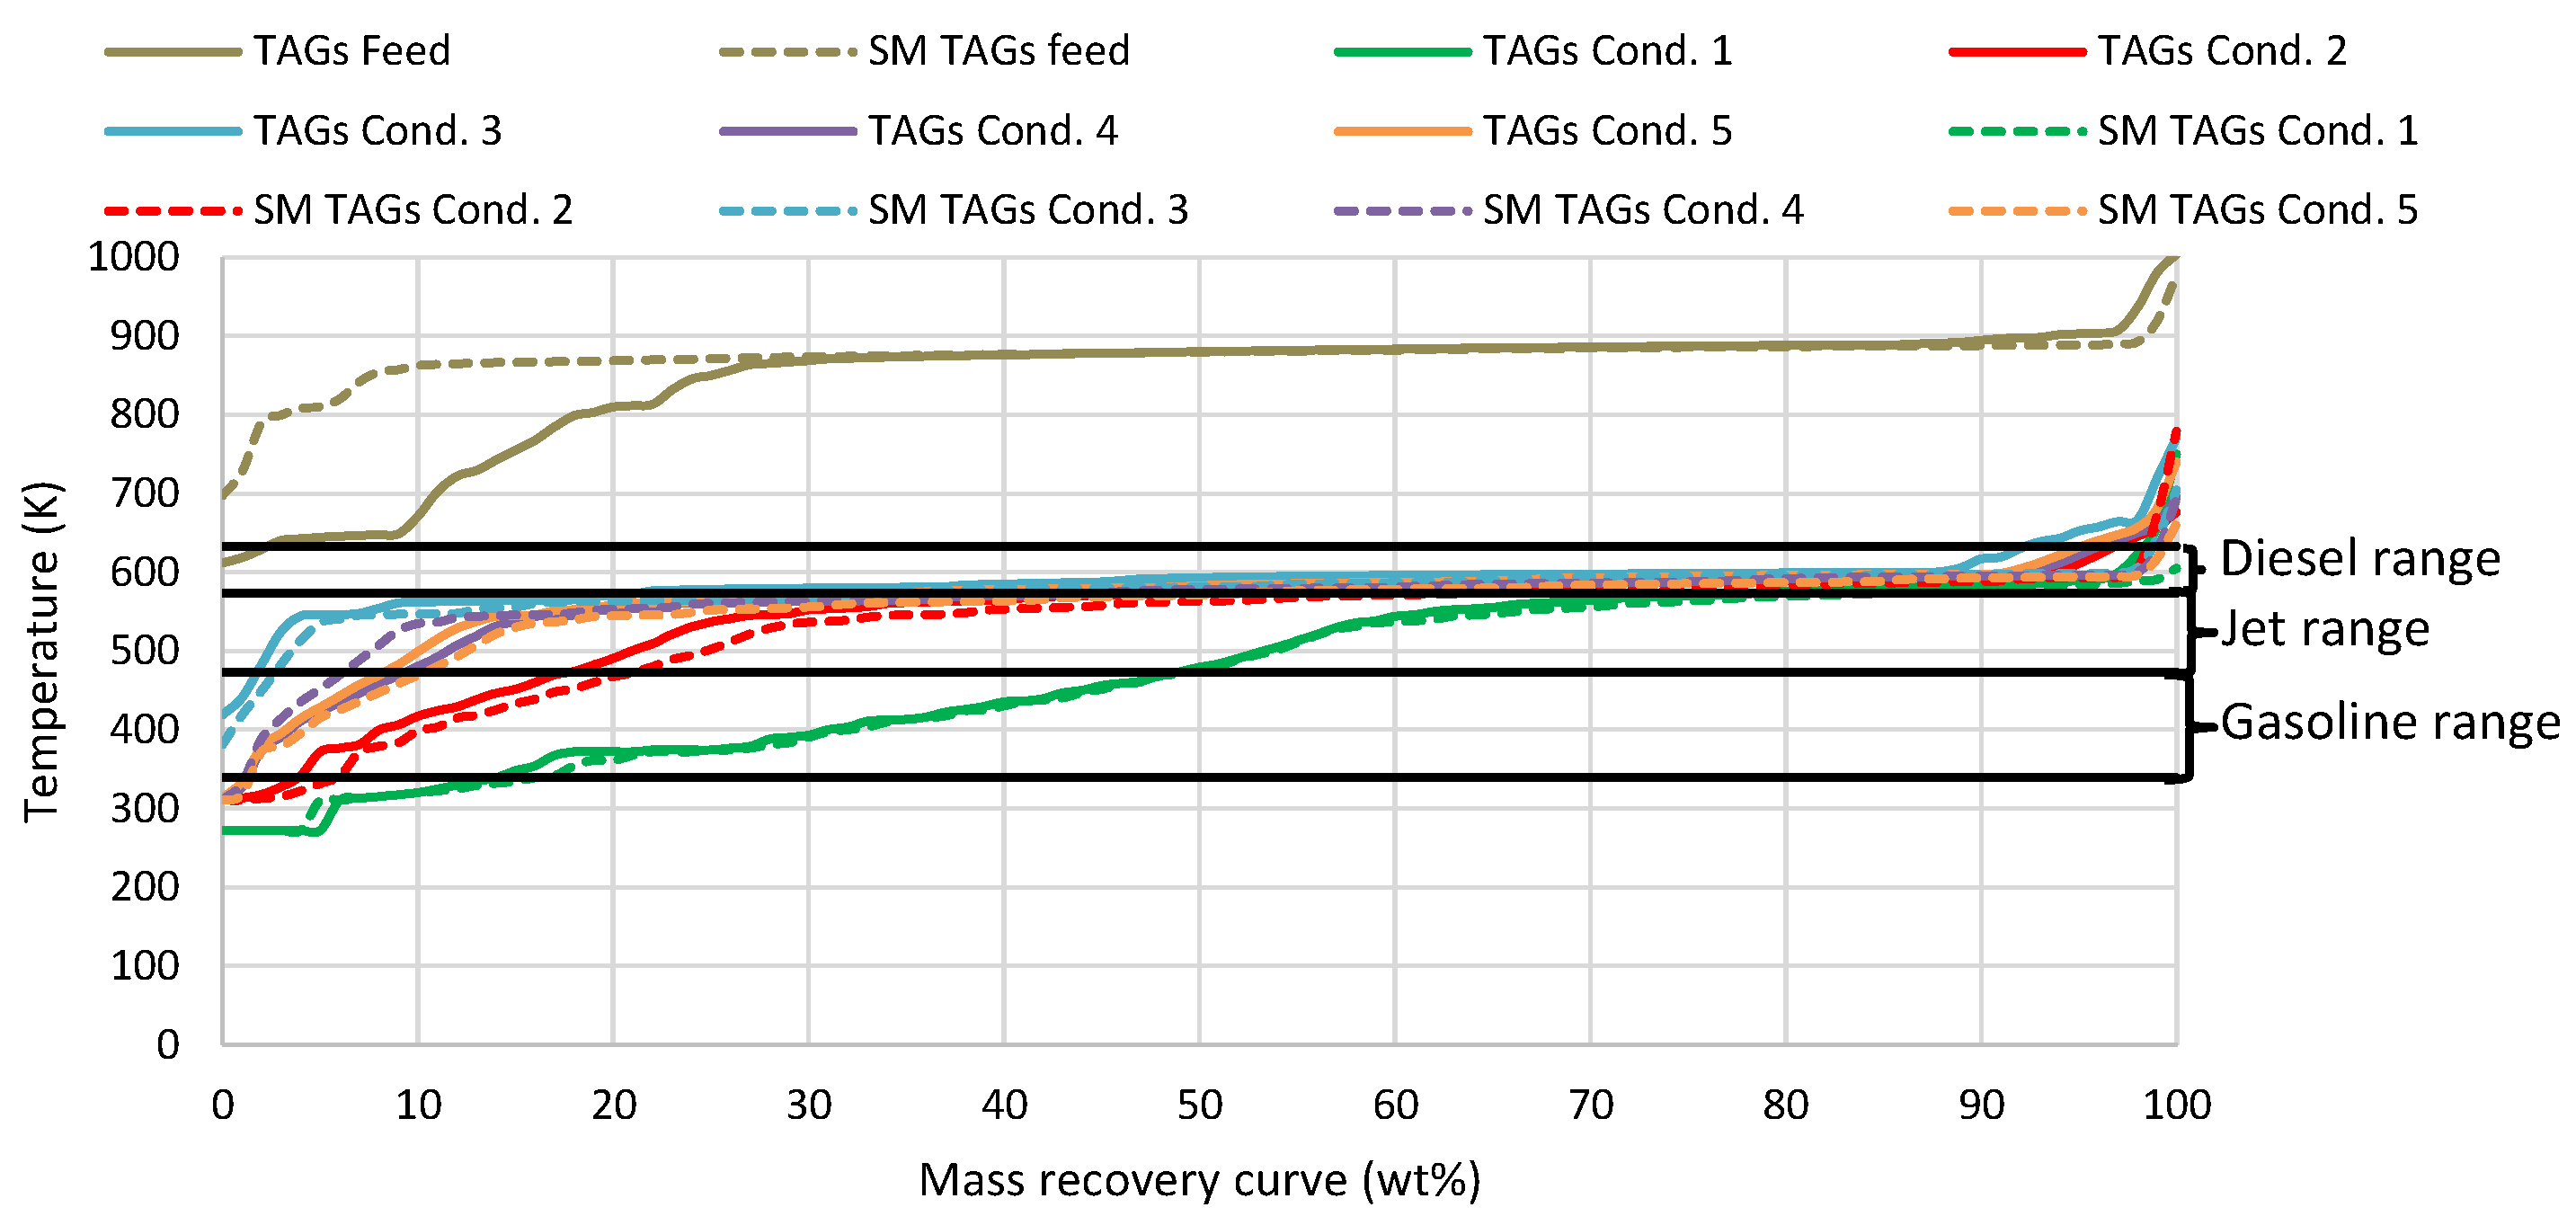
3.1. Simulated Feedstock Evaluation

The first step of the current investigation is to evaluate the efficiency of the SM TAGs to simulate the real TAGs and, secondly, to optimize the hydroprocessing operation. To that aim, the two feedstocks were tested on the same five operating conditions (Table 1). This section presents the results from both TAGs and SM TAGs products after hydroprocessing. A very important analysis in order to evaluate the products’ quality after hydrotreatment is the mass recovery curve analysis, which is presented in Figure 5. The results show that the mass recovery curve of the TAGs products and the SM TAGs products are almost similar. This shows that the hydroprocessing of the SM TAGs can lead to similar-boiling-range hydrocarbons with the hydroprocessing of the real TAGs. Furthermore, it can be observed that an increase in the LHSV from 0.5 h−1 (condition 1) to 1 h−1 (condition 2) leads to heavier hydrocarbons in the organic liquid products. The higher LHSV means that the liquid flow is higher and, thus, the reaction time is lower. A reduction in reaction time leads to fewer hydrocracking reactions and, finally, to a heavier product than jet and diesel fuel. In addition, the LHSV also affects the reactor volume; higher LHSV requires smaller reactors and, thus, investment cost. As a result, condition 2 is preferable compared to condition 1 as it can lead to higher jet and diesel fuel yields and also it requires half the catalyst and reactor size compared to condition 1. The yields of jet and diesel fuel for condition 1 are 36 and 15 wt%, respectively, while for condition 2 they are 43 and 35 wt%, respectively. Similar jet yields from the hydrotreatment of palm oil were observed by Lin et al. [31] and also by Xu et al. [32], who examined the production of aviation fuels via the hydrogenation of waste triacylglycerides.
The effect of reaction temperature was investigated via the conditions 2 and 3. The reaction temperature of condition 2 was 663 K, while for condition 3 it was 643 K. From the mass recovery curves (distillation curves) of conditions 2 and 3, it can be observed that the reduction in operating temperature has led to fewer cracking reactions and, thus, heavier hydrocarbons in the products, confirming the results from various studies that have tested the hydrotreatment of lipid-based feedstocks targeting aviation fuel production [33]. The jet and diesel yields from condition 3 are 33 and 64 wt%, respectively. In general, the higher the operation temperature, the quicker the catalyst deactivation; in addition, higher temperatures require higher energy demands. From the above results, it is easily noticeable that condition 3 is preferable. In order to further improve the process, the LHSV was reduced in condition 4, at the same time keeping the temperature at 643 K. It can be observed that the reduction in the LHSV from 1 h-1 to 0.5 h−1 led to more hydrocracking reactions as the retention time increased. However, lower LHSVs demand bigger reactors and,, thus higher investment costs for the same unit capacity. Finally, in order to test the effect of the reaction pressure, the pressure was reduced to 10 MPa in condition No. 5, at the same time keeping the temperature at 643 K and the LHSV at 0.5 h−1. Based on the results of Figure 5, the reduction in the reaction pressure does not strongly influence the mass recovery curve of the products. A minor effect of operating pressure on product quality was observed also by Feng et al. [34], who studied the hydrotreatment of oleic acid, targeting the production of aviation-fuel-range alkanes at different reaction temperatures and operating pressures. Similar results were also observed by Li et al. [35], who investigated the production of aviation kerosene via one-step hydrotreatment of jatropha oil in a high-pressure fixed-bed reactor.
To evaluate the efficiency of the SM TAGs to simulate the real TAGs, the density and cetane index were also compared in Figure 6. The results show that the products from both feedstocks have identical densities, confirming in that way the efficiency of the SM TAGs to simulate the real TAGs in terms of product density. In the case of the cetane index, which shows the quality of the fuel during the combustion process, the two feedstocks present very similar values.
The last two parameters that were evaluated during the process are the hydrogen consumption and the organic yields (Figure 7). As can be noticed, the hydrogen consumption presents some deviations between the two feeds. More specifically, the hydroprocessing of the TAGs required less hydrogen compared to the hydroprocessing of the SM TAGs. This deviation in hydrogen consumption can be explained by the small differences in the free fatty acid composition between the TAGs and the SM TAGs. The SM TAGs consist of 10 wt% more linoleic acid (C18:2) that consists of double bonds, while the TAGs have almost 10 wt% more stearic acid (C18:0) with no double bonds (Figure 1). For that reason, the hydrogen consumption for the hydroprocessing of SM TAGs is higher compared to the hydroprocessing of the TAGs. This is because the double bonds present in linoleic acids require additional hydrogen to break. However, the hydrogen consumption that is presented here is just an indication and cannot be considered as an absolute value because it is affected by several factors such as the hydrogen determination in the liquid feed and products. The organic yields from the products of both feeds are also presented in Figure 7. It is easily noticeable that the hydroprocessing of both feeds can lead to similar organic yields, confirming, once again, the ability of the SM feed to simulate the real TAGs.

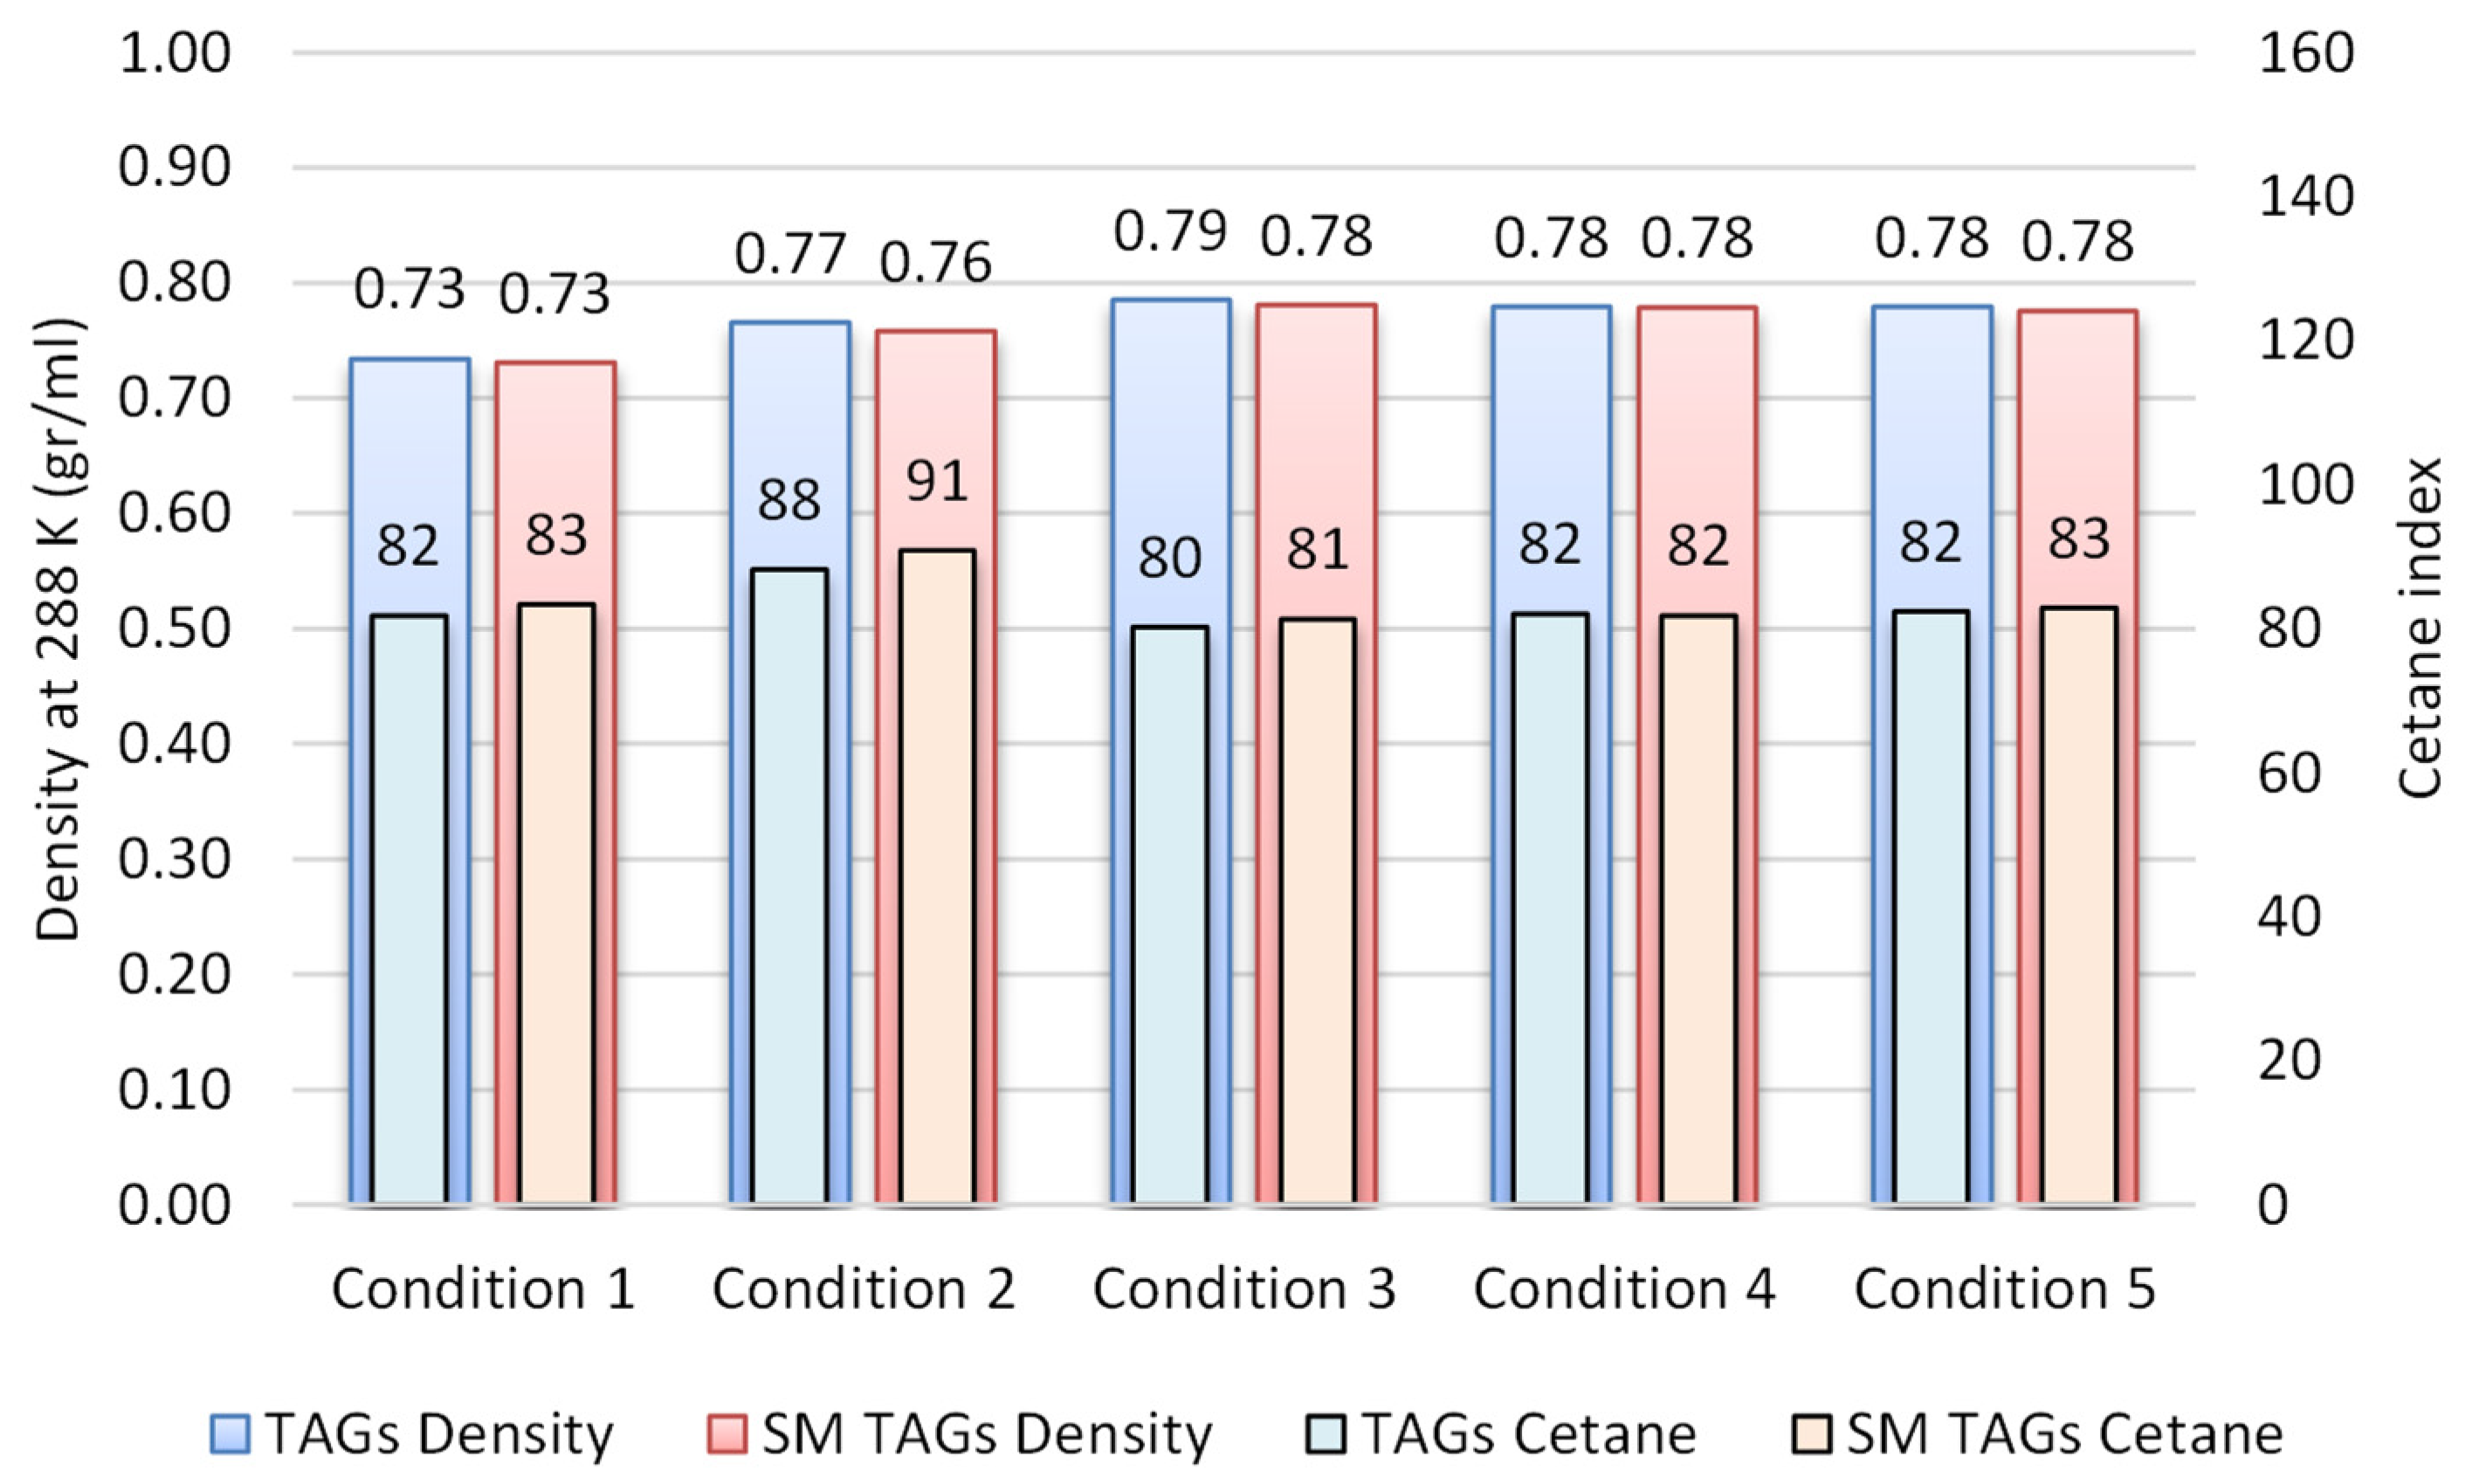
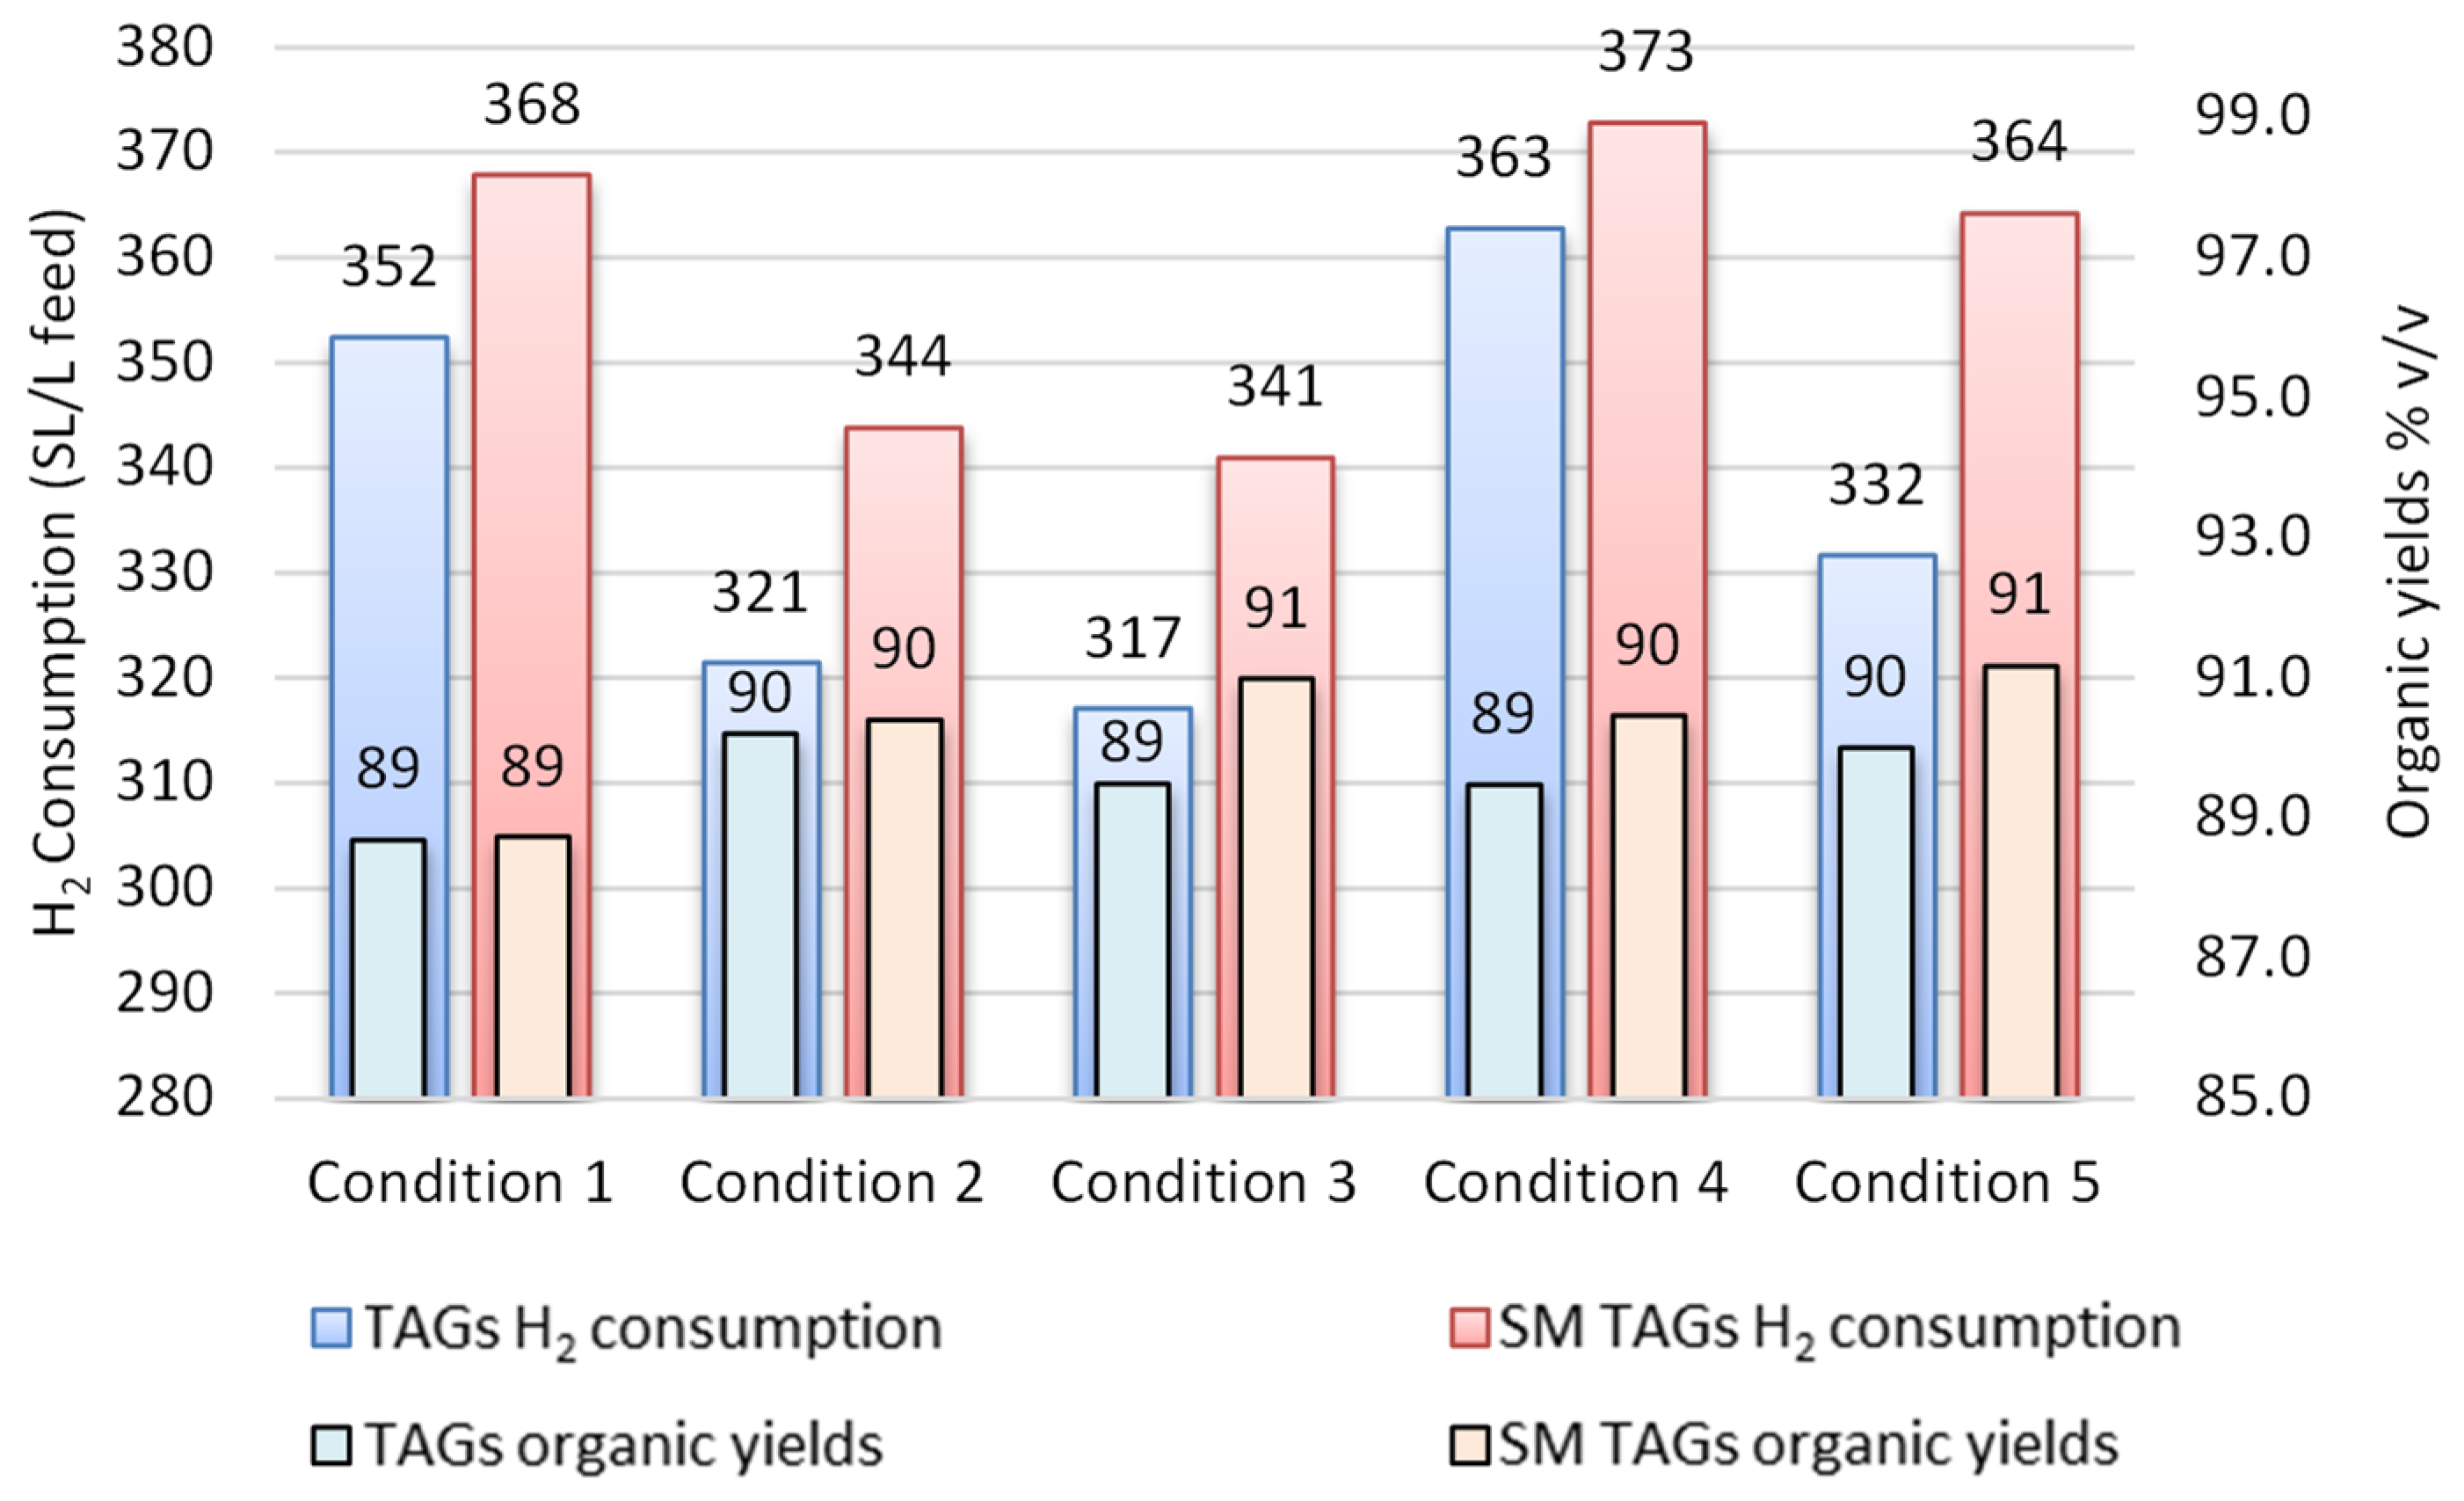
3.2. Operating Process Evaluation

The results up to now have shown that in terms of distillation curve and hydrogen consumption, condition No. 3 is the optimum one as it presents the highest jet and diesel fuel yields with an average hydrogen consumption. However, before concluding which operating window is the optimum one, further data analysis is important. To that aim, the gas product analysis from all conditions is presented in Table 4, presenting useful information about the reaction pathways during the hydroprocessing. According to the detailed feed properties analysis, both the TAGs and the SM TAGs present high oxygen content; more specifically, the oxygen content for the TAGs is 12.8 wt%, while for the SM TAGs it is 11.2 wt%, due to the oxygenate compounds that are contained in both feedstocks.
There are three main types of reactions that remove the oxygen content from the lipids: the hydrodeoxygenation reactions that result in the formation of water as an aqueous second phase in the liquid product (Equation (4)); the decarboxylation reactions, where the oxygen is removed as carbon dioxide in the gas products (Equation (3)); and, finally, the decarbonylation reactions, where the oxygen content is removed via carbon monoxide in the gas products (Equation (2)). However, additional reactions occurred during the process, such as the methanation (Equations (5)–(7)) and the water gas shift reaction (Equation (8)). The suggested reactions according to the literature are presented below [36].
R C H 2 C O O H + H 2 R C H 3 + C O + H 2 O d e c a r b o n y l a t i o n
R C H 2 C O O H R C H 3 + C O 2 d e c a r b o x y l a t i o n
R C H 2 C O O H + 3 H 2 R C H 2 C H 3 + 2 H 2 O h y d r o d e o x y g e n a t i o n
C O + 3 H 2 C H 4 + H 2 O m e t h a n a t i o n   1 / 3
2 C O + 2 H 2 C H 4 + C O 2 m e t h a n a t i o n   2 / 3
C O 2 + 4 H 2 C H 4 + 2 H 2 O m e t h a n a t i o n s   3 / 3
C O 2 + H 2 C O + H 2 O w a t e r   g a s   s h i f t
In general, the gas product consists mainly of unreacted hydrogen, some gas hydrocarbons such as methane, propane ethane, butane, etc., and also contains some small amounts of CO and CO2. These results are in agreement with previous studies in the literature, where the hydroprocessing of lipid-based feedstocks was investigated, such as palm oil [31], soybean [32], animal fats [36], waste cooking oil [37], etc. According to the gas product analysis, carbon monoxide and carbon dioxide are present in the gases, showing that the oxygen is removed via the decarboxylation and decarbonylation reactions. Furthermore, the presence of the second aqueous phase on the liquid products confirms that the oxygen is also removed via the hydrodeoxygenation reactions. Furthermore, the formation of methane confirms the presence of the methanation reactions. Increasing the LHSV from 0.5 h−1 in condition 1 to 1 h−1 in condition 2 leads to an increase in the carbon dioxide percent; at the same time, there is also some carbon monoxide production, while the methane content is reduced. This shows that the reduction in the retention time leads to fewer methanation reactions (5), (6), and (7). The second aqueous phase is reduced during condition 2, which means that there are fewer reactions during the process, while the carbon monoxide and the carbon dioxide are not transformed to methane via methanation. These results confirm that the increase in LHSV reduces the reaction time of the feed on the catalyst, leading to fewer hydrotreating reactions, which can be also confirmed by the hydrogen consumption plot (Figure 7), where the hydrogen consumption during condition 2 is lower compared to condition 1. Moving to the third condition, the temperature is reduced from 663 K (condition 2) to 643 K (condition 3), while the LHSV is kept constant at 1 h−1. In general, the lower reaction temperature in the hydrotreating process leads to milder reactions and, thus, lower hydrogen consumption, which is also confirmed by Figure 7. Furthermore, from the gas product analysis, it can be observed that the methane is reduced further, showing that the higher temperatures favor methanation reactions. As the methane content is reduced, the carbon monoxide and carbon dioxide content are increased, which means that less carbon monoxide and carbon dioxide react with the hydrogen to form methane via Equations (5) to (7). Reducing the LHSV at 0.5 h−1 at 643 K leads to more methanation reactions (5), (6), and (7), as the carbon monoxide and the carbon dioxide react with the hydrogen, leading to a higher methane production. In addition, the hydrogen consumption is also increased. Furthermore, propane production has also increased. The propane originates from the glycerol backbone of triglycerides [38]. Finally reducing the pressure from 13.78 MPa (condition 4) to 10.34 MPa (condition 5) leads to the reduction in hydrogen consumption. Less methane and propane are produced in condition 5 compared to 4, while the content of carbon dioxide and carbon monoxide in the gas products is increased. This is expected, as the higher pressure favors hydrotreatment reactions. In general, the target of the hydrotreatment is to break the heavy molecules of the feedstock and also to remove the heteroatoms (sulfur, nitrogen, and oxygen) from the feedstock, but at the same time to avoid the production of hydrocarbons in the gas products (e.g., the methane and propane). The carbons determined/identified on the gas products are carbon losses from the liquid fuel products. Based on this analysis, the lower methane and propane formation is observed in condition 3, which has an average hydrogen consumption and high jet and diesel fuel yields. To that aim, condition 3 can be selected as the optimum one.
As condition 3 was selected as the optimum one, a GC MS analysis was performed on the products from both feedstocks, the TAGs and the SM TAGs, and the results are presented in Figure 8. As can be observed, both products consist mainly of paraffins and iso-paraffins. More specifically, the product from TAGs consists of 73.64 wt% paraffins and 24.84 wt% iso-paraffins, while the product from SM TAGs consists of 65.20 wt% paraffins and 33.11 wt% iso-paraffins. These results are very close between the two products. Furthermore, it can be observed that the free fatty acids from both feedstocks were converted to light hydrocarbons, confirming the successfulness of the hydrotreatment technology.

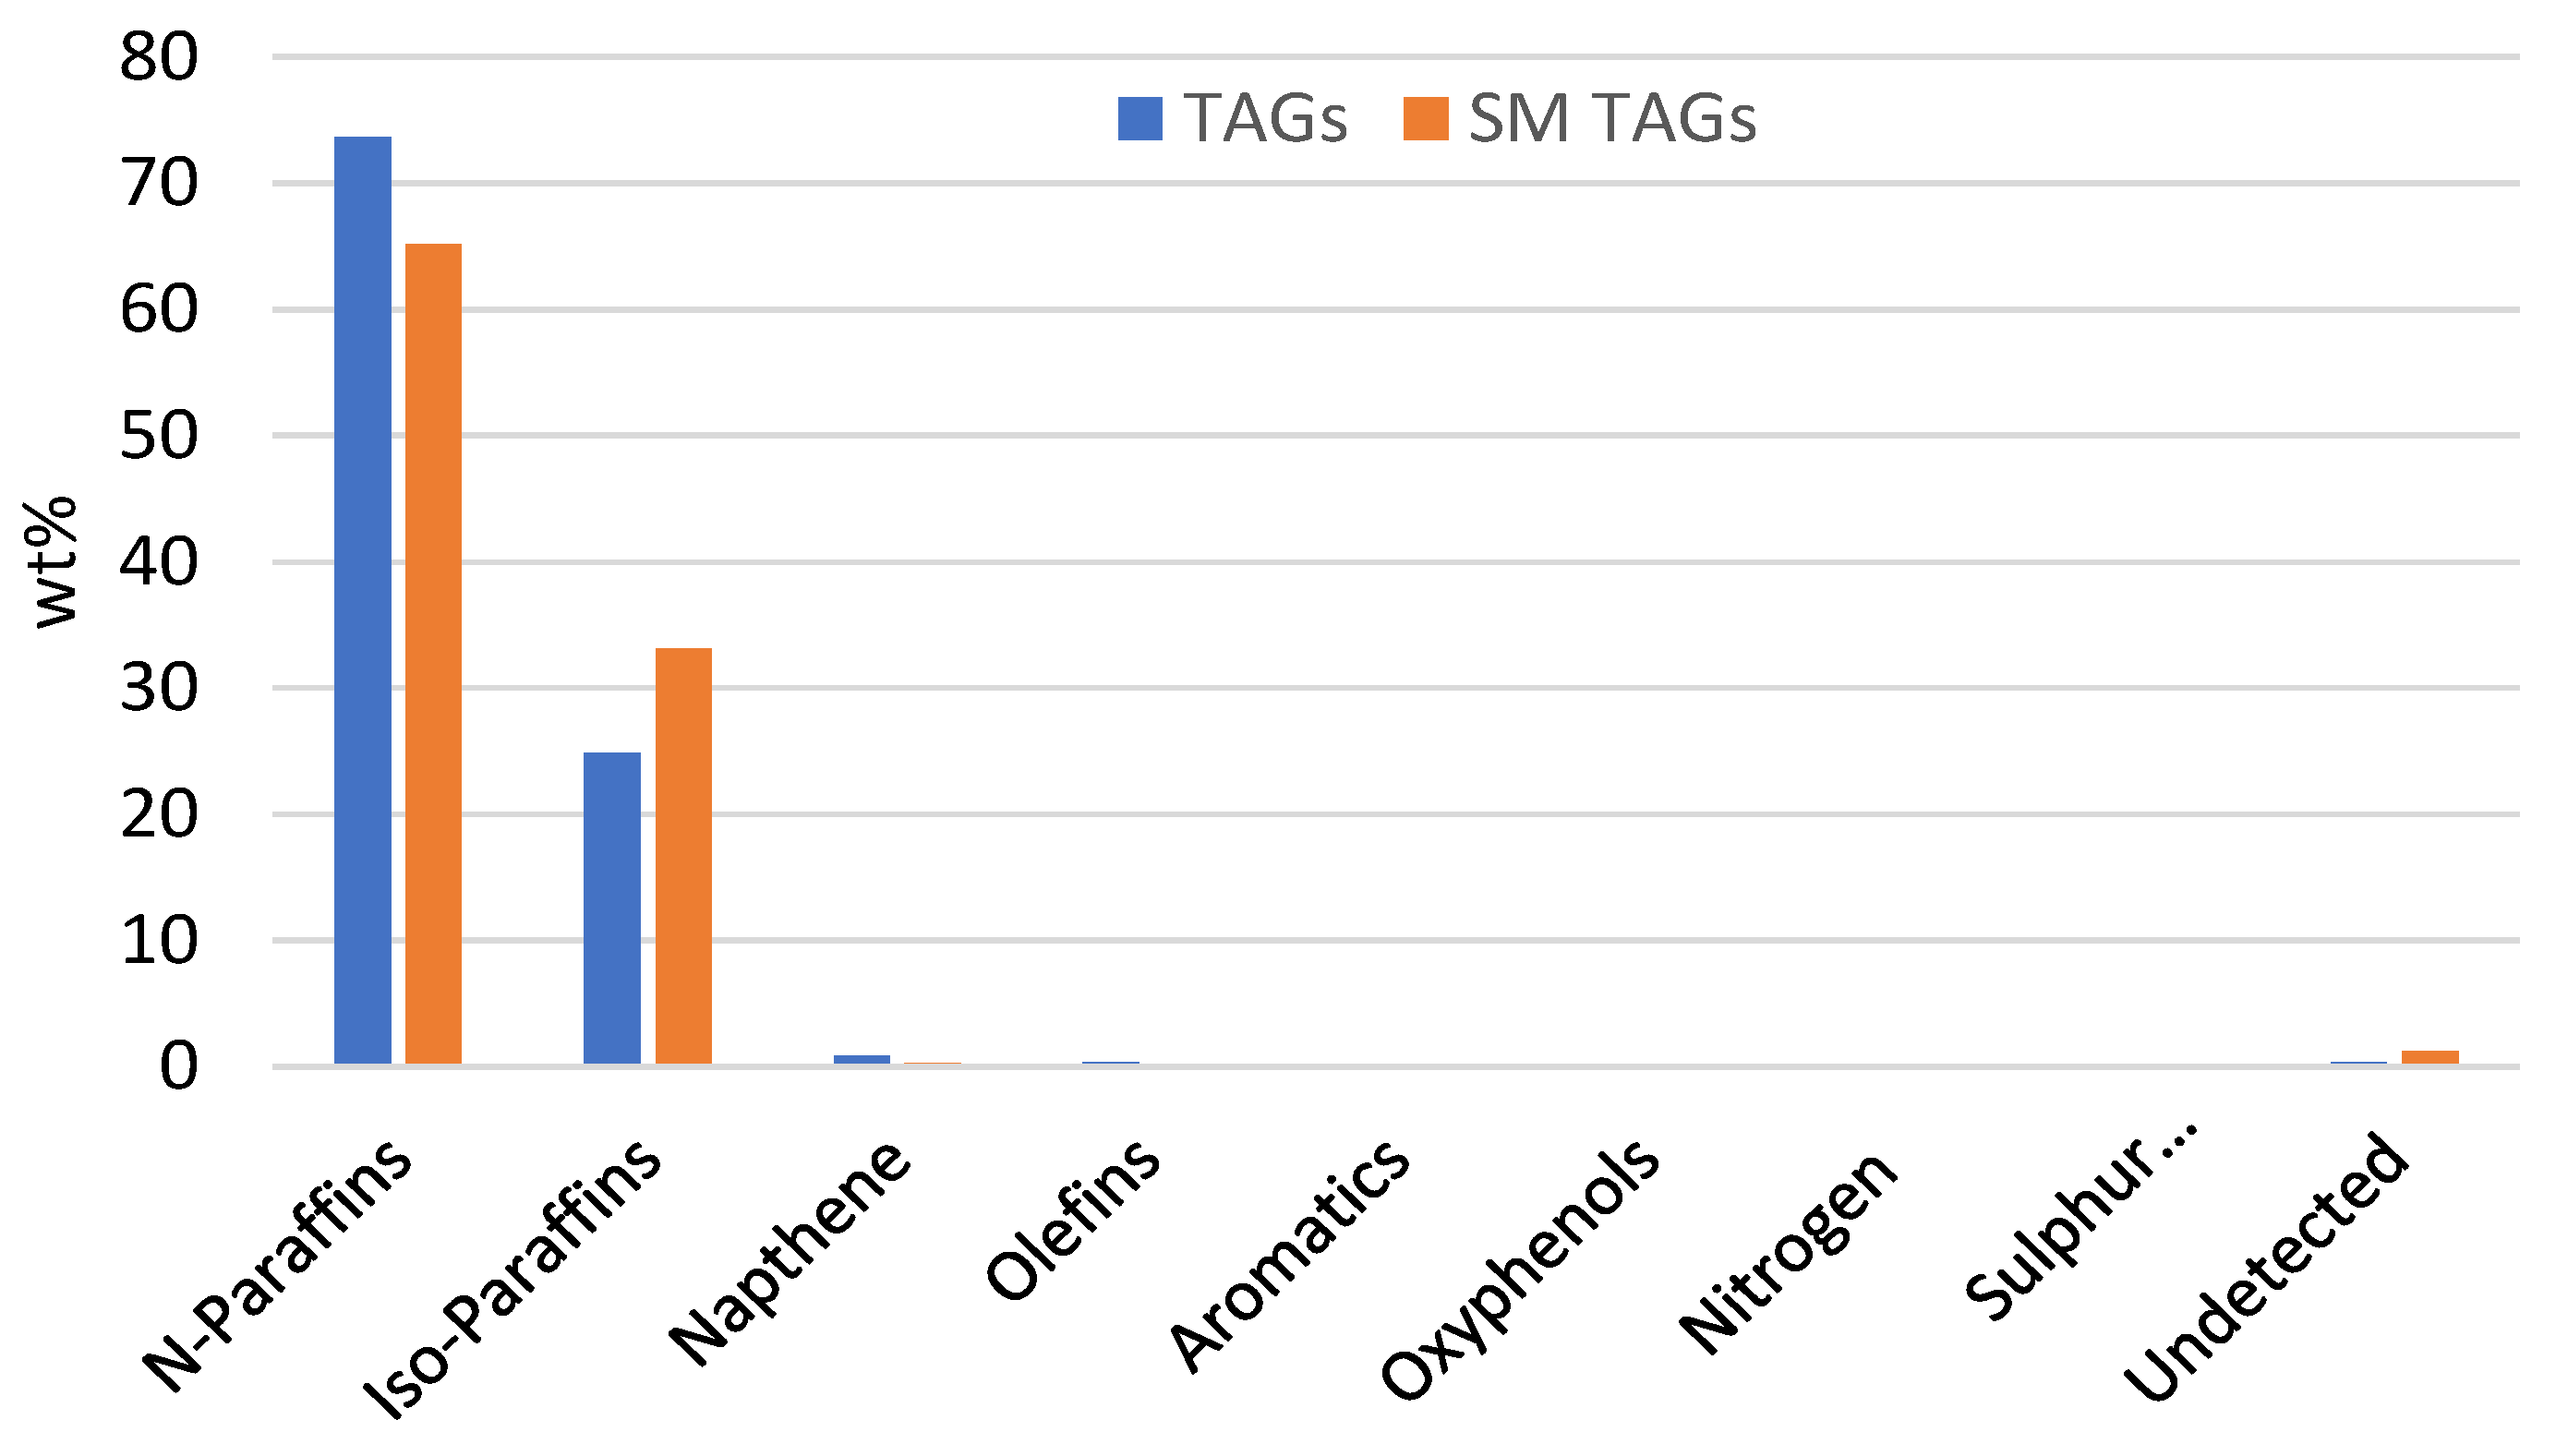
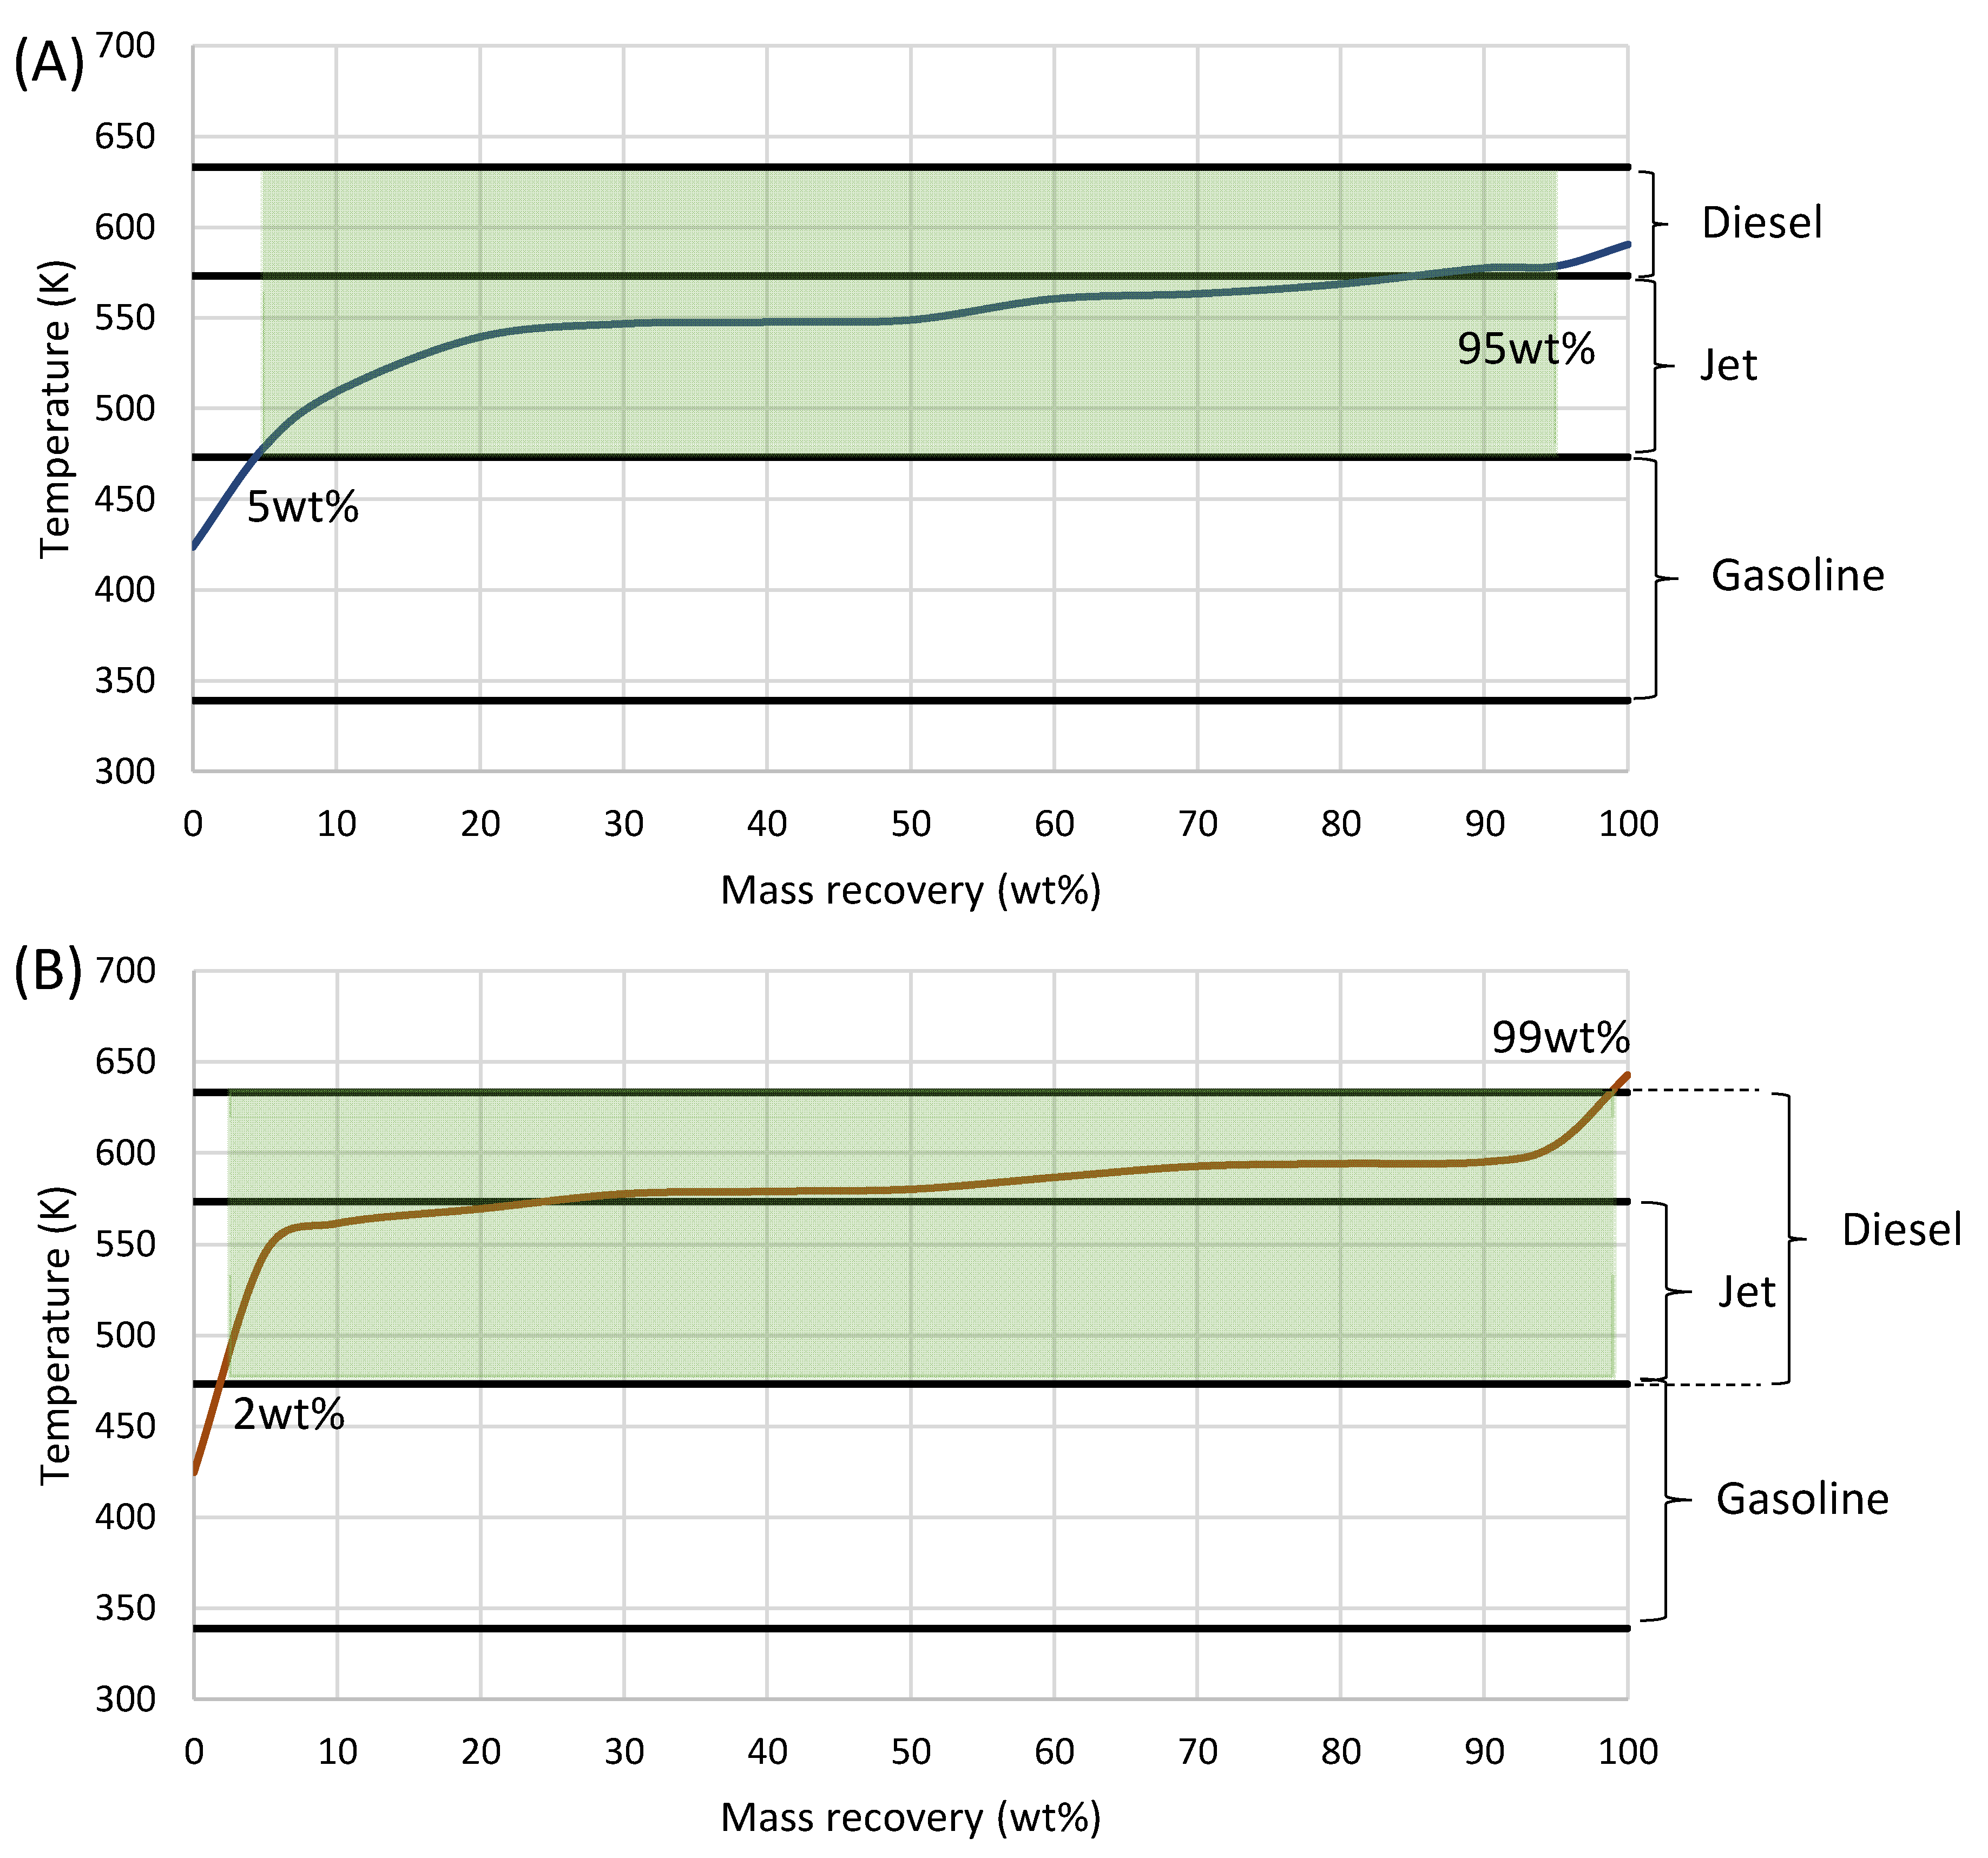
3.3. TRL 5 Scale-Up—Production

The experiments performed on the TRL 4 unit showed that the SM TAGs can simulate the TAGs with high accuracy, leading to similar organic liquid products. Furthermore, the prescreening test showed that the optimum operating window for the hydrotreatment of the TAGs and the SM TAGs is condition 3 at 643 K, 13.78 MPa, 1 h−1, and 5000 scfb. In the next phase, the current findings were extended to a higher-scale unit TRL 5, while the same catalytic system was loaded, utilizing the SM TAGs as a feedstock (due to the limited availability of TAG quantities). The production run on the TRL 5 unit lasted 33 days in a stream of continuous operation. The total liquid product that was collected consisted of the organic and the aqueous phases. The aqueous phase was mechanically removed via gravity. Table 5 presents an average mass balance from the unit operation. It is easily observed that the mass closure is 97%; this is due to the measurement errors from the different analytical instruments that were used to calculate the mass flows between the products and the feed. However, for a TRL 5 pilot plant, the 97% mass closure is very high. Furthermore, it can be observed that from 1 g of feed, 0.87 g of organic product is produced, as the aqueous phase is approximately 10% v/v of the total liquid product. The organic phase of all days on stream was blended, leading to a total organic liquid product of approximately 300 L.
The operation of the TRL 5 unit, as well as the catalyst life, was monitored via the sulfur content on the daily products. Figure 9 presents the sulfur content of all products during the experiments, also including the max limits of EN590 and EN15940 for the road transport market diesel and the paraffinic fuels, respectively, for comparison reasons. According to the results of sulfur content, the catalyst life as well as the operation of the unit were constant during the 33 days of run. In general, the sulfur content in the products was very low and below the max limits of EN590 and EN15940 specifications. No DP was observed during the operation, nor was there any coke formation on the catalyst. These results are important, confirming the scaling up of the tested technology to TRL 5 and moving the proposed technological approach closer to commercialization.
The total liquid product from the TRL 5 HDT plant (~300 L) was fractionated in a batch fractionation unit, as described in Section 2.4.3, in order to separate the jet from the diesel fraction. Particularly, the jet fraction range is from 473 K to 573 K, while the diesel fraction range is from 573 K to 633 K. It should be noted here that the diesel-range fraction can also range from 473 K to 633 K, including the jet fraction, if the target is only the diesel fuel production. The fractionation of the 300 L hydrotreated product was completed via several runs. The fractions were blended in two different barrels, one for the jet fuel and one for the diesel fraction. In the last phase of the study, two samples were collected, one of each fraction, to be analyzed and compared with the fuel specifications.
The mass recovery curve from the two fractions is presented in Figure 10A for the jet fuel and in Figure 10B for the diesel fuel. The jet fraction (Figure 10A) consists of 90 wt% jet-boiling-range hydrocarbons, 5 wt% lighter-boiling-range hydrocarbons in the gasoline range, and 5 wt% heavier-boiling-range hydrocarbons in the diesel range. In the case of the diesel fraction, it seems that the diesel fraction from 573–633 K is 74 wt%, while there is 1 wt% heavier-, 23 wt% jet-, and 2 wt% gasoline-range hydrocarbons. However, it should be noted that sometimes when the targeted product is only the diesel fraction, the range can be considered from 473 to 633 K, also including the jet fraction on the diesel part. Considering this, the diesel fraction consists of 97 wt% diesel-, 1 wt% heavier-, and 2 wt% gasoline-range hydrocarbons. In general, the fractionation of the total organic liquid product was successful. In the next step, the two fractions were evaluated and compared with the fuel specifications, as presented in Table 6. More specifically, Table 6 presents the Jet A1 specs for aviation fuels, the EN590 specs for road transport market diesel, the DMA specs for marine diesel fuel, and the EN15940 specs for HVO paraffinic fuel, also including the results from the jet and diesel fractions of the current study. As far as the jet fraction is concerned, all the measured properties fulfill the Jet A1 specifications. More specifically, the density is similar (775 kg/m3) to the minimum value for the Jet A1 specs, viscosity is lower (2.53 mm2s−1) than 8 mm2s−1, the sulfur content is much lower (0.0004 wt%) compared to the Jet A1 specs (0.3 wt%), the flash point is much higher (391 K) compared to the minimum value for Jet A1 specs (>311 K), and the calorific value is higher (46.37 MJ/kg) compared to the minimum value for Jet A1 specs (>42.8 MJ/kg). In general, the jet fraction produced during the study can be characterized as a high-quality advanced aviation fuel that can be used as an improver additive (drop-in fuel) in fossil jet fuel.
The diesel fraction was compared with the DMA specifications for marine fuels and with the specifications of the EN590 for the fossil market road transport diesel, as well as with the specifications of the EN15940 for HVO paraffinic fuels. The reason is that the diesel fraction presents better properties compared to the fossil counterparts. More specifically, the produced diesel fraction has a much higher calorific value (46.37 MJ/kg) compared to the road transport diesel EN590 (43.8 MJ/kg). Furthermore, the cetane number is much higher (78.9) than the DMA and the EN590 (>40) specifications, but also higher compared to the minimum value of the EN15940 for paraffinic fuels (>70). The viscosity fulfills the requirements from all types of diesel fuels (EN590, EN15940, and DMA); in addition, the flash point is really high, approximately ~391 K, while, finally, the most important parameter, the sulfur content, is below 5 wppm, fulfilling even the strictest requirements of the EN15940 (<5 wppm). Based on these findings, it is evident that the diesel fraction is a high-quality advanced drop-in diesel fuel that can be used either as a road transport substitute or as a blending component improver for fossil diesel fuel. Additionally, it is suitable for use as a high-quality bunker fuel or as an additive to improve the quality of commercial marine diesel.

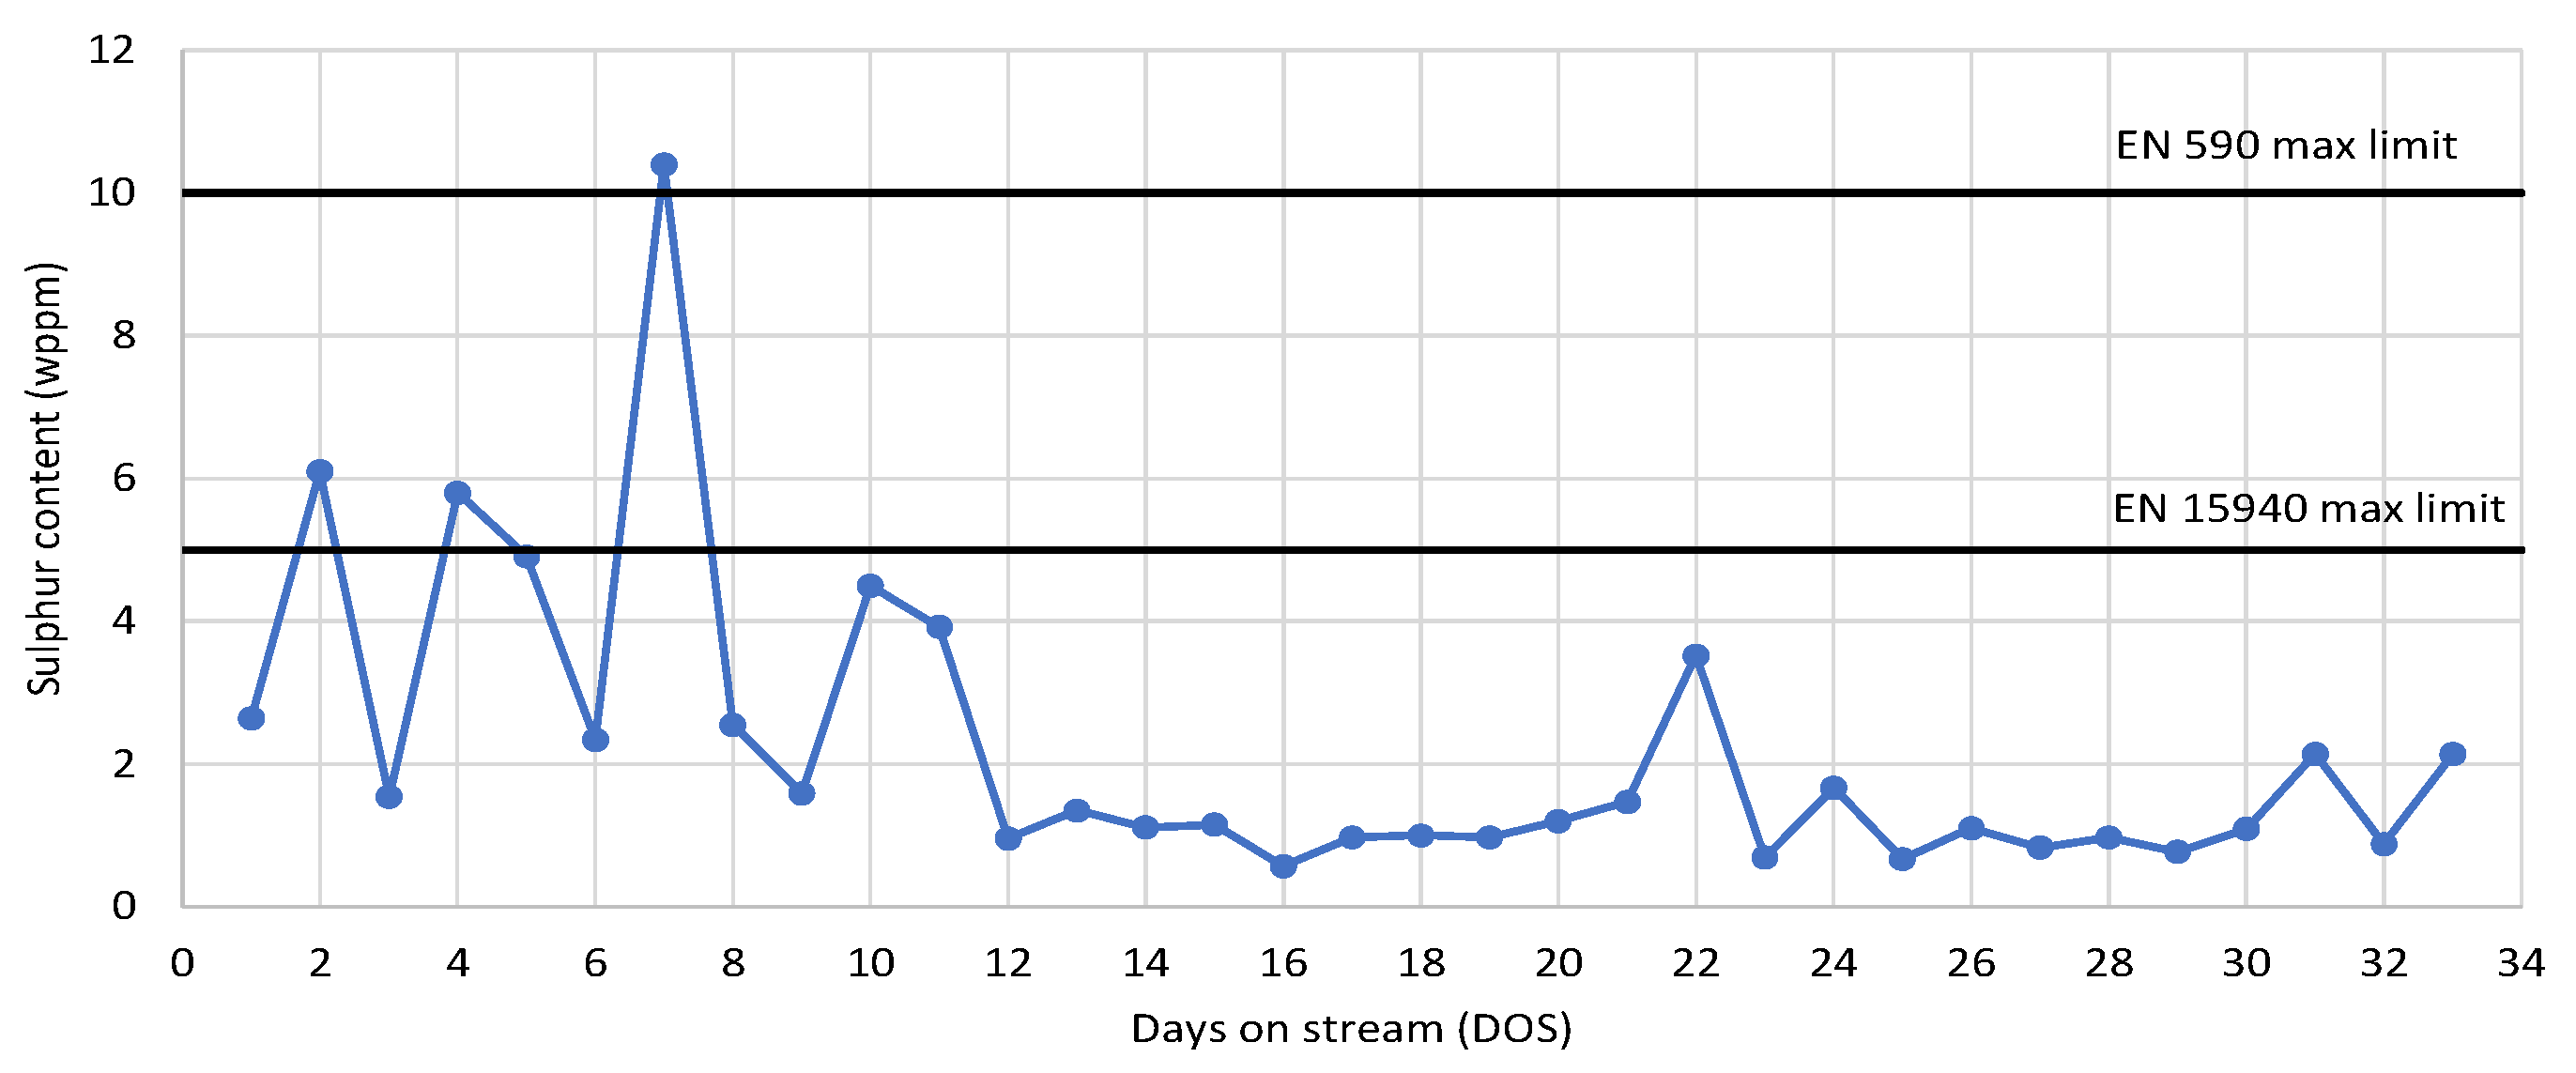
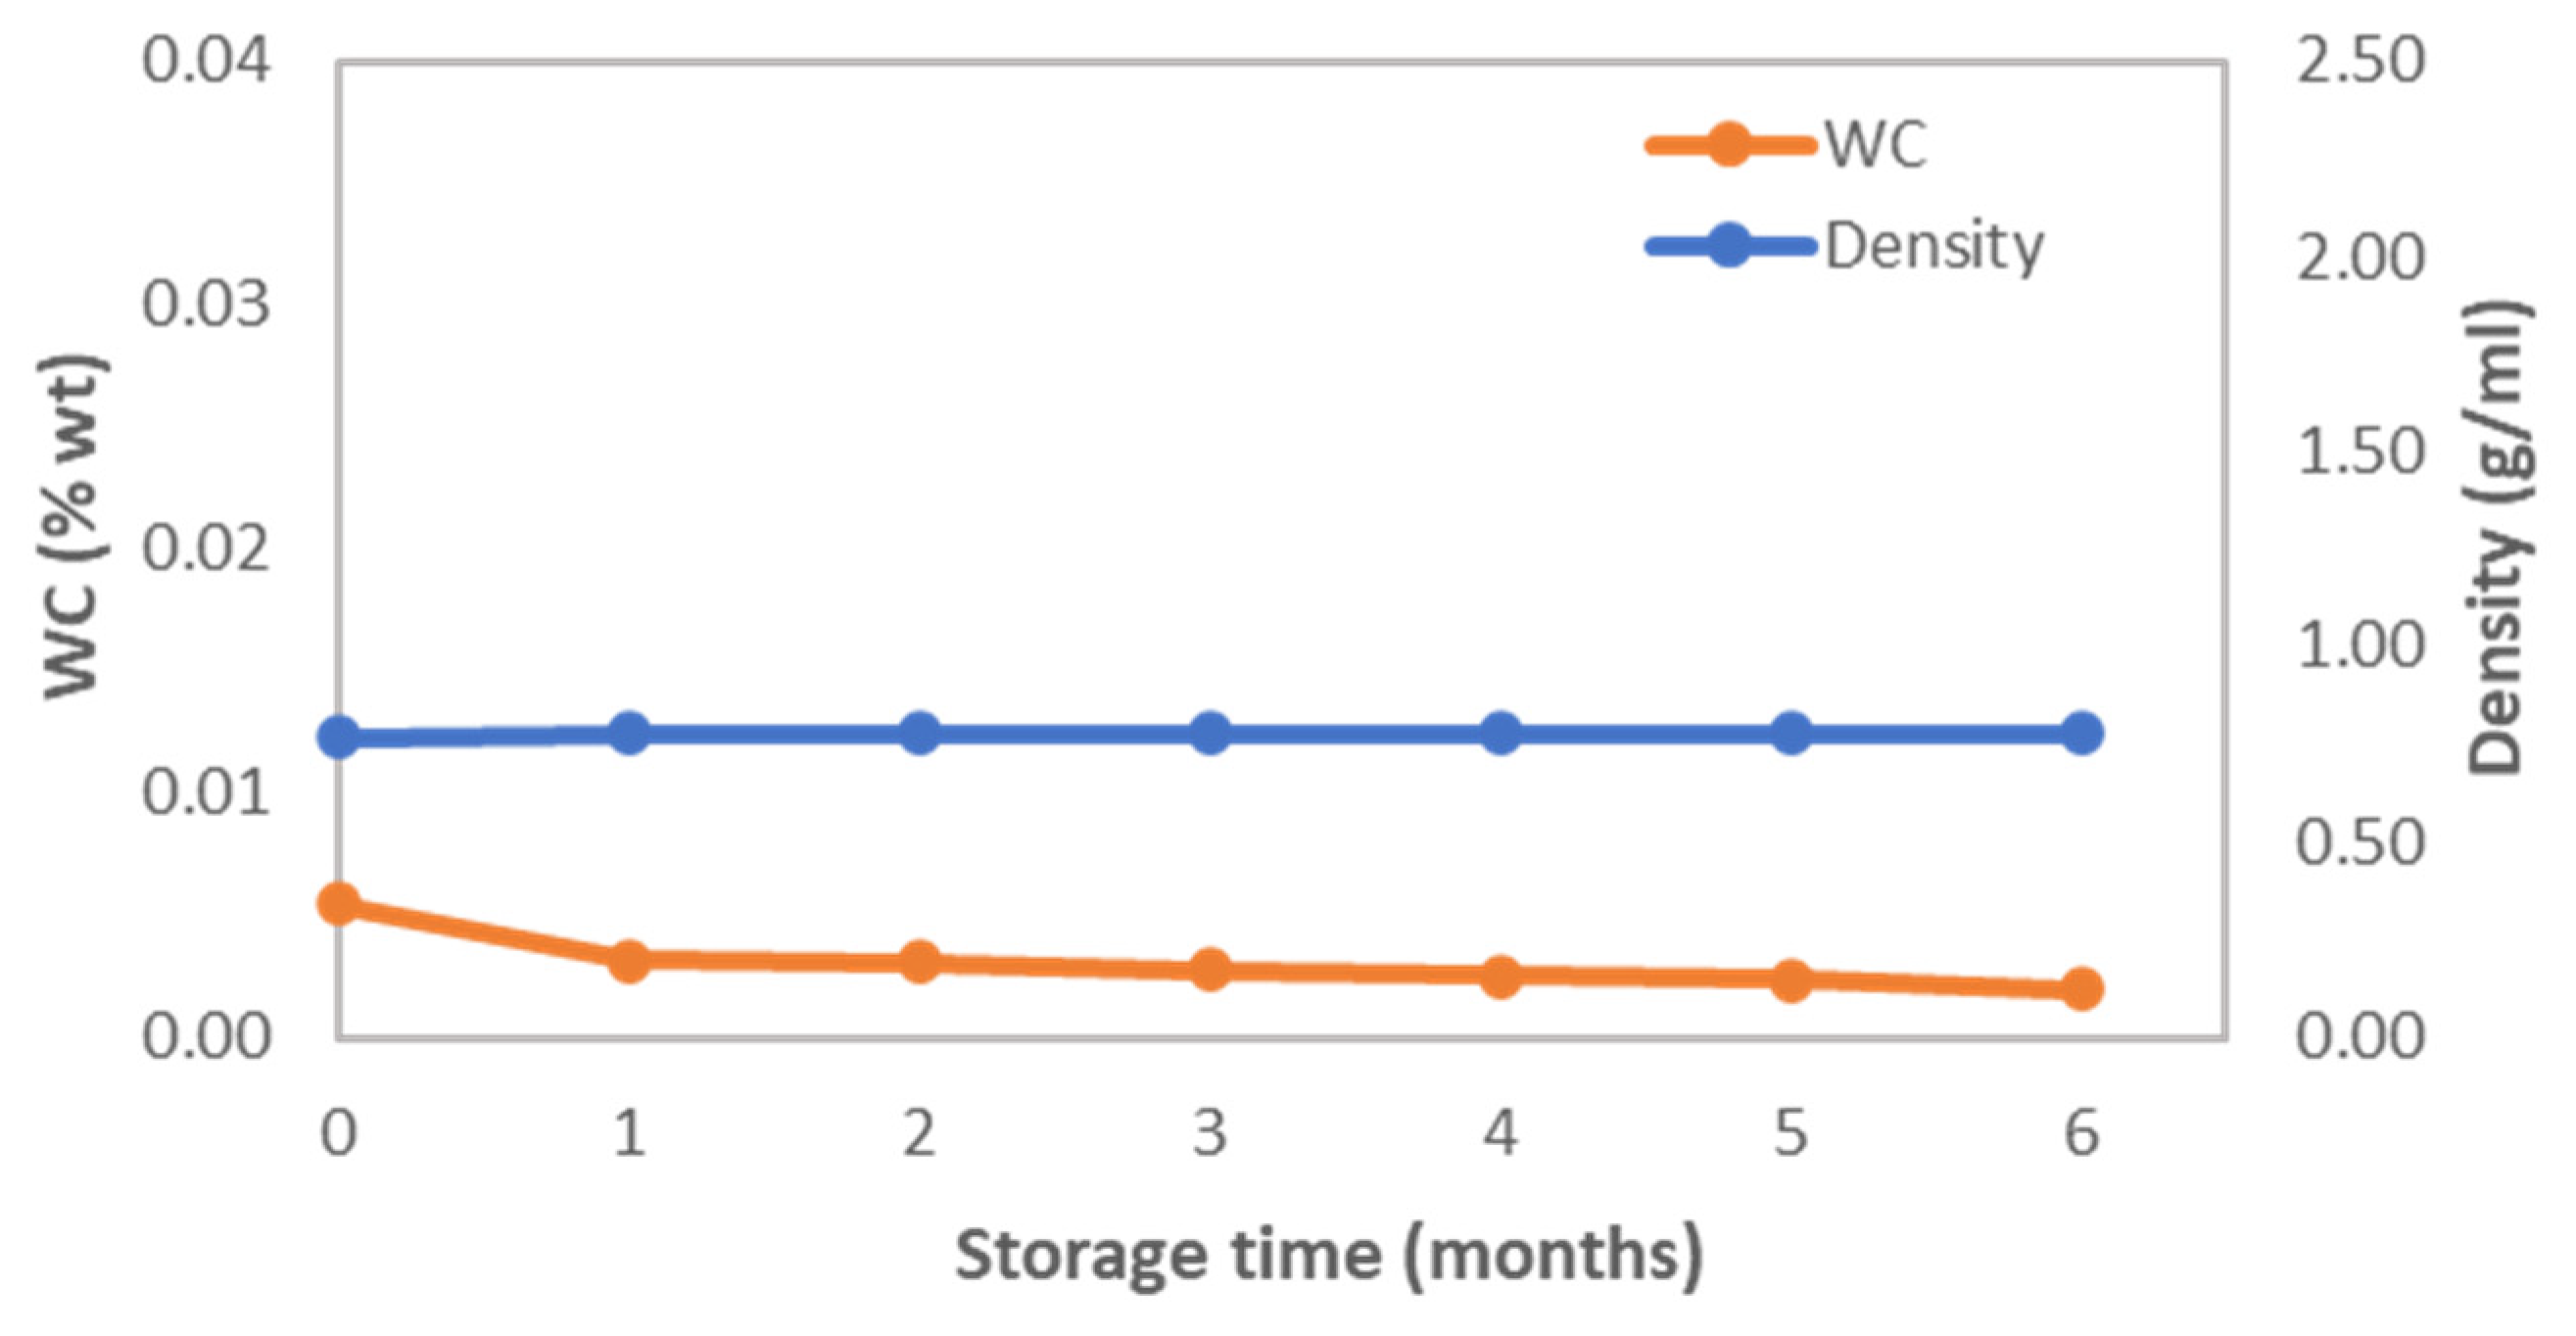
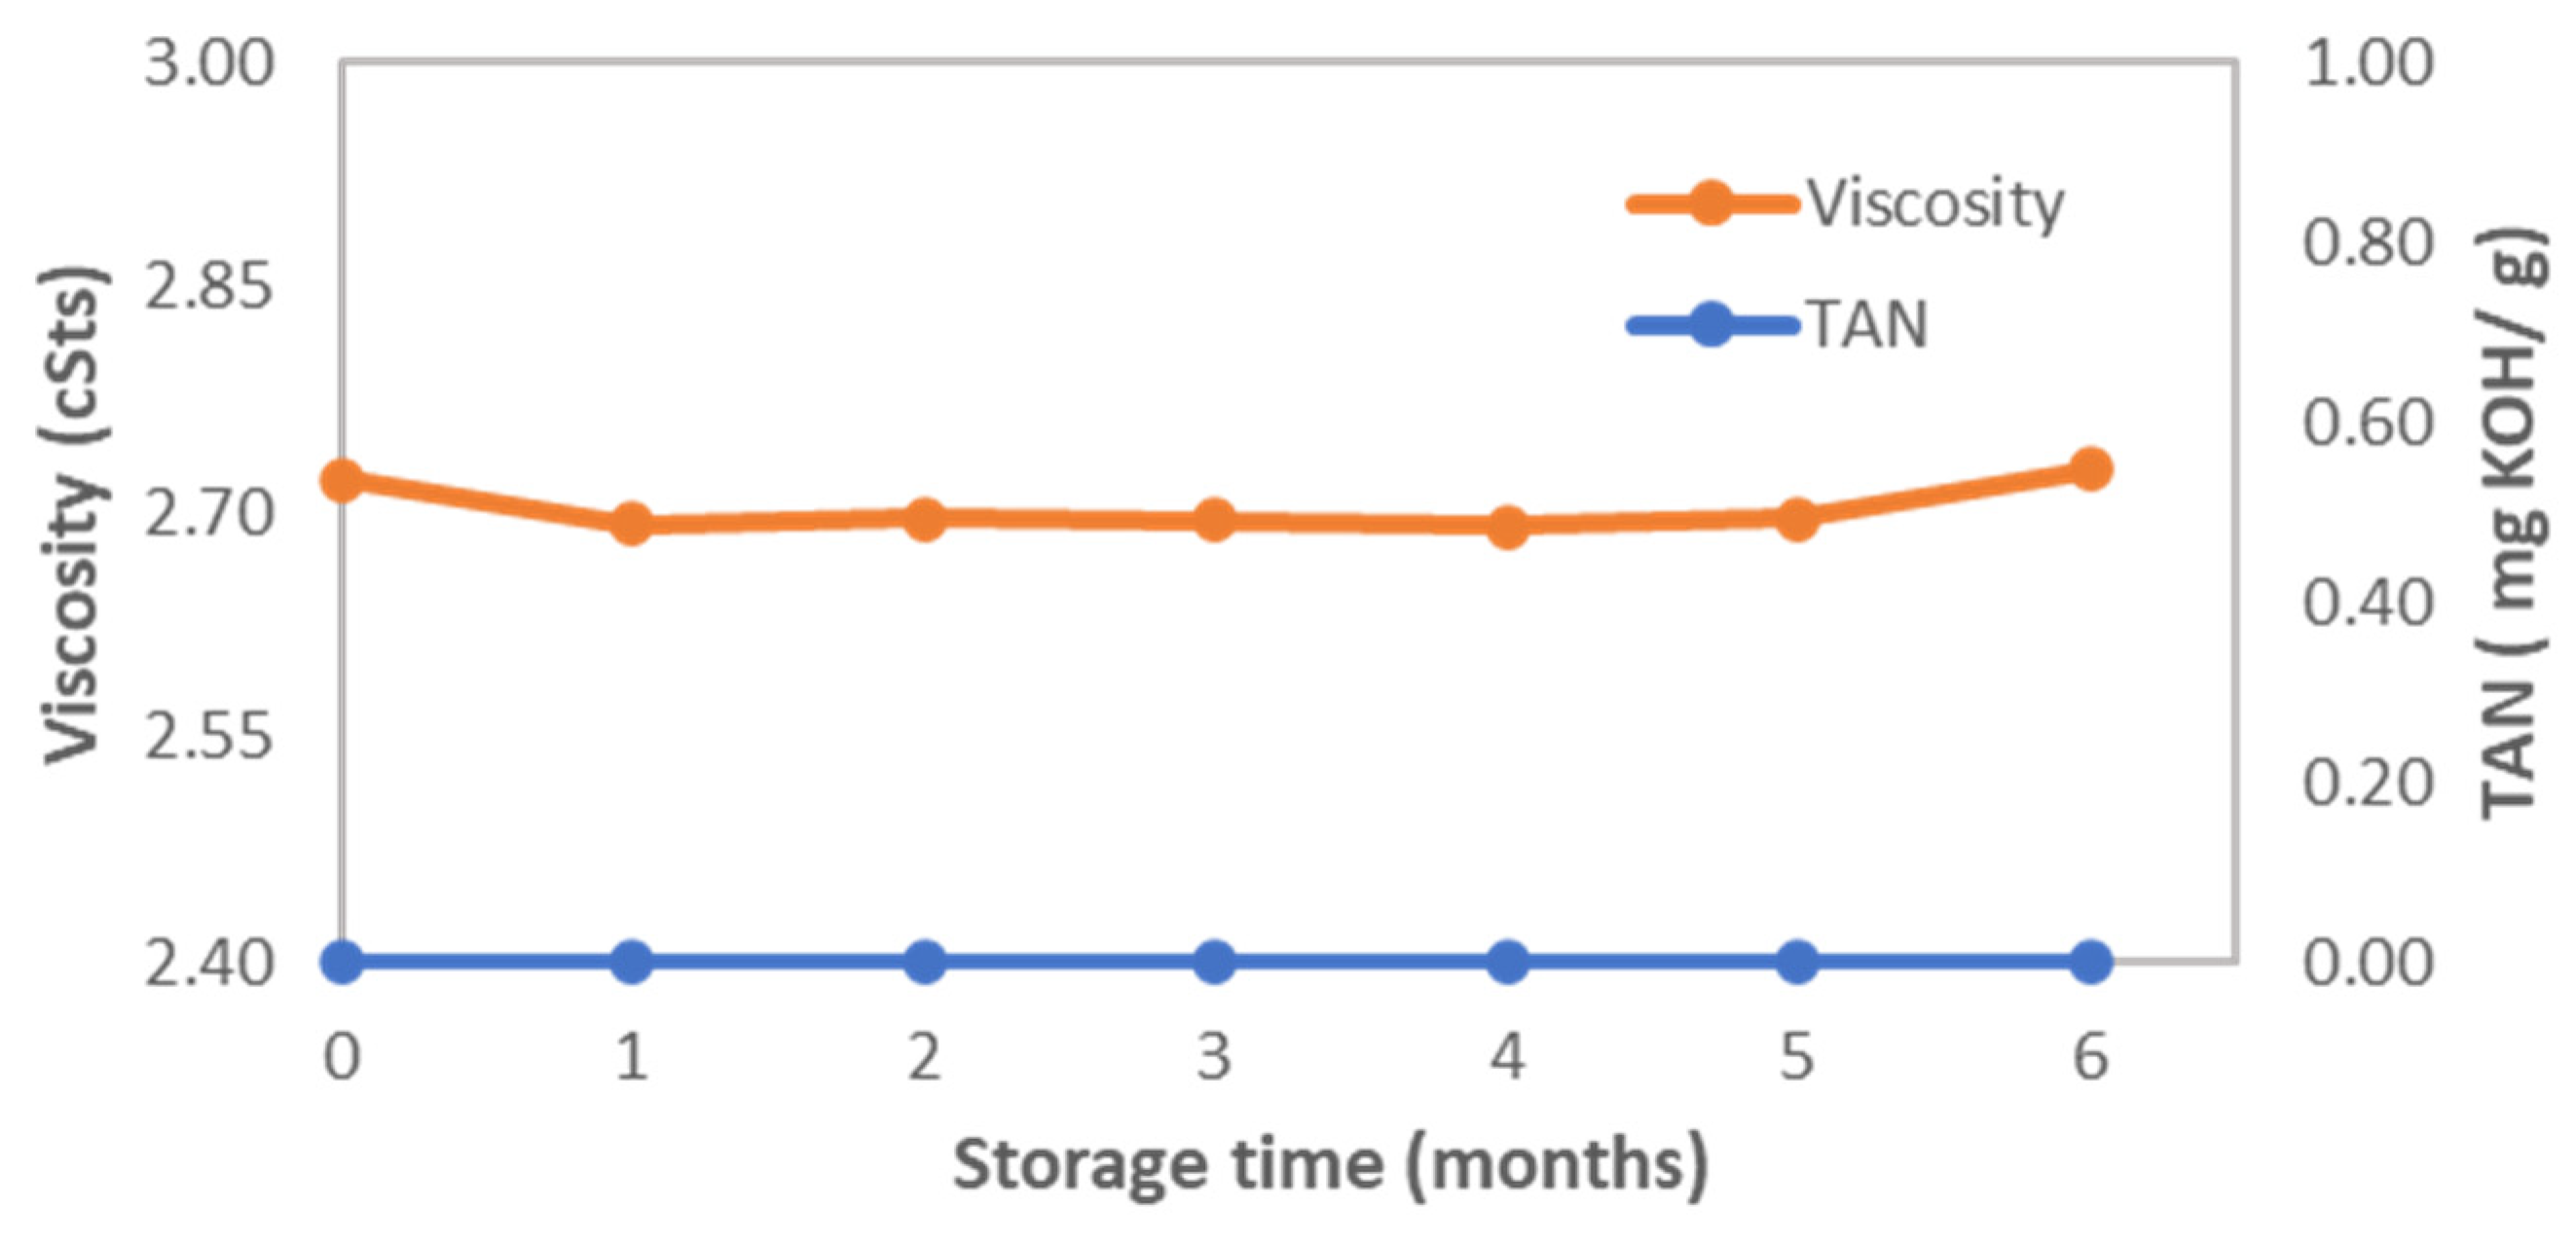
3.4. Storage Stability Study

For the stability study, the product derived from the TRL 4 experiments with TAGs was selected (optimum condition 3). During storage, the product remained transparent, while solids were not formed. The results are presented in Figure 11 and Figure 12, showing the product stability over time. The TAN variation over time is negligible, pointing to limited oxidative variations. Moreover, the other monitored properties did not present a noticeable difference, further verifying the product’s stability while maintaining its quality. Therefore, it can probably be inferred that the TAGs hydrotreated products are stable and their storage is feasible for a maximum period of 6 months, whereas regular monitoring of their quality characteristics is suggested.

4. Discussion

The current manuscript aimed to investigate the production of advanced renewable drop-in fuels from the hydroprocessing of microbial oils (TAGs) up to the TRL 5 scale. The studies in this research field are limited mostly to batch reactors or low TRL pilot plants. Thus, this research is focused on filling this gap in the literature by providing useful operation data up to TRL 5, which would help to move the technology one step closer to commercialization. To that aim, in the first phase of the research, the optimization of the hydrotreatment technology was studied on a TRL 4 continuous operation hydrotreatment pilot plant where the upgrading of the TAGs was investigated via several operating conditions. The TAGs were successfully converted to 65–73 wt% n-paraffins and 24–33 wt% iso-paraffins. In accordance with the findings, the reduction in the operating temperature leads to less cracking reactions and thus heavier hydrocarbons in the products, confirming the results from various studies that have tested the hydrotreatment of lipid-based feedstocks targeting aviation fuel production [33]. Furthermore, a minor effect on the product quality was observed from the changes in the reactor pressure. These results are is in agreement with other studies that have investigated the hydrotreatment upgrading of triacylglycerides to advanced fuels [34,35]. As far as the LHSV is concerned, it was found that the reduction in the LHSV from 1 h-1 to 0.5 h−1 has led to more hydrocracking reactions as the retention time was increased. However, the lower LHSVs demand bigger reactors and thus higher investment costs for the same unit capacity. The optimum operating window was noticed at 643 K, 13.78 MPa, 1 h−1 and 5000 scfb, leading to a product that consists of jet- and diesel-range hydrocarbons. The findings are in accordance with previous studies that that have investigated the conversion of other lipid-based feedstocks that present similar characteristics with the TAGs [8,12,31,32,33,34,35].
In the next phase, the target was to scale-up the process on a TRL 5 continuous operation hydrotreatment pilot plant. Nevertheless, due to the limited TAGs availability, the feedstock was simulated via a blend of four commercial oils (42.89 wt% palm oil, 3.44 wt% flaxseed oil, 30.75 wt% olive oil, and 22.92 wt% pumpkin seed oil). The analysis of the two feeds showed that the blended feed matches almost 80% of the free fatty acid composition of the real TAGs. Therefore, it can be assumed that the prepared blended feed can almost perfectly simulate the two core FFAs of the microbial oil TAG, the palmitic acid and the oleic acid, with an error close to the detectable measurement limits. According to the properties, the two feedstocks present similar results. The density, the elemental composition, and the simulated distillation curve are very similar between the two feedstocks; only the total acid number presents some deviations. To investigate the efficiency of the simulated feed (SM TAGs) to simulate the real TAGs, both feeds (TAGs and SM TAGs) were tested over several operating hydrotreatment conditions. The hydrotreatment results showed that similar-quality liquid products can be produced from both feedstocks. However, the hydrogen consumption of the SM TAGs was higher compared to that of the real TAGs. The reason is that the SM TAGs consist of 10 wt% higher amount of linoleic acid (C18:2) that consists of double bonds, while the TAGs have almost 10 wt% higher stearic acid (C18:0) with no double bonds. Thus, the hydrogen consumption for the SM TAGs is higher compared to the TAGs, in order to break the higher number of the double bonds present in linoleic acids.
In the last phase, the process was scaled up on a TRL 5 pilot plant, utilizing 300 L from the SM TAGs. The resulting total liquid product was a two-phase liquid consisting of the organic and the aqueous phases. The aqueous phase was separated from the organic phase via gravity. The organic phase was further inserted in a batch fractionation unit to separate the jet from the diesel fraction. Additionally, the organic phase of the products was also examined in terms of storage assessment, exhibiting noticeable stability over the 6-month storage period at ambient conditions, as verified by the monitoring of its qualitative properties. The two fractions (jet and diesel) were analyzed and compared with the Jet A1 specifications for aviation kerosene, the DMA specifications for marine diesel, the EN590 specifications for road transport diesel, and the EN15940 specifications for the HVO paraffinic fuel. The results showed that the diesel fraction is characterized by a higher cetane number (78.9) and higher heating value (46.37 MJ/kg) compared to the commercial fossil diesel (cetane number: >40, HHV: 43.8 MJ/kg), exhibiting improved combustion performance on diesel car engines [39]. In addition, the fact that the produced advanced diesel fuel is paraffinic and iso-paraffinic can lead also to emission benefits, compared to fossil diesel, during its combustion in diesel car engines [40]. In general, the produced advanced diesel fraction is a high-quality fuel that can be used either as a road transport substitute or as a blending component improver for the fossil diesel fuel. But, it can also be used as a high-quality bunker fuel or as an improver for commercial marine diesel.
In the case of the jet fraction, this was compared with the specifications for Jet A1. All the properties measured in the manuscript fulfill the Jet A1 specifications. The most important property for aviation fuels is the freezing point, which, according to the Jet A1 specs, should be −313 K. However, the freezing point of the advanced jet fraction was not measured as the laboratory is not equipped with the required analytical instrument for the freezing point analysis. In general, according to the results, the jet fraction produced during the study can be characterized as a high-quality advanced aviation fuel that can be used either as a drop-in fuel in the fossil jet or as an improver additive. In general, the technology was successfully scaled up to TRL 5, rendering the research closer to commercialization. However, further research is required on the process optimization and TAG testing at plants higher than the TRL 5 level prior to the commercial application of the technology.

5. Conclusions

This study was aimed at the production of advanced road transport, maritime, and jet fuels via hydrotreating of microbial oil utilizing green H2. In the first step, the hydrotreatment technology was evaluated and optimized on a TRL 4 plant. The results showed that the optimal hydroprocessing conditions are 13.78 MPa pressure, 643 K temperature, 1 h−1 LHSV, and 5000 scfb H2/oil ratio. In the next step, the process was scaled up on a TRL 5 hydrotreatment plant. Due to the limited TAGs availability, a simulated feedstock was created by blending various commercial oils to simulate the TAGs FFAs composition. According to the findings, the microbial oil FFAs composition was effectively simulated via a blend of four commercial oils, including 42.89 wt% palm oil, 3.44 wt% flaxseed oil, 30.75 wt% olive oil, and 22.92 wt% pumpkin seed oil. The hydrotreating of the real microbial oil and the simulated feed rendered similar-quality liquid products. As a result, the simulated TAGs were utilized in the TRL 5 plant. The technology was successfully scaled up in the TRL 5 hydrotreatment plant, leading to 300 L of organic liquid product. In addition, according to the storage stability study, the organic liquid product exhibited noticeable stability over the 6-month storage period at ambient conditions, while its quality was not deteriorated. In the next step, the 300 L of the organic liquid product was successfully fractionated on a batch fractionation unit, leading to the separation of the diesel and jet fractions. The diesel fraction was compared with the specifications of the EN590 for road transport diesel, of the DMA for marine diesel, and of the EN15940 for HVO paraffinic fuels. The results underline that the diesel fraction is a high-quality advanced diesel fuel that can be utilized either as a road transport or maritime substitute or as a blending component improver for fossil diesel fuel. Finally, the jet fraction was compared with the specifications for the Jet A1, and the results showed that it is a high-quality advanced aviation fuel that could be utilized as a drop-in fuel in fossil jets or even as an improver additive.

Author Contributions

A.D.: Methodology, formal analysis, writing—original draft, investigation, validation, data curation, writing—review and editing. L.P.C.: Methodology, formal analysis, investigation, writing—review and editing, I.K.: Methodology, formal analysis, investigation. N.T.: Data curation, investigation. S.B.: Conceptualization, validation, writing—review and editing, supervision, project administration. All authors have read and agreed to the published version of the manuscript.

Funding

This research was funded by the European Union’s Horizon 2020 research and innovation programme under Grant Agreement No 884208. Project name “BioSFerA” (Biofuels production from Syngas FERmentation for Aviation and maritime use).

Data Availability Statement

The original contributions presented in the study are included in the article; further inquiries can be directed to the corresponding author.

Conflicts of Interest

The authors declare no conflicts of interest.

Abbreviation

CERTHCentre for Research & Technology Hellas
CPERIChemical Process & Energy Resources Institute
DFBDual fluidized bed
DMDSDimethyl-disulphide
DOSDays on stream
DPDrop pressure
FAMEFatty acid methyl ester
GCGas chromatograph
HDOHydrodeoxygenation
HDTHydrotreating
HHVHigher heating value
HVOHydrotreated vegetable oils
LAGOLight atmospheric gas oil
LHSVLiquid hourly space velocity
NDANondisclosure agreement
SM TAGsSimulated triacylglycerides
TAGsTriacylglycerides
TANTotal acid number
TBATetra-butyl-amine
TRLTechnology readiness level
WCWater content

References

  1. Li, X.; Mupondwa, E.; Tabil, L. Technoeconomic analysis of biojet fuel production from camelina at commercial scale: Case of Canadian prairies. Bioresouce Technol. 2018, 249, 196–205. [Google Scholar] [CrossRef] [PubMed]
  2. Ioannidou, S.M.; Pateraki, C.; Ladakis, D.; Papapostolou, H.; Tsakona, M.; Vlysidis, A.; Kookos, I.K.; Koutinas, A. Sustainable production of bio-based chemicals and polymers via integrated biomass refining and bioprocessing in a circular bioeconomy context. Bioresour. Technol. 2020, 307, 123093. [Google Scholar] [CrossRef] [PubMed]
  3. Perin, G.; Jones, P.R. Economic feasibility and long-term sustainability criteria on the path to enable a transition from fossil fuels to biofuels. Curr. Option Biotechnol. 2019, 57, 175–182. [Google Scholar] [CrossRef] [PubMed]
  4. Kumar, S.; Tirlangi, S.; Kumar, A.; Imran, M.; Pillai HP, J.S.; Koshariya, A.K.; Sathish, T.; Ubaidullah, M.; Ayub, R.; Reddy, V.R.M.; et al. A review on the contribution of nanotechnology for biofuel production from algal biomass: A bridge to the reduction of carbon footprint. Sustain. Energy Technol. Assess. 2023, 60, 103498. [Google Scholar] [CrossRef]
  5. Elgharbawy, B.S.; Sadik, W.A.; Sadek, O.M.; Kasaby, M.A. A review on biodiesel feedstocks and production technologies. J. Chil. Chem. Soc. 2021, 66, 5098–5109. [Google Scholar] [CrossRef]
  6. Sajjadi, B.; Chen, W.-Y.; Aziz, A.; Raman, A.; Ibrahim, S. Microalgae lipid and biomass for biofuel production: A comprehensive review on lipid enhancement strategies and their effects on fatty acid composition. Renew. Sustain. Energy Rev. 2018, 97, 200–232. [Google Scholar] [CrossRef]
  7. Zhou, Y.; Remon, J.; Jiang, Z.; Matharu, A.S.; Hu, C. Tuning the selectivity of natural oils and fatty acids/esters deoxygenation to biofuels and fatty alcohols: A review. Green Energy Environ. 2023, 8, 722–743. [Google Scholar] [CrossRef]
  8. Carmona-Cabello, M.; Garcia, I.L.; Papadaki, A.; Tsouko, E.; Joutinas, A.; Dorado, M.P. Biodiesel production using microbial lipids derived from food waste discarded by catering services. Bioresour. Technol. 2021, 323, 124597. [Google Scholar] [CrossRef]
  9. Detsios, N.; Theodoraki, S.; Maragoudaki, L.; Atsonios, K.; Grammelis, P.; Orfanoudakis, N.G. Recent Advances on Alternative Aviation Fuels/Pathways: A Critical Review. Energies 2023, 16, 1904. [Google Scholar] [CrossRef]
  10. El-Sawy, M.S.; Hanafi, S.A.; Ashour, F.; Aboul-Fotouh, T.M. Co-hydroprocessing and hydrocracking of alternative feed mixture (vacuum gas oil/waste lubricating oil/waste cooking oil) with the aim of producing high quality fuels. Fuel 2020, 269, 117437. [Google Scholar] [CrossRef]
  11. Wang, J.; Singer, S.D.; Souto, B.A.; Asomaning, J.; Ullah, A.; Bressler, D.C.; Chen, G. Current progress in lipid-based biofuels: Feedstocks and production technologies. Bioresour. Technol. 2022, 351, 127020. [Google Scholar] [CrossRef]
  12. Liu, H.; Han, J.; Huang, Q.; Shen, H.; Lei, L.; Huang, Z.; Zhang, Z.; Zhao, Z.K.; Wang, F. Catalytic hydrodeoxygenation of methyl stearate and microbial lipids to diesel-range alkanes over Pd/HPA-SiO2 catalysts. Ind. Eng. Chem. Res. 2020, 59, 17440–17450. [Google Scholar] [CrossRef]
  13. ASTM D1655-2024; Standard Specification for Aviation Turbine Fuels. ASTM International: West Conshohocken, PA, USA, 2024.
  14. ISO 8217:2017; Fuel Standard for Marine Distillate Fuels. ISO: Geneva, Switzerland, 2017.
  15. SIST EN 590:2022; Automotive Fuels-Diesel-Requirements and Test Methods. SIST: Ljubljana, Slovenian, 2022.
  16. SIST EN 15940:2023; Automotive Fuels—Paraffinic Diesel Fuel from Synthesis or Hydrotreatment—Requirements and Test Methods. SIST: Ljubljana, Slovenian, 2023.
  17. Detsios, N.; Maragoudaki, L.; Atsonios, K.; Grammelis, P.; Orfanoudakis, N.G. Design considerations of an integrated thermochemical/biochemical route for aviation and maritime biofuel production. Biomass Convers. Biorefinery 2023. [CrossRef]
  18. HoraceK, J.; Kubicka, D. Bio-oil hydrotreating over conventional CoMo & NiMo catalysts: The role of reaction conditions and additives. Fuel 2017, 198, 49–57. [Google Scholar] [CrossRef]
  19. Channiwala, S.A.; Parikh, P.P. A unified correlation for estimating HHV of solid, liquid and gaseous fuels. Fuel 2002, 81, 1051–1063. [Google Scholar] [CrossRef]
  20. ASTM D4052-22; Standard Test Method for Density, Relative Density, and API Gravity of Liquids by Digital Density Meter. ASTM International: West Conshohocken, PA, USA, 2022.
  21. ASTM D7169-23; Standard Test Method for Boiling Point Distribution of Samples with Residues such as Crude Oils and Atmospheric and Vacuum Residues by High Temperature Gas Chromatography. ASTM International: West Conshohocken, PA, USA, 2023.
  22. ASTM D5291-21; Standard Test Methods for Instrument Determination of Carbon, Hydrogen, and Nitrogen in Petroleum Products and Lubricants. ASTM International: West Conshohocken, PA, USA, 2021.
  23. ASTM D4294-21; Standard Test Method for Sulfur in Petroleum and Petroleum Products by Energy Dispersive X-ray Fluorescence Spectrometry. ASTM International: West Conshohocken, PA, USA, 2021.
  24. ASTM D6304-20; Standard Test Method for Determination of Water in Petroleum Products, Lubricating Oils, and Additives by Coulometric Karl Fischer Titration. ASTM International: West Conshohocken, PA, USA, 2020.
  25. ASTM E203-16; Standard Test Method for Water Using Volumetric Karl Fischer Titration. ASTM International: West Conshohocken, PA, USA, 2016.
  26. ASTM D664-18E02; Standard Test Method for Acid Number of Petroleum Products by Potentiometric Titration. ASTM International: West Conshohocken, PA, USA, 2024.
  27. ASTM D445-21; Standard Test Method for Kinematic Viscosity of Transparent and Opaque Liquids (and Calculation of Dynamic Viscosity). ASTM International: West Conshohocken, PA, USA, 2021.
  28. ASTM D976-06; Standard Test Method for calculated cetane index of distillate fuels. ASTM International: West Conshohocken, PA, USA, 2006.
  29. SIST EN 15751:2014; Automotive Fuels—Fatty Acid Methyl Ester (FAME) Fuel and Blends with Diesel Fuel—Determination of Oxidation Stability by Accelerated Oxidation Method. SIST: Ljubljana, Slovenian, 2014.
  30. ASTM D97-17; Standard Test Method for Pour Point of Petroleum Products. ASTM International: West Conshohocken, PA, USA, 2022.
  31. Lin, C.H.; Wang, W.C. Direct conversion of glyceride-based oil into renewable jet fuels. Renew. Sustain. Energy Rev. 2020, 132, 110109. [Google Scholar] [CrossRef]
  32. Xu, J.; Long, F.; Jiang, J.; Li, F.; Zhai, Q.; Wang, F.; Liu, P.; Li, J. Integrated catalytic conversion of waste triglycerides to liquid hydrocarbons for aviation biofuels. J. Clean. Prod. 2019, 222, 784–792. [Google Scholar] [CrossRef]
  33. Maki-Arvela, P.; Martinez-Klimov, M.; Murzin, D.Y. Hydroconversion of fatty acids and vegetable oils for production of jet fuels. Fuel 2021, 306, 121673. [Google Scholar] [CrossRef]
  34. Feng, F.; Niu, X.; Wang, L.; Zhang, X.; Wang, Q. TEOS-modified Ni/ZSM-5 nanosheet catalysts for hydroconversion of oleic acid to high-performance aviation fuel: Effect of acid spatial distribution. Microporous Mesoporous Mater. 2020, 291, 109705. [Google Scholar] [CrossRef]
  35. Li, X.; Chen, Y.; Hao, Y.; Zhang, X.; Du, J.; Zhang, A. Optimization of aviation kerosene from one-step hydrotreatment of catalytic Jatropha oil over SDBS-Pt/SAPO-11 by response surface methodology. Renew. Energy 2019, 139, 551–559. [Google Scholar] [CrossRef]
  36. Dimitriadis, A.; Chrysikou, L.P.; Kokkalis, A.I.; Doufas, L.I.; Bezergianni, S. Animal fats valorization to green transportations fuels: From concept to industrially relevant scale validation. Waste Manag. 2022, 143, 242–252. [Google Scholar] [CrossRef] [PubMed]
  37. Chen, Y.K.; Hsieh, C.H.; Wang, W.C. The production of renewable aviation fuel from waste cooking oil. Part II: Catalytic hydro-cracking/isomerization of hydro-processed alkanes into jet fuel range products. Renew. Energy 2020, 15, 731–740. [Google Scholar] [CrossRef]
  38. Kubička, D.; Tukač, V. Hydrotreating of Triglyceride Based Feedstocks in Refineries. In Advances in Chemical Engineering; Academic Press: Cambridge, MA, USA, 2013; Volume 42. [Google Scholar] [CrossRef]
  39. Dimitriadis, A.; Dimaratos, A.; Doulgeris, S.; Bezergianni, S.; Samaras, Z. Emissions Optimization Potential of a Diesel Engine Running on HVO: A Combined Experimental and Simulation Investigation; SAE Technical Paper No. 2019-24-0039; SAE International: Warrendale, PA, USA, 2019. [Google Scholar] [CrossRef]
  40. Dimitriadis, A.; Natsios, I.; Dimaratos, A.; Katsaounis, D.; Samaras, Z.; Bezergianni, S.; Lehto, K. Evaluation of a Hydrotreated Vegetable Oil (HVO) and Effects on Emissions of a Passenger Car Diesel Engine. Front. Mech. Eng. 2018, 4, 7. [Google Scholar] [CrossRef]
Figure 1. Free fatty acid composition of the TAGs and the SM TAGs.
Energies 17 03854 g001
Figure 2. Simplified diagram of the hydroprocessing pilot plant TRL 4 at parallel mode.
Energies 17 03854 g002
Figure 3. Simplified diagram of the hydroprocessing pilot plant TRL 5.
Energies 17 03854 g003
Figure 4. Simplified diagram of the batch fractionation unit.
Energies 17 03854 g004
Figure 5. Mass recovery curves of the TAGs and SM TAGs products.
Energies 17 03854 g005
Figure 6. Density and cetane index of the TAGs and SM TAGs products.
Energies 17 03854 g006
Figure 7. Hydrogen consumption and organic yields from the TAGs and the SM TAGs products.
Energies 17 03854 g007
Figure 8. GC MS analysis of the TAGs and SM TAGs products hydrotreatment (condition 3).
Energies 17 03854 g008
Figure 9. Sulfur content with DOS.
Energies 17 03854 g009
Figure 10. Mass recovery curves (shown with the black color straight lines are the ranges for the fossil diesel, the jet, and the gasoline): (A) for the aviation fraction (the blue color line presents the curve for the aviation/jet fraction) and (B) for the marine diesel fraction (the brown color line presents the curve for the marine diesel fraction).
Energies 17 03854 g010
Figure 11. WC and density of the TAGs hydrotreated products during storage.
Energies 17 03854 g011
Figure 12. Viscosity and TAN of the TAGs hydrotreated products during storage.
Energies 17 03854 g012
Table 1. Tested operating window.
Temperature (K)Pressure (MPa)LHSV (h−1)H2/Oil Ratio (scfb)
Condition 166313.780.55000
Condition 266313.7815000
Condition 364313.7815000
Condition 464313.780.55000
Condition 564310.340.55000
Table 2. Free fatty acid composition of TAGs and various commercial vegetable oils.
AcidsFormulaUnitsMicrobial Oil
(TAGs)
Palm OilFlaxseed OilOlive OilPumpkin Oil
LauricC12:0wt%0.000.210.000.000.00
MyristicC14:0wt%0.000.950.040.000.07
PalmiticC16:0wt%24.0041.955.4611.639.80
PalmitoleicC16:1wt%3.000.000.000.000.00
StearicC18:0wt%14.003.213.551.525.60
OleicC18:1wt%48.0040.3624.0874.3130.59
LinoleicC18:2wt%9.0010.2015.138.9052.23
LinolenicC18:3wt%2.000.2349.080.640.08
ArachidicC20:0wt%0.000.460.280.690.42
Table 3. TAGs and SM TAGs properties.
PropertiesUnitsTAGsSM TAGs
Density at 288 K g/mL0.91590.9188
Sulfurwppm65.42.84
Sulfur + DMDSwppm863.3854.1
Hydrogenwt%11.7511.86
Carbonwt%75.3776.90
Nitrogenwt%87.6083.20
Oxygenwt%12.8611.15
Water dissolvedwt%0.3730.026
TANmgKOH/g32.210.51
Viscosity at 315 KcSts46.2435.46
H/C ratio-0.1550.154
O/C ratio-0.1700.137
HHV *MJ/kg40.0140.82
Simulated distil. curve
IBOK611697
10K667862
30K871873
50K877879
70K883884
90K894887
95K901888
FBPK1012976
* Heating value was calculated based on [19].
Table 4. Gas product analysis.
TAGsSM TAGs
ConditionsConditions
1234512345
Hydrogen88.61288.59790.82893.06790.60581.27686.80789.79289.26388.567
Methane2.1321.5861.0251.1741.1184.1512.4841.4612.2421.642
Propane2.8622.7562.3231.7782.5755.0953.6452.9663.2223.343
Isobutane0.0000.5760.1100.0000.2000.0000.6440.0780.1510.306
N-Butane0.7880.4760.1270.1060.1381.1030.4390.0680.1140.203
Isopentane0.5210.8540.2940.0820.1060.8160.3940.0820.0950.173
N-Pentane0.2610.4500.1870.0470.0640.3970.2220.0640.0560.086
Carbon dioxide0.1120.5170.5960.1400.5800.3220.7630.7960.3700.801
Carbon monoxide0.0000.0370.0340.0000.0410.0250.0480.0440.0240.049
Nitrogen0.0550.0500.0450.0410.0600.0540.0520.0500.0550.050
Ethane0.4040.0000.0000.0000.0000.4120.0000.0000.0000.000
C6+0.2620.4790.3960.1900.1670.3550.4370.3520.1870.180
Table 5. Average mass balance of TRL 5 hydrotreatment plant.
UnitsMass Flows
Liquid feedg/h344.5
Hydrogen feedg/h30.7
Liquid organic productg/h299.8
Aqueous liquid productg/h33.3
Gas productg/h31.4
Mass balance%97.1
Table 6. Specifications for the Jet A1, the EN590 for market road diesel, the DMA for marine diesel, the EN15940 for paraffinic HVO fuels, and from the jet and diesel fraction of the study.
PropertiesUnitsJet A1 SpecsEN590 Road Diesel SpecsDMA Marine SpecsHVO 15,940 SpecsJet FractionDiesel Fraction
Density at 288 Kkg/m3775–840820–845<890765–800775785
Viscosity at 313 Kmm2s−1<8 *1.9–4.12.0–6.02–4.52.532.53
Cetane number-->40>40>70-78.9
Oxidation stability at 383 Kgm−3-<25<25<25--
Aromaticsv/v%<25--<1.00.0-
S contentwt%<0.3<0.0005<1.5<50.00040.0004
Flash pointK>311>325>333>323373391
Lubricity at 333 Kμm-<520<520---
Ashwt%-<0.01<0.01<0.01--
Water and sedimentv/v%-<0.05---0.0028
Calorific valueMJ/kg>42.843.8--46.9346.37
Carbon residuewt%--<0.3<0.3--
* Viscosity for jet fraction is measured at 253 K.
Disclaimer/Publisher’s Note: The statements, opinions and data contained in all publications are solely those of the individual author(s) and contributor(s) and not of MDPI and/or the editor(s). MDPI and/or the editor(s) disclaim responsibility for any injury to people or property resulting from any ideas, methods, instructions or products referred to in the content.

