Article

Particle Swarm Optimisation Algorithm-Based Renewable Energy Source Management for Industrial Applications: An Oil Refinery Case Study

by
Nelisiwe O. Mathebula
1,*,
Bonginkosi A. Thango
1 and
Daniel E. Okojie
2
1
Department of Electrical & Electronic Engineering Technology, University of Johannesburg, Johannesburg 2092, South Africa
2
Department of Electrical and Electronics Engineering, Pan-Atlantic University, Lagos 105101, Nigeria
*
Author to whom correspondence should be addressed.
Energies 2024, 17(16), 3929; https://doi.org/10.3390/en17163929
Submission received: 16 July 2024 / Revised: 1 August 2024 / Accepted: 7 August 2024 / Published: 8 August 2024
(This article belongs to the Section C: Energy Economics and Policy)

Abstract

:
Motivated by South Africa’s need for the transition to a net-zero economy, this study investigates the integration of renewable energy sources (RESs) into oil refineries, considering the unique challenges and opportunities therein. The research focuses on optimising RES allocation using particle swarm optimisation (PSO), a data-driven approach that adapts to real-time operational conditions. Traditional energy management systems often struggle with the inherent variability of RESs, leading to suboptimal energy distribution and increased emissions. Therefore, this study proposes a PSO-based renewable energy allocation strategy specifically designed for oil refineries. It considers factors like the levelised cost of energy, geographical location, and available technology. The methodology involves formulating the optimisation problem, developing a PSO model, and implementing it in a simulated oil refinery environment. The results demonstrate significant convergence of the PSO algorithm, leading to an optimal configuration for integrating RESs and achieving cost reductions and sustainability goals. The optimisation result of ZAR 4,457,527.00 achieved through iterations is much better than the result of ZAR 4,829,638.88 acquired using linear programming as the baseline model. The mean cost, indicating consistent performance, has remained at its original value of ZAR 4,457,527.00, highlighting the convergence. The key findings include the average distance measurement decreasing from 4.2 to 3.4, indicating particle convergence; the swarm diameter decreasing from 4.7 to 3.8, showing swarm concentration on promising solutions; the average velocity decreasing from 7.8 to 4.25, demonstrating refined particle movement; and the optimum cost function achieved at ZAR 4,457,527 with zero standard deviation, highlighting stability and optimal solution identification. This research offers a valuable solution for oil refineries seeking to integrate RESs effectively, contributing to South Africa’s transition to a sustainable energy future.

1. Introduction

By the year 2050, South Africa intends to have achieved net-zero carbon emissions [1,2]. This ambitious objective necessitates substantial investment and effort from private and public sectors. A significant focal point pertains to the utility industry, which presently accounts for approximately 60% of the entirety of the nation’s greenhouse gas emissions [3]. The majority of South Africa’s electricity is produced by coal-fired power facilities, a significant contributor to carbon emissions. South Africa must invest in renewable energy sources, including wind, solar, and hydroelectric power, to transition to a net-zero economy. With proper investment and policy backing, these plentiful resources have the potential to constitute a substantial component of the nation’s energy portfolio. Additionally, South Africa must prioritise the petrochemical and chemical industries, which are major contributors to the nation’s greenhouse gas emissions [4]. These sectors are highly dependent on fossil fuels and must adopt more sustainable, environmentally friendly alternatives to help South Africa reach its net-zero emissions targets. Various factors must be considered to achieve the most effective integration of renewable energy technologies into oil refinery operations. These factors include the levelised cost of energy, geographical location, available technology, plant processes, equipment lifetime, and equipment optimisation options. Insights regarding the optimal assimilation of renewable energy sources into oil refinery operations were obtained from the subsequent search results.
Conventional energy management and distribution approaches often fail to meet the precision needed to maximise the use of renewable resources. The inherent variability of renewable energy sources, such as solar and wind, required the implementation of timely decision-making processes to effectively capture and use the available energy resources. To guarantee the long-term sustainability and dependability of renewable energy sources in the industrial sector, it is essential to use innovative and data-driven methodologies. The following strategies may be used to enhance the integration of renewable energy via the utilisation of data-driven methodologies: Data-Driven Energy Solutions, Data-Driven Artificial Intelligence Techniques, Data-Driven Strategic Energy Management, and Data-Driven Next-Generation Smart Grids [5,6]. PSO can optimise the allocation of renewable energy resources by using real-time data and adapting to dynamic operating circumstances [7,8]. Electricity production using hybrid renewable energy systems (HRESs) has been optimised in numerous studies using PSO techniques. An instance of PSO was used in research to enhance the energy management system of an autonomous hybrid renewable energy system (HRES) [9]. Subsequent research presented an enhanced PSO method to optimise the arrangement of components in a freestanding solar system [10]. PSO has been used in the development of an optimum sizing algorithm for a hybrid renewable energy system. This method incorporates a smart grid load-management application, which is based on the available data [7].
Particle swarm optimisation (PSO) has considerable potential as a viable approach for effectively optimising the allocation of renewable energy resources, considering real-time data and the dynamic nature of operating circumstances. The tool is very effective in optimising the energy management process and can accommodate variations in parameters, changes in constraints, and characteristics particular to different locations. The primary objective is to develop and execute a PSO-based renewable energy allocation strategy that is specifically designed to meet the distinct needs of oil refineries. This strategy must take into consideration various factors, including the intricacies of energy storage, dynamic limitations, equipment deterioration, levelised cost of energy, and geographic factors. By implementing this approach, it should be possible to significantly decrease electricity usage, attain financial benefits, and improve dependability. As a result, there will be less dependence on national electricity networks that are primarily powered by coal, and the strategy will be in line with sustainability and environmental goals.

Related Research Works

Ibrahim, Ashour, and Gadalla [11] researched energy optimisation in a refining plant in the Middle East. Following the stability of the output, the plant operators made the decision to conduct energy optimisation. They chose four units for optimisation: Sour Water Stripper Units (SWSs), Amine Regeneration Units (ARUs), and a Sulphur Recovery Unit (SRU). The study focused on analysing and optimising two different scenarios. In Scenario 1, the objective was to cease the utilisation of the SWSs in order to save steam that is used for stripping. On the other hand, Alternative 2 focused on enhancing the efficiency of the steam utilised in the SWSs and ARUs. After performing a feasibility study, we chose Scenario 2 to be implemented, which led to an annual cost reduction of USD 1,537,206.38. The investigation was conducted using five distinct models, with four of them using Aspen HYSYS V.11 and one employing a specialised sulphur package. We assessed the thermodynamic characteristics, materials, and energy balance equations for live steam balances using a combined heat and power model. On the other hand, Naz, Bou-Rabee, Shukrullah, Ghaffar, Gungor, and Sulaiman [12] presented a review of hybrid energy technologies, their tenets, controls, and combinational strategies. The authors examined the worldwide issue of the depletion of natural resources for energy generation and emphasised the necessity for industries and consumers to discover methods of producing energy with limited resources in a cost-efficient manner. The authors concentrate on practical methods that make use of renewable energy sources, which are both affordable and ecologically sustainable, to create energy in an inexpensive manner. The paper discusses the progress of hybridised topologies and principles, control and energy management policies, power electronics interface designs, various approaches employed in different hybrid energy systems, design considerations, kinds, and application areas. The aim was to elucidate the progression of hybrid energy systems by presenting previously conducted research in this field and discussing the various technologies and control methods employed in their studies.
Meanwhile, the objective of the work reported by Norouzi, Kalantari, and Talebi [13] was to efficiently integrate renewable energy sources into a refinery located in the Middle East, while considering both the cost and carbon dioxide emissions. The researchers employed Aspen HYSYS software V.11 to model an oil refinery located in the Middle East and determine the energy requirements of different processing units. The linear programming (LP) issue was formulated based on the pre-existing solar energy systems and the wind capacity of the region. The utilisation of GAMS enabled the determination of the most efficient allocation of power from various sources to the units inside the refinery, resulting in reduced costs and CO2 emissions while maintaining flexible operation. A study was conducted to assess the economic viability of establishing a renewable energy technology project to fulfil the energy needs of the refinery. The payback period for the Concentrated Solar Power (CSP) plant, which has an annual capacity of around 411 GWh and a lifespan of 30 years, is 10 years when considering power output from all renewable energy sources. On the other hand, the payback period for solar PVs is determined to be 7 years, while for wind it is 6 years. This paves the way for incorporating renewable energy into the oil refining business while also enhancing energy transmission in the crude oil industry. The analysis determined that the integration of renewable energy into the refinery is feasible, considering both the cost and carbon dioxide emissions. In order to enhance power dependability, the authors proposed integrating several aspects of their research, such as energy hubs, to address the intermittent nature of renewable energy sources and to utilise integrated storage systems.
Similarly, Alhajri and Taqvi [14] created a comprehensive mixed-integer linear programming (MILP) mathematical model to optimise the integration of renewable energy in the process sector, taking into account both economic and environmental factors. The model was created with a multi-energy hub methodology and integrated energy storage to address the seasonal disparities of renewable energy sources. A case study was conducted on a refinery to examine the suitability of the suggested model. The findings indicated that the most minimal carbon emissions were achieved by combining wind energy with Concentrated Solar Power technologies for the production of electricity and heat, respectively. By adopting this design, about 9.8 tonnes of carbon dioxide emissions were reduced, with an additional yearly expenditure of approximately USD 88,000, compared to the hypothetical scenario of using grid electricity. In addition, many scenarios were examined to analyse the effects of strategies like carbon cap and trade and carbon capture and storage on both economic expenses and carbon dioxide emissions. The authors assert that their suggested model framework may be utilised to evaluate the economic and environmental consequences of incorporating renewable energy into existing systems and, therefore, make well-informed decisions. They propose that future studies should consider including the expenses associated with the recycling and disposing of storage technology components into the overall cost of storage.
According to Jahandideh-Tehrani, Bozorg-Haddad, and Loáiciga [15], PSO variations have found effective application in six primary areas of water engineering: groundwater modelling, hydrological modelling, hydraulic modelling, reservoir operation, water quality, and water management. PSO can also be hybridised with other statistical techniques, including Support Vector Machines (SVMs), Artificial Neural Networks (ANNs), Adaptive Neuro-Fuzzy Inference Systems (ANFISs), and other evolutionary algorithms, including Simulated Annealing (SA), Genetic Algorithms (GAs), and the Bat Algorithm (BA), according to the study, for energy management in Industrial Wireless Sensor Networks (IWSNs).
Eseye, Zheng, Zhang, and Wei [16] significantly advanced the area of energy management in isolated industrial microgrids by presenting an MPSO-based optimal EMS, running simulations to verify its effectiveness and emphasising the advantages of applying intelligent optimisation methods to microgrid planning and operation. Through the use of advanced optimisation algorithms, Anh and Kien’s [17] study presents a new method of energy management in microgrids. Using multi-objective particle swarm optimisation (MOPSO) defies conventions and demonstrates a more advanced and effective approach to solving energy management issues in microgrids.
As additional techniques of optimisation used in systems of renewable energy, Banos, Manzano-Agugliaro, Montoya, Gil, Alcayde, and Gómez [18] applied evolutionary algorithms. Stand-alone renewable energy systems have had their control techniques, solar module configurations, and wind farm layouts optimised using EAs such as Genetic Algorithms. Similar applications of mixed-integer linear programming (MILP) have been made to the optimal dispatch of hybrid renewable systems, the minimal cost development of power transmission networks under carbon emission restrictions, and long-term renewable energy management [19,20,21,22].
The main advantages of using PSO over the other optimisation methods are that it can solve a wider range of renewable energy management problems, it is more efficient, it needs fewer function evaluations, and it can handle difficult nonlinear problems [23].

2. Materials and Methods

2.1. Theoretical Background of PSO

The PSO algorithm was first proposed in 1995 by Kennedy and Eberhart [24]. In a swarm, each particle is composed of three A-dimensional vectors, where A represents the dimensionality of the search space. The three vectors under consideration are the present location X i of the particle, its velocity V i , and its prior best position P i . Furthermore, it is worth noting that every individual particle inside the swarm knows the present global best solution, denoted as g . The velocity of each particle is repeatedly adjusted to ensure that all particles converge towards the locations of g and P i . In the end, the whole swarm will converge towards an optimal solution of the fitness function under consideration. The algorithm depicted in Table 1 illustrates this procedure.

2.2. Rationale for the Use of Particle Swarm Optimisation

PSO is a computational technique that draws inspiration from the coordinated movement of bird flocks. The algorithm mentioned is a distributed behaviour algorithm designed for performing multidimensional searches [24,25]. The PSO algorithm is classified as a metaheuristic method because it does not rely on specific assumptions about the solutions. The algorithm operates by manipulating particles within the search space using efficient algorithms that leverage the particles’ position and velocity. The decision to use PSO as the primary optimisation technique in this research is based on its effectiveness in efficiently exploring complex solution spaces. The adaptability and capacity to identify global optima make it a viable contender for addressing the complexities of managing renewable energy in an industrial setting.

2.3. Model Background

As reported in the works [26,27,28,29], the adoption of renewable energy sources, including solar photovoltaic, wind turbines, biomass, and others, is growing in industrial applications. This trend is driven by the desire to achieve sustainability goals and decrease reliance on traditional fossil fuels. However, the optimisation problem of fully utilising renewable sources while also considering cost efficiency and energy reliability is complex and has multiple facets. The formulation of the optimisation model is a crucial stage in researching the best management of renewable energy sources. The objective is to develop an optimisation model that will aid in determining the optimal mix and capacity of renewable energy sources and energy efficiency measures. The optimisation model is represented as follows in Equation (3):
M i n t = 1 T P g r i d , t × G E C i + i N P R E , i , t × R E T C
where
T —the total amount of time intervals;
N —the number of renewable energy technologies that have been considered;
P g r i d , t —the electricity purchased from the grid in time t ;
P R E , i , t —the energy generated by renewable energy technology i in time t ;
G E C i —the cost of grid power in time t ;
R E T C —the cost of renewable energy technology i .
The model described above is subject to the constraints described in the subsequent subsections.

2.3.1. Energy Balance Constraint

It is essential to satisfy the overall energy requirements of the refinery by using a mix of power derived from the grid and sustainable energy sources, as shown in Equation (4):
i N P R E , i , t + P g r i d , t + j = 1 M P s t o r a g e , j , t = E D t ,   t
where
E D —energy demand.

2.3.2. Capacity Constraint

To effectively assess the potentials of renewable energy technologies, it is imperative to establish a comprehensive understanding of their respective maximum capacities while considering the inherent limitations imposed by equipment constraints, as shown in Equations (5) and (6):
P R E , i , t M C i , i , t
P s t o r a g e , j , t M S C j , i , t
where
M C —maximum capacity;
M S C —maximum storage capacity.

2.3.3. Energy Efficiency Constraints

To effectively promote energy efficiency, it is imperative to establish a framework wherein the aggregate energy output derived from renewable sources surpasses or equals a predetermined proportion of the overall energy consumption, as shown in Equation (7):
1 T t = 1 T i = 1 N P R E , i , t + j = 1 M P s t o r a g e , j , t E E T × 1 T t = 1 T E D t
where
E E T —energy efficiency threshold.

2.3.4. Renewable Energy Generation Limit

It is important to maintain a balance between renewable energy output and the available resources within each period.
P R E , i , t R R i i , t
Here,
R R —renewable resource.

2.3.5. Energy Storage Constraints

It is important to ensure that energy storage technologies conform to their charging and discharging limitations following their specific attributes, such as capacity and charge/discharge rates, as shown in Equations (9) and (10):
P s t o r a g e , j , t M C R i , j , t
P s t o r a g e , j , t M D R j , j , t
where
M C R —max. charge rate;
M D R —max. discharge rate.

2.3.6. State of Charge (SOC) Constraints

Constraints on the state of charge (SOC) of energy storage devices are incorporated to accommodate their dynamic characteristics, as shown in Equation (11).
S O C s t o r a g e , j , t = S O C , j , t 1 + η c h a r g e , j · P s t o r a g e , j , t P s t o r a g e , j , t P η c h a r g e , j ,     j ,   t
It is important to provide the initial SOC values for the storage technologies, as shown in Equation (12).
S O C s t o r a g e , j , 0 = I n i t i a l S O C j ,   j
The key decision variables for the optimisation model are tabulated in Table 2.

2.4. Model Development

This study employed PSO to optimise the management of renewable energy sources in an oil refinery. PSO is a stochastic optimisation approach that is based on populations. It was created by Kennedy and Eberhart and draws inspiration from social behaviours observed in bird flocking, fish schooling, and swarm theory [30]. This approach is based on a straightforward principle, where a collective of swarm particles actively explores a predetermined solution space to find the most effective solution.

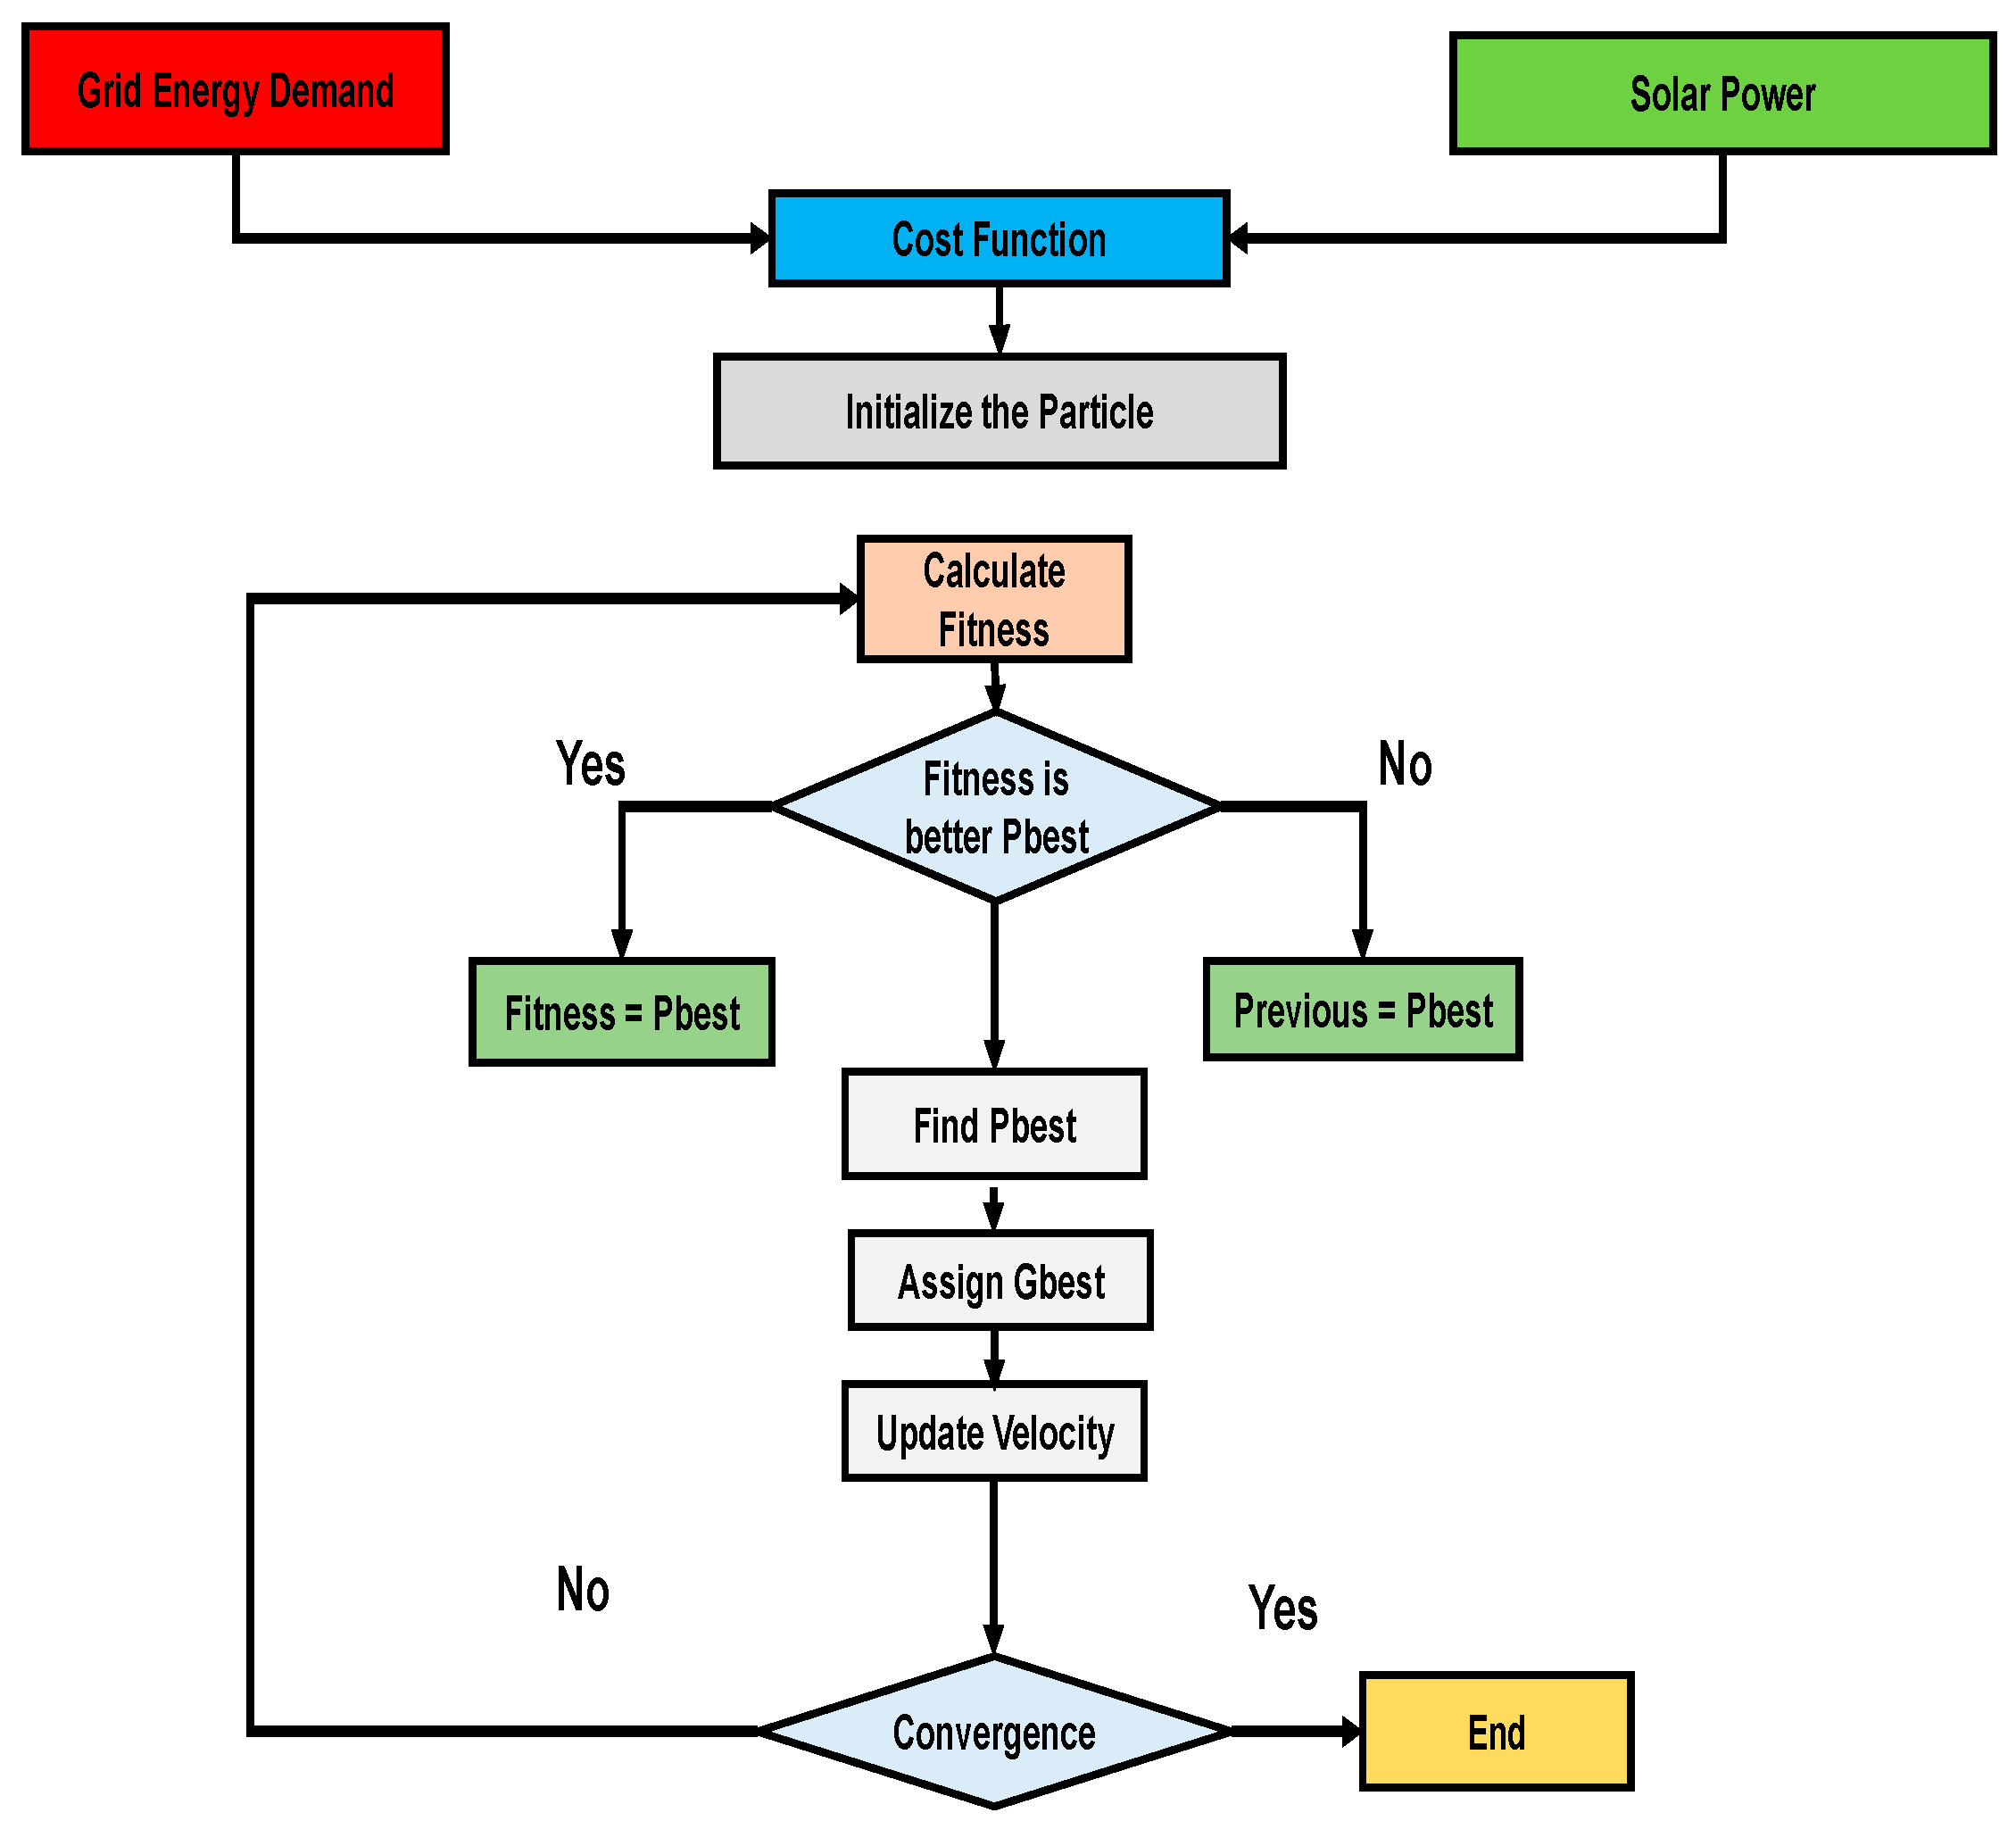
2.4.1. Particle Swamp Optimisation

This optimisation approach was derived from the collective movement patterns shown by bird flocks in a computational space. This method initialises the particle’s movement throughout the space to seek the optimal solution based on the objective function. The ultimate optimum solution is reached by considering a larger number of particles. During each cycle, the optimal current position will update its position by incorporating the current velocity, current best position, and current global position, as described in Figure 1.
The optimisation model, as described in Equation (3), incorporates factors such as the energy balance, capacity, energy efficiency, constraints on renewable energy output, and energy storage. The cost function is represented by the encoding shown in Figure 1. The energy data used to implement the PSO algorithms is sourced from the grid energy demand and solar power framework. The energy data inputs are included in the cost functions, which embody the model formulation in this research. One method for reducing the overall cost of the system is through the implementation of PSO, which comprises the following fundamental components [30]:
Particle X: This is a bird in search of a certain location, represented by a vector. At the iteration time, the ith particle X i may be characterised as X i = x 1 i ,   x 2 i ,   x n i , which represents the ith particle’s location relative to the vector.
Population P: The number of particles to run for the iteration count, denoted as P = x 1 i ,   x 2 i , x n i T .
Swarm: A group of particles that move in random directions within each population and get together as they move forward.
Particle velocity V: This refers to the vector representation of the velocity of moving particles. During the process of iteration, the velocity of the ith particle can be represented as V = V 1 i ,   V 2 i , V n i .
Individual best: The particle advances in the search area when the present optimal position based on the fitness value is contrasted with the optimal position based on the fitness value in the subsequent iteration. The individual best is derived from the maximum fitness value as the iteration progresses.
Pbest(t): The Pbest is determined through iteration by modifying the value of the fitness function; the position best is then identified and denoted as P b e s t t = P b e s t 1 , , P b e s t 2 , , P b e s t n .
Global best, denoted as gbest(t): The individual best position is determined from the count of the best positions during the iteration.
This is, therefore, denoted as g b e s t t = G b e s t 1 , , G b e s t 2 , , G b e s t n .
Stopping criterion: This criterion dictates that the search process shall cease either upon achieving the expected or ideal value or upon reaching the maximum iteration count.
The particle update is as follows, in Equation (13):
X i , t + 1 = X i , t + v i , t + 1
The constants C 1 and C 2 are positive values and reflect the value of each particle in the swarm. The variables r 1 and r 2 are uniformly distributed random numbers in the range of 0 to 1. Each stage involves evaluating the fitness functions of individual particles. The inertial factor governs the magnitude of the step size. A higher inertia weight promotes the extensive exploration of the global search space while also assisting in the local search. Updates to the velocity and position are as follows, shown in Equations (14)–(16):
X i = r a n d · X i m a x X i m i n + X i m i n
v i k = r a n d · v i m a x v i m i n + v i m i n
The formula for inertia weight is as follows, in Equation (16):
w = w m a x w m a x w m i n i t e r i t e r m a x
where
w m a x / w m i n —the inertia maximum and minimum weights.
Equations (13)–(16) play a crucial role in preventing our optimisation algorithms from running indefinitely. In essence, they facilitate the convergence of our algorithm, allowing us to obtain the desired results. The PSO technique starts by randomly distributing particles inside the problem area. Every individual particle is utilised to calculate the goal function. During each cycle, the velocities of particles are computed using a specific method. Once the velocities have been determined, the location of the particle is estimated. The particle’s location will change if the requirement is met. The subsequent instructions outline the process of determining the solution:
  • Assign random values to the positions.
  • Initialise the velocity with randomly generated values.
  • Calculate the objective function of each particle.
  • Denote the initial population as the local best position using Pbest.
  • Save the optimal values for the global best position (Gbest) that you select from Pbest.
  • Start the iteration counter and PSO loop.
  • Determine the inertia weight of the particle, its velocity, and its position.
  • Evaluate the cost function defined in Equation (3).
  • Update Pbest and Gbest.
  • Iterate over the numbers 7, 8, and 9 in each iteration until the stop condition is met.
  • Print the Gbest values.

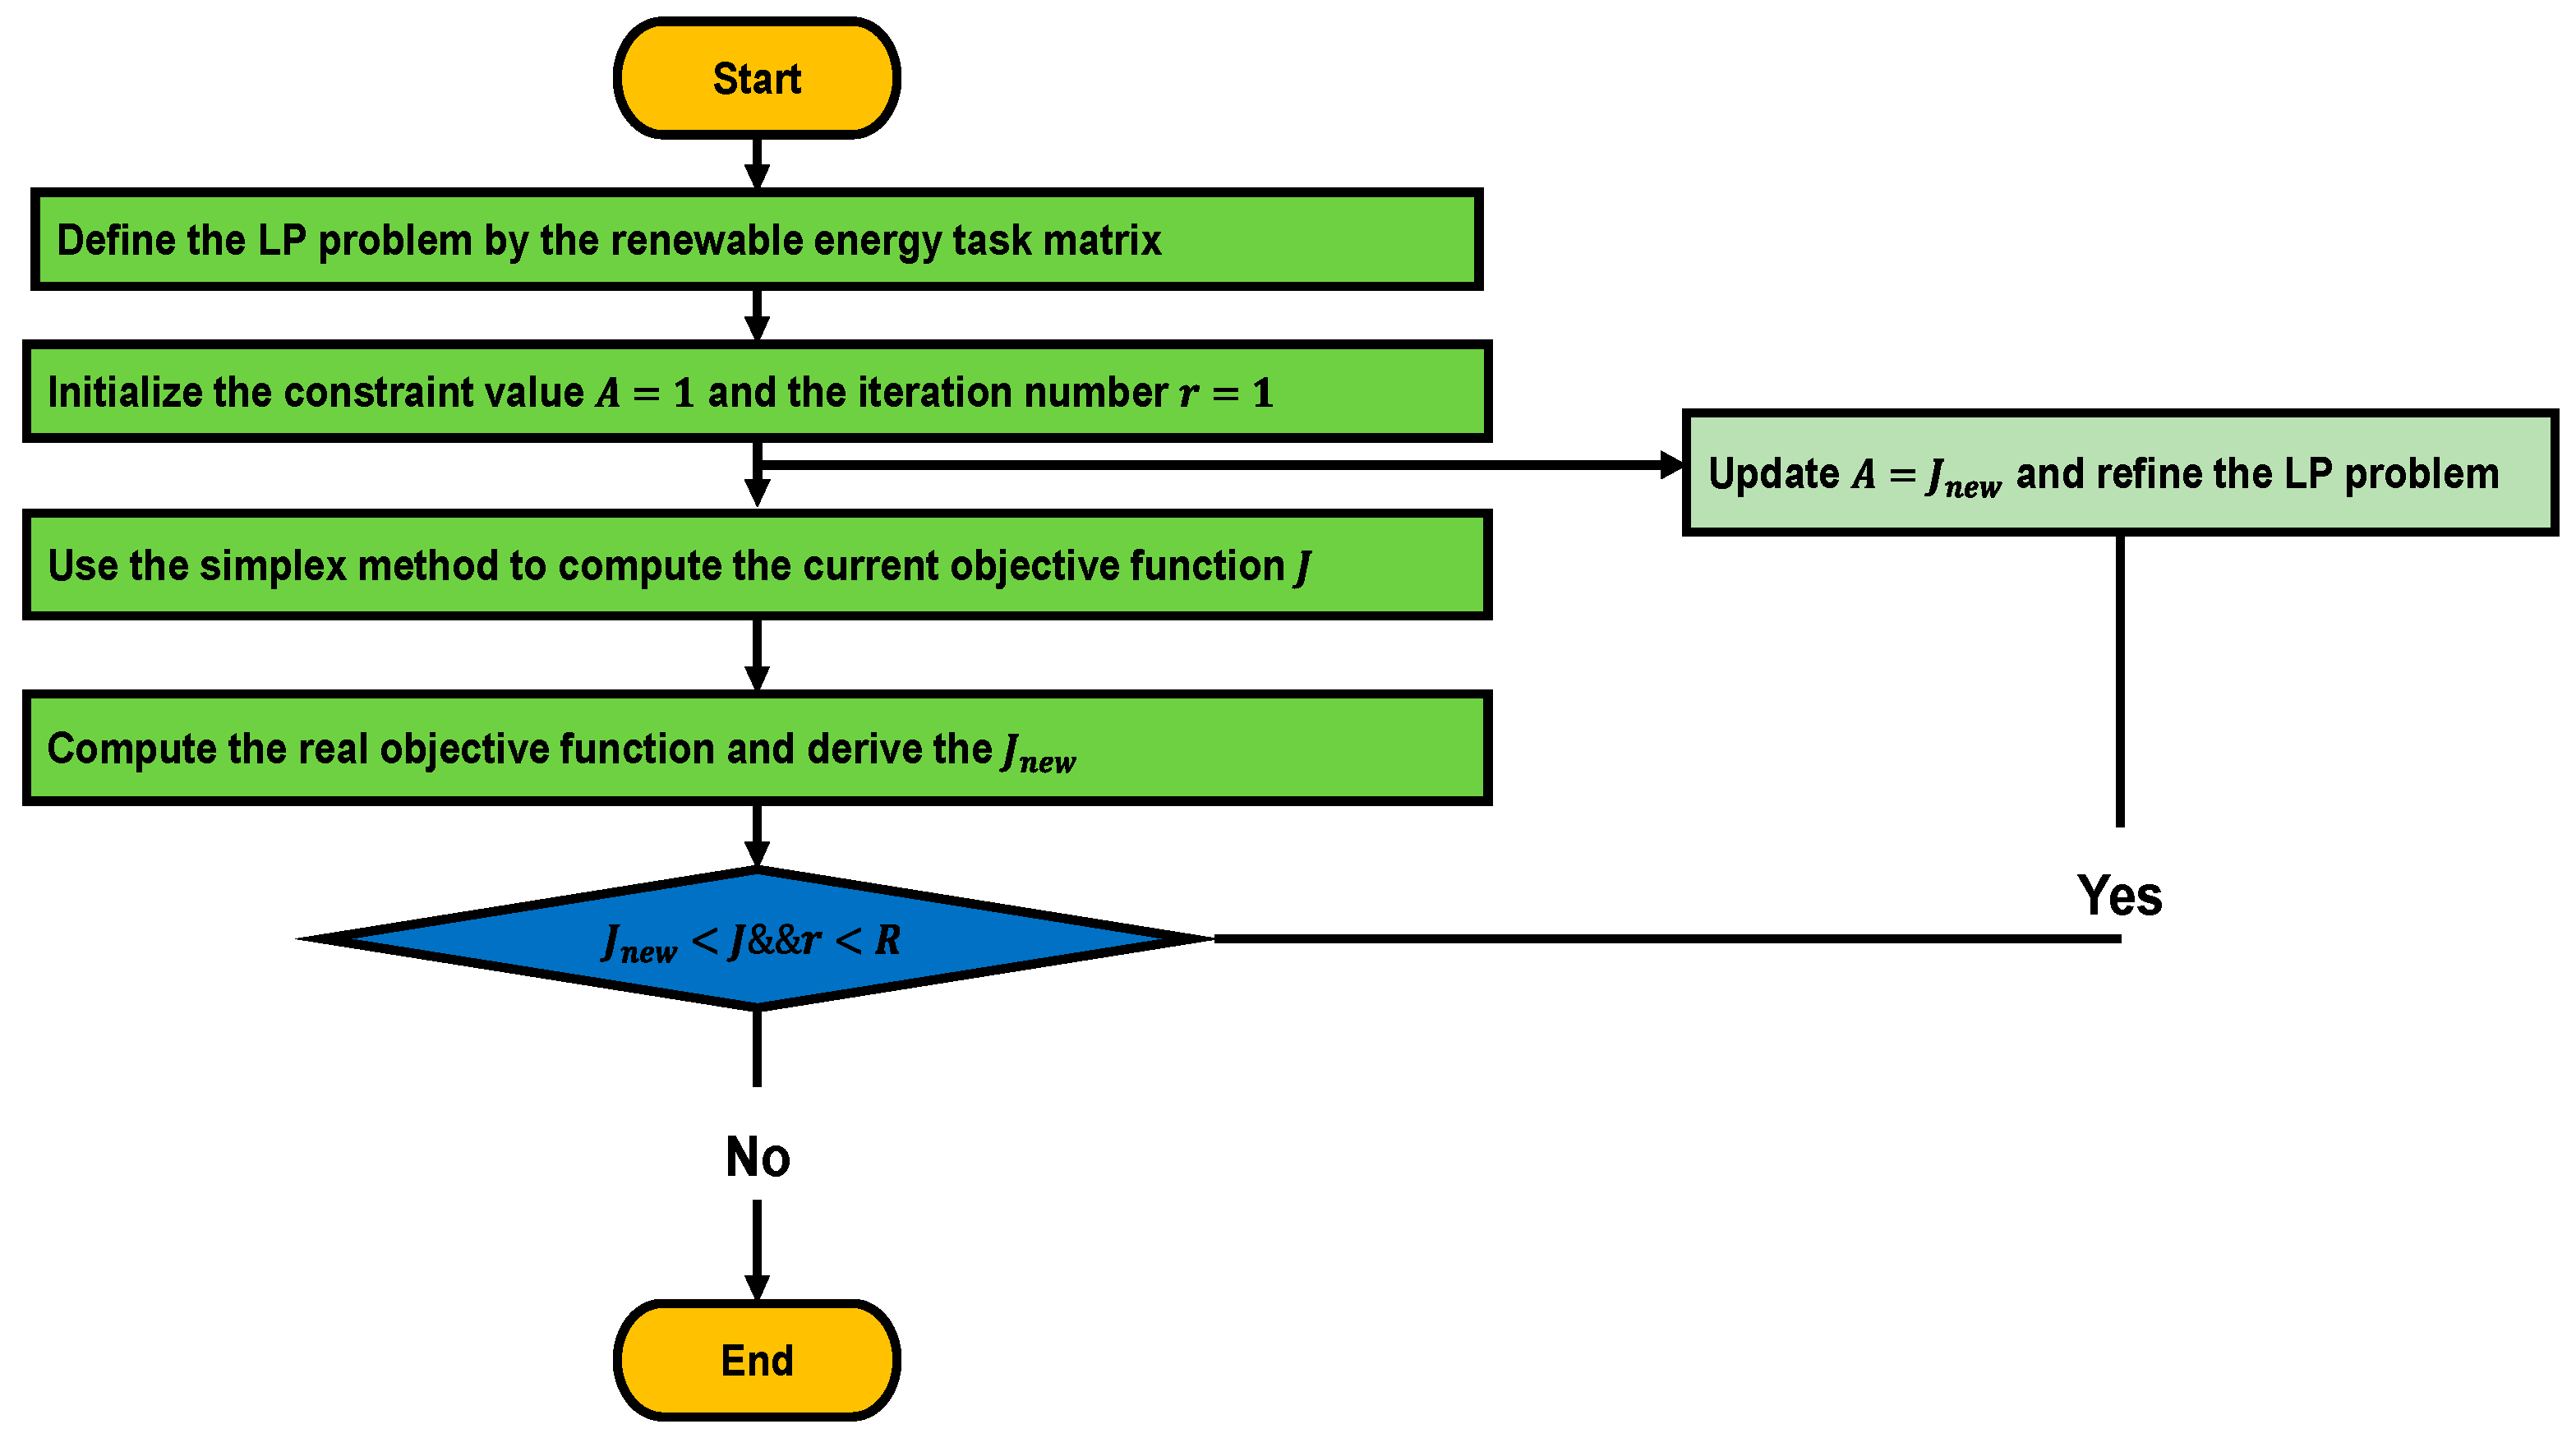
2.4.2. Methodology for Implementing the Linear Programming as a Baseline Model

The flowchart in Figure 2 provides a concise representation of the sequential actions required to execute the LP model in Python to reduce the overall energy expenses. The process begins with the establishment of inputs, which include variables such as Time of Use, energy requirements, and grid and solar energy costs. The choice variable is defined for the grid electricity, solar electricity, battery charge, and disc. The objective function is formulated to reduce the overall energy expenses. The constraints to meet the energy demand, considering the limitations of solar capacity, manufacturing capabilities, and battery efficiency, are defined. The methodology utilises the PuLP library to establish and solve the LP problem. Subsequently, the optimal choice variables with the minimal cost are generated as the outcome.
The all-encompassing expression of the optimisation problem combines the objective function, decision variables, and constraints that underpin the administration of renewable energy sources within an industrial context. The establishment of the problem formulation serves as the fundamental basis upon which the PSO-based optimisation model is built, thereby establishing the framework for subsequent investigation and analysis in the subsequent sections. The implementation of the refinery basic model is presented using the LP methodology in Python, specifically within the Anaconda framework.

3. Results

This section focuses on implementing the methodology established in Section 2, which supports the management of renewable energy sources in an industrial setting. It also investigates the potential energy efficiency measures and their effects on electricity consumption and cost savings by using particle swamp optimisation. The goal is to reduce the reliance on the coal-dominated national electricity network.

3.1. Data Gathering

Data gathering is crucial for industrial facilities aiming to attain optimal efficiency, as it enables further analysis via the use of key performance indicators (KPIs). The data modelling approach involved integrating on-site observations with computational models. This section classifies the data as profiles of refinery energy consumption, refinery geographic location, and refinery landscape. A South African inland downstream oil refinery has implemented the methodology. The refinery features a decanter and centrifuge plant, which cleans and dries the products for further processing or mixing (3 million). The local municipal grid meets the 500 kW peak electrical consumption as shown in Figure 3, with a diesel generator serving as backup during outages.
The parameters for the refinery under study are tabulated in Table 3.
Figure 4 is utilised to characterise the time-of-use features of the refinery; further details on the refinery’s high- and low-demand season properties are detailed in Appendix A. These data are utilised to establish the time intervals during which the suggested solar PV system would exhibit optimal efficiency.

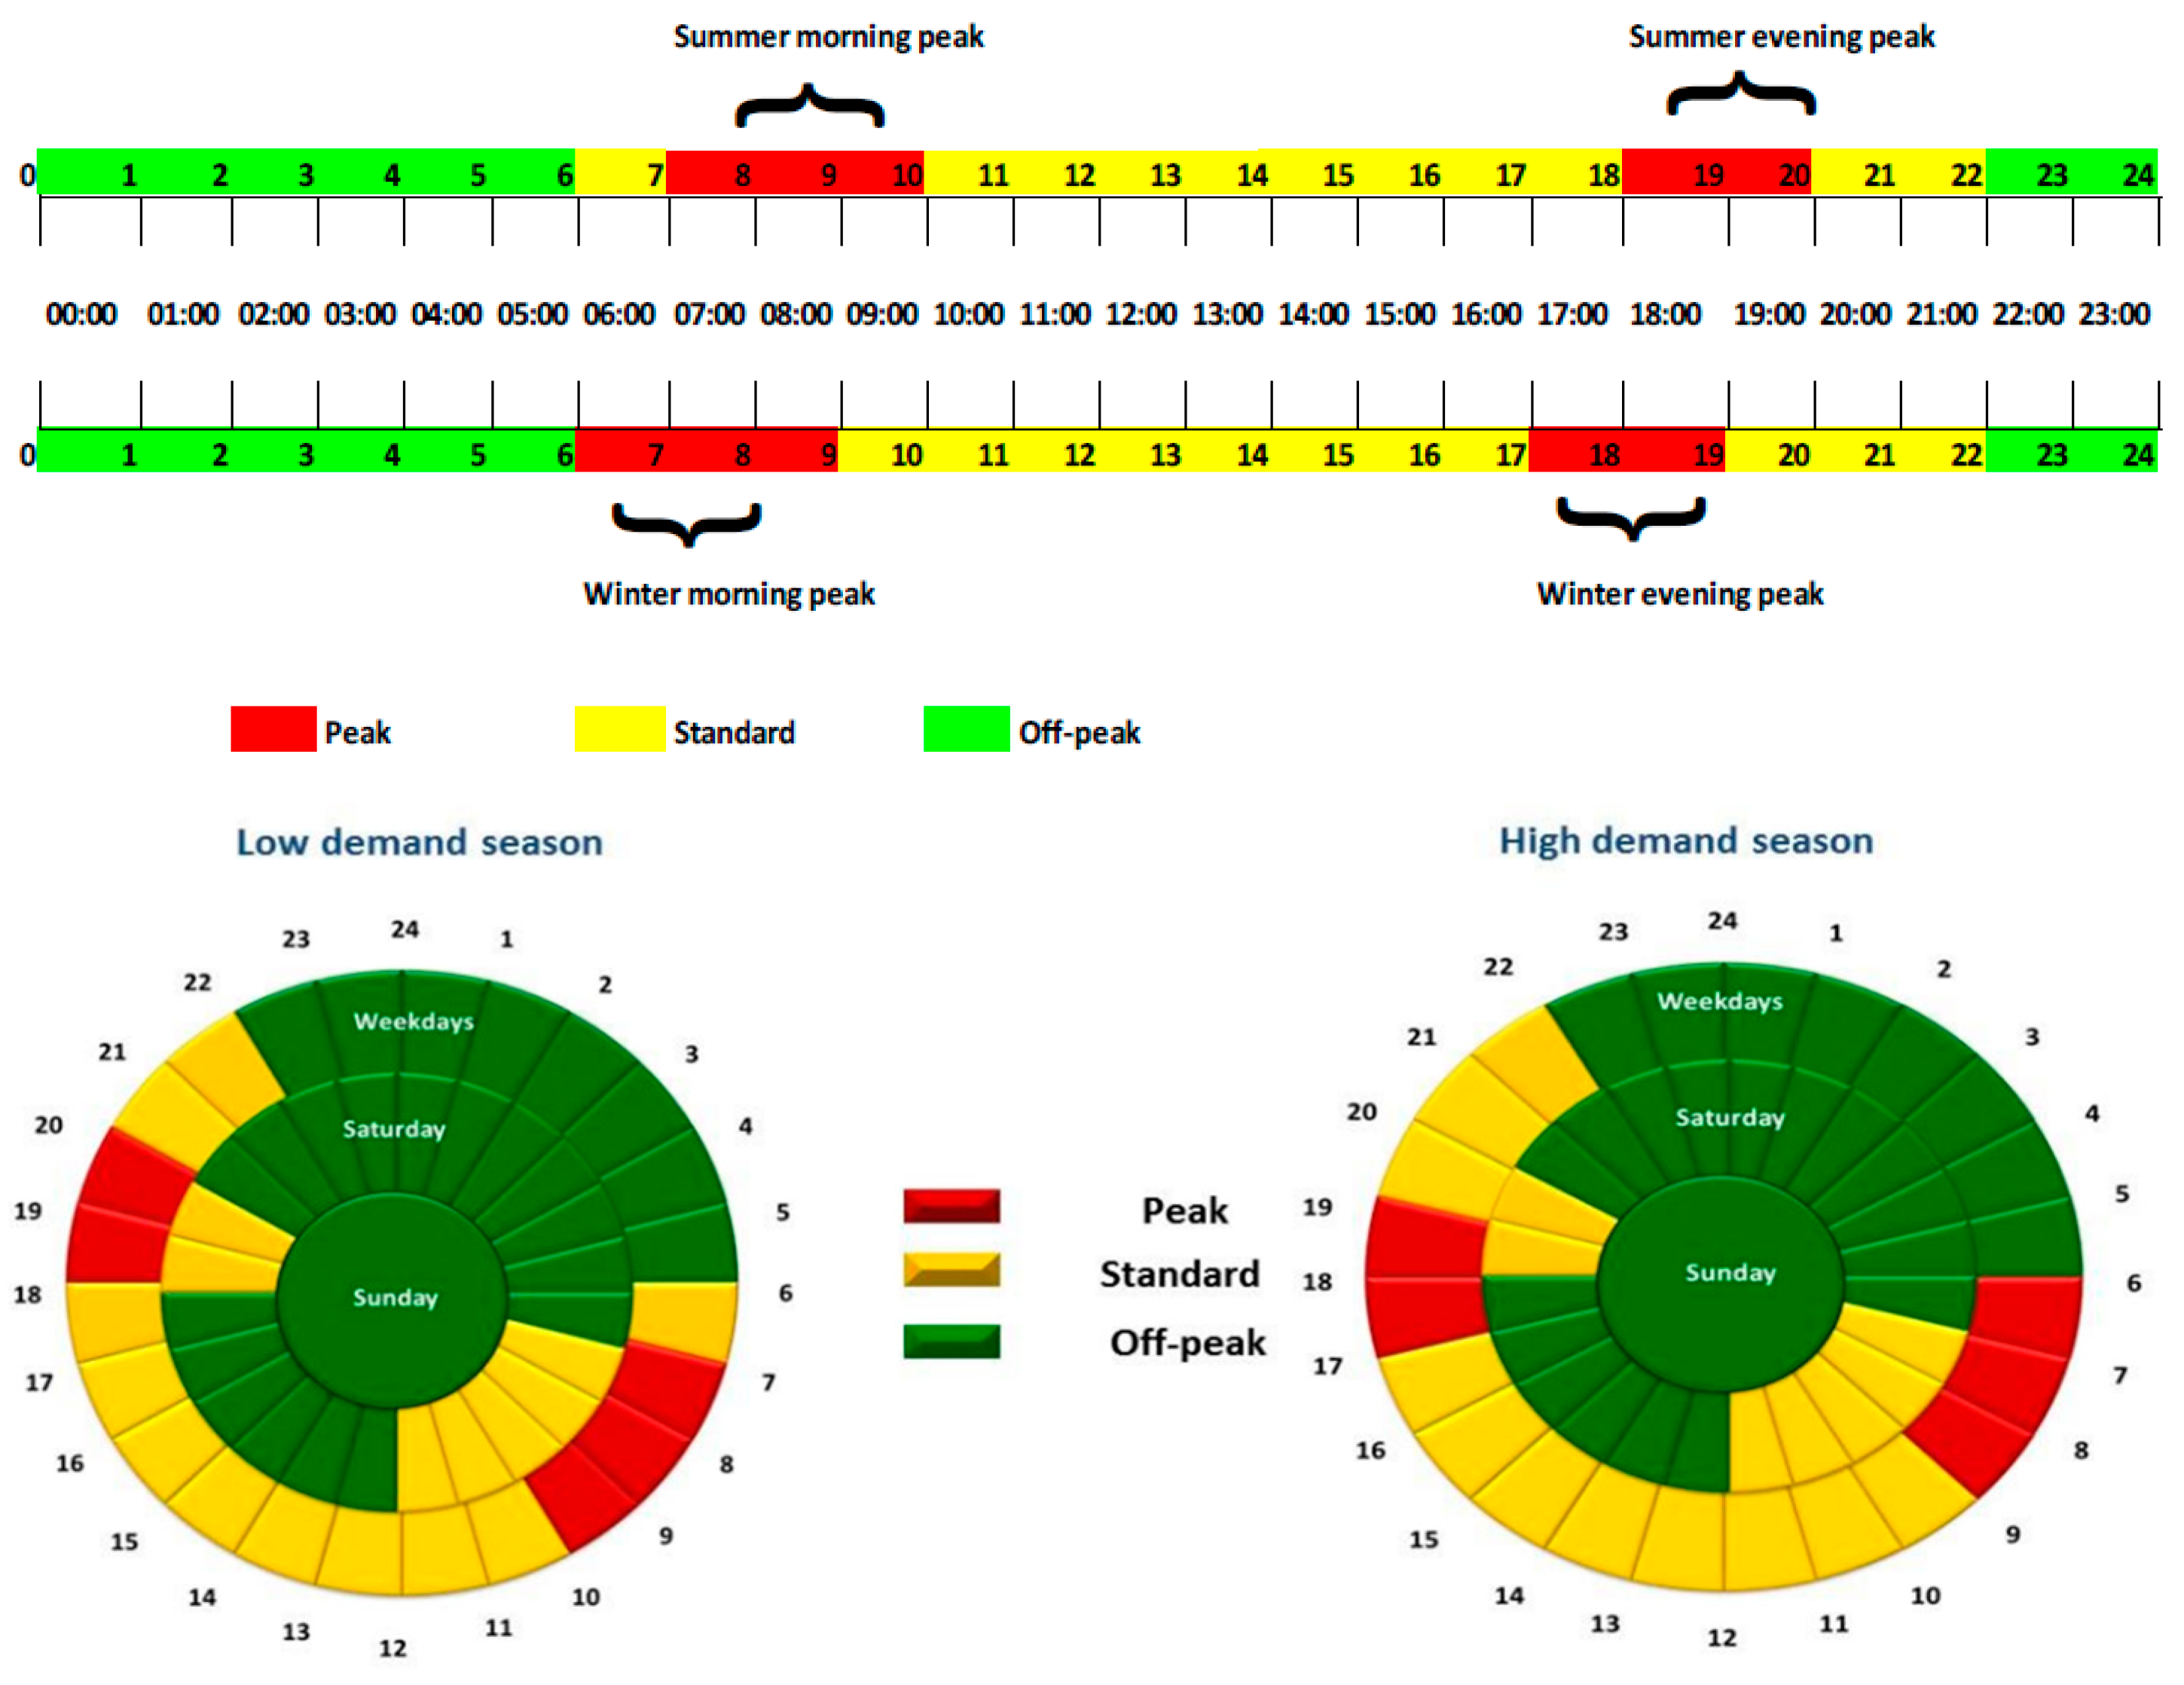
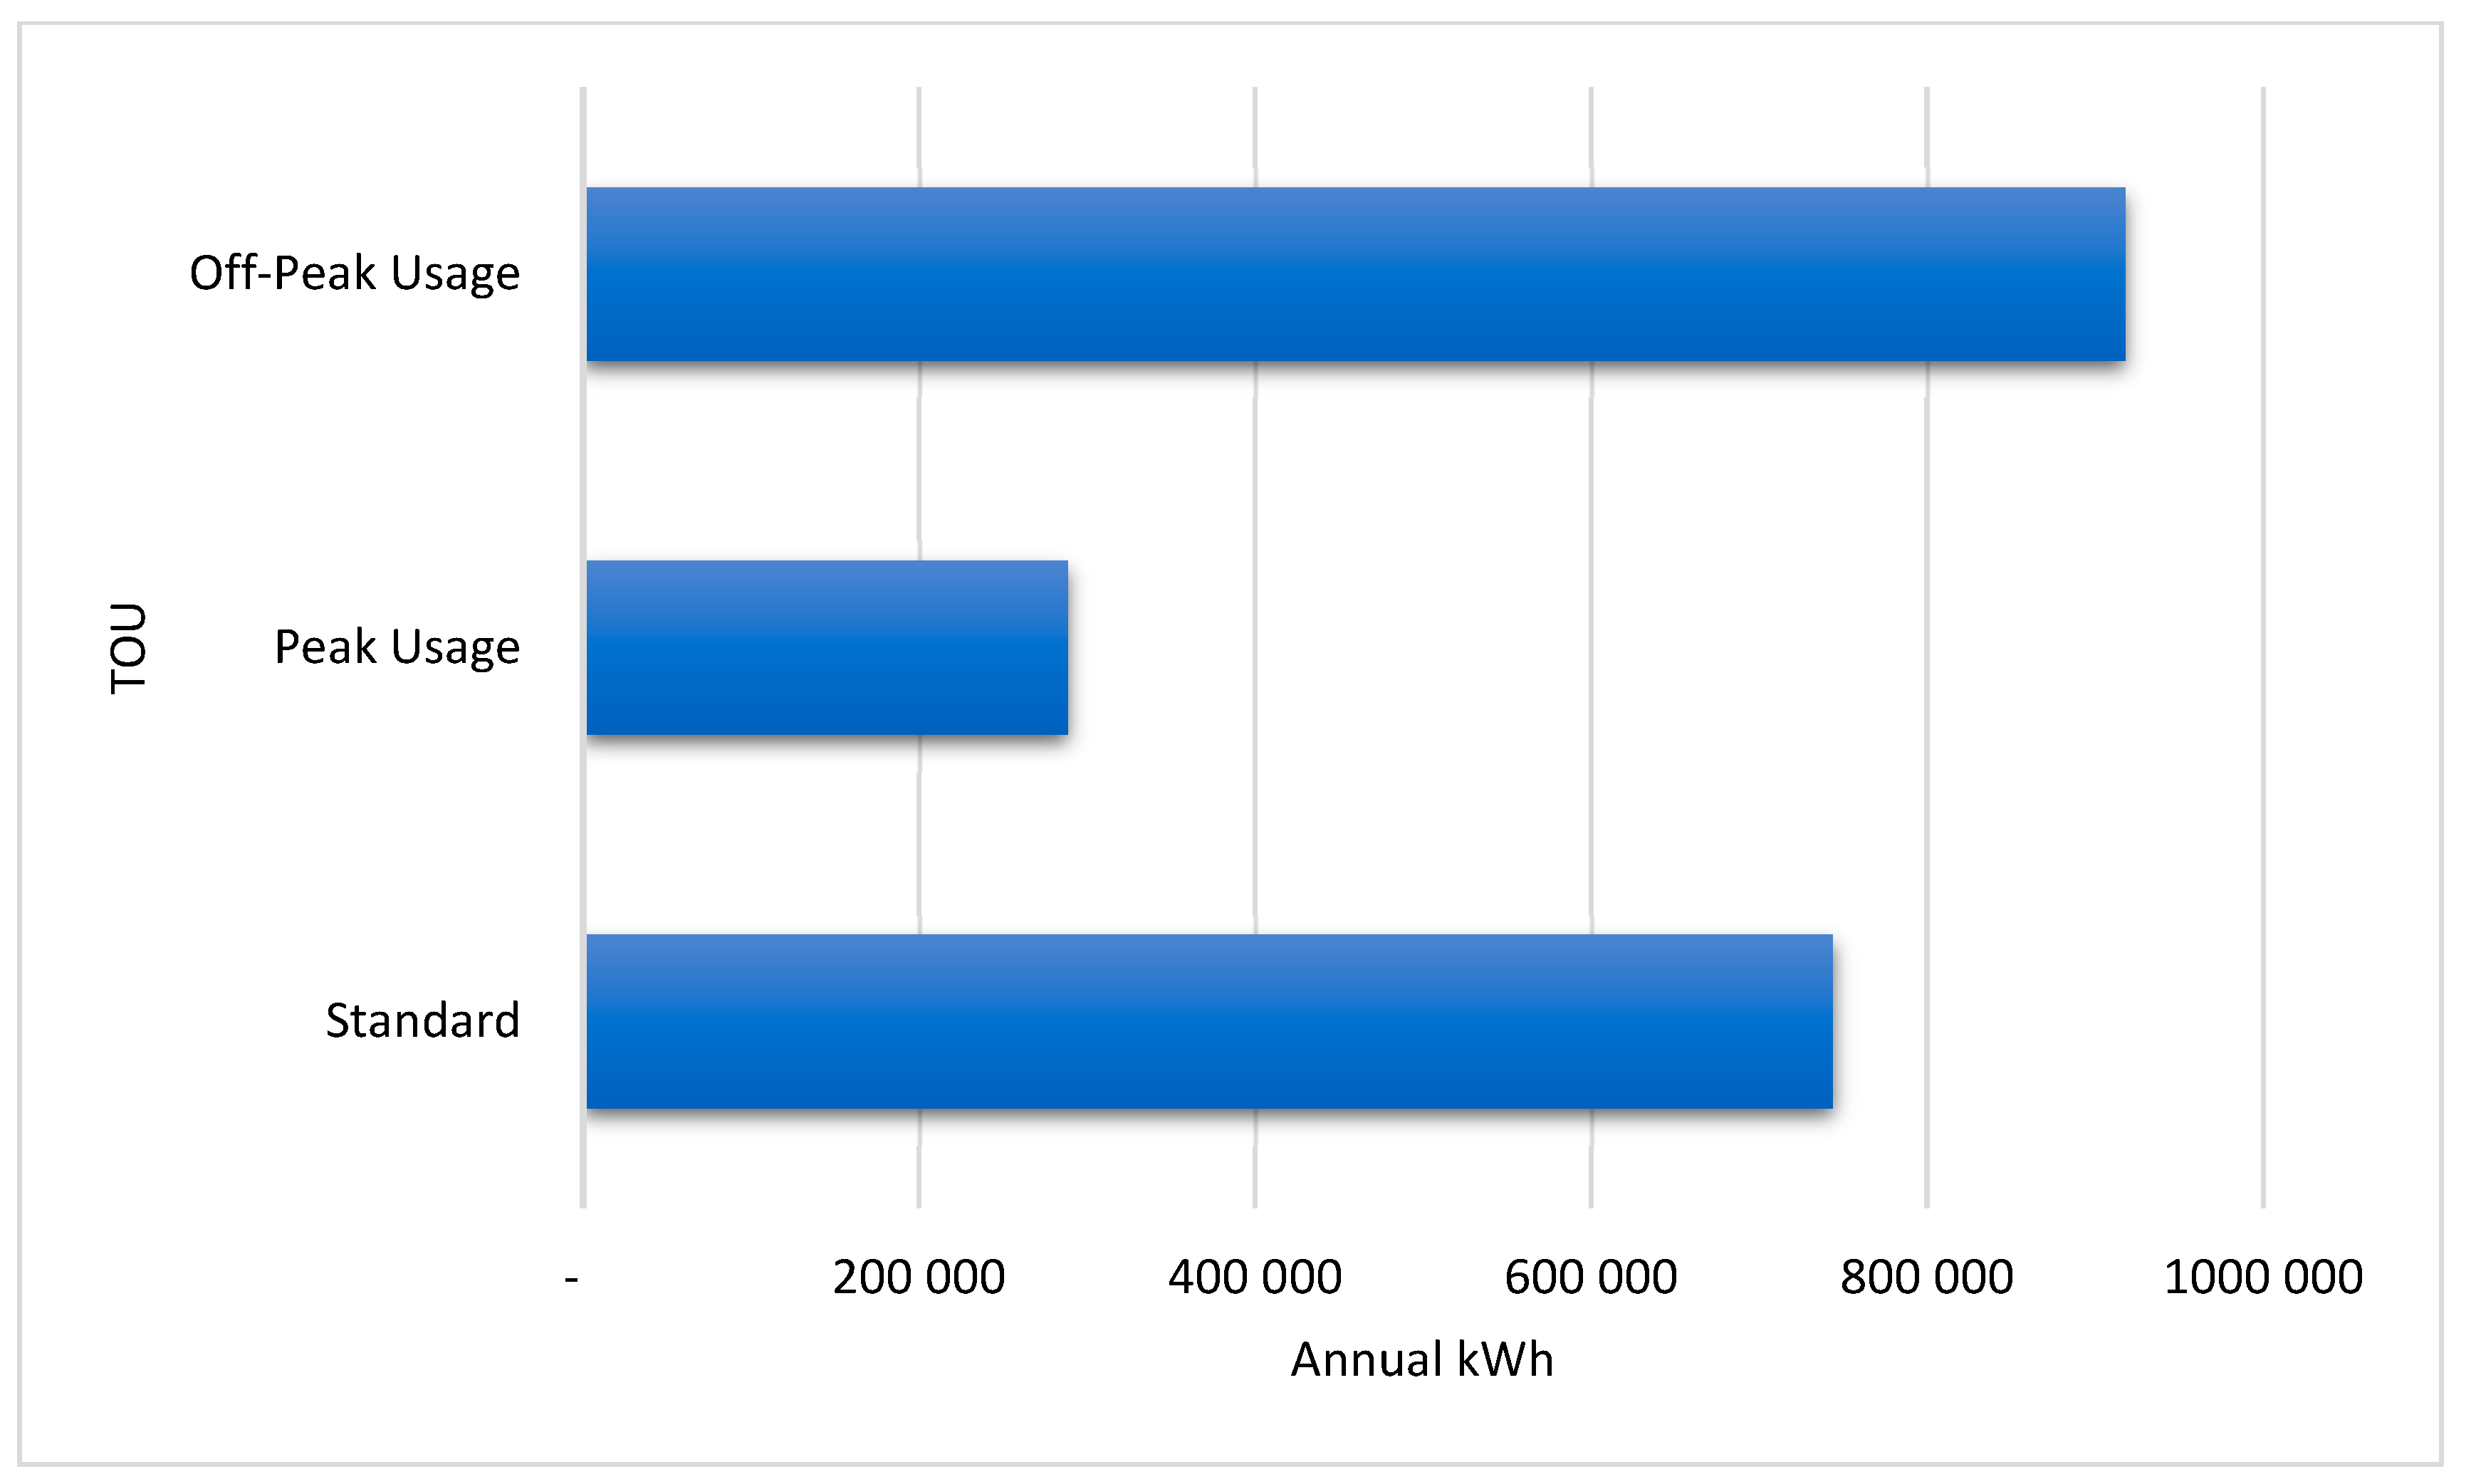
3.2. Refinery’s Energy Consumption Profile

The energy consumption profile includes the utilisation of power from the grid and the energy demand of the refinery. Figure 5 depicts the refinery’s annual electricity consumption for each Time of Use (TOU).

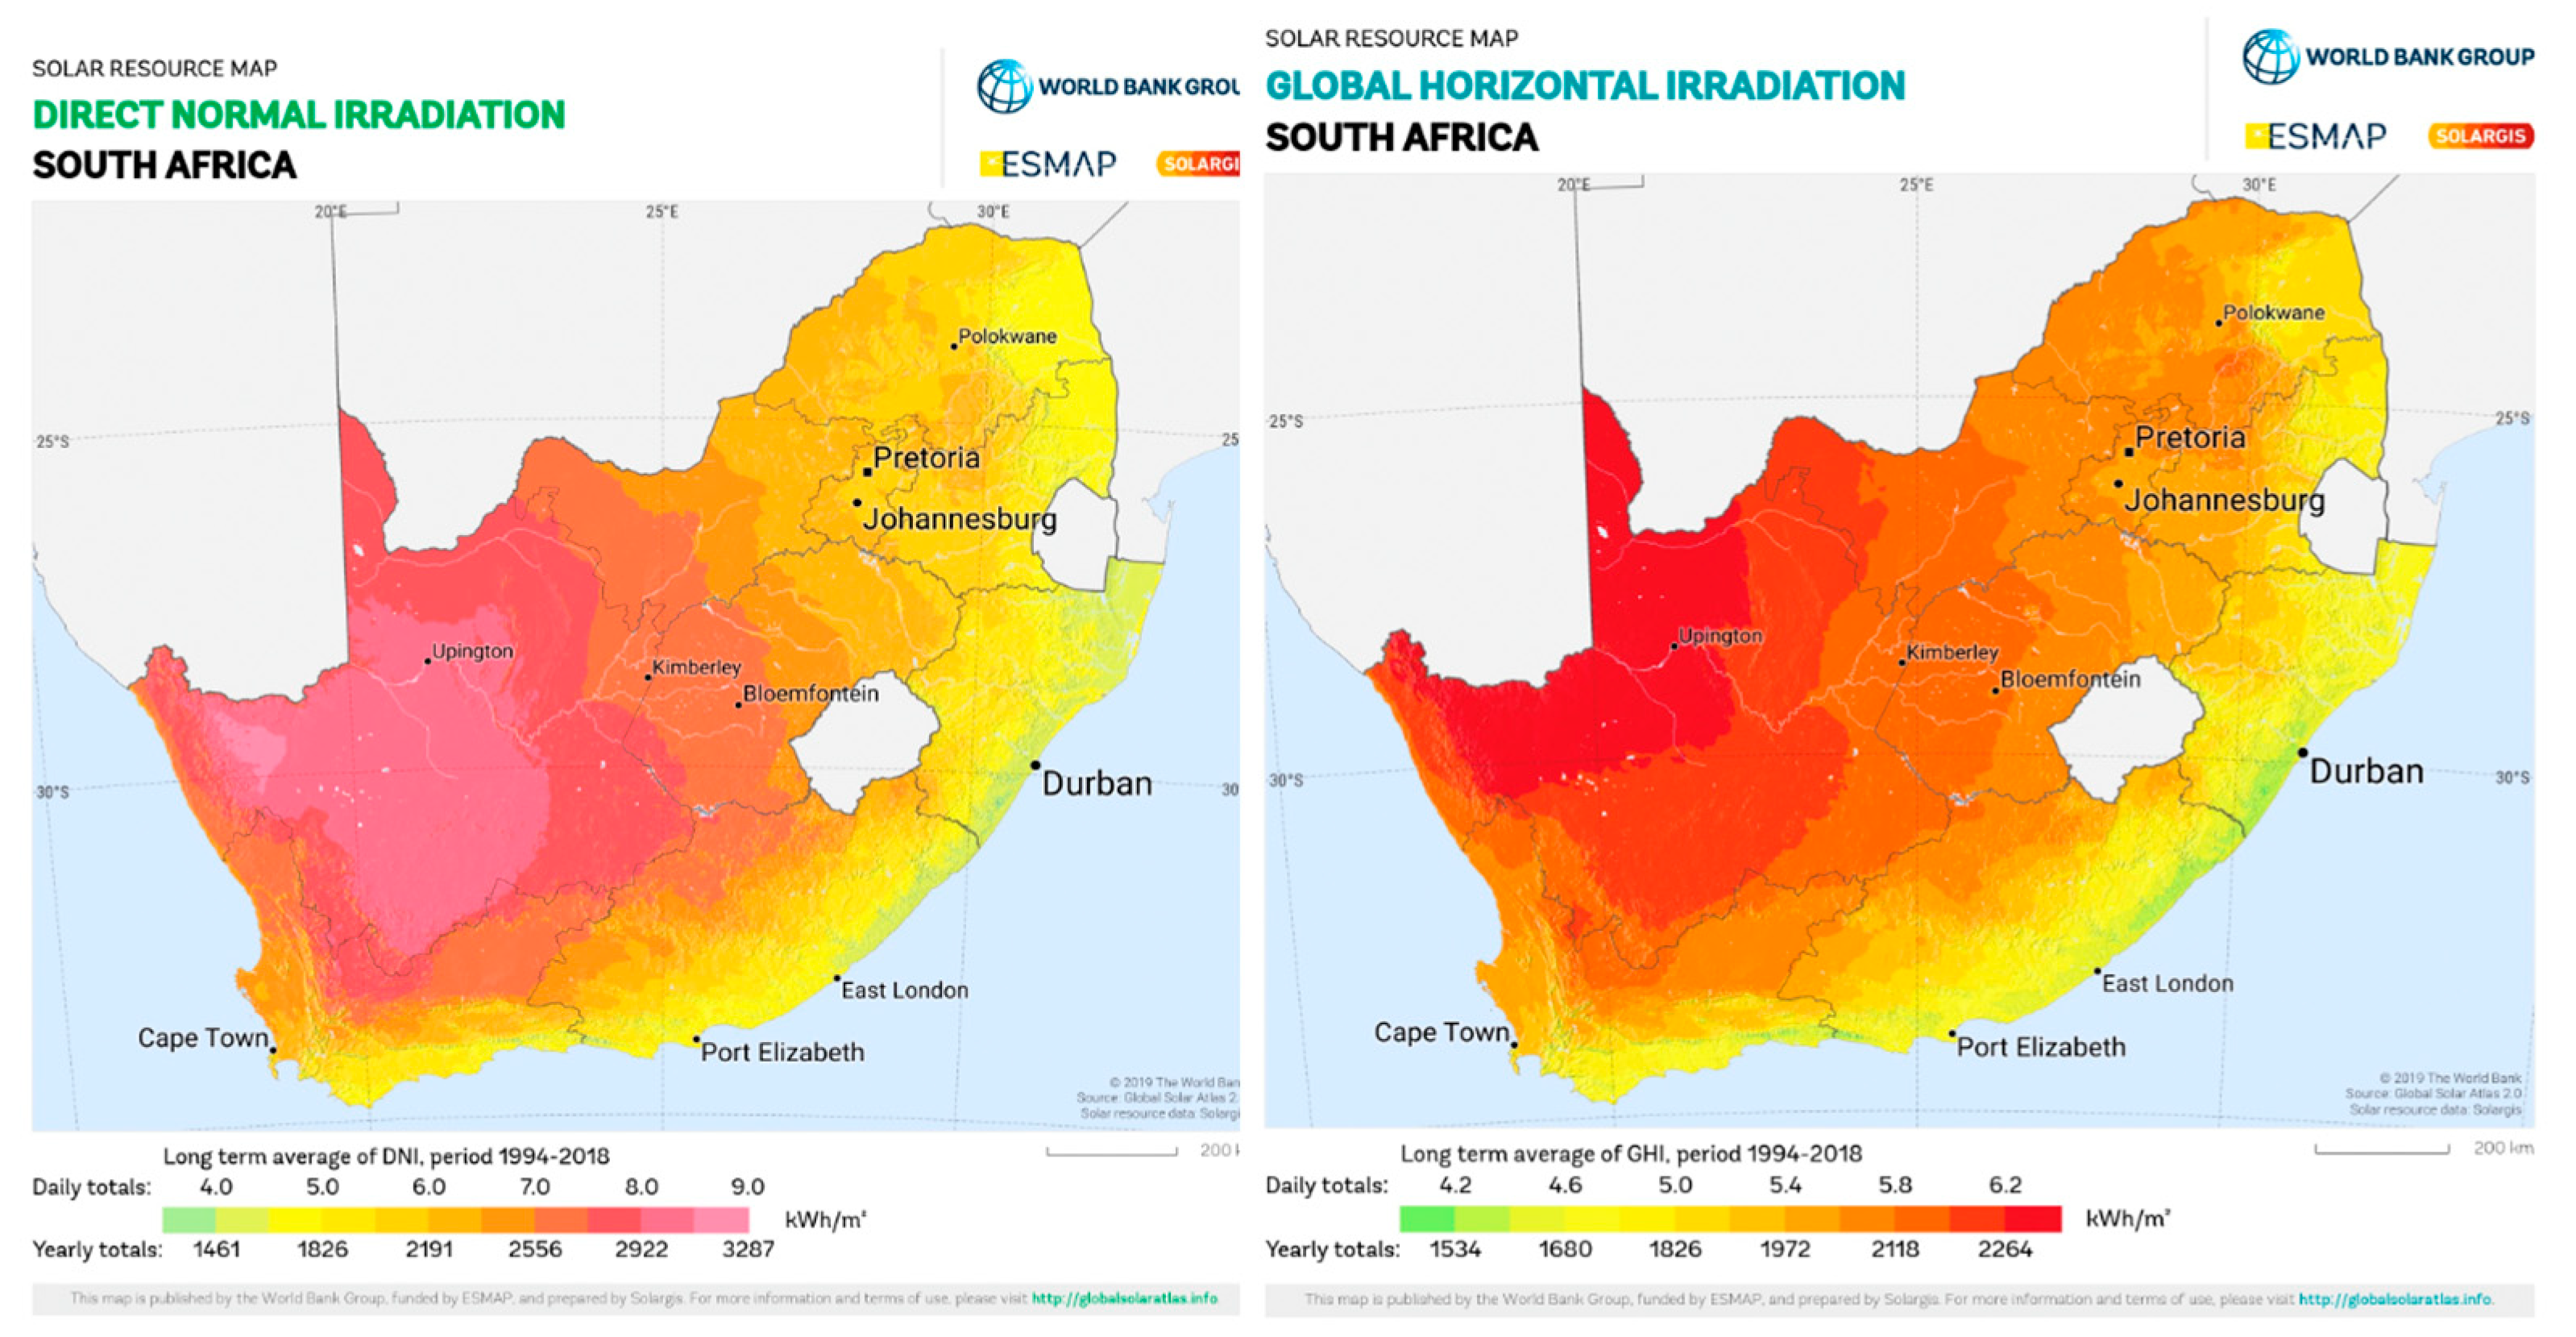
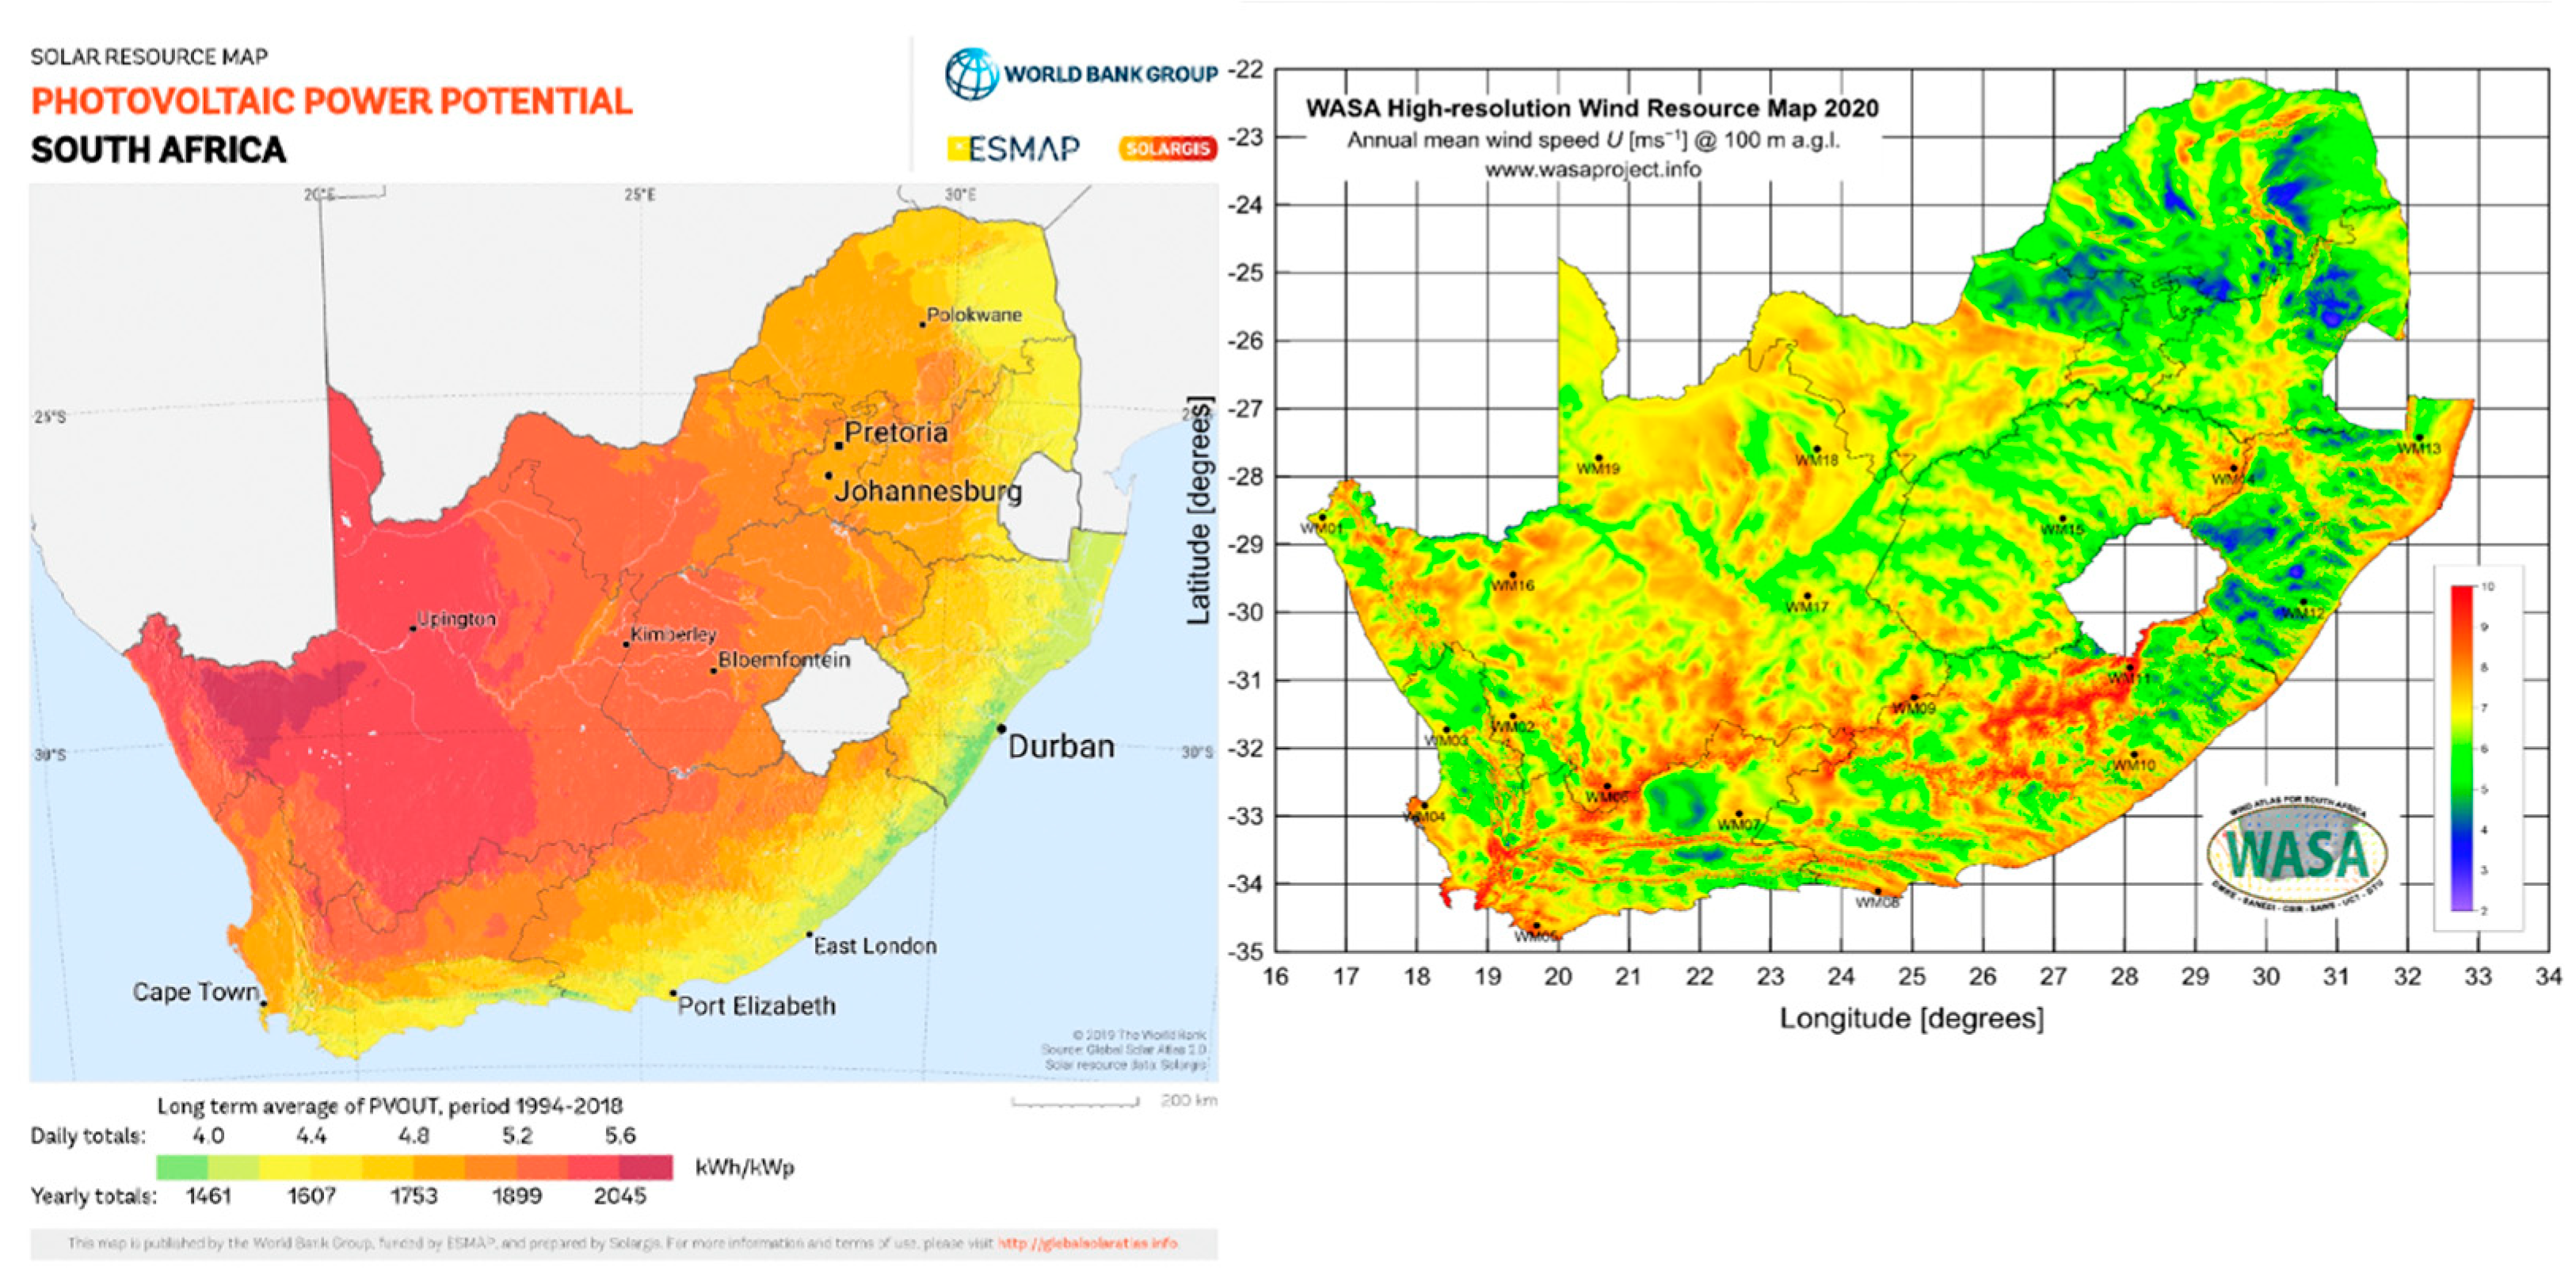
3.3. Refinery’s Geographic Location Profile

A geographical study highlights the potential of different renewable energy sources and energy optimisation measures for the inland oil refinery under consideration. This investigation tailors its results to the unique needs of the refinery. The Global Horizontal Irradiation Map in Figure 6 indicates that the refinery’s geographic area can achieve an average of 5.4 h of daily solar PV electricity production, typically between 10 a.m. and 3 p.m.
This assessment is guided by the following criteria:
  • PV solar potential: The Global Horizontal Irradiation (GHI) and Photovoltaic Power Potential (PVOUT) maps shown in Figure 6 depict the feasibility of directly harvesting solar energy in South Africa.
  • Possibility of CSP: The Direct Normal Irradiation (DNI) map shown in Figure 6 illuminates the potential efficacy of Concentrator Solar Photovoltaic (CSP) technology in South Africa.
  • Wind energy evaluation: The Wind Atlas for South Africa (WASA) map shown in Figure 6 informs the refinery’s appraisal of wind as a renewable energy source.
The criterion outcomes and supports for solar PV taken into account include solar insolation, grid power pricing, land availability, and government incentives. High degrees of insolation are essential for optimising solar power output. When the price of buying electricity from the grid is expensive, solar power becomes a more financially appealing option. Adequate land space is required to establish a solar panel array with a capacity that can fulfil the electrical demands of the refinery. Monetary incentives like subsidies or tax exemptions may greatly enhance the feasibility of solar systems.

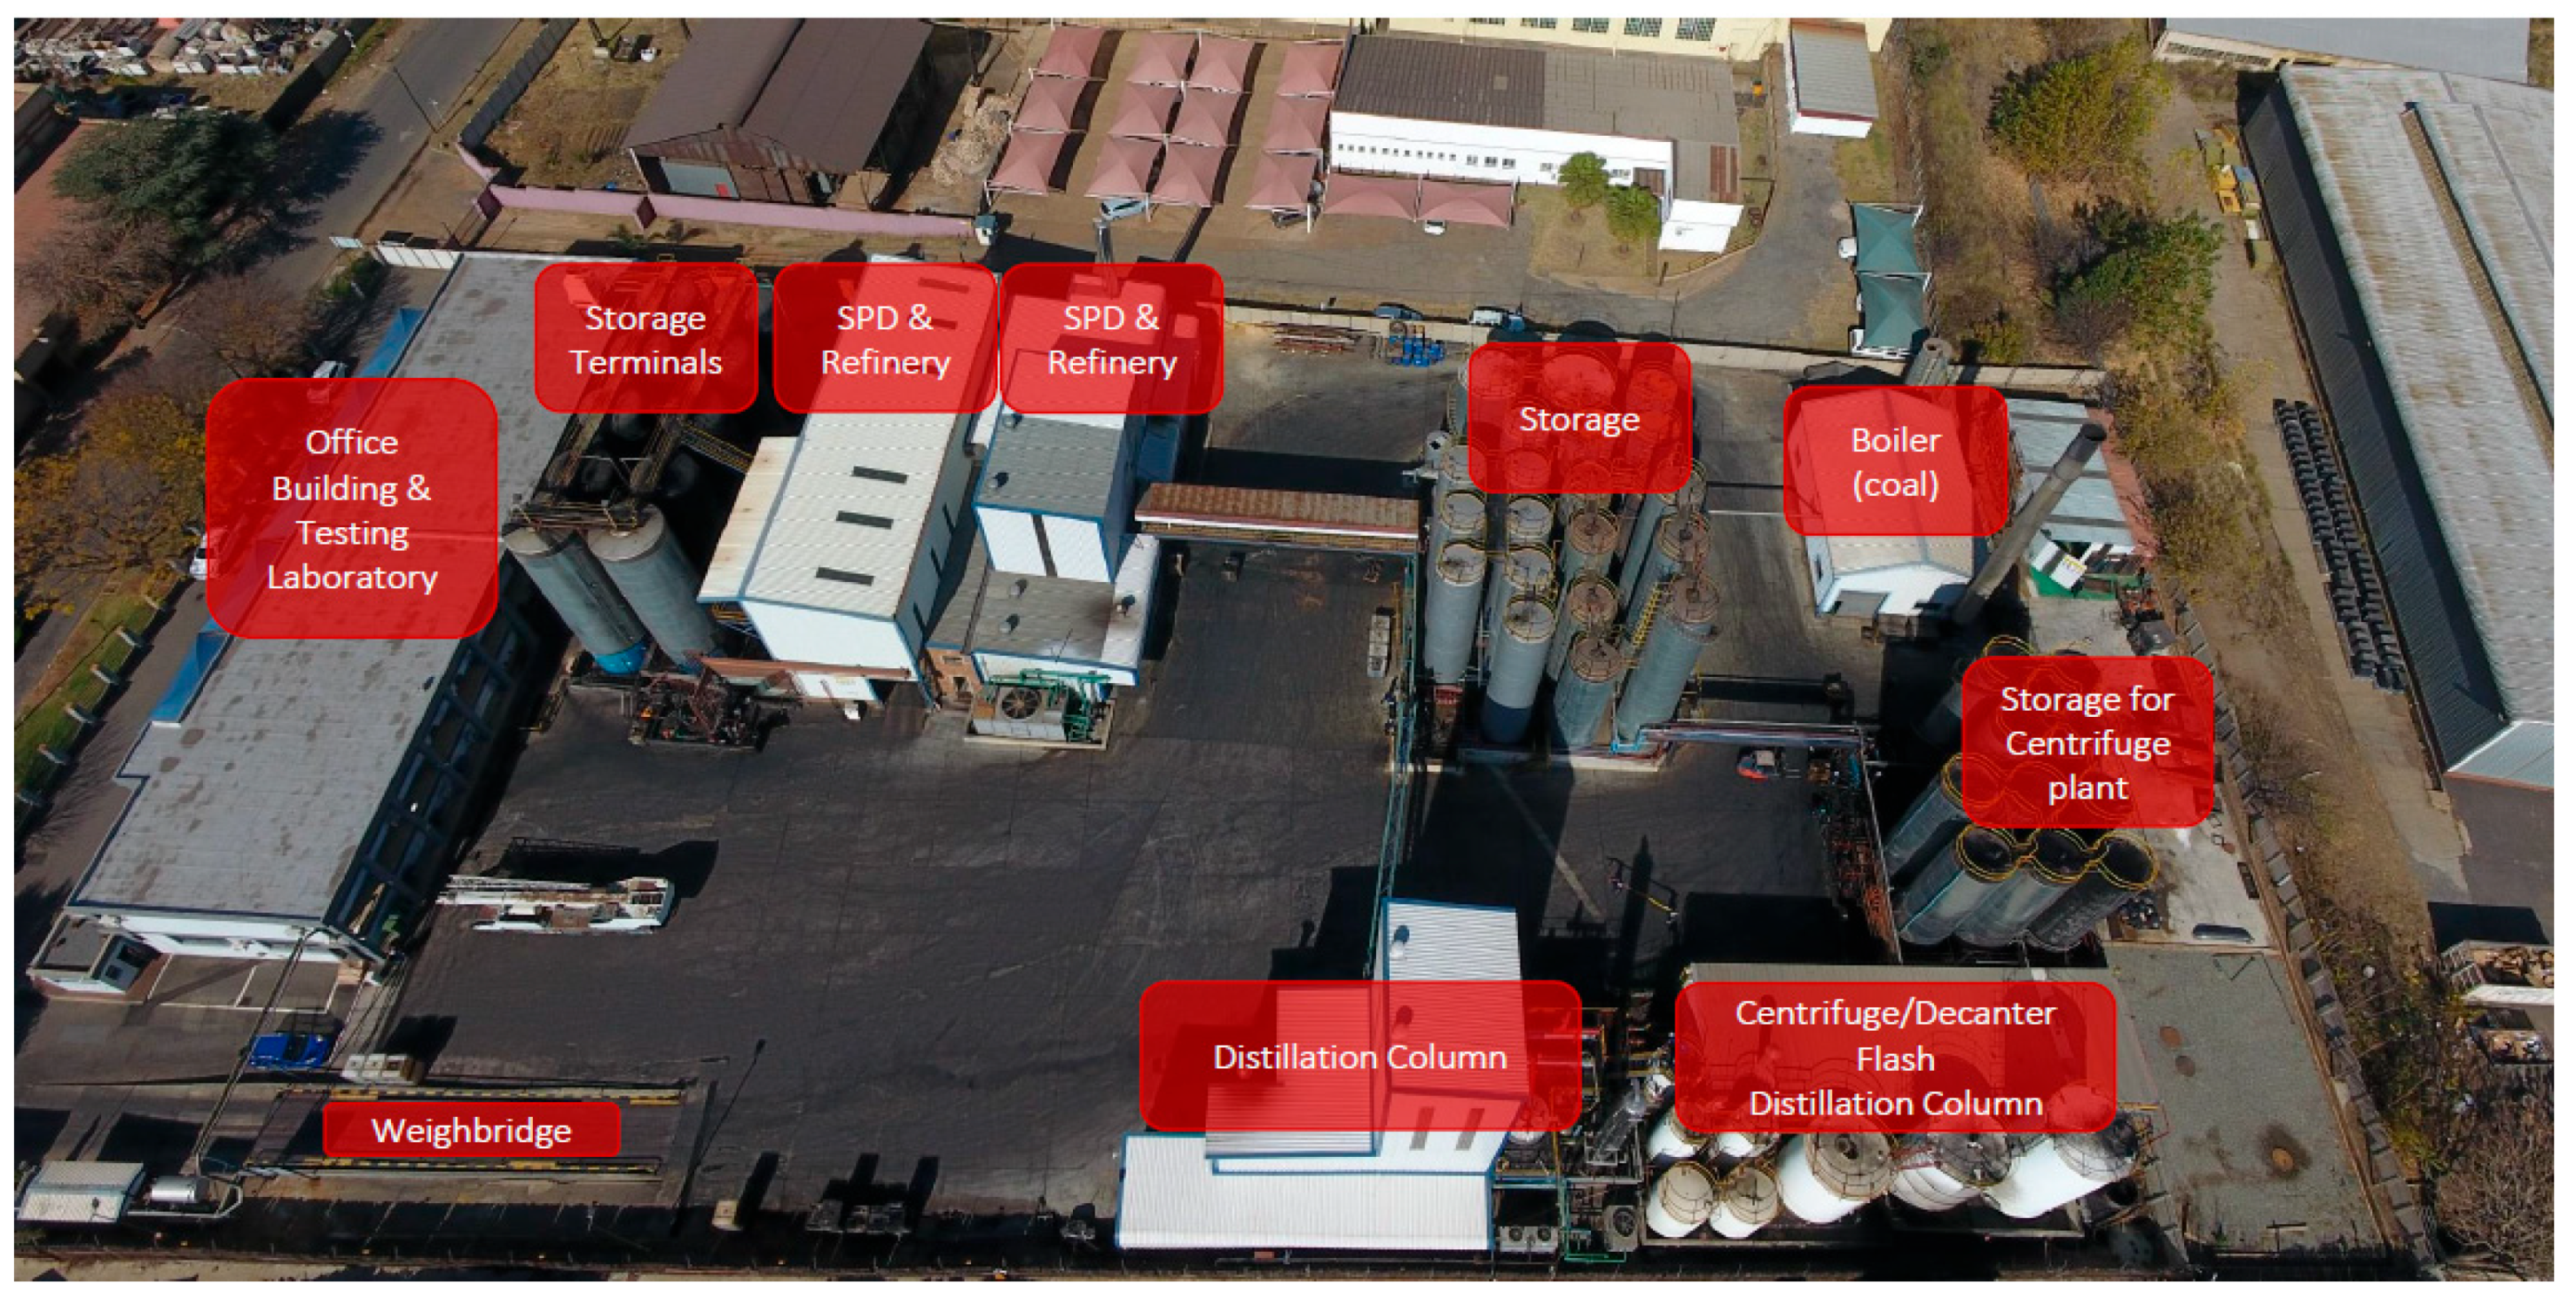
3.4. Refinery Landscape

The refinery’s layout drawings illuminate the available land and roof space, paving the way for the potential implementation of various renewable energy solutions. The collected data fuel the study’s objectives by the following:
  • Building a rock-solid foundation for the seamless integration and optimisation of renewable energy down the line;
  • Opening up a world of possibilities for exploring and evaluating a diverse range of renewable energy solutions and energy optimisation strategies; these, meticulously tailored to the specific needs of the inland oil refinery, guide the path towards identifying the most optimal approaches;
  • Shining a light on the direct impact of identified renewable energy solutions on critical factors like electricity consumption rates, operational reliability, and overall cost effectiveness.
Subject to the land limitations within the refinery, the office building and testing laboratory roof were considered for the solar PV solution, as shown in Figure 7.
In this framework, PV solar technology with and without a battery energy storage system (BESS) was considered subject to the potential renewable PV solar energy available in the area and the number of hours of load shedding experienced in 2022 (3773 h), as shown in Figure 8.

3.5. Model Implementation for Optimal Management of Renewable Energy Sources for an Oil Refinery

The flowchart shown in Figure 1 is utilised to implement the PSO model for the optimal management of renewable energy sources in an oil refinery. A validation test is employed to ascertain the effectiveness of the proposed method. The essential data utilised in this analysis were the Time of Use, energy demand, Solar Levelised Cost of Electricity (LCOE) without battery, Solar LCOE with battery, Solar Resource, maximum solar capacity, average daily solar production, battery capacity, charging efficiency, and discharging efficiency.

3.6. Baseline for Validating the Optimal Management of Renewable Energy Source Problem

To provide a baseline for assessing the feasibility of optimum management of renewable energy sources, the initial cost of electricity for the refinery was considered before the hybrid solar plus battery energy storage system adoption. Subject to Figure 5 above, which depicts the refinery’s Time of Use annual consumption and the Levelised Cost of Electricity for the refinery of R5.98, as shown in Table 3 above, a summary of the costs is presented, as shown in Table 4.
Based on the refinery’s PV solar peak hours indicated in the Global Horizontal Irradiation Map (Figure 6) and considering the refinery’s high- and low-demand seasons (Figure 4 and Appendix A), the PV solar system is most effective during the standard tariff Time of Use (TOU). During the low-demand season, the PV Solar system can meet the peak tariff TOU for 1 h each day, while the rest of the time falls under the standard tariff TOU. As a result, the system will reduce the standard tariff cost of ZAR 743,680.15 kWh per annum, as shown in Figure 5 (refinery’s TOU kWh per annum). To calculate the annual solar production (ASP) for the refinery, which amounts to 281,601.60 kWh, Equation (17) was used:
A S P = P s , P V × G H I a n n u a l × P R s
where
P s , P V , t —energy generated from solar PV;
P R s —Solar System Performance Ratio;
G H I a n n u a l —Global Horizontal Irradiation in the refinery’s geographic location.
Furthermore, as indicated in Table 4, the levelised cost of electricity for the solar and battery energy storage systems is R2.83. This means that the refinery’s electricity costs after the solar and battery energy storage system applications are as shown in Table 5.
For the statistical calculations expressed in Table 4 and Table 5 above, the following assumptions were considered:
  • Average grid power tariff as expressed in Appendix A, which considers the average annual cost of grid power over the low- and high-demand seasons;
  • Share of power contribution to the refinery is split between the grid and diesel generator at 85/15%; thus, the LCOE for grid/genset encompasses both the average cost of grid power and the diesel genset power;
  • Solar PV System Performance Ratio = 85%;
  • Annual Solar Panel Degradation = 0.5%;
  • Solar Utilisation = 100%;
  • Cost of Operation and Maintenance = R250/kWp;
  • Future annual grid price increase (AGP) averaged at 10%;
  • Future annual diesel price increase (ADP) at 3%.
The LP approach is employed to simulate the problem. The LP algorithms aim to pinpoint the ideal solution for a specific problem. An objective function formulates the problem and aims to maximise or minimise its value within a specified set of limits and constraints. In this particular case study, the target function is to minimise costs, enhance energy dependability, and, where appropriate, mitigate environmental impacts. Figure 9 displays the flowchart that demonstrates the iterative LP approach for effectively managing the renewable energy source problem. The implementation of this method is achieved in Python 3.11.5 utilising JupyterLab within the Anaconda framework. The LP solution is evaluated, resulting in an evaluation function value of R4,829,638.88. As shown in Figure 10a, the projected total cost is also R4,829,638.88, with an absolute deviation of 0.0 and a percentage variance of 0.0%, as shown in Figure 10b.
An absolute deviation, as described in Figure 10a,b of 0.0, in the context of linear programming problem implementation signifies that the observed values are precisely equivalent to the expected values, thereby signifying a perfect fit or absence of deviation from the mean. In contrast, a percentage variance of 0% signifies the absence of dispersion or variability in the data, signifying that all data points are identical or remain constant. By employing mean absolute deviation (MAD) in linear programming to analyse the optimal strategy for managing renewable energy sources, the obtained values indicate that maintaining the expected returns without any fluctuations or deviations is the most effective approach. Such a refinery is either risk free or optimally optimised as a result.

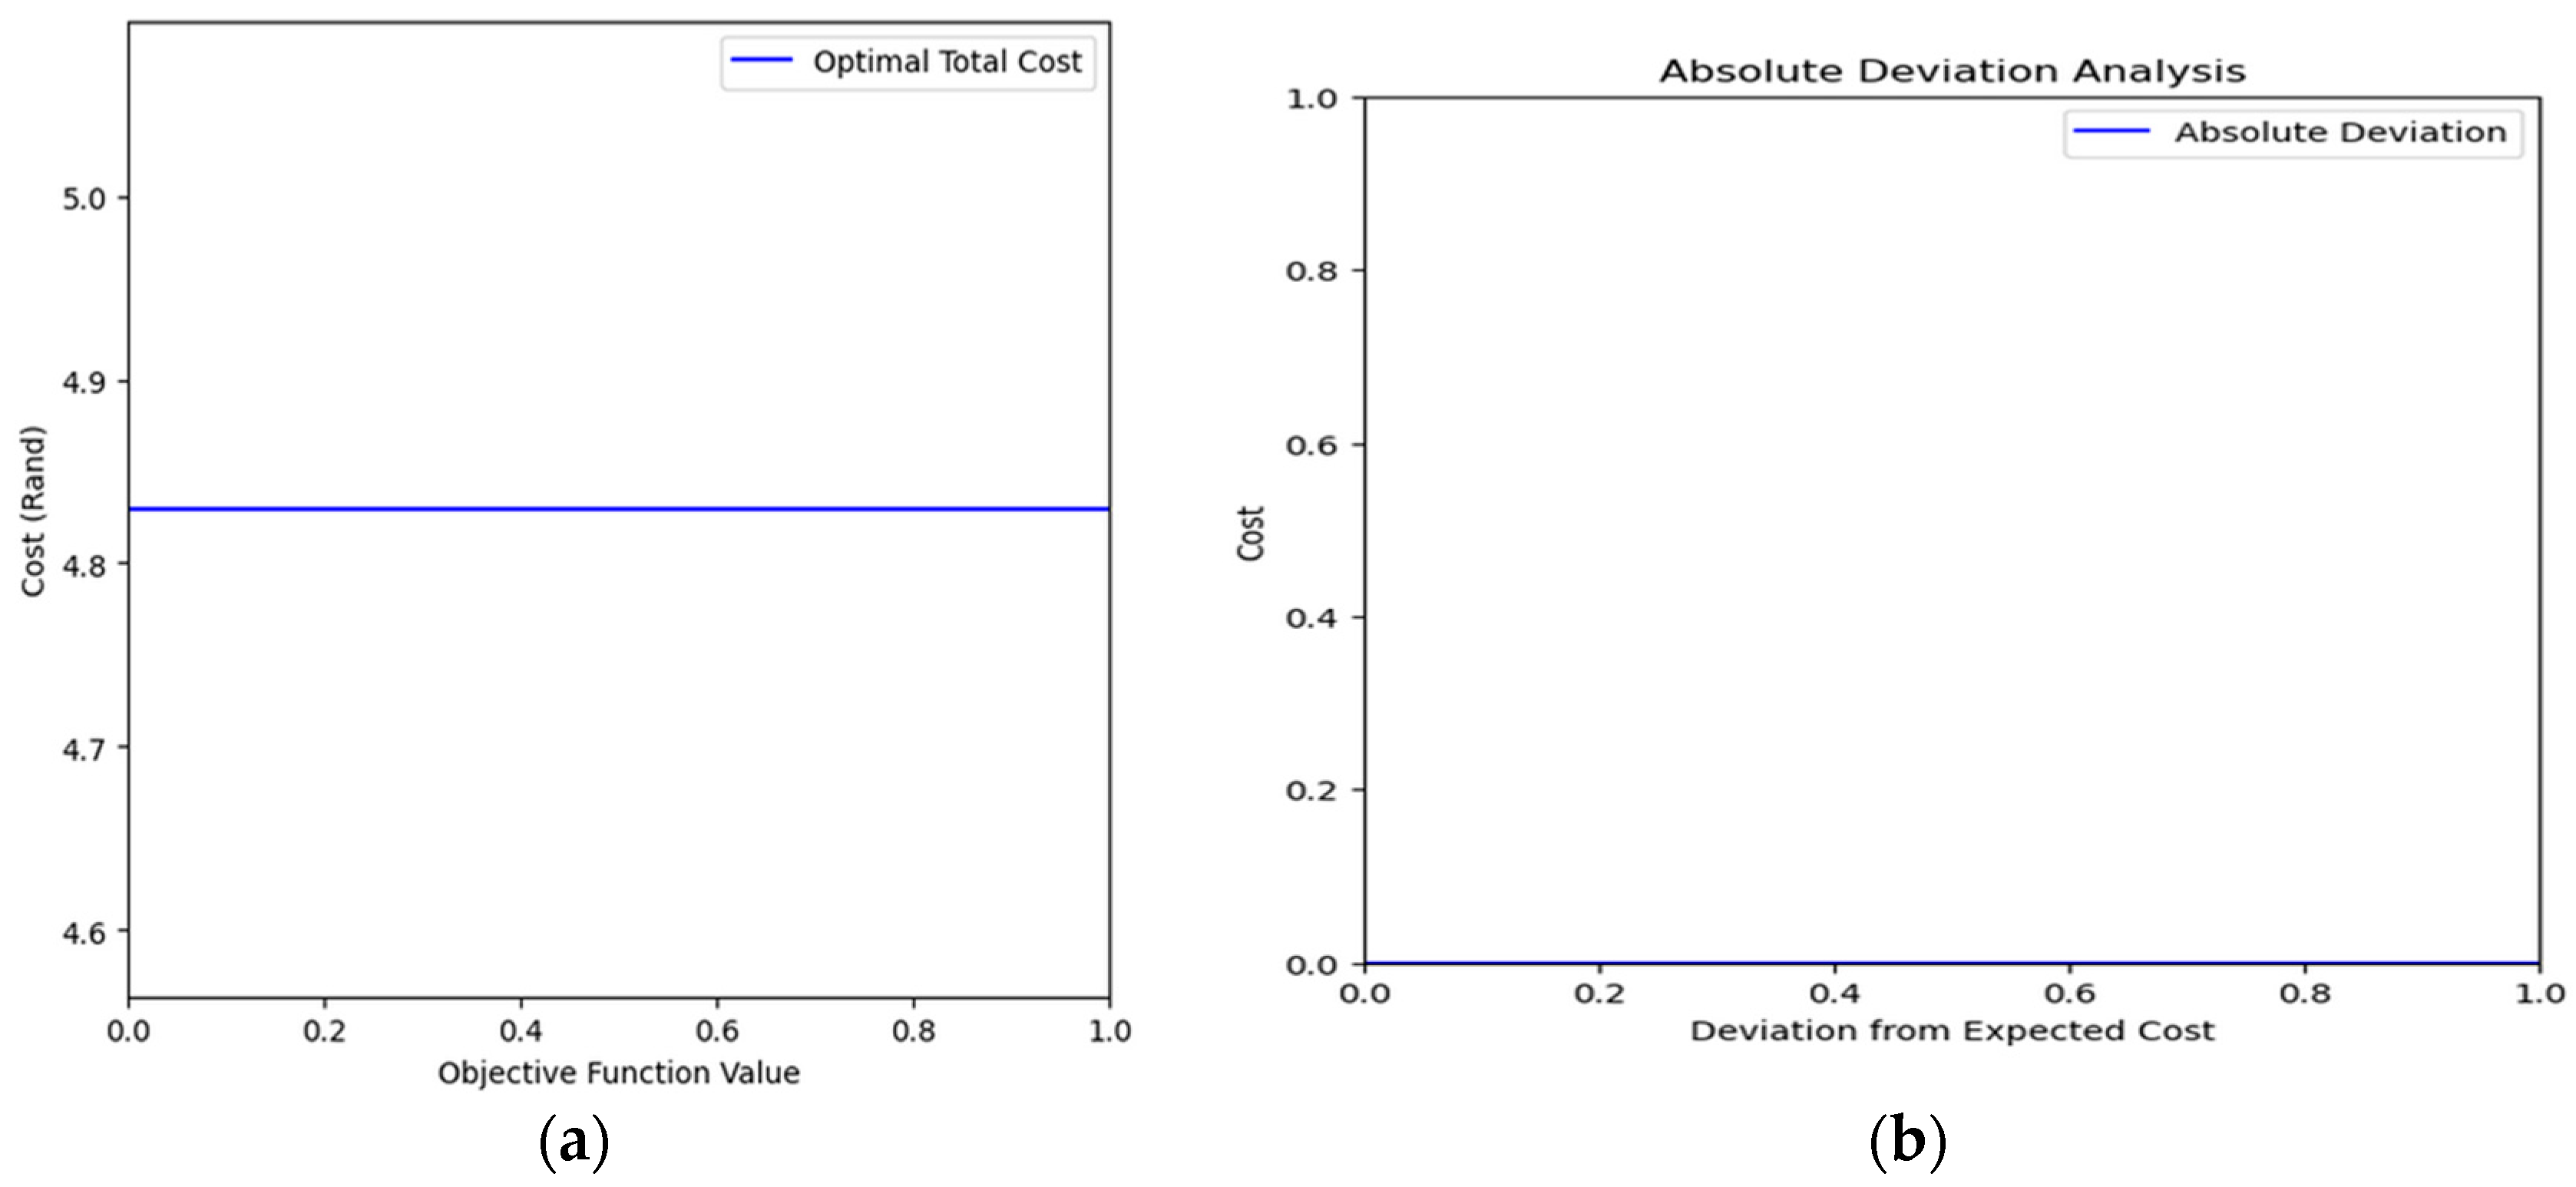
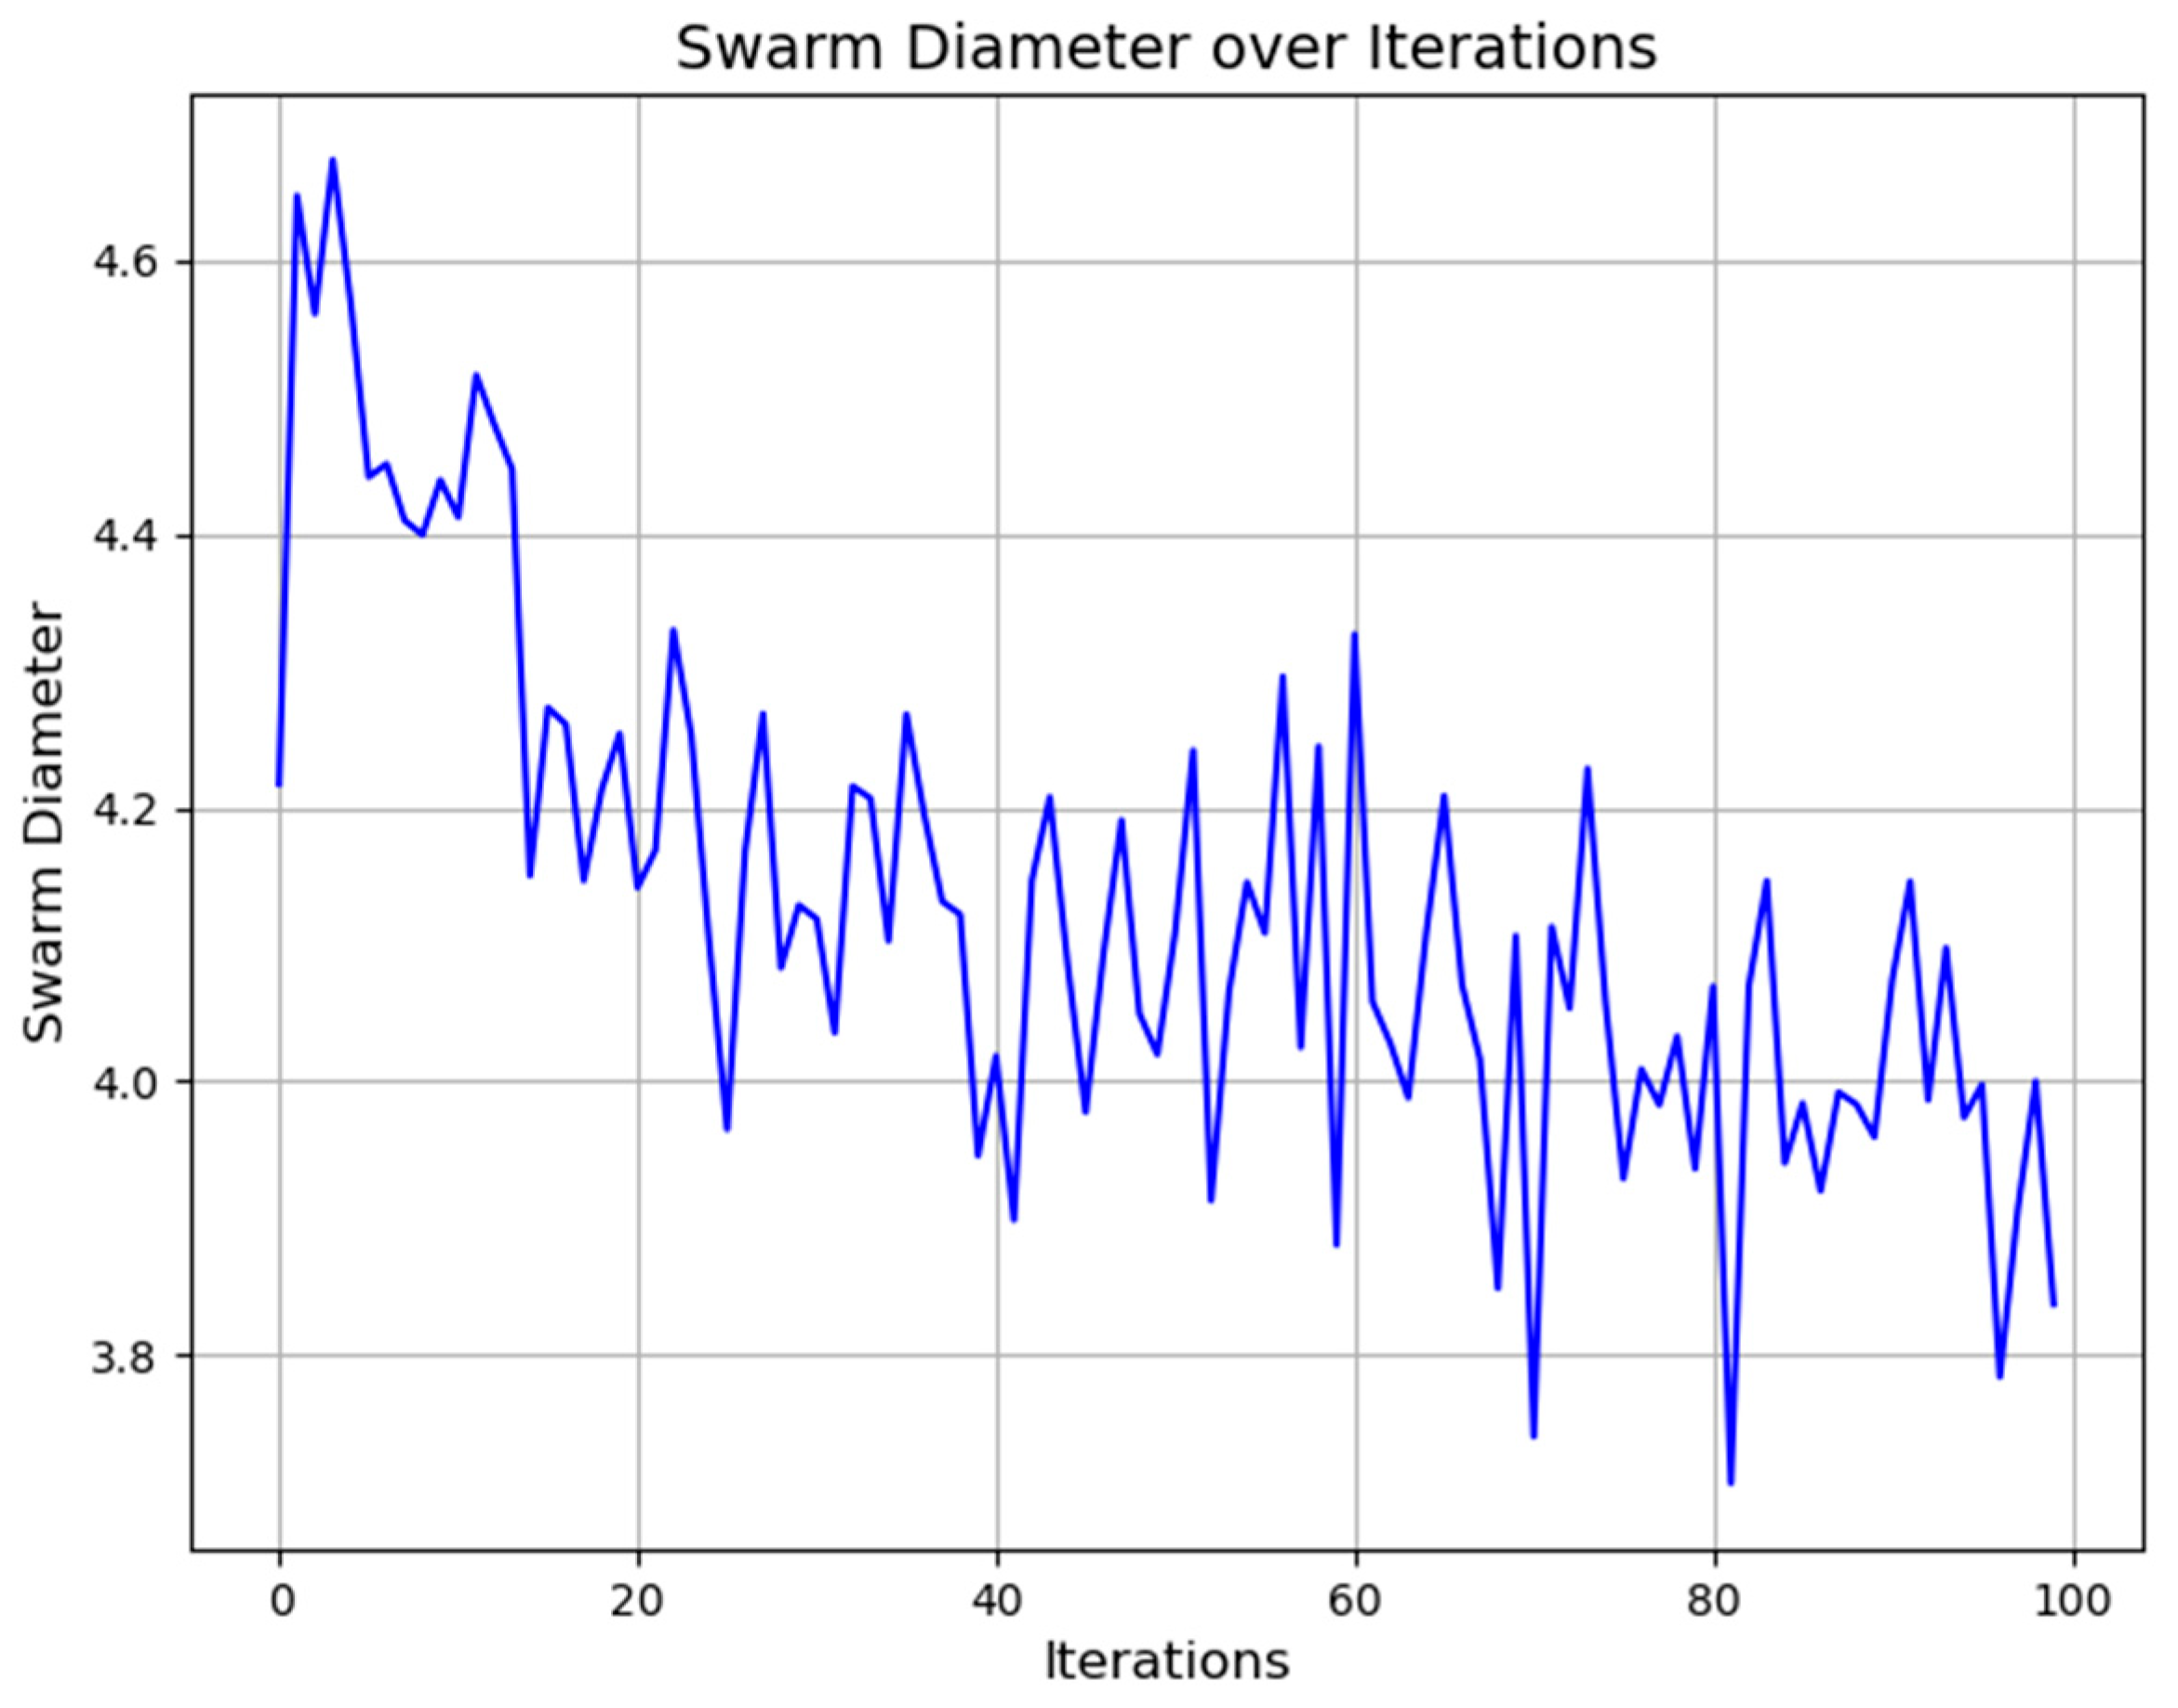
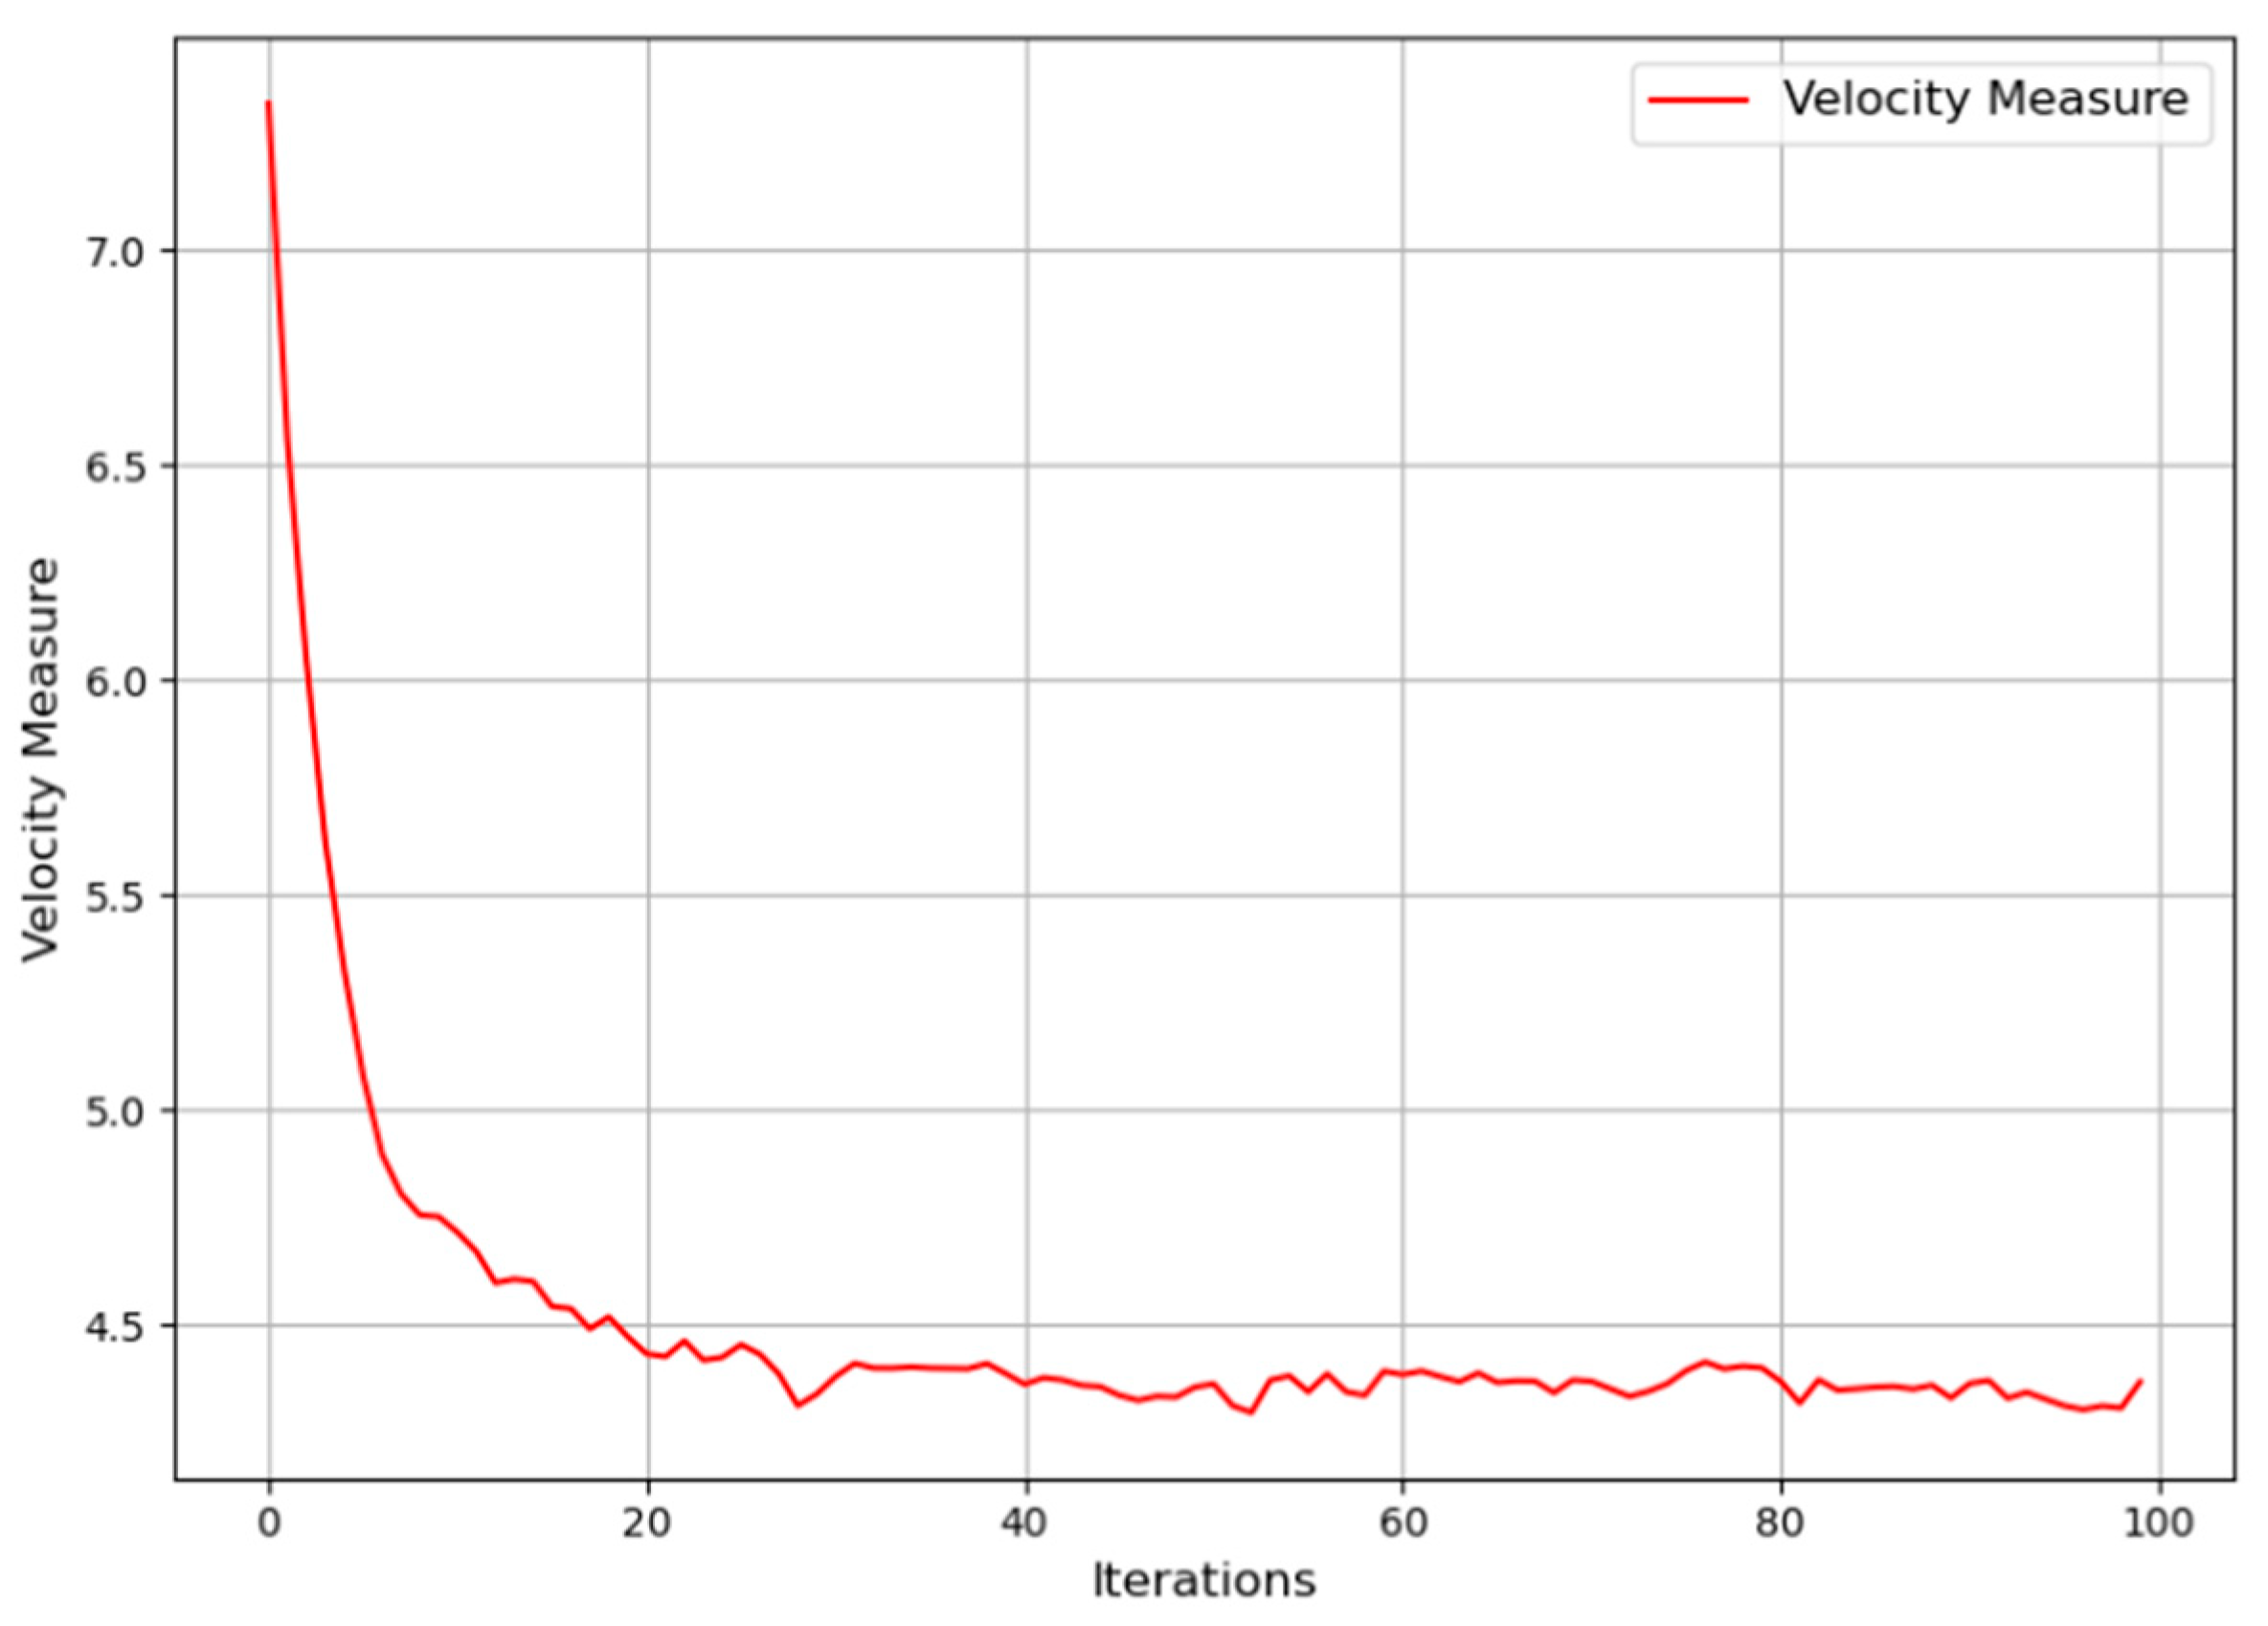
3.7. Results and Analyses

Ultimately, the parameters indicated in Table 6 are employed to fine-tune the PSO model.
The observed trend in the average distance measurement during the iterative process is significant for the research. The average distance, which began at 4.2 and decreased to 3.4 over the iteration, indicated particle convergence in the solution space. This decrease, as shown in Figure 11, indicates that the swarm is efficiently exploring and exploiting the solution space, focusing on promising locations. In terms of our project’s aims, this pattern is consistent with our goal of identifying optimal configurations for combining energy efficiency measures and renewable sources in an oil refinery, suggesting that the PSO algorithm refines its search successfully.
The evolution of the swarm diameter during the iterative process is important in this section. For example, the iterative trajectory from an initial diameter of 4.7 to a lowered size of 3.8 shows that the swarm’s particles are gradually converging (see Figure 12). This convergence is consistent with our project’s goal of reducing the solution space to discover the best configurations for energy-saving measures and renewable energy integration in an industrial context. The decreasing swarm diameter demonstrates the PSO algorithm’s effectiveness in concentrating the search and exploitation of prospective solutions, which contributes to the attainment of our project objectives.
The progressive decrease in average velocity from 7.8 to 4.25, as shown in Figure 13, indicates that the particles in the swarm are converging more carefully. This planned convergence is consistent with our project’s goal of refining and optimising solutions. The decreasing velocity indicates that the particles are fine-tuning their locations with greater accuracy, highlighting the PSO algorithm’s ability to iteratively explore the solution space. This fine-tuned control over particle mobility helps the programme find ideal designs for energy efficiency and renewable energy integration.
The remarkable outcomes of this research highlight the PSO algorithm’s efficiency, as summarised in Figure 14. The best cost attained, R4,457,527 per annum over iterations, is a remarkable optimisation result. The average cost, which implies steady performance, has stayed at its initial amount of R4,457,527, emphasising the convergence. The zero standard deviation highlights the algorithm’s stability, indicating a strong convergence to the optimal solution. This extraordinary stability is critical for the effective integration of energy-saving measures and renewable sources in an industrial environment, and it aligns well with the project’s goals.
The objection function value of R4,457,527.00 over iterations is a remarkable optimisation result as compared to the R4,829,638.88 obtained using linear programming. The average cost, which implies steady performance, has stayed at its initial amount of R4,457,527.00, emphasising the convergence.

4. Discussion

Based on the refinery’s geographic location and landscapes, the introduction of a RES such as a hybrid solar PV plus battery energy storage system has potential to reduce the refinery’s energy consumption by 281,601.60 kWh per annum. This reduction has a direct impact on the refinery’s electricity costs. A statistical calculation was considered in this research, which revealed the initial electricity cost for the refinery to be R11,660,623.56 prior to the application of the RES and R10,773,578.52 after the RES implementation, resulting in an approximately 8% reduction on the refinery’s electricity costs per annum. This outcome provided a projection on the expected percentage cost reduction when modelling the function objective via the PSO model. To thoroughly assess the PSO’s ability to improve the function objective of cost, LP was used to model the baseline scenario for the refinery’s initial cost of electricity, which was ZAR R4,829,638.88. However, this value differs from the annual cost of electricity of ZAR R11,660,623.56 achieved using the statistical calculation due to the variation in the LCOE input data. The statistical calculation considers the average annual grid cost for the low and high seasonal tariffs and encompasses the average annual cost of diesel for the genset backup power supply, whereas the LP model makes use of the monthly grid power tariffs. The PSO model was used to simulate the post RES application, which resulted in the cost of R4,457,527.00, achieving an approximate cost reduction for the refinery of 8% subject to the LP’s baseline cost of R4,829,638.88, showcasing its ability to minimise the objective function of cost.

5. Conclusions

The results and discussions demonstrate the PSO model’s usefulness in optimising the management of renewable energy sources in oil refineries. The changes seen in the average distance, swarm diameter, and velocity measurements show that the particles are effectively focusing and fine-tuning. This fits with the project’s goals of finding the best configurations for integrating renewable energy and saving energy. The PSO algorithm’s efficiency, which demonstrates the excellent results of the research, suggests the best cost of ZAR R4,457,527.00 over repetitions with a constant average cost and zero standard deviation. This stability is critical for effectively integrating energy-saving measures and renewable sources in an industrial context, and it is consistent with the project’s sustainability and environmental aims. In conclusion, the findings of this research provide important insights into the challenges of renewable energy integration in industrial settings. The suggested PSO-based strategy offers a strong approach to addressing difficulties and paving the path for a more sustainable and efficient energy future in oil refineries.

Author Contributions

All authors conceptualised the work, carried out the computations, conducted the investigations, and wrote and prepared the article. All authors have read and agreed to the published version of the manuscript.

Funding

This research received no external funding.

Data Availability Statement

The original contributions presented in the study are included in the article, further inquiries can be directed to the corresponding author.

Acknowledgments

The authors would like to thank local manufacturers and utilities for their contribution in the database.

Conflicts of Interest

The authors declare no conflicts of interest.

Appendix A

Table A1. Refinery’s High- and Low-Demand Season Properties.
Operation Hours per DayNo. of Hours/Day24.00
No. of operation days per weekNo. of days7.00
Operation hours during power peaks, weekdaysNo. of days5.00
Operation hours during power standard, weekdaysNo. of days11.00
Operation hours during power off-peak, weekdaysNo. of days8.00
Operation hours during power standard, SaturdayNo. of days7.00
Operation hours during power off-peak, SaturdayNo. of days17.00
Operation hours, Sunday, off-peakNo. of days24.00
Power Tariffs of Client
Tariff category E
Voltagein V240/400
High Demand (June–August): Qinter SeasonNo. of Months3.00
PeakZAR/kWh7.70
StandardZAR/kWh2.20
Off-peakZAR/kWh1.30
Ancillary service charge and network demand chargeZAR/kWh0.42
Low Demand (September–May): Summer SeasonNo. of Months9.00
PeakZAR/kWh2.34
StandardZAR/kWh1.54
Off-peakZAR/kWh1.15
Ancillary service charge and network demand chargeZAR/kWh0.42
Calculation of Weighted Power CostsUnitValue
High-Demand Season
Weighted average power tariff, weekdaysZAR/kWh3.465
Weighted average power tariff, SaturdayZAR/kWh1.981
Weighted average power tariff, SundayZAR/kWh1.719
Weighted average grid power tariff, high demandZAR/kWh3.003
Low-Demand Season
Weighted average power tariff, weekdaysZAR/kWh1.996
Weighted average power tariff, SaturdayZAR/kWh1.683
Weighted average power tariff, SundayZAR/kWh1.569
Weighted average grid power tariff, low demandZAR/kWh1.890
Weighted Average Grid Power Tariff, throughout the YearZAR/kWh2.168

References

  1. Anika, O.C.; Nnabuife, S.G.; Bello, A.; Okoroafor, E.R.; Kuang, B.; Villa, R. Prospects of low and zero-carbon renewable fuels in 1.5-degree net zero emission actualization by 2050: A critical review. Carbon Capture Sci. Technol. 2022, 5, 100072. [Google Scholar] [CrossRef]
  2. Chapungu, L.; Nhamo, G.; Chikodzi, D.; Maoela, M.A. BRICS and the Race to Net-Zero Emissions by 2050: Is COVID-19 a Barrier or an Opportunity? J. Open Innov. Technol. Mark. Complex. 2022, 8, 172. [Google Scholar] [CrossRef]
  3. Dragomir, V.D. The disclosure of industrial greenhouse gas emissions: A critical assessment of corporate sustainability reports. J. Clean. Prod. 2012, 29, 222–237. [Google Scholar] [CrossRef]
  4. Ma, S.; Lei, T.; Meng, J.; Liang, X.; Guan, D. Global oil refining’s contribution to greenhouse gas emissions from 2000 to 2021. Innovation 2023, 4, 100361. [Google Scholar] [CrossRef] [PubMed]
  5. Ning, K. Data Driven Artificial Intelligence Techniques in Renewable Energy System; Massachusetts Institute of Technology: Cambridge, MA, USA, 2021. [Google Scholar]
  6. Pasichnyi, O.; Levihn, F.; Shahrokni, H.; Wallin, J.; Kordas, O. Data-driven strategic planning of building energy retrofitting: The case of Stockholm. J. Clean. Prod. 2019, 233, 546–560. [Google Scholar] [CrossRef]
  7. Amer, M.; Namaane, A.; M’sirdi, N. Optimization of hybrid renewable energy systems (HRES) using PSO for cost reduction. Energy Procedia 2013, 42, 318–327. [Google Scholar] [CrossRef]
  8. Menzri, F.; Boutabba, T.; Benlaloui, I.; Khamari, D. Optimization of Energy management using a particle swarm optimization for hybrid renewable energy sources. In Proceedings of the 2022 2nd International Conference on Advanced Electrical Engineering (ICAEE), Constantine, Algeria, 29–31 October 2022; pp. 1–5. [Google Scholar]
  9. Liu, H.; Wu, B.; Maleki, A.; Pourfayaz, F. An improved particle swarm optimization for optimal configuration of standalone photovoltaic scheme components. Energy Sci. Eng. 2022, 10, 772–789. [Google Scholar] [CrossRef]
  10. Mohamed, M.A.; Eltamaly, A.M.; Alolah, A.I. PSO-based smart grid application for sizing and optimization of hybrid renewable energy systems. PLoS ONE 2016, 11, e0159702. [Google Scholar] [CrossRef] [PubMed]
  11. Ibrahim, A.Y.; Ashour, F.H.; Gadalla, M.A. Refining plant energy optimization. Alex. Eng. J. 2021, 60, 4593–4606. [Google Scholar] [CrossRef]
  12. Naz, M.; Bou-Rabee, M.; Shukrullah, S.; Ghaffar, A.; Gungor, A.; Sulaiman, S. A review of hybrid energy technologies tenets, controls and combinational strategies. Clean. Eng. Technol. 2021, 5, 100340. [Google Scholar] [CrossRef]
  13. Norouzi, N.; Kalantari, G.; Talebi, S. Combination of renewable energy in the refinery, with carbon emissions approach. Biointerface Res. Appl. Chem. 2020, 10, 5780–5786. [Google Scholar]
  14. Alhajri, I.H.; Taqvi, S. Mathematical Modeling and Analysis of Distributed Energy Systems for a Refinery in Kuwait. ACS Omega 2021, 6, 19778–19788. [Google Scholar] [CrossRef] [PubMed]
  15. Jahandideh-Tehrani, M.; Bozorg-Haddad, O.; Loáiciga, H.A. Application of particle swarm optimization to water management: An introduction and overview. Environ. Monit. Assess. 2020, 192, 281. [Google Scholar] [CrossRef] [PubMed]
  16. Eseye, A.T.; Zheng, D.; Zhang, J.; Wei, D. Optimal energy management strategy for an isolated industrial microgrid using a modified particle swarm optimization. In Proceedings of the 2016 IEEE International Conference on Power and Renewable Energy (ICPRE), Shanghai, China, 21–23 October 2016; pp. 494–498. [Google Scholar]
  17. Anh, H.P.H.; Kien, C.V. Optimal energy management of microgrid using advanced multi-objective particle swarm optimization. Eng. Comput. 2020, 37, 2085–2110. [Google Scholar] [CrossRef]
  18. Banos, R.; Manzano-Agugliaro, F.; Montoya, F.; Gil, C.; Alcayde, A.; Gómez, J. Optimization methods applied to renewable and sustainable energy: A review. Renew. Sustain. Energy Rev. 2011, 15, 1753–1766. [Google Scholar] [CrossRef]
  19. Haddad, M.; Nicod, J.M.; Varnier, C.; Peéra, M.-C. Mixed integer linear programming approach to optimize the hybrid renewable energy system management for supplying a stand-alone data center. In Proceedings of the 2019 Tenth International Green and Sustainable Computing Conference (IGSC), Alexandria, VA, USA, 21–24 October 2019; pp. 1–8. [Google Scholar]
  20. Mirbarati, S.H.; Heidari, N.; Nikoofard, A.; Danish, M.S.S.; Khosravy, M. Techno-economic-environmental energy management of a micro-grid: A mixed-integer linear programming approach. Sustainability 2022, 14, 15036. [Google Scholar] [CrossRef]
  21. Sigalo, M.B.; Pillai, A.C.; Das, S.; Abusara, M. An energy management system for the control of battery storage in a grid-connected microgrid using mixed integer linear programming. Energies 2021, 14, 6212. [Google Scholar] [CrossRef]
  22. Yang, Y.; Zhang, S.; Xiao, Y. An MILP (mixed integer linear programming) model for optimal design of district-scale distributed energy resource systems. Energy 2015, 90, 1901–1915. [Google Scholar] [CrossRef]
  23. Liu, H.; Zhang, X.-W.; Tu, L.-P. A modified particle swarm optimization using adaptive strategy. Expert Syst. Appl. 2020, 152, 113353. [Google Scholar] [CrossRef]
  24. Kennedy, J.; Eberhart, R. Particle swarm optimization. In Proceedings of the ICNN’95-International Conference on Neural Networks, Perth, WA, Australia, 27 November–1 December 1995; pp. 1942–1948. [Google Scholar]
  25. Clerc, M. Particle Swarm Optimization; John Wiley & Sons: Hoboken, NJ, USA, 2010. [Google Scholar]
  26. Ellabban, O.; Abu-Rub, H.; Blaabjerg, F. Renewable energy resources: Current status, future prospects and their enabling technology. Renew. Sustain. Energy Rev. 2014, 39, 748–764. [Google Scholar] [CrossRef]
  27. Farghali, M.; Osman, A.I.; Chen, Z.; Abdelhaleem, A.; Ihara, I.; Mohamed, I.M.; Yap, P.-S.; Rooney, D.W. Social, environmental, and economic consequences of integrating renewable energies in the electricity sector: A review. Environ. Chem. Lett. 2023, 21, 1381–1418. [Google Scholar] [CrossRef]
  28. Qazi, A.; Hussain, F.; Rahim, N.A.; Hardaker, G.; Alghazzawi, D.; Shaban, K.; Haruna, K. Towards sustainable energy: A systematic review of renewable energy sources, technologies, and public opinions. IEEE Access 2019, 7, 63837–63851. [Google Scholar] [CrossRef]
  29. Salvarli, M.S.; Salvarli, H. For Sustainable Development: Future Trends in Renewable Energy and Enabling Technologies, Renewable Energy-Resources, Challenges and Applications; IntechOpen: London, UK, 2020. [Google Scholar]
  30. Kennedy, J.; Eberhart, R.C. A discrete binary version of the particle swarm algorithm. In Proceedings of the 1997 IEEE International Conference on Systems, Man, and Cybernetics, Computational Cybernetics and Simulation, Orlando, FL, USA, 12–15 October 1997; pp. 4104–4108. [Google Scholar]
  31. Erero, J.L. Impact of loadshedding in South Africa: A CGE analysis. J. Econ. Political Econ. 2023, 10, 78–94. [Google Scholar]
Figure 1. Implementation of PSO algorithm.
Energies 17 03929 g001
Figure 2. Flowchart for implementing an LP model in Python to minimise the total energy cost.
Energies 17 03929 g002
Figure 3. Oil refinery’s 12-month electricity consumption profile.
Energies 17 03929 g003
Figure 4. Low- and high-demand seasons in South Africa.
Energies 17 03929 g004
Figure 5. Refinery’s annual kWh for each TOU category.
Energies 17 03929 g005
Figure 6. Solar Resource and Wind Atlas for South Africa maps.
Energies 17 03929 g006aEnergies 17 03929 g006b
Figure 7. Refinery site layout.
Energies 17 03929 g007
Figure 8. South African load-shedding analysis: 2007 to 2022 [31].
Energies 17 03929 g008
Figure 9. Flowchart of iterative linear programming algorithm for optimal management of renewable energy source problem.
Energies 17 03929 g009
Figure 10. (a) Optimal solution to the management of the renewable energy source problem using LP. (b) Absolute deviation analysis for the LP problem.
Energies 17 03929 g010
Figure 11. Average distance over iterations.
Energies 17 03929 g011
Figure 12. Average diameter over iterations.
Energies 17 03929 g012
Figure 13. Velocity measurement over iterations.
Energies 17 03929 g013
Figure 14. Best cost, mean cost and standard deviation over iterations.
Energies 17 03929 g014
Table 1. Particle swarm optimisation algorithm.
StepDescription
1Initialisation: The process begins by creating a swarm of particles, each assigned random positions and velocities within the given solution space. The particles should be assigned fitness values according to the objective function. The personal best position of each particle and the global best position discovered by any particle in the swarm are recorded.
2Iterative Update: To ensure the termination criterion is met, the subsequent steps are repeated for each particle in the swarm until either a maximum number of iterations is reached or sufficient convergence is achieved.
3Velocity Update: The new velocity for the particle can be determined by applying the given formula:
V i t + 1 = w · V i t + c 1 · r 1 · P i X i t + c 2 · r 2 · P g l o b a l X i t (1)
where
V i t + 1 the   updated   velocity   of   particle   i in the next iteration;
w —the inertia weight;
c 1   and   c 2 —the cognitive and social learning rates;
r 1   and   r 2 random   values   between   0   and   1 ;
P i the   personal   best   solution   of   particle   i ;
P g l o b a l —the global best solution found by any particle.
4Position Update: The particle’s position is updated by incorporating the new velocity.
X i t + 1 = X i t + V i t + 1 (2)
5Fitness Evaluation: The level of suitability of the new position is assessed by utilising the objective function. When the fitness of the particle improves, it is necessary to update its personal best solution. If the solution is deemed the most optimal within the entire swarm, the global best solution must be updated.
6Termination Check: The termination criteria are examined. If the conditions are satisfied, the algorithm is terminated; otherwise, Step 3 is performed for the next iteration.
7Conclusion: The algorithm reaches its conclusion when the termination criteria are satisfied. At this point, the global best solution is determined, which represents the optimised solution to the given problem.
Table 2. Decision variables.
VariableMeaning
P R E , i , t The optimisation of energy produced using renewable energy technologies in a certain time, denoted as t , which is the focus of this study.
P g r i d , t The purchase of electricity from the power grid at a certain time interval t .
P s t o r a g e , j , t The energy that is either stored or released by storage technology j within a certain time t .
S O S s t o r a g e , j , t The present level of energy storage technology j ’s state of charge (SOC) throughout the period t .
Table 3. Refinery input parameters.
Refinery Input ParametersSpecification
Roof area available for renewable energy installations1198 m2
Global Horizontal Irradiation1972 kWh/m2
MunicipalityEkurhuleni
Diesel consumption
Diesel tariffR13/L
Area of each PV module2564 m2
Power on each PV module540 W
Annual average grid power tariffR2.168
Levelised Cost of Electricity (LCOE) grid + gensetR5.98
Levelised Cost of Electricity (LCOE) PV solar + BESSR2.83
Table 4. Refinery’s cost of electricity before solar system + BESS application.
Electricity ComponentCost (R)
Std TOU kWh/annum743,680.15
Peak TOU kWh/annum288,422.15
Off-peak TOU kWh/annum917,834.75
Total TOU kWh/annum1,949,937.05
LCOE (grid/genset)R5.98
Std TOU Cost/annumR4,447,207.30
Peak TOU Cost/annumR1,724,764.46
Off-peak TOU Cost/annumR5,488,651.81
Total Cost/annumR11,660,623.56
Table 5. Refinery’s cost of electricity after solar system + BESS application.
Post Solar System + BESS Electricity ProfileCost (R)
Solar Std TOU kWh/annumR281,601.60
Grid Std TOU kWh/annumR462,078.55
Peak TOU kWh/annumR288,422.15
Off-peak TOU kWh/annumR917,834.75
Total TOU kWh/annum1,949,937.05
LCOE (grid/genset)R5.98
LCOE (solar system + BESS)R2.83
Solar Std TOU cost/annumR796,932.53
Grid Std TOU cost/annumR2,763,229,729
Peak TOU cost/annumR1,724,764.46
Off-peak TOU cost/annumR5,488,651.81
Total cost/annumR10,773,578.52
Table 6. Parameters of the PSO algorithm.
c 1 c 2 ω m a x ω m i n n P a r t i c l e s n I t e r a t i o n f t o l _ i t e r C e n t r e b h _ S t r a t e g y
0.50.30.90.41010011.0Periodic
Disclaimer/Publisher’s Note: The statements, opinions and data contained in all publications are solely those of the individual author(s) and contributor(s) and not of MDPI and/or the editor(s). MDPI and/or the editor(s) disclaim responsibility for any injury to people or property resulting from any ideas, methods, instructions or products referred to in the content.

