Article

Effect of Using Moisture-Buffering Finishing Materials and DCV Systems on Environmental Comfort and Energy Consumption in Buildings

by
Dobrosława Kaczorek
1,* and
Małgorzata Basińska
2
1
Thermal Physics, Acoustics and Environment Department, Building Research Institute (ITB), Filtrowa 1 Str., 00-611 Warsaw, Poland
2
Institute of Environmental Engineering and Building Installations, Faculty of Environmental Engineering and Energy, Poznan University of Technology, Berdychowo 4 Str., 61-131 Poznań, Poland
*
Author to whom correspondence should be addressed.
Energies 2024, 17(16), 3937; https://doi.org/10.3390/en17163937
Submission received: 24 June 2024 / Revised: 31 July 2024 / Accepted: 1 August 2024 / Published: 8 August 2024

Abstract

:
One of the technical solutions to improve indoor thermal comfort and reduce energy consumption in buildings is the use of demand-controlled ventilation (DCV) systems. The choice of the control method becomes more important when the walls in the room are finished with moisture-buffering materials. This study explores the impact of four DCV system control scenarios (control of temperature, relative humidity, and carbon dioxide concentration for two different supply airflows to the room) combined with various indoor moisture-buffering materials (gypsum board and cement–lime plaster) on the variability of indoor air quality parameters, thermal comfort, and energy. The analysis was performed by computer simulation using WUFI Plus v.3.1.0.3 software for whole-building hydrothermal analysis. Control-based systems that maintain appropriate relative humidity levels were found to be the most favourable for localised comfort and were more effective in terms of energy consumption for heating and cooling without humidification and dehumidification. This research also revealed that the moisture-buffering effect of finishing materials can passively contribute to enhancing indoor air quality, regardless of the room’s purpose. However, higher energy consumption for heating was observed for better moisture-buffering materials.

1. Introduction

The indoor environmental quality (IEQ) in enclosed spaces, where we spend the most time (offices, houses, public buildings, etc.), has a significant impact on occupant health [1] and work performance [2]. Studies recently revealed that developing a good indoor environment contributes to people’s general satisfaction [3,4]. Nearly all of the methods and tools used for sustainable construction assessment consider thermal comfort to be one of the most significant assessment parameters [5,6]. According to the provisions of the EU Directive on the energy characteristics of buildings [7], stating that “the energy needs for space heating, space cooling, domestic hot water, ventilation, lighting, and other technical building systems shall be calculated in order to optimise health, indoor air quality and comfort levels”, it has become necessary to include the impact of thermal efficiency improvement on IEQ. In this context, Fanger’s model appears to be suitable as a tool for assessing thermal comfort. It is described in detail in the standards [8,9] and is based on two assessment indices, that is, the Predicted Mean Vote (PMV) and the Predicted Percentage of Dissatisfied (PDD). The PMV index characterises a human’s thermal experience on a seven-point scale, while the PPD index represents the percentage of people dissatisfied with the developed thermal equilibrium. This method considers variables such as the thermal resistance of clothes, human physical activity, pollution emissions, indoor carbon dioxide concentration, relative humidity, and temperature.
Maintaining uniform indoor temperature and humidity using ventilation and air-conditioning (HVAC) systems to satisfy users’ individual thermal comfort needs is challenging [10]. This difficulty results from the occupants’ diversified personal preferences, time-variable heat gains and losses, indoor moisture levels, and imperfect control of HVAC systems. An additional problem occurs when energy efficiency requirements for buildings must be met. Reducing the final energy supplied to the building is often achieved by limiting the ventilation-based index of heat loss, which may consequently lead to the deterioration of environmental conditions within the room. Moreover, using effective HVAC system solutions, combined with increasing thermal comfort requirements, results in higher energy consumption in buildings, which contradicts the increasingly stringent requirements for the energy efficiency of buildings. Thus, savings related to HVAC systems have become the focus of many research groups working to develop competitive solutions to reduce the demand for final energy and simultaneously provide comfortable indoor conditions for occupants [11,12]. One solution is a smart ventilation system based on demand-controlled ventilation (DCV) [13,14], which was confirmed in studies conducted by Afroz et al. [15]. DCV changes the ventilation flow rate automatically and continuously depending on the measurement of indoor air quality (IAQ) and/or thermal comfort parameters [16]. It contributes to additional energy reduction related to a higher heat recovery coefficient and lower fan power when the airflow is below the maximum capacity [17]. Using hygroscopic materials can be another method to improve thermal comfort, particularly in relation to indoor humidity conditions. Because of their ability to absorb or release moisture depending on the indoor humidity level, hygroscopic materials reduce relative humidity fluctuations in the air by maintaining them within specified limits; this ability, called moisture buffering, can be investigated using several methods. The literature mentions documented numerical simulation tests [18,19,20,21,22,23,24,25,26,27], laboratory experiments [28,29], and real-life tests in buildings [30,31]. In most studies, a time-constant value of air exchange was assumed for the ventilation systems. There are only a few studies on moisture-buffering potential combined with other ventilation control methods. Woloszyn et al. [32] investigated the impact of a relative-humidity-sensitive (RHS) ventilation system combined with indoor moisture-buffering materials on the indoor climate and energy efficiency of a building. Their study results revealed that RHS ventilation reduces the span between the minimum and maximum indoor RH values and generates energy savings by maintaining the relative humidity at the required level. One disadvantage of this type of ventilation is that other pollutants (e.g., CO2) exceed the expected values. On the other hand, Pedram and Tariku [33] focused on analysing test buildings situated in a maritime climate. They investigated the indoor relative humidity level for four ventilation control methods using a moisture-buffering material in the form of non-coated gypsum boards to finish the walls. Their results revealed that the moisture-buffering potential of gypsum boards effectively regulated the indoor humidity peak values and maintained the relative humidity levels within acceptable limits when combined with adequate ventilation. In combination with time- and demand-controlled ventilation schemes, the moisture-buffering effect of gypsum boards provides a competitive advantage for controlling indoor moisture and air quality and minimising ventilation heat losses. To improve IAQ in the context of indoor occupants’ health, the efficiency of a standard ventilation system, depending on its control method, should be analysed. The authors claim that in seeking a compromise between minimising the final energy consumption in a building and the indoor air quality (IAQ), studies are needed that include a combination of the moisture-buffering effect of hygroscopic materials with DCV.
The literature review showed that there is a lack of comprehensive research on the moisture-buffering potential of finishing materials in reducing energy consumption and improving indoor environmental quality in combination with various operating strategies of ventilation systems. Therefore, to address this deficiency, this study presents the relationship between the moisture-buffering capacity of materials and DCV ventilation systems. Moreover, the aim of this study was to assess the potential of using moisture-buffering materials on interior surfaces in rooms in combination with DCV systems to achieve appropriate thermal comfort, CO2 concentration, and energy efficiency in the building.

2. Methods

The applied methodology was mainly aimed at examining the impact of the implemented engineering and construction solutions on the number of hours when acceptable indoor climate parameters were maintained. This study examined the impact of four demand-controlled ventilation (DCV) system control strategies for different indoor surface finishes and indoor environmental quality, evaluated using PMV and PPD comfort indices. The analyses were performed in a room with two occupancy options. The nursery (B1) was the original function and was then transformed into an office (B2). Abuimara et al. used a similar evaluation method by identifying the number of hours when the occupants experienced discomfort [34]. In their studies, the authors referred to office spaces using variable scenarios of occupant distribution in the room; they evaluated the benefits of implementing adaptation technologies such as demand-controlled ventilation to alleviate the impact of variable occupant distribution scenarios.

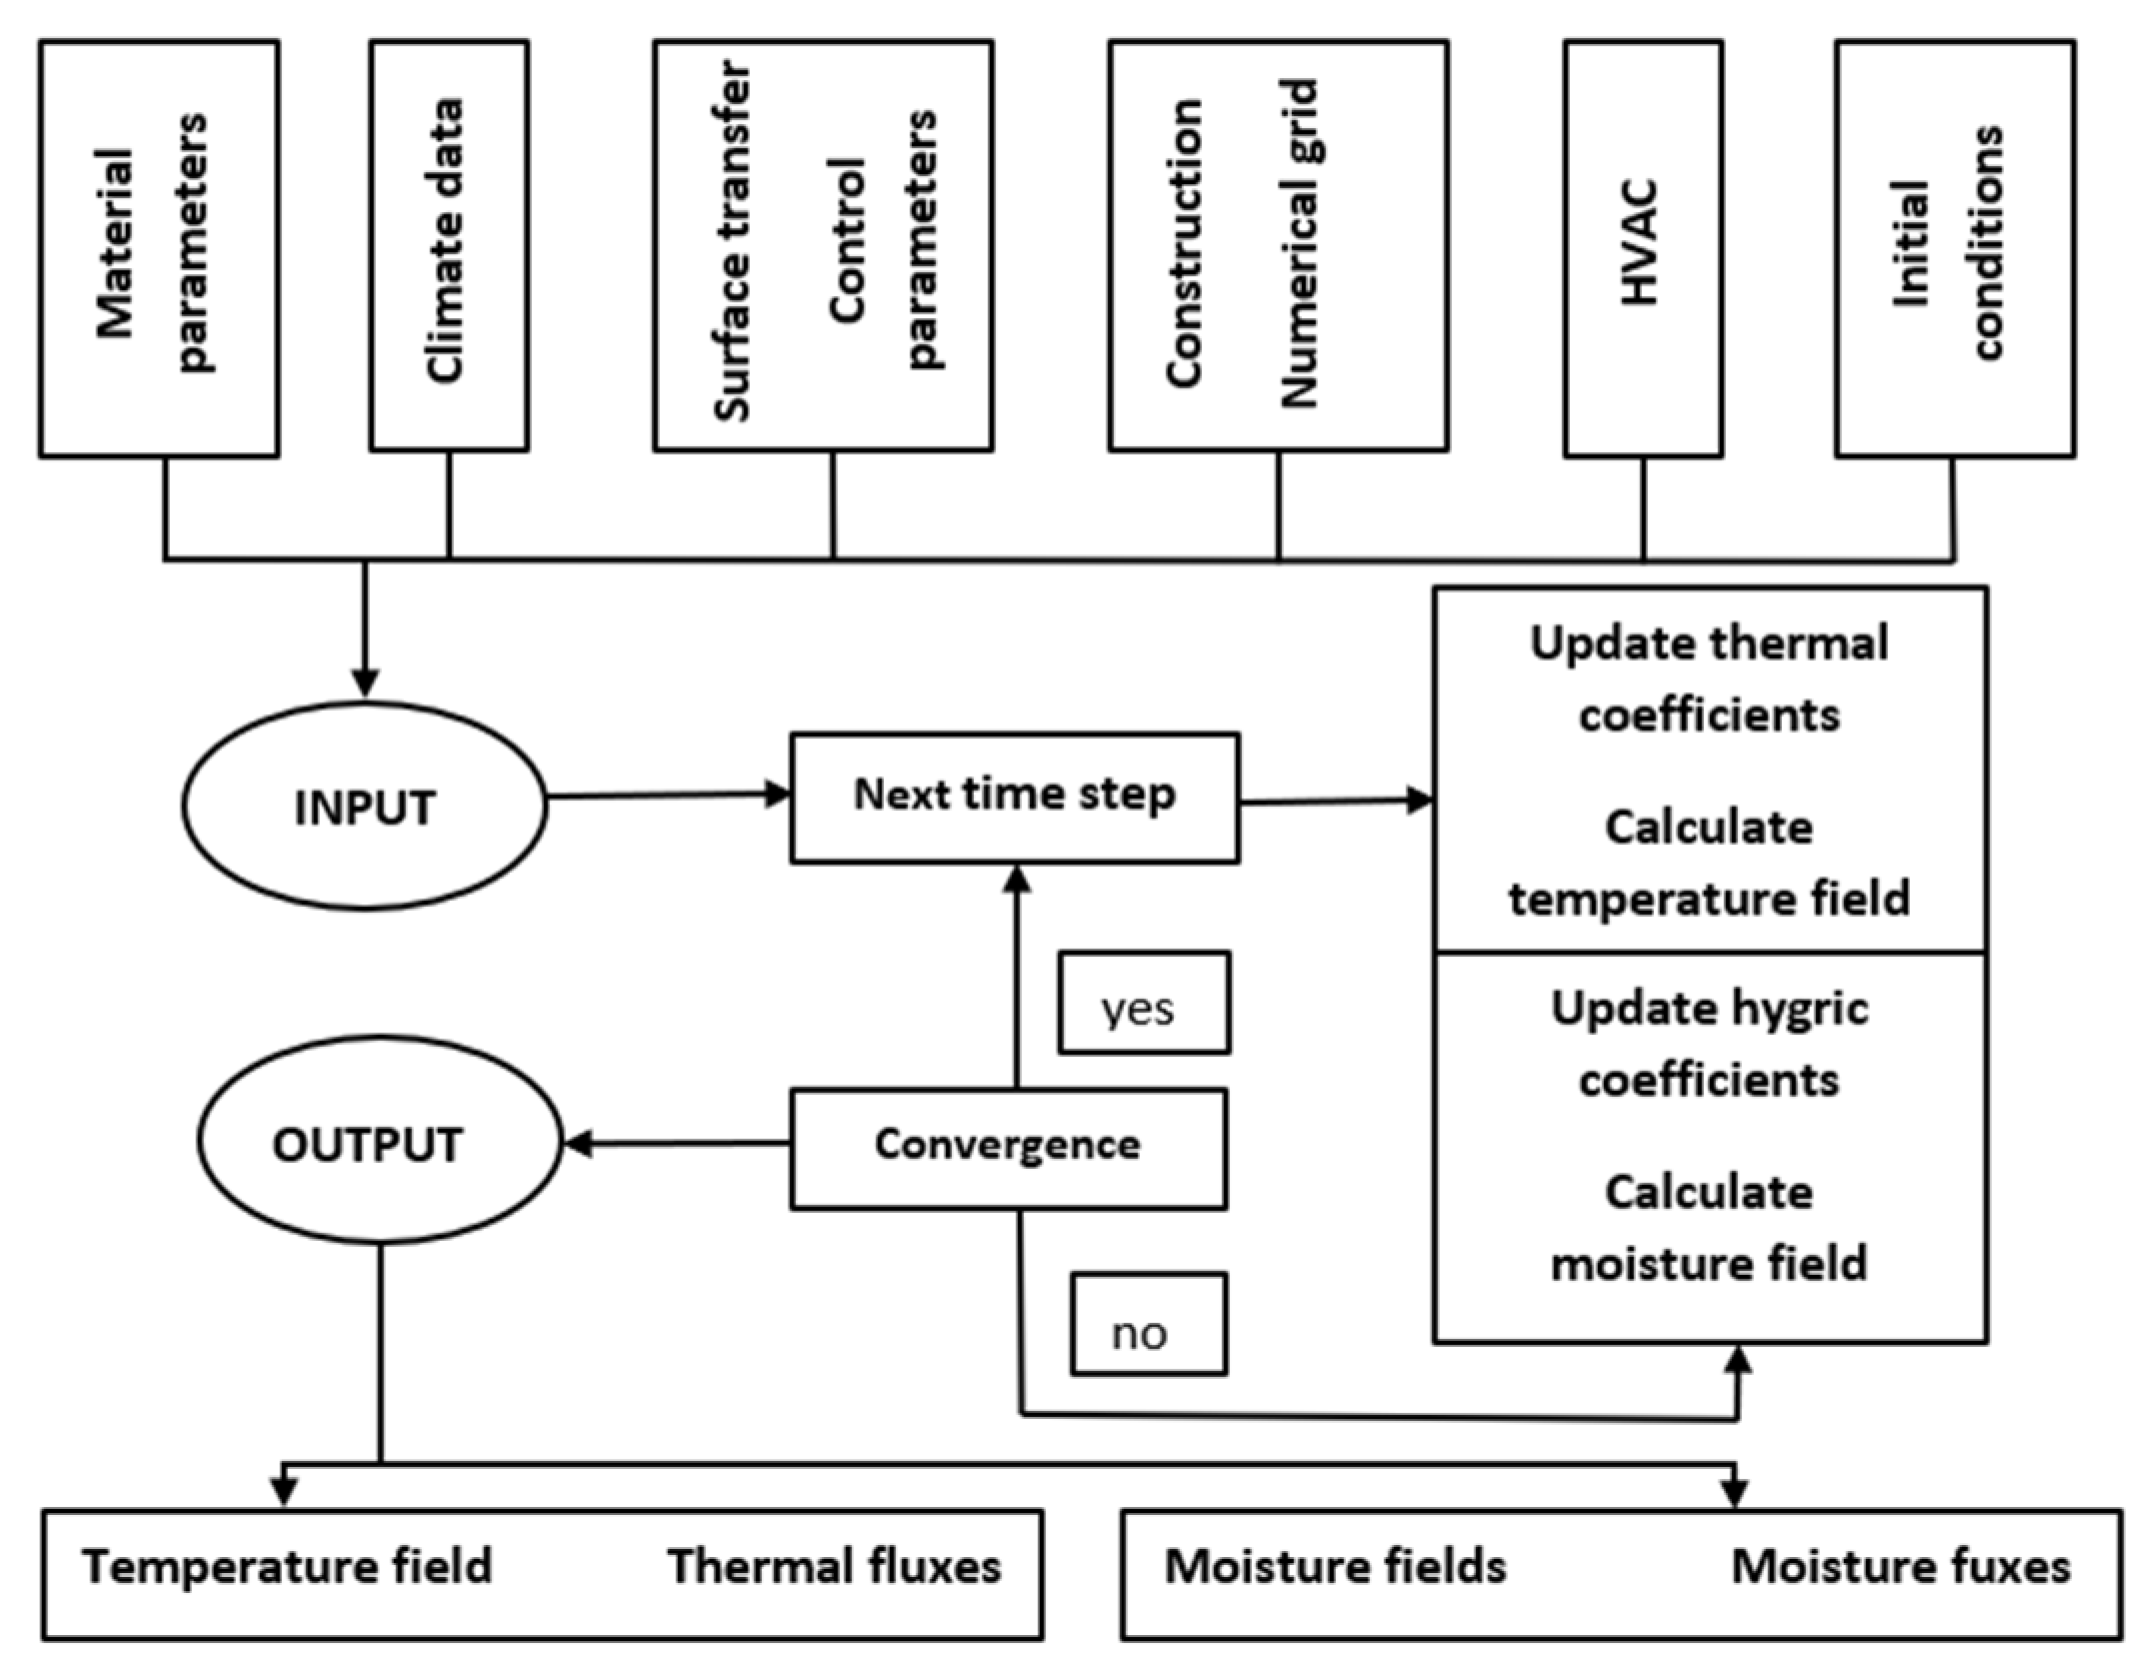
2.1. Model of Heat and Moisture Transfer

A commercial simulation tool was used to estimate the effectiveness of energy-saving DCV systems combined with indoor moisture-buffering materials, which affect energy consumption and indoor air quality. The use of hygroscopic materials on the internal surfaces of the walls influenced, due to the need to take into account humidity behaviour, the selection of WUFI Plus software [35] developed by the Fraunhofer Institute for Building Physics in Germany. In addition to simulating the hygrothermal conditions of building components, WUFI Plus, which calculates the coupled heat and moisture transfer, can simulate indoor hygrothermal environments by considering the interactions between wall layers, room occupancy scenarios, HVAC system solutions, and other variables. This approach helps evaluate a building’s comfort and energy consumption. The mathematical and physical models of WUFI Plus were based on the assumptions presented in Künzel’s study [36]. In the WUFI Plus simulation model, the heat and moisture balance equations were formulated as follows:
d H d T T t = · λ T + h v · δ p φ · p s a t
d w d φ φ t = · D φ φ + δ p φ · p s a t
where
dH/dT—heat storage capacity of the moist building material, J/(m3·K);
λ—thermal conductivity, W/(m·K);
hv—latent heat of evaporation, J/kg;
δp—water vapour permeability of the building material, kg/(m·s·Pa);
dw/dφ—moisture storage capacity of the building material, kg/m3;
φ—relative humidity, −;
Dφ—liquid transport coefficient of the building material, kg/(m·s);
psat—water vapour saturation pressure, Pa;
T—temperature, °C.
A flowchart of the hygrothermal calculation process for WUFI Plus is shown in Figure 1.

2.1.1. Validation

Numerous factors impact the transfer of heat and moisture within building envelopes. The precision of the simulation results relies on the configuration of the boundary conditions and the selection of an appropriate model. Therefore, it is crucial to conduct experiments to validate the model selection and boundary condition settings for accuracy. Although previous studies [22,37] have validated WUFI Plus, we conducted measurements in a nursery on 13–14 December 2021 to evaluate changes in indoor temperature, humidity, and CO2 concentration. A comprehensive description of this experiment can be found in our previous study [38]. We compared the agreement between the measured and simulated data using statistical metrics, such as the Variation of the Root Mean Square Error (CV(RMSE)) and the Normalised Mean Bias Error (NMBE). Following the criteria outlined in [39,40], where CV(RMSE) < 30% and NMBE < ±10% were employed for hourly data, the simulated results demonstrated substantial agreement with the measured data, especially with respect to temperature and humidity. Nevertheless, it is worth noting that the simulations do not account for the real-time functioning of thermostatic control valves, which exhibit some delay owing to their proportional range (P–2K) when considering room temperature.

2.1.2. Assumptions

A simulation model was developed for a real building in Warsaw (52.13 °N and 21.00 °E). This part of Poland belongs to a moderate, warm, and transitional climate zone. The average monthly temperature (T) and relative humidity (RH) for Warsaw are shown in Table 1.
The simulations were conducted between 1 September 2021 and 31 August 2022 with a maximum time step of one hour. The following initial conditions were adopted: 20 °C indoor temperature, 50% relative humidity, and 400 ppm CO2.

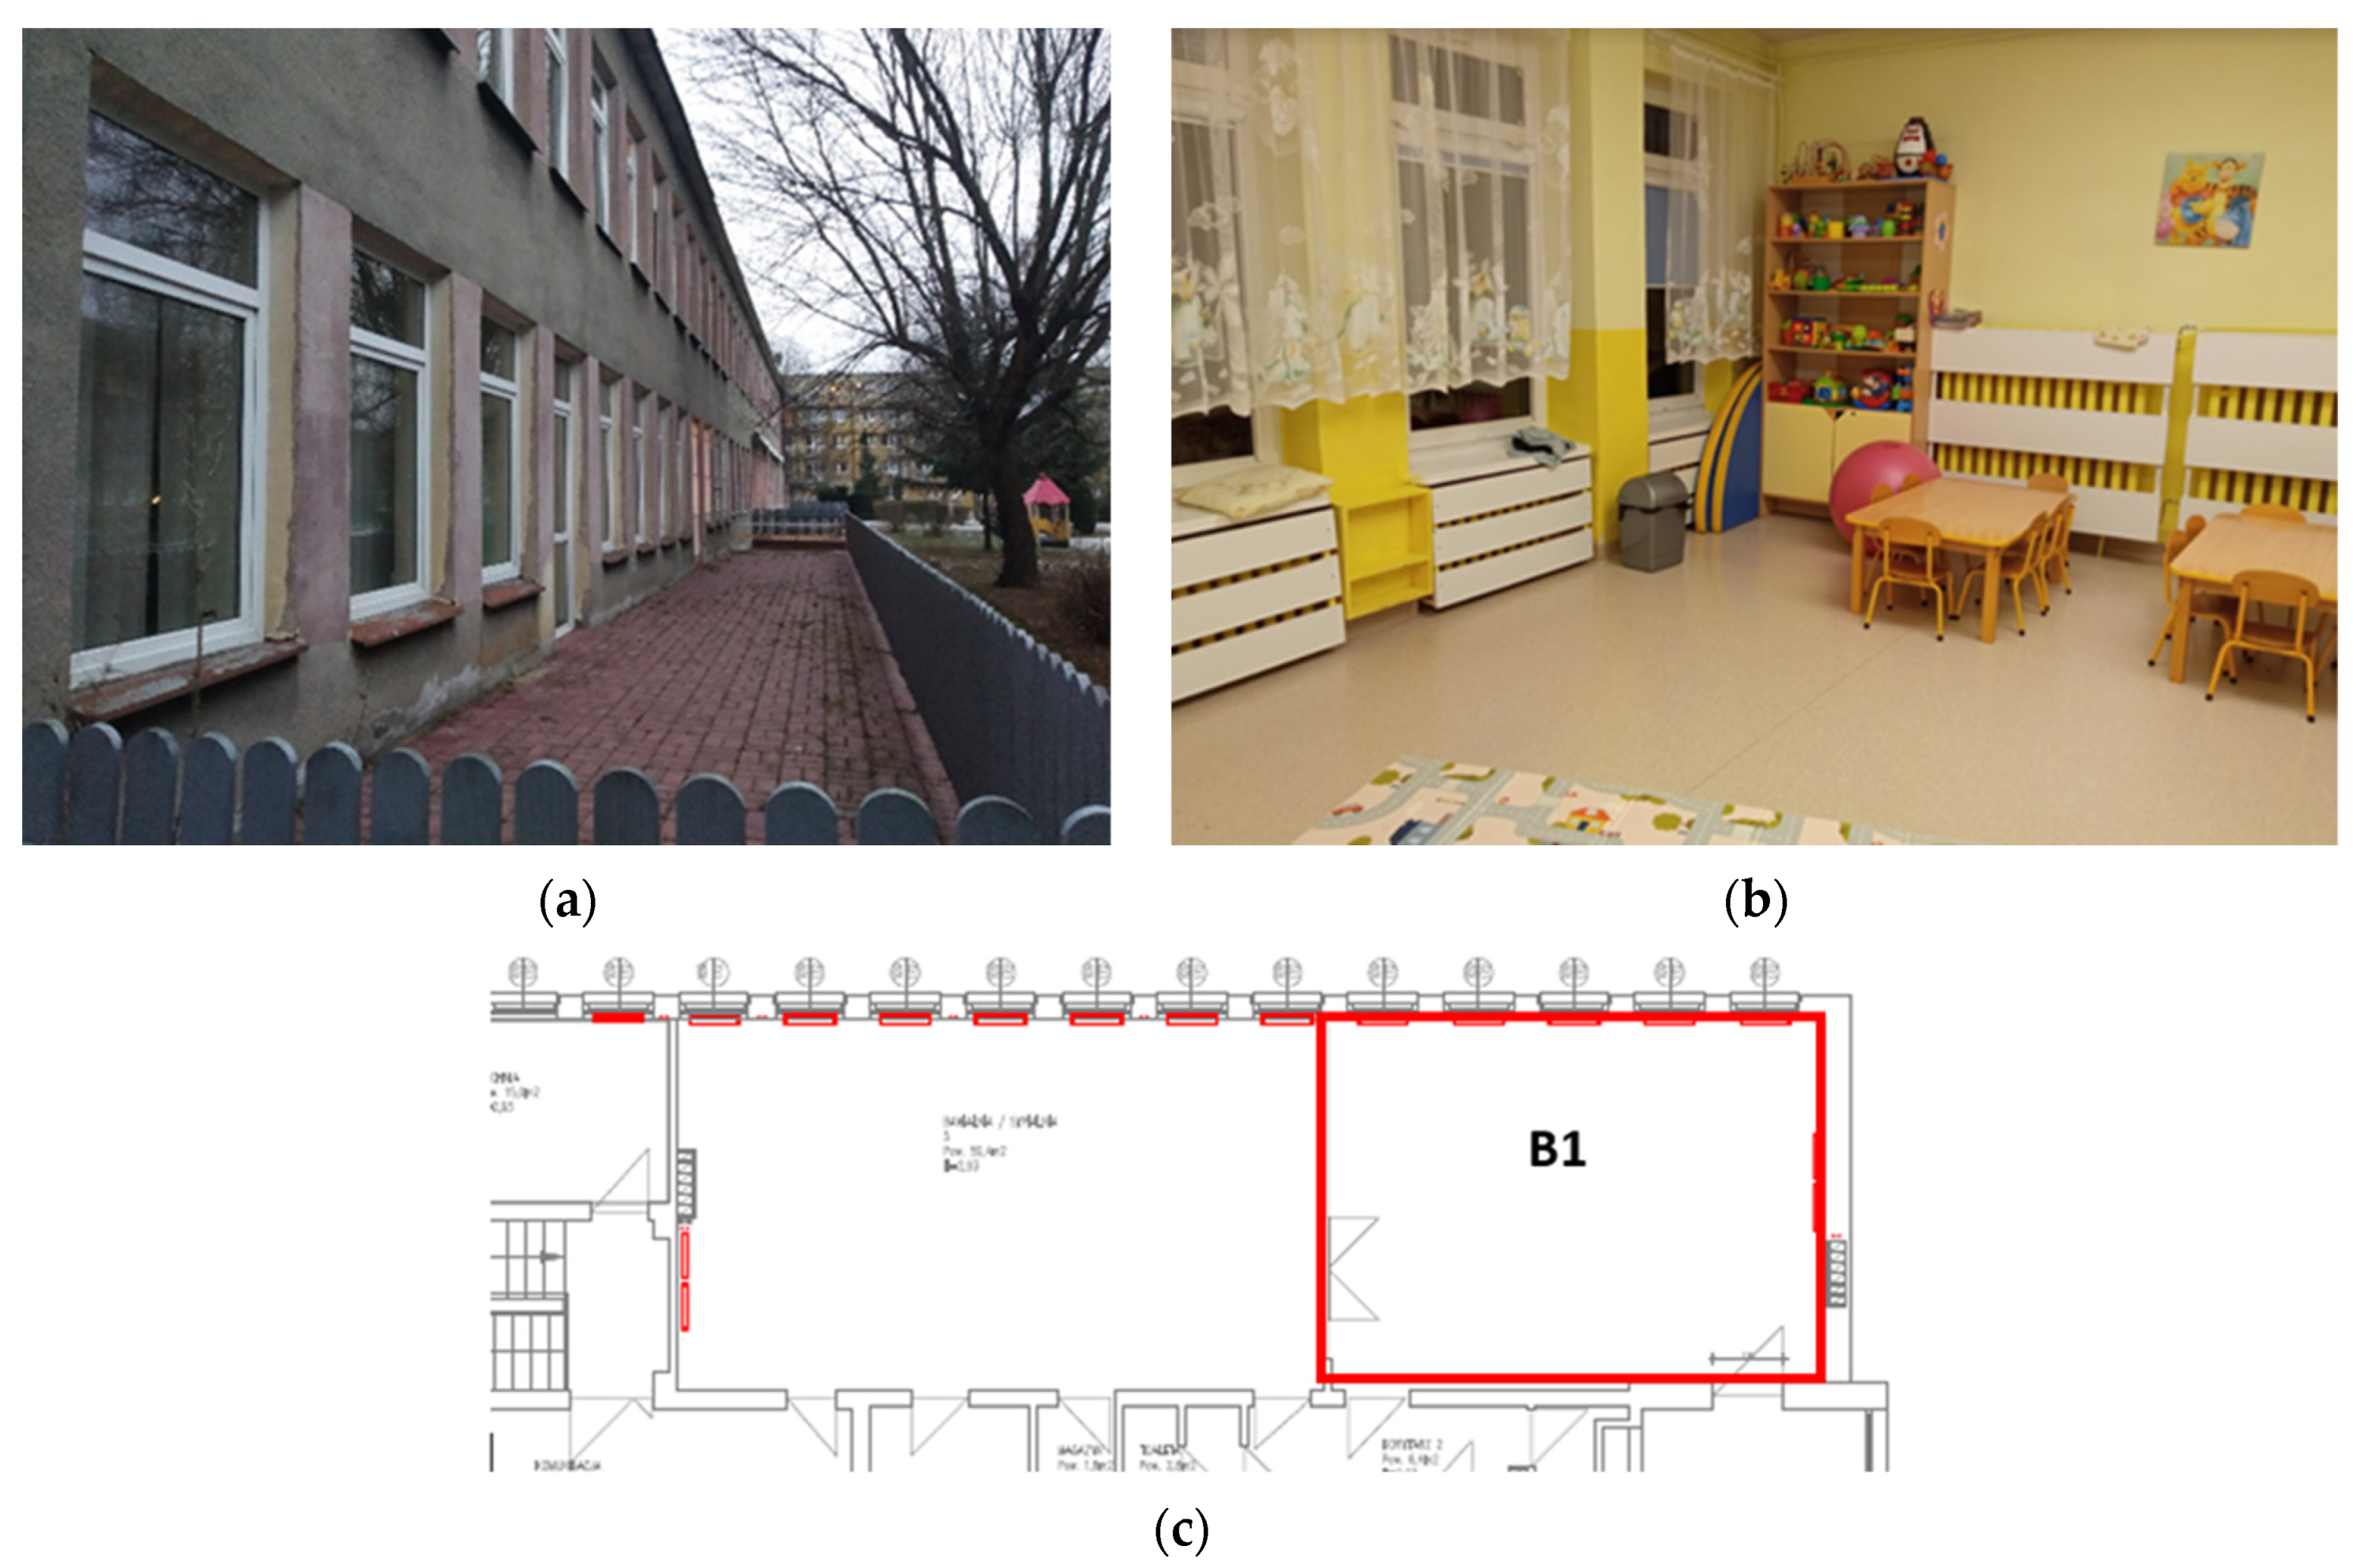
2.2. Building Description

This part of the paper discusses the assessed case study. For the analysis, a real nursery building designed and constructed in the 1970s was used. The construction is typical of such building structures. The analyses were performed in one room (Figure 2) situated on the second (last) floor. The room volume was 132 m3, and windows accounted for 40.8% of the southbound surface. The outer wall with windows faced south. For window glazing, the solar heat gain coefficient (SHGC) was at a level of 0.22, and the long-wave radiation emissivity (mean glazing/frame) was 0.80.
A detailed description of the building components is presented in Table 2.

2.3. Material Scenarios

To analyse the impact of the buffering effect of the finishing materials on the indoor climate, two typical indoor finishing materials were used in the analyses, gypsum board (A1 material) and cement–lime plaster (A2 material) (Table 3), either with no paint coat or with a top coat of acrylic paint, defined by an additional vapour diffusion thickness of Sd = 0.5 m.
The other hygrothermal properties were obtained from the WUFI Plus database.

2.4. Room Occupancy Scenarios

To assess the impact of the way the room is used on IEQ in a building, analyses were carried out for two usage functions of the room. Different occupancy scenarios were assumed for the nursery (B1) and office (B2), resulting from the number of people staying in the room and their activities.
In reference to the nursery (B1), real information acquired from the nursery staff was used. Children arrive at the nursery (B1) at 6:00 a.m. and are picked up by their parents no earlier than 3:00 p.m. Therefore, the presence of one caregiver and two children was assumed between 6:00 a.m. and 7:00 a.m., one caregiver and ten children between 7:00 a.m. and 8:00 a.m., two caregivers and fifteen children between 8:00 a.m. and 4:00 p.m., and one caregiver and five children between 4:00 p.m. and 5:00 p.m.
In reference to office (B2), 8.5 m2 of office space per capita was assumed, and five people occupied a room. The staff came to the office at 8:00 a.m., left the office for lunch between 12:00 p.m. and 1:00 p.m., and ended their work at 5:00 p.m. Both the nursery (B1) and office (B2) were closed on weekends.
Because apparent and hidden heat gains and carbon dioxide emissions are related to the human occupancy of rooms and their activity, the daily, hourly-based profiles of heat emission through convection, radiation, moisture, and CO2 generation were taken for the calculations and are shown in Figure 3. The figure was developed based on data from WUFI Plus. According to the software description, the values were determined based on the ASHRE 55 Standard [42] for heat emissions, the IEA ANNEX 41 Standard [43] for moisture level increase, and the ASHRAE 62 Standard [44] for CO2 emissions.

2.5. Ventilation Control Scenarios

The following assumptions were made for HVAC system solutions:
  • DCV serves all rooms with a heat recovery ventilation (HRV) efficiency level of 0.80;
  • The indoor temperature in winter is no lower than 20 °C, while in summer, it does not exceed 26 °C;
  • For the air stream supplied to the zone, determined based on the maximum loads resulting from gas pollution concentration reduction, the system provides a stream of fresh air according to the following relationship (3):
V = K s s 2 s 1
where
Ks—emission of air pollutants, kg/s;
s2—pollution concentration in the exhaust air, kg/m3;
s1—pollution concentration in the supplied air, kg/m3.
Analyses were performed for DCV system control strategies (four scenarios) with supply air stream rates as follows:
  • C1 scenario—temperature control, with the supply air stream determined based on pollution emissions for the nursery (B1) at 359 m3/h and for the office (B2) at 129 m3/h (30 m3/(h·person) per adult and 15 m3/(h·person) per child [45]);
  • C2 scenario—CO2 as the priority combined with temperature control, with the CO2 concentration no higher than 1500 ppm (in accordance with the acceptable levels defined in references [46,47]) and with the supply air stream determined based on the same pollution emission levels as in the C1 scenario;
  • C3 scenario—RH as the priority combined with temperature control, with relative humidity in the 40–60% range and with the supply air stream determined based on the same pollution emission levels as in the C1 scenario;
  • C4 scenario—CO2 as the priority combined with temperature control, with the CO2 concentration no higher than 1500 ppm (in accordance with the acceptable levels defined in references [46,47]) and with the supply air stream determined based on air stream units per capita according to the room’s occupancy profile: 285 m3/h for the nursery (B1) and 150 m3/h for the office (B2).
The supply and exhaust ventilation system was activated during the room’s occupancy hours, from Monday to Friday, between 6:00 a.m. and 5:00 p.m. The assumption was that outside the occupancy hours, only air infiltration through the building’s leak spots occurred at a continuous level of ACH = 0.5 h−1. For scenario C3, to maintain the relative humidity at the required level during the period when the rooms are in use, full air conditioning with humidification and dehumidification options, each with a capacity of 50 kg/h, was assumed.

2.6. Analysed Options—Symbols

The symbols marking each of the analysed options are explained in Table 4.

2.7. Evaluation Methods

Based on the simulations, the hourly values used for the analyses included the indoor temperature (°C), indoor air humidity (%), CO2 concentration (ppm), heating and cooling energy (kWh/period), humidification and dehumidification energy (kWh/period), and total ventilation (m3/h). The hourly PMV (Predicted Mean Vote) and PPD (Predicted Percentage of Dissatisfied) values were used to assess thermal comfort. The adopted model for determining the mean radiant temperature has a significant impact on the value of the PMV index. The authors of publication [48] conducted analyses and studies on the influence of the mean value of the radiant temperature on the obtained values of thermal comfort parameters in the simulation tools used, evaluating three models to determine the mean radiant temperature used in the Energy Plus program. However, the WUFI Plus program used by us for simulation does not provide detailed calculation algorithms; therefore, it is difficult for the authors to assess the influence of the model used on the obtained results.
Owing to the variable loads on rooms with internal and external gains during the individual days of the year, the following additional indicators were used to assess the indoor environments in the rooms, taking into account the combined effect of moisture-buffering materials and DCV systems:
  • The number of hours for which, during the room occupancy hours (from 6:00 a.m. to 5:00 p.m. from Monday to Friday), the air quality parameters were within the acceptable range, assumed as follows:
    -
    Temperature 20–26 °C;
    -
    Relative humidity 40–60%;
    -
    Carbon dioxide concentrations up to 1500 ppm.
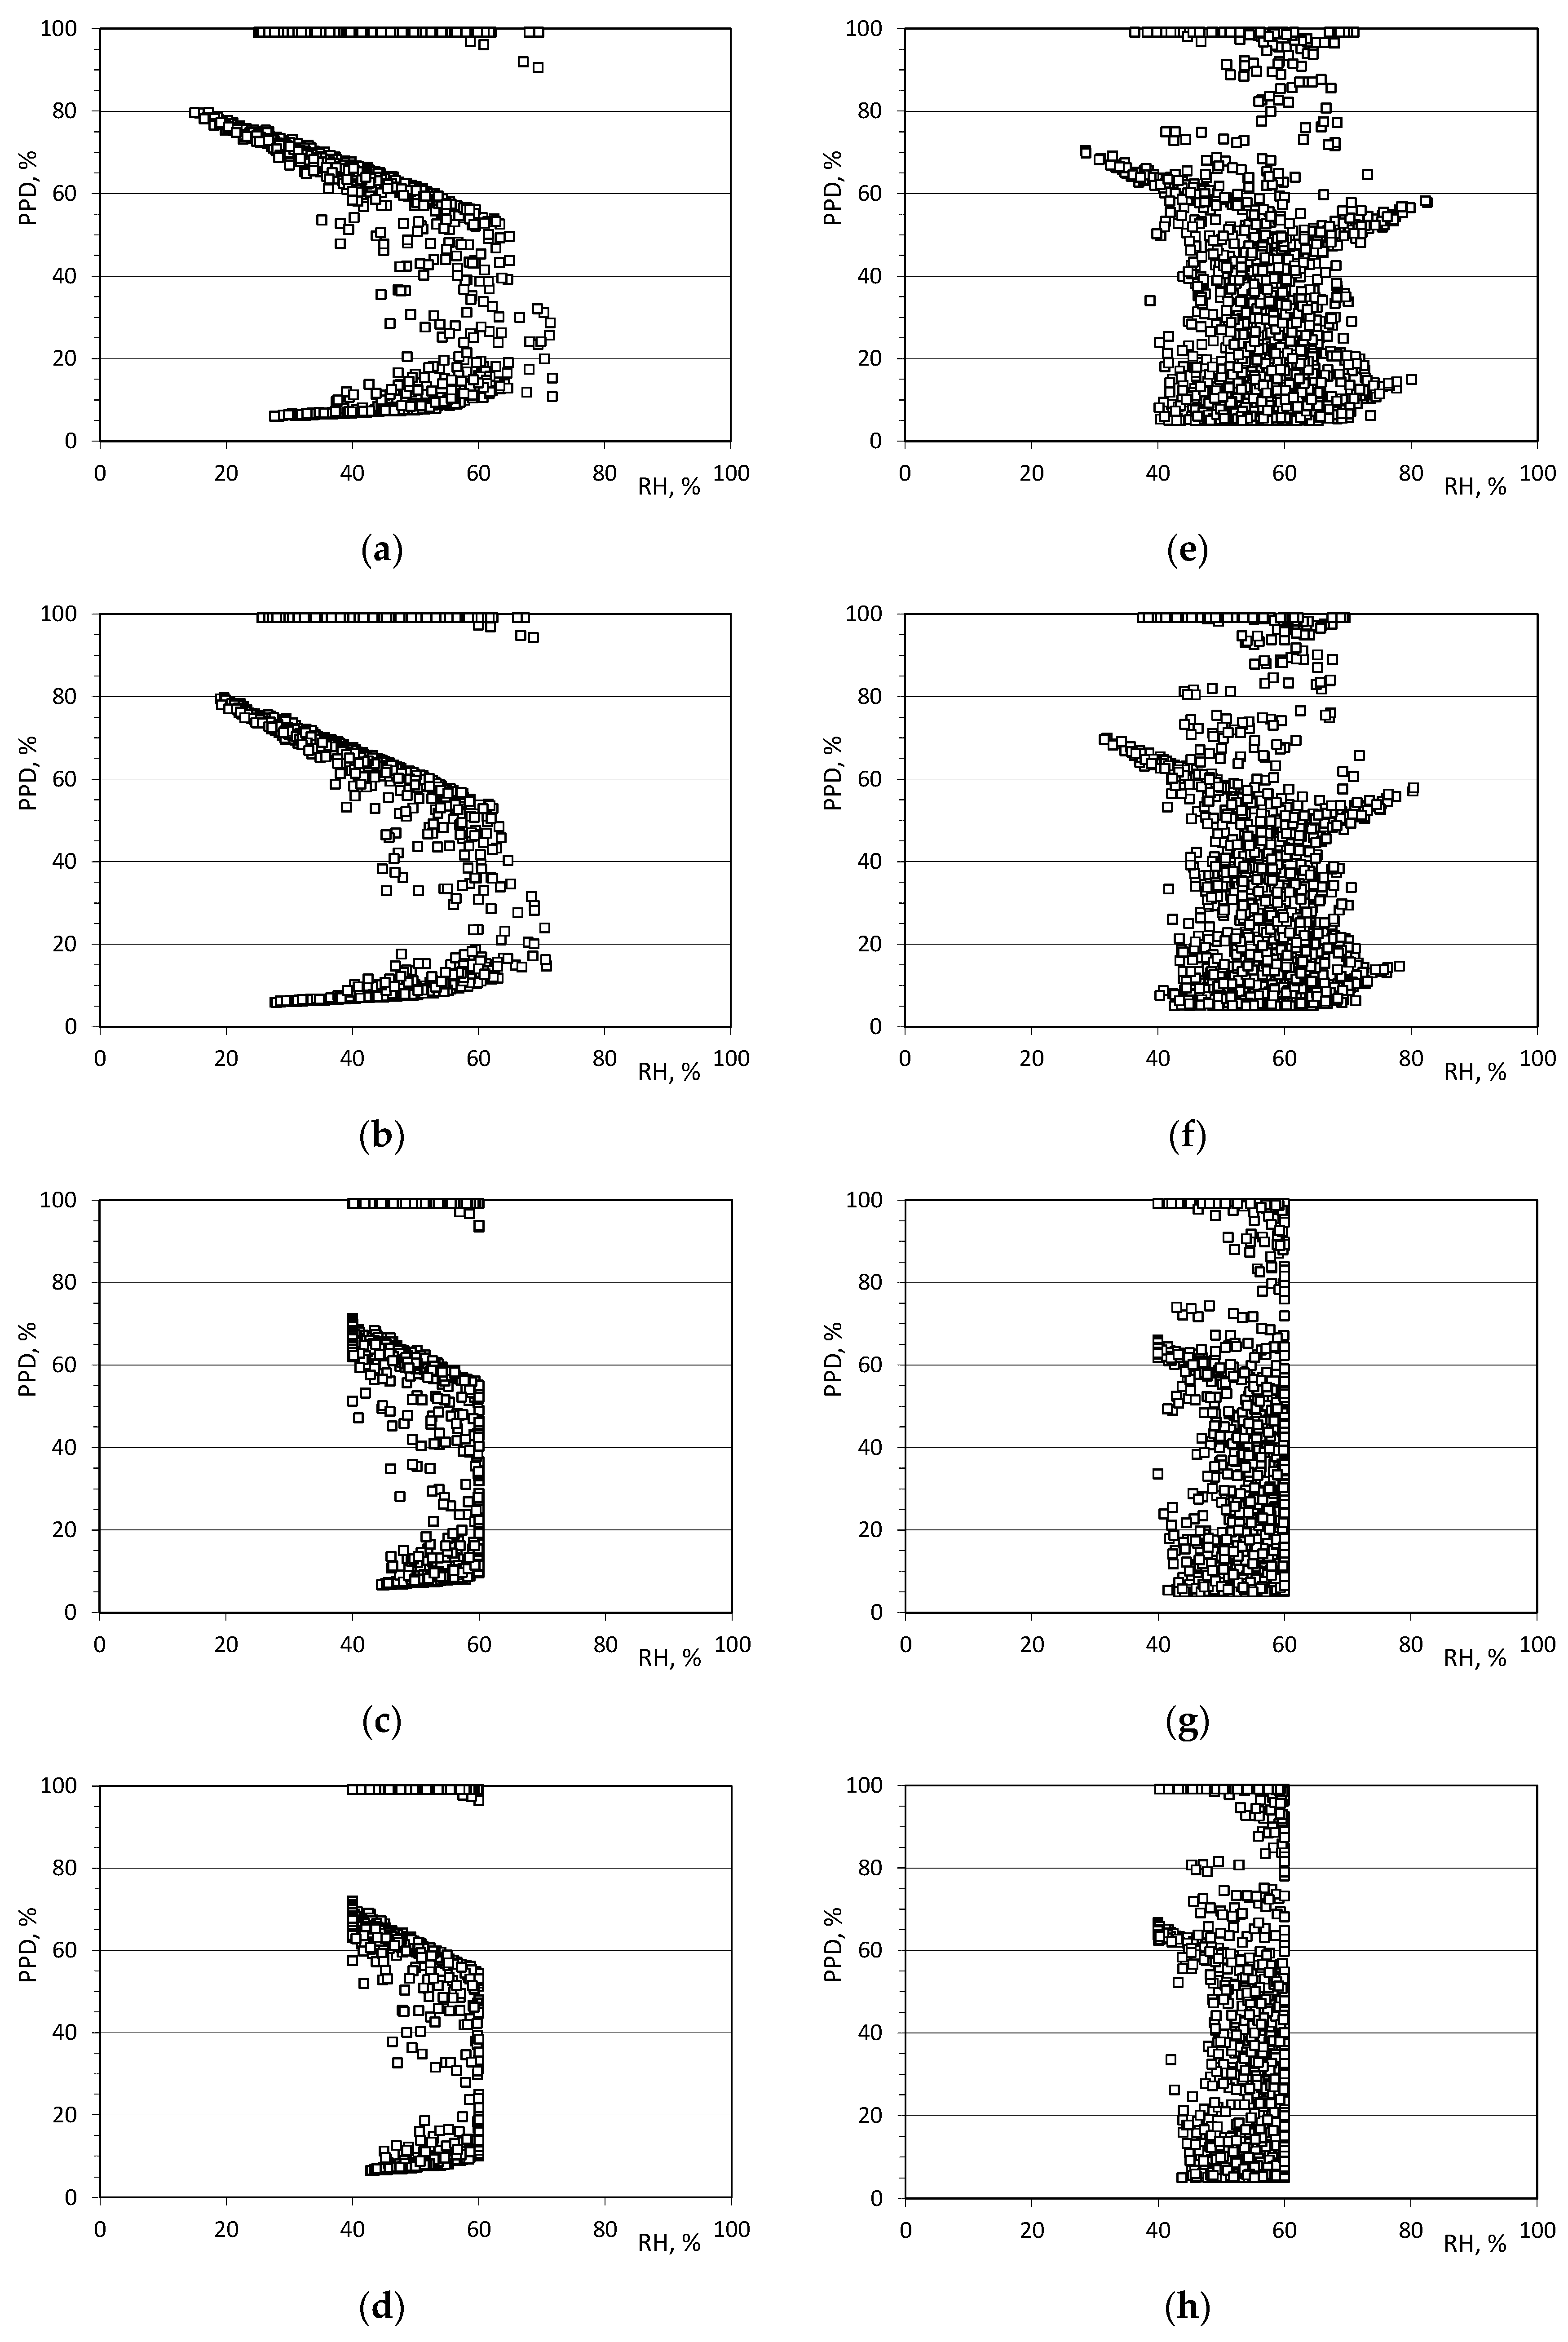
  • Values of thermal comfort parameters PMV and PPD [8]:
    -
    Category A—PMV in the range <−0.2, +0.2> and PPD < 6%;
    -
    Category B—PMV in the range <−0.5, +0.5> and PPD < 10%;
    -
    Category C—PMV in the range <−0.7, +0.7> and PPD < 15%.
Additionally, the variability in the total air stream supplied to the room and the final energy consumption was analysed.

3. Results and Discussion

3.1. Number of Comfort Hours

Table 5 summarises the percentage of occupancy hours of the number of rooms (Monday to Friday, 6:00 a.m. to 5:00 p.m.) during which the maintained evaluation parameter fell within the assumed comfort range, according to the assumptions presented in Section 2.7. The following is a percentage analysis of the hours of comfort, assuming 3132 h of room use. The potential for improving individual air parameters for each DCV system control scenario, combined with the use of moisture-buffering materials on the interior surfaces, was assessed.
With regard to temperature, irrespective of the DCV system control method and the finishing material used, high comfort levels of over 98% were found for both the nursery (B1) and office (B2). This is because all of the DCV system control scenarios analysed reduce the indoor temperature in the room when it increases above 26 °C.
However, when DCV systems are controlled by adjusting only one parameter, there is often a deterioration in air quality with respect to other parameters, owing to an increase in carbon dioxide concentration and relative humidity. In our analyses, this was evident in scenario C1, where only temperature control was used, especially in the nursery. For material A1, the CO2 concentration remained below 1500 ppm for 73.3% of the hours of use for the unpainted materials and 72.0% for the painted materials. The relative humidity was in the acceptable range for only 53.3% of the hours for the unpainted materials and 44.2% for the painted ones. The use of material A2 did not significantly improve this situation, as the CO2 concentration and relative humidity remained within acceptable ranges at similar percentages.
For the office, in all options analysed, the CO2 concentration remained below 1500 ppm for 100% of the hours of use. The relative humidity for the unpainted materials was within a comfortable range for 46.7% of the hours for material A1 and 46.9% for material A2, and for the painted ones, 45.9% for A1 and 45.3% for A2. This suggests the need to consider more than one parameter when controlling ventilation systems to ensure both thermal comfort and adequate indoor air quality.
In scenario C2, where CO2 concentration was the control parameter and supply airflow was determined by emissions, for 100% of the hours of use, CO2 concentrations remained below the assumed level of 1500 ppm for both rooms B1 and B2, regardless of the interior surface finish options. In scenario C4, with a reduction in supply airflow for B1, the percentage of hours within the assumed comfort range for CO2 concentration decreased to 86.1% for A1 unpainted, 86.3% for A2 unpainted, 86.3% for A1 painted, and 86.6% for A2 painted. For B2, owing to the increased supply airflow compared to scenario C2, the CO2 concentration remained below 1500 ppm for 100% of the occupancy time, regardless of the interior finishing material.
The lowest percentage of comfort hours was recorded for the RH parameter, except in scenario C3, where the DCV system was controlled with relative humidity as the priority. In scenario C2 for the nursery, the percentage of comfort hours for unpainted materials averaged 57.1%, which was 11% higher than that for painted materials and the highest of all the analysed cases. In the office, the percentage of comfort hours did not exceed 47.0% in all cases, with an average of 2.6% higher for unpainted materials than for painted ones. In scenario C3, the percentage of comfort hours in relation to RH for unpainted materials was 1% higher than that for painted materials in the nursery and 1.27% higher in the office.
In all cases analysed, the percentage of comfort hours concerning relative humidity in the nursery (a room with higher humidity gains due to the higher number of people and more activity) was higher than in the office. This confirms that hygroscopic materials can reduce the relative humidity level in a room owing to their moisture-buffering properties [49,50]. Additionally, this analysis highlights the importance of integrating finishing materials with ventilation systems to effectively exploit their moisture-buffering potential. Fang et al. [51], based on their research, also highlighted the need to adapt the choice of finishing materials to the HVAC scenarios in buildings.
Figure 4 shows, in detail, the impact of moisture buffering on humidity in rooms B1 and B2, determined based on the number of comfort hours for the C3 scenario (RH control as priority). When comparing the painted and unpainted options, it is evident that painting reduces the number of comfort hours. Additionally, there was no significant difference between the painted variants when using material A1 (gypsum board) or A2 (cement–lime plaster). This indicates that painting decreases the moisture-buffering capacity of materials, a finding that is also supported by Latif et al. [52] and Shang and Tariku [53].
Comparing the unpainted A1 material with the unpainted A2 material, we can see that the number of hours of comfort in terms of humidity is greater in the case of the A2 material with better hygroscopic properties. Compared to the unpainted A1 material, the unpainted A2 material increased the number of hours of comfort by 0.7% in the nursery room (B1), from a value of 3016 h to 3038 h, and by 0.5% in the office room (B2), from a value of 2735 h to 2757 h. For painted partitions, the difference in the number of comfort hours is imperceptible. This confirms that the moisture-buffering effect is dependent on the type of material used. Therefore, considering the hygroscopic effects between the indoor air and the materials on surfaces can influence the humidity level in a room, regardless of the type of room, and consequently, potentially passively improve the indoor comfort of the room. In turn, comparing room B1 with room B2, we see that the number of comfort hours for room B1 (nursery) was greater. This allows us to conclude that the ability of materials to buffer moisture increases with an increase in the moisture production load.

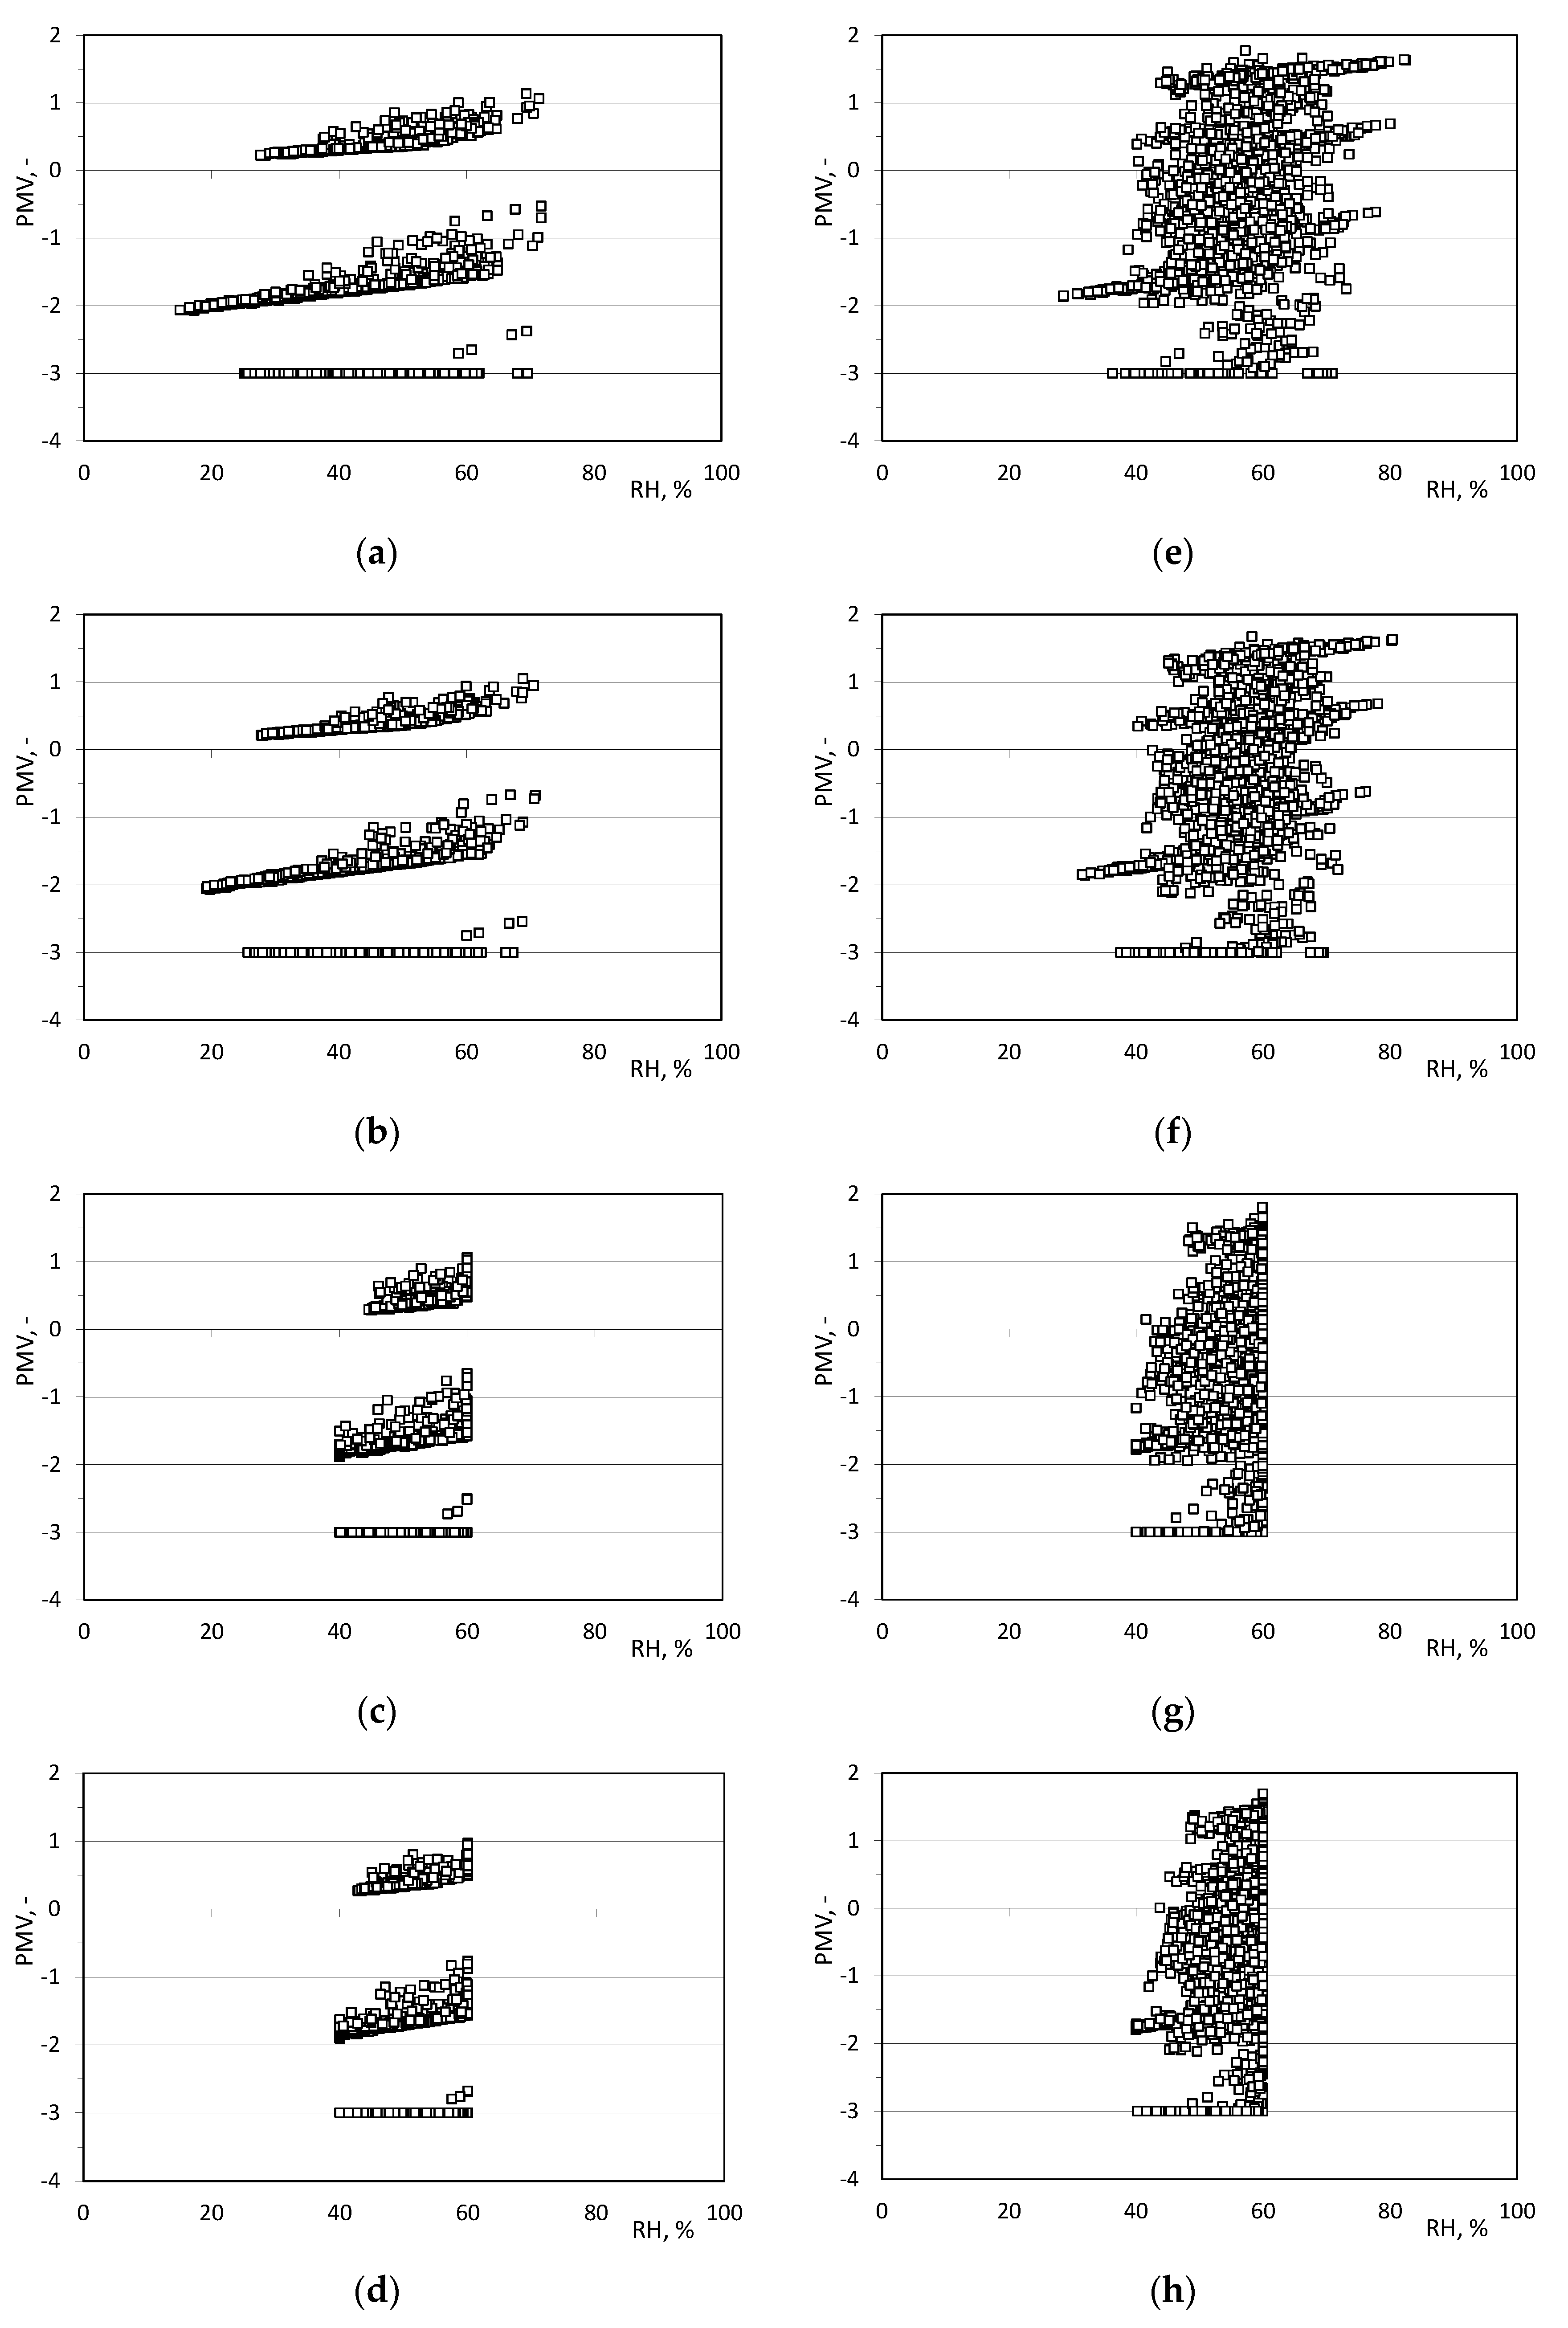
3.2. Evaluation of Occupancy Comfort

For an evaluation of the behaviour of moisture-buffering materials, Table 6 presents the number of hours of comfort for which the PPD and PMV indicators meet the requirements for a given room category (A, B, C) according to the assumptions presented in Section 2.7. The table shows data for the room usage period (Monday–Friday, 6:00 a.m. to 5:00 p.m.).
By analysing the results, it can be concluded that the number of comfort hours for individual categories of indoor environments is comparable for all analysed internal partition finishing materials. In the nursery (B1), under conditions for thermal environment categories B and C, regardless of the DCV system used in the room, the number of comfort hours was higher for the A2 material in both variants of its finishing. For thermal environment category A, we have a similar situation only in the case of using a DCV system with control of the relative humidity level in the room (C3). In other variants, the comfort hours were higher when the A1 finishing material was used. For the nursery (B1) and materials A1 and A2, in options with and without painting the internal surface of the partition for indoor environment categories A and B, the highest number of comfort hours was for ventilation scenario C3. For thermal environment category C, the highest was for ventilation scenario C4. It follows from the above that the use of appropriate finishing materials may contribute to improving the air quality in the room; however, the method of controlling the DCV installation also becomes important, especially in situations where we want to ensure the highest level of thermal comfort (thermal environment category A) [51].
When assessing the behaviour of moisture-buffering materials in combination with DCV systems, the change in the relative humidity in the room becomes important. To assess the buffering capacity of the finishing materials used, the following drawings show the sample relationships between the PPD (Figure 5) and PMV (Figure 6) for the C2 and C3 scenarios and the change in the indoor relative humidity for the nursery (B1) for unpainted materials A1 (gypsum board) and A2 (cement–lime plaster). The diagrams represent data from Monday to Friday between 6:00 a.m. and 5:00 p.m., divided into the winter period from the beginning of October to the end of March and the summer period from the beginning of May to the end of September.
The comparison reveals that regardless of the DCV system control method, the occupants experienced comfort described by a PMV evaluation index ranging between <−3 and +2>. The authors of publication [54], based on the analysis of over 93 publications on thermal comfort, reported that students at all stages of education feel comfortable at temperatures towards the lower end of the thermal sensation scale (i.e., cooler temperatures). Our research has indicated that the way one controls DCV has an impact on this feeling. In summer, with indoor carbon dioxide concentration control (C2 scenario), one can observe a shift towards the “too warm” experience compared to indoor relative humidity control (C3 scenario). In the absence of indoor relative humidity control in winter (C2 scenario), the indoor relative humidity drops to 18%, while in summer, it ranges from 45 to 85%. For cement–lime plaster (A2), the PMV index was comparable at higher indoor relative humidity values. For the DCV–C3 scenario, using better moisture-buffering material leads to a slight decrease in the indoor relative humidity at a comparable satisfaction level in winter, while in summer, the system maintains the relative humidity at 60% during nearly its entire operation time, at the occupants’ satisfaction expressed by a PMV ranging from 1.2–1.4. The figures indicate that only 77% of the occupants were dissatisfied with staying in the referenced environment for the C2 scenario, while the percentage of dissatisfied occupants in the C3 scenario rose by 4% to 81%. Comparing the impacts of moisture-buffering materials, it can be seen that for the A2 (cement–lime plaster) versus the A1 (gypsum board) material, the PPD increased by ca. 2% for the DCV C1, C2, and C4 scenarios with no relative humidity control and by ca. 1.3% when such a possibility was assumed (C3 scenario). In [55], the authors showed that non-uniform and unsteady modes were better than uniform and steady modes in terms of fulfilling the thermal comfort conditions described by the PPD and PMV indices. The PPD values were approximately 37.8% lower than those of steady-state ventilation operation, indicating that the controlled ventilation mode contributed to improved thermal comfort. Their results suggested that mechanical ventilation is an effective tool for ensuring higher thermal comfort in buildings.

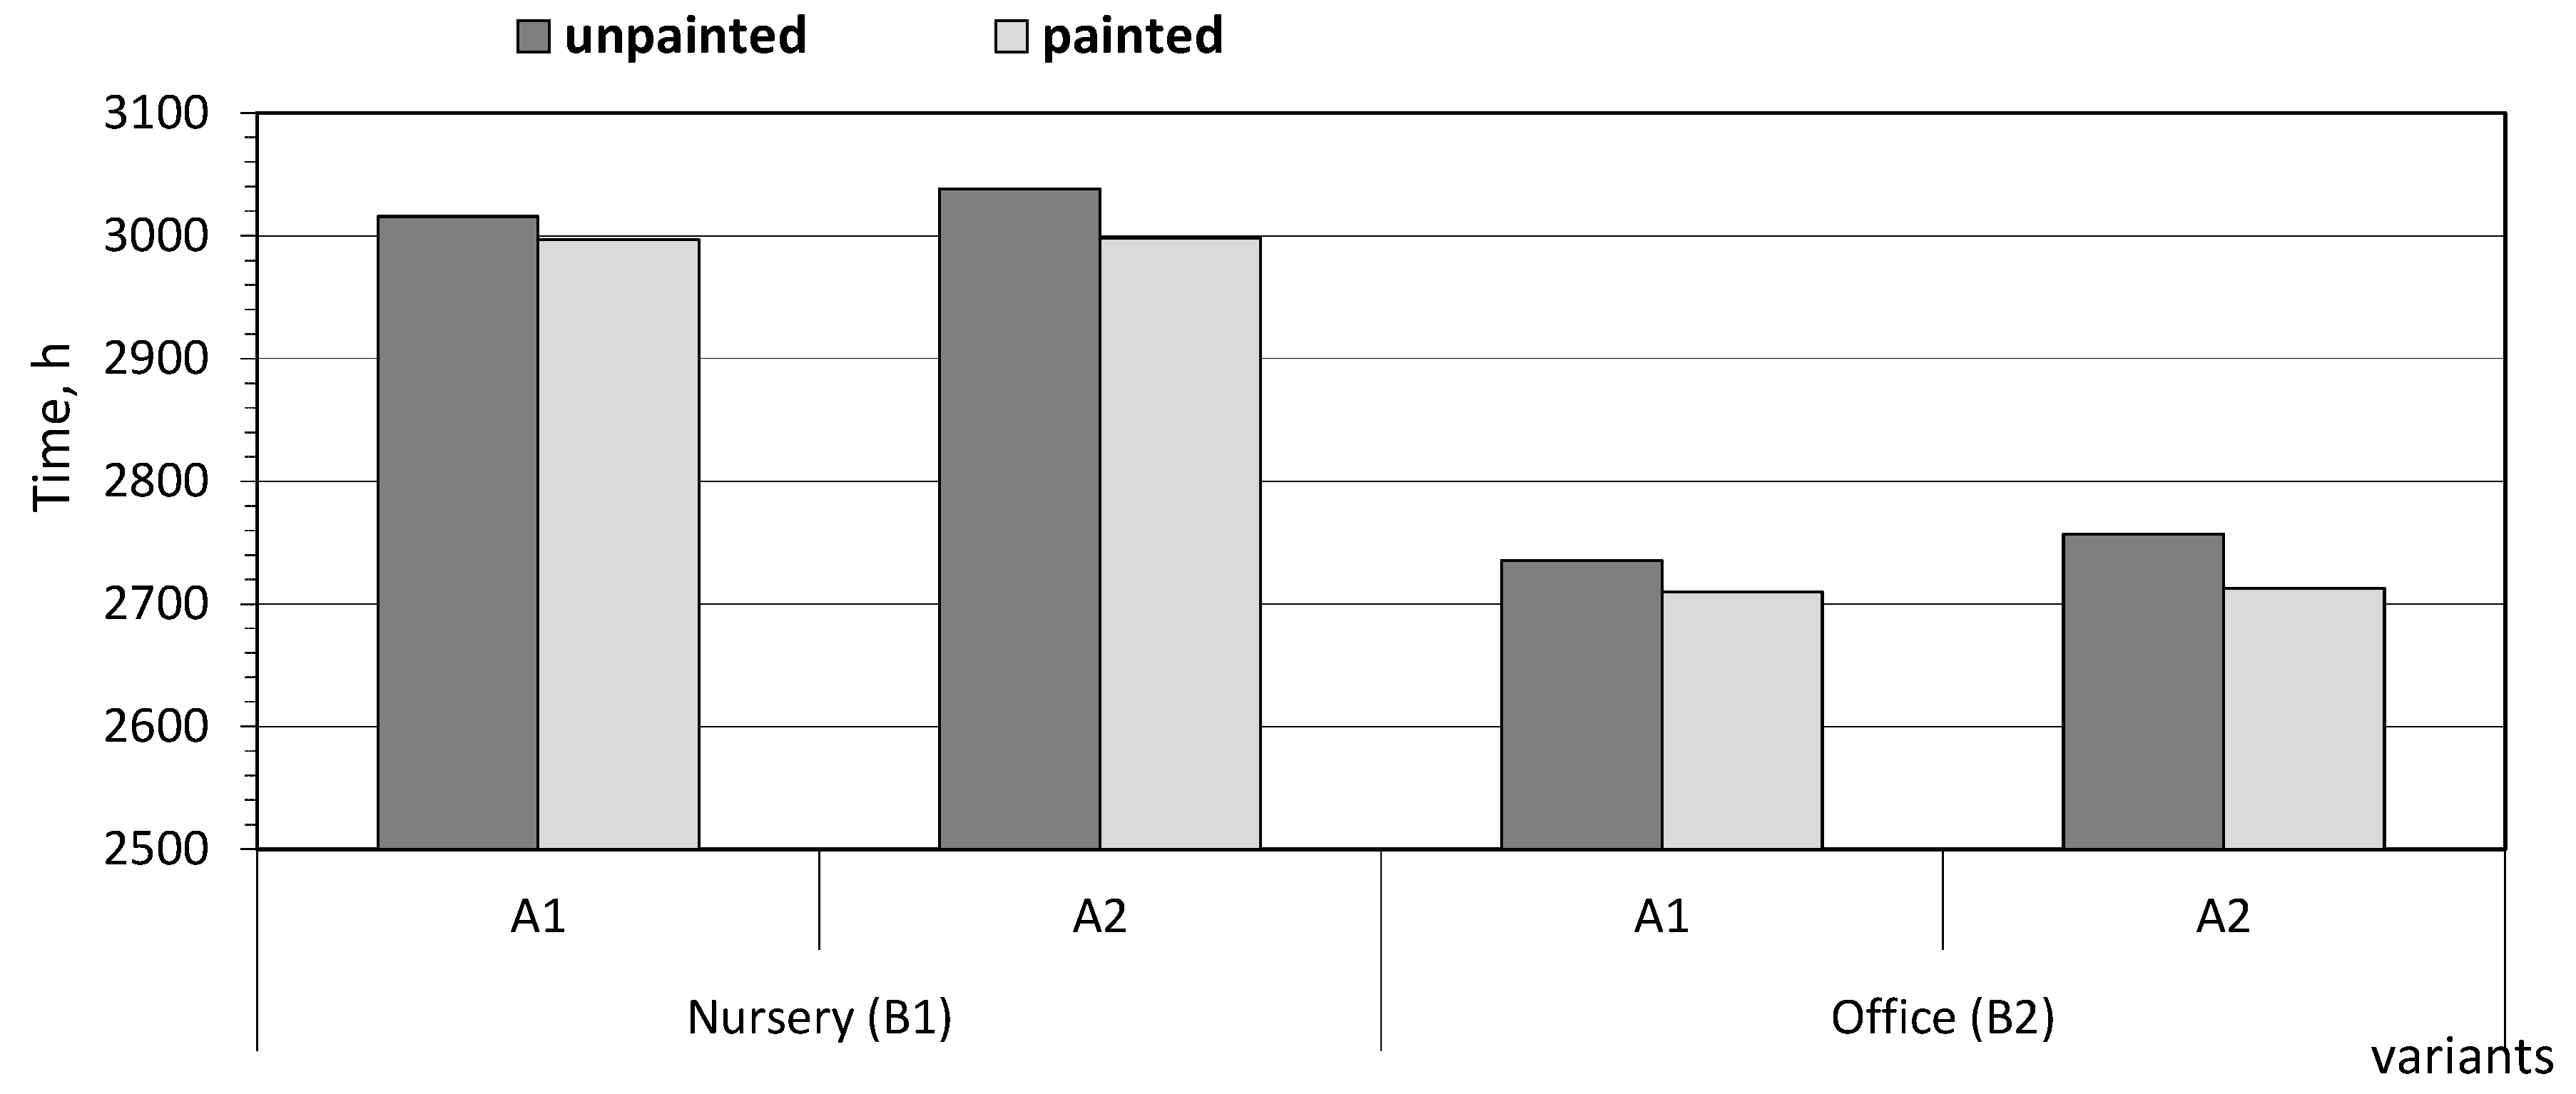
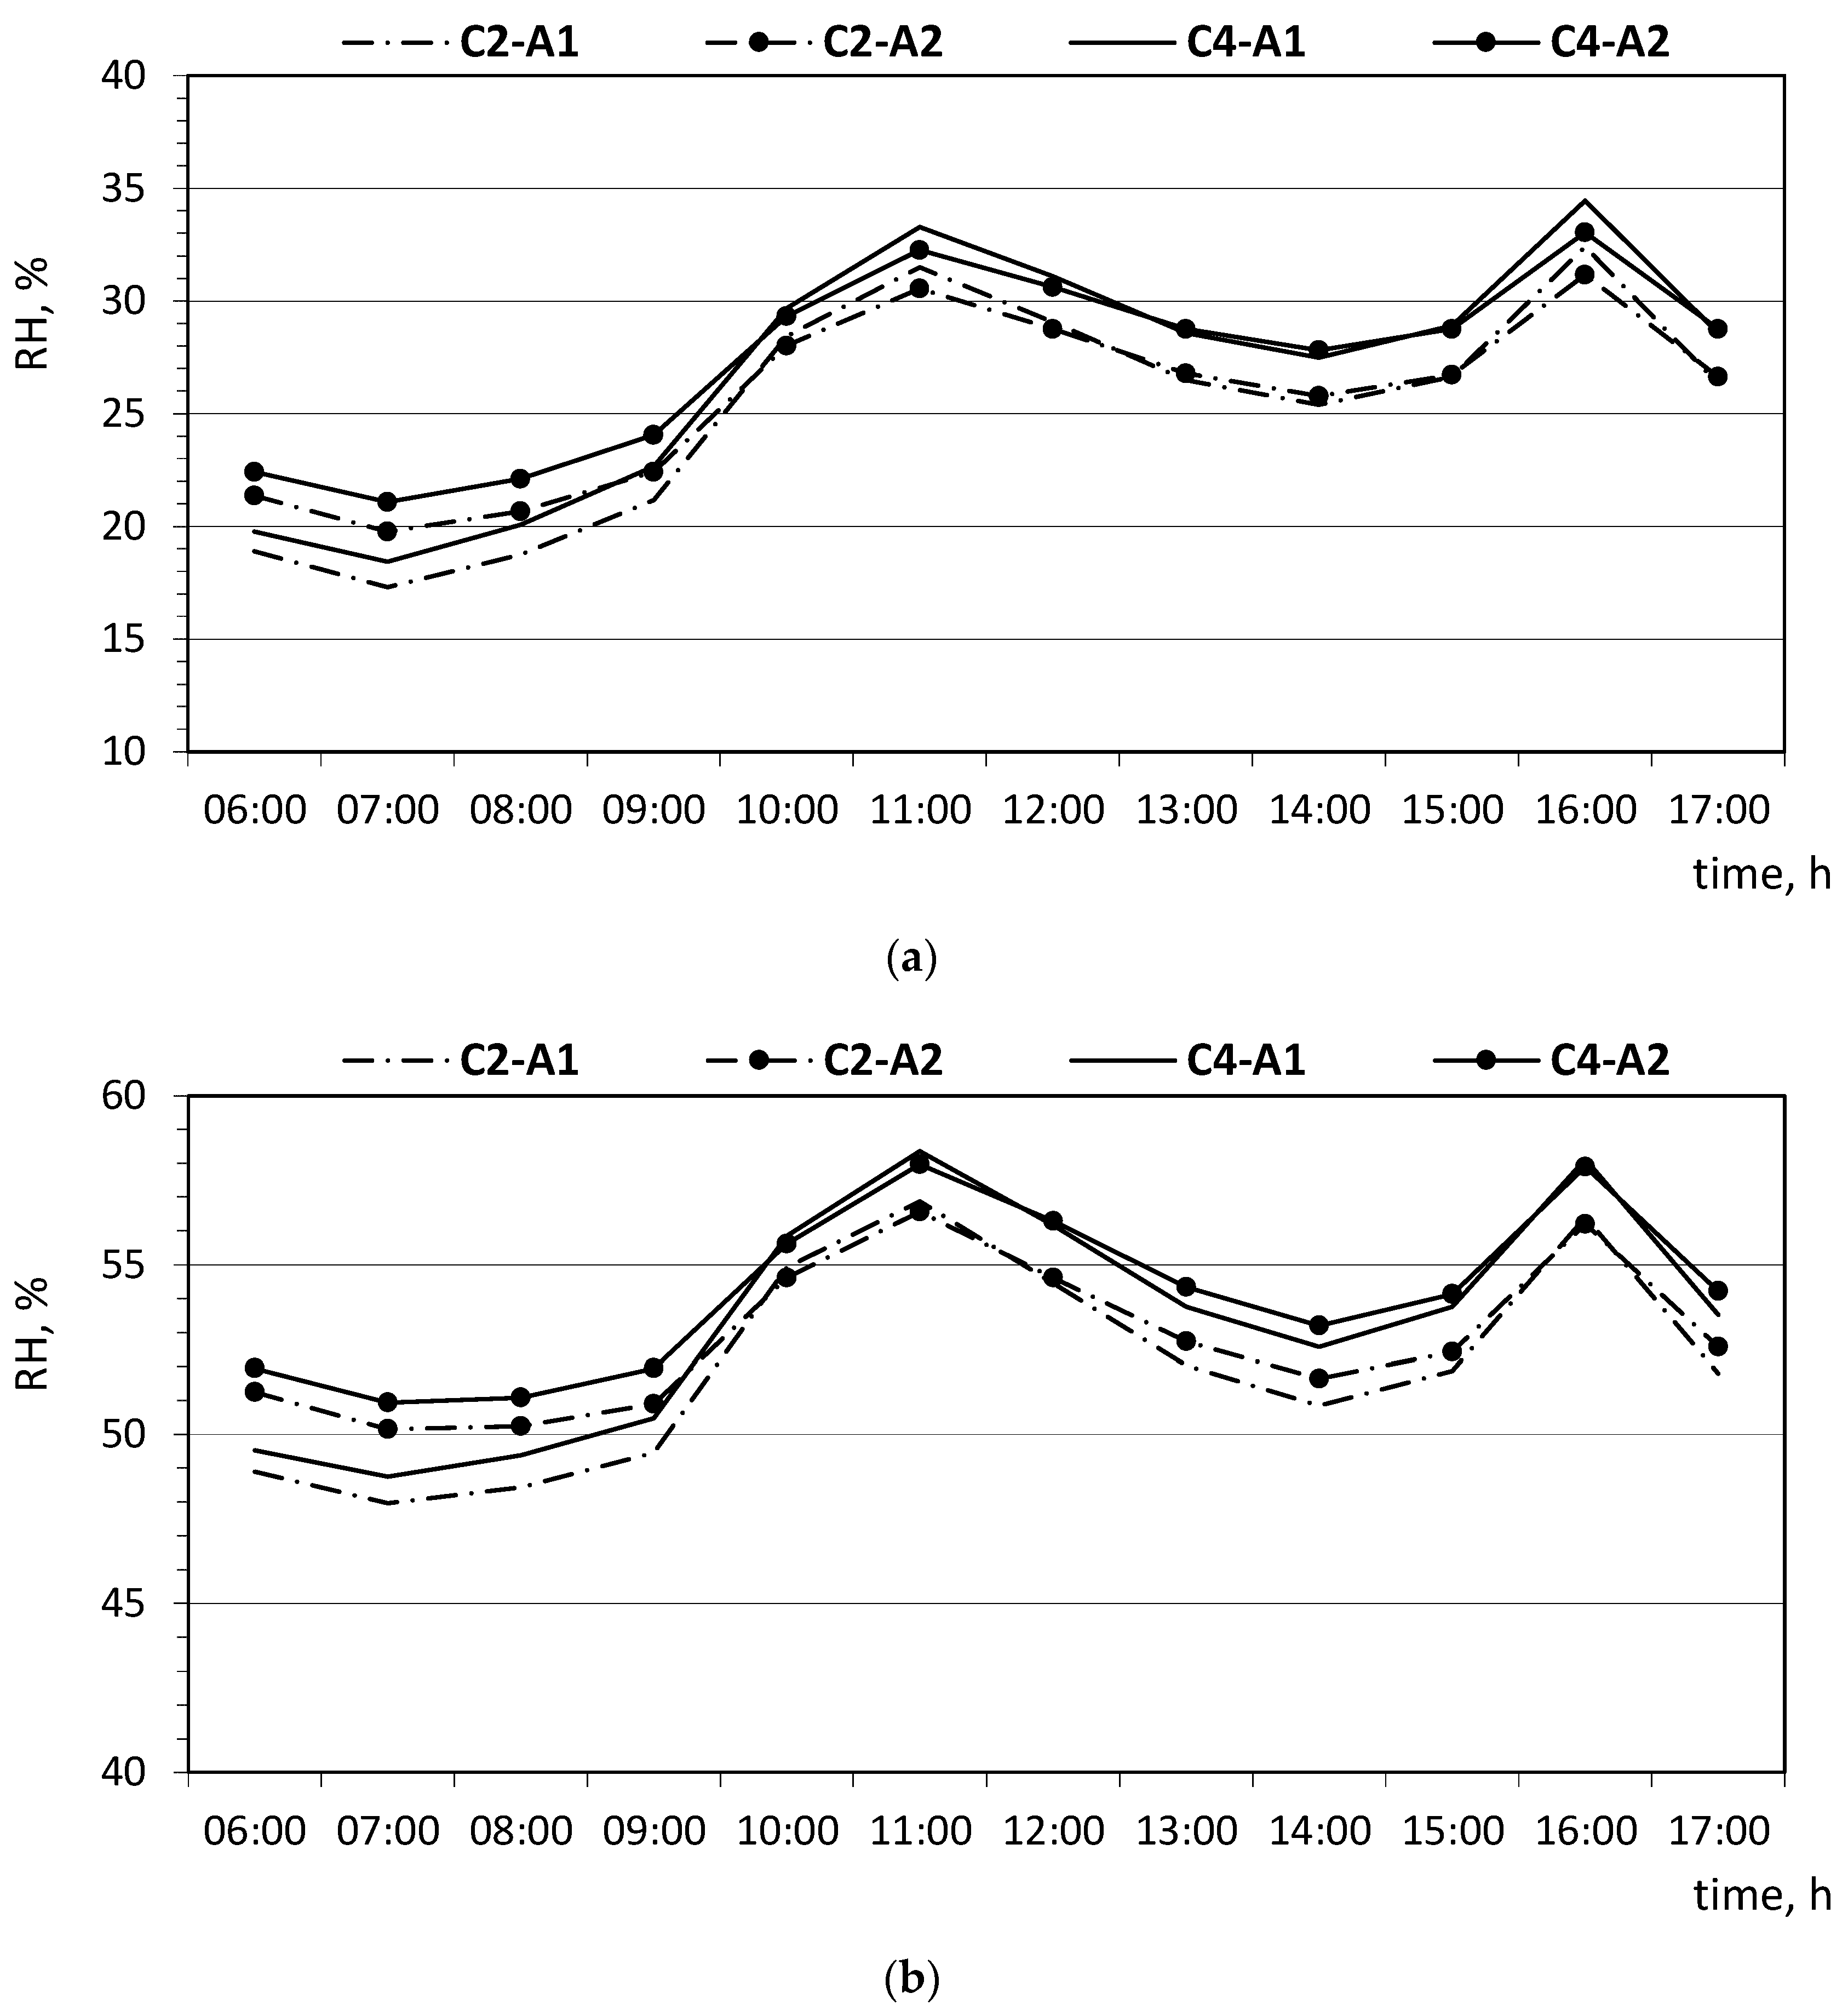
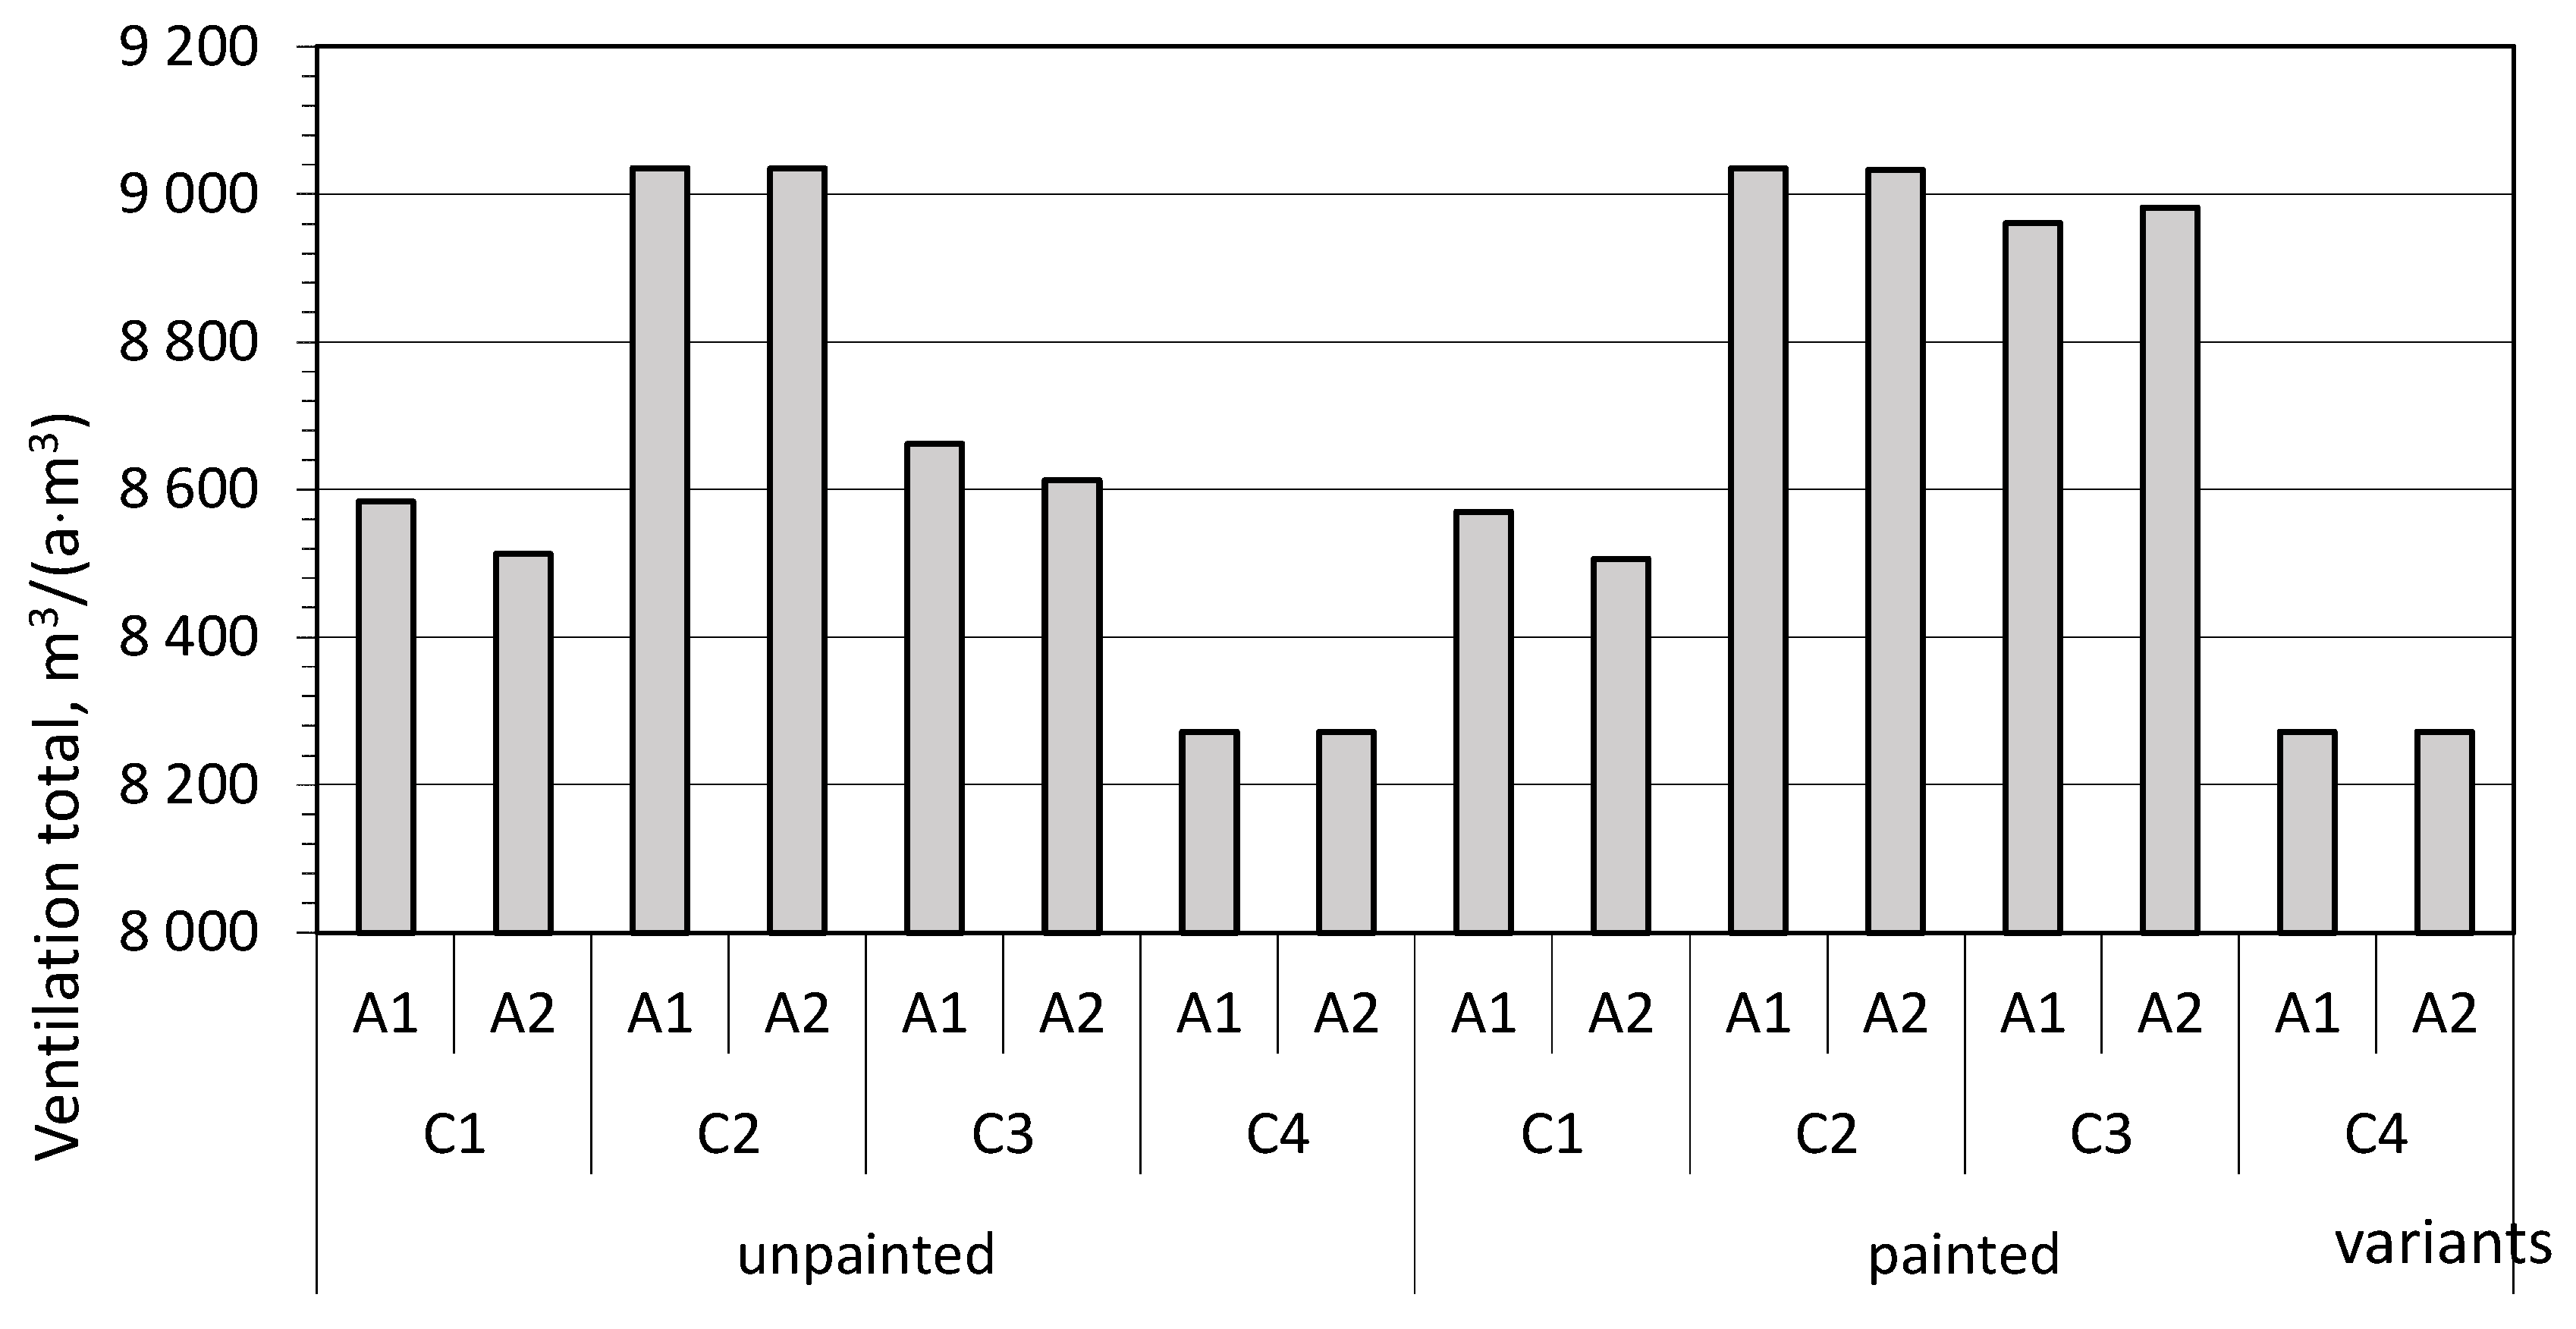
3.3. Moisture-Buffering Effect and Ventilation Air Stream

To confirm the thesis of the authors of publications [56,57], the moisture-buffering capacity was increased with a decrease in ventilation intensity, as shown in Figure 7. Figure 7 shows that the nursery (B1) with unpainted finishing materials shows 24 h relative humidity variability for two DCV scenarios, C2 and C4, for a selected summer day (5 July 2022) and winter day (7 December 2021).
Based on the analysis of the results, no impact on the moisture-buffering capacity of the adopted building solutions was observed when the supply air stream was reduced. The lowest change amplitude was observed for the carbon dioxide concentration-controlled DCV system, where, for the C4 scenario, with lower design values of the air stream supplied to the room, the air relative humidity values for the A1 material (gypsum board) were ca. 0.9% higher in summer and ca. 1.2% in winter. For the A2 finishing material (cement–lime plaster), the difference between the relative humidity values in scenarios C2 and C4 was smaller when the variability was similar to that for the A1 finishing material. For the A2 material, as previously mentioned, a material that has better hygroscopic properties than the A1 material, smaller differences were obtained between the maximum and minimum values of relative humidity. If moisture gains occur in the room, the use of a moisture-buffering finishing material reduces the relative humidity in the room (Figure 7, between 9:00–11:00 a.m. and 3:00–6:00 p.m.), and in the event of low or no moisture gains (Figure 7, between 6:00–7:00 a.m. and 12:00 p.m. to 2:00 p.m.), such material releases moisture into the room and causes an increase in the relative humidity in the room. It can be concluded that the use of materials that buffer humidity may be an effective way to reduce the amplitude of daily humidity fluctuations. The presented results for unpainted finishing materials suggest that the mean indoor relative humidity increases as the ventilation rate decreases, with only a slight increase in the variability of the latter. The difference may be attributed to the fact that the presented results apply only to selected days for which the momentary ventilation air streams in the C4 scenario could have been higher than in the C2 scenario. According to the ventilation air stream analysis taking a whole year’s perspective (Figure 8), the total streams were the highest for the C2 scenario for the nursery (B1).
The momentary supply air stream values may vary because they are adapted to the current needs of the room. Based on the results shown in Figure 8, using the A2 material (cement–lime plaster) contributes to reducing the supply air stream by 0.83% and 0.56% compared to the computational flow rate for the C1 and C3 scenarios, respectively, compared to the A1 material (gypsum board). The buffering effect deteriorates after the walls are painted, leading to a reduction in the supply air stream for the C1 scenario (temperature control) of only 0.16% for A1 and 0.07% for A2. For indoor air relative humidity control (C3), the required total supply air stream increased by 3.5% for A1 and 4.3% for A2. For the airflow control scenarios depending on the CO2 concentration (C2 and C4), no significant changes were observed in the amount of air supplied to the room. As shown in Figure 8, there were no differences in moisture buffering by the A1 and A2 materials for the C2 and C4 scenarios. Therefore, it can be concluded that the moisture-buffering effect in rooms with CO2-controlled mechanical systems was more limited than that in rooms with RH-controlled systems.

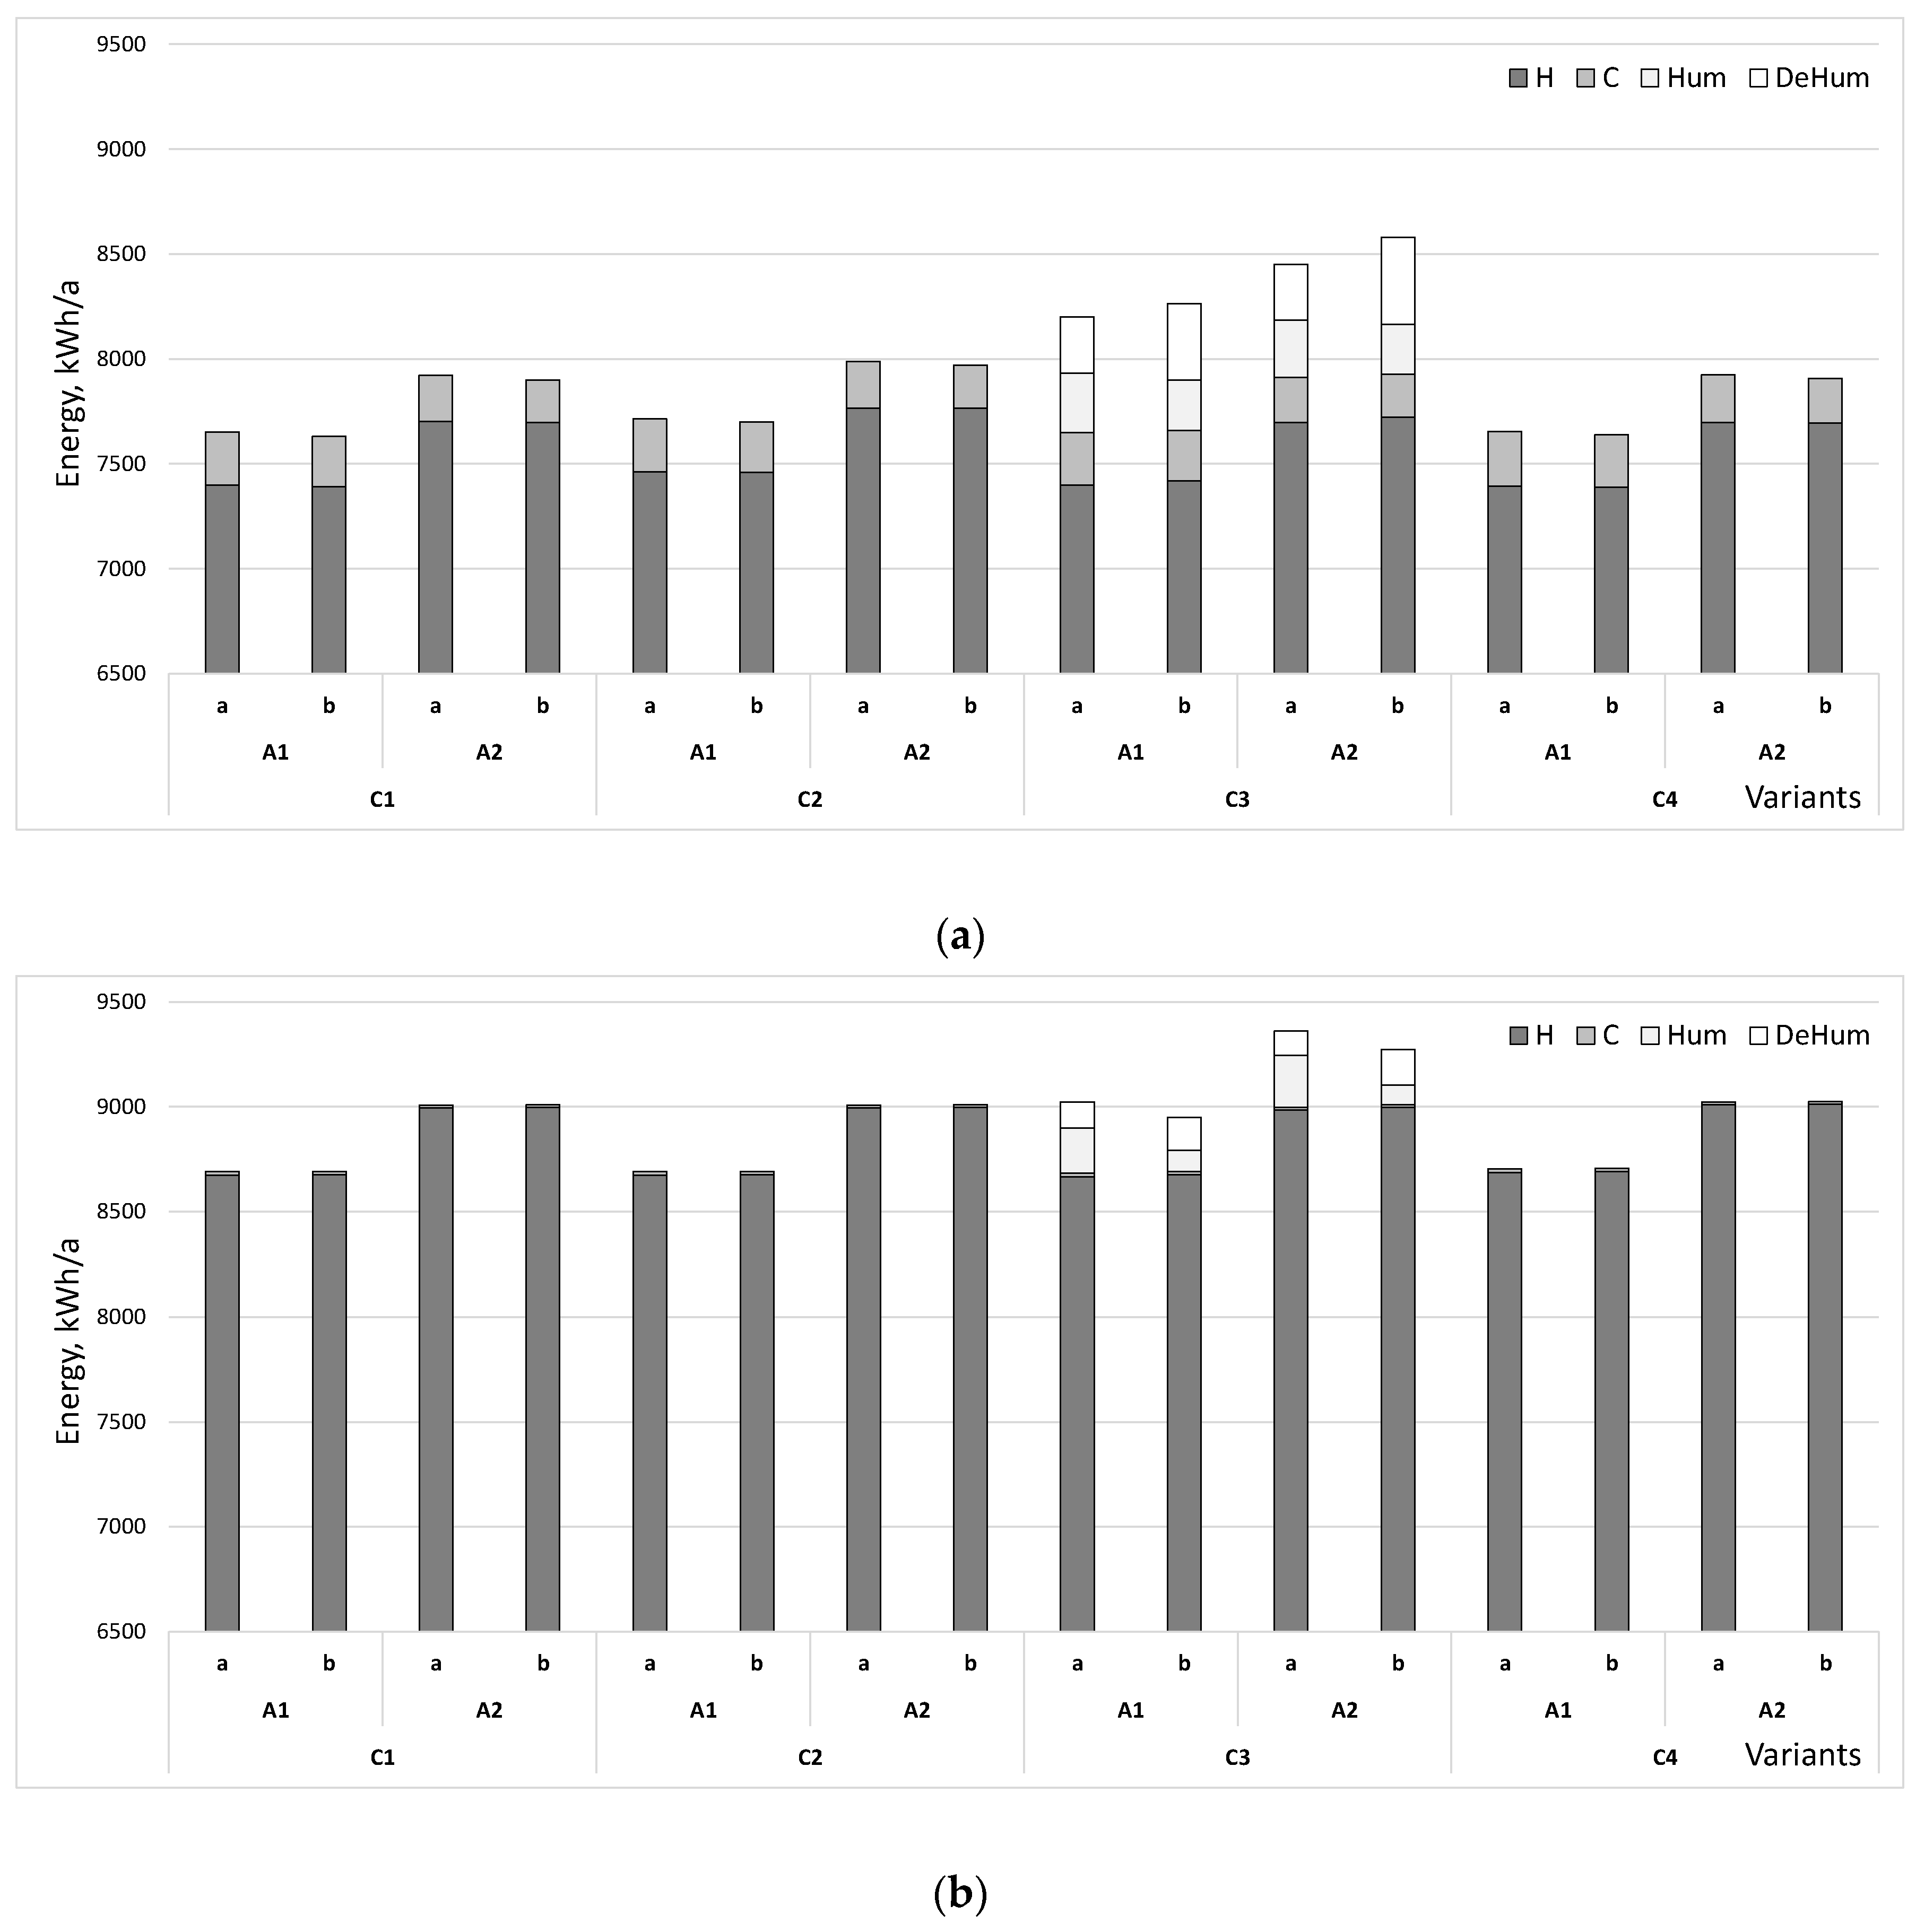
3.4. Energy Consumption for Each Purpose

The ventilation system control method and the resulting streams of air supplied to the room translate into energy consumption. Many researchers have confirmed that implementing DCV systems contributes to energy savings related to building heating and cooling [58,59]. However, only a few studies have compared the impact of different control methods for DCV systems in conjunction with moisture-buffering materials on energy consumption [22,32]. The following figure compares the energy consumption for the nursery (B1) (Figure 9a) and for the office (Figure 9b) with unpainted finishing materials (A1 and A2), divided into the heating, cooling, humidification, and dehumidification required to maintain the set values in the required ranges for the temperature (C1), carbon dioxide (C2 and C4), and indoor relative humidity (C3) control scenarios.
Regardless of the room occupancy scenario (B1, B2), under Polish conditions, most of the energy is consumed for the building’s heating needs. For the nursery (B1), it constitutes, on average, 96.7% of the total energy consumption for the scenarios excluding humidification and dehumidification (C1, C2, and C4 scenarios), whereas for the C3 scenario, it amounts to 90.2%. For the relative-humidity-controlled DCV system (C3), 3.4% of the energy in the room was used for humidification and 3.3% for dehumidification. For the office (B2), with regard to smaller supply air streams and lower indoor heat and humidity gains, the total energy supplied to the room compared to the nursery (B1) was 10.1% higher, and the energy consumption for humidification and dehumidification decreased by 2.7%.
For all analysed variants and DCV scenarios not aimed at maintaining the set level of indoor relative humidity (C1, C2, C4), one can observe the highest total energy consumption for the nursery (B1) for the C2 scenario and unpainted A2 material (7986 kWh/a). When the supply airflow increases for B1 by 20.6% (comparison of scenarios C2 and C4), the amount of energy required to maintain comfort parameters in the acceptable range decreases by only 0.8%. For the office (B2), a change in the supply airflow of 14% (comparison of scenarios C4 and C2) resulted in only a 0.2% savings in energy consumption.
The impact of moisture and thermal mass on energy consumption for each purpose is most apparent in the analysis of indoor relative-humidity-controlled DCV system operation (C3 scenario). For the nursery (B1) with unpainted finishing materials, for the A2 material (cement–lime plaster), with a moisture-buffering rate higher than A1 (gypsum board), the heating energy demand increases by 4%, and the energy consumption for cooling and humidification decreases by 14.6% and 3.1%, respectively, while only 0.2% less energy is used for dehumidification. After painting the partition surface, the energy consumption for dehumidification increases by 14.2%. This confirms that painting a surface deteriorates the moisture exchange between the partition and the room. According to the authors of [32], the relationship can be explained by a sudden air exchange increase when vapour starts being released, which, combined with cold outdoor air, contributes to a higher demand for heating power to maintain a constant temperature. Our results and those presented by Tran Le et al. [60] reveal that ignoring the hygroscopic properties of building materials can result in an underestimation of the energy demand in a mild and chilly climate.
For the other three scenarios of DCV system control (C1, C2, and C4 scenarios), the indoor relative humidity depends primarily on the indoor moisture gains, finishing material type, and level of indoor gains. Using the A2 buffering material (cement–lime plaster) led to 4.6% higher mean energy consumption than A1 (gypsum board). These results differ from those presented in [28], where the demand for heating energy was lower when hygroscopic materials were used. In contrast, the total energy consumption in the heating season was nearly equal between analysed cases with and without hygroscopic material because of the need to remove the moisture released from the materials during unoccupied periods. In our cases, the ventilation systems operated only during occupancy hours, so the moisture released from the materials in the unoccupied periods was not removed in any way. Consequently, it accumulates in the room, requiring the systems to operate at a higher capacity to remove it, especially during start-up. Hence, ventilation systems should operate even in unoccupied periods when combined with hygroscopic materials based on an adequate control strategy.

4. Conclusions

The aim of this paper is to assess the feasibility of using moisture-buffering materials on indoor surfaces in combination with DCV systems to improve indoor comfort and energy consumption. Four control options were analysed based on different indoor air quality indicators, including temperature, relative humidity, and CO2 concentration, in the two supply air streams. Two finishing materials with variable hygroscopic properties were considered. A series of simulations were carried out in the WUFI PLUS software to take into account the variability of individual parameters, such as the number of occupants, the concentration of pollutants generated, how the DCV ventilation operation is controlled, and the different interior finishing options. Based on the analyses conducted, the following conclusions can be drawn:
  • Combining moisture-buffering materials with DCV systems can be used to balance occupant comfort and building energy efficiency, provided that the materials are selected appropriately;
  • The higher the requirements regarding environmental comfort (class A), the more important the method of controlling the DCV system;
  • Taking environment comfort as the evaluation criterion, the scenario characterised by the highest number of comfort hours, both for the nursery (B1) and the office (B2), was the C3 scenario involving relative humidity control in all analysed material solutions;
  • The solutions based on humidity-level control turned out to be more effective for energy consumption when only heating and cooling purposes were compared, whereas when taking into account humidification and dehumidification, these solutions become energy-inefficient;
  • The moisture-buffering effect in rooms with CO2-controlled mechanical systems is more limited compared to the rooms with RH-controlled systems;
  • Higher energy consumption for heating was observed for cement–lime plaster (A2), which has better moisture-buffering characteristics than gypsum board (A1), demonstrating poorer moisture-buffering performance;
  • Moisture-buffering materials become active as the humidity load in the rooms increases;
  • The moisture-buffering potential effectively regulates indoor humidity peaks and maintains relative humidity levels within acceptable thresholds when coupled with adequate ventilation;
  • Because measures to reduce a building’s energy consumption do not always improve occupant comfort, solutions that compromise air quality and energy consumption must be sought.
The WUFI Plus simulation program is a good tool for assessing the behaviour of moisture-buffering materials for various finishing solutions and various ventilation systems. However, due to the lack of detailed information about the mean radiation temperature calculation algorithm used by the program, it is difficult for the authors to assess how the adopted calculation assumptions affect the obtained results of the PMV index. When conducting the simulation, it was assumed that the impact of the error resulting from the calculation algorithm used by the program is comparable for each of the analysed scenarios.
Because it is very difficult to consider all aspects that affect thermal comfort while minimising energy consumption, it is necessary to analyse all variables as early as the design stage, which involves using the right tools and involving teams of specialists from different disciplines. Therefore, it is important to consider whether there are more efficient and energy-saving methods for maintaining air quality while following the global trend of reducing energy consumption. Further research is needed to answer this question. IAQ assessment appears to be particularly relevant in buildings undergoing thermal retrofitting, for which improvements in air quality can be expected owing to the material and installation solutions proposed and evaluated in this article.

Author Contributions

Conceptualisation, D.K. and M.B.; methodology, D.K. and M.B.; software, M.B.; validation, D.K.; formal analysis, D.K. and M.B.; investigation, D.K. and M.B.; resources, D.K. and M.B.; data curation, D.K. and M.B.; writing—original draft preparation, D.K. and M.B.; writing—review and editing, D.K. and M.B.; visualisation, M.B.; supervision, D.K.; project administration, D.K. and M.B.; funding acquisition, D.K. and M.B. All authors have read and agreed to the published version of the manuscript.

Funding

This research was funded by the Ministry of Education and Science (PL) NZF-141/2024 and 0713/SBAD/0981.

Data Availability Statement

The data presented in this study are available on request.

Conflicts of Interest

The authors declare no conflicts of interest.

References

  1. Tham, K.W.; Willem, H.C. Room air temperature affects occupants’ physiology, perceptions and mental alertness. Build. Environ. 2010, 45, 40–44. [Google Scholar] [CrossRef]
  2. Tham, J.S.; Thompson, R.; Landeg, O.; Murray, K.A.; Waite, T. Indoor temperature and health: A global systematic review. Public Health 2020, 179, 9–17. [Google Scholar] [CrossRef] [PubMed]
  3. Tang, H.; Ding, Y.; Singer, B. Interactions and comprehensive effect of indoor environmental quality factors on occupant satisfaction. Build. Environ. 2020, 167, 106462. [Google Scholar] [CrossRef]
  4. Zalejska-Jonsson, A.; Wilhelmsson, M. Impact of perceived indoor environment quality on overall satisfaction in Swedish dwellings. Build. Environ. 2013, 63, 134–144. [Google Scholar] [CrossRef]
  5. Halawa, E.; Van Hoof, J. The adaptive approach to thermal comfort: A critical overview. Energy Build. 2012, 51, 101–110. [Google Scholar] [CrossRef]
  6. Gauthier, S. The role of environmental and personal variables in influencing thermal comfort indices used in building, Building Simulation. In Proceedings of the 13th Conference of the International Building Performance Simulation Association, Chambéry, France, 26–28 August 2013; pp. 2320–2325. [Google Scholar] [CrossRef]
  7. The European Parliament and the Council of the European Union. Directive (EU) 2018/844, Directive (EU) 2018/844 of the European Parliament and of the Council of 30 May 2018 amending Directive 2010/31/EU on the energy performance of buildings and Directive 2012/27/EU on energy efficiency. Off. J. Eur. Union 2018. Available online: https://eur-lex.europa.eu/legal-content/EN/TXT/HTML/?uri=CELEX:32018L0844&from=EN (accessed on 20 January 2024).
  8. PN-EN ISO 7730; Ergonomics of the Thermal Environment—Analytical Determination and Interpretation of Thermal Comfort Using Calculation of the PMV and PPD Indices and Local Thermal Comfort Criteria. Polish Organization for Standardization: Warsaw, Poland, 2006.
  9. PN-EN 16798-1; Energy Performance of Buildings. Ventilation for Buildings. Indoor Environmental Input Parameters for Design and Assessment of Energy Performance of Buildings Addressing Indoor Air Quality, Thermal Environment, Lighting and Acoustics. Polish Organization for Standardization: Warsaw, Poland, 2019.
  10. Song, W.; Zhang, Z.; Chen, Z.; Wang, F.; Yang, B. Thermal comfort and energy performance of personal comfort systems (PCS): A systematic review and meta-analysis. Energy, Build. 2022, 256, 111747. [Google Scholar] [CrossRef]
  11. Martínez-Molina, A.; Tort-Ausina, I.; Cho, S.; Vivancos, J.L. Energy efficiency and thermal comfort in historic buildings: A review. Renew. Sustain. Energy Rev. 2016, 61, 70–85. [Google Scholar] [CrossRef]
  12. Halhoul Merabet, G.; Essaaidi, M.; Ben Haddou, M.; Qolomany, B.; Qadir, J.; Anan, M.; Al-Fuqaha, A.; Abid, M.R.; Benhaddou, D. Intelligent building control systems for thermal comfort and energy-efficiency: A systematic review of artificial intelligence-assisted techniques. Renew. Sustain. Energy Rev. 2021, 144, 111116. [Google Scholar] [CrossRef]
  13. Zhuang, C.; Shan, K.; Wang, S. Coordinated demand-controlled ventilation strategy for energy-efficient operation in multi-zone cleanroom air-conditioning systems. Build. Environ. 2021, 191, 107588. [Google Scholar] [CrossRef]
  14. Guyot, G.; Sherman, M.H.; Walker, I.S. Smart ventilation energy and indoor air quality performance in residential buildings: A review. Energy Build. 2018, 165, 416–430. [Google Scholar] [CrossRef]
  15. Afroz, Z.; Higgins, G.; Shafiullah, G.M.; Urmee, T. Evaluation of real-life demand-controlled ventilation from the perception of indoor air quality with probable implications. Energy Build. 2020, 219, 110018. [Google Scholar] [CrossRef]
  16. Lu, X.; O’Neill, Z.; Li, Y.; Niu, F. A novel simulation-based framework for sensor error impact analysis in smart building systems: A case study for a demand-controlled ventilation system. Appl. Energy 2020, 263, 114638. [Google Scholar] [CrossRef]
  17. Merema, B.; Delwati, M.; Sourbron, M.; Breesch, H. Demand controlled ventilation (DCV) in school and office buildings: Lessons learnt from case studies. Energy Build. 2018, 172, 349–360. [Google Scholar] [CrossRef]
  18. Simonson, C.J.; Salonvaara, M.; Ojanen, T. The effect of structures on indoor humidity—Possibility to improve comfort and perceived air quality. Indoor Air 2002, 12, 243–251. [Google Scholar] [CrossRef] [PubMed]
  19. Teodosiu, C.; Hohota, R.; Rusaouen, G.; Woloszyn, M. Numerical prediction of indoor air humidity and its effect on indoor environment. Build. Environ. 2003, 38, 655–664. [Google Scholar] [CrossRef]
  20. Isetti, C.; Laurenti, L.; Ponticiello, A. Predicting vapour content of the indoor air and latent loads for air-conditioned environments: Effect of moisture storage capacity of the walls. Energy Build. 1988, 12, 141–148. [Google Scholar] [CrossRef]
  21. Kurnitski, J.; Kalamees, T.; Palonen, J.; Eskola, L.; Seppanen, O. Potential effects of permeable and hygroscopic lightweight structures on thermal comfort and perceived IAQ in a cold climate. Indoor Air 2007, 17, 37–49. [Google Scholar] [CrossRef] [PubMed]
  22. Kunzel, H.M.; Holm, A.; Zirkelbach, D.; Karagiozis, A.N. Simulation of indoor temperature and humidity conditions including hygrothermal interactions with the building envelope. Sol. Energy 2005, 78, 554–556. [Google Scholar] [CrossRef]
  23. Mendes, N.; Winkelmann, F.C.; Lamberts, R.; Philippi, P.C. Moisture effects on conduction loads. Energy Build. 2003, 35, 631–644. [Google Scholar] [CrossRef]
  24. Hameury, S. Moisture buffering capacity of heavy timber structures directly exposed to an indoor climate: A numerical study. Build. Environ. 2005, 40, 1400–1412. [Google Scholar] [CrossRef]
  25. Diasty, R.E.; Fazio, P.; Budaiwi, I. Modelling of indoor air humidity: The dynamic behaviour within an enclosure. Energy Build. 1992, 19, 61–73. [Google Scholar] [CrossRef]
  26. El Diasty, R.; Fazio, P.; Budaiwi, I. The dynamic modelling of air humidity behaviour in a multi-zone space. Build. Environ. 1993, 28, 33–51. [Google Scholar] [CrossRef]
  27. Derluyn, H.; Janssen, H.; Diepens, J.; Derome, D.; Carmeliet, J. Hygroscopic behaviour of paper and books. J. Build. Phys. 2007, 31, 9–34. [Google Scholar] [CrossRef]
  28. Osanyintola, O.F.; Simonson, C.J. Moisture buffering capacity of hygroscopic building materials: Experimental facilities and energy impact. Energy Build. 2006, 38, 1270–1282. [Google Scholar] [CrossRef]
  29. Holm, A.; Künzel, H.M. Experimental investigation of the hygric buffering capacity of wood based interior panelling. In Research in building physics and building engineering. In Proceedings of the Third International Building Physics Conference, Montreal, QC, Canada, 27–31 August 2006. [Google Scholar]
  30. Plathner, P.; Woloszyn, M. Interzonal air and moisture transport in a test house: Experiment and modelling. Build. Environ. 2002, 37, 189–199. [Google Scholar] [CrossRef]
  31. Kalamees, T.; Korpi, M.; Vinha, J.; Kurnitski, J. The effects of ventilation systems and building fabric on the stability of indoor temperature and humidity in Finnish detached houses. Build. Environ. 2009, 44, 1643–1650. [Google Scholar] [CrossRef]
  32. Woloszyn, M.; Kalamees, T.; Abadie, M.O.; Steeman, M.; Kalagasidis, A.S. The effect of combining a relative-humidity-sensitive ventilation system with the moisture-buffering capacity of materials on indoor climate and energy efficiency of buildings. Build. Environ. 2009, 44, 515–524. [Google Scholar] [CrossRef]
  33. Pedram, S.; Tariku, F. Moisture buffering and ventilation strategies to control indoor humidity in a marine environment: A field experimental study. In Proceedings of the 15th Canadian Conference on Building Science and Technology, Vancouver, BC, Canada, 6–8 November 2017. [Google Scholar]
  34. Abuimara, T.; O’Brien, W.; Gunay, B. Quantifying the impact of occupants’ spatial distributions on office buildings energy and comfort performance. Energy Build. 2021, 233, 110695. [Google Scholar] [CrossRef]
  35. WUFI Plus, v.3.1.0.3 DB; Version 24/79: Fraunhofer Institute for Building Physics. License Building Research Institute (ITB): Stuttgart, Germany, 2017.
  36. Künzel, H.M. Simultaneous Heat and Moisture Transport in Building Components—One- and Two-Dimensional Calculation Using Simple Parameters. Ph.D. Thesis, Fraunhofer Institute of Building Physics, Stuggart, Germany, 1995. [Google Scholar]
  37. Coelho, G.B.A.; Entradas Silva, H.; Henriques, F.M.A. Calibrated hygrothermal simulation models for historical buildings. Build. Environ. 2018, 142, 439–450. [Google Scholar] [CrossRef]
  38. Kaczorek, D.; Basińska, M.; Koczyk, H. Hygrothermal behaviour of a room with different occupancy scenarios. J. Build. Eng. 2023, 66, 105928. [Google Scholar] [CrossRef]
  39. Ruiz, G.; Bandera, C. Validation of calibrated energy models: Common errors. Energies 2017, 10, 1587. [Google Scholar] [CrossRef]
  40. ASHRAE Guideline 14-2014, Measurement of Energy, Demand, and Water Savings, ASHRAE, Atlanta. 2014. Available online: https://webstore.ansi.org/preview-pages/ASHRAE/preview_ASHRAE+Guideline+14-2014.pdf (accessed on 15 December 2023).
  41. Kaczorek, D.; Basińska, M. Hygrothermal The impact of ventilation combining with moisture-buffering materials on selected parameters of environmental comfort in a nursery. Mater. Bud. 2024, 620, 15–19. (In Polish) [Google Scholar] [CrossRef]
  42. ASHRAE. ANSI/ASHRAE Standard 55-2004; Thermal Environmental Conditions for Human Occupancy. American Society of Heating, Refrigerating and Air-Conditioning Engineers, Inc.: Atlanta, GA, USA, 2004.
  43. IEA Annex 41. Whole Building Heat, Air, Moisture Response. Available online: https://research.tuni.fi/buildingphysics/international-collaboration/annex-41/ (accessed on 17 December 2023).
  44. ASHRAE. ANSI/ASHRAE Standard 62.1-2004; Ventilation for Acceptable Indoor Air Quality. Society of Heating, Refrigerating and Air-Conditioning Engineers, Inc.: Atlanta, GA, USA, 2004.
  45. Regulation of Minister of Infrastructure of 12 April 2002 on the Technical Condition That Should Be Met by Buildings and Their Location; Journal of Laws of the Republic of Poland No 75, Item 690, (with Recast); Polish Ministry of Infrastructure: Warsaw, Poland, 2002. (In Polish)
  46. Deutsches Institut für Normung. DIN 1946-2 Ventilation and Air Conditioning. Technical Health Requirements (VDI Ventilation rules). Germany. Available online: https://standards.globalspec.com/std/1331773/DIN%201946-2 (accessed on 5 April 2023).
  47. Education and Skills Funding Agency. Building Bulletin 101 Ventilation and School Buildings (BB101). UK. Available online: https://ves.co.uk/hvac-solutions/school-ventilation/insights/building-bulletin-101/ (accessed on 5 April 2023).
  48. D’Ambrosio Alfano, F.R.; Pepe, D.; Riccio, G.; Vio, M.; Palella, B.I. On the effects of the mean radiant temperature evaluation in the assessment of thermal comfort by dynamic energy simulation tools. Build. Environ. 2023, 236, 110254. [Google Scholar] [CrossRef]
  49. Zhang, M.; Qin, M.; Rode, C.; Chen, Z. Moisture buffering phenomenon and its impact on building energy consumption. Appl. Therm. Eng. 2017, 124, 337–345. [Google Scholar] [CrossRef]
  50. Ranesi, A.; Faria, P.; Freire, M.T.; Gonçalves, M.; Veiga, M.R. Eco-efficient plastering mortars for improved indoor comfort. The influence of A. dealbata bark addition. Constr. Build. Mater. 2024, 421, 135572. [Google Scholar] [CrossRef]
  51. Fang, J.; Zhang, H.; Ren, P.; He, B.-J.; Tang, M.; Feng, C. Influence of climates and materials on the moisture buffering in office buildings: A comprehensive numerical study in China. Environ. Sci. Pollut. Res. 2022, 29, 14158–14175. [Google Scholar] [CrossRef] [PubMed]
  52. Latif, E.; Lawrence, M.; Shea, A.; Walker, P. Moisture buffer potential of experimental wall assemblies incorporating formulated hemp-lime. Build. Environ. 2015, 93, 199–209. [Google Scholar] [CrossRef]
  53. Shang, Y.; Tariku, F. Hempcrete building performance in mild and cold climates: Integrated analysis of carbon footprint, energy, and indoor thermal and moisture buffering. Build. Environ. 2021, 206, 108377. [Google Scholar] [CrossRef]
  54. Singh, M.K.; Ooka, R.; Rijal, H.B.; Kumar, S.; Kumar, A.; Mahapatra, S. Progress in thermal comfort studies in classrooms over last 50 years and way forward. Energy Build. 2019, 188–189, 149–174. [Google Scholar] [CrossRef]
  55. Fan, M.; Fu, Z.; Wang, J.; Wang, Z.; Suo, H.; Kong, X.; Li, H. A review of different ventilation modes on thermal comfort, air quality and virus spread control. Build. Environ. 2022, 212, 108831. [Google Scholar] [CrossRef]
  56. Yang, X.; Fazio, P.; Ge, H.; Rao, J. Evaluation of moisture buffering capacity of interior surface materials and furniture in a full-scale experimental investigation. Build. Environ. 2012, 47, 188–196. [Google Scholar] [CrossRef]
  57. Yoshino, H.; Mitamura, T.; Hasegawa, K. Moisture buffering and effect of ventilation rate and volume rate of hygrothermal materials in a single room under steady state exterior conditions. Build. Environ. 2009, 44, 1418–1425. [Google Scholar] [CrossRef]
  58. Lu, T.; Lü, X.; Viljanen, M. A novel and dynamic demand-controlled ventilation strategy for CO2 control and energy savings in buildings. Energy Build. 2011, 43, 2499–2508. [Google Scholar] [CrossRef]
  59. Jia, J.L.; Han, R.; Chen, X.; Li, Q.Y.; Lee, C.; Fung, Y.H. Interaction between thermal comfort, indoor air quality and ventilation energy consumption of educational buildings: A comprehensive review. Buildings 2021, 11, 591. [Google Scholar] [CrossRef]
  60. Tran Le, A.D.; Maalouf, C.; Mai, T.H.; Wurtz, E.; Collet, F. Transient hygrothermal behaviour of a hemp concrete building envelope. Energy Build. 2010, 42, 1797–1806. [Google Scholar] [CrossRef]
Figure 1. Flowchart of the calculation technique for WUFI Plus [36].
Energies 17 03937 g001
Figure 2. Nursery (B1): (a) view from outside, (b) view of the playroom, (c) ground plan with the analysed room marked in red box [38].
Energies 17 03937 g002
Figure 3. Profiles for (a) daily heat generation, (b) moisture generation, and (c) CO2 generation.
Energies 17 03937 g003
Figure 4. Number of comfort hours in terms of RH for buildings in C3 scenario—indoor relative humidity control.
Energies 17 03937 g004
Figure 5. The Predicted Percentage of Dissatisfied (PPD) for the nursery (B1) with unpainted finishing material for the winter period (1 October–31 March): (a) C2 scenario, material A1, (b) C2 scenario, material A2, (c) C3 scenario, material A1, (d) C3 scenario, material A2; for the summer period (1 April–30 September): (e) C2 scenario, material A1, (f) C2 scenario, material A2, (g) C3 scenario, material A1, (h) C3 scenario, material A2.
Energies 17 03937 g005
Figure 6. The Predicted Mean Vote (PMV) for the nursery (B1) with unpainted finishing material for the winter period (1 October–31 March): (a) C2 scenario, material A1, (b) C2 scenario, material A2, (c) C3 scenario, material A1, (d) C3 scenario, material A2; for the summer period (1 April–30 September); (e) C2 scenario, material A1, (f) C2 scenario, material A2, (g) C3 scenario, material A1, (h) C3 scenario, material A2.
Energies 17 03937 g006
Figure 7. The indoor relative humidity change for the nursery (B1) with unpainted finishing materials (A1, A2) in scenarios C2 and C4 on (a) 7 December 2021 and (b) 5 July 2022.
Energies 17 03937 g007
Figure 8. Total air stream supplied to the nursery (B1) for the entire year.
Energies 17 03937 g008
Figure 9. Energy consumption for A1 and A2 materials (a—unpainted, b—painted) and C1–C4 scenarios, divided into heating (H), cooling (C), humidification (Hum), and dehumidification (DeHum) purposes for (a) the nursery (B1) and (b) the office (B2).
Energies 17 03937 g009
Table 1. Average monthly temperature (T) and relative humidity (RH) of Warsaw.
IIIIIIIVVVIVIIVIIIIXXXIXII
T, °C−3.6−1.83.97.814.117.117.916.613.78.72.3−0.7
RH, %848380807371758079848789
Table 2. Description of the actual building components [41].
Building ComponentDesign (Outwards)Thermal Transmittance
U, W/(m2·K)
Exterior wall
(south and west)
  • 12.5 mm cement–lime plaster/gypsum board
1.04
  • 240 mm hollow-core slabs
  • 140 mm aerated concrete
  • 5 mm mineral-lime cement
Roof
(horizontal)
  • 12.5 mm cement–lime plaster/gypsum board
0.42
  • 240 mm hollow-core slabs
  • 1 mm bituminous paper
  • 80 mm mineral wall
  • 30 mm concrete
Interior wall
  • 12.5 mm cement–lime plaster/gypsum board
  • 120 mm calcium silicate brick
2.06
  • 12.5 mm cement–lime plaster/gypsum board
Ceiling
  • 7 mm laminate flooring
0.89
  • 30 mm concrete
  • 1 mm bituminous paper
  • 20 mm expanded polystyrene insulation
  • 240 mm hollow-core slabs
  • 12.5 mm cement–lime plaster/gypsum board
Windows 2.53
Table 3. Properties of internal coverings.
Properties Finishing Material
(A1) Gypsum Board(A2) Cement–Lime
Plaster
Thermal conductivity
λ, W/(m·K)
0.200.80
Water vapour diffusion resistance
μ, -
6.119.0
Table 4. Description of symbols identifying analysed options.
SymbolDescription
B1nursery
B2office
A1gypsum board
A2cement–lime plaster
C1DCV system (temperature control)
C2, C4DCV system (CO2 as priority and temperature control)
C3DCV system (RH as priority and temperature control)
Table 5. The percentage of comfort hours for each parameter (T, CO2, RH) in the given control scenarios (C1–C4) for finishing materials A1 and A2.
Nursery (B1)
Material A1Material A2
TCO2RHTCO2RH
The unpainted finishing materialC198.273.353.398.871.554.4
C298.3100.056.798.8100.057.5
C398.077.196.398.775.897.0
C498.386.156.198.886.356.5
The painted finishing materialC198.572.744.298.971.043.5
C298.5100.051.398.9100.050.2
C398.486.695.798.897.295.7
C498.486.350.398.886.649.2
Office (B2)
Material A1Material A2
TCO2RHTCO2RH
The unpainted finishing materialC198.273.353.398.871.554.4
C298.3100.056.798.8100.057.5
C398.077.196.398.775.897.0
C498.386.156.198.886.356.5
The painted finishing materialC198.572.744.298.971.043.5
C298.5100.051.398.9100.050.2
C398.486.695.798.897.295.7
C498.486.350.398.886.649.2
T—comfort hours within the range of acceptable temperature values; CO2—comfort hours within the range of acceptable CO2 concentration values; and RH—comfort hours within the range of acceptable relative humidity values. The number of comfort hours for the given controlled parameter in scenarios C1–C4 are marked in bold.
Table 6. The number of comfort hours in relation to the requirements set for a given category of buildings according to PN-EN 7730 [8].
Nursery (B1)
Material A1Material A2
ABCABC
The unpainted finishing materialC1C1151602859144630
C2C2148624875143659
C3C3153633860154659
C4C4153630881147654
The painted finishing materialC1C1151588848143611
C2C2149628872143651
C3C3155667870156689
C4C4151627880144644
Office (B2)
Material A1Material A2
ABCABC
The unpainted finishing materialC1193566918182540895
C2193566918182540895
C3188576929186555903
C4190566915182539893
The painted finishing materialC1187594925187582902
C2187594925187582902
C3183598924180578905
C4184590922182575900
Disclaimer/Publisher’s Note: The statements, opinions and data contained in all publications are solely those of the individual author(s) and contributor(s) and not of MDPI and/or the editor(s). MDPI and/or the editor(s) disclaim responsibility for any injury to people or property resulting from any ideas, methods, instructions or products referred to in the content.

