Article

Lessons Learned from the Process of Water Injection Management in Impactful Onshore and Offshore Carbonate Reservoirs

Department of Petroleum Engineering, Cullen College of Engineering, University of Houston, Houston, TX 77204, USA
*
Author to whom correspondence should be addressed.
Energies 2024, 17(16), 3951; https://doi.org/10.3390/en17163951
Submission received: 14 June 2024 / Revised: 2 August 2024 / Accepted: 7 August 2024 / Published: 9 August 2024
(This article belongs to the Special Issue Recent Advances in Oil and Gas Recovery and Production Optimisation)

Abstract

:
This paper presents a comprehensive analysis of water injection management practices for complex and impactful onshore and offshore carbonate reservoirs. It delves into the fundamental aspects of waterflooding design, surveillance techniques, and monitoring methods tailored for the unique challenges posed by carbonate formations. Two case studies from the Permian Basin in Texas and two from Lula Field offshore Brazil and Agbami Field offshore Nigeria are examined considering scientific principles into practice to provide insights into best practices, lessons learned, and strategies to maximize the benefits derived from real noteworthy waterflood operations. The paper underscores the significance of rigorous reservoir characterization, including understanding reservoir architecture, heterogeneities, fracture networks, fluid communication pathways, and rock–fluid interactions. It emphasizes the crucial role of integrated multidisciplinary teams involving geologists, reservoir engineers, production engineers, and field operators in ensuring successful waterflood design, implementation, and optimization. Through the case studies, the paper highlights the importance of designing pattern configurations, well placements, and injection/production strategies to the specific reservoir characteristics, continually optimizing these elements based on surveillance data. It also stresses the necessity of comprehensive data acquisition, advanced analytics, numerical simulations, and frequent model updates for effective reservoir management and decision-making. The paper is impactful in terms of the lessons learned from the actual case studies, and how can these be implemented in actual field projects. Different case studies documented in the paper provide the challenges facing them and how different authors have addressed their problems in unique ways. The paper distills the information and important findings from a variety of case studies and provides succinct information that is of immense value as a reference. Important findings of these case studies are connected using creativity and are innovative as they introduce unique techniques and establish successful ideas to create new value in terms of maximizing oil recovery. Most importantly, this paper explores the application of innovative technologies, such as intelligent completions, 4D seismic monitoring, and water–alternating gas (WAG) injection, which can significantly improve waterflood performance in complex carbonate reservoirs. In summary, the paper provides a thorough understanding of the factors contributing to the success and failure of waterfloods in carbonate reservoirs through case studies based on factually and technically sound operations. It documents guidelines for optimizing waterflood performance and reducing or eliminating the potential for failures, reinforcing positive results in these challenging yet invaluable hydrocarbon resources.

1. Introduction

The energy required to support the whole range of human activities comes from a variety of sources, such as fossil fuels (petroleum, natural gas, and coal), nuclear energy, and renewable energy. Liquid fossil fuel, namely petroleum, is a key component of the energy mix, contributing up to about 36% of U.S. energy consumption (Figure 1). The recovery of crude oil typically consists of three stages: primary, secondary, and tertiary. Primary recovery, also known as natural depletion, is the initial stage where the natural production mechanisms, such as solution gas drive, natural water drive, and gravity drainage, create sufficient pressure to force the oil and gas to the surface without any additional assistance. Primary recovery can usually extract a small portion of the original oil in place (OOIP) in a reservoir, often around 5–20%. Waterflooding is a secondary recovery method that injects water into the reservoir to help maintain pressure and sweep oil toward the production wells. This method is effective and widely used, and can extract an additional 20–40% of the OOIP. Tertiary recovery is employed to further increase oil production after primary and secondary methods are complete. It injects various fluids or gases such as CO2, polymers, surfactants, or chemicals into the reservoir to interact with the oil and improve its flow characteristics. This process can potentially extract an additional 5–20% or more of the OOIP.
Waterflooding remains the pre-eminent method for improving recovery from oil reservoirs. Its effectiveness, relatively low cost, and easy-to-operate features make it favorable over decades. Nowadays, in the current context of uncertainty regarding the applicability of EOR (enhanced oil recovery) techniques, integrated waterflood asset management has gained unprecedented significance. The concepts and processes of reservoir management were proposed and established in the 1990s by Satter and Thakur [2,3,4]. They emphasized the importance of integrating different disciplines such as reservoir characterization, fluid behavior in the reservoir, drilling and operating wells, surface handling of the fluids, facilities, water system, and field operation (Figure 2) to benefit the most from each project. Furthermore, they highlighted that reservoir management is not confined to the beginning of geologic evaluations, economic justifications, and project approval by management. Instead, these management activities occur from before the commencement of the waterflood until the waterflood becomes uneconomical or transitions into EOR techniques [3].
Carbonate reservoirs hold tremendous significance for the oil and gas industry due to their substantial hydrocarbon potential and global distribution. These reservoirs are prevalent in many major hydrocarbon-producing regions, including the Middle East, North America, and offshore environments. The complex pore systems and fracture networks within carbonate rocks can create highly productive reservoirs capable of yielding substantial volumes of oil and gas. With their widespread occurrence and the potential for substantial hydrocarbon accumulations, carbonate reservoirs represent invaluable targets for the oil and gas industry’s exploration and development efforts, contributing significantly to global energy supplies.
Waterflooding plays a crucial role in enhancing oil recovery from carbonate reservoirs. By injecting water into the reservoir, waterflooding helps maintain reservoir pressure and sweep remaining oil towards production wells. However, the complexity of carbonate reservoirs requires careful design of waterflooding. When designed and implemented effectively, waterflooding can significantly improve recovery factors in carbonate reservoirs, maximizing the economic value of these vital hydrocarbon resources for the oil and gas industry.
This paper highlights reservoir waterflooding in terms of practical management practices in carbonate reservoirs. Two case studies from the Permian Basin in Texas, USA, one case study from Brazil, and one case study from South Africa (Appendix A) are included in this paper to illustrate the best waterflood management practices.

2. Overview of Carbonate Reservoirs

Carbonate rocks are sedimentary rocks consisting of significant quantities of carbonate minerals, such as limestone and dolomite. Pores and karst caves are generally the main storage spaces, and fractures serve as both storage spaces and the main flow channels in the reservoir rocks. Carbonate reservoirs have become the dominant oil and gas production resources due to their ubiquity, uniform thickness, and large scale. Approximately 70% of the world’s oil and gas resources are from carbonate reservoirs, and proven recoverable reserves account for approximately 50% [5]. For instance, Middle East reservoirs produce approximately two-thirds of global oil production, and 80% of Middle East oil-bearing formations are carbonate rocks [6]. In North America, about one-third of oil and gas fields are in carbonates and they produce about 50% of all North American giant fields [7]. In China, there is nearly 3 × 10⁶ km2 carbonate reservoirs, which accounts for 1/3 of China’s land area [5]. Marine carbonate oil and gas resources make up the dominant portion of global oil and gas production, which can be as high as 90%. There are 389 oil and gas basins in the world engaged in commercial production, among which 208 basins are located in marine carbonate strata [5]. This information illustrates the significance of carbonate fields in the world.
Compared to sandstone reservoirs, Carbonate rocks have notable differences in geological structure characteristics that require specific attention. They typically have complex pore structures that vary widely in terms of size, shape, and connectivity, leading to a strong heterogeneity of formations. The porosity is generally low, with a range of 4% to 16%, and the permeability ranges from 1.0 to 500 md [5]. Therefore, the success of waterflooding in carbonates is highly dependent on reservoir characteristics, such as fracture networks, matrix porosity, and wettability. Besides proper reservoir characterization and an understanding of fluid flow dynamics within the carbonate pore system, robust waterflood management is essential for optimizing waterflood performance.

3. Summary of Waterflood Cycle

3.1. Importance of Integrated Waterflood Asset Management

Integrated waterflood management is crucial for maximizing oil recovery and economic value from oil reservoirs. This approach involves a multidisciplinary collaboration that integrates geology, geophysics, reservoir engineering, production engineering, and field operations to ensure comprehensive planning and execution. By employing integrated waterflood management, oil recovery can be significantly improved beyond primary recovery methods, unlocking billions of barrels of additional oil. This holistic and technologically advanced approach ensures not only enhanced recovery but also the economic viability of waterflood projects throughout their lifecycle. The objectives of integrated waterflood asset management can be summarized as follows:
(1)
Enhancing recovery from huge remaining OIP (oil in place) in carbonates, which requires effective reservoir management from “day 1”—billions of barrels of recoverable oil;
(2)
Designating the proper timing, which has a significant impact on recovery efficiency;
(3)
Maximizing volumetric sweep early on in the project’s life, as trying to squeeze more oil from marginal fields will yield marginal to average results;
(4)
Identifying the purpose (take the “bull by the horns” and solving the problem without any delay):
  • Determining the key components of an effective IOR (improved oil recovery) asset management strategy;
  • Describing important problems and technical areas;
  • Considering all environmental issues;
  • Gaining advantages from managing IOR as a team.

3.2. Technology Development Process

The process of waterflood asset management encompasses eight key stages [3], each critical to ensuring the effective implementation and optimization of waterflood projects: It commences with the identification of potential opportunities through preliminary conceptual designs, supported by laboratory investigations. Subsequent phases involve the strategic selection of candidate fields for prototype implementation and the sanctioning of field trials or pilots to extend the application from the controlled laboratory environment to real-world reservoir conditions. Once the technology has been validated through pilot testing, the most promising applications are chosen for broader deployment, contingent upon the approval of requisite expenditures. As the technology is applied across various fields, continuous modifications to the programs become imperative to accommodate evolving reservoir dynamics and operational experiences. The last state comprises the execution and evaluation of the waterflood project, utilizing the insights gained throughout the preceding phases to optimize performance and maximize economic recovery.

3.3. Factors Affecting Waterflood Recovery

Waterflooding in carbonate reservoirs is affected by many factors, not only the design and process of waterflooding, but also the nature of carbonate reservoirs. Waterflood recovery efficiency is governed by the following [3]:
(1)
Recovery efficiency, which is the result of volumetric sweep efficiency pore-to-pore displacement efficiency, is influenced by several factors:
  • Reservoir heterogeneity, including natural fractures, directional permeability, crossflow, and non-communicating layers, which impacts volumetric sweep;
  • Reservoir fluid properties, such as viscous fingering, mobility ratio, and residual water/oil/gas saturations, which affect microscopic displacement;
  • High gas or water saturation, which may create channels that allow injected water to bypass oil;
  • Unbalanced flood patterns due to variations in permeability, pattern type and size, and variable injectivity and productivity, which can reduce sweep efficiency;
  • Lack of fluid communication between injectors and producers due to geological structure (crossbedding, discontinuity, faulting), which impairs sweep efficiency.
(2)
Carbonate reservoirs often exhibit significant heterogeneity, with considerable variation in both areal and vertical properties.
(3)
The flood patterns of producers and injectors, as well as their completions, complicate fluid movements close to the wellbore and inside the porous medium.
(4)
Reservoir rock wettability, where
  • More favorable conditions are available for water-wet reservoirs compared to oil-wet reservoirs;
  • Oil-wet reservoirs can be efficiently flooded as well in some circumstances;
  • It is noteworthy that heavy oil reservoirs are able to be flooded efficiently.
(5)
Pre-existing fractures or fractures created by injecting above parting pressure can adversely impact sweep efficiency.
(6)
Higher reservoir pressure maintains lower oil viscosity and a higher oil formation volume factor, which is favorable, but requires more investment.
(7)
Maximum incremental oil recovery is achieved at or near the saturation pressure when the oil formation volume factor is highest.

3.4. Guidelines for Waterflooding

Effective waterflood design, implementation, and surveillance in carbonate reservoirs should follow a structured set of guidelines that address geological, engineering, and operational aspects. These guidelines aim to optimize waterflood performance by improving reservoir characterization, identifying bulk oil zones, designing optimal flood patterns, implementing rigorous monitoring and surveillance programs, managing surface facilities and environmental impacts, and handling produced water at surface [8]. The key guidelines for successful waterflood management in carbonate reservoirs are as follows:
(1)
Rigorous reservoir characterization: detailed understanding of reservoir architecture, heterogeneities, permeability and porosity variations, oil saturation distribution, fractures/fracture networks, fluid communication pathways, reservoir continuity, and rock–fluid interactions/wettability;
(2)
Estimation of pay areas with the bulk of recoverable hydrocarbon: identify thin high-permeability layers/streaks, estimate portion of overall pay containing the bulk of mobile oil, and analyze primary depletion performance to infer high/low permeability areas;
(3)
Pattern configuration and performance analysis: evaluate different flood patterns (five-spot, line-drive, peripheral, etc.), conduct pattern balancing, assess the need for infill drilling, track flood fronts, and analyze profile data;
(4)
Data gathering, analysis, and analytics: a comprehensive data acquisition program (well logs, cores, production data, injection data, 4D seismic, tracer tests, etc.), and integrated database, and advanced analytics like numerical simulation;
(5)
Well testing and reservoir pressure monitoring: well tests (pressure transient, injection profiling), interference testing between injectors/producers, field-wide pressure monitoring, and pressure transient analysis;
(6)
Information management: databases for reservoir, wells, facilities, and water system parameters, workflow for updating models with new data, and data visualization tools;
(7)
Mineral reaction and wettability: assessing rock–brine interactions, the impact on wettability, the potential for scale/fine migration, and the remedial treatments required;
(8)
Environmental considerations: surface handling of produced water, optimal water quality for injection, treatment requirements, and disposal of waste streams;
(9)
Facility design and operations: design of surface facilities (water treatment, injection/production equipment), automation, well monitoring, and control systems;
(10)
Surveillance and management: integrated team-based surveillance, proactive monitoring and control actions, and modification of operations based on performance data

3.5. Why Do Some Waterfloods Fail?

Actual field performance may not match predictions due to unrealistic assumptions and the rough estimation of some parameters. Forecasted performance may be very different and may lead to project failures. Here, we provide some insights into why some waterfloods fail in carbonate reservoirs [3]:
(1)
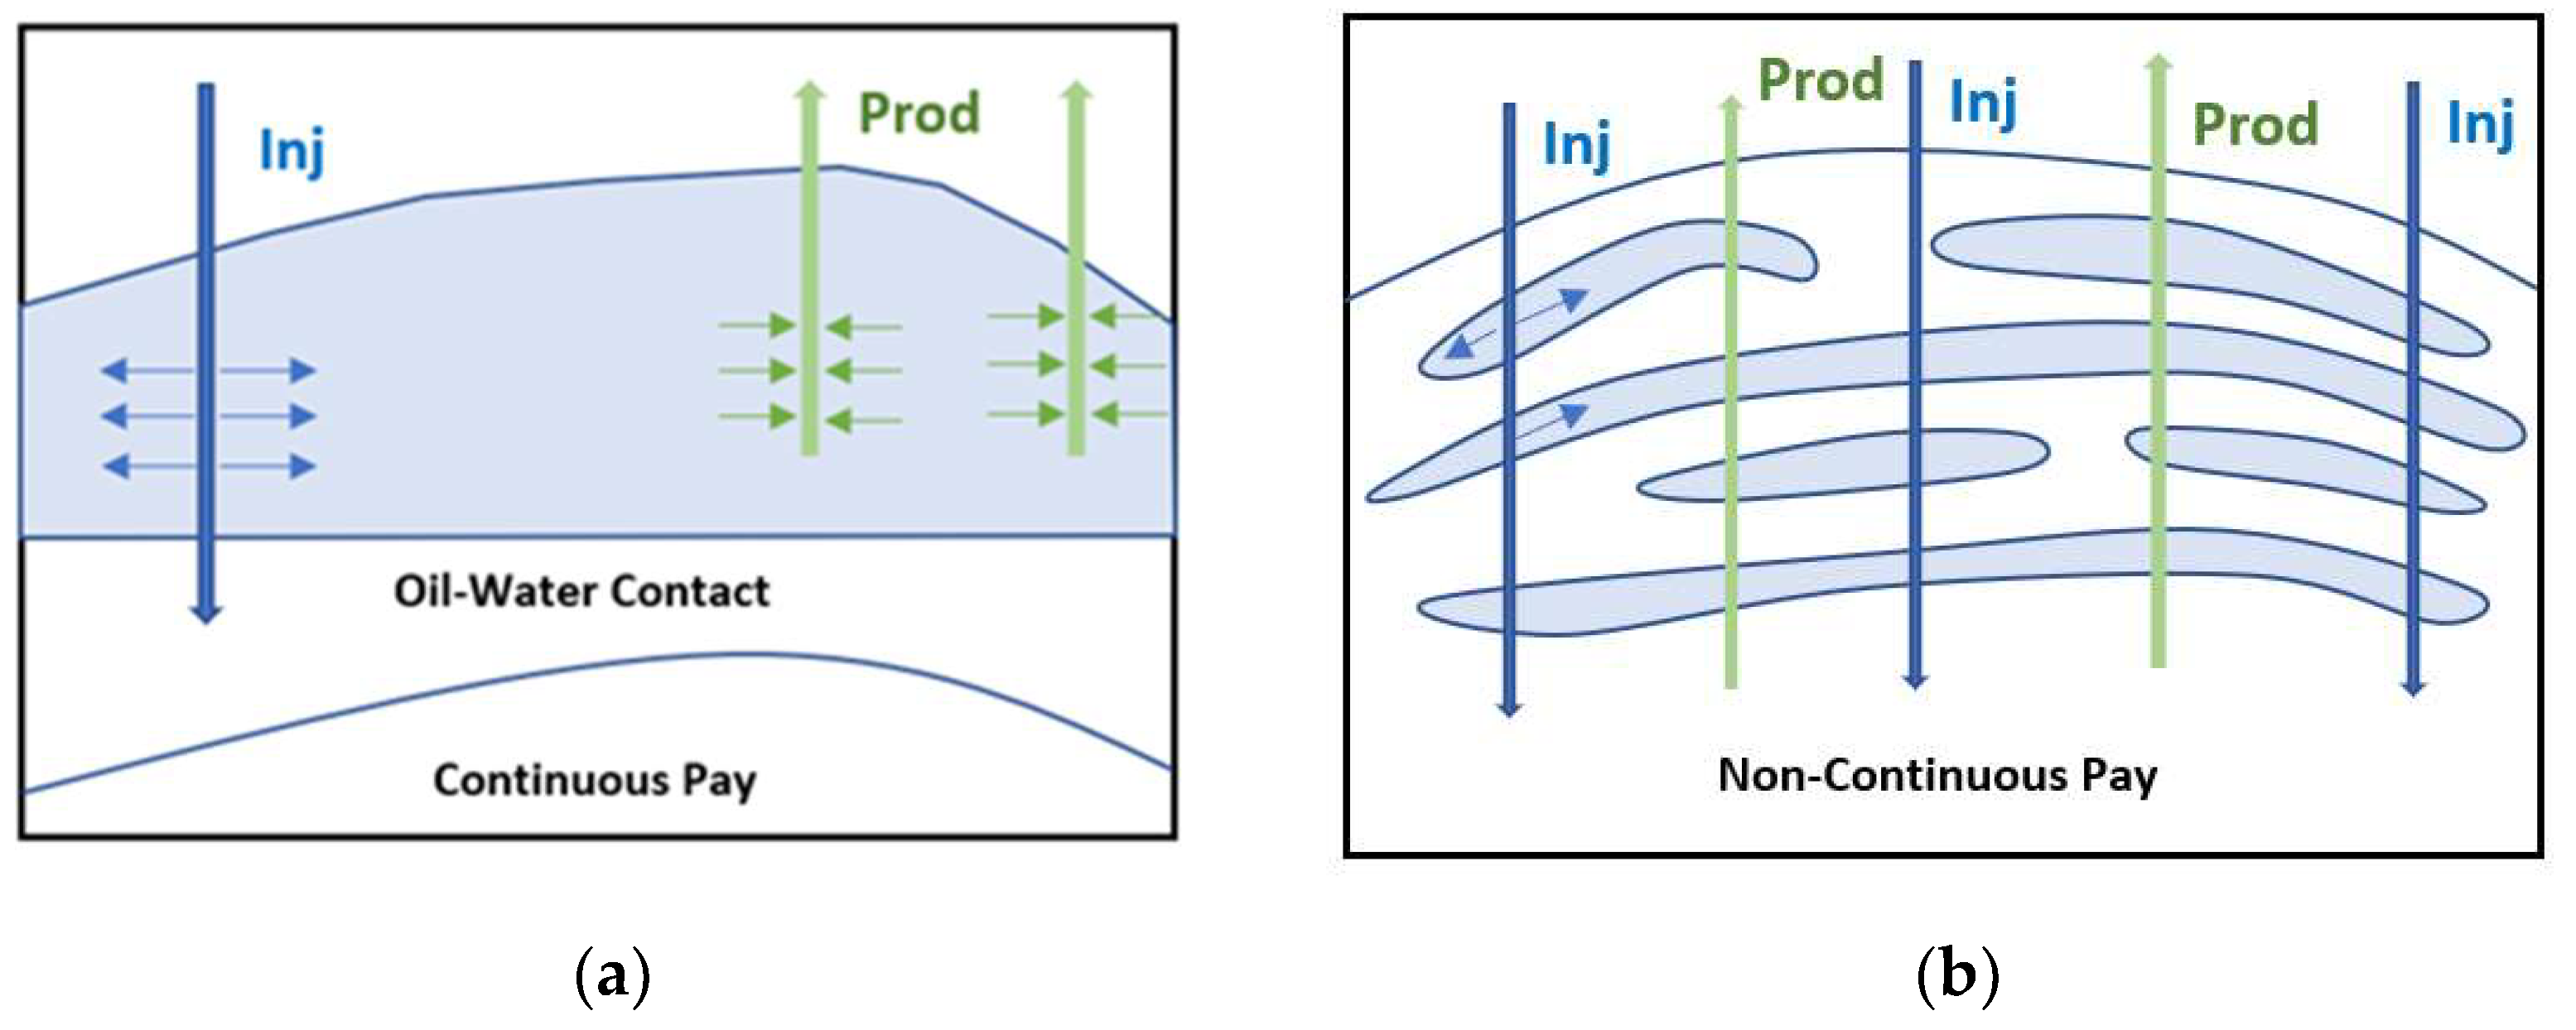
Vertical permeability variations cause early breakthrough: water bypasses oil zones and reduces the efficiency of oil displacement. This occurs because water tends to flow through zones of higher permeability, leading to uneven displacement and early breakthrough in these high-permeability pathways.
(2)
Fractures and directional permeability: fractures can act as high-permeability channels that lead to rapid water movement, bypassing large volumes of oil and reducing sweep efficiency. Directional permeability, where permeability is higher in one direction, can cause anisotropic flow patterns, complicating the displacement process and leading to suboptimal recovery. One way to manage the situation is to align the injection wells along the direction of the fractures, thus taking advantage of the anisotropy in an effective manner.
(3)
Fluid distribution in a thick reservoir with high vertical permeability: the injected water may preferentially flow into higher-permeability zones or vertically segregate downward, leading to uneven displacement across the reservoir. This results in poor sweep efficiency and leaves significant portions of the reservoir unswept, thereby reducing overall recovery.
(4)
Viscous fingering and poor mobility ratio: viscous fingering occurs when there is a large difference in viscosity between the injected water and the oil. A poor mobility ratio, where the water is much less viscous than the oil, exacerbates this problem. This leads to unstable displacement fronts and the formation of fingers or channels of water that bypass oil, significantly reducing the efficiency of the waterflood.
(5)
Unbalanced injectivity: unbalanced injectivity refers to the variations in the ability of different injection wells to take in water. This can be caused by differences in reservoir properties, well conditions, or operational issues. Such imbalance leads to an uneven distribution of injected water, causing some areas to flood more quickly than others, and thus, the inefficient displacement of oil.

4. Design of Waterfloods: Geological, Engineering, and Operational Considerations

Designing an effective waterflood project involves a comprehensive approach that integrates geological, engineering, and operational aspects. The process is structured into several phases, each with distinct objectives and tasks:
(1)
Phase 1: conceptual planning and opportunity identification
  • Assess reservoir characteristics, including depth, thickness, temperature, and properties of the oil such as gravity and viscosity;
  • Outline potential injection patterns and explore alternatives;
  • Estimate initial rates and pressures for both injection and production phases;
  • Determine water source, quality, and compatibility with the reservoir;
  • Establish the projected lifespan of the waterflood project;
  • Gather and review all available data on the project, reservoirs, wells, and facilities, noting any missing information;
  • Provide rough cost estimates for the pump system, water sourcing and treatment, facility modifications, well drilling and completion, equipment changes, and operational expenses;
  • Conduct a preliminary economic screening to assess the project’s feasibility based on reasonable estimates.
(2)
Phase 2: development and evaluation of alternatives
  • Collect, validate, consolidate, manage, and store data for reservoir study and asset development planning;
  • Form a multidisciplinary team to conduct a detailed study and explore various development alternatives, producing:
    • A comprehensive reservoir description;
    • Analysis of drilling and production performance;
    • Predictions of waterflood performance using reservoir simulations or traditional methods;
    • Comparative analysis of similar fields, if data are available;
    • An integrated plan for the waterflood system;
    • Economic analysis and risk assessment, identifying key economic drivers and risks;
    • Initiation of unitization proceedings with other partners if necessary;
    • Designing pilot research or injectivity test if required.
(3)
Phase 3: detailed evaluation of preferred alternatives
  • Conduct a thorough analysis of the best possibilities for waterflood (e.g., five-spot, nine-spot, line drive, peripheral flood). This evaluation should utilize core and log data, completion data, production performance analysis (including oil, water, and GOR (gas-oil ratio)), pressure performance analysis, reservoir rock and fluid analysis, operating costs, and laboratory or pilot test results.
  • Select the best alternative(s) for detailed design and development, creating comprehensive waterflood design plans, and estimating development costs.
  • Perform detailed risk and environmental assessments.
  • Negotiate unitization parameters if needed.
  • Conduct economic and risk analyses, and determine the expected value of the project.
  • Seek approval from management and regulatory authorities.
  • Develop and document a waterflood asset management plan, including key performance metrics.
(4)
Phase 4: implementation of waterflood and management plan
a.
Complete equipment and material selection, sizing, and thorough design.
b.
Carry out the asset management strategy, which includes the following:
  • Drilling and/or recompleting wells;
  • Erecting the required infrastructure;
  • Installing field and artificial lift apparatus.
c.
Complete the waterflood operating plan and schedule.
d.
Develop a surveillance and monitoring plan for the waterflood.
e.
Assemble and train the operating team.
(5)
Phase 5: operation, monitoring, and evaluation
  • Continuously monitor the performance of the reservoir, wells, and facilities;
  • Evaluate performance against established metrics;
  • Update the dynamic reservoir model with new data from ongoing operations and evaluations;
  • Adjust plans and strategies based on actual performance;
  • Identify opportunities for project expansion;
  • Develop a strategy for the eventual termination of the waterflood.

5. Onshore Case Studies

Two case studies from Texas are provided here to show how geological concepts were applied to optimize waterflood projects and finally improve oil recovery. Case 1 and Case 2 are old oil fields because they were both discovered in the 1930s. These fields went through primary production, then secondary production with very effective water injection, and now with CO2 EOR, which has occurred for over 30 years. These cases have experienced a complete life-cycle of primary, secondary, and tertiary (or EOR) recovery phases, and they are still producing now. The final recovery factors in these fields are approaching 50% of the OOIP (original oil in place) and 60% of the OOIP, respectively. Thus, these two cases teach us that even with very complex reservoir heterogeneities, if reservoir management, surveillance, and monitoring are followed effectively and in a timely manner, we can obtain very attractive total recovery factors in the range of 50 to 60% of the OOIP.

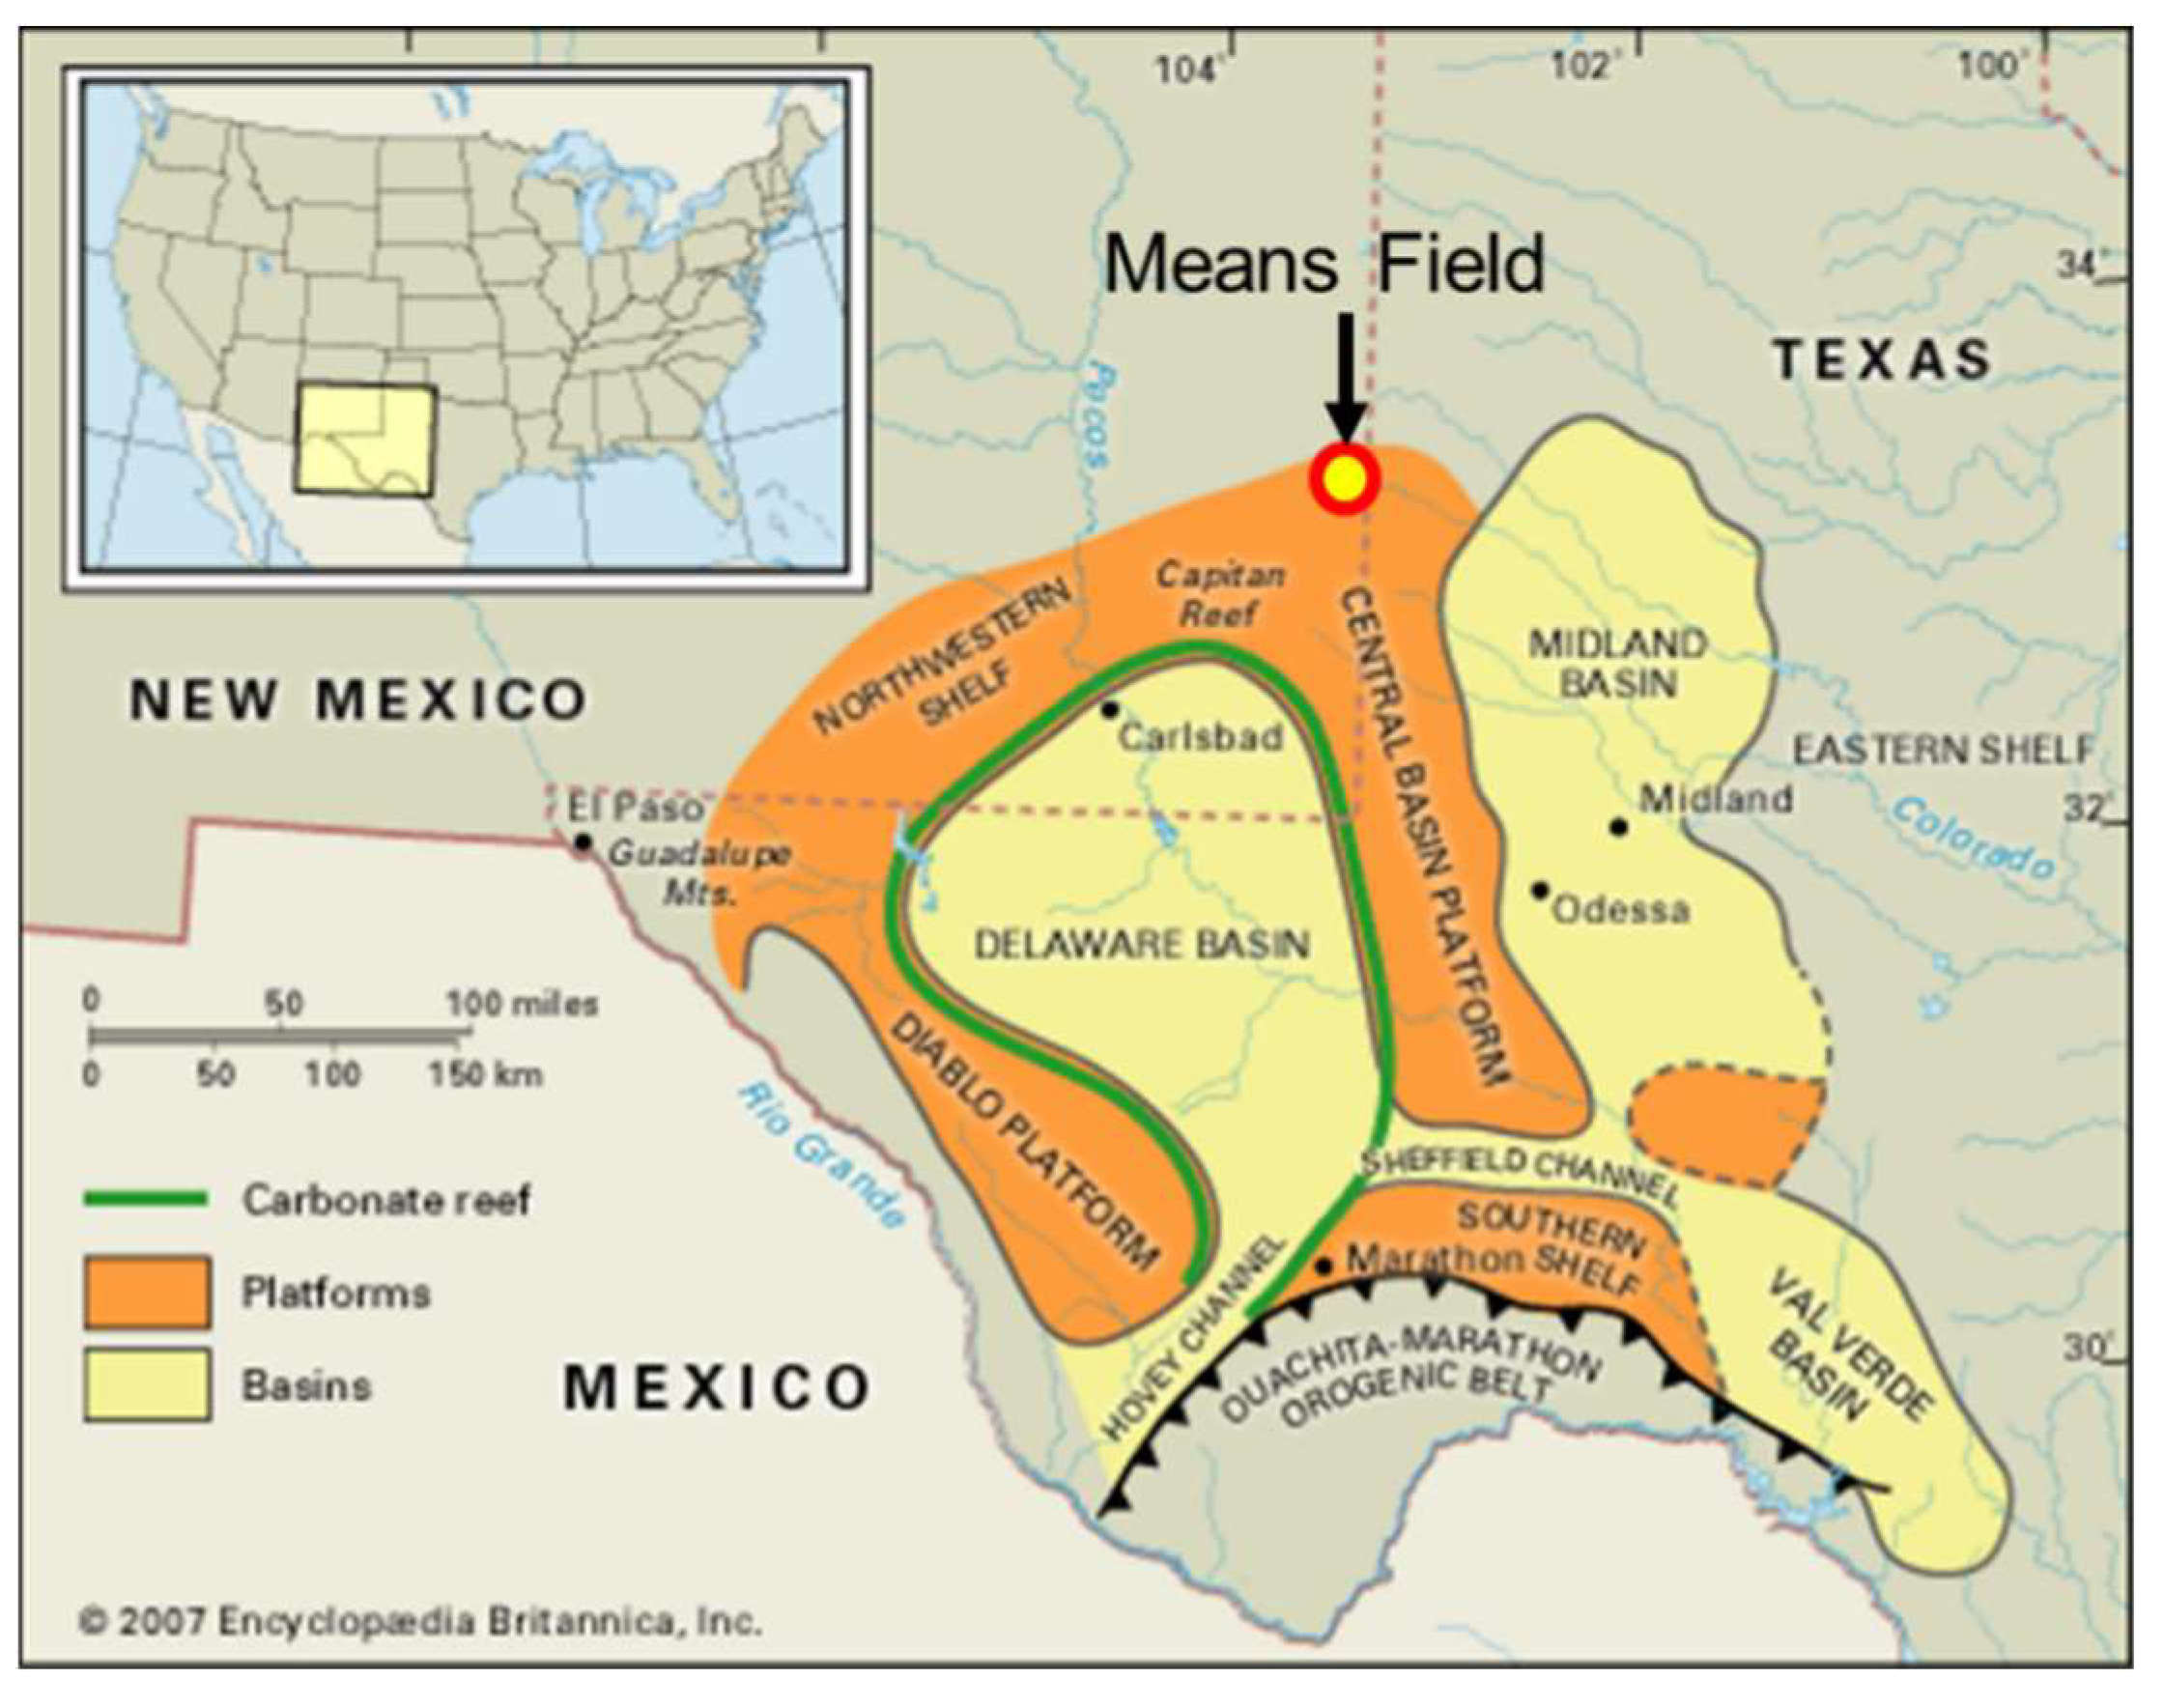
5.1. Means San Andres Unit (MSAU)—Case 1

5.1.1. Reservoir Description

The Means field is located in Andrews County, TX, roughly 50 miles northwest of Midland, situated near the eastern margin of the Central Basin platform (Figure 3). It was discovered in 1934 and by the early 1950 was developed at a 40-acre spacing with approximately 300 wells [9]. The reservoir and fluid properties are listed in Table 1.
The MSAU has a north–south running anticline that divides the field into the North Dome and the South Dome (Figure 4). This division is affected by a prominent structural saddle, oriented east–west, situated close to the center of the field. The production formations include the Grayburg and upper and lower San Andres at depths ranging from 4200 to 4800 ft. The Grayburg is about 400 ft, with the basal 100 to 200 ft being considered gross pay, while the San Andres is more than 1400 ft thick with the upper 200 to 300 ft being productive. The primary drive mechanism for the Grayburg formation is the solution gas drive, with the same bubble point pressure as the reservoir initial pressure of 1850 psi. In contrast, the San Andres formation is driven by a combination of fluid expansion and weak water drive. Overall, the Grayburg Reservoir is of much poorer quality and has minor production compared with the San Andres.

5.1.2. Field History

Figure 5 provides a brief description of MSAU’s history before tertiary operation. One year following the discovery of MSAU, the initial reservoir study was completed, emphasizing reservoir management relevant to primary recovery. Subsequently, in 1959, a further reservoir study was undertaken to evaluate the waterflood recovery.
In 1963, a peripheral waterflood pattern was initiated, as depicted in Figure 6a. Twenty-four wells were permanently shut in and maintained to monitor reservoir pressure. By 1967, the peripheral flood pattern was no longer able to provide adequate pressure support. Consequently, in 1969, a reservoir engineering and geological study was performed to devise a novel depletion plan to counteract the pressure reduction. An analysis of pressure data from the observation wells indicated that neither the North Dome nor South Nome had received sufficient pressure support. Therefore, the peripheral injection pattern was replaced by a 3:1 line drive (Figure 6b). Following this implementation, the unit production improved from 12,000 BOPD in 1970 to over 18,000 BOPD in 1972. In 1976, in line with the concept of continuous and floodable pay, a significant infill drilling effort was started, as shown in Figure 6c. From 141 infill wells (20-acre spacing with an 80-acre inverted nine-spot pattern), about 15.4 MMBBL of additional oil was obtained (Figure 7), which included the following measures:
(1)
Monitoring of injection (water) and production (oil, gas, and water);
(2)
Control of injection pressures through step rate tests;
(3)
Pattern balancing using computer balance programs;
(4)
Injection profile control to ensure injection into all pay zones;
(5)
Specific production profiles;
(6)
Fluid level checks to ensure pump-off of producing wells.
From 1981 to 1982, a comprehensive CO2 tertiary recovery reservoir study was conducted. While similar to other San Andres fields in the Permian Basin, some properties, such as relatively high MMP (between 1850 and 2300 psi) and oil viscosity (6 cP), made the means unit somewhat unique. A detailed reservoir description program along with extensive laboratory and simulation works was conducted for a CO2 flood pilot, and it was continuously updated through the planning and implementation phases. A number of 10-acre wells, primarily injectors, were drilled as part of the CO2 project. The project covered 67% of the productive acres and 82% of the OOIP with 167 patterns spread across 6700 acres. Among the main goals of the operation were the following:
(1)
All floodable pay zones had producers and injectors completed;
(2)
Reservoir pressure was maintained close to the MMP of 2000 psi;
(3)
Injection pressure was maximized and maintained at less than the fracturing pressure;
(4)
Producers were discharged.
(5)
Injection fluids were ensured to be well distributed vertically.
(6)
A pattern of balanced injection and withdrawals was preserved.
As a result, oil production reached a stable plateau in 1985 and maintained high-level performance until recent years (Figure 8).

5.1.3. Summary

Reservoir management strategies were implemented within one year of discovery and turned more and more sophisticated as operations transitioned from primary to secondary and tertiary. Key elements of reservoir management included detailed reservoir description, infill drilling with pattern modification, and continuous reservoir surveillance. The success of the MSAU demonstrated the importance of reservoir management during waterflooding and CO2 flooding. The operating philosophy, developed collaboratively by personnel from engineering, geology, and operations and subsequently presented to management, demonstrated the effectiveness of reservoir management strategies. Furthermore, this approach facilitated the identification and evaluation of new opportunities and technologies.

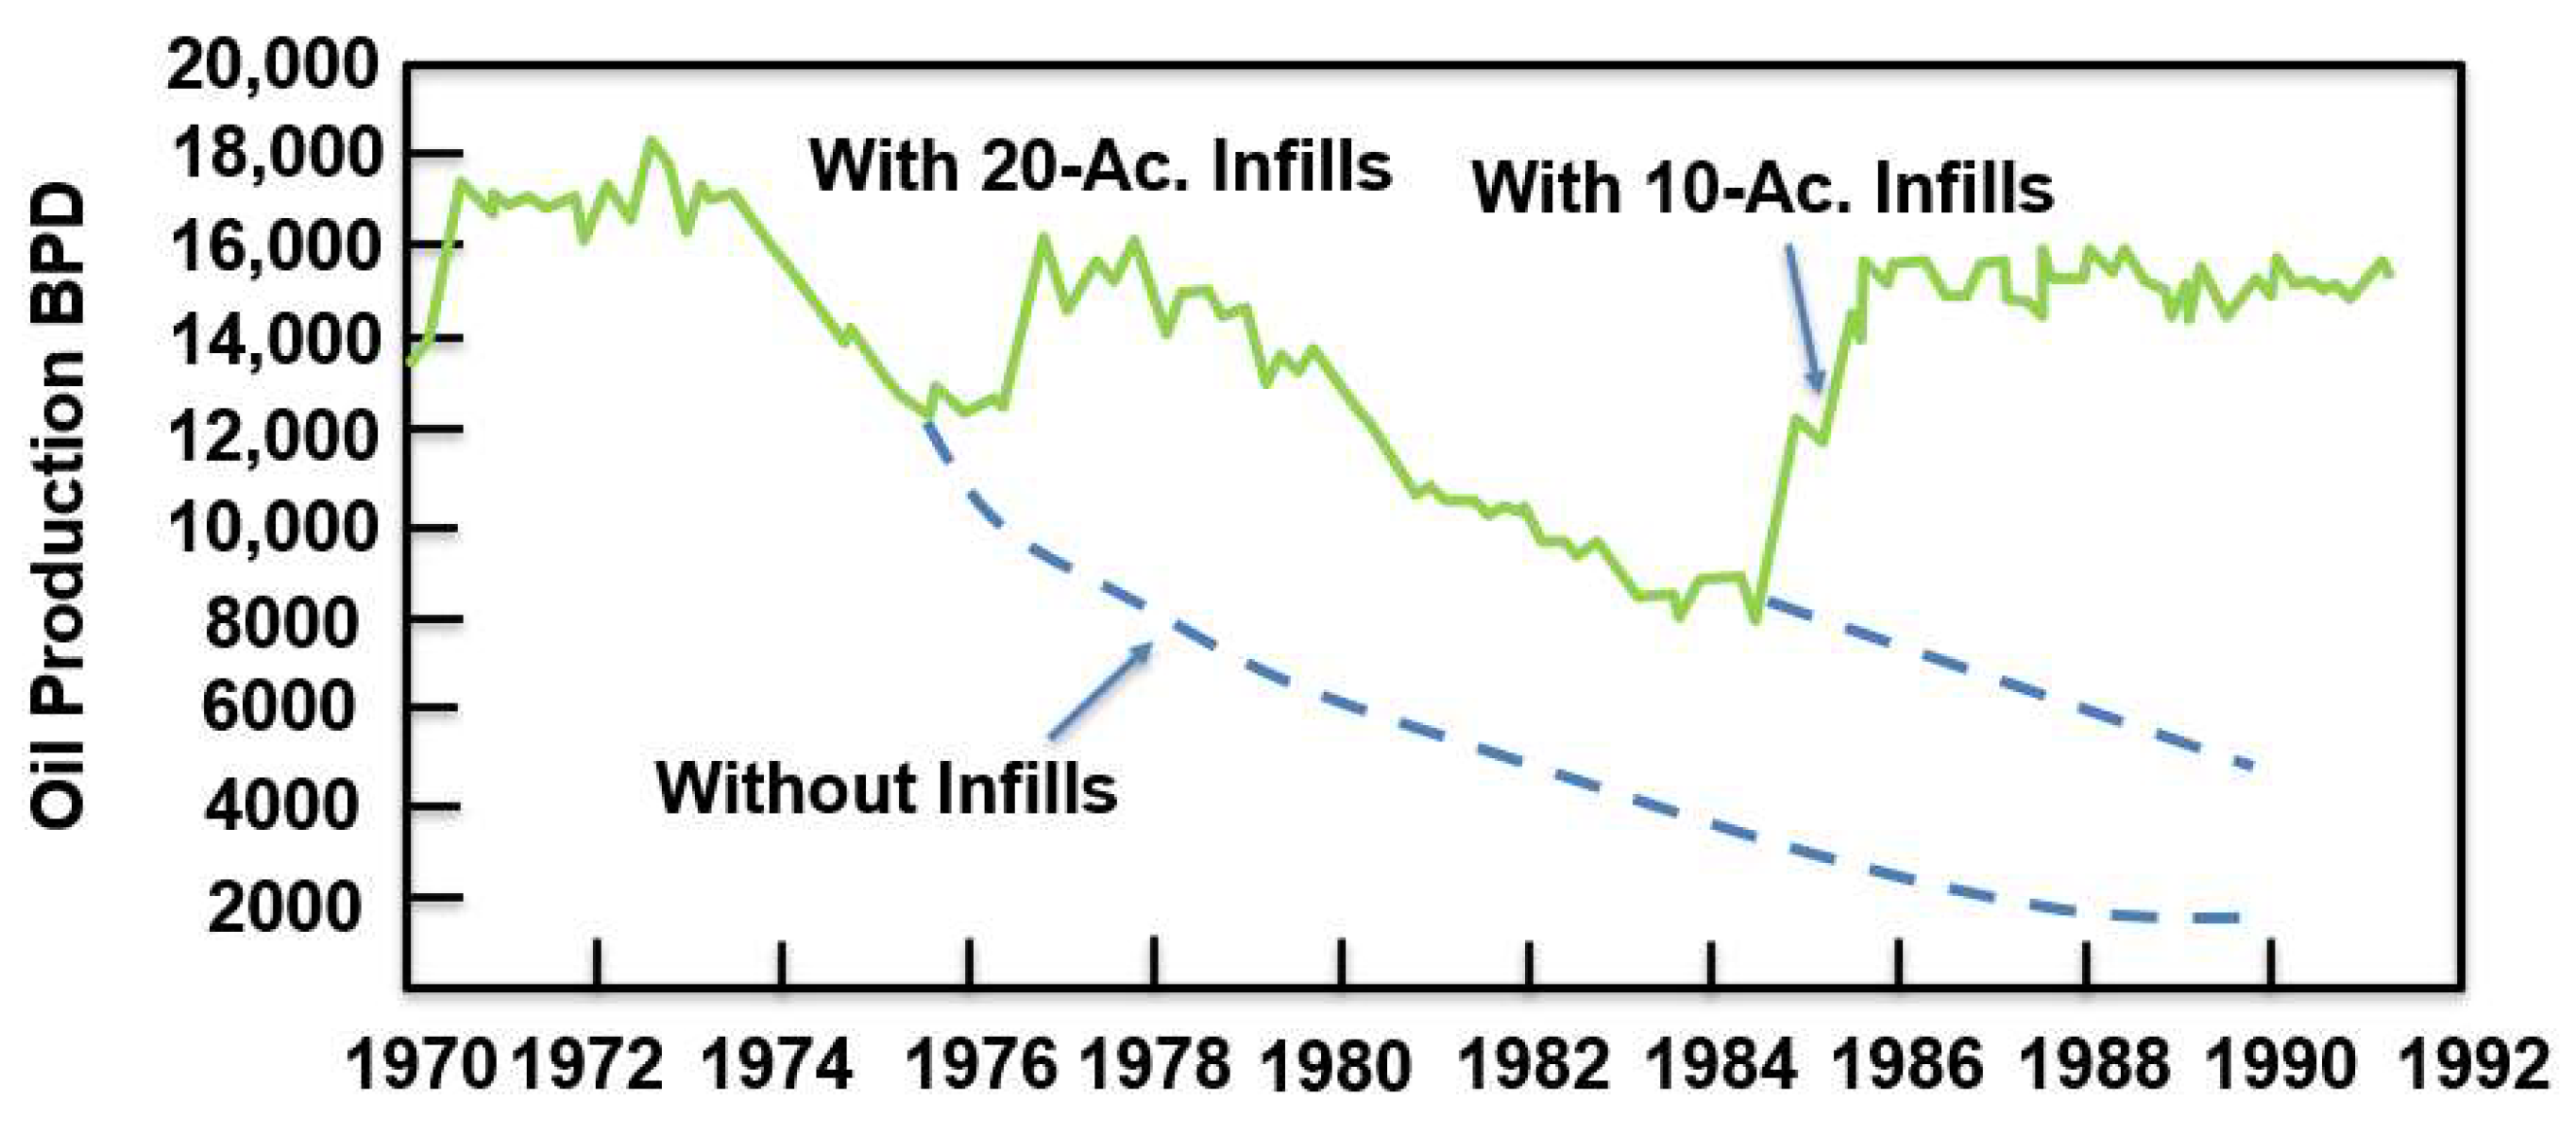
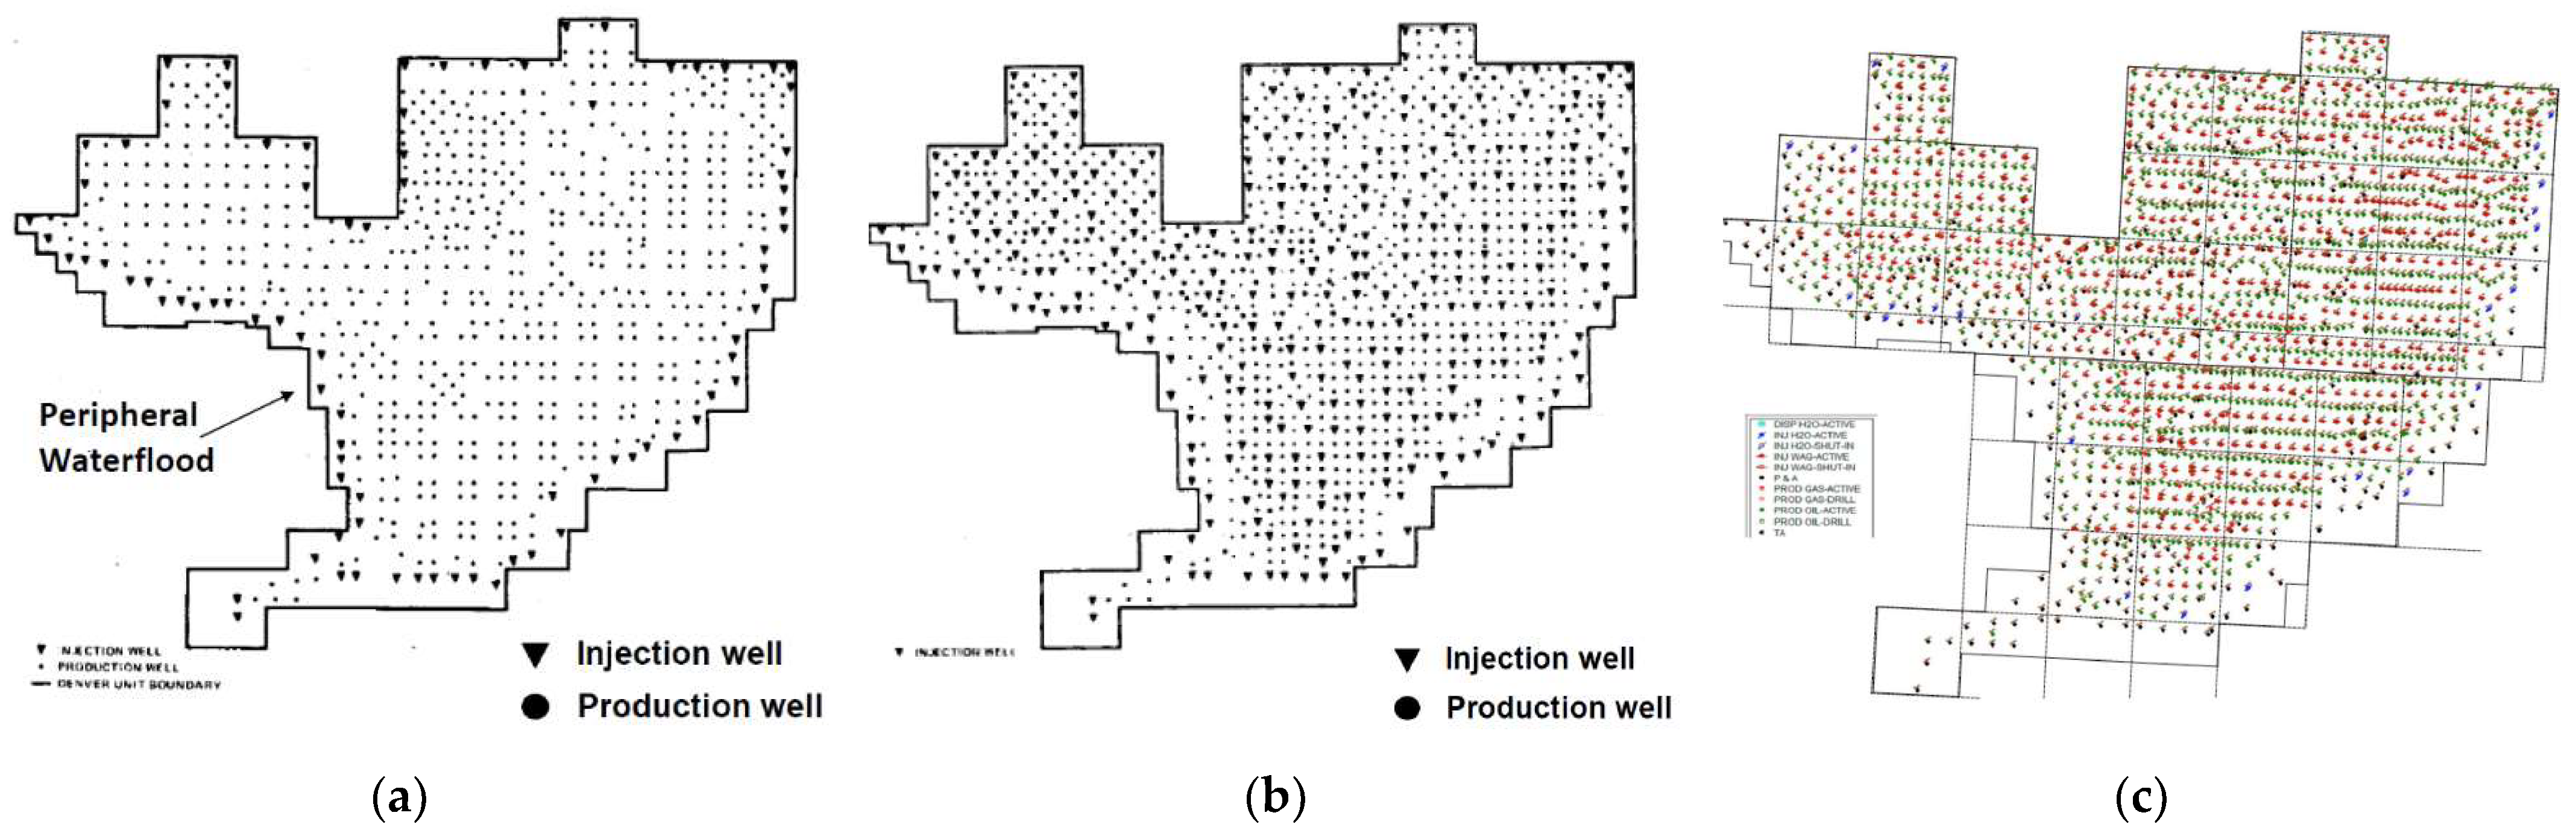
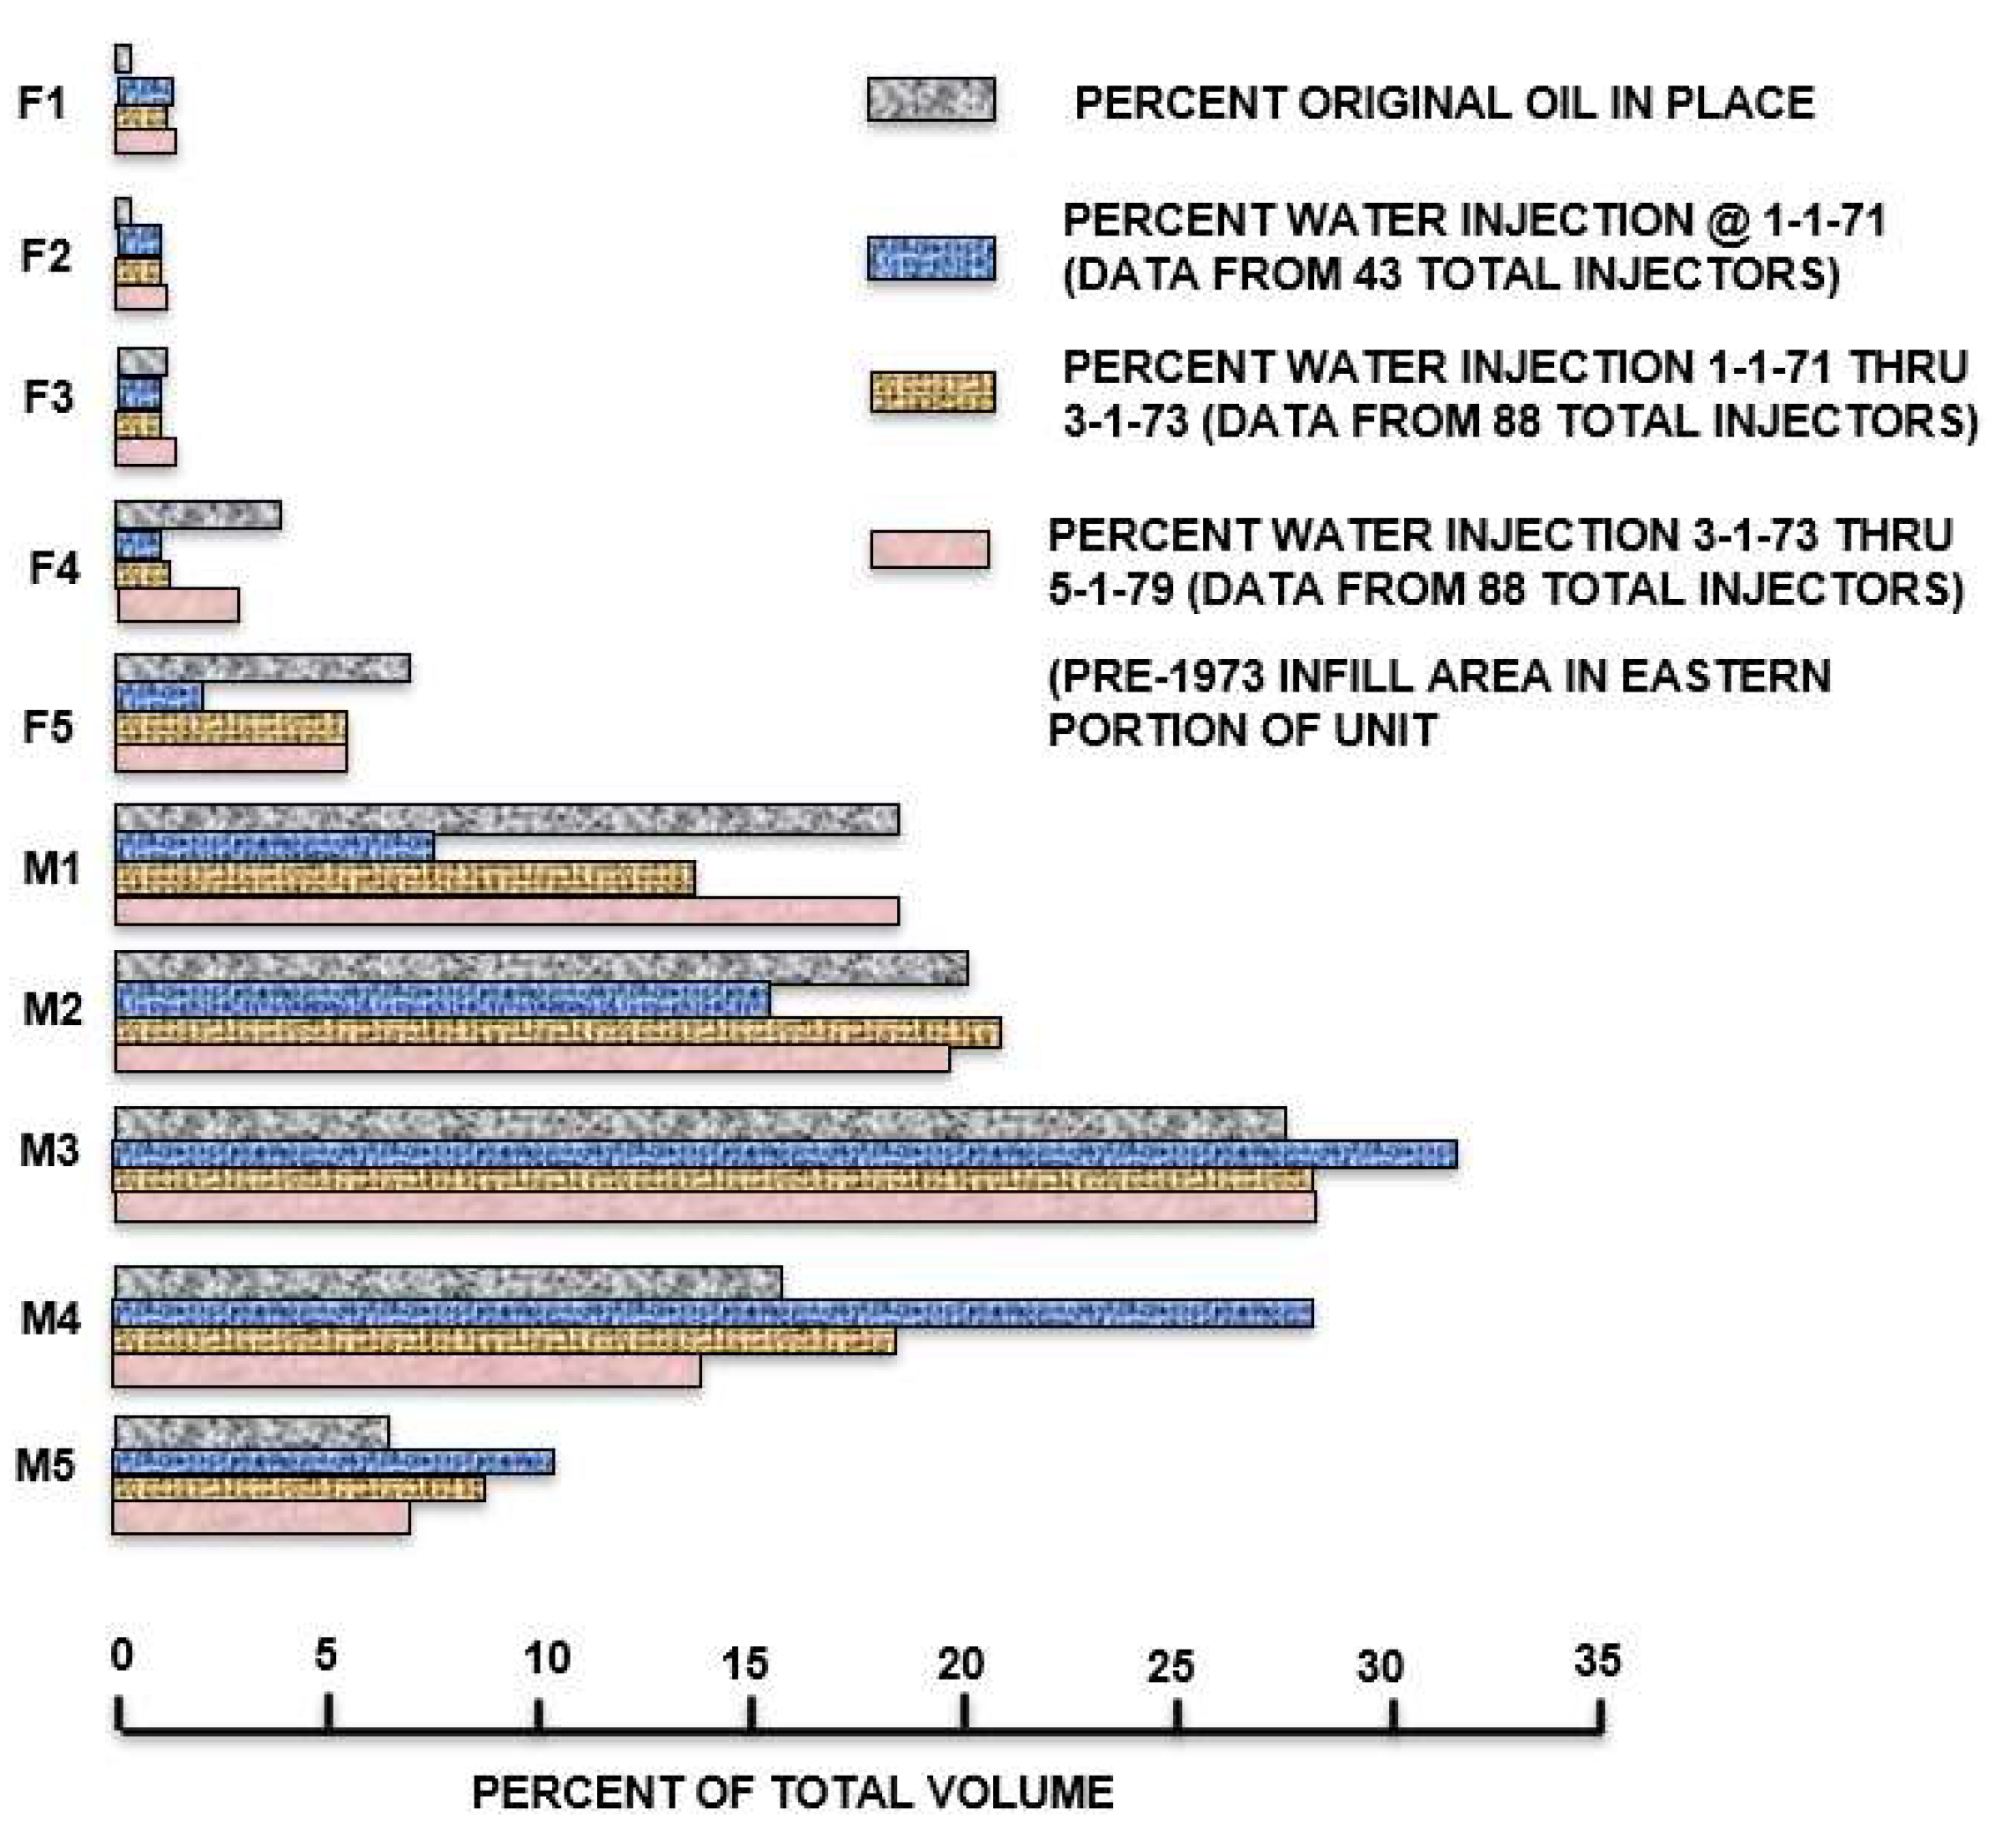
5.2. Denver Unit—Wasson San Andres Field—Case 2

Wasson San Andres Field is a classic example of a carbonate reservoir located on a regressive carbonate shelf platform. Discovered in 1936 with the OOIP over 2 billion barrels and more still under production, it is one of the largest oil fields in North America.

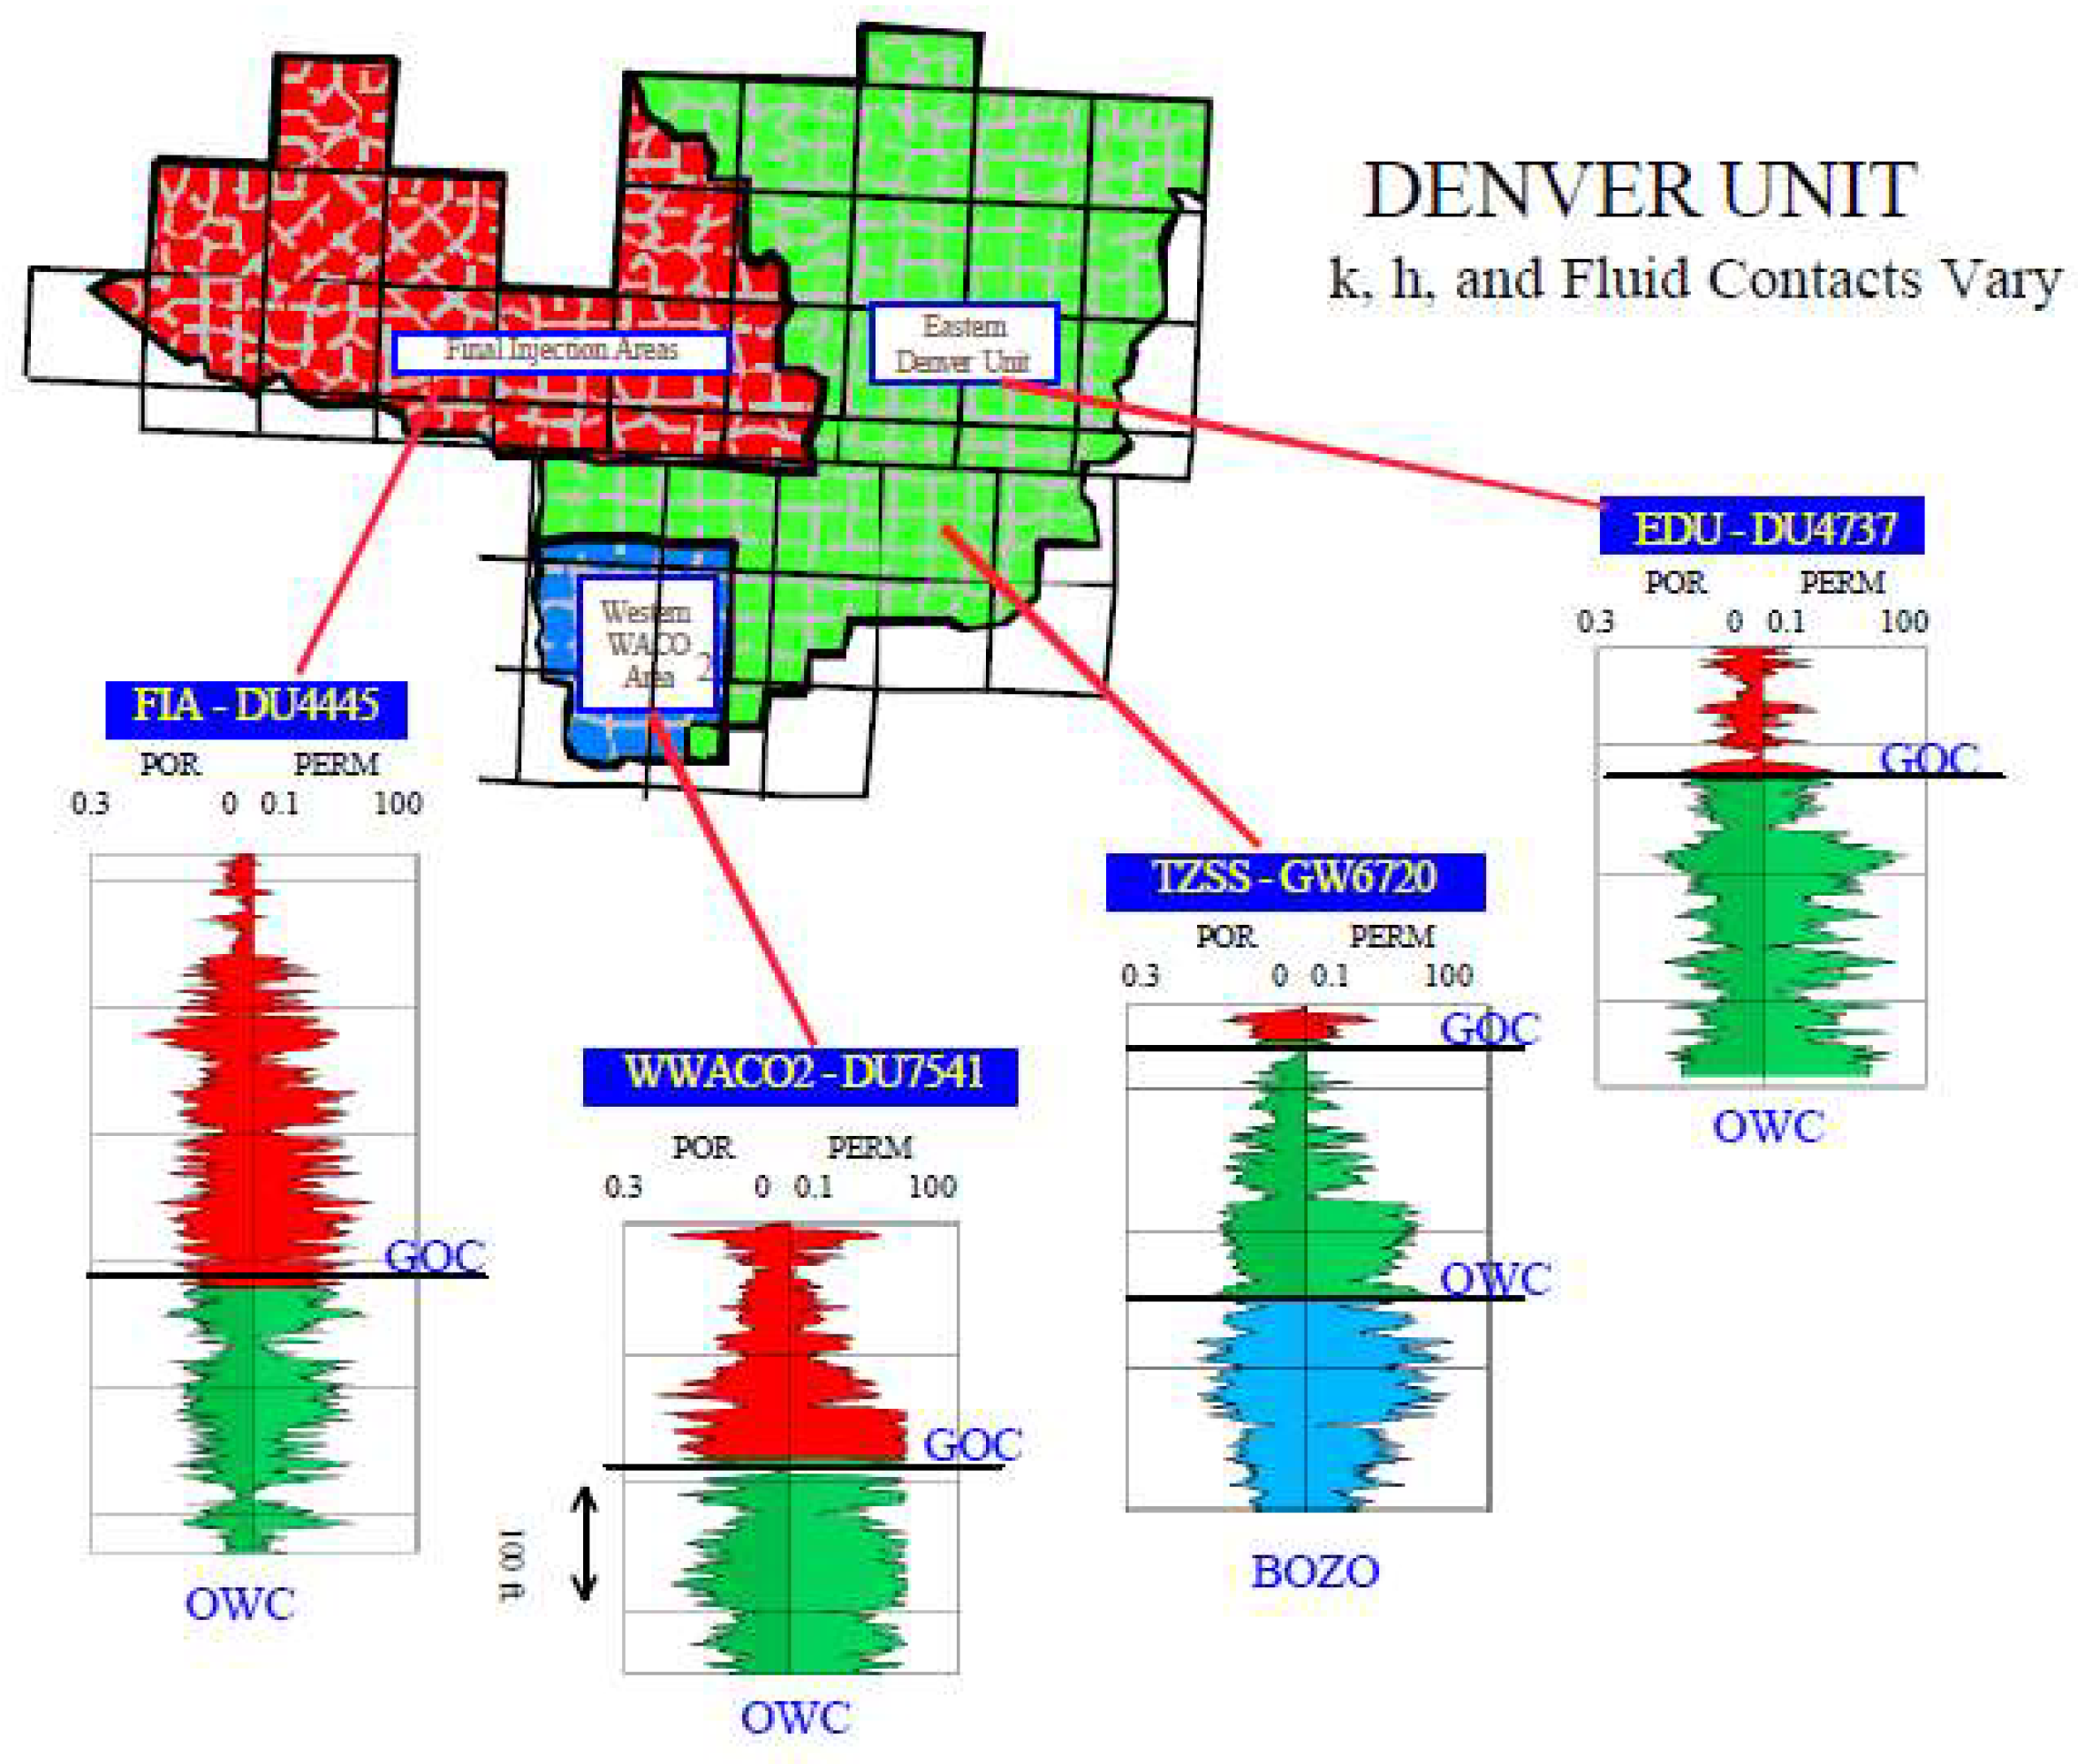
5.2.1. Reservoir Description

The Wasson San Andres Field Denver Unit is located on the southeastern edge of the North Basin Platform of the Permian Basin in West Texas (Figure 9). The field produces oil from the San Andres carbonated formation at a depth of around 5000 ft. The San Andreas formation is a layer of permeable dolomites that were deposited in a shallow marine environment during the Permian Period. The formation has a thickness varying from 300 to 500 ft, and solution gas drive was the primary producing mechanism. The reservoir and fluid properties are listed in Table 2.
The San Andres Formation has been stratigraphically divided into two major intervals known as “First Porosity” and “Main Pay”. The First Porosity interval, characterized by poor-quality reservoir rock, was deposited in shallower water, and restricted marine and intertidal environments. It features a finer crystalline matrix and is less continuous compared to the “Main Pay”. The Main Pay, the lower interval of two intervals, comprises dolomitized open-marine packstones and wackstones, and exhibits superior quality rock than the “First Porosity” interval. In the Denver Unit, Main Pay subtidal pelletal packstones have a porosity of 15% to 20% and a permeability of 10 to 50 md, whereas the Main Pay moldic wackestones possess a porosity of up to 10% but a permeability less than 1 md [15].

5.2.2. Field History

Figure 10 presents the overview of the field history of the Denver Unit. Primary depletion drive production started in 1936 with single-well production rates in excess of 1500 barrels of oil [16]. By the mid-1940s, the field was largely developed at a 40-acre well spacing. Waterflooding was started with peripheral injection in 1964, as shown in Figure 11a. The formation layers were thought to be continuous both vertically and laterally (Figure 12a). Thus, water was injected right below oil–water contact, and it was believed that the injected water would displace oil successfully. However, the reservoir actually had poor connectivity, and the low transmissibility of layers (Figure 12b) caused the waterflood to perform worse than anticipated. The infill wells with a 20-acre spacing and an inverted nine-spot pattern with one injection well for every three production wells were developed to help make some of the discontinuous pay behave like continuous pay. Consequently, in 1979, a waterflood pattern was initiated (Figure 11b). Figure 13 displays the production profile of the waterflood. The decreasing GOR, increasing water injection rate, and improving reservoir voidage and oil production rate clearly indicate the successful performance of the waterflood.
In 1983, as the waterflood was maturing, a tertiary enhanced oil recovery project with CO2 was initiated. Based on reservoir development and different geological characteristics, the Denver Unit was divided into three areas: (a) Eastern Denver Unit, (b) WACO2, and (c) final injection area. Figure 14 illustrates the delineated areas and the typical porosity and permeability development in each subgroup. CO2 flooding in these areas is implemented based on the reservoir characteristics. The Eastern Denver Unit began CO2 injection in 1984, received an CO2 slug of an initially large size, then was converted into a WAG injection scheme once a targeted CO2 slug size was reached. The WACO2 area also began CO2 injection in 1984. However, this area injected WAG right from the beginning. Once the Eastern Denver Unit area began its alternating injection scheme, the freed-up CO2 was used to expand the flood into the final injection area.
The success of the waterflood in Denver Unit Field led to its success in the CO2 flood. It is the largest CO2 EOR project in the United States and is currently operated by OXY (Occidental Petroleum). Figure 15 exhibits the production performance up to 2010. As of August 2014, there have been approximately 1734 active wells, as indicated in Figure 11c; roughly two-thirds of these wells are producing wells and the remaining third are injection wells. In addition, there are 448 inactive wells, bringing the total number of wells to 2182 [17].
Implementation methods also include production technology practices [14], such as cased-hole completion, fiberglass liner installation, injection profile control, computer production control, etc.:
(1)
Open-Hole vs. Cased-Hole Completions
In 1964, when water injection started, there were around 700 active wells and more than 90% were completed barefoot or open-hole. After carefully examining the geologic and reservoir concepts, all new infill producers and injectors were cased through the productive zone and have been perforated selectively in correlative pay members.
(2)
Fiberglass vs. Steel Liner Installations in Injectors
The injection water in the Denver Unit project is either freshwater (200 ppm chlorides and 8 ppm oxygen) or produced San Andres water with formation water salinities ranging from 30,000 to 120,000 ppm of chlorides. Due to the corrosive nature of the injected water, steel liners were replaced by fiberglass pipe. This change has controlled formation fill, has provided injection profile control, and has been an insurance against tubular corrosion.
(3)
Injection Profile Control
Vertical sweep efficiency has been significantly improved in both existing production wells converted into injectors and new wells drilled as injectors. The key to success appears to be proper profile control in the immediate vicinity of the wellbore. The percentage of the total water volume being injected into each pay zone was found to be more nearly proportional to the oil in place contained in the individual pay members than had been the case previously. Figure 16 illustrates this improvement in profile conformance. It is evident that the vertical sweep efficiency has been enhanced greatly by the improved completion and operating practices. The vertical sweep efficiency for the Denver Unit project has increased to approximately 90%.
(4)
Computer Production Control
This technique was employed to improve well surveillance and operation efficiencies based on the data from wells. It can help to check for abnormal load conditions and either shut the well down or alert the operator.
(5)
Well Completion and Well Stimulation
(6)
Artificial Lift.
(7)
Remedial and Reconditioning (R&R) Activity.

5.2.3. Summary

The success of the Denver Unit, whether with waterflooding or CO2 flooding, is a combination of multiple efforts. In association with an improved geologic understanding of pay continuity, detailed reservoir engineering work was carried out with the help of mathematical modeling and reservoir simulation.

5.3. Offshore Case Study

The success of Lula Field was achieved through a robust reservoir-oriented strategy to minimize risks and maximize value during fast-track development. The strategy used in the development of Lula Field, which aims at attaining a recoverable oil volume of billions of barrels, is described in this section.

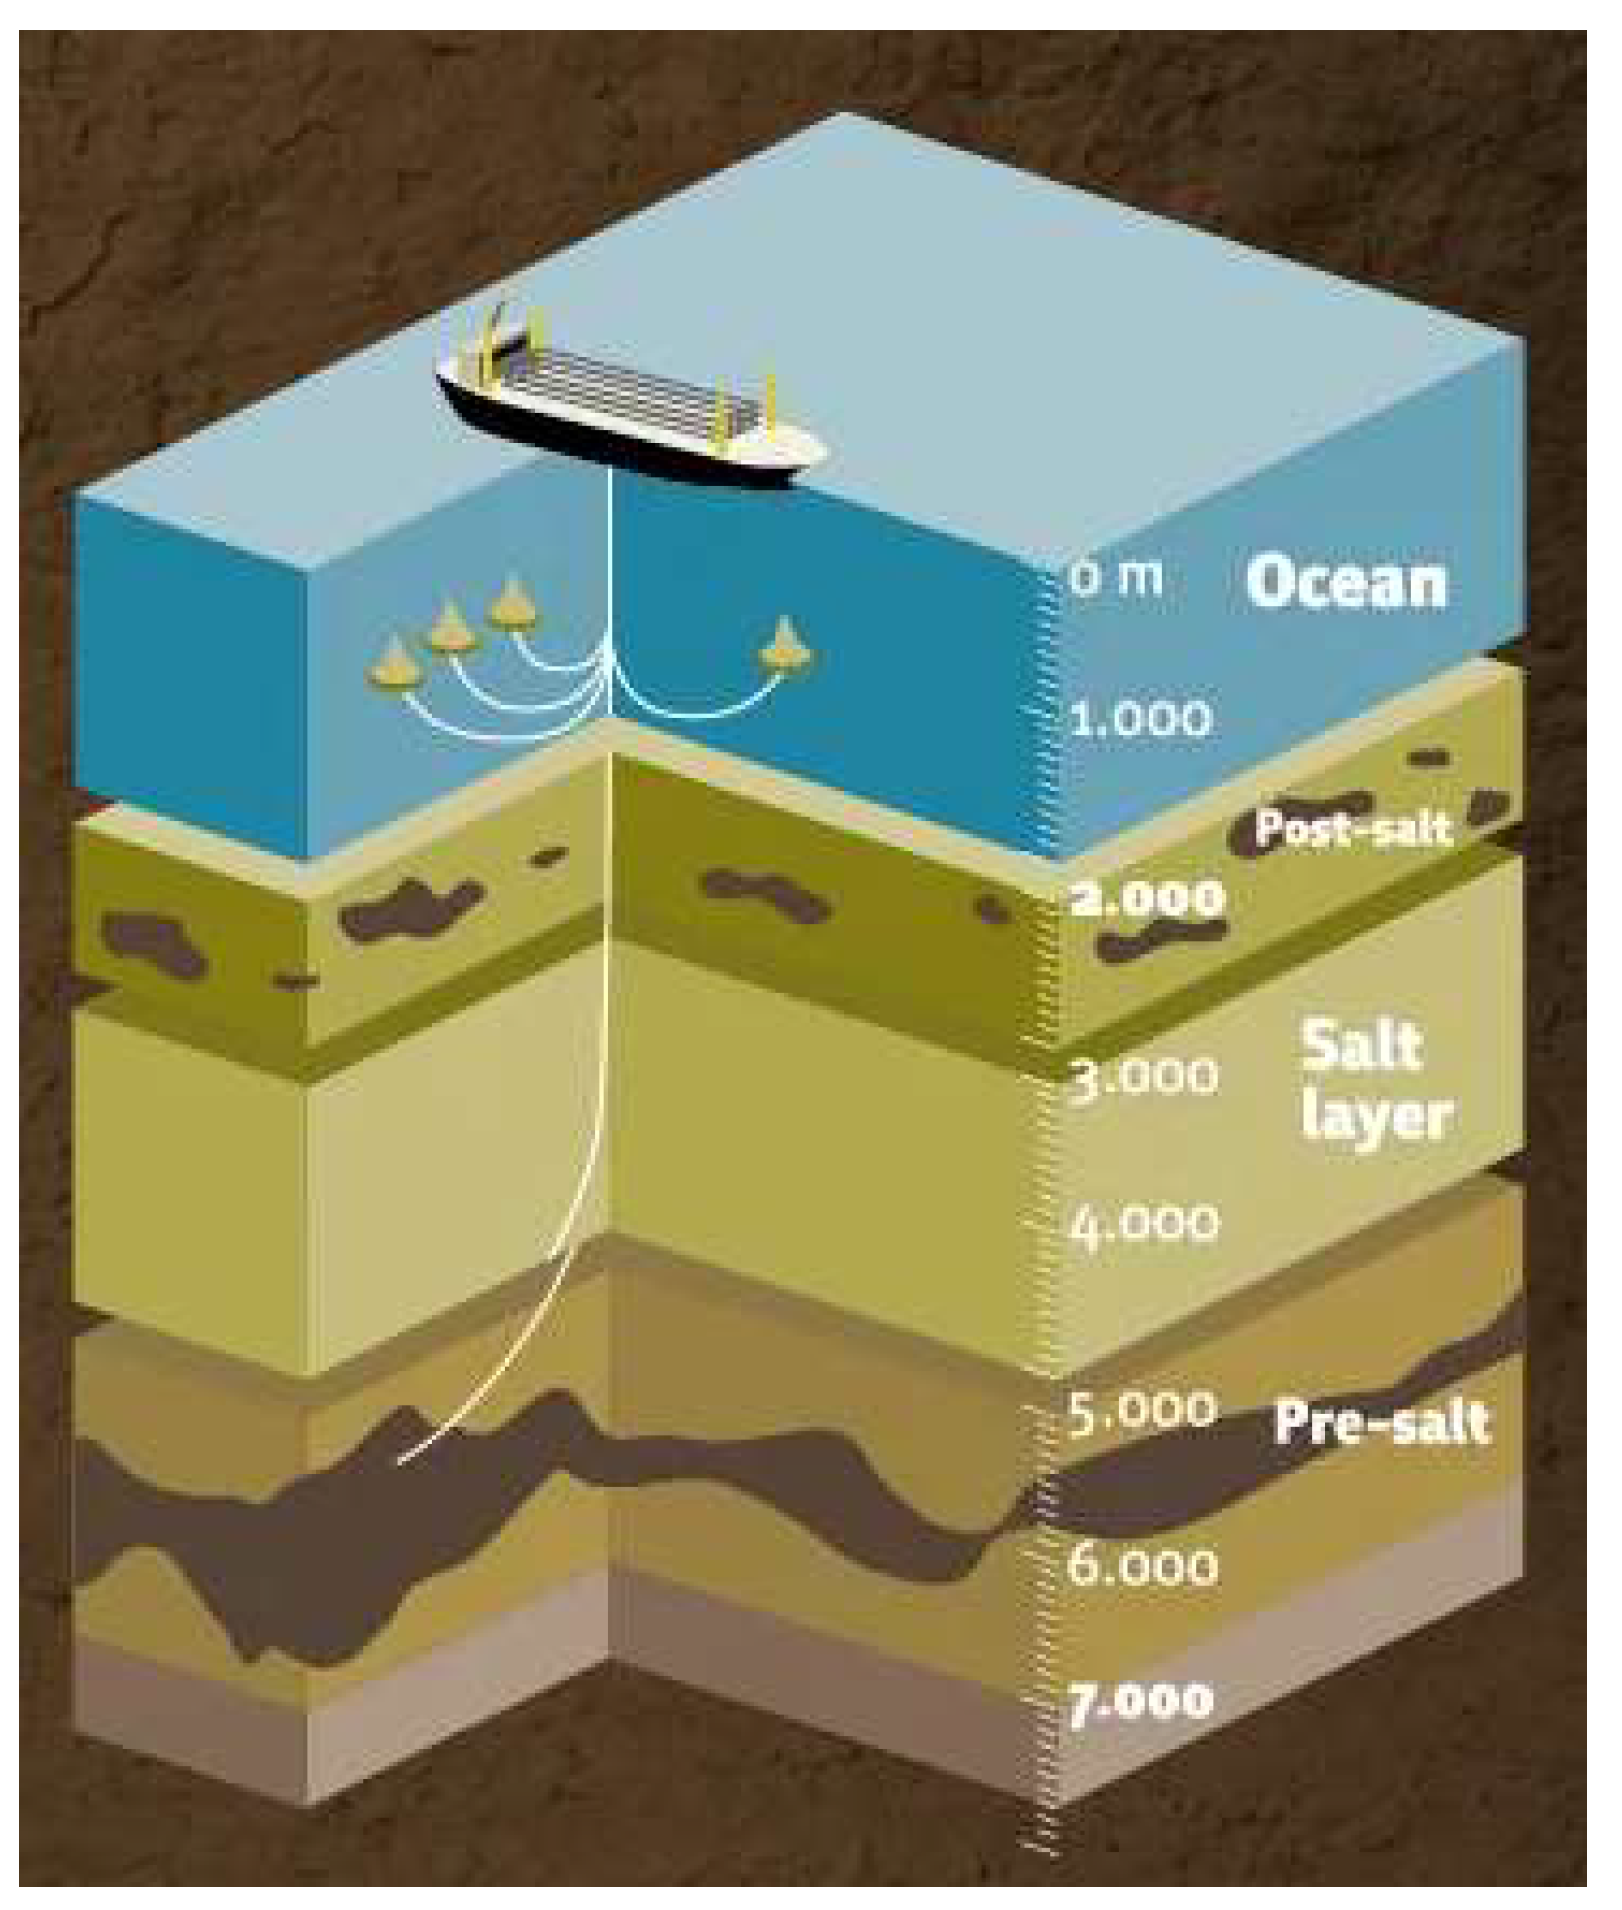
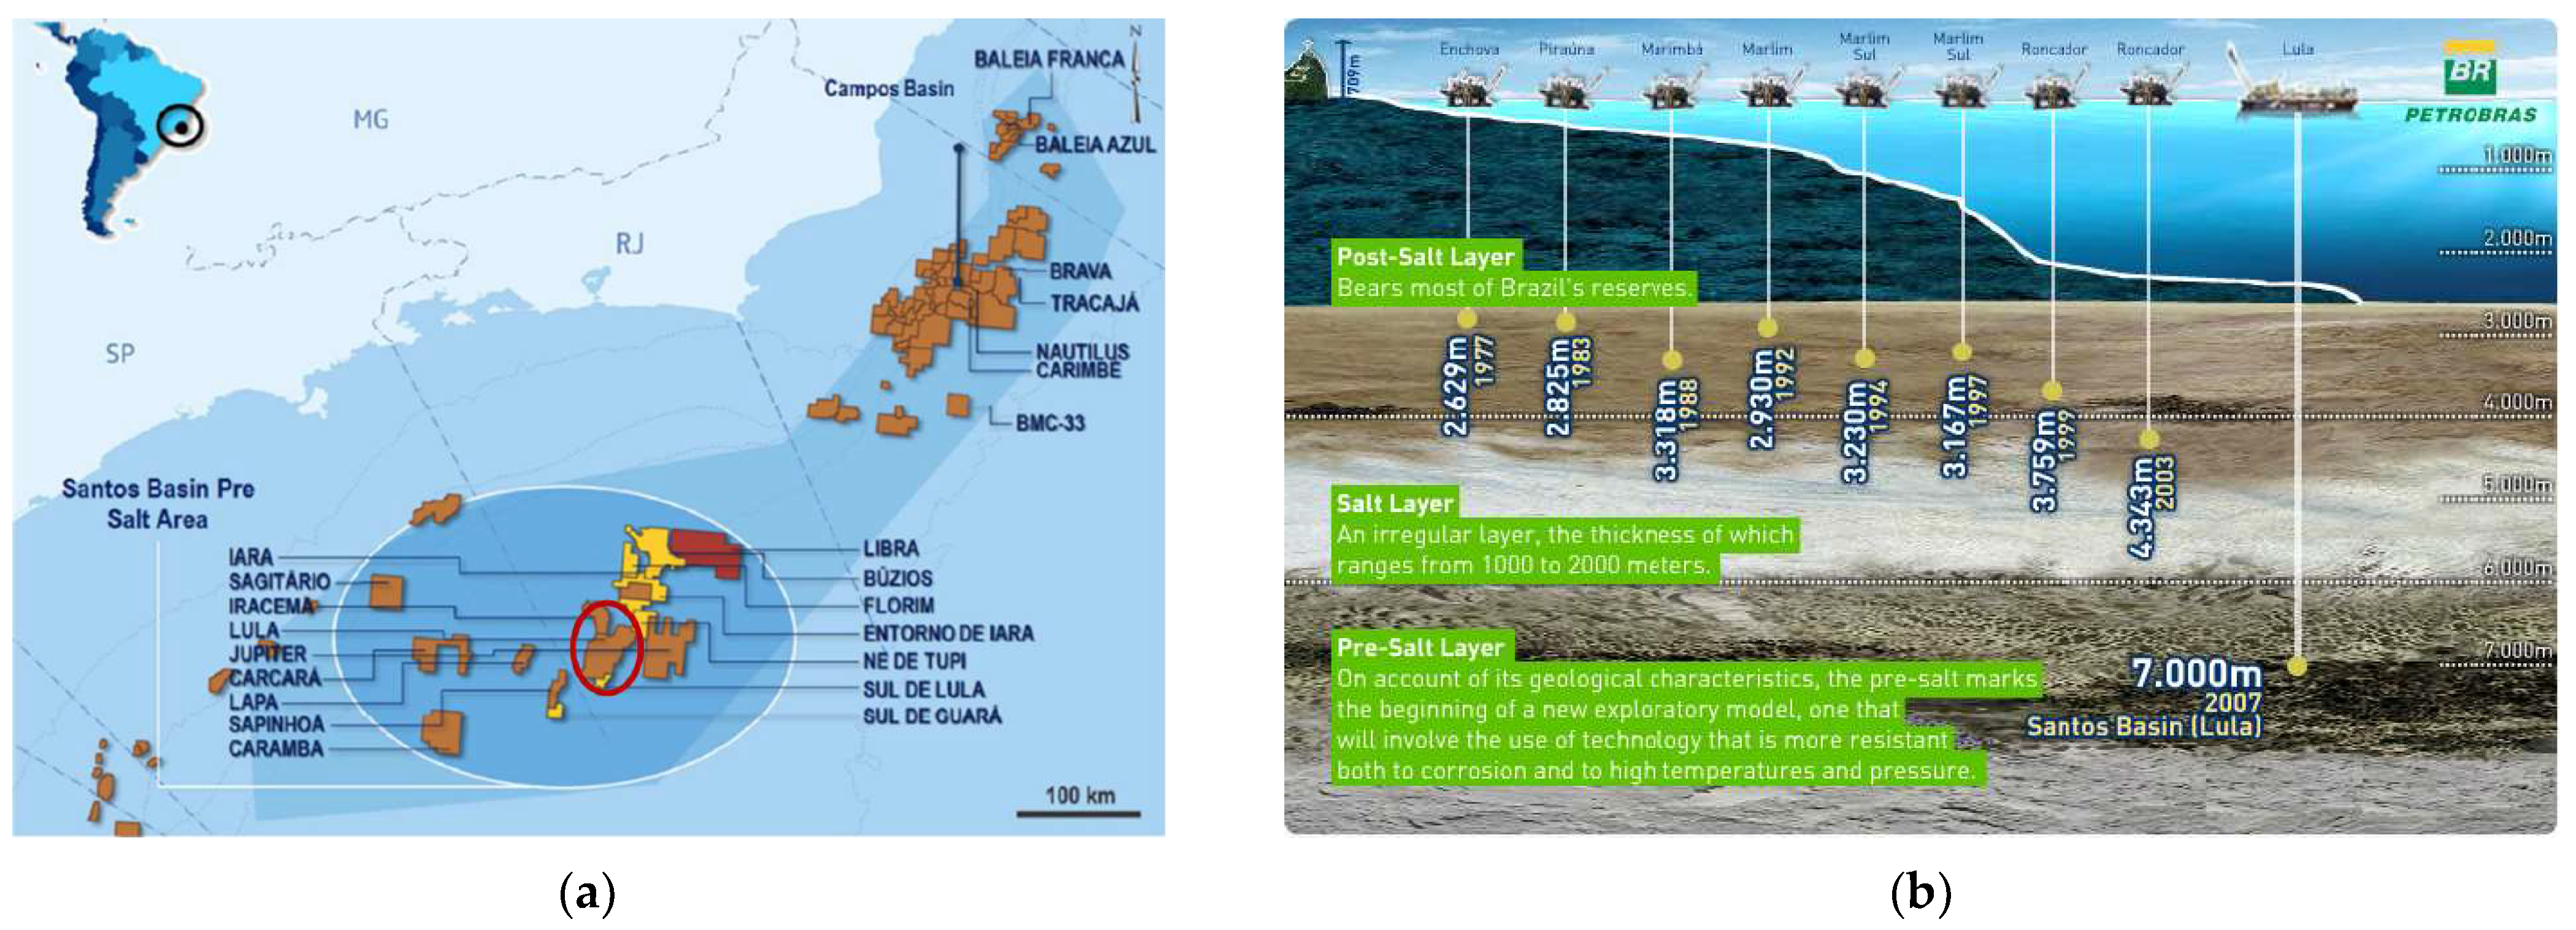
5.3.1. Pre-Salt Introduction
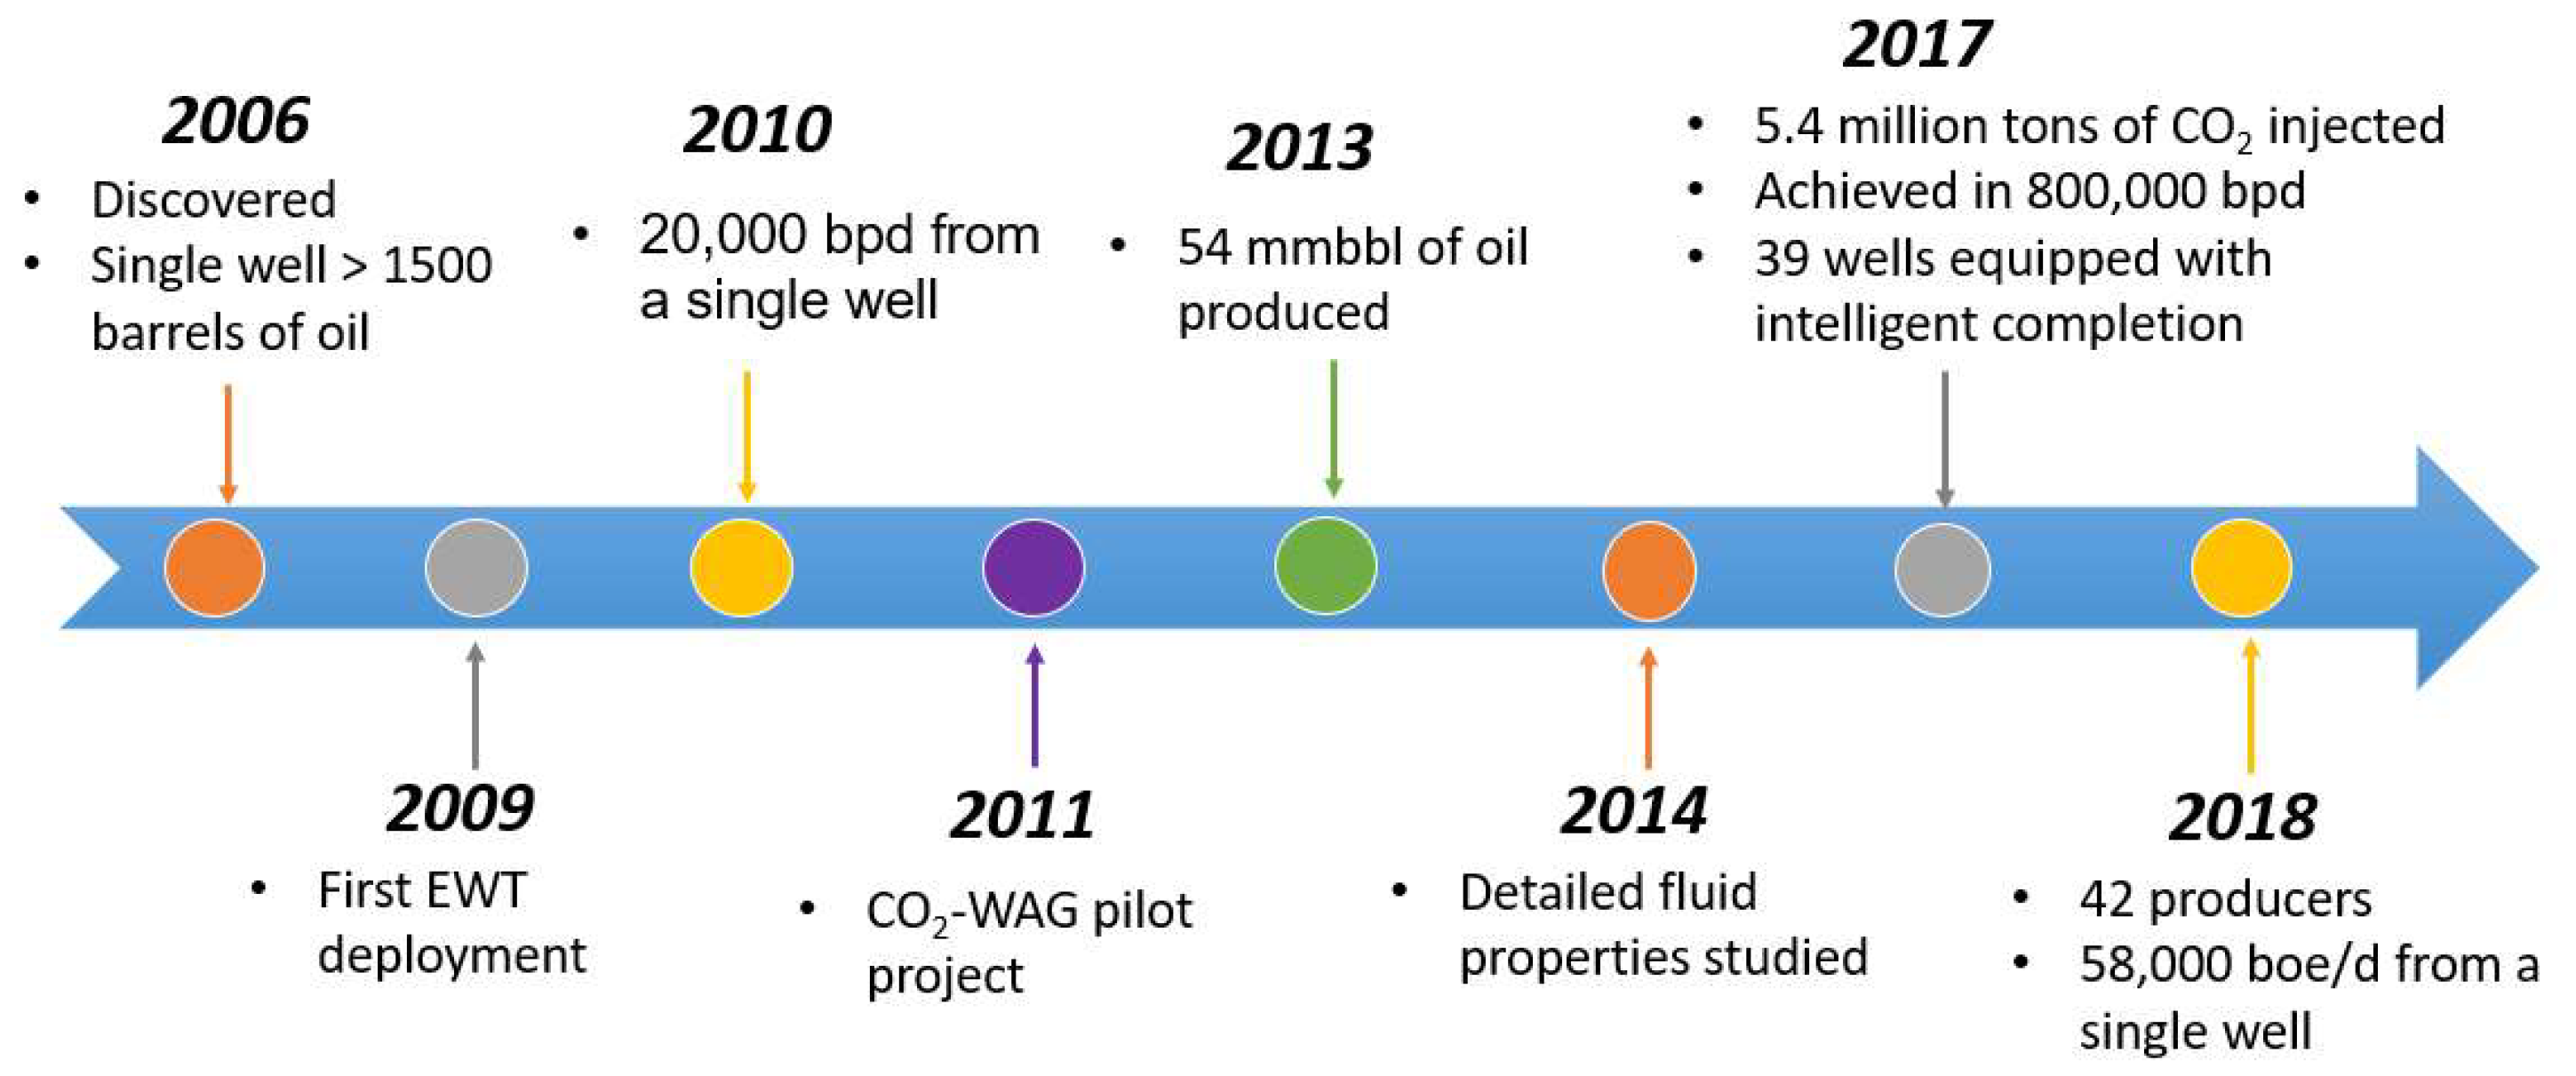
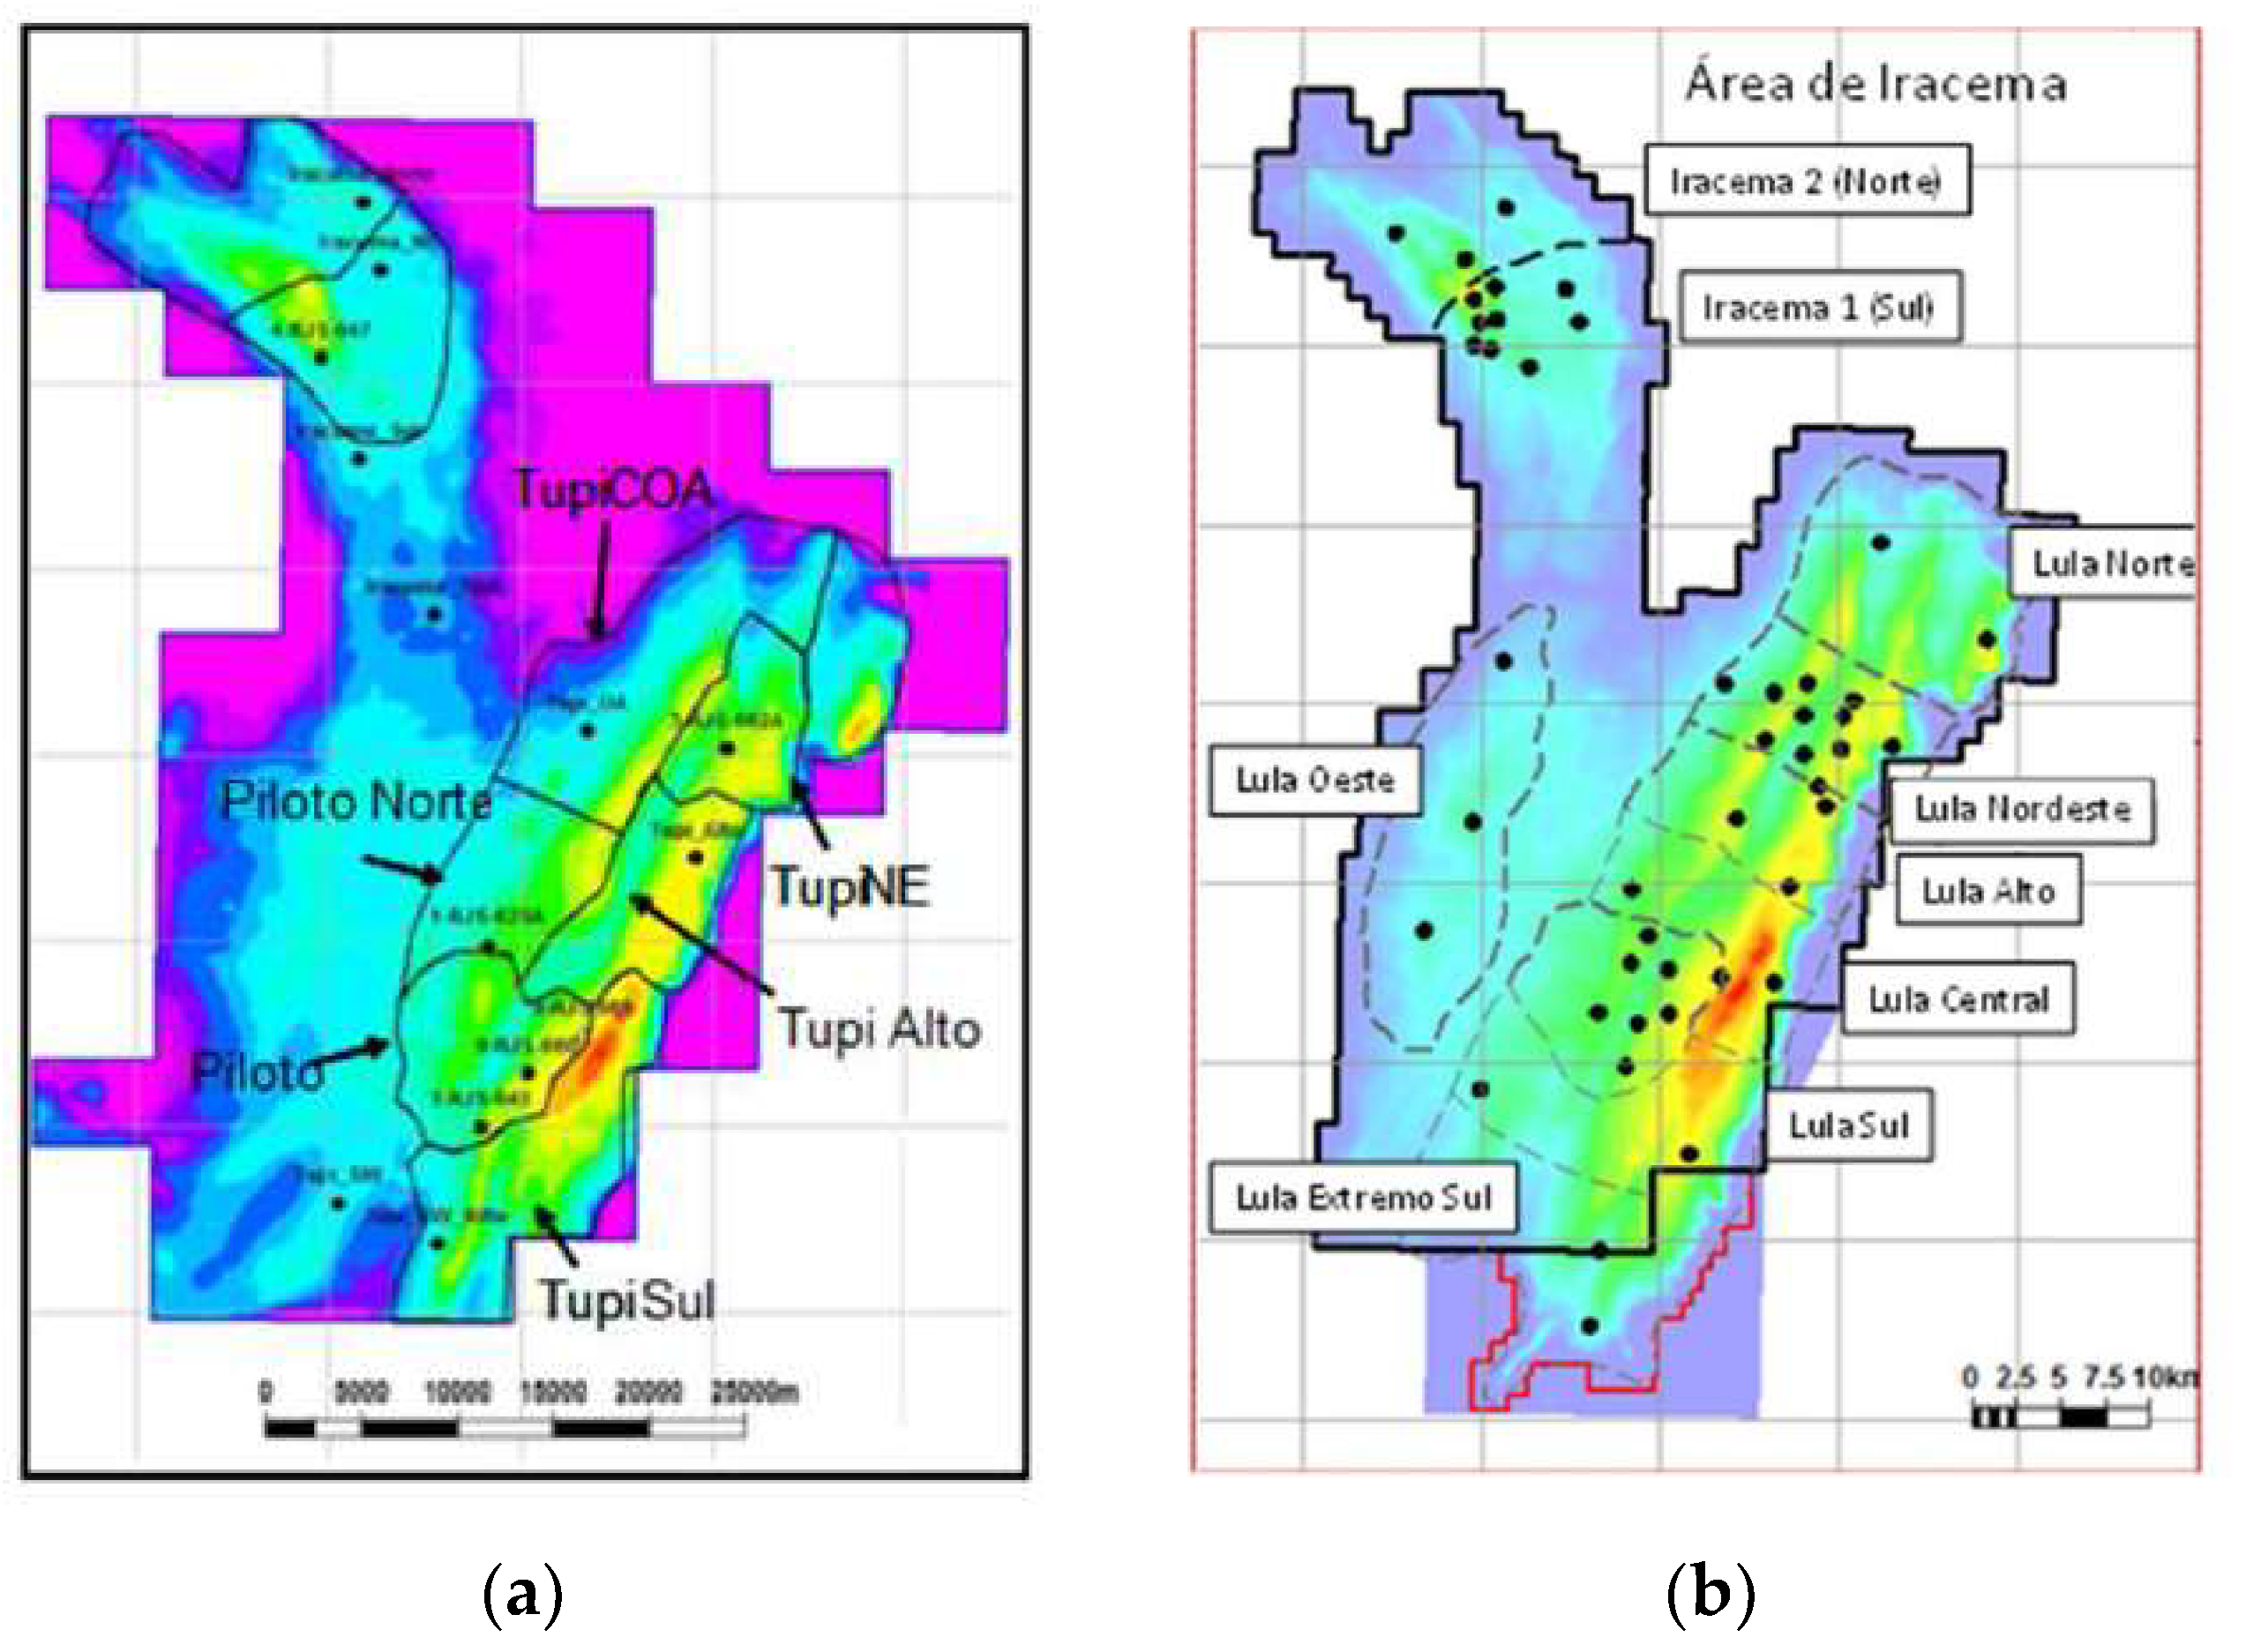
Pre-salt refers to a geological formation located beneath layers of salt deep beneath the ocean floor. It consists of sedimentary rocks that were formed more than 100 million years ago with the separation of the current South American and African continents. With this separation, large depressions emerged that gave rise to several lakes, which were later connected to the oceans. In the deeper regions of these lakes, large amounts of organic matter from microscopic algae began to accumulate. This organic matter, mixed with sediments, formed the rocks that generate the oil and gas of the pre-salt. In the shallowest part of these lakes, on large lake islands, the so-called calcareous shells appeared, which increasingly accumulated over time. Later on, these shells ‘gained the company’ of stromatolite deposits, which are nothing more than types of algae that form limestone rocks. Both limestone shells and limestone rocks gave rise to the main reservoirs of the pre-salt layer. Due to the arid climate at that time, the intense evaporation of seawater caused the accumulation of salts, which created the pre-salt layer, a kind of protection that prevented the oil from ‘escaping’ and reaching the surface. The total depth of the pre-salt layer exceeds 7000 m (Figure 17). The pre-salt oil quality is very high, as is the water pressure.
The pre-salt fields can suffer various challenges in terms of location—ultra-deep water and a far distance to shore—as well as reservoir and fluid characteristics. The major challenges for pre-salt can be summarized as follows [20]: (1) it is located in depths of 5000 to 7000 m and at a distance to shore of around 300 km in an area without previous infrastructure; (2) it is in an exploratory area spreading over 149,000 km2; (3) it has an up to 2000 m thick salt layer overlay above the reservoirs, introducing difficulties in drilling and seismic illumination; (4) reservoir rock is highly heterogeneous due to its natural structure and later diagenesis; (5) the existence of vertical barriers, sealing faults and various facies may create reservoir connectivity constraints; (6) relatively low temperatures cause flow assurance constraints for waxy oil flowing through the subsea.
This unique combination of technical and logistical challenges created the opportunity for the development of new solutions and technologies. Comprehensive waterflood management is in high demand to deliver successful oil production.

5.3.2. Lula Field

Lula Field, formerly known as Tupi, is considered the first Brazilian supergiant field and operated by Petrobras at the moment. It is located in the Santos Basin pre-salt clusters (SBPSCs), 300 km off the Rio de Janeiro coast, southeast of Brazil (Figure 18a). The SBPSCs are located in ultra-deep waters between 1900 and 2400 m, while Lula Field is at a depth ranging from 5000 to 6500 m (Figure 18b).

5.3.3. Reservoir Description

The first drilled well in Lula Field, designated as the RJS-628A well (known as Tupi Lead), was completed in BM-S-11 in September 2006. This well was tested and produced oil with an API of 28° and a GOR of 240 m3/m3. The oil was sourced from a carbonate reservoir of microbial origin (microbialite reservoir), known as the SAG reservoir. This reservoir is located just below a thick salt column measuring approximately 2000 m. The initial pressure was recorded at 560 kgf/cm2 at 4895 m TVDSS (true vertical depth subsea). The oil exhibits low acidity and contains 8 to 12% (molar fractions) of CO2 in the dissolved gas [23].
The reservoir is a heterogeneous carbonate, deposited in a stressing lacustrine environment. The Barra Velha Formation (Aptian) is the main reservoir zone, and the reservoir facies can be grouped into carbonates with shrub-like textures, reworked carbonates, and low-energy carbonates. Locally, vugs and fractures can also occur [24]. The properties of Lula Field are listed in Table 3.

5.3.4. Field History

Discovered in 2006 and beginning to produce oil commercially in 2010, the Lula Field has the world’s largest oil production in ultra-deep waters. Figure 19 briefly describes the history of the Lula Field.
Petrobras has devoted much effort to fluid studies, especially PVT properties over time. The initial development plan for Lula Field has changed over time to better assemble each FPSO well with low-GOR/CO2 together with higher-GOR/CO2 wells (Figure 20). A stable oil plateau has been maintained since September 2014, ascribed to the valuable fluid property studies. Lula Norte, Lula Nordeste, Lula Alto, Lula Central, Lula Sul, Lula Extremo Sul, Lula Piloto, Lula Oeste, Iracema Sul, and Iracema Norte are the ten modules located in Lula Field. Seven of these ten FPSOs are currently under production, named in chronological order as follows: FPSO Cidade Angra dos Reis (Lula Piloto), FPSO Cidade de Paraty (Lula Nordeste), FPSO Cidade de Mangaratiba (Iracema Sul), FPSO Cidade de Itaguaí (Iracema Norte), FPSO Cidade de Maricá (Lula Alto), FPSO Cidade de Saquarema (Lula Central), and FPSO P-66 (Lula Sul). The last FPSO is the first Petrobras-owned and operated platform to initiate production in Lula Field. With two sanctioned FPSOs still to be deployed, the Lula Field achieved a production oil rate of about 800,000 bpd in 2017 [24].
Lula Field has an advantage for CO2 injection as it has a relatively low temperature (60 to 70 ), high CO2 content (8 to 18 vol%), and high original reservoir pressure (around 8000 psi). Furthermore, transporting the gas to shore for processing was not feasible due to regulatory and equipment constraints. As a result, a CO2-WAG pilot project was initiated at the initial production stage to reduce the CO2 emissions due to environmental and logistical reasons in April 2011, with three producers, one gas injector, and two WAG injectors [22], as shown in Figure 21, and the production and injection performance is exhibited in Figure 22.
Up to 2018, Lula Field has 42 oil-producing wells, and the single well produces 58,000 boe/d with the application of CO2-WAG. Figure 23 shows the production of the first oil and gas.
The success of Lula Field illustrates the importance of a robust reservoir management strategy. It includes four steps [24]:
(1)
Perform sufficient data acquisition during exploratory and early development phases;
(2)
Implement pilot projects to collect important dynamic information and anticipate profits with previously obtained data;
(3)
Deploy definitive production systems based on robust drainage strategies and build under different reservoir scenarios;
(4)
Conduct production management through the application of innovative technologies in ultra-deep offshore environments, e.g., WAG and 4D seismic monitoring, and use intelligent completions.
The following reservoir management strategies are taken [27]:
(1)
Digital monitoring and data integration:
The extensive use of permanent downhole monitoring, well tests, tracers, etc., of all producers and injectors helps track the performance and characterize reservoir dynamics and heterogeneities.
(2)
Water and gas production controlled via WAG injection:
Instead of venting CO2 into formation, which would come with unwanted fluids, WAG injection proves to be effective in preventing early breakthrough, and 5.4 million tons of CO2 were reinjected until May 2017.
(3)
Intelligent completion applications:
  • Using inflow control values to choke off high water/gas zones and maximize production.
  • Thirty-nine wells equipped with intelligent completion until April 2017.
(4)
Production management:
Optimizing the distribution of produced/injected fluids across wells/areas to balance depletion.
(5)
Convertible wells to accelerate production growth:
Some wells are designed to be convertible before drilling (almost no extra expenses to do that) to aid pressure maintenance with updated data analysis.
(6)
Dynamical appraisal from extended well tests (EWTs) without gas flaring:
The data obtained from EWT brought dynamic information on non-drained areas of the reservoir, where a new development project would be deployed later. Producing new wells on existing FPSOs to acquire data without flaring associated gas becomes possible.
(7)
Water injection design:
The position of injector wells is affected by the main field heterogeneities. It mitigates risks of short-circuiting the injected fluid towards the producing wells and improves sweep efficiency if designed properly. By proper design, we mean we should try our best to place the injection wells in alignment with higher directional permeability. Otherwise, the water breakthrough could be severe.
(8)
Optimization of well stimulation:
All pre-salt wells are acid-stimulated right after completion due to the carbonate reservoir heterogeneity. Using two-stage acid treatments and diverters greatly helps improve coverage.
(9)
Use of 4D seismicity:
Four-dimensional seismicity provides powerful support in characterizing reservoirs after a few years of production and water/gas injection. It helps monitor reservoir drainage and identify remaining oil zones.

5.3.5. Summary

The success of Lula Field shows the effectiveness of reservoir management in ultra-deep waters. Multiple strategies are adopted to guarantee the project’s success, including evaluating and planning in advance, deploying experienced multidisciplinary teams, employing intelligent techniques, integrating and preparing to act and decide promptly, etc., which consist of effective “project integration”. The combination of elements, such as subsea engineering, flow assurance, fluid processing, production facilities, well construction, geosciences, reservoir engineering, and evaluation practices, was the key to the good technical results achieved so far in the fields of the Santos basin pre-salt.

6. Key Lessons Learned Summary

In this study, we documented best practices from a variety of case studies, including their significant real impact on operations. We took advantage of the experience and novel concepts of the authors in performing the analysis of various case studies and in making recommendations to be applied to future projects, reducing or eliminating the potential for failures and reinforcing positive results as well as those of significant impact. The case studies and analysis presented in this paper highlight several key lessons learned, from successes and mistakes, for effective waterflood management in carbonate reservoirs:
(1)
Rigorous reservoir characterization is crucial, including understanding reservoir architecture, heterogeneities, fracture networks, fluid communication pathways, and rock–fluid interactions.
(2)
Integrated multidisciplinary teams involving geologists, reservoir engineers, production engineers, and field operators are essential for successful waterflood design, implementation, and optimization. Our industry often makes mistakes when this integrated approach is not followed in a rigorous manner.
(3)
Pattern configuration, well placement, and injection/production strategies should be tailored to the specific reservoir characteristics and continually optimized based on surveillance data. These strategies are not to be performed only once while preparing the initial FDP (field development plan), but to be followed as an “evergreen” process.
(4)
Comprehensive data acquisition, advanced analytics, numerical simulations, and frequent model updates are necessary for effective reservoir management and decision-making. In today’s world, the use of data analytics, machine learning, and AI (artificial intelligence) is invaluable.
(5)
Proactive monitoring, surveillance, and control actions are vital for addressing issues such as water channeling, early breakthrough, and sweep inefficiencies. There was a time when most of the efforts focused on reservoir performance. Today, we realize it is equally important to include wells, facilities, operating conditions, water quality, and environmental and regulatory conditions.
(6)
Innovative technologies like intelligent completions and 4D seismic monitoring can significantly improve waterflood performance in complex carbonate reservoirs. Other technologies, like LSWF (low-salinity waterflooding), infill drilling with and without horizontal wells, zonal injection improvement, injection pattern modification, injection below formation parting pressure, pressure maintenance, workovers for injection and production wells, continuous data collection, gas cap barrier water injection, heavy oil waterflooding, slim-tube dual completions, and satellite waterflooding for pilot and marginal field waterflooding, should also be considered, as they can have significant impact.

7. Conclusions

(1)
Integrated waterflood asset management, incorporating geological, engineering, and operational aspects, is necessary for maximizing economic value and optimizing oil recovery from carbonate reservoir;
(2)
The design, implementation, and surveillance of waterfloods in carbonate reservoirs should be approached from a holistic perspective, considering the unique challenges posed by the complex pore systems, fracture networks, and heterogeneities present in these reservoirs;
(3)
Case studies from the Permian Basin and pre-salt Lula Field demonstrate the importance of detailed reservoir characterization, multidisciplinary team collaboration, advanced monitoring techniques, and continuous optimization to achieve successful waterflood performance in carbonate reservoirs;
(4)
The lessons learned from these case studies provide valuable insights into identifying and mitigating factors that can lead to waterflood failures, enabling more effective waterflood management strategies for future projects in carbonate reservoirs.

Author Contributions

Formal analysis, X.D.; Supervision, G.C.T. All authors have read and agreed to the published version of the manuscript.

Funding

This research received no external funding.

Data Availability Statement

The original contributions presented in the study are included in the article, further inquiries can be directed to the corresponding author.

Conflicts of Interest

The authors declare no conflict of interest.

Appendix A. Agbami Oilfield

Appendix A.1. Reservoir Description
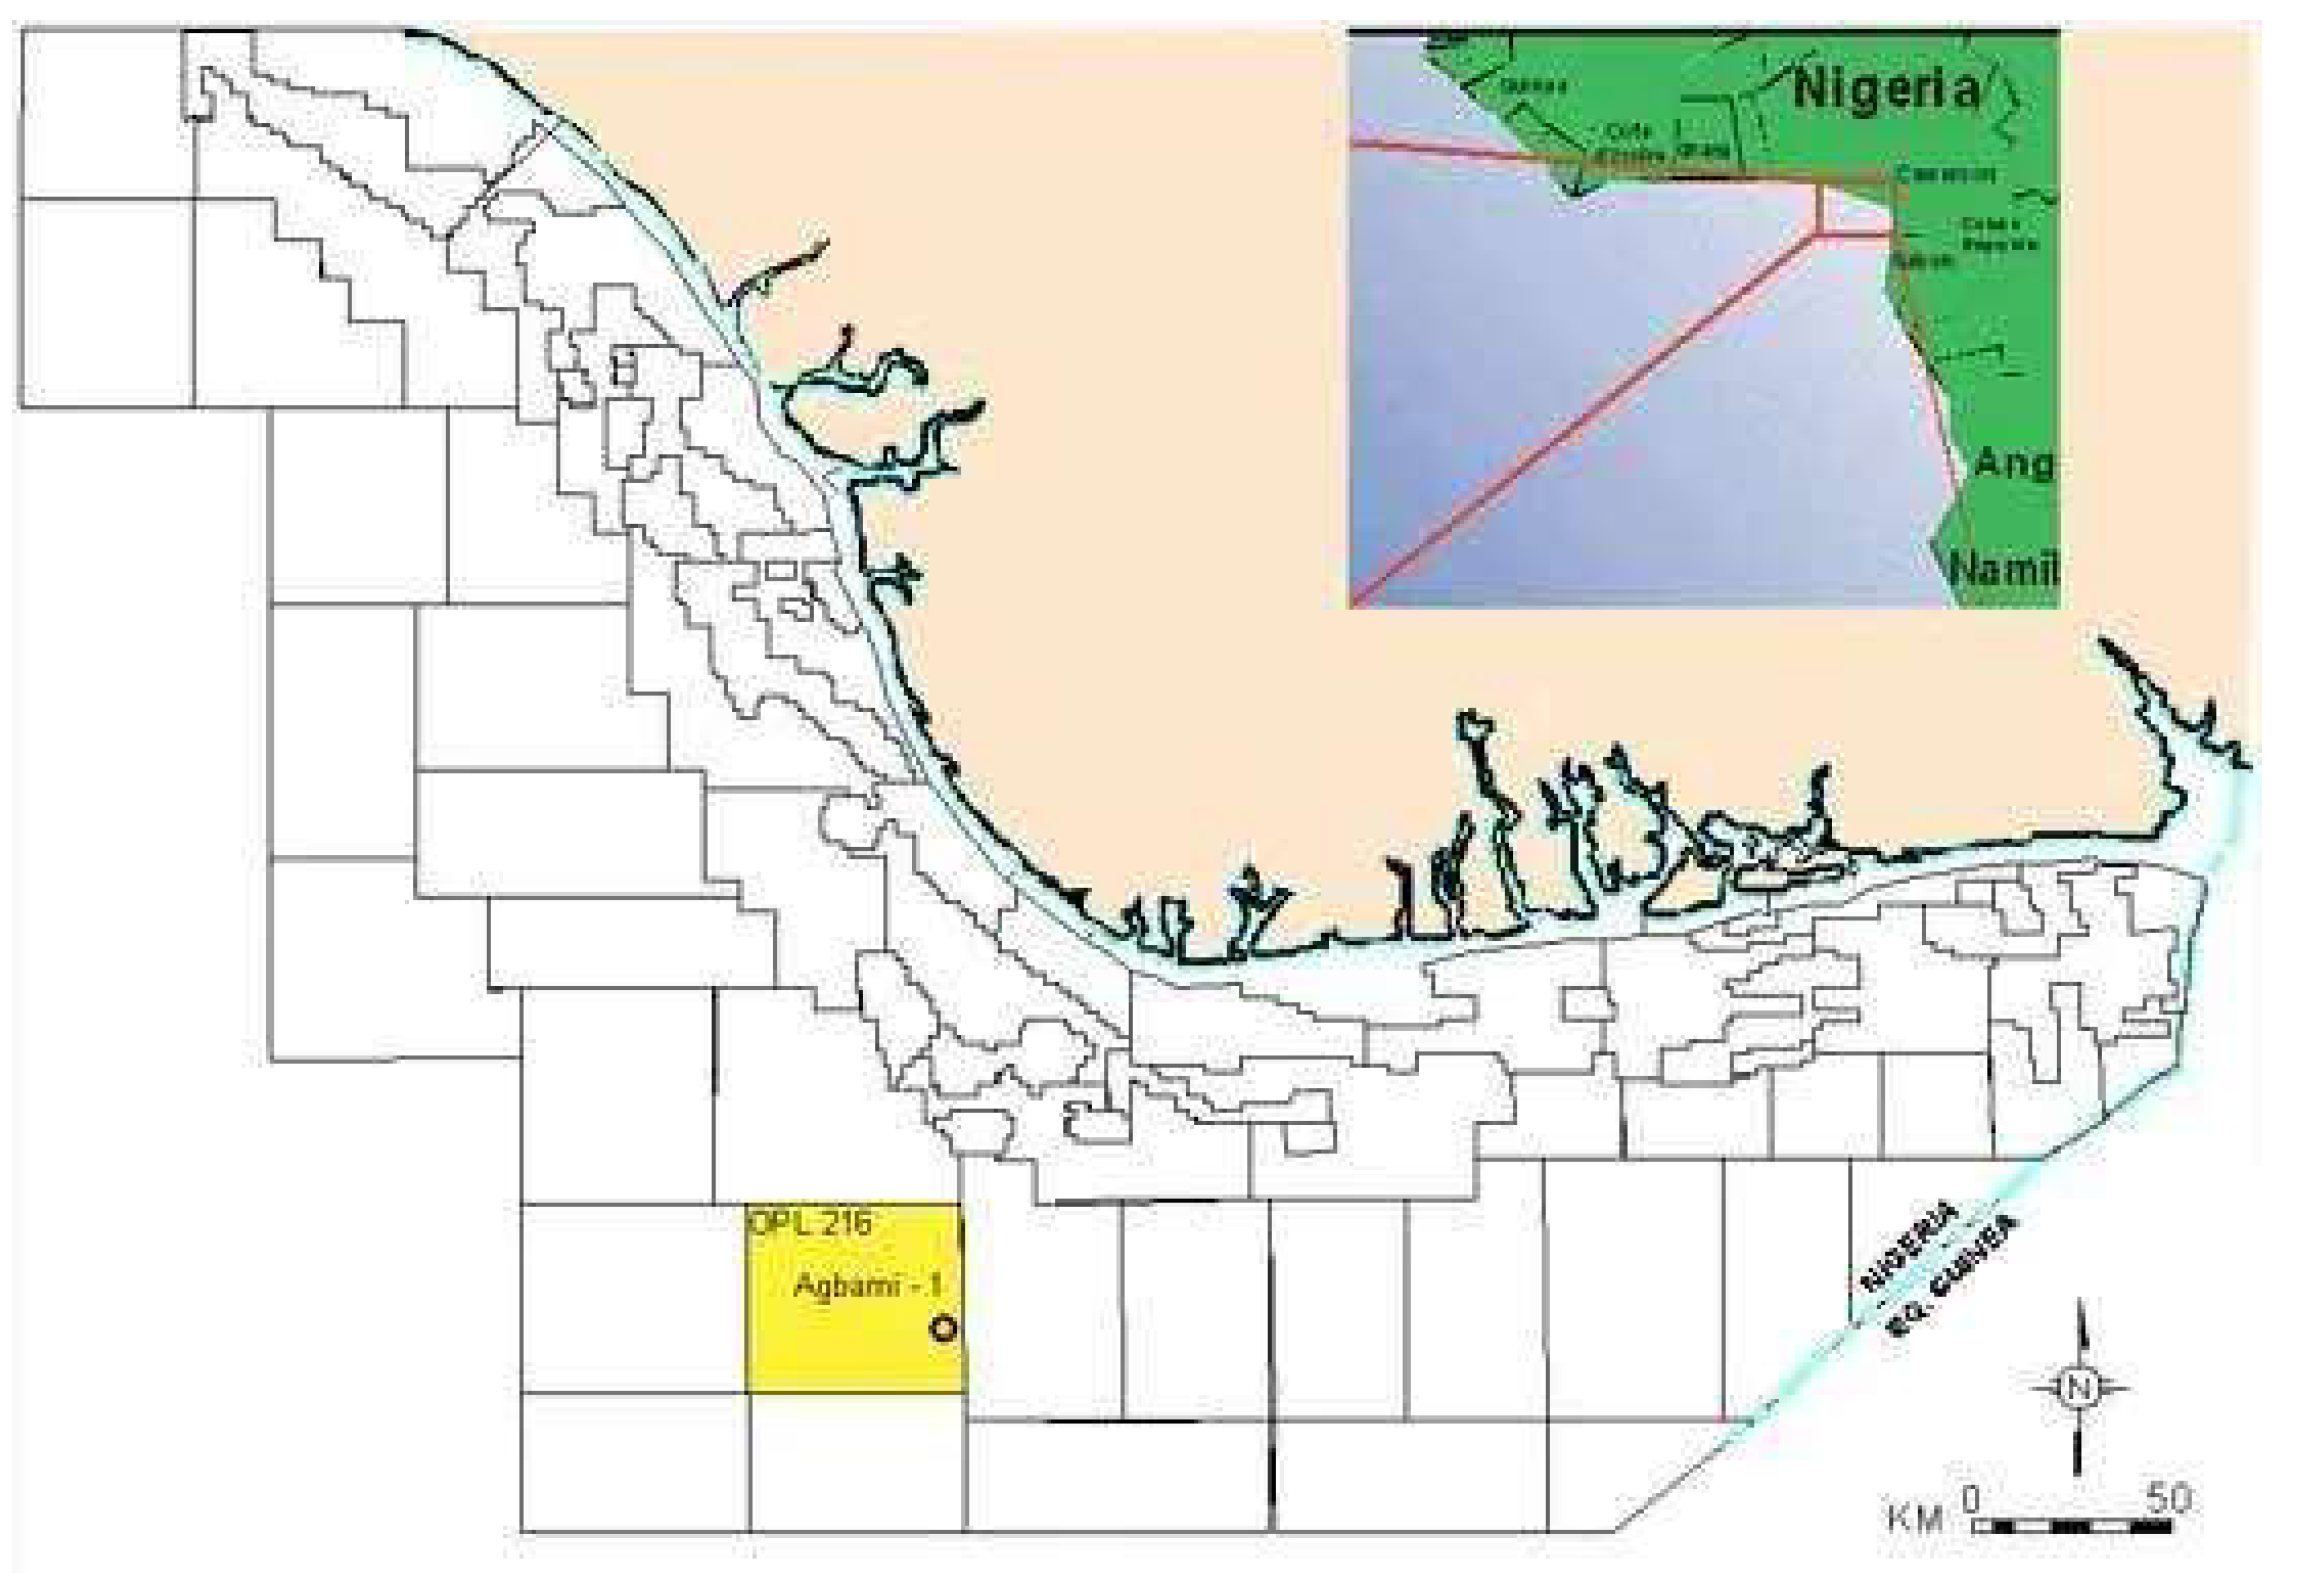
Although Agbami Field is not a carbonate reservoir, the waterflood management strategies of it are similar to those of many carbonate reservoirs. We provide this example here to offer insights into this successful waterflood project. The Agbami Field is Chevron’s first operated deep-water asset in Nigeria. The field was discovered in 1998 (Figure A1) and is located 70 miles off the coast of Nigeria, in about 4800 ft of water, and covers two license blocks, OML 126 and OML 127 [28]. The reservoir and fluid properties are listed in Table A1.
Figure A1. Location of Agbami Field [29].
Energies 17 03951 g0a1
Table A1. Reservoir and fluid properties of Agbami Field [29].
Main formationLower and middle Miocene deep-water turbiditic sandstones
Estimated area, acre45,000
Type of crudeLight
Depth, ft4800
Average porosity, %18
Permeability, md150 to 2000
Initial pressure, psi7000
Bubble point pressure, psi3000
Stock-tank oil gravity, API45 to 49
GOR, scf/stb1000
Estimated OOIP, billion bbls2.8
Agbami Field has a geology of a double-plunging anticlinal structure cut by a significant thrust fault along the crestal axis with multiple small-relief normal faults dividing the reservoirs into fault blocks (Figure A2). Briefly, 13MY (million year), 14MY, 16MY, and 17MY are the four major reservoir units for Agbami Field, and about 80% of oil in place is located within the 17MY reservoir. The 17MY units can be further subdivided into distinct architectural elements and have dip angles of up to 30° toward the northeast and southwest, as shown in Figure A3.
Figure A2. Geological structure of Agbami Field: (a) structural framework (area and fault designation) and (b) conceptual depositional model. Reprint with permission from ref. [28]. Copyright 2013 SPE.
Energies 17 03951 g0a2
Figure A3. Architecture elements within the 17MY and high dip angles (A). stratigraphic cross-section, (B). structural cross-section. Reprinted with permission from ref. [30]. Copyright 2018 SPE.
Energies 17 03951 g0a3
Based on the geological characteristics, the challenges encountered in producing from Agbami Field can be summarized as follows [28]:
(1)
The highly channelized deep-water environment results in a range of static and dynamic subsurface uncertainties within the field. Understanding the communication across the main thrust fault is challenging.
(2)
Optimized injection volumes of gas and water should be ensured to manage the flood fronts and reservoir pressures, within the constraints of well availability, well deliverability, and other operational limitations.
(3)
The complex subsea development architecture of the field means long lead times and high costs for implementing solutions to issues that arise during production.
(4)
Uncertainty in reservoir depletion across the field post-production, which impacts the ongoing development of the drilling program, must be dealt with.
(5)
The various operational challenges faced on a daily basis, such as well interactions, sand production, slugging, etc., should be managed while maintaining optimal production.

Appendix A.2. Field History
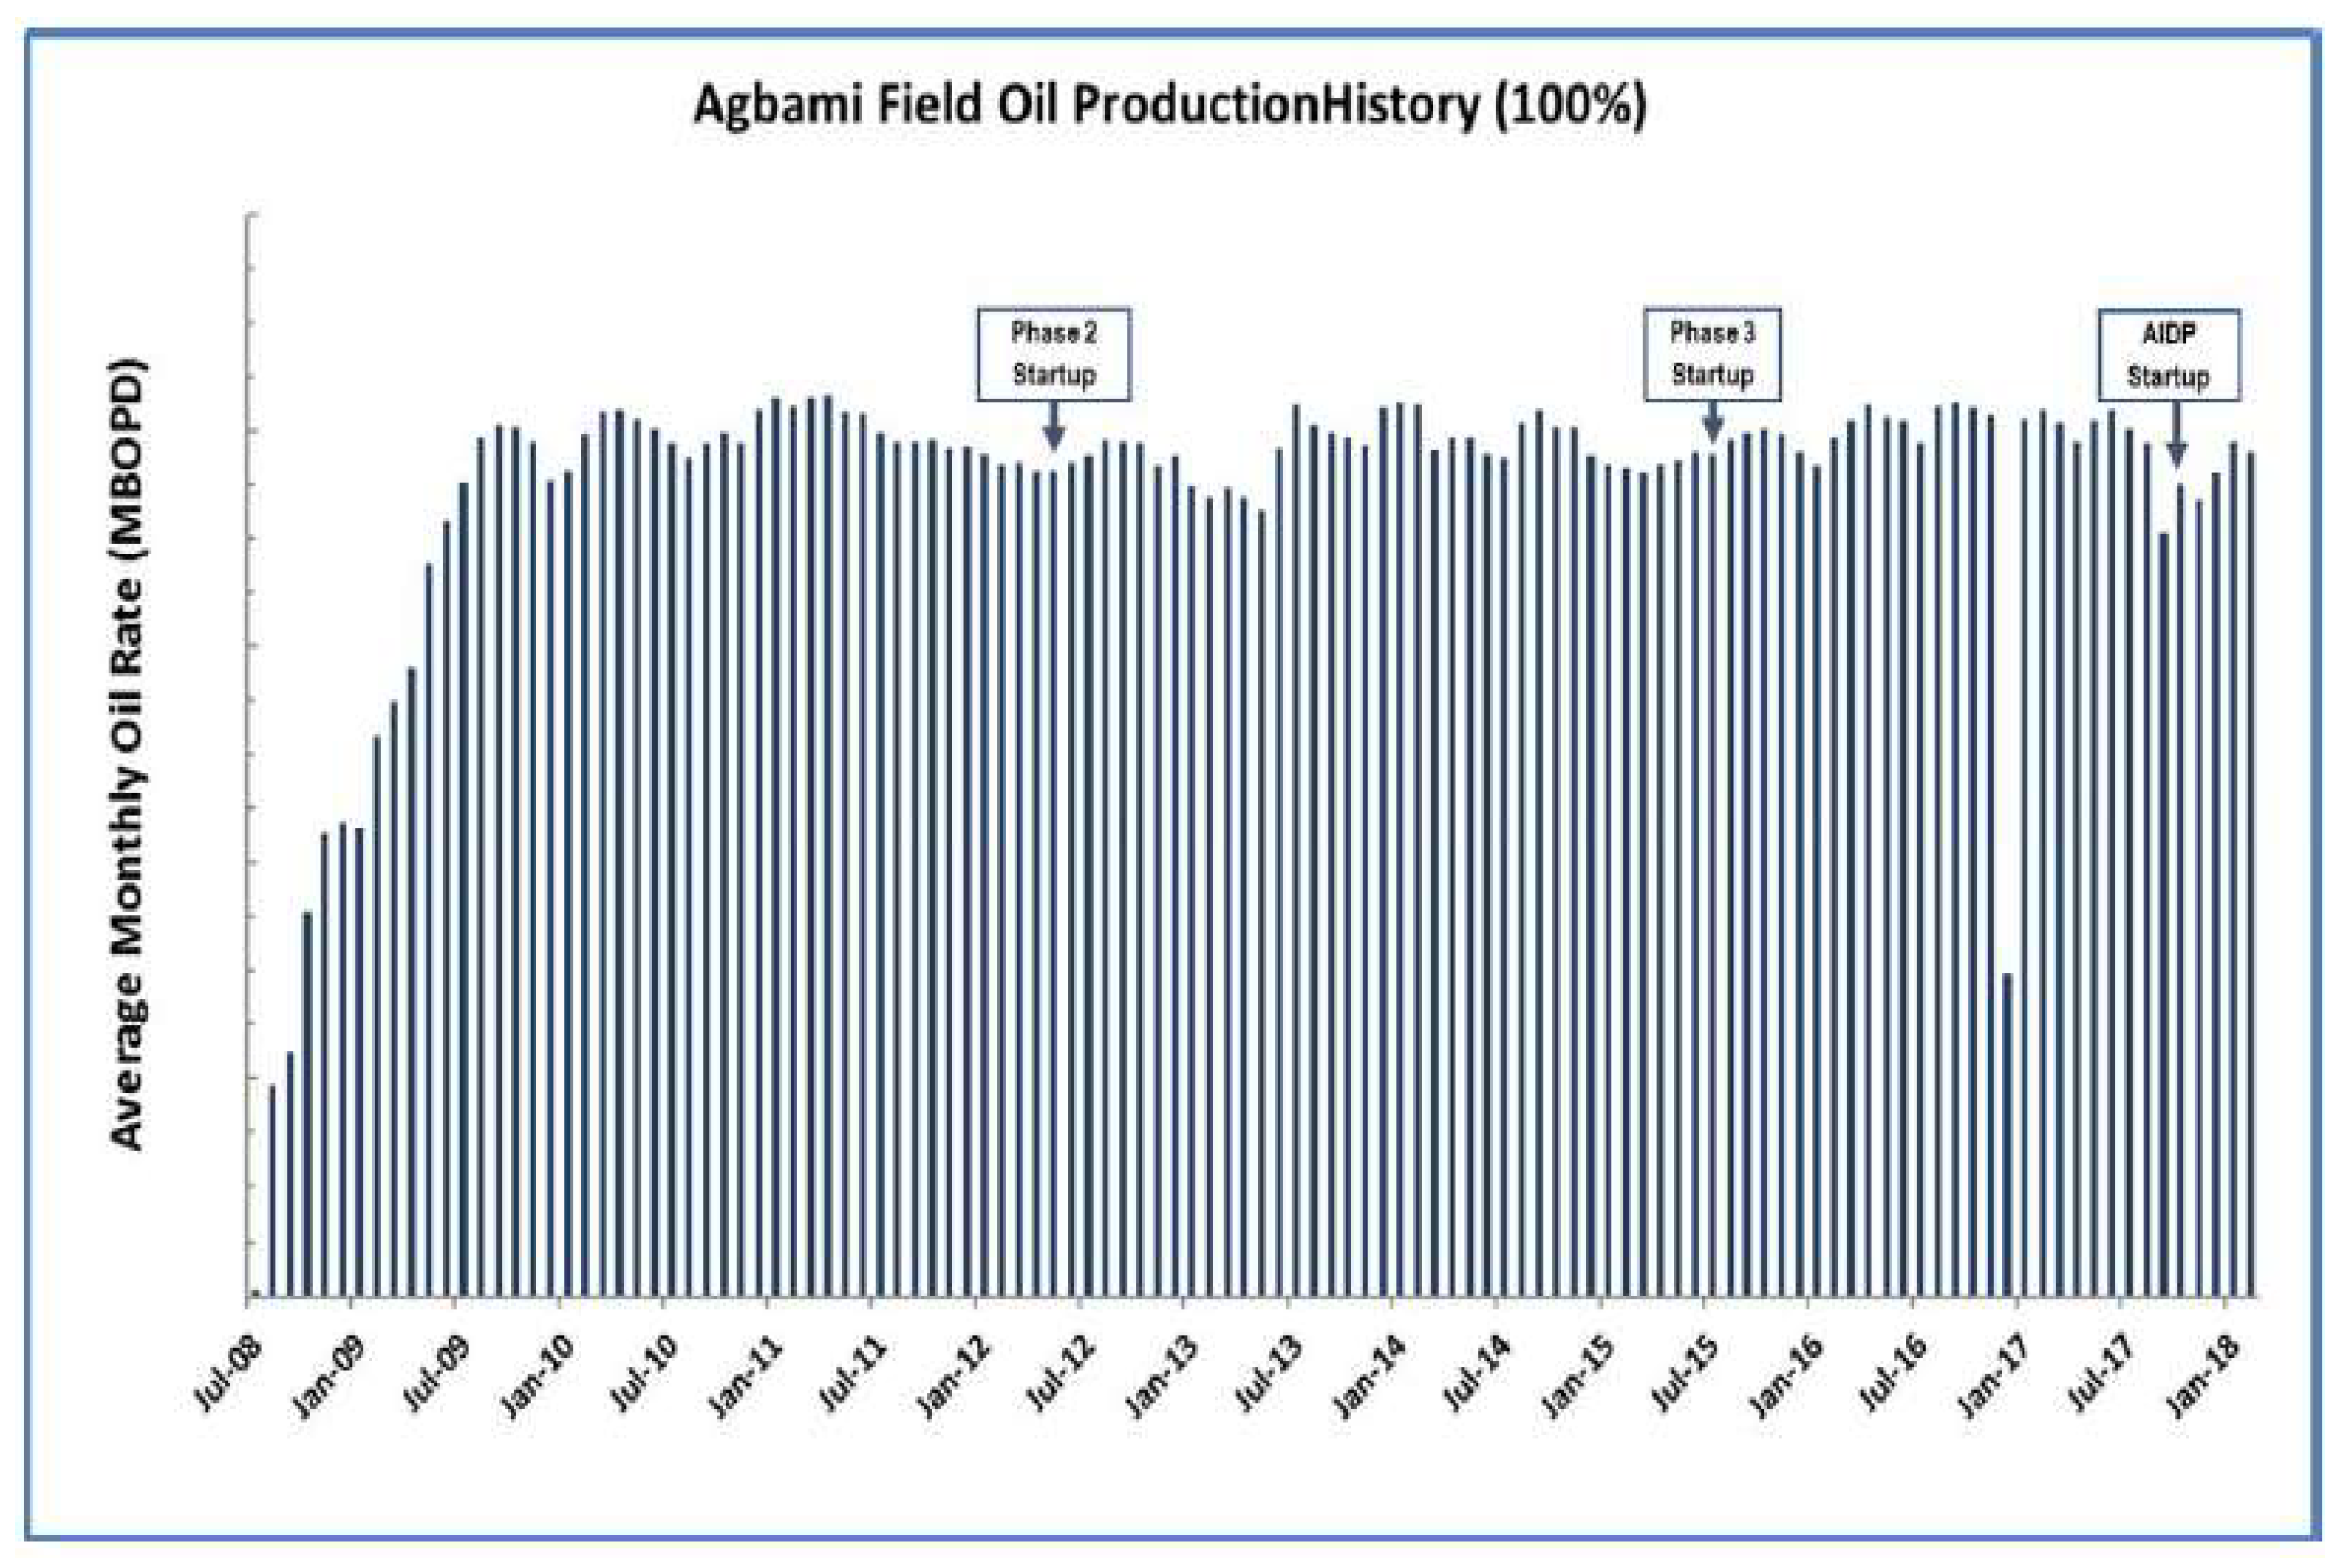
Agbami Field was discovered through the drilling of the Agbami No. 1 discovery well in 1998. One year later, a five-well and one-sidetrack appraisal program was carried out to further evaluate the field. In 2008, Agbami Field achieved first oil production at an initial rate of 95 MBOPD, approximately, and it reached a peak production of 250 MBOPD in 2009, 4 months ahead of schedule. The first 4D seismic monitoring survey was acquired after ~10% of the oil in place had been produced in 2013. By the end of 2017, the field had produced over 770 MMBO with average annual rates exceeding 230 MBOPD. Phase 3 development with 6 more wells was nearing completion with 37 of the 38 planned initial wells drilled. Agbami Field’s development progressed to the next phase with approval for the drilling of 12 additional infill wells over two phases (Agbami Infill Drilling Project) in 2018 (Figure A4). Figure A5 shows the historical production of Agbami Field, which shows a sustained plateau.
Figure A4. Field history overview of Agbami Field.
Energies 17 03951 g0a4
Figure A5. Agbami Field historical production. Reprinted with permission from ref. [31]. Copyright 2004 SPE.
Energies 17 03951 g0a5
The success of Agbami Field is ascribed to several key factors:
(1)
The phased field development approach: the field was developed in multiple phases (phases 1–4), allowing learnings and data from each phase to optimize well locations and production strategies for subsequent phases;
(2)
Robust reservoir management practices: a strong focus on reservoir characterization, integration of all available data sources like well logs, cores, seismic monitoring, production, 4D seismic monitoring, etc., and reduction of uncertainties over time.
(3)
Simultaneous water and gas injection strategy: mid-flank oil production with downdip water injection and crestal gas injection enhanced sweep efficiency and pressure support;
(4)
Advanced technology deployment: intelligent well completions for real-time monitoring and control of zones were used;
(5)
Strong project execution: Chevron’s structured project development and execution processes (CPDEP, WC-CPDEP) were adopted;
(6)
People competency: staff comprised experienced professionals with complementary skillsets from different regions.

Appendix A.3. Summary

The application of reservoir management strategies plays an important role in securing the success of the Agbami Field. The combination of phased development, robust reservoir management, advanced technology application, strong process execution, and competent people enabled Agbami Field to become a highly successful world-class deep-water project.

References

  1. U.S. Energy Information Administration. U.S. Energy Facts Explained. Available online: https://www.eia.gov/energyexplained/us-energy-facts/ (accessed on 24 April 2024).
  2. Satter, A.; Thakur, G.C. Integrated Petroleum Reservoir Management: A Team Approach; PennWell Corp.: Tulsa, OK, USA, 1994. [Google Scholar]
  3. Thakur, G.C. The Role of Reservoir Management in Carbonate Waterfloods. In Proceedings of the SPE India Oil and Gas Conference and Exhibition, New Delhi, India, 17 February 1998. [Google Scholar]
  4. Thakur, G.C. Waterflood Surveillance Techniques—A Reservoir Management Approach. J. Pet. Technol. 1991, 43, 1180–1188. [Google Scholar] [CrossRef]
  5. Xu, Z.-X.; Li, S.-Y.; Li, B.-F.; Chen, D.-Q.; Liu, Z.-Y.; Li, Z.-M. A Review of Development Methods and EOR Technologies for Carbonate Reservoirs. Pet. Sci. 2020, 17, 990–1013. [Google Scholar] [CrossRef]
  6. Nairn, A.; Alsharhan, A. Sedimentary Basins and Petroleum Geology of the Middle East; Elsevier: Amsterdam, The Netherlands, 1997. [Google Scholar]
  7. Wilson, J. A Review of Carbonate Reservoirs. In Facts and Principles of World Petroleum Occurrence—Memoir 6; CSPG Special Publications; AAPG Datapages, Inc.: Tulsa, OK, USA, 1980; pp. 95–117. [Google Scholar]
  8. Hong, J.; Wang, Z.; Li, J.; Xu, Y.; Xin, H. Effect of Interface Structure and Behavior on the Fluid Flow Characteristics and Phase Interaction in the Petroleum Industry: State of the Art Review and Outlook. Energy Fuels 2023, 37, 9914–9937. [Google Scholar] [CrossRef]
  9. Stiles, L.H.; Magruder, J.B. Reservoir Management in the Means San Andres Unit. J. Pet. Technol. 1992, 44, 469–475. [Google Scholar] [CrossRef]
  10. Encyclopaedia Britannica. Permian Basin. Available online: https://www.britannica.com/place/Permian-Basin (accessed on 8 August 2024).
  11. Magruder, J.B.; Stiles, L.H.; Yelverton, T.D. Review of the Means San Andres Unit CO2 Tertiary Project. J. Pet. Technol. 1990, 42, 638–644. [Google Scholar] [CrossRef]
  12. Mineralanswers Production Profile of Means San Andres Unit. Available online: https://www.mineralanswers.com/texas/andrews-county/properties/means-san-andres-unit/08-17503 (accessed on 8 August 2024).
  13. Garcia Quijada, M. Optimization of a CO2 Flood Design Wesson Field—West Texas. Master’s Thesis, Texas A&M University, College Station, TX, USA, 2005. [Google Scholar]
  14. Ghauri, W.K. Production Technology Experience in a Large Carbonate Waterflood, Denver Unit, Wasson San Andres Field. J. Pet. Technol. 1980, 32, 1493–1502. [Google Scholar] [CrossRef]
  15. Mathis, R.L. Reservoir Geology of the Denver Unit—Wasson San Andres Field, Gaines and Yoakum Counties, Texas. Permian Basin SEPM Publ. 1986, 86, 43–47. [Google Scholar]
  16. Fleming, E.A.; Brown, L.M.; Cook, R.L. Overview of Production Engineering Aspects of Operating the Denver Unit CO2 Flood. In Proceedings of the SPE/DOE Enhanced Oil Recovery Symposium, Tulsa, OK, USA, 4 April 1992. [Google Scholar]
  17. Occidental Oil Company. Oxy Denver Unit CO2 Subpart RR Monitoring, Reporting and Verification (MRV) Plan; Occidental Oil Company: Huston, TX, USA, 2015. [Google Scholar]
  18. Thai, B.N.; Hsu, C.F.; Bergersen, B.M.; Albrecht, S.L.; Richardson, T.W. Denver Unit Infill Drilling and Pattern Reconfiguration Program. In Proceedings of the SPE Permian Basin Oil and Gas Recovery Conference, Midland, TX, USA, 21 March 2000. [Google Scholar]
  19. Pre-Salt from Petrobras. Available online: https://www.petrobras.com.br/pre-sal (accessed on 8 August 2024).
  20. da Costa Fraga, C.T.; Capeleiro Pinto, A.C.; Branco, C.C.M.; de Sant´Anna Pizarro, J.O.; da Silva Paulo, C.A. Brazilian Pre-Salt: An Impressive Journey from Plans and Challenges to Concrete Results. In Proceedings of the Offshore Technology Conference, Houston, TX, USA, 4 May 2015. [Google Scholar]
  21. de Moraes Cruz, R.O.; Rosa, M.B.; Branco, C.C.M.; de Sant’Anna Pizarro, J.O.; de Souza Silva, C.T. Lula NE Pilot Project—An Ultra-Deep Success in the Brazilian Pre-Salt. In Proceedings of the Offshore Technology Conference, Houston, TX, USA, 2 May 2016. [Google Scholar]
  22. Hauville, B.; Rueda Terrazas, R.; Henrique, S. CO2 from Southeast Asia to Brazil: Making Your Enemy Your Ally? In Proceedings of the Offshore Technology Conference-Asia, Kuala Lumpur, Malaysia, 25 March 2014.
  23. Formigli, J.M.; Capeleiro Pinto, A.C.; Almeida, A.S. SS: Santos Basin’s Pre-Salt Reservoirs Development: The Way Ahead. In Proceedings of the Offshore Technology Conference, Houston, TX, USA, 4 May 2009. [Google Scholar]
  24. Rosa, M.B.; de Araújo Cavalcante, J.S.; Miyakawa, T.M.; de Freitas, L.C.S. The Giant Lula Field: World’s Largest Oil Production in Ultra-Deep Water Under a Fast-Track Development. In Proceedings of the Offshore Technology Conference, Houston, TX, USA, 30 April 2018. [Google Scholar]
  25. de Sant´Anna Pizarro, J.O.; Branco, C.C. Challenges in Implementing an EOR Project in the Pre-Salt Province in Deep Offshore Brasil. In Proceedings of the SPE EOR Conference at Oil and Gas West Asia, Muscat, Oman, 16 April 2012. [Google Scholar]
  26. Michelett, G.; Roberts, A.; Kalyondo, J.; Habashi, A.; Alhafidh, H.; Hascakir, B. Onshore and Offshore EOR Applications in Brazil: A Review Study. In Proceedings of the SPE Annual Technical Conference and Exhibition, Houston, TX, USA, 26 September 2022. [Google Scholar]
  27. de S. Pizarro, J.O.; Poli, R.E.B.; Rosa, M.B.; da Silva, V.C.; Branco, C.C.M.; Cunha, B.M.; Doria, M.A.F.S.; Alles, N.; Batello, D.; Pinto, A.C.C. Optimizing Production of Santos Basin Pre-Salt Fields through Sound Reservoir Management Practices. In Proceedings of the OTC Brasil, Rio de Janeiro, Brazil, 24 October 2017. [Google Scholar]
  28. Odusote, F. Deepwater Nigeria Field Development: Challenges, Best Practices and Lessons Learned from the Agbami Field. In Proceedings of the SPE Nigeria Annual International Conference and Exhibition, Lagos, Nigeria, 5 August 2013. [Google Scholar]
  29. Offshore Technology. Agbami Oilfed. Available online: https://www.offshore-technology.com/projects/agbami/ (accessed on 6 August 2024).
  30. Jeboda, O.; Bodunrin, A.; Atuanya, C.; Ogidi, E. Reservoir Management Best Practices and Lessons Learned from the Agbami Field. In Proceedings of the SPE Nigeria Annual International Conference and Exhibition, Lagos, Nigeria, 6 August 2018. [Google Scholar]
  31. Hollister, H.D.; Spokes, J.J. The Agbami Project: A World Class Deepwater Development. In Proceedings of the Offshore Technology Conference, Houston, TexasTX, USA, 3 May 2004. [Google Scholar]
Figure 1. U.S. primary energy consumption up to 2022 [1].
Energies 17 03951 g001
Figure 2. Waterflood management system, reprinted with permission from ref. [3]. Copyright 1998 SPE.
Energies 17 03951 g002
Figure 3. Location of Means Field [10].
Energies 17 03951 g003
Figure 4. Structural map of MSAU. Reprinted with permission from ref. [9]. Copyright 1992 SPE.
Energies 17 03951 g004
Figure 5. Field history overview of MSAU before the tertiary operation.
Energies 17 03951 g005
Figure 6. Injection schemes for MSAU at (a) 1963, (b) 1969, and (c) 1976. Reprinted with permission from ref. [9]. Copyright 1992 SPE.
Energies 17 03951 g006
Figure 7. Production profile from 1970 to 1990 for MSAU. Reprinted with permission from ref. [9]. Copyright 1992 SPE.
Energies 17 03951 g007
Figure 8. Performance of CO2 flood in (a) November of 1983. Reprinted with permission from ref. [9]. Copyright 1992 SPE and (b) 2024 [12].
Energies 17 03951 g008
Figure 9. Location map of Denver Unit, Wasson San Andres Field [13].
Energies 17 03951 g009
Figure 10. Field history overview of Denver Unit—Wasson San Andres Field.
Energies 17 03951 g010
Figure 11. (a) Original peripheral waterflood pattern in 1964 [14], (b) 1979 project status, reprinted with permission from ref. [14], copyright 1980 SPE, and (c) 2014 project status with CO2 injection [17].
Energies 17 03951 g011
Figure 12. Geologic concept: (a) continuous pay layers and (b) discontinuous pay layers.
Energies 17 03951 g012
Figure 13. Project performance of Denver Unit before CO2 flooding. Reprinted with permission from ref. [14]. Copyright 1980 SPE.
Energies 17 03951 g013
Figure 14. Area subgroups and samples of porosity and permeability variations across the field. Reprinted with permission from ref. [18]. Copyright 2000 SPE.
Energies 17 03951 g014
Figure 15. Production performance of Denver unit: (a) production rate vs. time and (b) cumulative oil vs. time.
Energies 17 03951 g015
Figure 16. Injection profile status. Reprinted with permission from ref. [14]. Copyright 1980 SPE.
Energies 17 03951 g016
Figure 17. Schematic picture of pre-salt [19].
Energies 17 03951 g017
Figure 18. (a). Location of Lula Field [21] (b). Santos Basin, reprinted with permission from ref. [22]. Copyright 2014 SPE.
Energies 17 03951 g018
Figure 19. Overview of field history of Lula Field.
Energies 17 03951 g019
Figure 20. Change in Lula Field development plan due to observed fluid variations: (a) projects in 2009 and (b) project in 2016. Reprinted with permission from ref. [21]. Copyright 2016 SPE.
Energies 17 03951 g020
Figure 21. Lula Pilot’s planned pattern. Reprinted with permission from ref. [25]. Copyright 2012 SPE.
Energies 17 03951 g021
Figure 22. (a) Production performance of Lula Pilot and (b) gas injector performance. Reprinted with permission from ref. [25]. Copyright 2012 SPE.
Energies 17 03951 g022
Figure 23. Historical production of Lula Field. Reprinted with permission from ref. [26]. Copyright 2022 SPE.
Energies 17 03951 g023
Table 1. Reservoir and fluid properties of MSAU [9,11].
FormationSan Andres
LithologyDolomite
Area, acres14,328
Depth, ft4400
Gross thickness, ft300
Average net pay, ft54
Average porosity, %9.0 (up to 25)
Average permeability, md20.0 (up to 1000)
Average Swi, %29
Primary driveWeak water drive
Average original pressure, psi1850
Minimum miscible pressure (MMP), psi1850 to 2300
Stock-tank oil gravity, API29
Oil viscosity, cP6
FVF, RB/STB1.04
Saturation pressure, psi310
Table 2. Reservoir and fluid properties of Wasson San Andres Field [14].
FormationSan Andres
LithologyDolomite
Area, acres27,848
Depth, ft4800–5200
GOC, ft1325
Gross thickness, ft200–500
Average net oil pay, ft137
Average porosity, %12
Average permeability, md5
Average Swc, %12
Primary driveSolution gas drive
Average original pressure, psig1805
Reservoir temperature, °F105
Stock-tank oil gravity, API33
Oil viscosity, cP1.18
Bo, RB/STB1.312
GOR at original pressure, ft3/bbl420
Saturation pressure, psi1805
Minimum miscible pressure, psi1300
OOIP (bbl)2.108 × 10⁹
Table 3. Reservoir and fluid properties of Lula Field [25].
Main formationBarra Velha
Rock typeCarbonate
Area, km21600 (or 390,000 acres)
Type of crudeLight
Dead oil viscosity, cP1
Depth, m5000–6500 (or 16,404 to 21,325 ft)
Porosity, %12 (can exceed 25)
Permeability, md50–1000
Initial pressure, kgf/cm2560 (or 7965 psi) at 4895 m TVDSS
Stock-tank oil gravity, API26–29
Avg CO2 (vol%)8–18
GOR, m3/m3160–300
Estimated OOIP, m34.8 × 109 (or 8.3 billion boe)
Disclaimer/Publisher’s Note: The statements, opinions and data contained in all publications are solely those of the individual author(s) and contributor(s) and not of MDPI and/or the editor(s). MDPI and/or the editor(s) disclaim responsibility for any injury to people or property resulting from any ideas, methods, instructions or products referred to in the content.

