Abstract
The deposition of fly ash on the heat exchanger will reduce the heat transfer efficiency of the system. This article conducted experiments and simulations on the deposition, exploring the effects of velocity, particle size on the deposition position. In addition, deposition density distribution was demonstrated, the calculation method of fin thermal resistance was improved, and the efficiency of fins was also calculated. The results showed that deposition decreased with velocity increasing, and the simulation results were in good agreement with the experimental results. The deposition distribution of the first section of the fin is unimodal, and the maximum deposition value approaches the peak of the fin. The distribution of the second section of the fin becomes bimodal with increasing velocity. In addition, as the speed increases, due to the decrease in deposition mass, the thermal resistance decreases by 53.2% and the fin efficiency increases by 8.82%.
1. Introduction
Heat exchangers are essential components across various industries, including refrigeration, automotive, electronics, chemicals, food processing, and power generation [1]. However, the performance of these heat exchangers can be compromised by the accumulation of small particles and fly ash from industrial exhaust gases. These particles deposit on the heat-exchanger surfaces, creating a fouling layer that augments wall thickness, constricts the flow passage, and escalates flow resistance. Ahn [2] observed that after seven years of operation, the heat-transfer capacity of finned-tube heat exchangers can diminish by 10–15%, while the air pressure drop may surge by over 44%. Moreover, the fouling layer also insulates the surface, diminishing the heat-transfer efficiency between the equipment and the exhaust gases. This reduction in efficiency has a direct bearing on the overall energy performance level of the heat-exchange system [3].
Numerous scholars have conducted theoretical analyses on deposition. Soltani [4] applied the John Kimball Rice (JKR) adhesion theory to determine the critical shear velocity necessary for particle movement. Brach [5] took a different approach by utilizing both the velocity and the angle at which particles collide with a surface as key factors in the critical conditions for particle deposition. Konstandopoulos [6] further refined the understanding of particle deposition by introducing a tangential deposition criterion, enhancing the comprehensiveness of the deposition theory. Batsh [7] proposed the concept of a deposition layer on the fin surface, integrating the Poisson’s ratio of both the wall and the particle into the mathematical model, and made significant corrections to the model by refining the definitions of both normal and tangential critical velocities. Herterich [8] confirmed the robustness of the critical-velocity model through empirical validation of particle deposition rates.
Although the effects of critical velocity and wall properties on particle deposition are considered, the above analysis overlooks elements such as the erosion of the fouling layer and the impact of particle erosion by the flow. Bohnet [9] proposed a physical model for deposition and erosion, positing that shear stress at the dirt layer’s surface is the primary cause of particle dislodgement. Paz [10] applied this model to forecast the thickness of deposits accumulating on pipe walls. Subsequently, Li [11] employed the Eulerian approach in conjunction with this model to simulate the deposition process on cylindrical tubes, achieving effective predictions of deposition patterns and a comprehensive simulation of the entire deposition sequence. In addition, during the operation of heat exchangers, the surfaces of heat exchange walls were not always clean or fouled uniformly. Instead, they transitioned from initially clean to fouled surfaces. The differences in surface roughness and other characteristics between clean and fouled surfaces can significantly affect particle deposition [12]. Pan [13] concluded that particle deposition predominantly occurs on fouled surfaces rather than clean ones. Wang [14] confirmed that the fouling layer on the wall surface facilitates the subsequent deposition of fly ash. The morphology and physical properties of the fouling layer influence the deposition characteristics of fly ash. Zhang [15] identified two turning points in the deposition layer’s evolution and described its characteristics as being divided into three distinct ash layers. Zhan [16] conducted numerical simulations using an improved model, and the deposition morphology is in good agreement with experimental data. It is evident that the factors influencing the early and later stages of the deposition layer’s development are different, with the early-formed deposition layer impacting the development of subsequent layers. However, few scholars have considered the distinction and transition between clean surfaces and fouling layers in their research. Liu [17] proposed a particle deposition and removal algorithm based on the Grant and Tabakoff particle-wall rebound model and the Johnson–Kendall–Roberts (JKR) theory in order to develop criteria for determining particle fouling. The model not only considered the transport, adhesion, rebound, and removal behavior of particles but also analyzed the deposition of particles from multiple collisions with the flue wall.
Based on the above theoretical research, many scholars have explored deposition in heat exchangers. A portion of them focused attention on the tube bundles. Han’s [18] results indicate that the first layer of deposition is composed of small particles and will accelerate subsequent deposition. Pérez [19] and Xu [20] came to similar conclusions: that the main deposition in tube-heat exchange occurs on the windward side of the tubes, and there is more deposition on the upstream tube bundles than on the downstream ones. Guo [21] believes that using elliptical tubes and enriched circular tubes can reduce ash accumulation and wear. Tang’s [22] research results also show that using stacked elliptical tubes helps to reduce fouling. Other scholars have focused on the deposition within the fin channels. Zhang’s [23] tests showed that deposition occurs mainly on the leading edge and center-back of the windward side. The deposited mass at the leading edge was much greater than that at the windward and leeward sides. For both the windward and leeward sides, for a given particle concentration, the deposited mass increased with increasing mainstream velocity. Bell [24] concluded that when using louvered fins, smaller spacings are more prone to fouling, and the wavy-plate fin heat exchanger was significantly less sensitive to fouling with both types of dust. Chen [25] mainly analyzed and discussed the effects of gas temperature, gas velocity, ammonium bisulfate (ABS), mass ratio (R) of fly ash, and ash particle size on ash deposition characteristics under different conditions. Mason [26] similarly found that for both straight and wavy herringbone fins, the smaller the fin spacing, the greater the increase in pressure drop caused by fouling. Additionally, the deposition behavior of nanoparticles in wavy heat exchangers is significantly influenced by thermophoresis [27]. The deposition efficiency curves for the floor, two sidewalls, and ceiling in a rectangular channel are different [28]. Välikangas [29], after comparative analysis, believed that herringbone fins have a higher fouling rate than plain fins. Lu [30] investigated the effects of airflow velocity, particle size, wave amplitude, and wave period on particle-deposition efficiency. The results show that the use of corrugated walls can significantly improve the deposition efficiency of particles with sizes smaller than 20 μm.
When the surface of heat-exchanger fins is covered with fly ash, heat cannot be directly transferred from the fins to the air, which significantly reduces the efficiency of the fins. The efficiency of the fins can be calculated using analytical or numerical methods. Aziz and Luardini [31] obtained the temperature distribution of the fins by solving the heat conduction problem. This method is applicable to situations where the fins are regular in shape. However, when the fin shapes are irregular, other methods are required to determine the temperature distribution. Tseng [32] conducted transient calculations for fins of rectangular, triangular, and other shapes, obtaining the temperature distribution along the direction of the fins. Atouei [33] applied the least-squares method to predict the temperature distribution of hemispherical porous fins. Zhan [34] proposed an analytical model to predict the efficiency of particle-deposited fins based on classical heat transfer formulas. However, these calculation models assume the particle deposition as a uniformly thick fouling layer, failing to consider the impact of deposition non-uniformity fully.
In summary, the deposition in finned-tube heat exchangers is a major research hotspot. However, most studies focus on the total deposition of fins, and few have studied the distribution of deposition on fins under different factors. This article considers the transition process from clean wall to fouling layer wall, which is distinguished by the random function method and combines the deposition, rebound, and erosion removal to study the deposition of multi-dispersed particles on heat exchanger fins. The thermal resistance and efficiency are calculated based on the deposition mass to evaluate the impact of deposition on the fins.
2. Numerical Models and Methods
2.1. Continuous Phase
The gas phase is assumed as continuous, incompressible Newton fluid, and the experiment and numerical simulation are carried out under the working conditions and environment of 25 °C, so the temperature change is ignored in the process of gas–solid two-phase flow. The mathematical expression of its control equation and turbulence model are expressed as follows:
- (1)
- mass conservation equation
- (2)
- momentum conservation equation
- (3)
- turbulent model
2.2. Discrete Phase
2.2.1. Particle Transport Model
For the motion of fly ash particles, the Lagrange method is used, and the motion equation of particles based on Newton’s law is as follows:
where, is the velocity vector of the discrete phase; ρp is the density of the discrete phase; Rep is the Reynolds number; and μ is the fluid viscosity.
The motion of fly ash particles’ motion in the flue gas is subjected to Magnus lift, drag, gravity, Saffman lift, and thermophoretic forces in high-velocity gradient fields. In the study of gas-solid two-phase flow, the Saffman force has a smaller effect on large particles [35], which is suitable for submicron-sized particles. The thermophoretic force is suitable for the influence of high-temperature environments on small particles, and the influence magnitude is smaller at room temperature. This article studies the deposition characteristics of 1~50 μm particles at room temperature. The Saffman lift and thermophoresis forces are relatively small compared to other force levels, so the influence of Saffman lift and thermophoresis forces is ignored in this article. Drag force is the main force acting on the motion of particles in the flow field, expressed as follows:
where, Cvm is the virtual mass factor, choosing the default value of 0.5.
2.2.2. Random Function
Due to the different physical properties of the clean wall and dirt surfaces, the deposition and rebound behavior of particles after collision will also be different, which will have a significant impact on subsequent deposition. Therefore, it is necessary to determine whether the surface is clean when particles collide with the surface. Using fluent to simulate calculations requires dividing grids to discretize the computational domain, which is the smallest unit in the calculation. Therefore, it cannot obtain the precise location of particle deposition. In this paper, the ratio G of the projected area of sedimentary particles on the wall to the grid area is used as the probability of collision between particles and the fouling layer:
where UDM (User Defined Memory) is a user-defined storage that represents the number of deposited particles in the current cell. A is the area of the particle currently impacting the cell.
When particles collide with the wall within the cell, a random number, g, is selected between 0~1. If g > G, it is determined that the particles collide with the clean wall; otherwise, it is determined that the particles collide with the sedimentary layer. When particles deposit on a clean wall surface, the probability of the random function is increased, while the probability of the random function remains unchanged when deposited on the fouling layer.
2.2.3. Critical Velocity Deposition Model
When particles collide with the wall, there are two behaviors: deposition and rebound. Distinguishing conditions should be provided for the two behaviors during calculation. The critical velocity model proposed by Brach and Dunn [5] has good applicability and is widely used in particle deposition simulation; the critical velocity Vcr is calculated based on the wall and particle properties, and the calculation formula is as follows:
where E is Young’s modulus, Es is Young’s modulus of wall, Ep is Young’s modulus of particle, vs is the Poisson’s ratio of surface, and vp is the Poisson’s ratio of particle.
The deposition of particles is affected not only by velocity but also by the angle between particle velocity and the wall surface. Konstandopoulos [6] calculated the critical adhesion angle based on contact mechanics and Newton’s theorem. The results indicate that the incident angle of particle wall collision θ is greater than the critical adhesion angle θcr; particles do not adhere to the wall surface.
where vi,t is the tangential velocity of particles colliding with the surface; vi,n is the normal velocity of particles colliding with the surface; μ* is the effective friction coefficient; β is the effective coefficient of contact radius; E* is the effective Young’s modulus; and G* is the effective shear modulus.
Due to differences in surface properties, the critical velocity and angle of the clean wall and fouling layer are also different, respectively Vcr1, θcr1 and Vcr2, θcr2. As shown in Figure 1, when particles collide with the wall, the random function is used to determine the type of wall. Then, the velocity and angle are compared with corresponding ones, determining which behavior of particles it is. If particles deposit on the wall, the UDM stores the number of deposited particles. Otherwise, the particles rebound and re-enter the flow field.
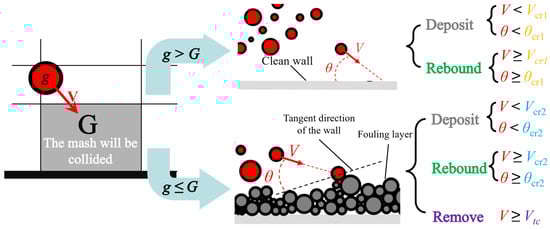
Figure 1.
Schematic diagram of particle deposition model.
2.2.4. Particle Removal Model
Particles deposited on the wall would be continuously scoured by the gas. The critical wall shear velocity was proposed by Soltani and Ahmadi [4], and the particles, which are predicted to stick to the tube wall, would be removed if the local wall friction velocity is larger than the critical wall shear velocity. The critical wall shear velocity [36] is expressed as follows:
where Cu and K are the Cunningham correction factor and composite Young’s modulus, respectively. The local wall friction velocity is given by:
where ν is the kinematic viscosity of the gas and n·∇U is the velocity gradient of the gas along the normal direction.
2.2.5. Dynamic Mesh
The deposition of particles at the wall cell will increase the UDM value of the corresponding cell. When the value of deposition particles is enough, DEFINE_GRID_MOTION is active to move boundary layer nodes, simulating the changes in wall shape and position caused by the increase of deposition mass. The orientation of the displacements of the grid node can be calculated by the sum of the normal vectors of two adjoining deposition surfaces. The movement distance is calculated based on the number of particles in the grid [18,37]. The formula is as follows:
where, md is mass of particle; n is the number of particle storage in UDM; F(id) is the area of deposition grid surface; and ρb is particle bulk density.
2.3. Calculation Process
The computational flowchart for the particle deposition and removal model in this study is shown in Figure 2. Firstly, it is determined whether the incident particles are carried to the target surface or not, and the velocity and angle of the particles entering the heat exchanger are also obtained by the particle transport model; then, different particle deposition models are developed depending on the target surface (clean surface or fouled surface), and the critical adhesion velocity, critical impact angle, and critical removal velocity are calculated and compared with the impact angle and impact velocity of the incident particles to determine the behaviors of the incident particles and the wall. Meanwhile, in order to be able to accurately analyze the particle deposition morphology and the effect of deposited particles on the flow field and particle trajectories, the dynamic mesh technique was used in this research.
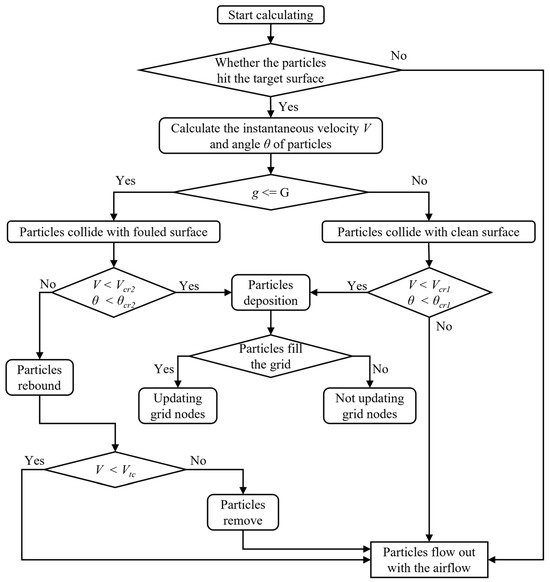
Figure 2.
Flow chart of the calculation of particle deposition and removal model.
2.4. Physical Model and Boundary Conditions
This paper simplifies the model to the 2D-simulation domain shown in Figure 3, with a total length of 320 mm. The inlet is extended by 120 mm to fully develop the flow field before entering the fin section, and the outlet is extended by 120 mm to weaken the influence of backflow. Each fin section has a horizontal length of 40 mm, and the distance between fins is 5 mm.
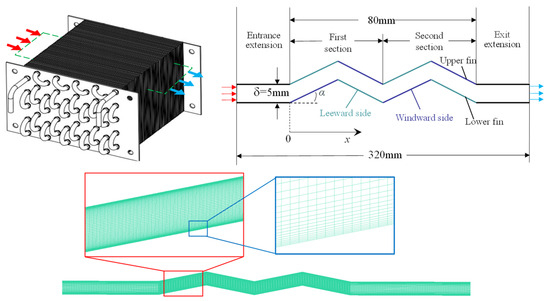
Figure 3.
Physical model of finned tube heat exchanger, simulation domain, and mesh division.
A two-dimensional precision separation solver is used to solve equations in Fluent. According to the range of inlet velocity, Reynolds number Re ranges from 800 to 3300, so the turbulence is not strong, and the fin structure is simple. Therefore, the standard k-ε turbulence model with high calculation accuracy and relatively less computational complexity is selected. The continuous phase condition at the inlet selects the velocity inlet, and particles are released from the surface using SiO2 with the same velocity. The particle mass flow rate is 7.5 × 10⁻⁵~2.5 × 10⁻⁴ kg/s, with a particle size range of 1–50 μm [38], divided into ten levels of particles, using a Rosin–Rammler diameter distribution to control the mass of particles with different sizes, with a distribution coefficient of 3.5. The detailed properties of the particles used in the present work are listed in Table 1. Young’s modulus and surface energy are typical mechanical characteristics of solid materials, characterizing the tensile or compressive stiffness of the material and the interaction of molecules located near the surface of the particle with the impact surface, respectively. Since the particle mass loading in this paper is small (lower than 1%), the one-way coupling method for the particle phase is adopted. The wall surface adopts no-slip conditions, and the fin wall surface is set with trap conditions, loading UDF to change the capture conditions. The outlet is a pressure outlet, and the particle condition is an escape. The calculation method is SIMPLE that considers the coupling relationship between velocity and pressure. Using transient calculation and time step size is 0.001 s.

Table 1.
The physical properties of particles.
2.5. Grid Independence Verification
Structured grids are divided by ANSYS ICEM, as shown in Figure 3. For intensifying the mesh near the wall to make the calculation more accurate, the height of the first layer boundary mesh is 0.1 mm, y+ ≈ 1.4, and it expands from the first layer mesh at a ratio of 1.1.
The difference in the number and size of grids may lead to different calculation results. To ensure the accuracy of the numerical solution, the grid independence of the numerical solution is checked. This paper verifies the independence of the pressure drop of the physical model in the experimental section under a different number of grids with an inlet velocity of 3–10 m/s. As shown in Figure 4, as the number of grids increases from 3.2 w to 6.3 w, the relative error between the pressure drop in the experimental section and the number of left and right grids is within 7%. The grid number of 3.2 w is selected to save computational time without losing accuracy.
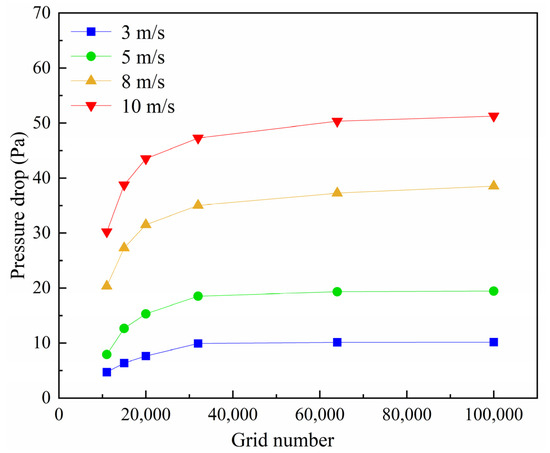
Figure 4.
Grid independence verification.
2.6. Characteristic Parameter
- (1)
- Collision rate
The collision between particles and the surface of fins is a prerequisite for particle deposition. This article introduces a collision rate to characterize the ability of fly ash transportation to reach the surface of the tube bundle; the expression is as follows:
where mimpact is the mass of particle impact on the wall; minject is total powder feeding mass, kg; and Qinject is the mass flow rate of particles;
- (2)
- Deposition rate
After particles collide with the wall, they do not always deposit. In this paper, the deposition rate is introduced to represent the tendency of particle deposition, and its expression is as follows:
- (3)
- Improved thermal resistance calculation
The average calculation of the thermal resistance of the fouling layer neglects the thickness difference on the fins and cannot reflect the impact of the non-uniformity of the fouling layer on the overall thermal resistance. This article simulates the deposition on the fins and obtains the deposition thickness of each node so it can calculate the thermal resistance of each node and sum it up to truly reflect the thermal resistance of the entire fin.
Figure 5 shows the fins on the tube, where heat is transferred from the tube to the fins, which then passes to the fouling layer and then to the air. The thermal resistance network is simplified, as shown in Figure 5. The fins are divided into parts according to nodes, and each node is divided into two layers. The thermal resistance of each layer of fins and fouling layer is calculated as:
where d is half of the fin thickness; δ is the deposition layer thickness in current node; s is an area of the current node, and λfouled and λfin are the thermal conductivities of the fouling layer and fin, respectively.
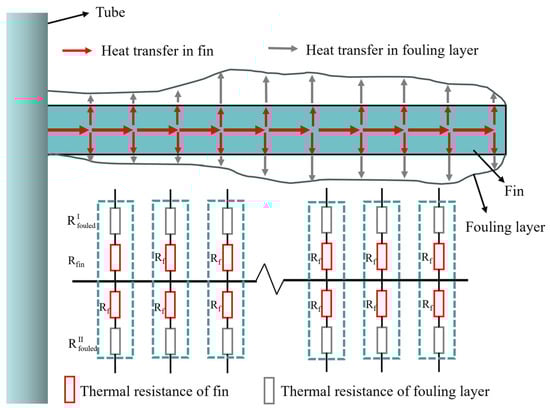
Figure 5.
Heat transfer and thermal resistance network of fins.
For the upper fins, heat is transferred from the fins to the dirt layer and then to the air, so the fin thermal resistance is connected in series with the fouling layer’s thermal resistance. The lower fins are the same. Therefore, the formula for calculating the total thermal resistance of the upper and lower fins covered with fouling layers is as follows:
Due to the simultaneous transfer of heat from the fins to both sides, the upper and lower thermal resistances are connected in parallel, and the thermal resistance of each node is as follows:
Heat is transmitted along the fins, and each node on the fins is connected in series, resulting in a total thermal resistance of the fins:
To compare the improved calculation with the average thickness calculation, the thickness in Formula (18) is replaced with the average thickness, and then brought into Formula (21) to obtain the fin thermal resistance calculated through the average thickness:
- (4)
- Efficiency of fin
Zhan [34] derived the formula for the fin efficiency on a plate fin-and-tube heat exchanger with a central tube. Although there are differences in fin forms in this article, the difference is not significant. Therefore, his formula is used to calculate the fin efficiency as follows:
where rb and re are the equivalent center tube diameter and equivalent fin radius, respectively, and 10 mm and 50 mm are taken, respectively; I0 and K0 are the first and second kind of modified Bessel function with order 0, respectively; mI and mII are the fin parameters of the upper and bottom fins, respectively; and the average thickness of the upper and lower fins is calculated as follows:
where ρp is the particle density; and are the particle deposition weight per unit area on the upper fin surface and bottom fin surface, respectively; and h is the surface heat transfer coefficient; this article takes 60.
3. Experimental Verification and Uncertainties
Experiments were conducted to verify the simulation model and result. Figure 6 shows the experimental system diagram. The frequency of the fan is changed by an electric cabinet, aiming to control the airspeed. The feed screw is installed at the inlet to feed the powder evenly, and the speed of the feed screw, namely the particle flow rate, is changed by the motor. The finned experimental section is visualized with acrylic plates, and strain gauges are installed below the fins to measure the deposition mass. The deposition mass, temperature, humidity, etc., are collected through the data collector. In addition, a separate weighing system was designed for secondary acquisition of the mass of particles deposited on the fin surface to ensure the accuracy of the measurements.
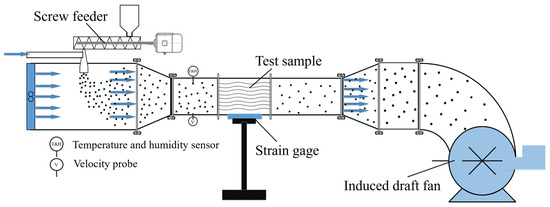
Figure 6.
Schematic diagram of particle deposition experimental platform.
The experiment was conducted under the conditions of air relative humidity of 37.7% and temperature of 25 °C, with air velocity of 3 m/s, 5 m/s, 8 m/s, and 10 m/s. In the actual environment, the particle concentration was relatively low, and the particle deposition time was longer. To reduce the experimental time, the powder concentration was increased to reduce the deposition time. To ensure that the experimental particle concentration was consistent with the simulation and to meet the sparse phase ratio requirement, a powder concentration of 5 g/m3 and mass flow rate of 3.38 × 10⁻⁴~1.13 × 10⁻³ kg/s were set.
This experiment required particle deposition mass, air-side pressure drop, and wind speed to be measured; wind speed and air-side pressure drop were measured by instrumentation, and particle deposition mass, air temperature, and relative humidity were obtained directly from the data collector, as well as secondary accurate measurements of particle deposition mass using an electronic analytical balance. The uncertainties of these directly measured parameters are shown in Table 2.
Table 2.
Uncertainties of direct measurements.
4. Results and Discussion
4.1. Experimental Verification Results
The photos of the fins and morphology of the simulation are shown in Figure 7. When the velocity is low, similar to the previous paragraph, fly ash is mainly deposited on the fins, and the fins are almost covered with dust. As the velocity increases, the effect of particle removal gradually increases. At the velocity of 10 m/s, there is less deposition on the fins, which is much cleaner than that at 3 m/s. The simulated deposition appearance is consistent with the experimental photos, showing an overall trend of decreasing deposition with increasing velocity. In addition, it is obvious that the deposition on the windward side is significantly higher than that on the leeward side due to the fact that air-carrying particles collide more with the windward side.
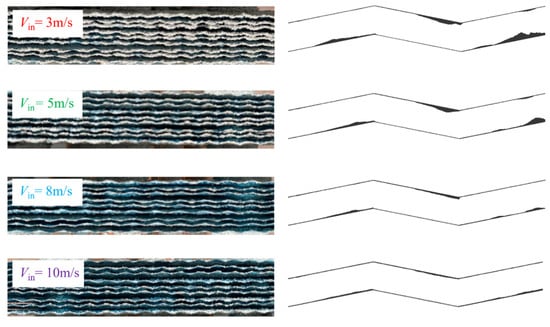
Figure 7.
Photos of fins and morphology of simulation.
Figure 8 illustrates that the deposition mass is proportional to time during the experimental period, which is similar to the result in the literature [11,39]. As the velocity increases, the deposition mass gradually decreases, and at 40 min, the deposition mass decreases from 11 g to 3 g. This is because when the velocity is low, the effect of particle removal is not obvious, and the behavior of particles after colliding with the wall is mainly deposition. As the velocity increases, particles not only do not deposit on the wall, but the effect of particle removal becomes more obvious. Therefore, the deposition mass of 8 m/s relative to 5 m/s decreases the most. As the velocity further increases, the removal effect has already occupied the main role, and there is no sudden change in deposition and removal. Therefore, 10 m/s relative to 8 m/s decreases less.
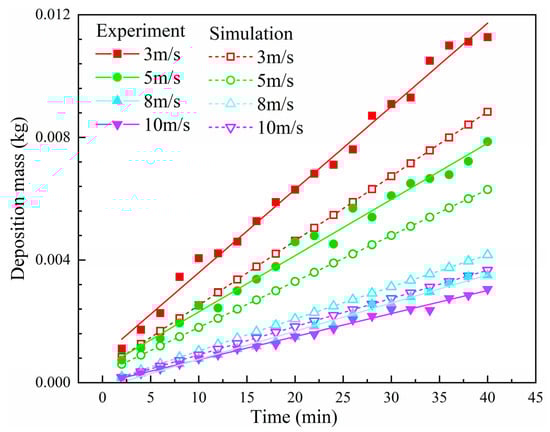
Figure 8.
Experimental and simulated deposition mass.
In addition, the simulated deposition mass is also shown in the figure, and the overall trend is the same as in the experiment. When the inlet velocity is 3 m/s, the average error between the experimental and simulated values is 34.4%. When the wind velocity is greater than 5 m/s, the error between the experimental and simulated values is about 17.35%, which is within the allowable range of error.
4.2. The Flow Characteristics and Particle Field Distribution
The motion of particles is influenced by the drag force exerted by the gas flow field. The gas velocity distribution between the heat-exchanger fins and the velocity vector distribution of the particles are shown in Figure 9. It can be seen that at different velocities, the velocity distribution inside the channel is similar, with zones of higher velocities concentrated at the center of the channel, and it can be clearly observed that the high-velocity range is closer to the peak of the fins at the turning point of the fins, so the airflow has a stronger erosion removal effect on the peak of the fins compared to other places.
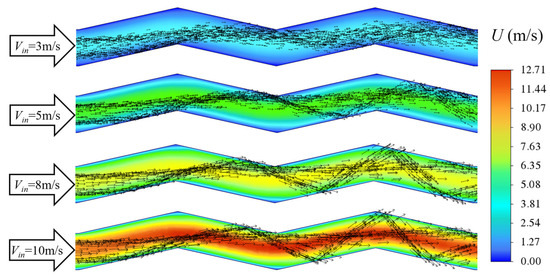
Figure 9.
Velocity distribution of the airflow and vector distribution of particles.
Figure 10 shows the particle distribution at different velocities. It can be clearly seen that the influence of the flow field on particle motion is different. As the force on particles is not proportional to the mass, the flow field has a greater impact on small particles at the same velocity. Therefore, small particles diffuse with the airflow and are more uniform in the flow channel, while large particles are more concentrated in distribution. As the speed increases, the rebound behavior of large particle-size particles on the wall becomes more obvious, making the deposition of subsequent fins different.
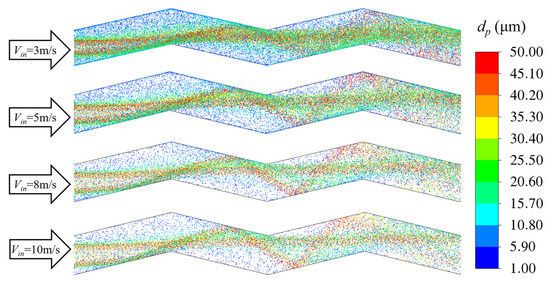
Figure 10.
Particle distribution of all particle sizes.
Due to fluent treating particles in the form of particle packages, the distribution of a certain particle cannot be viewed separately in multi-dispersed particle simulation. Therefore, four types of particles were simulated at a velocity of 3 m/s. From Figure 11, 1 μm particles are basically uniformly distributed throughout the entire flow channel. As the particle size increases, the particle distribution gradually concentrates, and the rebound behavior becomes more obvious. In addition, the particles of 30 μm were simulated, as shown in Figure 12. From this, it can be seen that the distribution of different particle sizes in the flow channel varies greatly, and there will also be significant differences in collision and deposition on the wall.
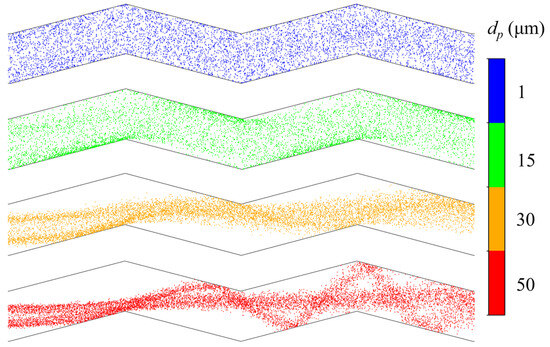
Figure 11.
Particle distribution of different particle sizes at 3 m/s.
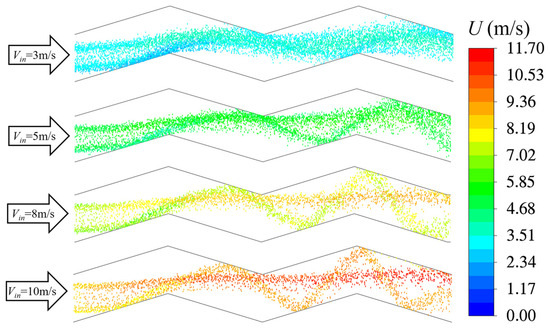
Figure 12.
Particle distribution of 30 μm at different velocities.
The different distribution of particles in the flow channel with airflow can lead to different collisions with fins. From Figure 13, both the particle collision rate and deposition rate increase with the increase in particle size, which is the same as the deposition rate on the floor in the literature [40]. This is because small particles are more easily affected by airflow and distributed throughout the entire flow channel, so only particles near the wall can collide and deposit. As the particle size increases, the particle distribution becomes more concentrated, resulting in a higher probability of collision with the wall and a higher deposition rate. It is worth noting that from Figure 12, it can be seen that due to the larger inertia of the 15 μm particles compared to the 1 μm particles, there are fewer back collisions compared to the 1 μm particles. In addition, due to the smaller inertia of the 15 μm particles compared to the 30 μm particles, the distribution is more average compared to the 30 μm particles. Therefore, at the velocities of 3 m/s and 5 m/s, the collision first decreases and then rises.
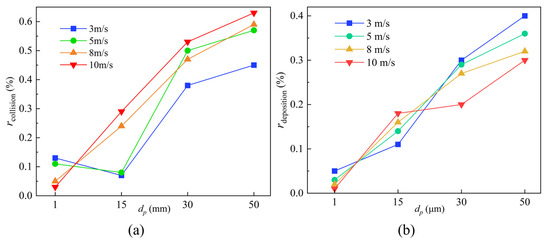
Figure 13.
(a) Collision rate and (b) Deposition rate at different velocities.
Figure 14 shows that the particle collision rate gradually increases with increasing velocity while the deposition rate decreases with increasing velocity and Reynolds. The reason is that as the velocity increases, the degree of turbulence increases, causing the flow between the fins to become more complex; particles are more easily carried and collide with the fins. The higher the gas velocity, the greater the collision kinetic energy of particles. The particles that collide with the surface of the fins have an erosive effect on the deposition layer particles, which not only does not cause deposition but may also erode small particles attached to the surface, causing a reverse reduction in particle deposition rate.
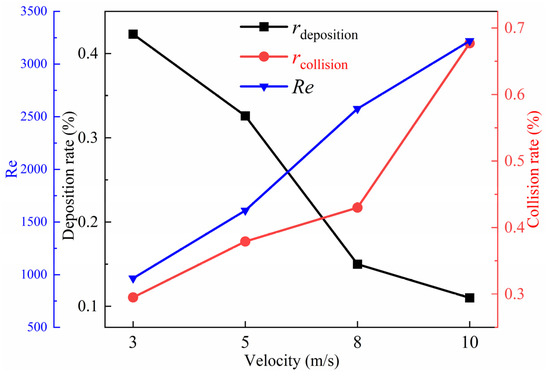
Figure 14.
Total collision rate and deposition rate.
4.3. The Effect of Flow Velocity on Deposition
Figure 15 shows the deposition mass distribution of particles with a diameter of 30 μm under various inlet velocities. The distribution of deposition in the first section is similar to that in the second section, which is the same as the discussion in the previous text. Similar to the pattern obtained in the previous section, the deposition distribution of particles with the same diameter also exhibits a transition from uneven distribution to uniform distribution under different velocities. The reason is that when the velocity (3 m/s, 5 m/s) is low, the deposition and removal area is uneven. The velocity of particles with small velocities can be quickly changed by the flow field, which can be carried to the middle of the windward side and deposited there. The velocity at the peak is higher, and the removal effect on particles is greater than that at other positions.
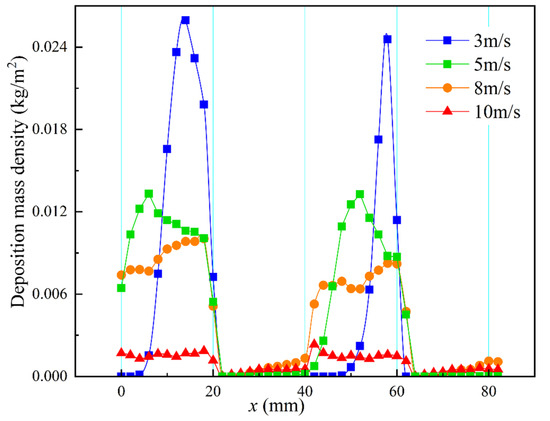
Figure 15.
Deposition mass distribution of 30 μm particles with various inlet velocity.
When the velocity is high (8 m/s, 10 m/s), the particle velocity is also high, and the particle inertia is large, resulting in a slower change in velocity. The middle of the windward side is greatly eroded by gas along the flow channel direction, and the removal at the wave peak is also large. Therefore, when the velocity is high, the particle distribution gradually becomes uniform. This is also the reason for the difference in deposition trends on the windward side. At low velocity (3 m/s, 5 m/s), it first increases and then decreases, and at 8 m/s, it continues to increase. At 10 m/s, the deposition distribution changes to uniform. This is consistent with the changes of distribution in the literature [41].
4.4. The Effect of Particle Size on Deposition
From the discussion in the previous text, it can be known that particle size also affects the movement and distribution of particles in the flow field, thus affecting the mass and location of deposition. To study the impact of particle size on the distribution of deposition, the simulation was carried out with different particle sizes respectively under the condition of 3 m/s velocity. The discussion in the above section shows that the deposition situation on the upper and lower fins is basically the same, so this section only analyzes the deposition situation on the lower fins.
As shown in Figure 16, for the 1 μm particles with uniform distribution and movement, whether on the windward or leeward side, the deposition is uniform, and there is no local excessive deposition mass. For larger particle sizes of 15 μm, the deposition distribution on the windward side is relatively uniform, while the deposition on the leeward side shows a gradual increase from zero. This is because the inertia of 15 μm particles is more than that of 1 μm, and the velocity direction does not immediately change when passing through the peak of the fin. Therefore, there is less deposition on the leeward side near the peak of the fin. After passing through the peak of the fin, the velocity gradually matches the airflow direction, and the distribution in the flow channel is also more uniform, so the particles gradually deposit at the rear end of the leeward side.
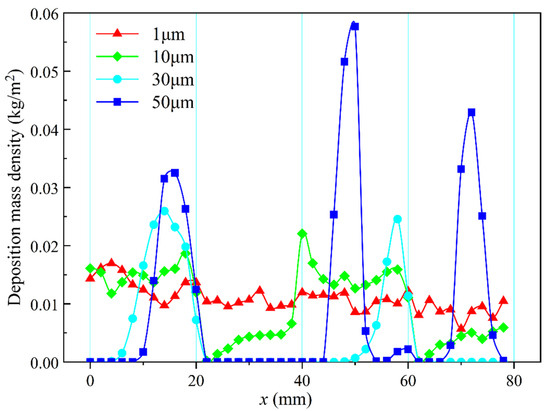
Figure 16.
Deposition mass distribution of several particles at 3 m/s.
Large particles of 30 μm and 50 μm with concentrated distribution have almost zero deposition mass near the beginning of the fins. From the midpoint of the windward surface to the wave peak, the deposition mass of particles increases sharply, while almost no deposition occurs on the leeward side. This is basically consistent with the conclusion of the study [42] on the deposition of circular pipes. This is because large particles have a large mass and less drag force, making it difficult to change their trajectory. When flowing from one section of the fin to another, they still follow the original velocity direction until encountering another windward side. The large particles are concentrated on the windward side, and that on the leeward side is almost zero. In addition, due to the special characteristic of the 50 μm particles rebound on the wall, the deposition mass in the second section reached a peak that other particles did not show, forming the last deposition peak of the lower fin in Figure 17.
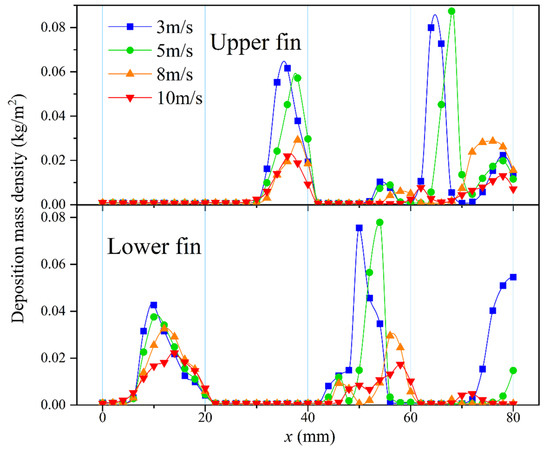
Figure 17.
Deposition distribution of multi-particles at different velocities.
The total deposition mass and converted mass of each particle size on the fins are shown in Figure 18. The conversion formula is as follows:
where Qtotal is the mass flow rate containing all particle sizes, Qi is the mass flow rate corresponding to the particle size, and Yi is the mass proportion of the corresponding particle size in Rosin–Rammler diameter distribution.
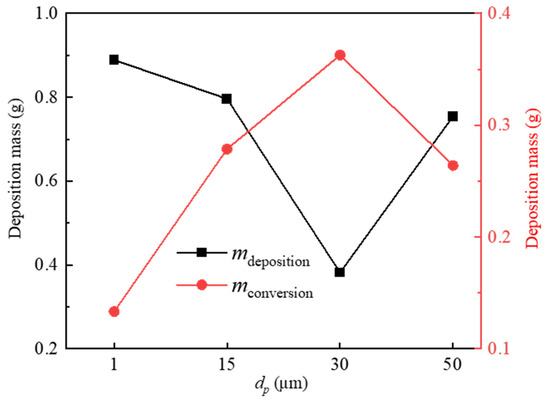
Figure 18.
Total mass and converted mass.
Before conversion, the deposition curve showed an initial decrease and then an increase, with 30 μm particles depositing the least. Due to ensuring the same volume density under single particle size conditions, the number of small particles was more than that of large particles, resulting in the largest deposition of 1 μm particles. However, due to the high collision and deposition rates of 50 μm particles and the relatively large particle mass, the deposition mass of 50 μm particles was greater than 30 μm. After conversion, the mass trend flipped and became higher before decreasing. The 30 μm particles have the highest deposition mass among all particles, partly due to their higher deposition and collision rates, and 30 μm is the average particle size, accounting for the largest proportion of all particles.
4.5. Deposition and Thermal Resistance Analysis of Multiple Particle Diameters on Fins
Due to differences in particle motion behavior and deposition rates, the distribution of deposition on the fins will naturally change. It can be clearly seen in Figure 17 that deposition was concentrated on the windward side. There was almost no deposition on the leeward side. The deposition mass on the upper and lower fins was staggered, with roughly the same trend and size. The peak value of deposition mass was cut down by 45% on the windward side of the first section of the lower fin and was cut down by 83% on the leeward side of the second section of the higher fin.
As the velocity increased, the influence of the flow field on particles gradually increased, and the distribution was closer to the centerline of the flow channel. Therefore, the deposition peak shifted to the right on the windward surface of the first section. On the second section of the fin, due to the gradually obvious rebound behavior of large particles, the distribution curves changed from unimodal to bimodal.
As shown in Figure 19, the trend of deposition changes on the upper and lower fins was the same, and the mass gradually decreased with velocity. The mass on the upper and lower fins decreased respectively by 66% and 59% from 3 m/s to 10 m/s, and the total deposition mass decreased by 62%.
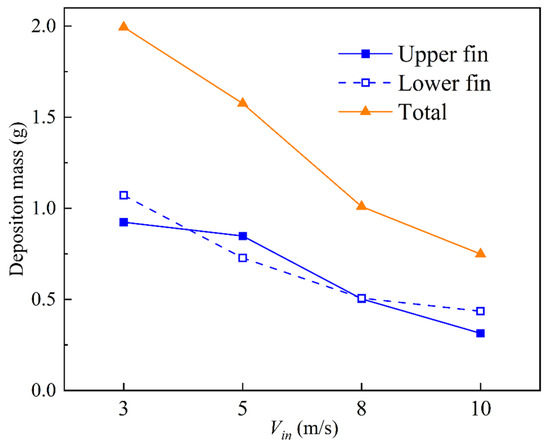
Figure 19.
Deposition mass of the entire fin.
The thermal resistance and efficiency were calculated and are shown in Figure 20. It can be seen that there was an inverse relationship between thermal resistance and efficiency. The thermal resistance decreased with the increase of inlet velocity, which is the same as what was found in the literature where the fouling degree decreased with increasing inlet velocity, leading to a decrease in thermal resistance as well [43,44], while the efficiency increased with the increase of inlet velocity. When the inlet velocity was increased from 3 m/s to 10 m/s, the thermal resistance decreased from 0.399 K/W to 0.187 K/W, while the efficiency increased from 61.59% to 70.41%.
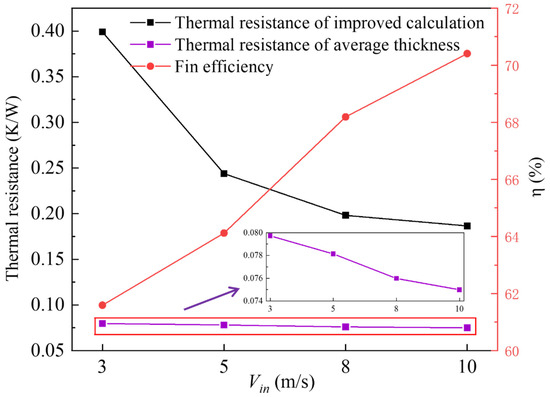
Figure 20.
Thermal resistance and efficiency of fins.
This is because as the velocity increased, the deposited mass on the fins decreased, the thickness of the fouling layer became thinner, and the fouling layer had less resistance to heat transfer, making it easier for heat to be transferred from the fins to the air. Due to the fact that the fin efficiency calculation uses average thickness, the trend of efficiency change was opposite to that of average thickness thermal resistance change.
From Figure 20, it can be seen that the change curve of the improved thermal resistance calculation was close to an exponential function. For 8 and 10 m/s, due to the similar distribution of dirt on the second fin, the thermal resistance changed little. For 3 and 5 m/s, the distribution of the fouling layer had a large peak, and the peak part had a significant impact on the thermal resistance, resulting in a large thermal resistance. Therefore, the influence of maximum thickness on thermal resistance far exceeded that of other locations, and averaging the thickness of the dirt layer smoothed out these differences, which were actually significant. The improved thermal resistance calculation method took into account the inconsistent deposition thickness at different locations, which better reflected the impact of uneven dirt layer thickness on thermal resistance.
5. Conclusions
This paper uses random functions to distinguish between clean surfaces and dirt layers and uses critical velocity and angle to determine particle deposition or removal. It simulates particle deposition on fins in fin-and-tube heat exchangers and explores the effects of velocity and particle diameter. The main conclusions are as follows:
- (1)
- Random function is used to improve the existing fly ash particle deposition model. The improved model’s simulation results are compared to relevant experimental data, verifying the model’s accuracy.
- (2)
- The flow field between fins and the motion of particles is analyzed. The distribution of the flow field is similar, with zones of higher velocities distributed at the center of the flow channel; small particles fill the entire flow channel, while large particles are concentrated and distributed; and the collision rate and deposition rate increase with the increase of particle size.
- (3)
- For 30 μm particles, as the velocity increases, the deposition on the fins becomes less and more uniform; at 3 m/s, small particles deposit uniformly, while large particles deposit in a concentrated way to form peaks. When a certain particle size is introduced separately, there is a situation where small particles deposit more. When converted to all particle sizes, the situation flips.
- (4)
- For multi-particles, the deposition positions of the upper and lower fins are staggered. The deposition on the windward side is obviously more than that on the leeward side. With the increase in flow velocity, the thickness of the deposition layer decreases, and the maximum value of the deposition mass gradually decreases. Furthermore, the mass distribution curve changes from unimodal to bimodal.
- (5)
- The thermal resistance of the average and improved methods and efficiency were calculated. Due to the efficiency being calculated with average thickness, the trend is similar to that of average thickness thermal resistance. A comparison was made between the average thickness and the improved method of thermal resistance, and it was found that the improved method better reflects the overall impact of uneven thermal resistance.
Author Contributions
W.X.: Conceptualization, Methodology, Software, Validation, Writing—Review and Editing. S.Z.: Conceptualization, Methodology, Software, Writing—Original Draft, Validation. Q.Y.: Methodology, Software, Writing—Original Draft, Validation. L.Z. (Lei Zhang): Writing—Original Draft, Writing—Review and Editing, Supervision. C.G.: Writing—Original Draft, Writing—Review and Editing. A.W.: Writing—Original Draft. S.B.: Conceptualization, Writing—Review and Editing. W.L.: Conceptualization, Supervision. L.Z. (Lin Zhang): Validation, Writing—Review and Editing. All authors have read and agreed to the published version of the manuscript.
Funding
This research was funded by the National Natural Science Foundation of China (Grant No. 52201352) and by Jiangsu Province Industry–University–Research Cooperation Project (Grant No. BY20230838) and Changzhou Sci and Tech Program (Grant No. CJ20235024).
Data Availability Statement
The original contributions presented in the study are included in the article, further inquiries can be directed to the corresponding author.
Conflicts of Interest
Author Weibing Lv was employed by the Changzhou Withon GreenTech Co., Ltd. The remaining authors declare that the research was conducted in the absence of any commercial or financial relationships that could be construed as a potential conflict of interest.
References
- Vosough, A.; Assari, M.R.; Peyghambarzadeh, S.M.; Azizi, S. Influence of fluid flow rate on the fouling resistance of calcium sulfate aqueous solution in subcooled flow boiling condition. Int. J. Therm. Sci. 2020, 154, 106397. [Google Scholar] [CrossRef]
- Ahn, Y.; Cheong, S.; Jung, Y.; Lee, J. An Experimental Study of the Air-Side Particulate Fouling in Fin-and-Tube Heat Exchangers of Air Conditioners. Int. Refrig. Air Cond. Conf. 2003, 20, 873–877. [Google Scholar] [CrossRef][Green Version]
- Kaiser, S.; Antonijevic, D.; Tsotsas, E. Formation of fouling layers on a heat exchanger element exposed to warm, humid and solid loaded air streams. Exp. Therm. Fluid Sci. 2002, 26, 291–297. [Google Scholar] [CrossRef]
- Soltani, M.; Ahmadi, G. On particle adhesion and removal mechanisms in turbulent flows. J. Adhes. Sci. Technol. 1994, 8, 763–785. [Google Scholar] [CrossRef]
- Brach, R.M.; Dunn, P.F. A Mathematical Model of the Impact and Adhesion of Microsphers. Aerosol Sci. Technol. 1992, 16, 51–64. [Google Scholar] [CrossRef]
- Konstandopoulos, A.G. Particle sticking/rebound criteria at oblique impact. J. Aerosol Sci. 2006, 37, 292–305. [Google Scholar] [CrossRef]
- El-Batsh, H. Modeling Particle Deposition on Compressor and Turbine Blade Surfaces. Ph.D. Thesis, Vienna University of Technology, Vienna, Austria, September 2001. [Google Scholar]
- Herterich, J.G.; Griffiths, I.M. A mathematical model of the erosion process in a channel bend. Tribol. Int. 2021, 163, 107175. [Google Scholar] [CrossRef]
- Bohnet, M. Fouling of heat transfer surfaces. Chem. Eng. Technol.-CET 1987, 10, 113–125. [Google Scholar] [CrossRef]
- Paz, C.; Suárez, E.; Eirís, A.; Porteiro, J. Development of a Predictive CFD Fouling Model for Diesel Engine Exhaust Gas Systems. Heat Transf. Eng. 2013, 34, 674–682. [Google Scholar] [CrossRef]
- Li, J.; Xu, Z.; Han, Z. A practical Eulerian approach for predicting the deposition characteristics of fly ash particles on the outer surface of tubes. Int. J. Heat Mass Transf. 2022, 189, 122654. [Google Scholar] [CrossRef]
- Jiang, H.; Lu, L.; Sun, K. Simulation of particle deposition in ventilation duct with a particle–wall impact model. Build. Environ. 2010, 45, 1184–1191. [Google Scholar] [CrossRef]
- Pan, Y.; Si, F.; Xu, Z.; Romero, C.E. An integrated theoretical fouling model for convective heating surfaces in coal-fired boilers. Powder Technol. 2011, 210, 150–156. [Google Scholar] [CrossRef]
- Wang, Y.C.; Tang, G.H. Numerical investigation on the coupling of ash deposition and acid vapor condensation on the H-type fin tube bank. Appl. Therm. Eng. 2018, 139, 524–534. [Google Scholar] [CrossRef]
- Zhang, Y.; Du, X.; Yue, M.; Yan, M.; Shi, Y. Heat transfer and ash deposition performance of heat exchange surface in waste incineration flue gas. Int. J. Heat Mass Transf. 2020, 155, 119691. [Google Scholar] [CrossRef]
- Zhan, F.; Ding, G.; Zhuang, D. Numerical model of particle deposition on wet fin surfaces of heat exchanger under dehumidifying conditions. Int. J. Heat Mass Transf. 2020, 149, 119258. [Google Scholar] [CrossRef]
- Liu, P.; Liu, W.; Gong, K.; Han, C.; Zhang, H.; Sui, Z.; Hu, R. Numerical Study on Particulate Fouling Characteristics of Flue with a Particulate Fouling Model Considering Deposition and Removal Mechanisms. Energies 2022, 15, 8708. [Google Scholar] [CrossRef]
- Han, Z.; Yang, X.; Li, J.; Xu, Z. A waste heat exchanger fly ash particle deposition model with dynamic mesh and random function method. Case Stud. Therm. Eng. 2022, 40, 102502. [Google Scholar] [CrossRef]
- García Pérez, M.; Vakkilainen, E.; Hyppänen, T. 2D dynamic mesh model for deposit shape prediction in boiler banks of recovery boilers with different tube spacing arrangements. Fuel 2015, 158, 139–151. [Google Scholar] [CrossRef]
- Xu, Z.; Li, J.; Han, Z.; Yang, X. Investigation of deposition characteristics on tube-bundle heat exchanger with an improved ash particle model. Powder Technol. 2023, 413, 118027. [Google Scholar] [CrossRef]
- Guo, Z.; Li, N.; Klemeš, J.J.; Wang, Q.; Zeng, M. Mechanisms and strategies for ash deposition reduction in flue gas heat exchanger. Clean Technol. Environ. Policy 2021, 24, 77–93. [Google Scholar] [CrossRef]
- Tang, S.-Z.; He, Y.-L.; Wang, F.-L.; Tao, Y.-B. Parametric study on fouling mechanism and heat transfer characteristics of tube bundle heat exchangers for reducing fouling considering the deposition and removal mechanisms. Fuel 2018, 211, 301–311. [Google Scholar] [CrossRef]
- Zhang, F.; Liu, Z.; Liu, Z.; Liu, Y. Experimental Study of Particle Deposition on Surface at Different Mainstream Velocity and Temperature. Energies 2019, 12, 747. [Google Scholar] [CrossRef]
- Bell, I.H.; Groll, E.A. Air-side particulate fouling of microchannel heat exchangers: Experimental comparison of air-side pressure drop and heat transfer with plate-fin heat exchanger. Appl. Therm. Eng. 2011, 31, 742–749. [Google Scholar] [CrossRef]
- Chen, X.; Ji, X.; Feng, J.; Heng, L.; Zhao, L. Laboratory Study on Adhesive Ash Deposition Characteristics of Ammonium Bisulfate in Conditions Simulating an Air Preheater for Hard Coal Combustion. Energies 2023, 16, 6513. [Google Scholar] [CrossRef]
- Mason, D.; Douch, N.; Heikal, M. Air Side Fouling of Compact Heat Exchangers. In Proceedings of the 2nd IMechE Automobile Division Southern Centre Conference on Total Vehicle Technology, Brighton, UK, 11–12 November 2002; pp. 131–144. [Google Scholar]
- Nagendra, K.; Tafti, D.K.; Viswanathan, A.K. Modeling of soot deposition in wavy-fin exhaust gas recirculator coolers. Int. J. Heat Mass Transf. 2011, 54, 1671–1681. [Google Scholar] [CrossRef]
- Han, Z.; Xu, Z.; Yu, X.; Sun, A.; Li, Y. Numerical simulation of ash particles deposition in rectangular heat exchange channel. Int. J. Heat Mass Transf. 2019, 136, 767–776. [Google Scholar] [CrossRef]
- Välikangas, T.; Hærvig, J.; Kuuluvainen, H.; Dal Maso, M.; Peltonen, P.; Vuorinen, V. Deposition of dry particles on a fin-and-tube heat exchanger by a coupled soft-sphere DEM and CFD. Int. J. Heat Mass Transf. 2020, 149, 119046. [Google Scholar] [CrossRef]
- Lu, H.; Wang, Y.; Li, H.; Zhao, W. Numerical Simulation of Turbulent Structure and Particle Deposition in a Three-Dimensional Heat Transfer Pipe with Corrugation. Energies 2024, 17, 321. [Google Scholar] [CrossRef]
- Aziz, A.; Luardini, V. Analytical and numerical modeling of steady periodic heat transfer in extended surfaces. Comput. Mech. 1994, 14, 387–410. [Google Scholar] [CrossRef]
- Tseng, J.-K.; Shih, C.-L.; Wu, W.-J. Analysis of transient heat transfer in straight fins of various shapes with its base subjected to a decayed exponential function of time in heat flux. Comput. Struct. 1993, 47, 289–297. [Google Scholar]
- Atouei, S.A.; Hosseinzadeh, K.; Hatami, M.; Ghasemi, S.E.; Sahebi, S.A.R.; Ganji, D.D. Heat transfer study on convective–radiative semi-spherical fins with temperature-dependent properties and heat generation using efficient computational methods. Appl. Therm. Eng. 2015, 89, 299–305. [Google Scholar] [CrossRef]
- Zhan, F.; Zhuang, D.; Ding, G. An analytical model for predicting the particle-deposited fin efficiency. Int. J. Refrig. 2018, 92, 235–245. [Google Scholar] [CrossRef]
- Zheng, Z.; Yang, W.; Cai, Y.; Wang, Q.; Zeng, G. Dynamic simulation on ash deposition and heat transfer behavior on a staggered tube bundle under high-temperature conditions. Energy 2020, 190, 116390. [Google Scholar] [CrossRef]
- Ai, W.; Kuhlman, J.M. Simulation of Coal Ash Particle Deposition Experiments. Energy Fuels 2011, 25, 708–718. [Google Scholar] [CrossRef]
- Zhou, H.; Zhang, K.; Li, Y.; Zhang, J.; Zhou, M. Simulation of ash deposition in different furnace temperature with a 2D dynamic mesh model. J. Energy Inst. 2019, 92, 1743–1756. [Google Scholar] [CrossRef]
- Hong, W.; Wang, B.; Zheng, J. Numerical study on the influence of fine particle deposition characteristics on wall roughness. Powder Technol. 2020, 360, 120–128. [Google Scholar] [CrossRef]
- Tang, S.-Z.; Wang, F.-L.; Ren, Q.; He, Y.-L. Fouling characteristics analysis and morphology prediction of heat exchangers with a particulate fouling model considering deposition and removal mechanisms. Fuel 2017, 203, 725–738. [Google Scholar] [CrossRef]
- Lu, H.; Quan, Y. A CFD study of particle deposition in three-dimensional heat exchange channel based on an improved deposition model. Int. J. Heat Mass Transf. 2021, 178, 121633. [Google Scholar] [CrossRef]
- Yuan, S.; Fan, Y.; Chen, B.; Li, J.; Gao, L.; Zhang, S. Forming and stripping of the wall film and the influence on gas–liquid separation. Asia-Pac. J. Chem. Eng. 2020, 15, e2447. [Google Scholar] [CrossRef]
- Fu, L.; Liu, P.; Li, G. Numerical investigation on ash fouling characteristics of flue gas heat exchanger. Appl. Therm. Eng. 2017, 123, 891–900. [Google Scholar] [CrossRef]
- Wang, F.-L.; He, Y.-L.; Tong, Z.-X.; Tang, S.-Z. Real-time fouling characteristics of a typical heat exchanger used in the waste heat recovery systems. Int. J. Heat Mass Transf. 2017, 104, 774–786. [Google Scholar] [CrossRef]
- Wang, F.-L.; He, Y.-L.; Tang, S.-Z.; Tong, Z.-X. Parameter study on the fouling characteristics of the H-type finned tube heat exchangers. Int. J. Heat Mass Transf. 2017, 112, 367–378. [Google Scholar] [CrossRef]


Disclaimer/Publisher’s Note: The statements, opinions and data contained in all publications are solely those of the individual author(s) and contributor(s) and not of MDPI and/or the editor(s). MDPI and/or the editor(s) disclaim responsibility for any injury to people or property resulting from any ideas, methods, instructions or products referred to in the content. |
© 2024 by the authors. Licensee MDPI, Basel, Switzerland. This article is an open access article distributed under the terms and conditions of the Creative Commons Attribution (CC BY) license (https://creativecommons.org/licenses/by/4.0/).