
An Enhanced Forecasting Method of Daily Solar Irradiance in Southwestern France: A Hybrid Nonlinear Autoregressive with Exogenous Inputs with Long Short-Term Memory Approach


Abstract
:1. Introduction
2. Related Works
3. Materials and Methods
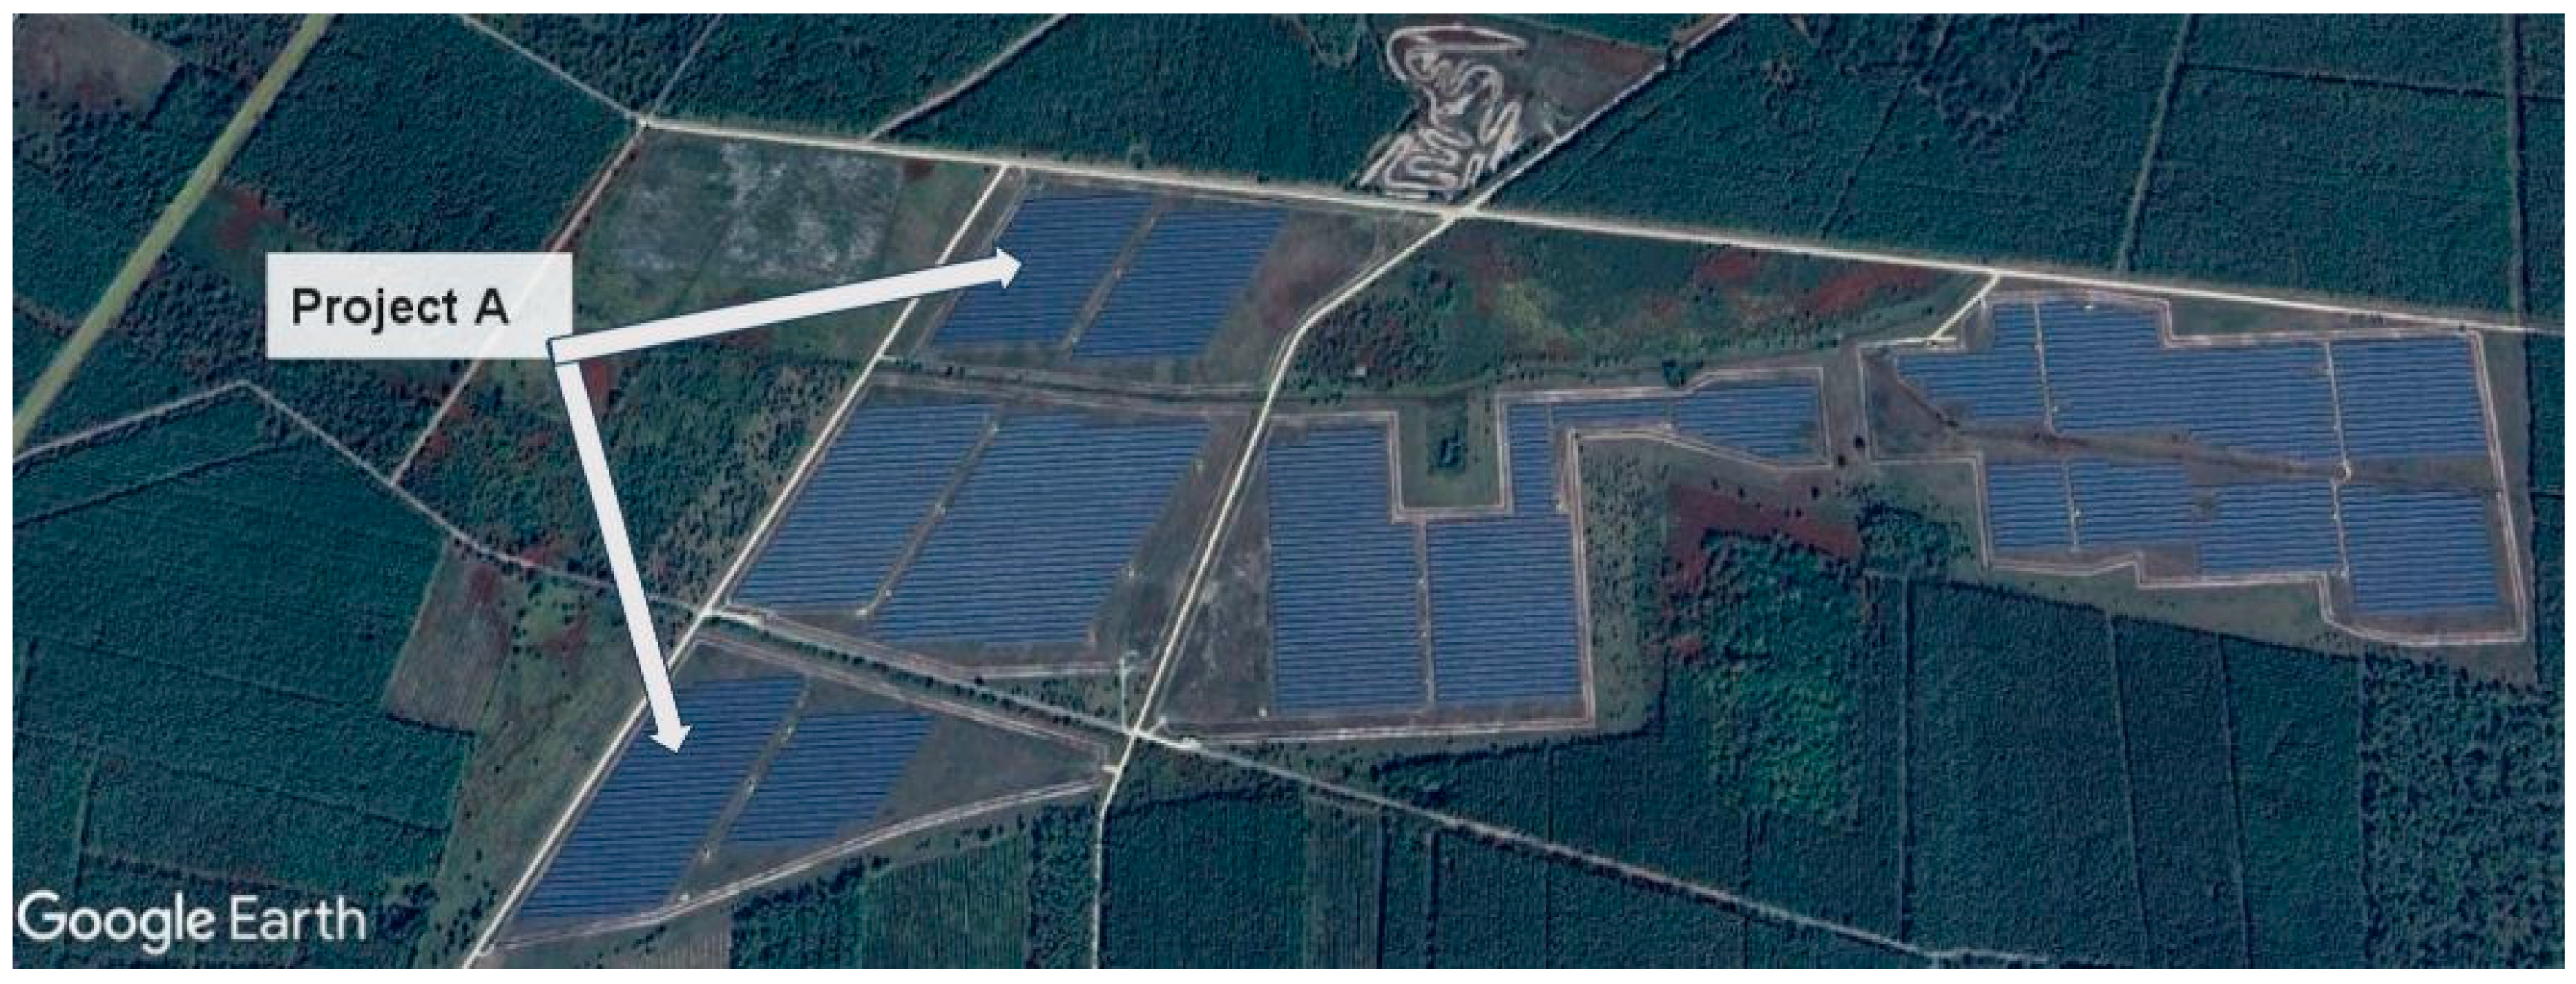
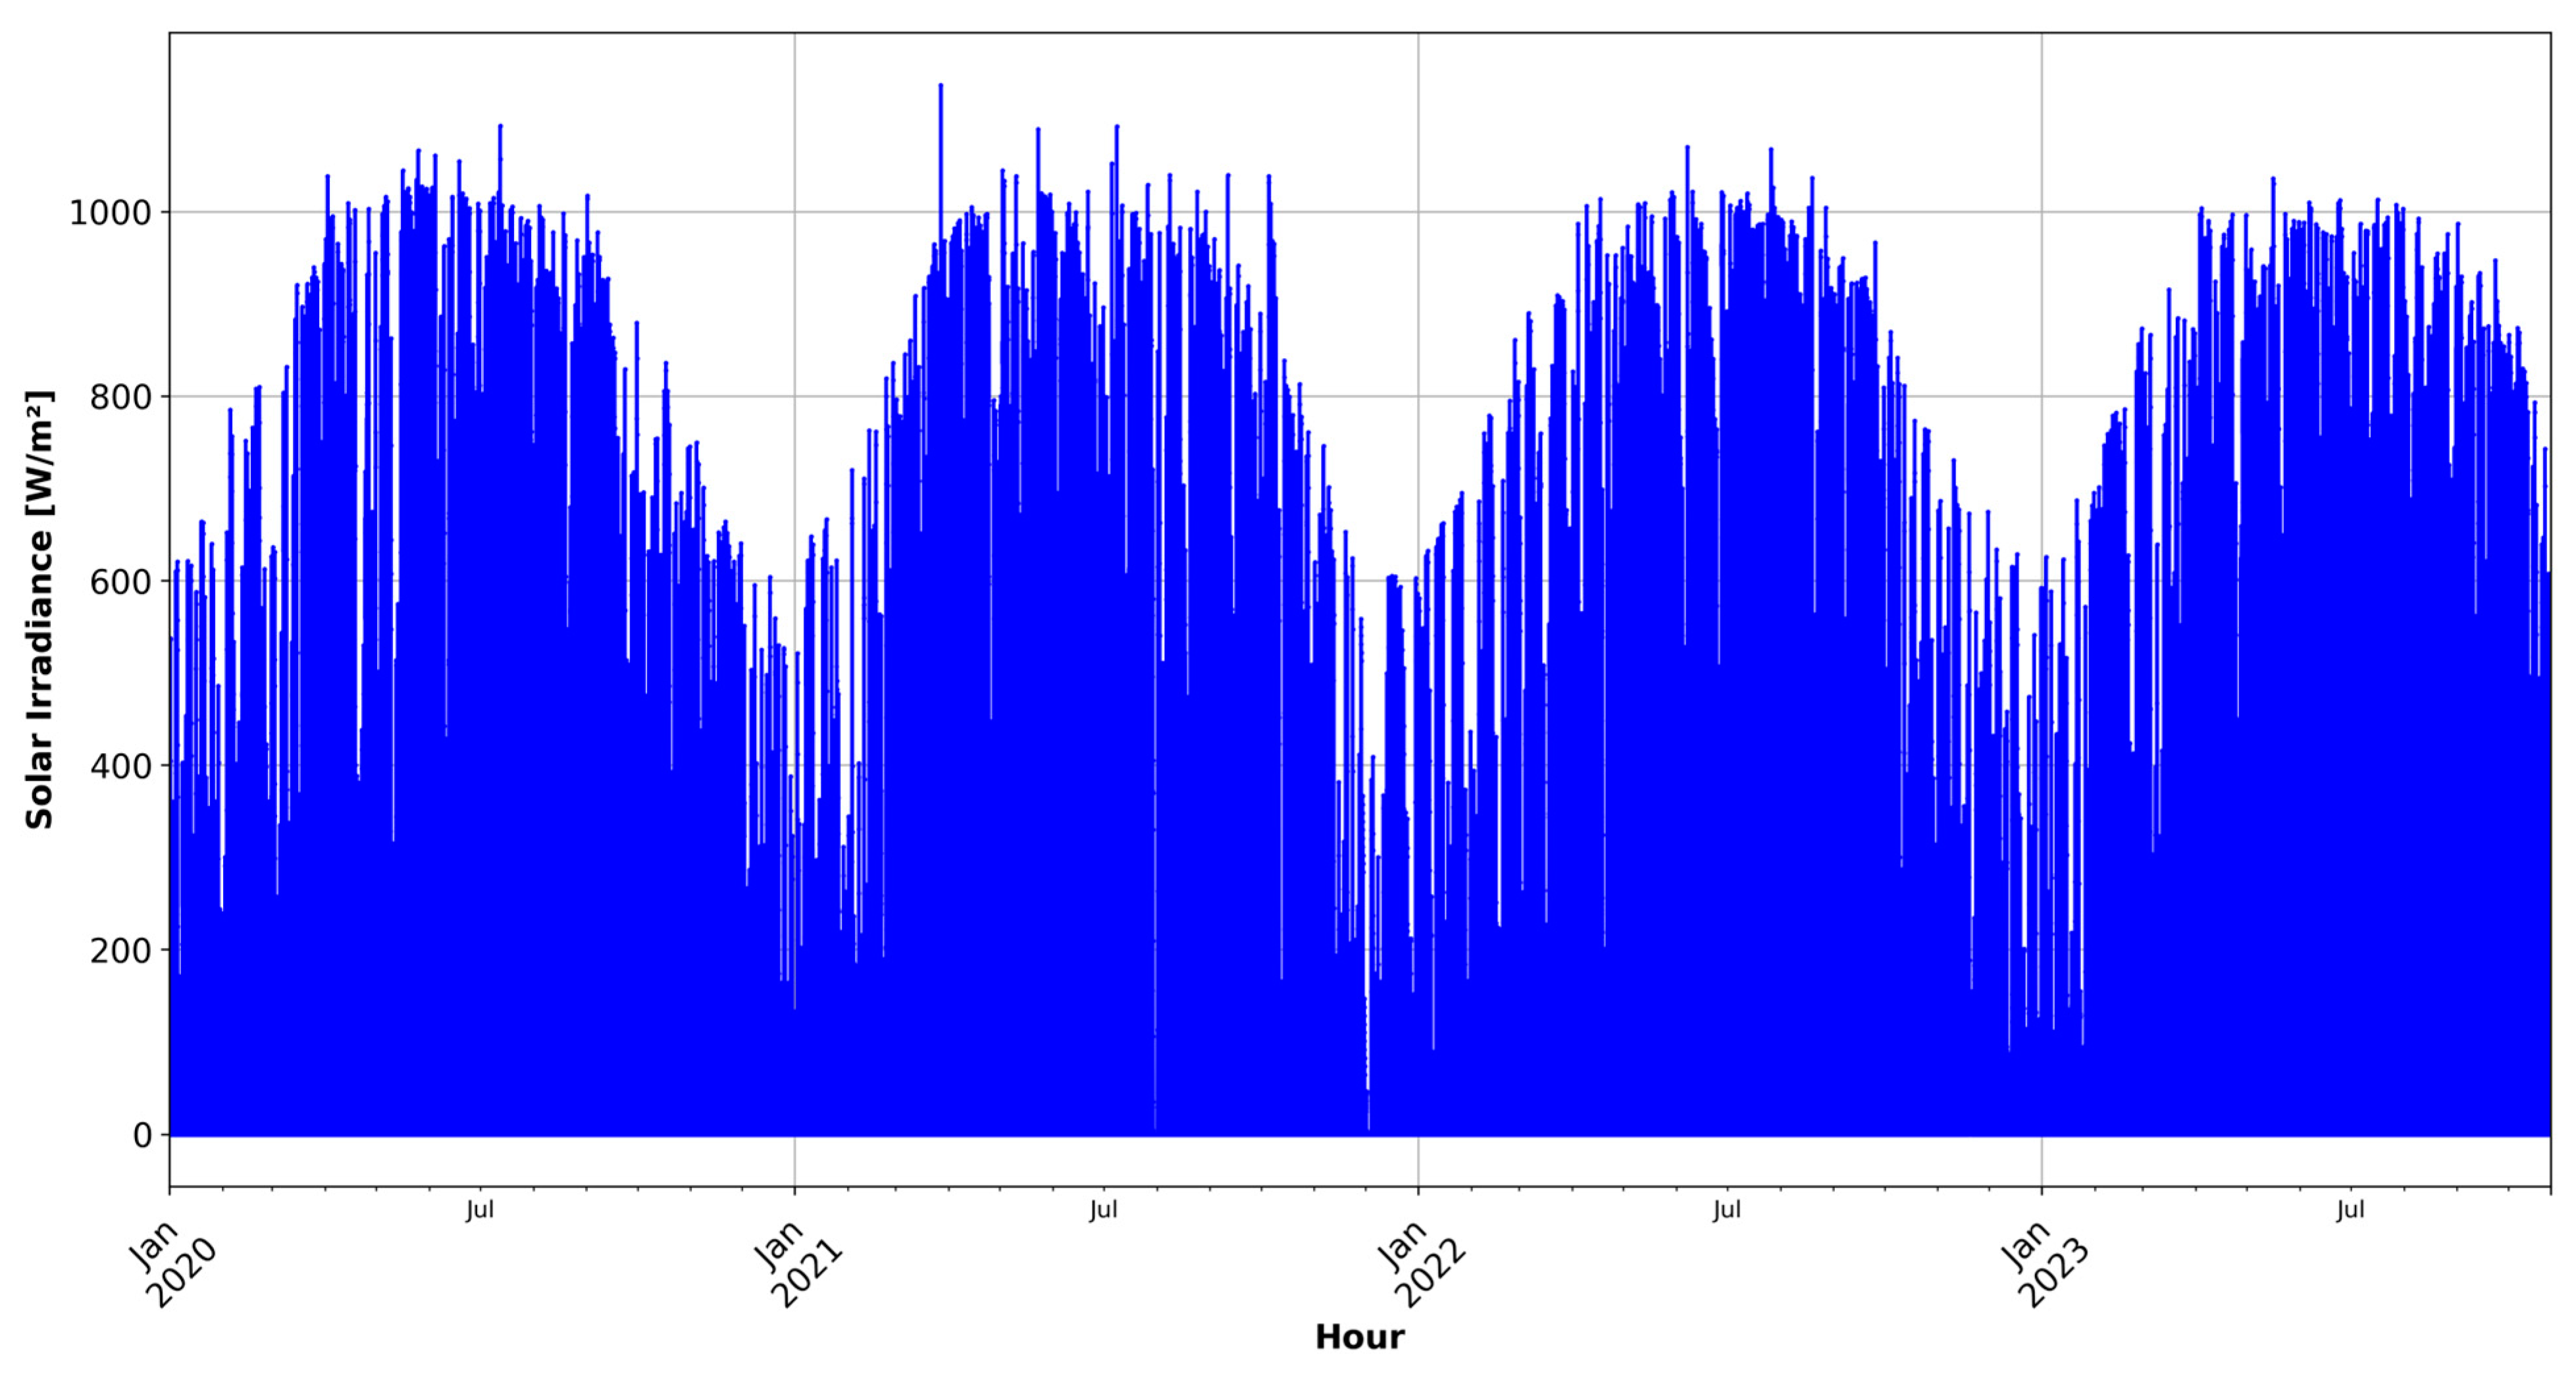
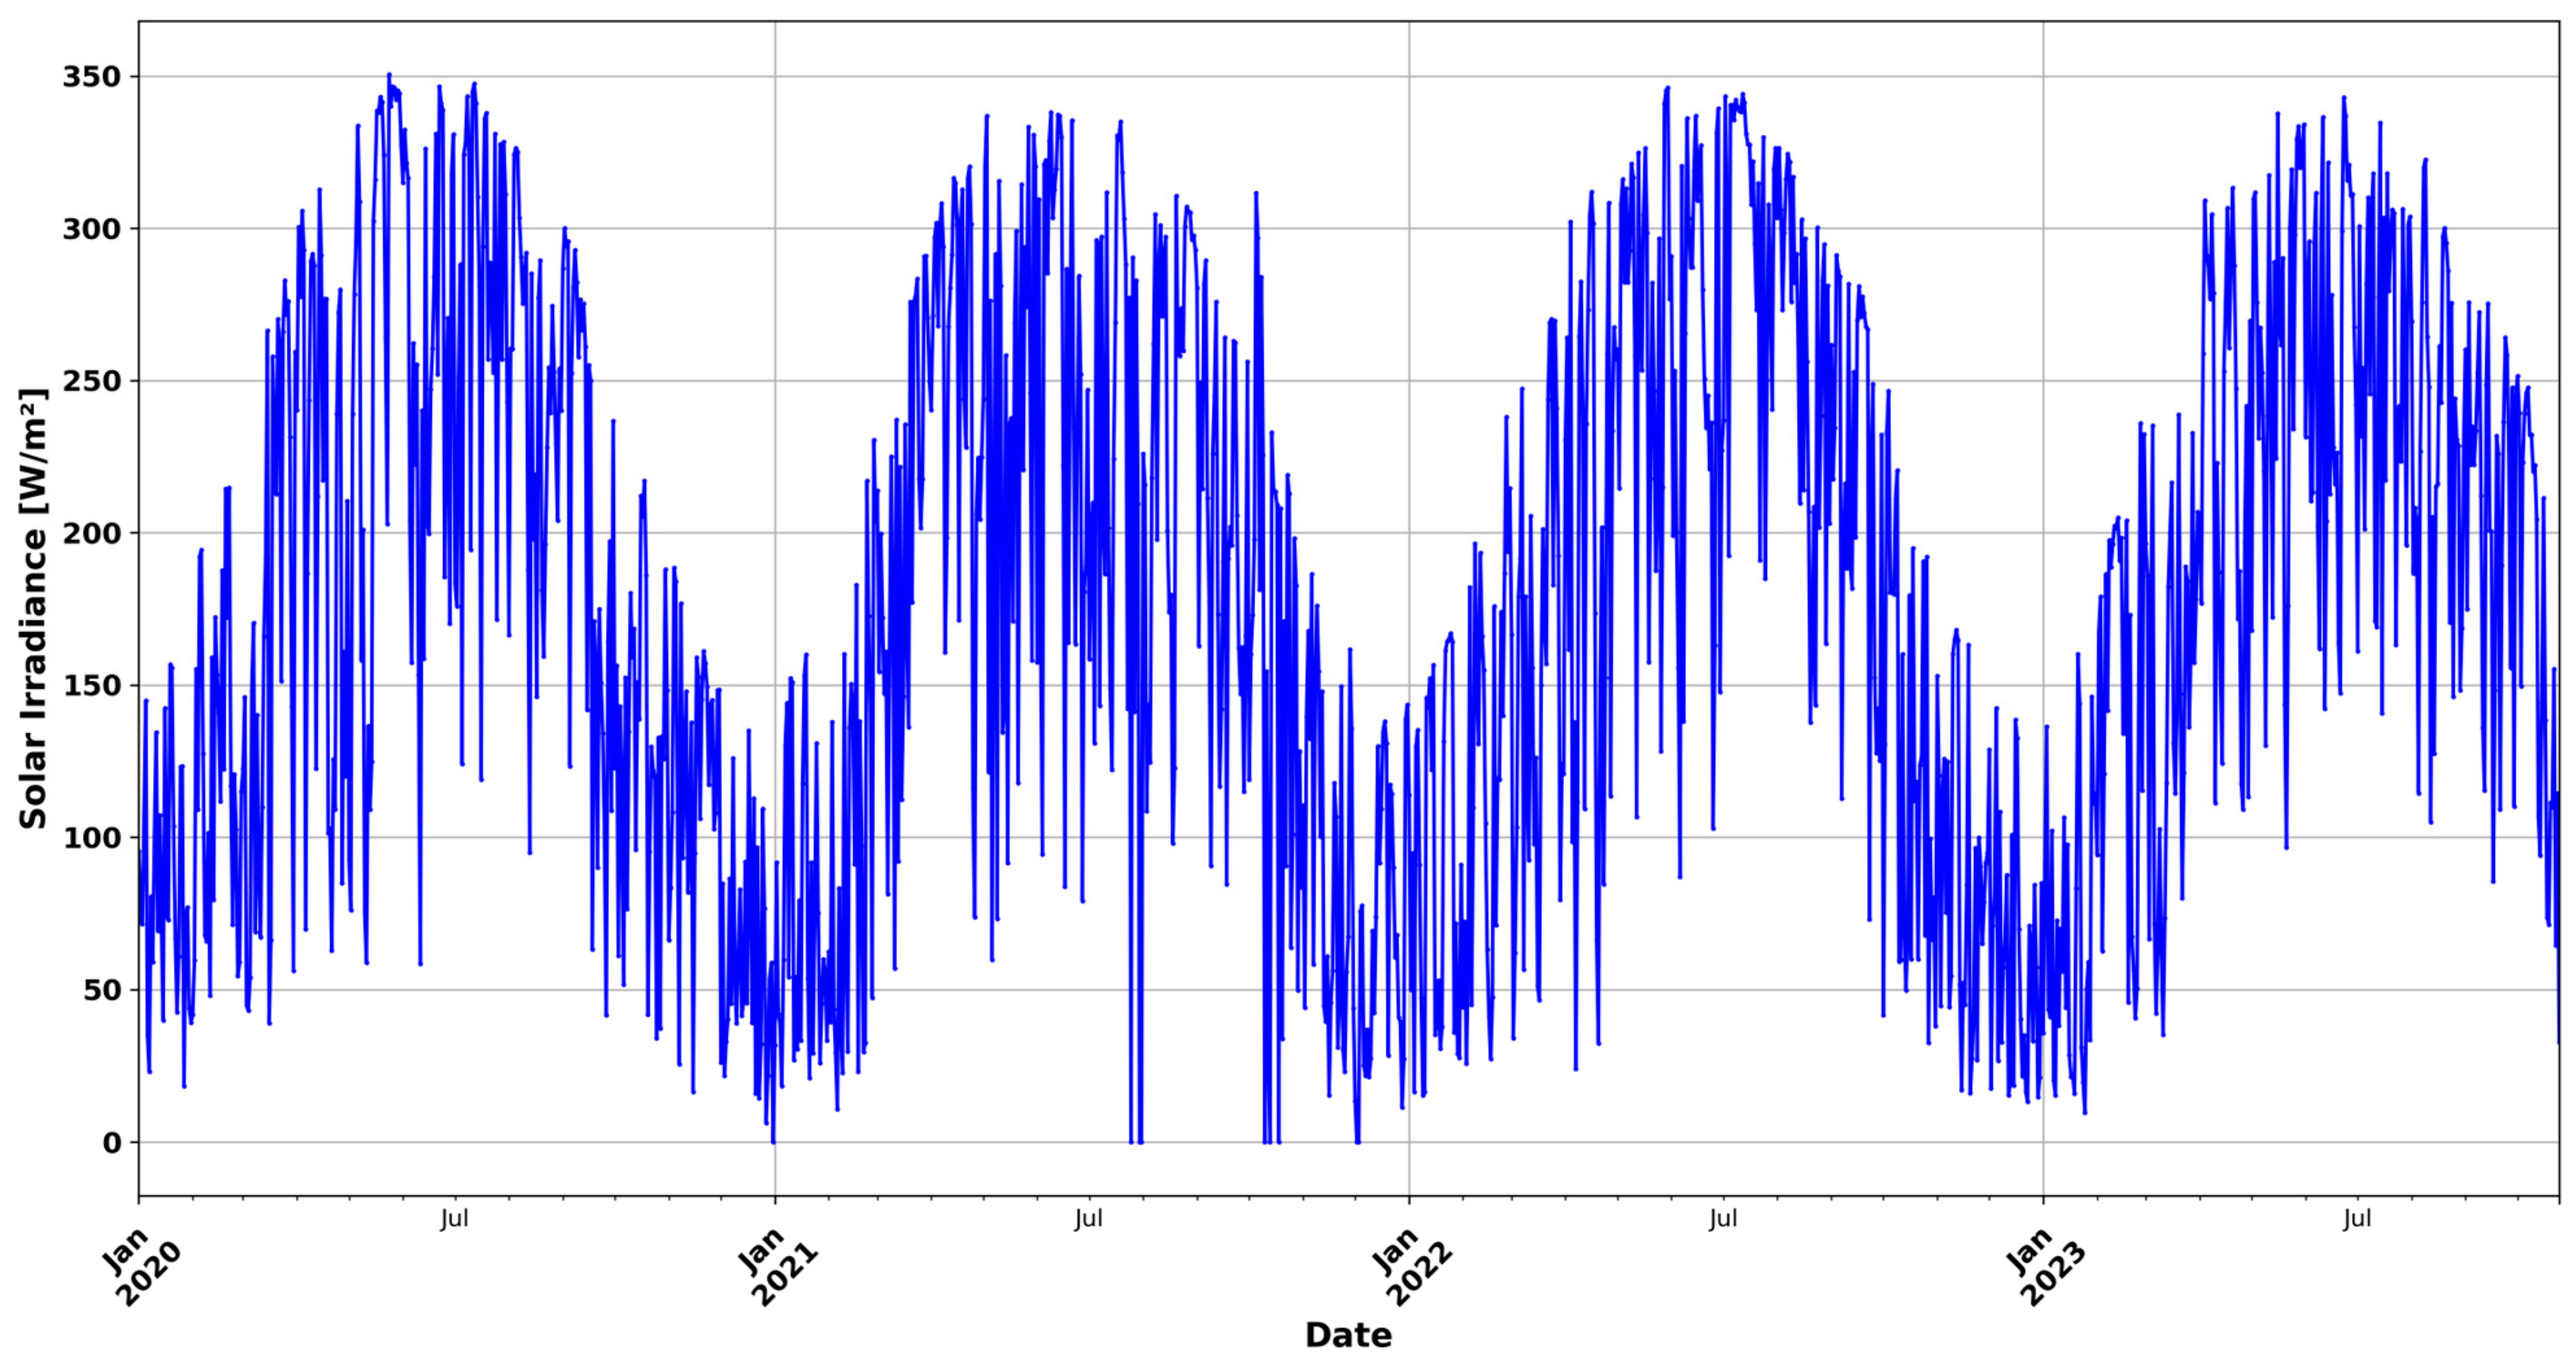
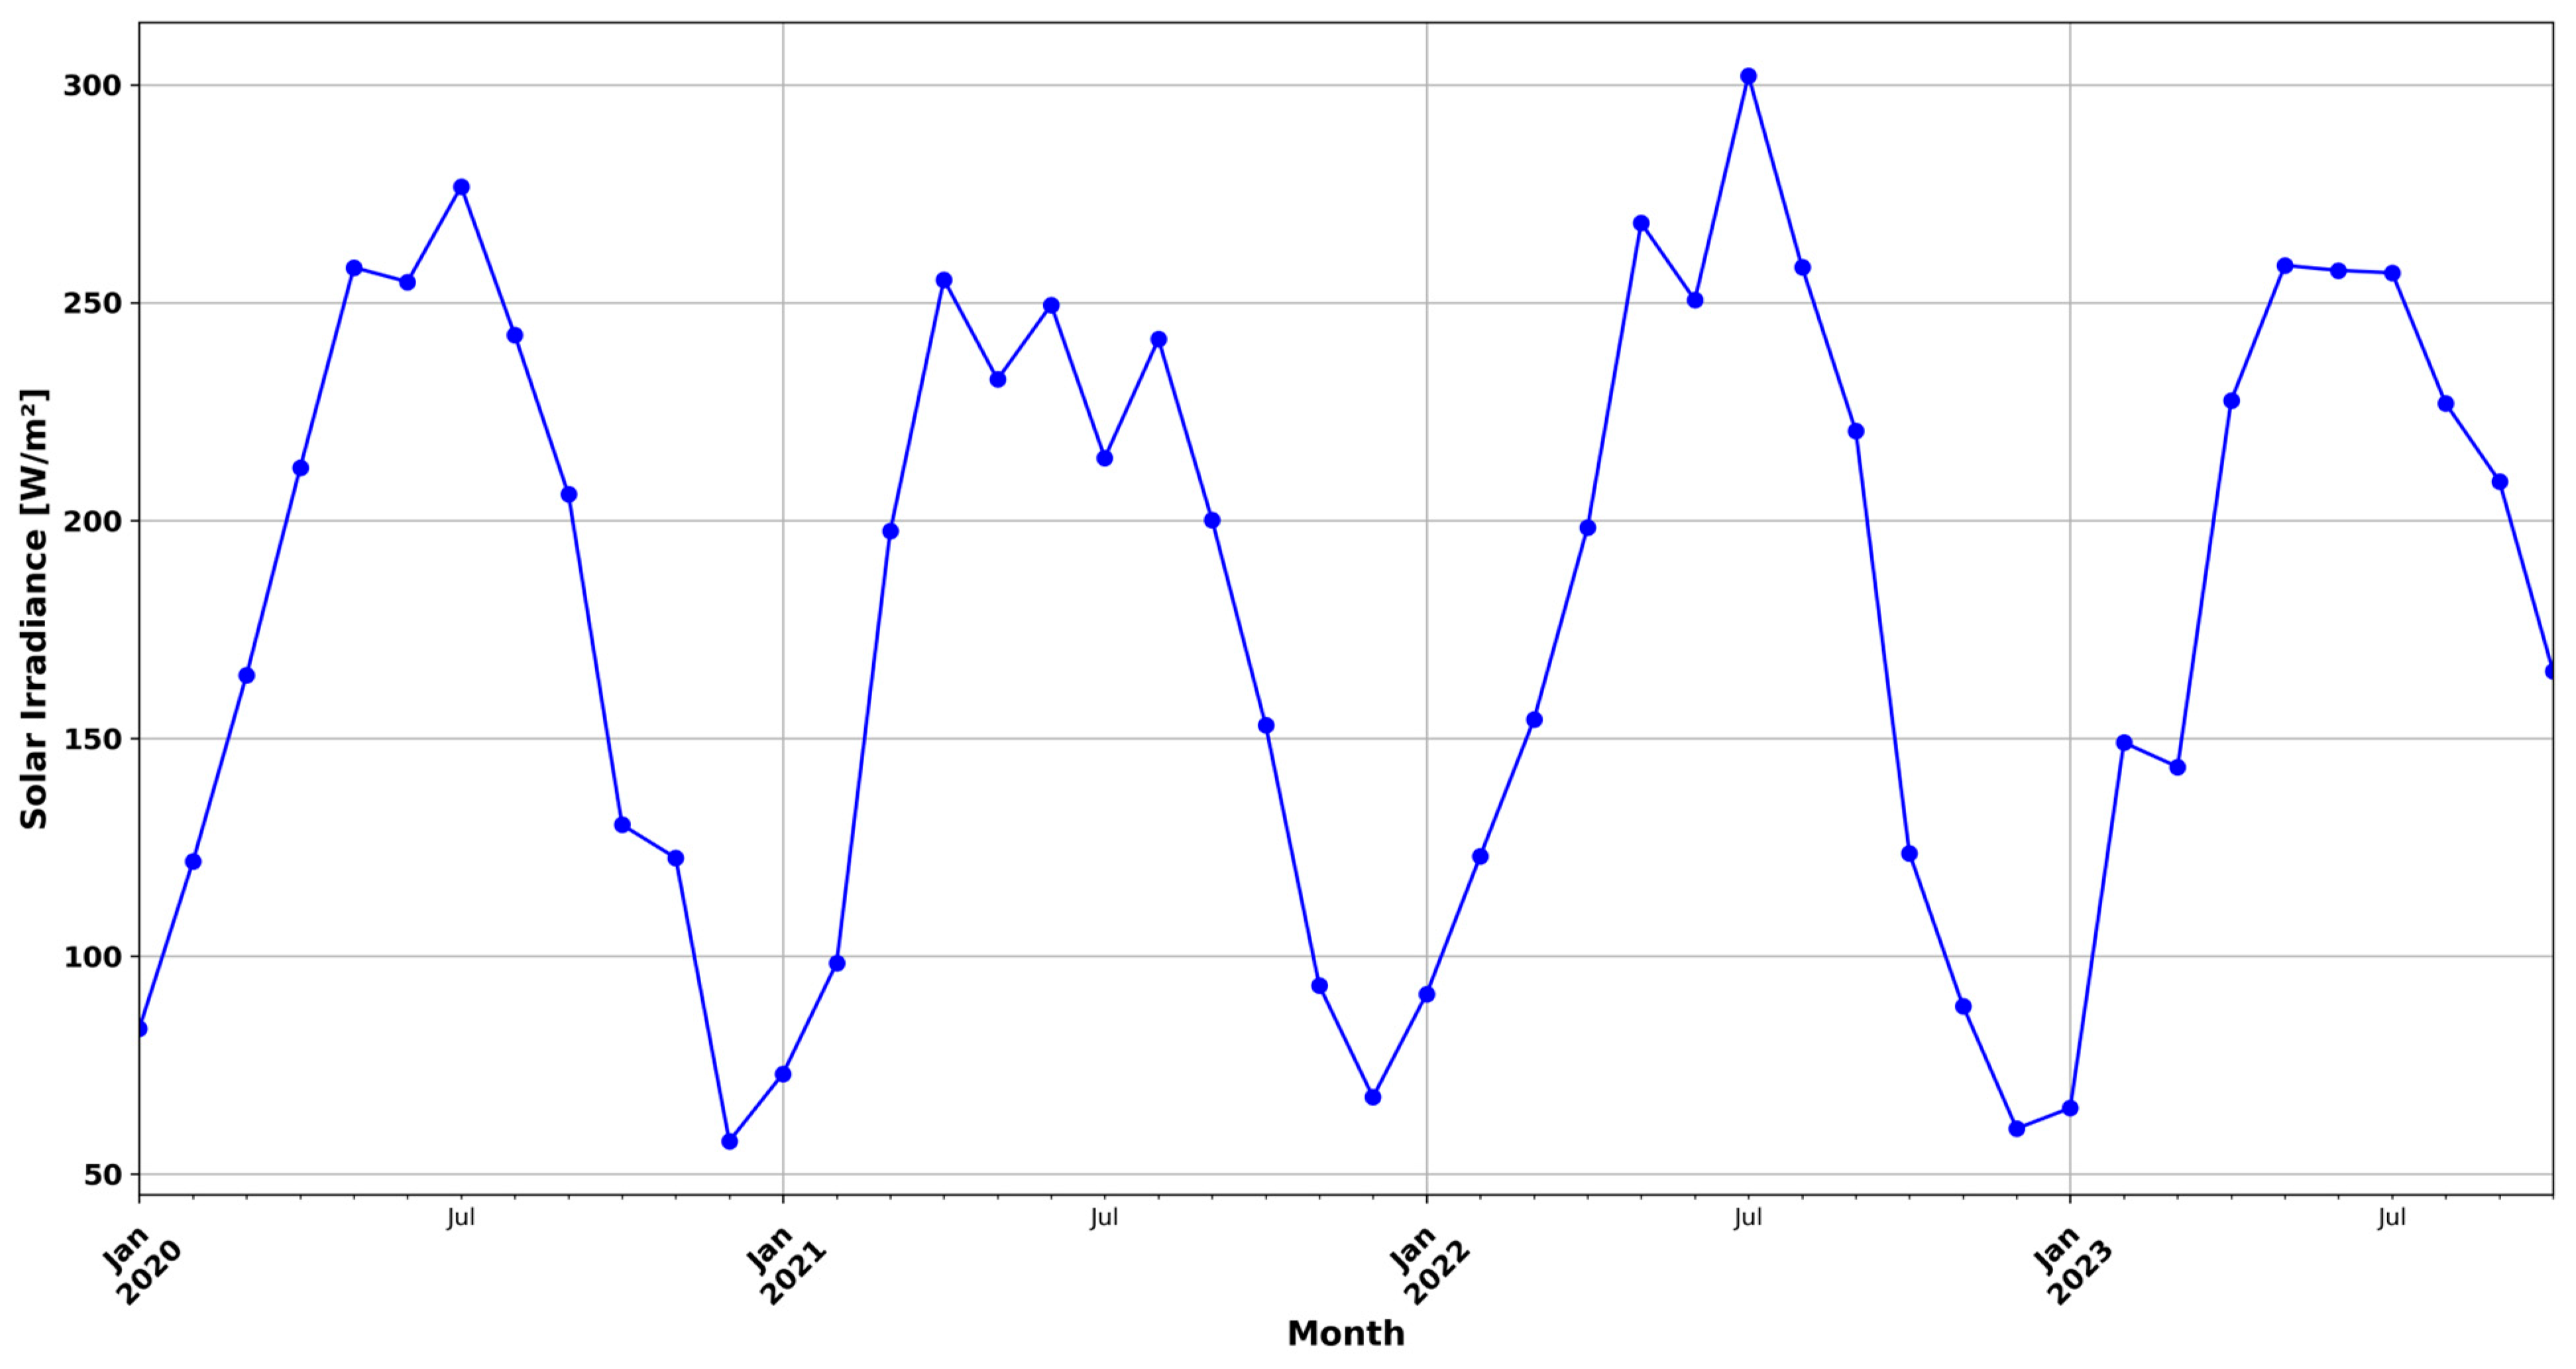
3.1. Site Assessment and Dataset
- Date_Time: The exact date and time of each observation, formatted in “DD/MM/YYYY HH:MM”;
- T01-t Solar Irradiance [W/m2]: Solar irradiance of Transformer 1;
- T01-t Module Temperature [°C]: Temperature of the solar module of Transformer 1;
- T03-Ta Ambient Temperature [°C]: Ambient temperature of Transformer 3;
- T03-Wind Speed [m/s]: Wind speed of Transformer 3.
3.2. Data Preprocessing
- Handling Missing Values: Due to the continuous nature of solar irradiance and related environmental data, missing values can significantly impact the performance of predictive models. We employed an interpolation method to replace the missing data points.
- Lagged Features: Historical data of the variables can provide context for current values, helping to capture trends and inertia in the data. We created lagged features for up to 24 h prior for the variables.
- Integration of Exogenous Variables: In the NARX framework, the exogenous variables (ambient temperature, surface temperature, and wind speed) are treated as external inputs that provide additional context to the model. These are integrated into the input feature set alongside the historical values of the target variable (solar irradiance).
- Normalization: This was employed to standardize the values of distinct features, which had a broad range, in order to make them similar. This process improved the stability and performance of the machine learning models. Min-max scaling was used to rescale all features so that they fall within the range of 0 to 1.
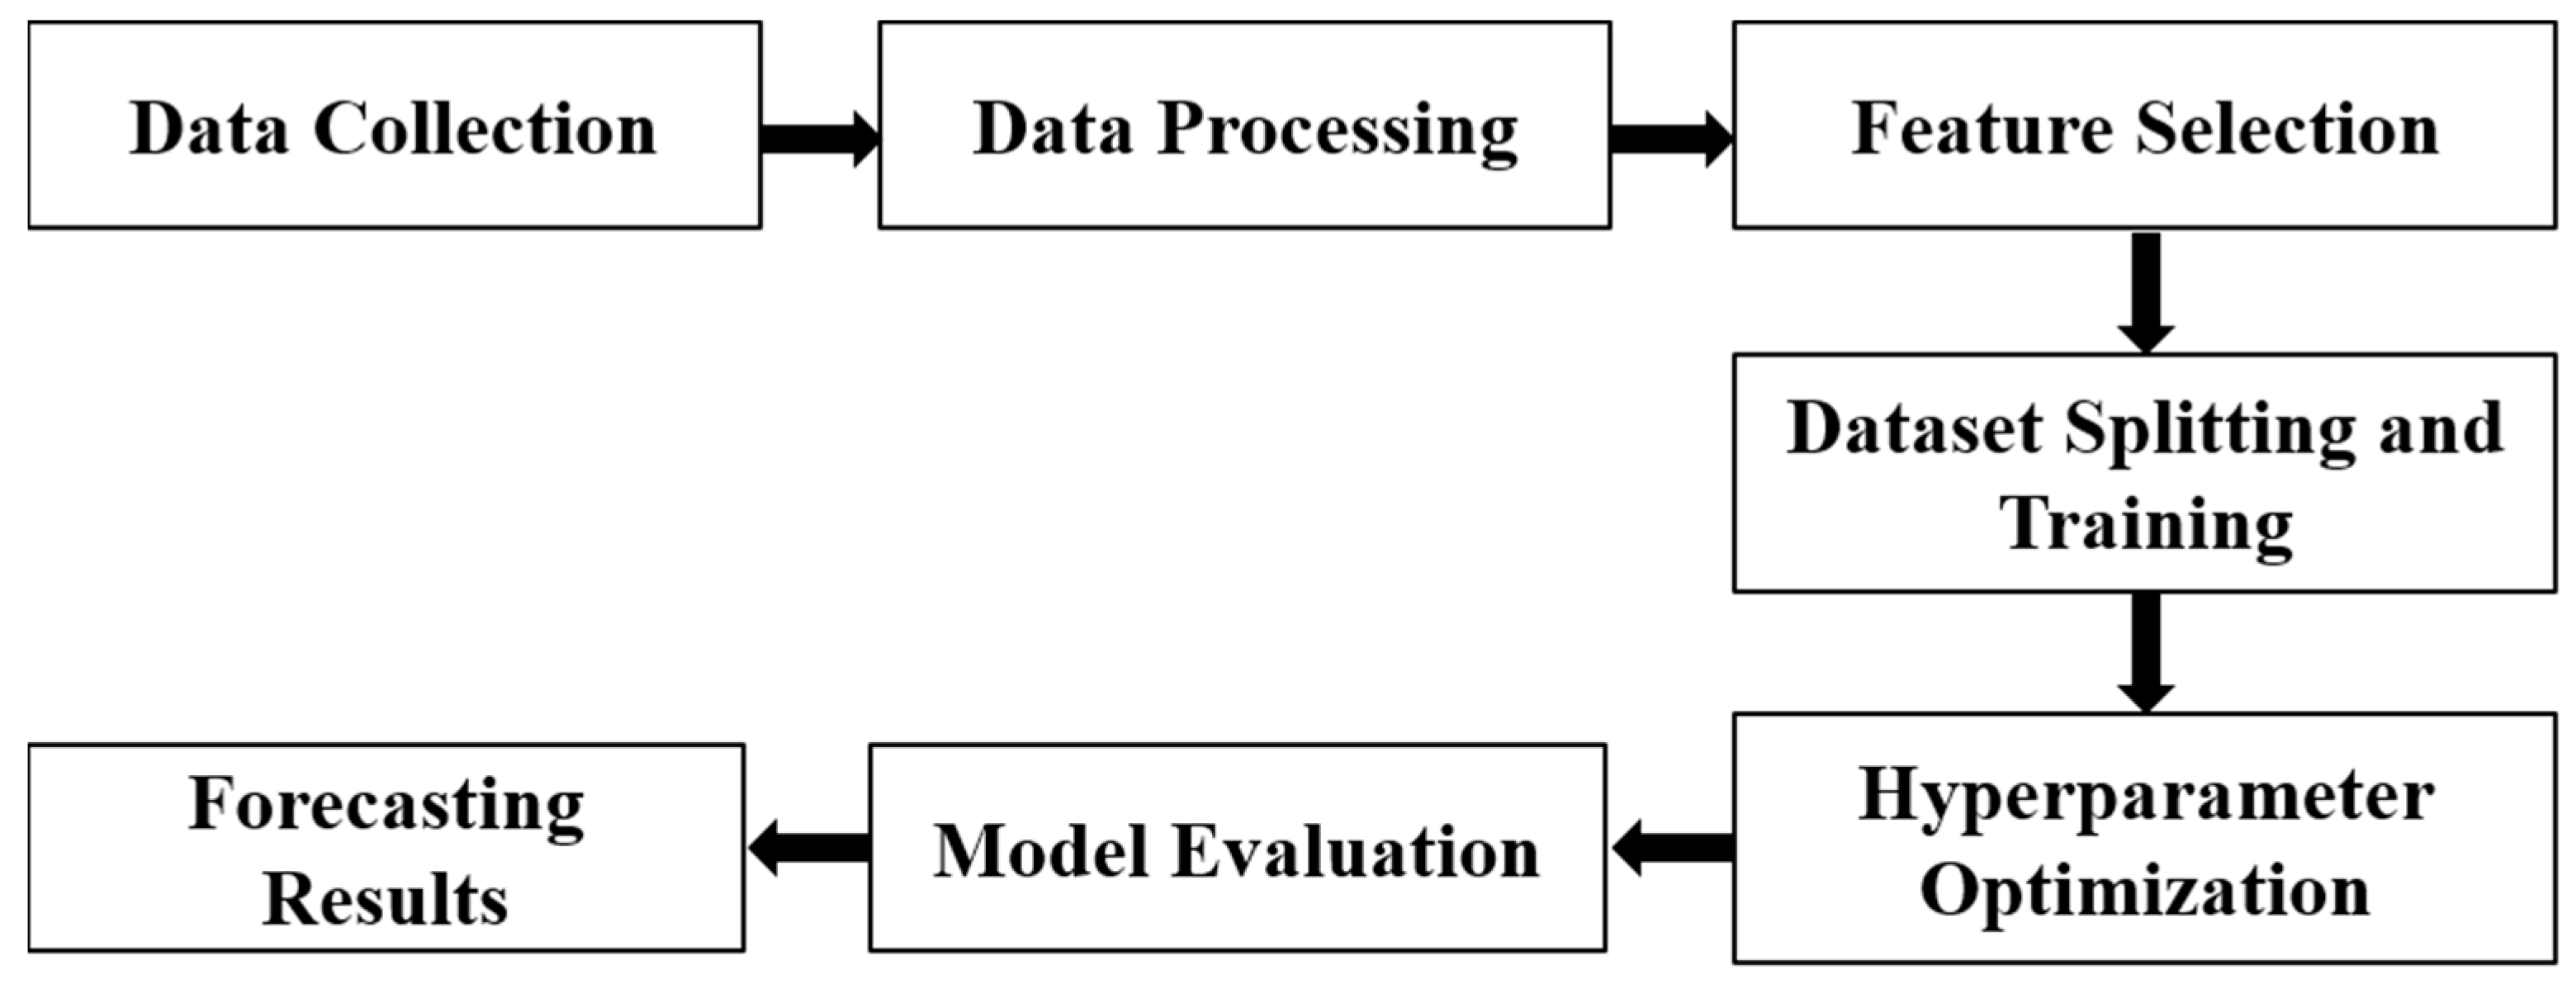
3.3. Proposed Methodology
- Feature Selection: For the development of a robust hybrid NARX-LSTM model aimed at forecasting solar irradiance, it is critical to carefully select and prepare input features that capture the underlying dynamics affecting solar power generation. In this context, features such as wind speed and ambient and surface temperatures are selected using the Pearson correlation coefficient due to their direct influence on solar irradiance levels.
- Data Segmentation: After the feature selection, the preprocessed dataset was divided into three subsets: 80% for training, 10% for validation, and 10% for testing. The training set is used to enable the model to acquire knowledge from a significant historical context. The validation set is employed for model parameter fine-tuning and overfitting prevention. Finally, the testing set assesses the model’s performance on unseen data. Table 2 presents the division of data across different periods and the number of samples in each dataset.
- Model Architecture: The architecture of the hybrid NARX-LSTM model is shown in Figure 4.
- Hyperparameter Optimization: Hyperparameter optimization for LSTM networks is an essential technique focused on adjusting the parameters that control the model’s learning process and structure. Our study utilizes the Optuna package to do hyperparameter optimization when building an LSTM-based neural network with Keras. The crucial hyperparameters that were optimized were the number of LSTM layers, the number of units per layer, the dropout rate, and the learning rate. Optuna’s efficient search algorithms are used to change these parameters. The algorithms recommend values for the number of units and dropout rates within specified ranges, and they also utilize a logarithmic scale for the learning rate with an ADAM optimizer to efficiently explore a wider range of values. The model architecture is dynamically constructed based on these parameters, incorporating dropouts after each LSTM layer to prevent overfitting. During model training, early stopping is used to end the training process if the validation loss does not improve. This helps increase training efficiency and prevents overfitting. This approach is particularly effective for managing the complexities of time-series predictions where the tuning of network architecture and learning parameters can greatly influence model accuracy and generalization. The optimized hyperparameters of this study are displayed in Table 3.
- Model Evaluation: The evaluation of the hybrid NARX-LSTM model for forecasting solar irradiance is conducted using MAE, RMSE, and R2 performance metrics to ensure a comprehensive assessment of its predictive accuracy and reliability.


3.4. Statistical Performance Metrics
- N represents the number of observations.
4. Results and Discussion
4.1. Correlation Coefficient
- Solar Irradiance and Module Temperature: The correlation coefficient between solar irradiance and module temperature is high, indicating a strong positive relationship. As solar irradiance increases, module temperature typically rises, affecting the efficiency of PV cells. This relationship underscores the need for thermal management in solar PV systems, especially in regions with high solar irradiance.
- Solar Irradiance and Ambient Temperature: There is also a significant positive correlation between solar irradiance and ambient temperature. This relationship is expected, as higher solar irradiance leads to increased temperatures. Ambient temperature can influence the performance of solar PV installations by affecting the physical properties of the materials involved in energy conversion. This phenomenon can be attributed to the overall rise in temperature that occurs during bright weather.
- Solar Irradiance and Wind Speed: The correlation between solar irradiance and wind speed is moderately positive. While less intuitive, this relationship suggests that in certain geographical regions, higher solar irradiance days might also experience higher wind speeds, possibly due to local climatic conditions. Wind speed can play a role in cooling solar panels, potentially improving their performance on very sunny days.
4.2. Nonlinear Autoregressive with Exogenous Inputs (NARX) Prediction Model
- Nonlinear Autoregressive (NAR): This aspect of the model signifies that the future values of a series are predicted based on past values of the same series but with a nonlinear relationship. In traditional linear models, future values are a linear combination of past values; in NARX, these relationships are modeled using nonlinear functions, typically represented by a neural network.
- Exogenous Inputs (X): These are external variables that influence the target variable but are not influenced by it within the model framework. For example, in the case of solar irradiance forecasting, exogenous inputs might include temperature, humidity, or cloud cover.
- is the nonlinear activation function (tanh for this study).
- and are the weight matrices for the input and output layers, respectively.
- and are bias vectors for the input and output layers, respectively.
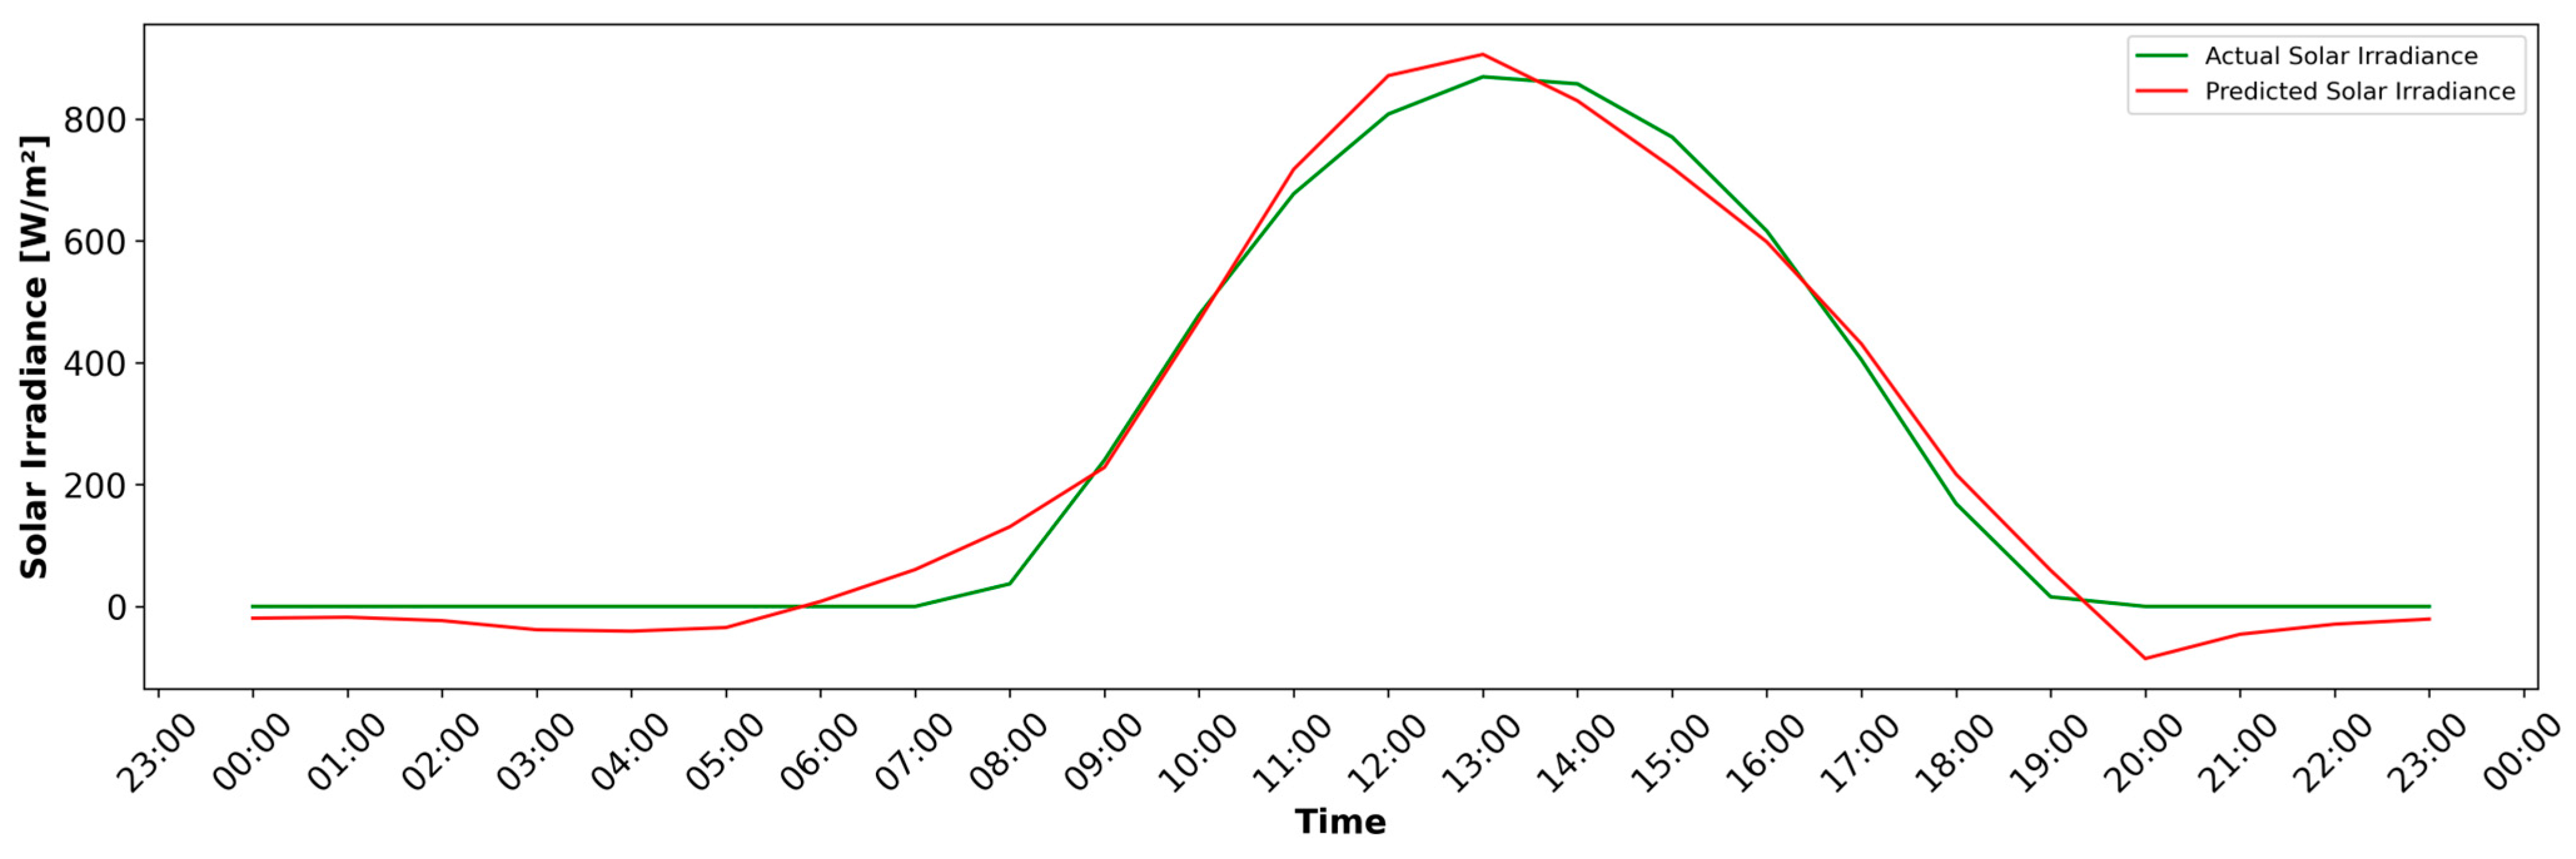
4.3. Hybrid NARX-LSTM Prediction Model
5. Conclusions and Future Perspectives
Author Contributions
Funding
Data Availability Statement
Acknowledgments
Conflicts of Interest
Nomenclature
| AdaBoost | Adaptive boosting |
| ANN | Artificial neural network |
| ARIMA | Autoregressive integrated moving average |
| ARMA | Autoregressive and moving average |
| BPNN | Back-propagation algorithm-based neural network |
| DT | Decision tree |
| ELM | Extreme learning machine |
| FFNN | Feed-forward neural network |
| GBM | Gradient boosting model |
| GBRT | Gradient boosting regression tree |
| GPR | Gaussian Process Regression |
| k-NN | k-nearest neighbor |
| Lasso | Least absolute shrinkage and selection operator |
| LR | Linear regression |
| LogR | Logistic regression |
| LSTM | Long Short-Term Memory |
| MAE | Mean absolute error |
| MAPE | Mean absolute percentage error |
| MLR | Multiple linear regression |
| MSE | Mean square error |
| MVTS | Multivariate time series |
| NARX | Nonlinear Autoregressive Network with Exogenous Inputs |
| NWP | Numerical weather prediction |
| PCR | Principal component regression |
| Pr | Pearson correlation |
| PV | Photovoltaic |
| QRA | Quantile regression averaging |
| RBFNN | Radial basis function neural network |
| RF | Random forest |
| RFE | Recursive feature elimination |
| RMSE | Root mean square error |
| RNN | Recurrent neural network |
| RRMSE | Relative root mean square error |
| SVM | Support vector machine |
| SVR | Support vector regression |
| XGBoost | Extreme gradient boosting |
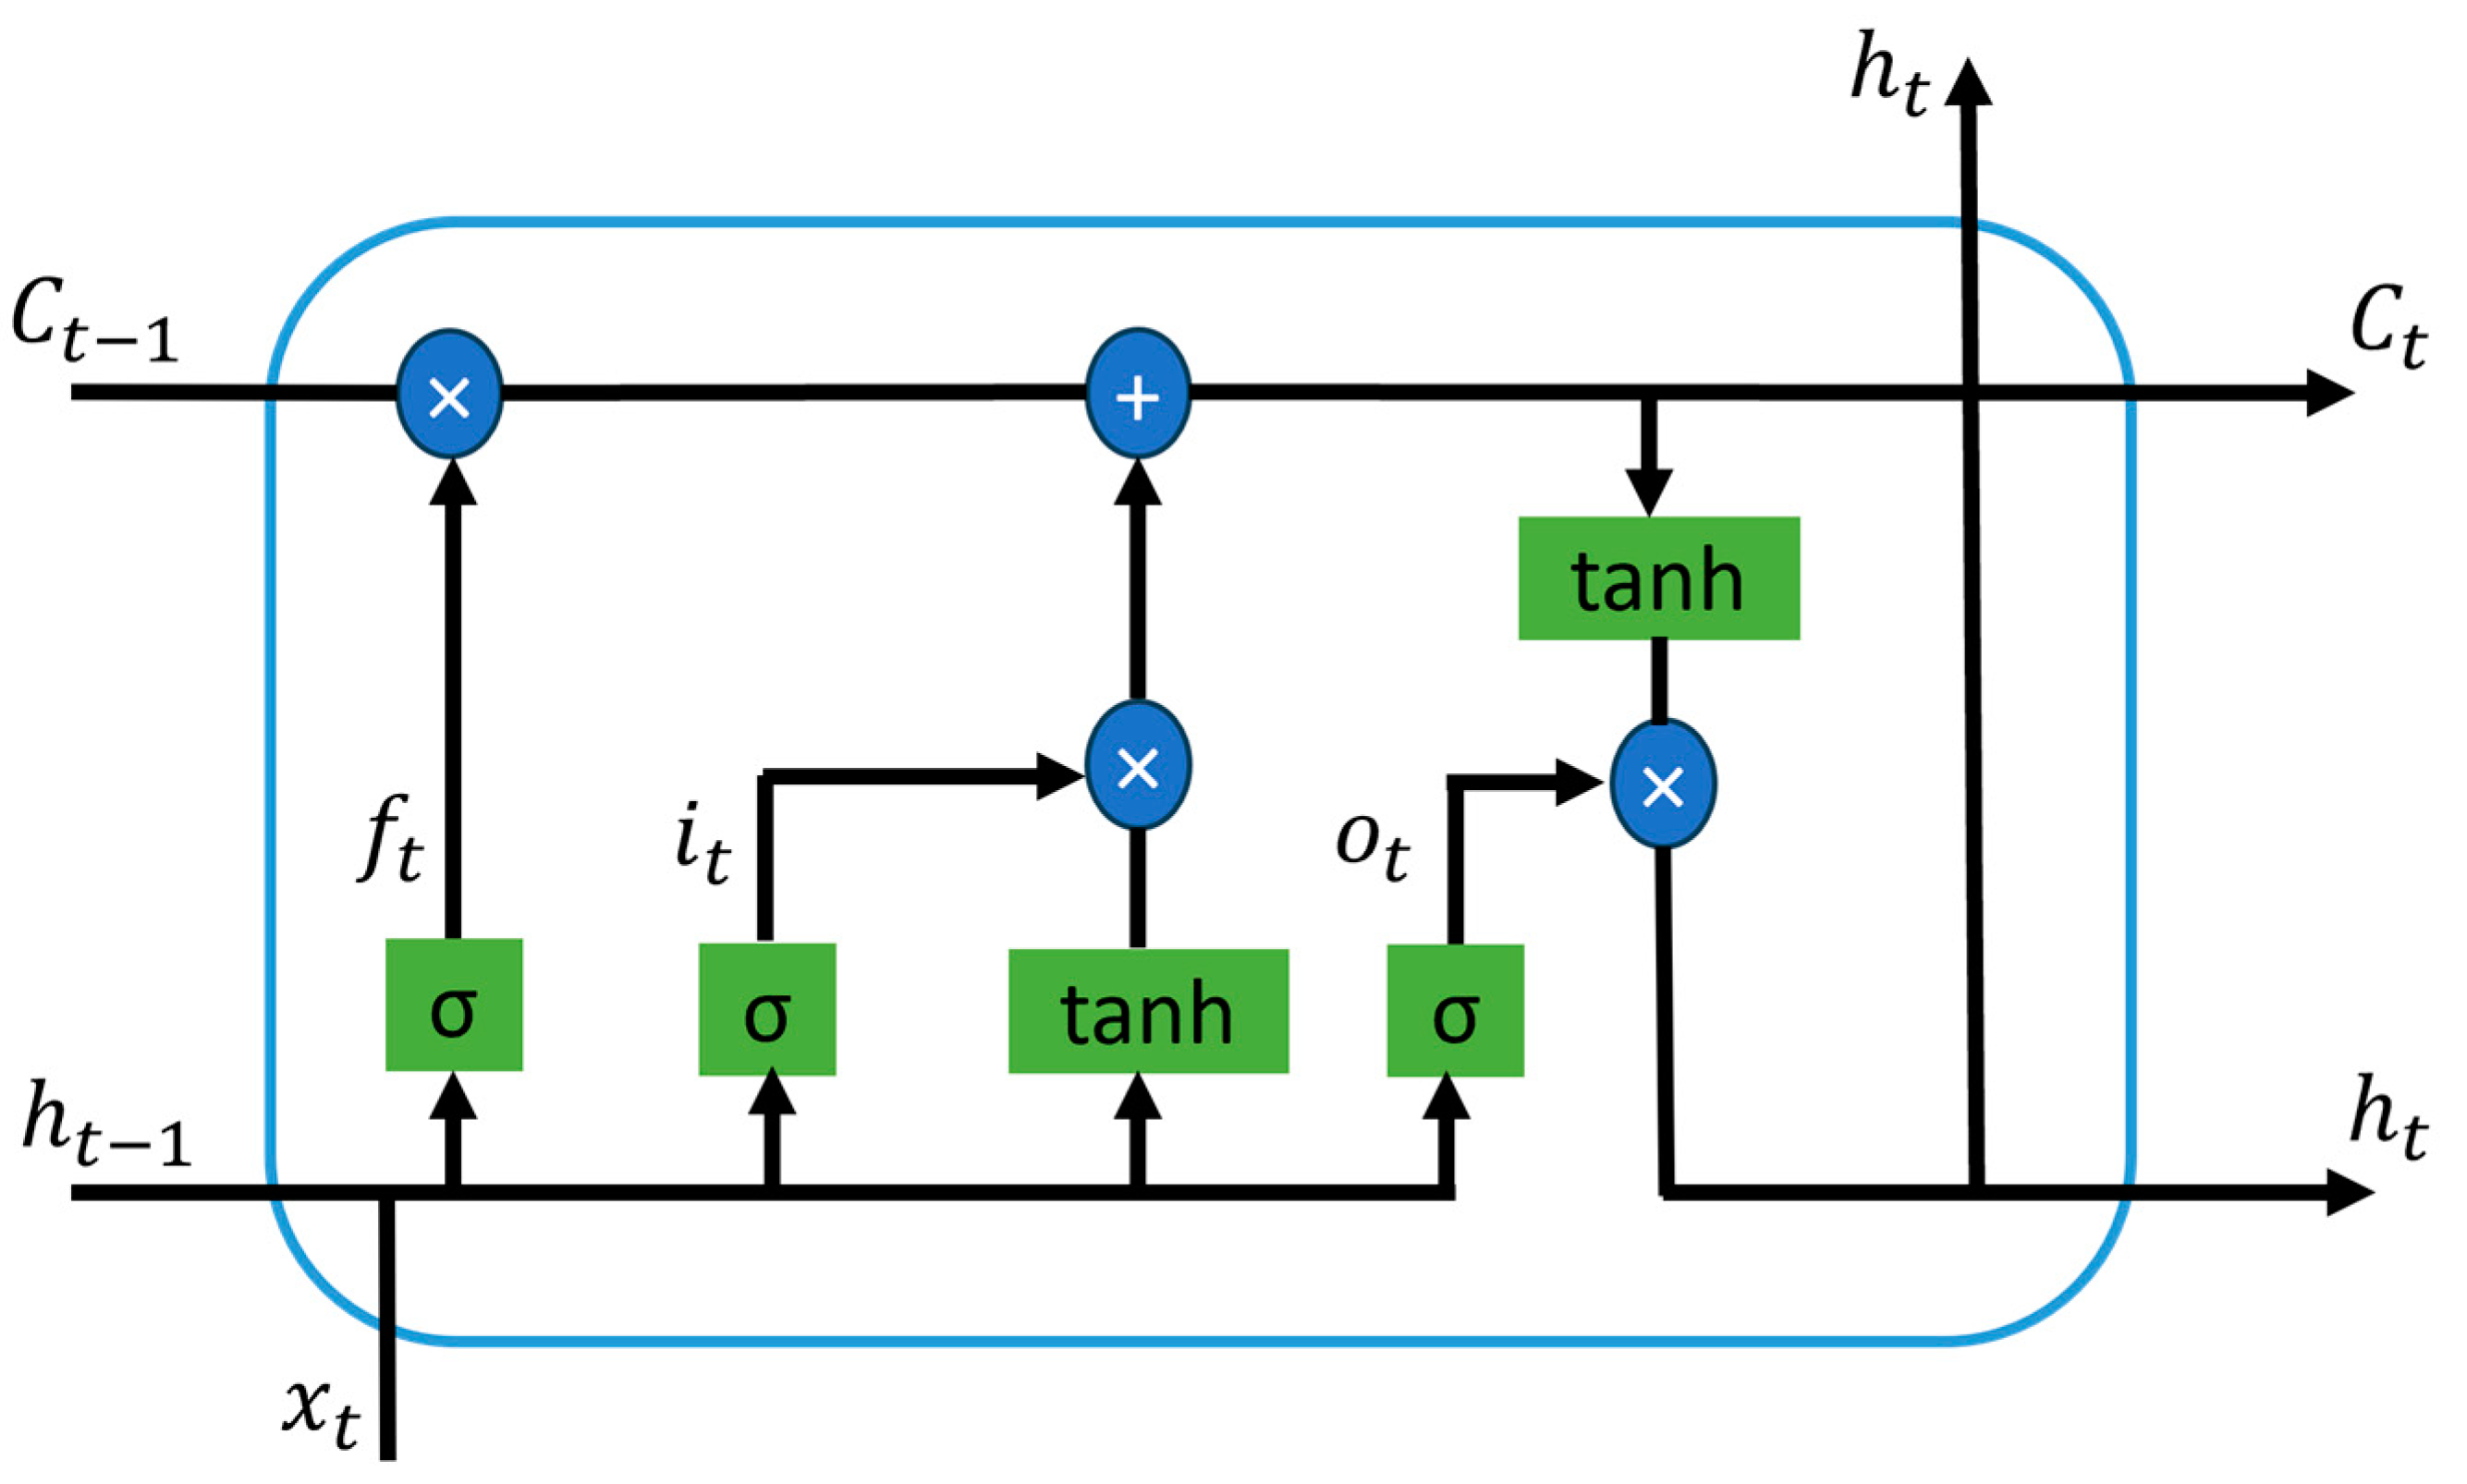
Appendix A
- Memory cell: The central component of the LSTM unit, responsible for retaining its state over a period of time. The cell state functions as a mechanism that transfers pertinent information down the sequence chain without modifying it.
- Gates: LSTMs have three types of gates, namely the forget gate, input gate, and output gate, which are responsible for regulating the memory cell. The forget gate decides which information is to be eliminated from the cell state, while the input gate determines the specific information that is incorporated into the cell state. It also includes creating a vector of new candidate values that could be added to the state. Finally, the output gate defines what the next hidden state should be.
References
- Sorrell, S. Reducing energy demand: A review of issues, challenges and approaches. Renew. Sustain. Energy Rev. 2015, 47, 74–82. [Google Scholar] [CrossRef]
- Chakraborty, D.; Mondal, J.; Barua, H.B.; Bhattacharjee, A. Computational solar energy—Ensemble learning methods for prediction of solar power generation based on meteorological parameters in Eastern India. Renew. Energy Focus 2023, 44, 277–294. [Google Scholar] [CrossRef]
- Jia, L.; Cheng, P.; Yu, Y.; Chen, S.-H.; Wang, C.-X.; He, L.; Nie, H.-T.; Wang, J.-C.; Zhang, J.-C.; Fan, B.-G.; et al. Regeneration mechanism of a novel high-performance biochar mercury adsorbent directionally modified by multimetal multilayer loading. J. Environ. Manag. 2023, 326, 116790. [Google Scholar] [CrossRef]
- Rana, V.; Tyagi, A.; Kumar, K.; Grover, H. History and Application of Solar PV System. In Artificial Intelligence for Solar Photovoltaic Systems: Approaches, Methodologies, and Technologies; CRC Press: Boca Raton, FL, USA, 2022; pp. 1–22. [Google Scholar] [CrossRef]
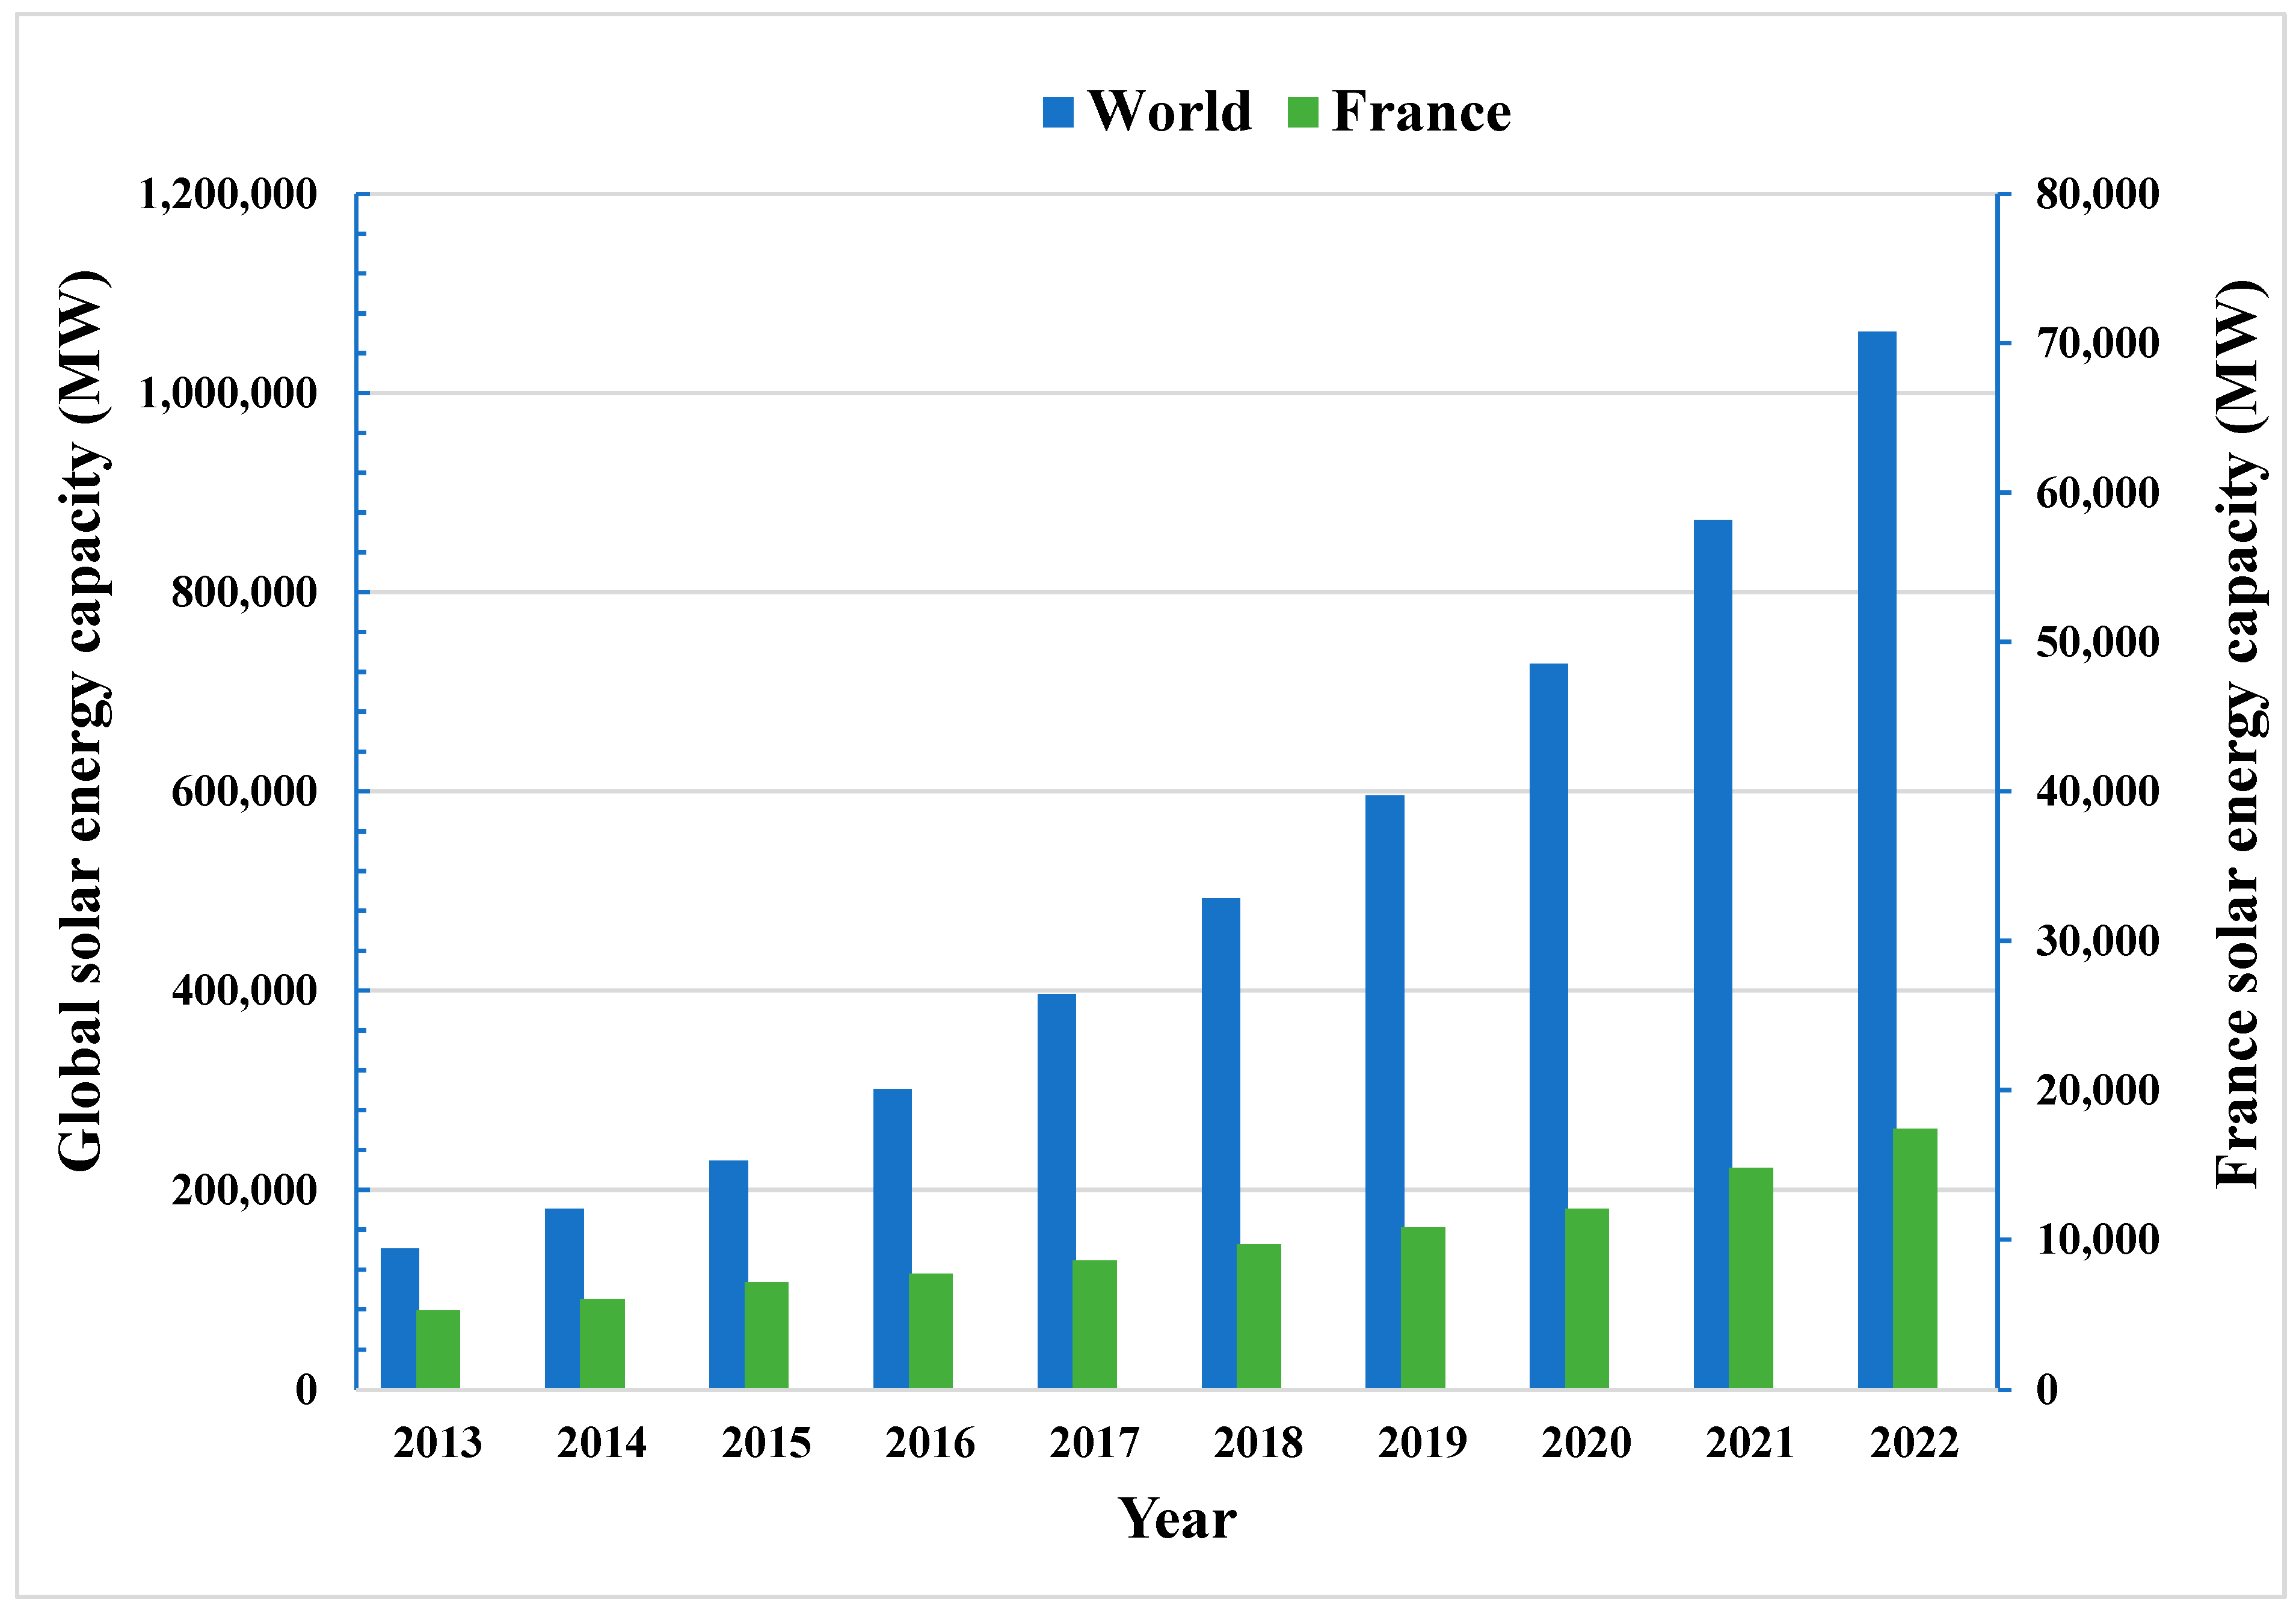
- Pourasl, H.H.; Barenji, R.V.; Khojastehnezhad, V.M. Solar energy status in the world: A comprehensive review. Energy Rep. 2023, 10, 3474–3493. [Google Scholar] [CrossRef]
- Okieh, O.I.; Mohamed, Y.N.; Seker, S. Application of 30 MWp grid-connected solar photovoltaic power plant for Djibouti Vision 2035. Int. J. Renew. Energy Res. 2023, 13, 136–143. [Google Scholar] [CrossRef]
- Mutavhatsindi, T.; Sigauke, C.; Mbuvha, R. Forecasting Hourly Global Horizontal Solar Irradiance in South Africa Using Machine Learning Models. IEEE Access 2020, 8, 198872–198885. [Google Scholar] [CrossRef]
- Dhaked, D.K.; Dadhich, S.; Birla, D. Power output forecasting of solar photovoltaic plant using LSTM. Green Energy Intell. Transp. 2023, 2, 100113. [Google Scholar] [CrossRef]
- Okieh, O.I.; Seker, S.; Akinci, T.C.; Idriss, A.I. Optimization of Neuro-controller Application for Maximum Power Point Tracking Photovoltaic Systems Through Shannon’s Information Criteria. Electr. Power Components Syst. 2024, 1–12. [Google Scholar] [CrossRef]
- Franco, M.A.; Groesser, S.N. A Systematic Literature Review of the Solar Photovoltaic Value Chain for a Circular Economy. Sustainability 2021, 13, 9615. [Google Scholar] [CrossRef]
- International Renewable Energy Agency. Renewable Energy Statistics 2023 Statistiques D’énergie Renouvelable 2023 Estadísticas de Energía Renovable 2023 about IRENA. 2023. Available online: www.irena.org (accessed on 27 October 2023).
- Sharadga, H.; Hajimirza, S.; Balog, R.S. Time series forecasting of solar power generation for large-scale photovoltaic plants. Renew. Energy 2020, 150, 797–807. [Google Scholar] [CrossRef]
- Brahma, B.; Wadhvani, R. Solar Irradiance Forecasting Based on Deep Learning Methodologies and Multi-Site Data. Symmetry 2020, 12, 1830. [Google Scholar] [CrossRef]
- Qazi, A.; Fayaz, H.; Wadi, A.; Raj, R.G.; Rahim, N.; Khan, W.A. The artificial neural network for solar radiation prediction and designing solar systems: A systematic literature review. J. Clean. Prod. 2015, 104, 1–12. [Google Scholar] [CrossRef]
- Ssekulima, E.B.; Anwar, M.B.; Al Hinai, A.; El Moursi, M.S. Wind speed and solar irradiance forecasting techniques for enhanced renewable energy integration with the grid: A review. IET Renew. Power Gener. 2016, 10, 885–989. [Google Scholar] [CrossRef]
- Ziane, A.; Necaibia, A.; Sahouane, N.; Dabou, R.; Mostefaoui, M.; Bouraiou, A.; Khelifi, S.; Rouabhia, A.; Blal, M. Photovoltaic output power performance assessment and forecasting: Impact of meteorological variables. Sol. Energy 2021, 220, 745–757. [Google Scholar] [CrossRef]
- Zhang, Y.; Cui, N.; Feng, Y.; Gong, D.; Hu, X. Comparison of BP, PSO-BP and statistical models for predicting daily global solar radiation in arid Northwest China. Comput. Electron. Agric. 2019, 164, 104905. [Google Scholar] [CrossRef]
- Zhang, G.; Yang, D.; Galanis, G.; Androulakis, E. Solar forecasting with hourly updated numerical weather prediction. Renew. Sustain. Energy Rev. 2022, 154, 111768. [Google Scholar] [CrossRef]
- Belaid, S.; Mellit, A. Prediction of daily and mean monthly global solar radiation using support vector machine in an arid climate. Energy Convers. Manag. 2016, 118, 105–118. [Google Scholar] [CrossRef]
- Yadav, A.K.; Chandel, S. Solar radiation prediction using Artificial Neural Network techniques: A review. Renew. Sustain. Energy Rev. 2014, 33, 772–781. [Google Scholar] [CrossRef]
- Villegas-Mier, C.G.; Rodriguez-Resendiz, J.; Álvarez-Alvarado, J.M.; Jiménez-Hernández, H.; Odry, Á. Optimized Random Forest for Solar Radiation Prediction Using Sunshine Hours. Micromachines 2022, 13, 1406. [Google Scholar] [CrossRef]
- Almaghrabi, S.; Rana, M.; Hamilton, M.; Rahaman, M.S. Solar power time series forecasting utilising wavelet coefficients. Neurocomputing 2022, 508, 182–207. [Google Scholar] [CrossRef]
- Iheanetu, K.J. Solar Photovoltaic Power Forecasting: A Review. Sustainability 2022, 14, 17005. [Google Scholar] [CrossRef]
- Akhter, M.N.; Mekhilef, S.; Mokhlis, H.; Shah, N.M. Review on forecasting of photovoltaic power generation based on machine learning and metaheuristic techniques. IET Renew. Power Gener. 2019, 13, 1009–1023. [Google Scholar] [CrossRef]
- Sansa, I.; Boussaada, Z.; Bellaaj, N.M. Solar Radiation Prediction Using a Novel Hybrid Model of ARMA and NARX. Energies 2021, 14, 6920. [Google Scholar] [CrossRef]
- Narayanan, S.; Kumar, R.; Ramadass, S.; Ramasamy, J. Hybrid Forecasting Model Integrating RNN-LSTM for Renewable Energy Production. Electr. Power Components Syst. 2024, 52, 1–19. [Google Scholar] [CrossRef]
- Ghimire, S.; Deo, R.C.; Wang, H.; Al-Musaylh, M.S.; Casillas-Pérez, D.; Salcedo-Sanz, S. Stacked LSTM Sequence-to-Sequence Autoencoder with Feature Selection for Daily Solar Radiation Prediction: A Review and New Modeling Results. Energies 2022, 15, 1061. [Google Scholar] [CrossRef]
- Rangel, E.; Cadenas, E.; Campos-Amezcua, R.; Tena, J.L. Enhanced Prediction of Solar Radiation Using NARX Models with Corrected Input Vectors. Energies 2020, 13, 2576. [Google Scholar] [CrossRef]
- Hissou, H.; Benkirane, S.; Guezzaz, A.; Azrour, M.; Beni-Hssane, A. A Novel Machine Learning Approach for Solar Radiation Estimation. Sustainability 2023, 15, 10609. [Google Scholar] [CrossRef]
- Natava, C.J.C.; Palmares, X.L.P.S.; Doma, B.J.T. Forecasting of daily global solar radiation in Dumaguete, Philippines using NARX-LSTM Hybrid Network. In ACM International Conference Proceeding Series; Association for Computing Machinery: New York, NY, USA, 2023; pp. 66–72. [Google Scholar] [CrossRef]
- Ayodele, T.; Ogunjuyigbe, A.; Amedu, A.; Munda, J. Prediction of global solar irradiation using hybridized k-means and support vector regression algorithms. Renew. Energy Focus 2019, 29, 78–93. [Google Scholar] [CrossRef]
- Huang, L.; Kang, J.; Wan, M.; Fang, L.; Zhang, C.; Zeng, Z. Solar Radiation Prediction Using Different Machine Learning Algorithms and Implications for Extreme Climate Events. Front. Earth Sci. 2021, 9, 596860. [Google Scholar] [CrossRef]
- Chodakowska, E.; Nazarko, J.; Nazarko, Ł.; Rabayah, H.S.; Abendeh, R.M.; Alawneh, R. ARIMA Models in Solar Radiation Forecasting in Different Geographic Locations. Energies 2023, 16, 5029. [Google Scholar] [CrossRef]
- Woldegiyorgis, T.A.; Benti, N.E.; Chaka, M.D.; Semie, A.G.; Jemberie, A.A. Estimating solar radiation using artificial neural networks: A case study of Fiche, Oromia, Ethiopia. Cogent Eng. 2023, 10, 2220489. [Google Scholar] [CrossRef]
- Huang, J.; Rikus, L.J.; Qin, Y.; Katzfey, J. Assessing model performance of daily solar irradiance forecasts over Australia. Sol. Energy 2018, 176, 615–626. [Google Scholar] [CrossRef]
- Ağbulut, Ü.; Gürel, A.E.; Biçen, Y. Prediction of daily global solar radiation using different machine learning algorithms: Evaluation and comparison. Renew. Sustain. Energy Rev. 2021, 135, 110114. [Google Scholar] [CrossRef]
- Wang, X.; Xu, N.; Meng, X.; Chang, H. Prediction of Gas Concentration Based on LSTM-LightGBM Variable Weight Combination Model. Energies 2022, 15, 827. [Google Scholar] [CrossRef]
- Narvaez, G.; Giraldo, L.F.; Bressan, M.; Pantoja, A. Machine learning for site-adaptation and solar radiation forecasting. Renew. Energy 2021, 167, 333–342. [Google Scholar] [CrossRef]
- Ezzeldin, R.; Hatata, A. Application of NARX neural network model for discharge prediction through lateral orifices. Alex. Eng. J. 2018, 57, 2991–2998. [Google Scholar] [CrossRef]
- Cornejo-Bueno, L.; Casanova-Mateo, C.; Sanz-Justo, J.; Salcedo-Sanz, S. Machine learning regressors for solar radiation estimation from satellite data. Sol. Energy 2019, 183, 768–775. [Google Scholar] [CrossRef]
- Mendyl, A.; Demir, V.; Omar, N.; Orhan, O.; Weidinger, T. Enhancing Solar Radiation Forecasting in Diverse Moroccan Climate Zones: A Comparative Study of Machine Learning Models with Sugeno Integral Aggregation. Atmosphere 2024, 15, 103. [Google Scholar] [CrossRef]
- Huang, X.; Li, Q.; Tai, Y.; Chen, Z.; Zhang, J.; Shi, J.; Gao, B.; Liu, W. Hybrid deep neural model for hourly solar irradiance forecasting. Renew. Energy 2021, 171, 1041–1060. [Google Scholar] [CrossRef]
- Qing, X.; Niu, Y. Hourly day-ahead solar irradiance prediction using weather forecasts by LSTM. Energy 2018, 148, 461–468. [Google Scholar] [CrossRef]
- Husein, M.; Chung, I.-Y. Day-Ahead Solar Irradiance Forecasting for Microgrids Using a Long Short-Term Memory Recurrent Neural Network: A Deep Learning Approach. Energies 2019, 12, 1856. [Google Scholar] [CrossRef]


| Ref. | Year | Input Parameters | Forecasting Model | Region | Forecasting Results |
|---|---|---|---|---|---|
| [31] | 2019 | Clearness index, evaporation, sunshine duration, maximum temperature, sunshine hours, difference between max and min temperature, average of max and min temperature | Hybridized k-means and SVR | Ibadan, Nigeria | For 2016: R2 = 0.9816 RMSE = 0.4275 RRMSE = 2.6515% MAPE = 1.7928% For 2017: R2 = 0.9842 RMSE = 0.434 RRMSE = 2.7498% MAPE = 1.795% |
| [28] | 2020 | Solar radiation, wind speed, relative humidity, pressure, temperature | Persistence model, NARX | Three cities in Mexico | %Forecast skill: 11.5% in Chihuahua 5.7% in Temixco 27.2% in Zacatecas |
| [7] | 2020 | wind speed, wind direction standard deviation, rainfall, relative humidity, barometric pressure, temperature, hour, month, a non-linear trend, a lagged hourly solar irradiance at lags 1 and 2. | LSTM, SVR, FFNN, PCR, Convex model, QRA model | RMSE = 88.6, MAE = 52.034 | |
| [25] | 2021 | Historical solar radiation, temperature | ARMA, NARX, Hybrid model of ARMA and NARX | Spain | MSE = 0.0340 MAE = 0.1270 RMSE = 0.1863 |
| [32] | 2021 | sunshine duration, mean wind speed, mean ground temperature, mean relative humidity, minimum temperature, maximum temperature, mean temperature, mean precipitation, mean pressure, visibility | XGBoost, ELM, DT, RF, GBRT, BPNN, AdaBoost, KNN, SVR, GPR, MLR, RBFNN | Ganzhou, China | R2 = 0.944 RMSE = 1.131 MJ/m2 MAE = 0.870 MJ/m2 |
| [21] | 2022 | Solar radiation, humidity, wind direction, wind speed, temperature, barometric pressure, sunshine hours | LR, RNN, SVR, RF, AdaBoost, Optimization RF, Optimization AdaBoost | Juriquilla, Queretaro, Mexico | MSE = 5011.19 RMSE = 70.78 MAE = 33.44 R2 = 0.95 MAPE = 1.596019 × 10¹³ Accuracy % = 95.98 |
| [30] | 2023 | Rainfall, wind direction, wind speed, relative humidity, temperature, sunshine duration, predicted global solar radiation | Optimized GPR, NARX, NARX-LSTM | Dumaguete, Philippines | RMSE = 0.10 |
| [33] | 2023 | Historical solar irradiance | ARIMA | Amman, Jordan Warsaw, Poland | R2 = 99.9% RMSE = 13.53 MSE = 183.18 MAPE = 2.79% Std. Error = 14.14 |
| [29] | 2023 | Maximum and minimum temperature, wind speed, relative humidity, precipitation | RF, DT, LR, Pr, GBM | - | RMSE = 0.003 R2 = 0.002 |
| [34] | 2023 | Maximum and minimum temperature, relative humidity, surface pressure, wind speed, latitude, longitude, elevation | FFBP, LayR, CFBP, EBP | Fiche town, Oromia, Ethiopia | MSE = 0.0079 RMSE = 0.0889 MAPE = 1.2075 |
| Reference | Models | Optimal Model | Performance Metrics | ||
|---|---|---|---|---|---|
| RMSE (W/m2) | MAE (W/m2) | R2 | |||
| [40] | SVR, GPR, MLP, ELM | ELM | 60.60 | - | 0.96 |
| [41] | LSTM, SVM, MLANN | LSTM | 41.05 | 21.99 | 0.98 |
| [42] | WPD–CNN–LSTM-MLP, BPNN, SVM, RNN, LSTM, Clim-Pers | WPD–CNN–LSTM-MLP | 32.1006 | 14.3523 | 0.994 |
| [43] | Persistence, LSTM, LR, BPNN | LSTM | 76.245 | - | - |
| [38] | NN, LR, AdaBoost, RF | RF | 66 | 33 | 0.96 |
| [44] | LSTM-RNN, FFNN, NARX | LSTM-RNN | 60.31 | 36.90 | - |
| Present Study | NARX, Hybrid NARX-LSTM | Hybrid NARX-LSTM | 16.30 | 9.58 | 0.997 |
Disclaimer/Publisher’s Note: The statements, opinions and data contained in all publications are solely those of the individual author(s) and contributor(s) and not of MDPI and/or the editor(s). MDPI and/or the editor(s) disclaim responsibility for any injury to people or property resulting from any ideas, methods, instructions or products referred to in the content. |
© 2024 by the authors. Licensee MDPI, Basel, Switzerland. This article is an open access article distributed under the terms and conditions of the Creative Commons Attribution (CC BY) license (https://creativecommons.org/licenses/by/4.0/).
Share and Cite
Isman Okieh, O.; Seker, S.; Gokce, S.; Dennenmoser, M. An Enhanced Forecasting Method of Daily Solar Irradiance in Southwestern France: A Hybrid Nonlinear Autoregressive with Exogenous Inputs with Long Short-Term Memory Approach. Energies 2024, 17, 3965. https://doi.org/10.3390/en17163965
Isman Okieh O, Seker S, Gokce S, Dennenmoser M. An Enhanced Forecasting Method of Daily Solar Irradiance in Southwestern France: A Hybrid Nonlinear Autoregressive with Exogenous Inputs with Long Short-Term Memory Approach. Energies. 2024; 17(16):3965. https://doi.org/10.3390/en17163965
Chicago/Turabian StyleIsman Okieh, Oubah, Serhat Seker, Seckin Gokce, and Martin Dennenmoser. 2024. "An Enhanced Forecasting Method of Daily Solar Irradiance in Southwestern France: A Hybrid Nonlinear Autoregressive with Exogenous Inputs with Long Short-Term Memory Approach" Energies 17, no. 16: 3965. https://doi.org/10.3390/en17163965