Review

Effect of Environmental and Operating Conditions on Partial Discharge Activity in Electrical Machine Insulation: A Comprehensive Review

1
Department of Electrical Engineering, Tsinghua University, Beijing 100084, China
2
Department of Engineering and Applied Sciences, University of Bergamo, 24100 Bergamo, Italy
3
Key Laboratory of More Electric Aircraft Technology of Zhejiang Province, University of Nottingham Ningbo China, Ningbo 315100, China
*
Author to whom correspondence should be addressed.
Energies 2024, 17(16), 3980; https://doi.org/10.3390/en17163980
Submission received: 12 July 2024 / Revised: 5 August 2024 / Accepted: 8 August 2024 / Published: 11 August 2024
(This article belongs to the Section F: Electrical Engineering)

Abstract

:
Electrical machines for transportation applications are subjected to harsh environmental conditions during their operations. Partial discharge (PD), which is one of the main reasons for insulation failure, is greatly affected by ambient conditions (i.e., temperature, pressure, and humidity). Countless efforts are made for a comprehensive understanding of the physics of PD under variable environmental factors. This paper aims to review recent works addressing temperature, pressure, and humidity impact on PD activity. The main content of the paper is organized into three sections dealing with each environmental factor. In every section, relevant publications are reviewed considering the type of samples tested, voltage waveform applied, mutual effects, and the most common PD modeling strategies used. The applicability of the PD measurements for PD risk assessment is also discussed. Based on the review, the current progress in understanding the environmental effects on the PD inception mechanism and PD characteristics is presented and discussed in detail, and future research trends in this field are outlined.

1. Introduction

In the past three decades, there has been a growing inclination towards the electrification of transportation, particularly in the automotive [1] and aerospace [2,3] industries. The adoption of electric-powered transport presents a significant opportunity to tackle emissions [4,5,6] and address concerns related to climate change [7,8]. The core of all these endeavors and advancements towards electrification lies in the electric drive system, which consists of an electrical machine (EM) powered by a power electronics converter (PEC) and regulated through a control platform along with suitable algorithms, as depicted in Figure 1 [9].
With the increase in DC bus voltage [10,11,12] and the wide application of fast switching devices [13,14,15], partial discharge (PD) has been one of the main issues leading to EM failures in transportation applications. PD refers to the electrical discharge that incompletely connects the insulation between electrical conductors [16]. Based on past surveys, environmental conditions (i.e., pressure, temperature, and humidity) have a great impact on PD activity. EMs for automotive and aerospace applications might operate at a high altitude and, thus, low-pressure conditions. To provide more precise details, automotive EMs may work at altitudes of up to 5500 m [17] in worst-case scenarios, while aerospace EMs might experience low-pressure conditions during the cruise phase. In addition, for achieving high power density, EMs for transportation are commonly designed to be compact with high current density, which leads to a high winding temperature. Finally, EMs could experience up to 85% relative humidity (RH) during the worst-case conditions for automotive applications, as shown in [17]. As a result, these three environmental factors must be considered during the PD risk assessment.
This paper reviews the recent work dealing with the environmental conditions of PD activities including partial discharge inception voltage (PDIV), partial discharge characteristics, etc., and the paper aims to help understand the physics of PD inception and prevent PD inception during EM operation. It should be noted that environmental conditions could also affect the electrical aging caused by PD. For example, studies on electrical aging caused by PD can be found in [18,19,20,21,22], where the pressure effect is evaluated, while a focus on the temperature effect is given in [23,24], and finally, the humidity impact is investigated in [25,26]. However, electrical aging induced by PD is commonly considered for Type II insulation that can withstand PD. For low-voltage EMs insulated via Type I insulation, the occurrence of PD indicates the end-of-life, thus, the concept of electrical aging does not apply to Type I insulated EMs.
The PD activities could also be influenced by voltage characteristics including rise time [27,28,29,30], pulse width (determined by switching frequency and duty cycle) [27,28,31,32,33], polarity [34,35,36], and voltage type [27,35,36,37,38,39,40]. The parameters of the applied stress voltage (i.e., rise time, switching frequency, duty cycle, etc.) are also considered in the presented overview when the impact of these parameters is examined for varying environmental conditions.
The inception mechanism of PD is significantly influenced by ambient conditions, and extensive research has been conducted in this area over time. This review aims to systematically organize and categorize the existing literature, highlighting the key accomplishments achieved so far, and identifying future research directions.

2. Effect of Temperature on PD Activity

Research dealing with the temperature effect on PD activity is presented and discussed in this section. EM losses, including copper loss, iron loss, and stray loss, are the main sources of winding insulation temperature rise. The winding temperature can reach high levels, particularly in designs with high power density. As depicted in Figure 2, for a typical aerospace EM, the slot area experiences the highest temperature while the back iron remains relatively cooler due to forced air cooling through the housing. With a current density of 9 A/mm2, the winding hotspot temperature can rise up to 193 °C. The temperature distribution map provides evidence that the winding insulation is exposed to elevated temperatures, thereby posing a potential risk of premature aging, as well as enhancing the destructive consequence of the occurrence of PD in EMs.
Given the multitude of studies conducted on this subject over the years, specific criteria have been established to systematically organize and categorize the available literature. In particular, temperature range, PD measured quantities, test sample, test voltage waveform, and some distinguishing features, such as insulation material, and wire size, are selected to screen the selected research works. Based on these criteria, Table 1 provides a comprehensive overview of 33 research papers focusing on temperature-induced variations in PD activities spanning a significant time frame (i.e., from 2001 to 2023). Considering that the characteristics of impulse voltage are influenced by the power electronic systems employed and exhibit variations in real-world scenarios, the specific parameters of impulse voltage utilized during the conducted tests are also presented in the table.
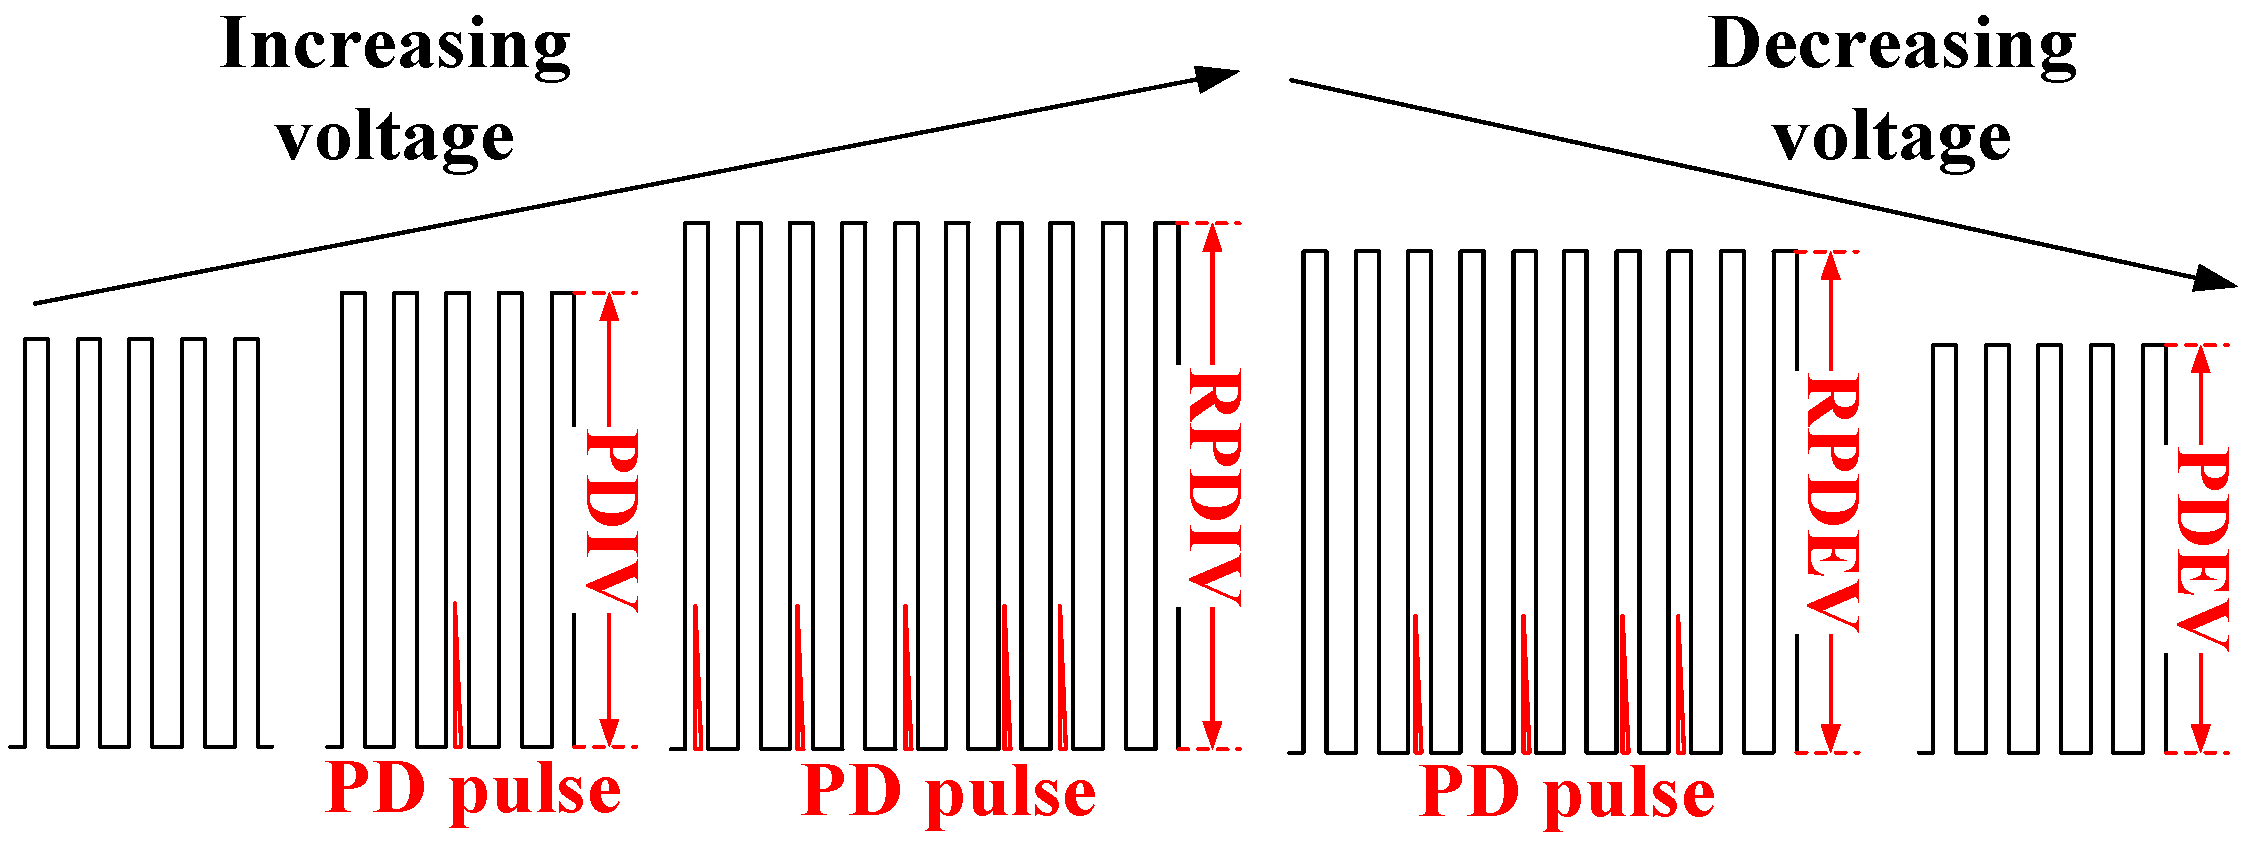
It should be noted that PDEV, RPDIV, RPDEV, and PRPD are the abbreviations of partial discharge extinction voltage, repetitive partial discharge inception voltage, repetitive partial discharge extinction voltage, and phase-resolved partial discharge, respectively. For the sake of clarity, the definitions of PDIV, PDEV, RPDIV, and RPDEV are illustrated in Figure 3. PDIV is the lowest voltage level when PD is first initiated under consecutive increasing voltage in a test arrangement [16]. As the voltage keeps increasing, the voltage level when there are more than five PD pulses on ten consecutive voltage pulses with the same polarity is recorded as RPDIV [41]. Once fewer than five PD pulses are observed, the RPDEV is obtained [41]. Once PD is initiated, the PDEV is the voltage level when PD is extinguished as voltage gradually decreases [16]. The use of PRPD represents a common approach for PD data visualization and facilitates easy understanding [42]. The magnitude of the PD pulse is represented on the vertical axis, while the AC cycle’s phase position is depicted on the horizontal scale [42]. An example of a PRPD plot can be found in Figure 4 [22].
Table 1. Summary of the literature related to temperature impact on PD activity.
Ref.Temperature Range (°C)Influencing FactorsMeasured QuantityTest Sample (Insulation Material)Test Voltage (Impulse Voltage Parameters)
[17]0 to 200 PDIV, PDEVTwisted pairs (Grade II Polyesterimide (PEI) + Polyamide-imide (PAI))Bipolar impulse (rise time (tr): 80 ns, frequency (f): 60 kHz)
[43]25 to 240 PDIVForm-winding with Litz wire (Duralco
resin, glass fiber, polyimide (PI))
Sinusoidal
[44]20 to 230 PDIVTwisted pairs (Grade II PAI)Unipolar impulse (tr: 150 ns, f: 2.5 kHz)
[45]25 to 175 PDIV, PD-frequencyTwisted pairsPWM (tr: 225 ns, f: 16 kHz (pulse) and 0.4 kHz (fundamental))
[46]60 to 155 PD magnitude, PDIV, PD delayTwisted pairsBipolar impulse (tr: 40 ns, duty cycle (dc): 50%, f: 0.05 and 10 kHz)
[47]25 to 220 PDIVTwisted pairsUnipolar impulse (tr: 40 ns, dc: 20%, f: 1 kHz)
[48]20 to 120 PRPD patternsFilm (25 μm PI with nano-Al2O3)Unipolar impulse (tr: 120 ns, dc: 50%, f: 1 kHz)
[49]10 to 60Different phaseRPDEVMotorImpulse
[50]25 to 155 RPDIV, capacitanceMotoretteUnipolar impulse
(dv/dt: 50 V/s, pulse width (pw): 50 μs, f: 1 kHz)
[51]23 to 180Insulation material (100 μm PAI, 100 and 130 μm Polyetheretherketone (PEEK))PDIVTwisted pairs Bipolar impulse (tr: 80 ns, f: 60 kHz)
[52]25 to 230Insulation material (30 μm PAI and PEEK)PDIVTwisted pairsSinusoidal
[53]25 to 250Insulation material (PI, PI with microcellular coating)PDIVParallel wireSinusoidal
[54]25 to 200Impregnation statusPDIV, dielectric spectroscopyTwisted pairs (35 μm PEI and epoxy-based resin)Sinusoidal
[55]20 to 220Impregnation statusPDIV, PDEVTwisted pairs (0.03 mm PEI + PAI and silicon resin)Unipolar impulse (pw: 0.2 ms)
[56]24 to 120Impregnation status (polyester, epoxy resin)PDIV, RPDIVStator windingSinusoidal, unipolar impulse (f: 25 Hz)
[57]Room temperature (RT) and 155Impregnation status (PEI, three other non-specified resin)PDIV, PDEVTwisted pairs Sinusoidal
[58]25 to 180Different wire (thermal-bonded, impregnated) PDIVAdjacent wire in the slot entrance Sinusoidal
[59]25 to 180Different wire (thermal-bonded, impregnated)PDIVAdjacent wire in the slot entrance Sinusoidal
[60]20 to 500Wire diameterPDIVTwo wires with a single contact point (28 μm PEI + PAI, 10 μm ceramic)Sinusoidal
[61]20 to 500Insulation material (10 μm ceramic, 0.1 mm mica phlogopite, 3–6 μm Al2O3)PDIV, resistance, tanδ, capacitanceWire wrapped on a stainless steelSinusoidal
[62]20 to 500Sample configuration, impregnation material (air, silicon, cement)PDIV, resistance, capacitanceCrossed wires, wrapped samples on metallic cylinders, coilsSinusoidal
[63]25 to 160Rise time (50, 250, 700 ns)PDIV, RPDIVTwisted pairs (39 μm PEI + PAI)Impulse
[64]25 to 125Rise time (250 to 1700 ns), voltage waveformRPDIV, PDIVTwisted pairs (0.025 mm PAI)Sinusoidal, bipolar impulse (f: 2.4 kHz (pulse) and 0.3 kHz (fundamental), dc: 50%)
[65]20 and 180Voltage waveform, different wirePDIV, PDEVTwisted pairsSinusoidal, bipolar impulse
[66]24 to 180Impregnation status, sample configurationPDIVCoil sample, specified designed sample (Grade II PAI with PEI impregnation resin)Sinusoidal, bipolar impulse (tr: 1 μs, f: 800 Hz)
[67]25 to 150Wire specificationsPDIVTwisted pairsSinusoidal
[68]20 to 180Impregnation status (epoxy and PEI resin) PDIVMotoretteSinusoidal
[69]RT to 230 PDIVTwisted pairsSinusoidal
[70]RT and 180Insulation material (Kapton film, Nomex paper, Nomex-Mylar-Nomex (NMN) paper), insulation thickness (190 and 240 μm NMN paper, 125 and 175 μm PI-FEP) PDIVMotorette, parallel wireSinusoidal
[71]25 and 150Wire sizePDIVTwisted pairs (16 to 43 μm PAI) Sinusoidal
[72]25 and 100Wire sizePDIVTwisted pairsSinusoidal
[73]32 to 160 PDIV, average discharge current, quadratic rate, accumulative apparent current, discharge powerMotorSinusoidal
[74]20 to 180Thermal agingPDIV, PDEVParallel wire (Grade II PEI)Unipolar impulse (tr: 49 ns, pw: 200μs)

2.1. Influence of Temperature on PD Activity

In general terms, the PDIV reduces monotonically with increasing temperatures up to 150 °C, as given in [43]. In fact, a higher temperature tends to reduce the required breakdown voltage of air. However, when the temperature further increases up to 240 °C, the PDIV value remains almost constant [43]. As shown in Figure 5 [44], a linear relationship is used to fit the normalized PDIV with temperature T up to 230 °C, as described by Equation (1).
Normalised PDIV = −0.0009T + 1.0169
The different trends might be attributed to the different test samples adopted during the test campaign. In fact, the form winding with Litz wire is investigated in [43], while twisted pairs made of enameled magnet wire are used in [44].
In [45], the increase in PD frequency is observed at higher temperatures when the test voltage is kept the same. As for comparison, the author reduced the excitation voltage at higher temperatures, and the PD frequency remained almost constant with the temperature variation. This finding is reasonable since a lower PDIV is measured at higher temperatures, and a greater PD frequency would be obtained if the voltage stress is kept the same. Similar to [45], twisted pairs are employed in [46,47]. A considerable PD magnitude and a longer PD delay are recorded in [46] when temperature levels ranging from 60 to 155 °C are evaluated. The theory related to the de-trapping of electrons is used to explain the experiment results. Special attention is given to the temperature impact on PDIV in [47], where the investigation is performed on twisted pairs, and the excitation voltage characteristics are also examined. A significant decrease in PDIV is confirmed over temperature variations compared to the impact of voltage characteristics, emphasizing the importance of temperature effects on PD risk.
A more fundamental sample (i.e., PI films) is investigated in [48] using rod-plate electrode configurations, as shown in Figure 6. The excitation voltage levels are kept constant while the PRPD patterns are measured under different temperature levels. The carried-out experiments proved that the number of PD events decreases with the increase in temperature, and such behavior is caused by the electrons’ boosted mobility.
Several researchers performed the PD test on motors or motorettes to derive data that could better represent the electrical insulation system (EIS) for the real case instead of using simple twisted pairs samples. In [49], PD tests are performed on three separate phases of a motor. There is a large discrepancy of RPDEV at lower temperatures and this seems to diminish when the temperature reaches up to 60 °C. Similarly, a motorette sample is used in [50], and phase-to-phase and turn-to-turn EISs are assessed. The capacitance under different temperature conditions is also measured, and the author interprets the decrease in RPDIV at high temperatures through the increase in the dielectric constant observed from the increasing temperature. Therefore, the only phase-to-phase PD inception is examined in [49], while the turn-to-turn PD inception is also evaluated in [50].
In this subsection, the characteristics of PD activity are assessed solely under varying temperature conditions. However, it should be noted that the influence of temperature on PD activity may vary when distinguishing factors (e.g., insulation material) are altered as well. The comprehensive analysis of the combined impact of temperature and other influencing factors on PD activity is presented in Section 2.2, Section 2.3 and Section 2.4.

2.2. Influence of Temperature on PD Activity Considering Different EIS

The EIS of EMs varies across different applications, and the selection of an appropriate EIS depends on several elements including voltage rating, cooling capacity, and power rating of the EMs. Furthermore, the performance of EMs is significantly influenced by the chosen EIS. Consequently, there has been a recent preference for advanced insulation materials with high thermal class and improved thermal conductivity to meet the demanding power density requirements of transportation applications.
Three temperature levels (23, 100, and 180 °C) are tested on twisted pairs made of PEEK wires and Polyamide-imide (PAI) wires in [51]. From the comparative analysis presented in [51], monotonic decreases in PDIV with the increase in temperature are observed for both insulating materials. A similar study could be found in [52], where the PEEK wire features a slightly higher reduction when the temperature changes from 25 to 230 °C (i.e., a higher operating temperature).
Aiming at improving the PDIV, new insulation materials are developed by adding microcells to the insulation film, as discussed in [53]. This methodology enables a PDIV increment over a wide temperature interval ranging from 25 to 250 °C [53]. On the other hand, the wire working temperature is also increased by incorporating microparticles. This characteristic is in line with the requirement of compact design, as higher operating temperatures allow EM designs with greater current density values. However, the procedure of adding microparticles results in an expensive EIS due to the challenging manufacturing process.
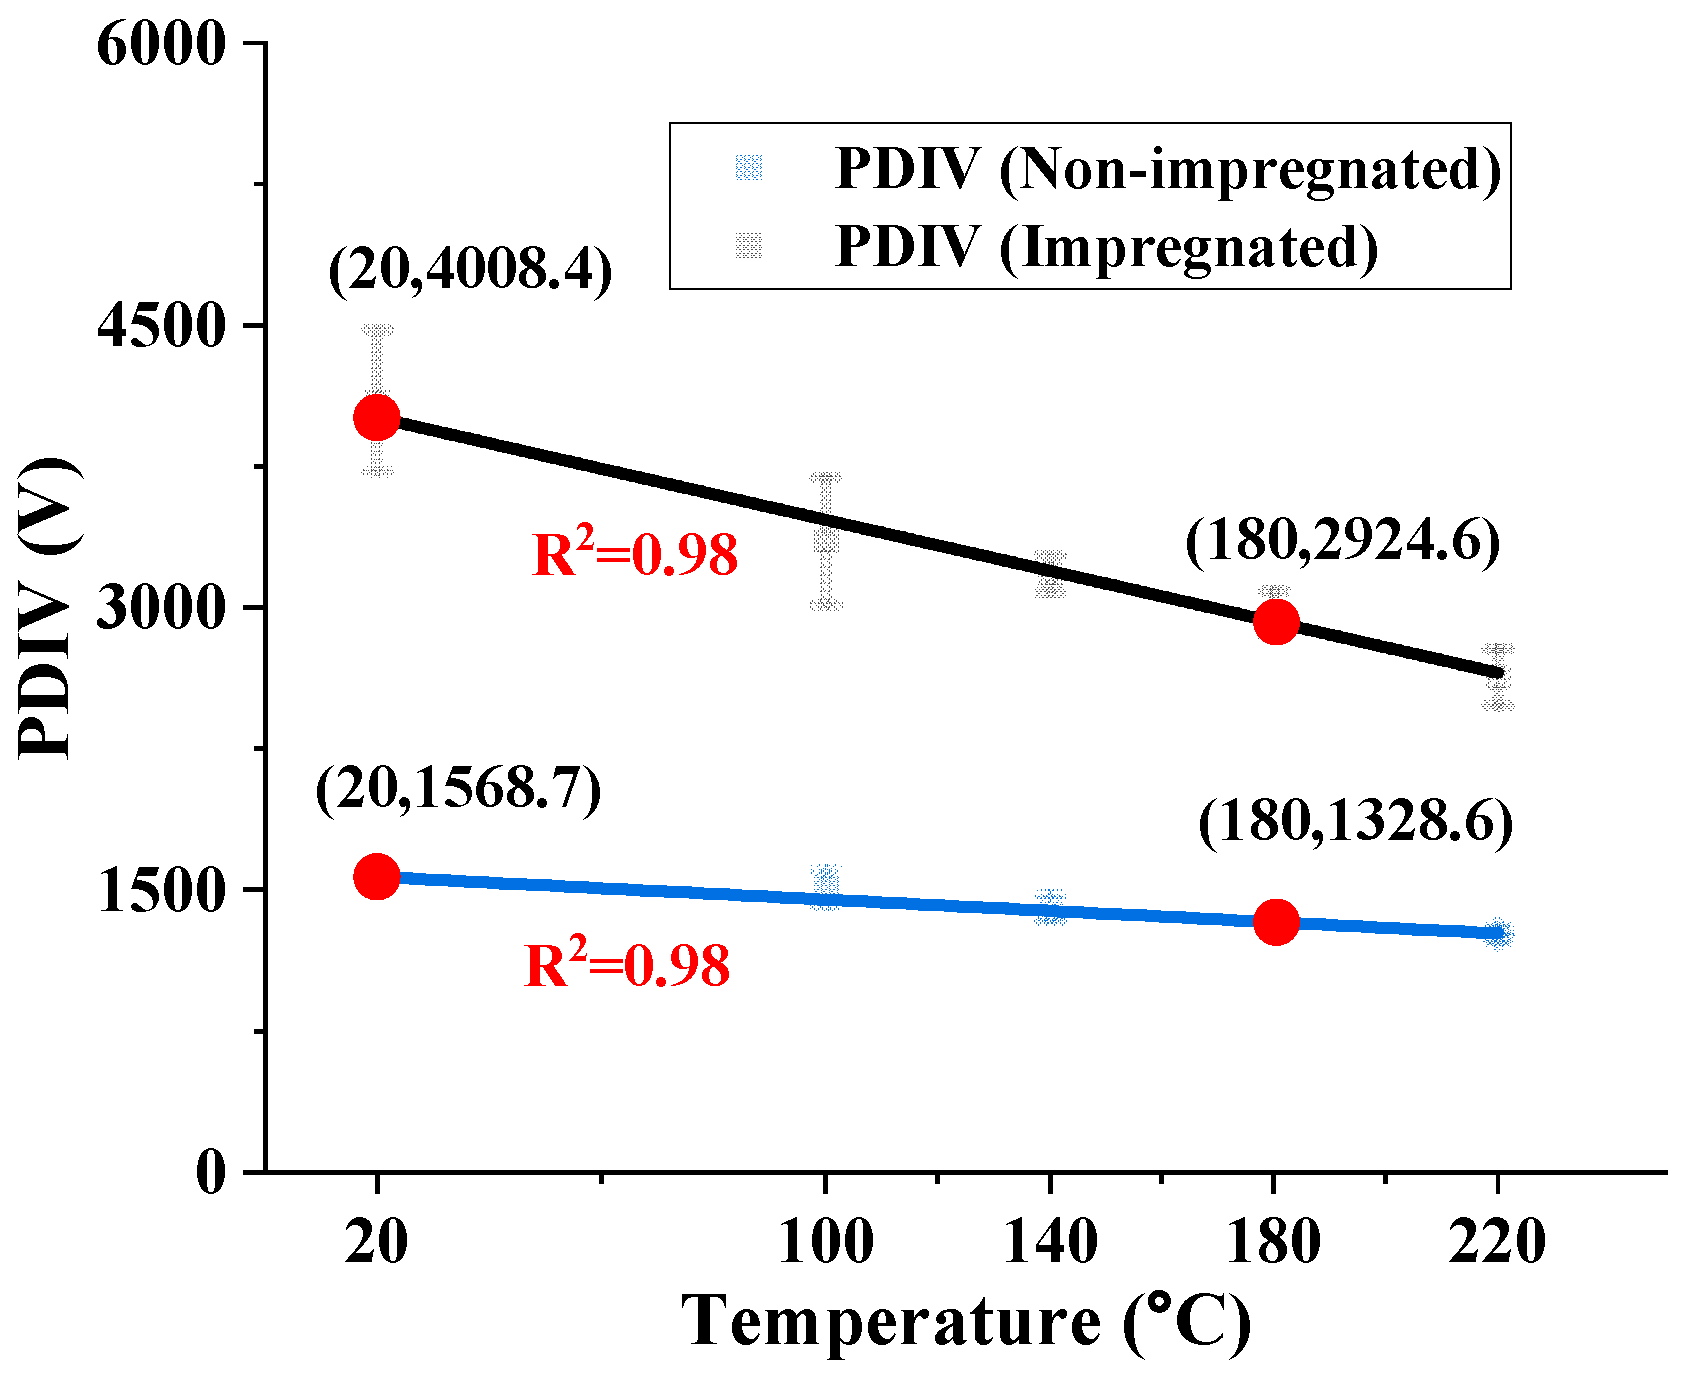
Studies on impregnated samples are also available in the literature. The impact of impregnation on PDIV performance under different temperatures is explored in [54], and the difference in PDIV caused by the impregnation process is pointed out. A significant drop in PDIV is recorded at the evaluated temperature when the sample is impregnated as shown in Figure 7 [55] and a similar trend is verified in [56,57]. The work in [58] mainly discusses the PDIV improvement of thermo-bonding methods compared to the traditional impregnation method. Similarly, the performance in terms of PDIV and thermal conductivity are compared for impregnated winding and two self-bonding wires in [59]. The impregnated winding is manufactured through the traditional vacuum impregnation method, while two kinds of self-bonding wires (i.e., enameled wire with an additional coating) are chosen for the comparative assessment. The extra insulating layer employed in self-bonding wires enables the replacement of varnish. The presented results show that a higher PDIV but worse thermal performance is detected for self-bonding solutions.
The subsequent focus is directed toward the investigation of PD in insulation materials that exhibit exceptional performance under extremely high-temperature conditions. Due to their cost, these materials are often preferred in EMs working at elevated ambient temperature environments or exhibiting high current density. In [60], the ceramic-coated wires insulated with an ultra-thin inorganic layer for high temperature is investigated and a temperature up to 500 °C is tested during the PD detection. Analyzing the obtained results, a linear decrease in PDIV with temperature is recorded until 400 °C, whereas a slight PDIV increment is measured at 500 °C. In [61], the performance of three wires with different insulation materials (i.e., ceramic, mica phlogopite, and Al2O3 insulation layer) up to 500 °C is compared. In addition, by performing tests using crossed wires, wrapped wire on a cylinder, and coils samples, the suitability of ceramic insulated wire for high-temperature EMs is verified in [62].

2.3. Combined Effect of Temperature and Voltage Characteristics on PD Activity

The interaction between temperature and stress voltage parameters is a crucial research topic, as different electric drive parameters may result in diverse voltage waveforms for EIS. Moreover, the appropriateness of employing sinusoidal voltage for qualifying inverter-fed EMs’ EIS should be further substantiated under elevated temperature conditions.
The combined effect of temperature and rise time is explored in [63]. The results highlight that the RPDIV is not correlated with rise time under RT. However, the situation changes when the temperature is above 100 °C. A slightly different trend is observed in [64], where a lower RPDIV is detected at high dv/dt. This finding holds for temperatures ranging from 25 to 125 °C.
The combined effect of voltage waveform shape (i.e., pulse and sinusoidal waveform) and temperature is studied in [65,66]. The results point out the influence of test voltage waveform on PD results, especially when a high-temperature level is considered. To be more specific, a lower reduction of PDIV under temperature variation could be observed when using impulse voltage compared to sinusoidal voltage [66]. Thus, the knowledge of the actual voltage applied to the EIS is necessary before evaluating the performance of the EIS. In fact, in transportation applications, EMs are usually inverter-fed, and the winding insulation is exposed to voltage pulses unless a current-source inverter (CSI) is employed to feed the EM (i.e., sinusoidal terminal voltage) [75].

2.4. PD Modeling Approach Considering Temperature Conditions

Paschen’s law and Schumann’s inception criterion are two common approaches for PD modeling to take into account the temperature influence on the PD inception mechanism. In [67], tests are performed at three temperatures (25, 110, and 150 °C), and different wire specifications (i.e., wire diameter, insulation thickness, and dielectric permittivity) are considered. The paper aims to model the PD activity considering the temperature effect according to Paschen’s law and Townsend’s secondary emission coefficient (i.e., the mean number of electrons emitted from the cathode for each incident positive ion [76]). A similar modeling approach using Paschen’s law is employed in [68] based on data collected on motorette samples, and in [69] where twisted pairs are used as test samples. The motorette samples generally exhibit a relatively smaller reduction in PDIV at elevated temperatures compared to the twisted pairs samples. The analysis presented in [69] also indicates that the PDIV is reduced by about 40% compared to standard ambient conditions when low pressure, high temperature, and thermal degradation are considered. Such a reduction is also reflected by the developed PD model.
Another PDIV modeling approach considering the temperature effect is discussed in [70,71], where Schumann’s inception criterion is employed, and the PD measurements are performed at a slightly lower temperature (i.e., 150 °C) [71].
A data-driven method according to the bisected deep belief network (BDBN) is introduced in [72]. The proposed model is devoid of parameter variation, yet it necessitates substantial computational efforts and exacerbates the challenges associated with model development due to the requirement of employing BDBN. In addition, the highest temperature considered is equal to only 100 °C, which seems quite low considering modern high-power density EM.

2.5. Application of PD Test Results under Different Temperature Levels

The work summarized in Section 2.1, Section 2.2, Section 2.3 and Section 2.4 primarily aims to comprehend the physics of PD under varying temperature conditions. However, certain literature is available to enhance PD risk assessment by considering PD test results at different temperature levels, such as evaluating enhancement or correction factors for implementation in the assessment process.
In [17], the PDIV and PDEV measurement results are used for temperature enhancement factor derivation. The factor of 1.15 is derived considering the worst-case temperature of 200 °C for automotive applications. Similar work can be found in [55], where experimental tests are performed on both impregnated and non-impregnated samples, and two temperature enhancement factors are determined.
A failure risk assessment relying on PD measurement at different temperature levels is addressed in [73]; a 1.6 times discharge power boost is revealed when the temperature increases from 32 to 160 °C.
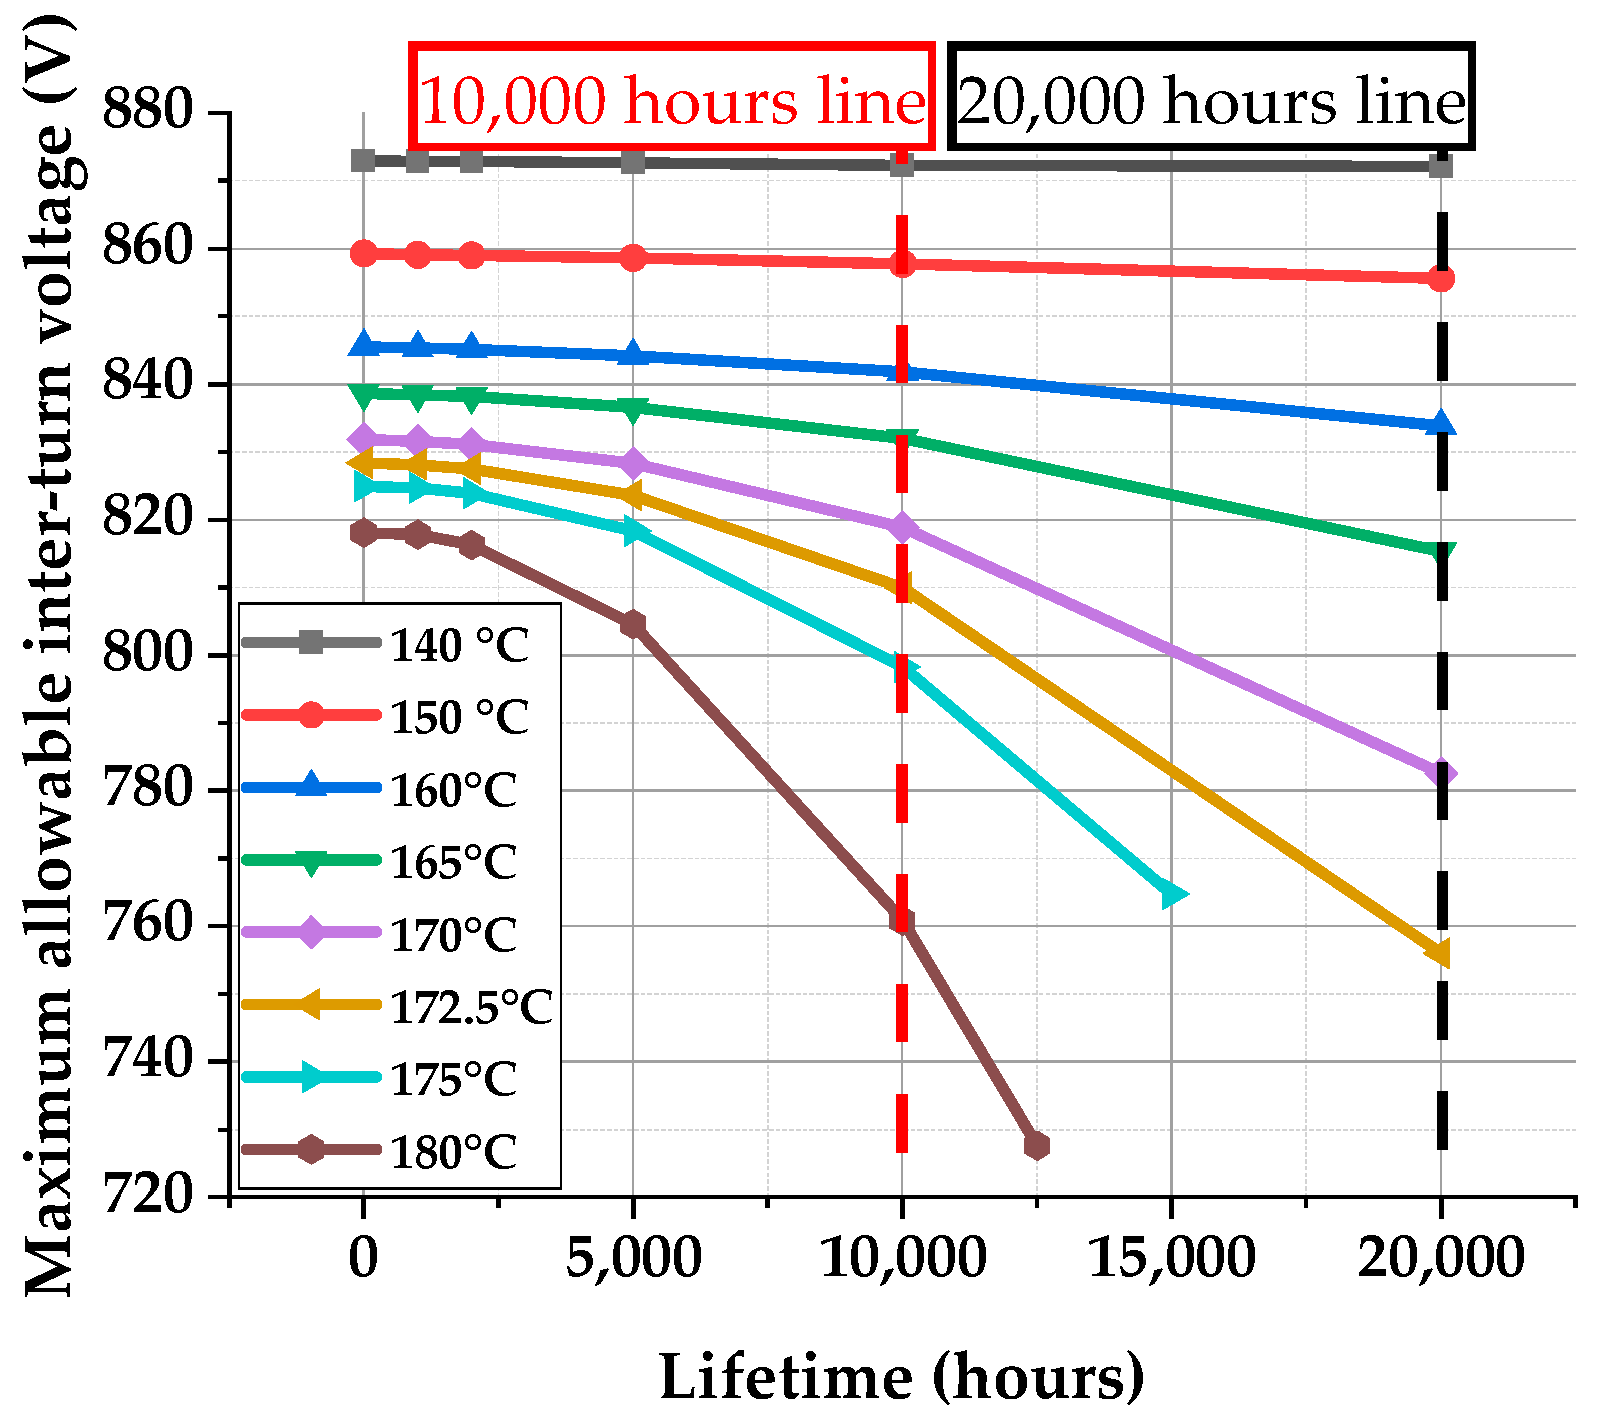
Elevated temperatures can also induce long-term degradation of insulation (i.e., thermal aging), and a decreased PDIV is observed for an aged sample. In [74], the combined effect of temperature and thermal aging is investigated, and the results are used to develop an accurate model for determining the hotspot temperature margin. In Figure 8 [74], the trend of the maximum allowable inter-turn voltage as a function of the thermal aging is shown for several operating temperatures (i.e., aging temperature). These results prove that thermal aging exposes the insulation to an increased PD risk due to the degradation of the dielectric properties. The proposed methodology supports the achievement of higher power density EM design, while ensuring safe operations in terms of PD inception risk.

3. Effect of Pressure on PD Activity

Another ambient factor affecting the PD activity is represented by the pressure, and its impact on the PD inception mechanism and PD characteristics is reviewed in this section. EMs for transportation applications might operate under a fairly low pressure level according to the data reported in In-Service Aircraft for a Global Observing System (IAGOS) [77], and presented in Figure 9 [11]. It can be seen that quite a large number of flights operate under low-pressure environments, thus highlighting the necessity for considering the associated PD risk.
Since the impact of pressure on PD might change according to the considered ambient temperature, the literature review is performed on investigations at constant temperatures (i.e., the content of subsections A to D). To provide further clarification, Section 3.1 presents the role played by pressure on the PD inception mechanism according to the EIS, while Section 3.2 discusses the combined influence of test voltage characteristics and pressure. Section 3.3 critically examines the PD modeling approach considering various pressure conditions, whereas Section 3.4 succinctly summarizes the application of PD test results across different pressure levels. The research on the combined effect of temperature and pressure on PD activity is separately discussed in Section 3.5. The review outcomes are summarized in Table 2, where pressure range, measured quantity, test sample, and stress voltage waveform are pointed out along with some influencing factors, like the analyzed insulation material.

3.1. Influence of Pressure on PD Activity Considering Different EIS

The enhancement of PDIV by adopting different insulating gases for high-voltage aerospace applications is examined in [78], and pressure levels ranging from 200 to 1000 mbar are evaluated. The findings indicate that fluorinated gases can greatly improve the PDIV for twisted wires in comparison to air. In actual applications, EMs employing fluorinated gases must be encapsulated in order to contain the insulating atmosphere. However, the encapsulation process leads to increased costs and manufacturing complexity. Additionally, there is a potential compromise in the thermal transfer capability. Therefore, insulating gases represent a promising solution for minimizing the PD risk, although practical challenges need to be further investigated and properly addressed.
A comprehensive PD test campaign under two pressure levels (i.e., atmospheric and 100 mbar) is performed in [79], where different samples (i.e., twisted pairs, stator, and motorette) and test voltages are considered. Motorette and whole stator samples allow one to evaluate the phase-to-phase and the phase-to-ground EISs, while investigations performed on twisted pair samples provide information on the only inter-turn EIS, which is commonly considered the weakest EIS. Referring to the results presented in [51], a monotonic decrease in PDIV with pressure is found for wires with different insulation materials (i.e., PAI and PEEK) and insulation thicknesses (i.e., 100 and 130 μm). Referring to the different insulation thicknesses, three insulation grades (i.e., Grade I, II, and III) with insulation thicknesses of 28, 53, and 80 μm are tested in [80] under atmospheric pressure and 100 mbar. The improvement of PDIV values by adopting thicker insulation (i.e., higher insulation grade) seems to decrease at a low-pressure condition. Focusing on the characteristics of PD activity, the occurrence of PD intensifies in tandem with a decrease in air pressure, both in terms of magnitude and frequency [81]. This outcome is confirmed on both twisted pairs and insulated wire wound with a plain metallic conductor.
Aiming at boosting the capability to withstand PD activity, corona-resistant (CR) wires are available on the market. These wires were developed for high-voltage applications, but they are becoming widespread in low-voltage inverter-fed EMs. CR wires are coated with special insulating materials, like varnish, or polymer resins, that enhance their PD resistance. Although the improvement is achieved through CR wire employment, there is not much difference between CR and non-corona-resistant (NCR) wires when different pressure levels are analyzed, as shown in [82]. According to the results presented in [82] and reported in Figure 10 for convenience, the probability of failure is almost unchanged at 1000 and 100 mbar. This observation also holds when stress voltages at several rise time values are applied to the samples. The PDIV enhancement by adding microcells to the insulation film is studied in [53], and an obvious increase in PDIV value is measured in the range from 470 to 1013 mbar.
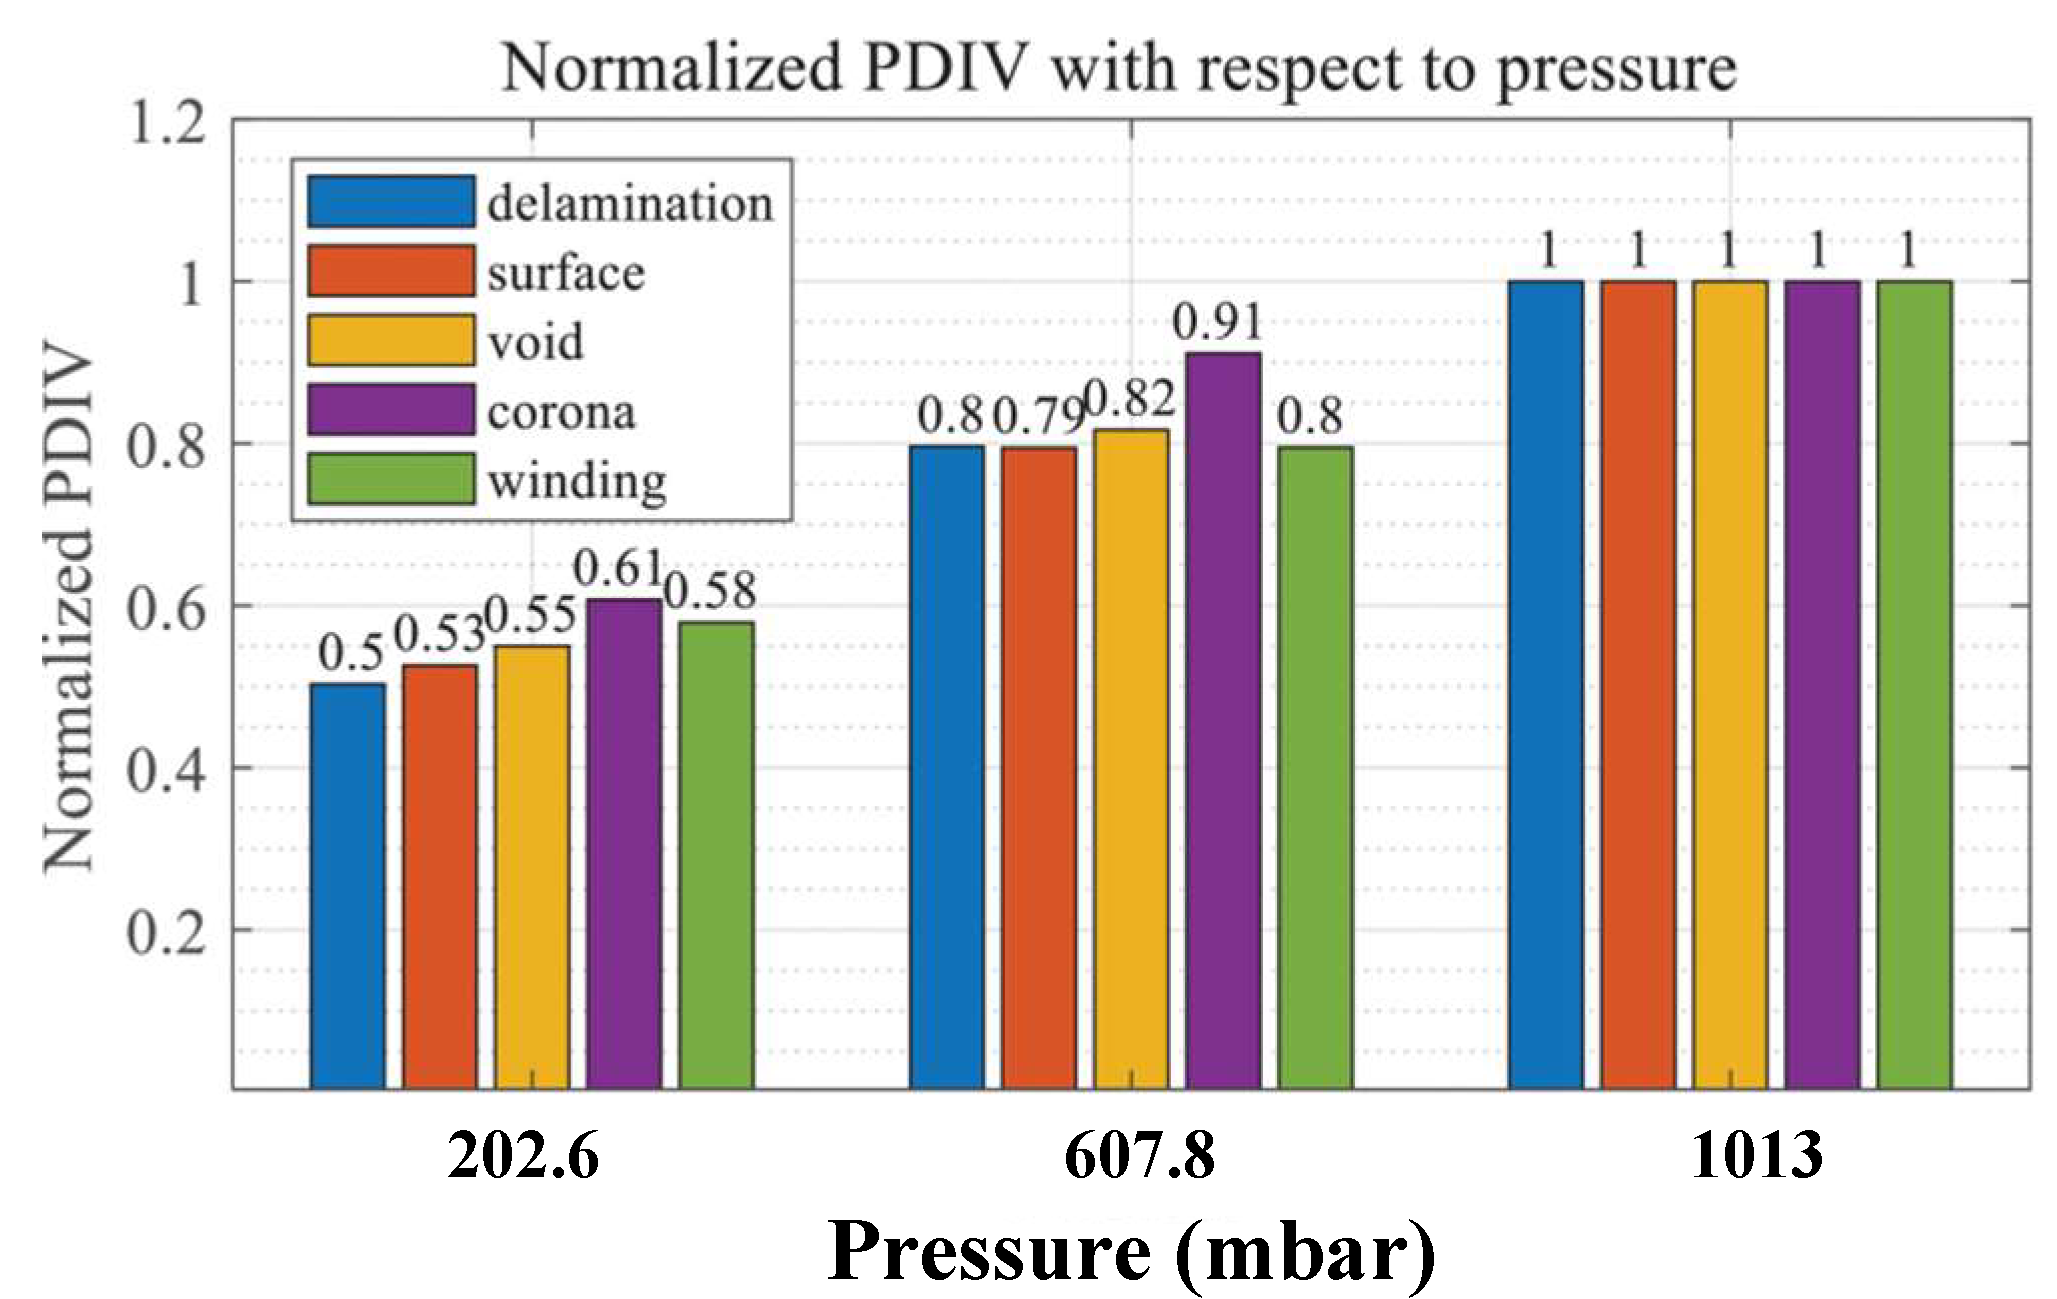
The combined effect of insulation defects and pressure levels on PD activity is discussed in [83]. In particular, the investigated defects encompass delamination, surface defects, voids, and corona defects. Voids or delamination commonly occur in the main-wall insulation of stator windings as a result of manufacturing processes and/or operating stresses. Surface discharge is caused by exposed Litz wire, while corona defects are induced by broken wire tips [83]. A monotonic decrease in PDIV with decreasing pressure is found for all four defects, as shown in Figure 11 [83]. In addition, the PRPD patterns could be used for defect discrimination. Similar test samples carried out on a 1 MW motor are given in [43] where both PDIV and PDEV are measured.

3.2. Combined Effect of Pressure and Voltage Characteristics on PD Activity

Numerous studies have highlighted the influence of pressure levels on the impact of voltage characteristics on PD activity. Therefore, it is imperative to investigate the combined effect of pressure and voltage characteristics on PD activity, which is comprehensively reviewed in this subsection.
In [44], the authors perform PD tests by applying both sinusoidal and impulse excitation voltages on the same sample type, and the study results prove that a simple sinusoidal test voltage could be used during the preliminary PD investigation, although the EM is driven by PWM voltage in the real application. Such an outcome is crucial because PD tests using sinusoidal stress voltage are easier to perform in terms of equipment, and the associated results are less affected by noise interferences compared to PD measurements involving impulse voltage. These findings are also confirmed by the results published in [22], and shown in Figure 12, where the insulating paper is investigated. In [84], it is argued that for low-pressure conditions, PD tests under 60 Hz are preferred due to their high consistency. A similar conclusion is found in [85], where the round-robin test is recommended for quality control purposes, in case of PD measurements with impulse excitation voltage.
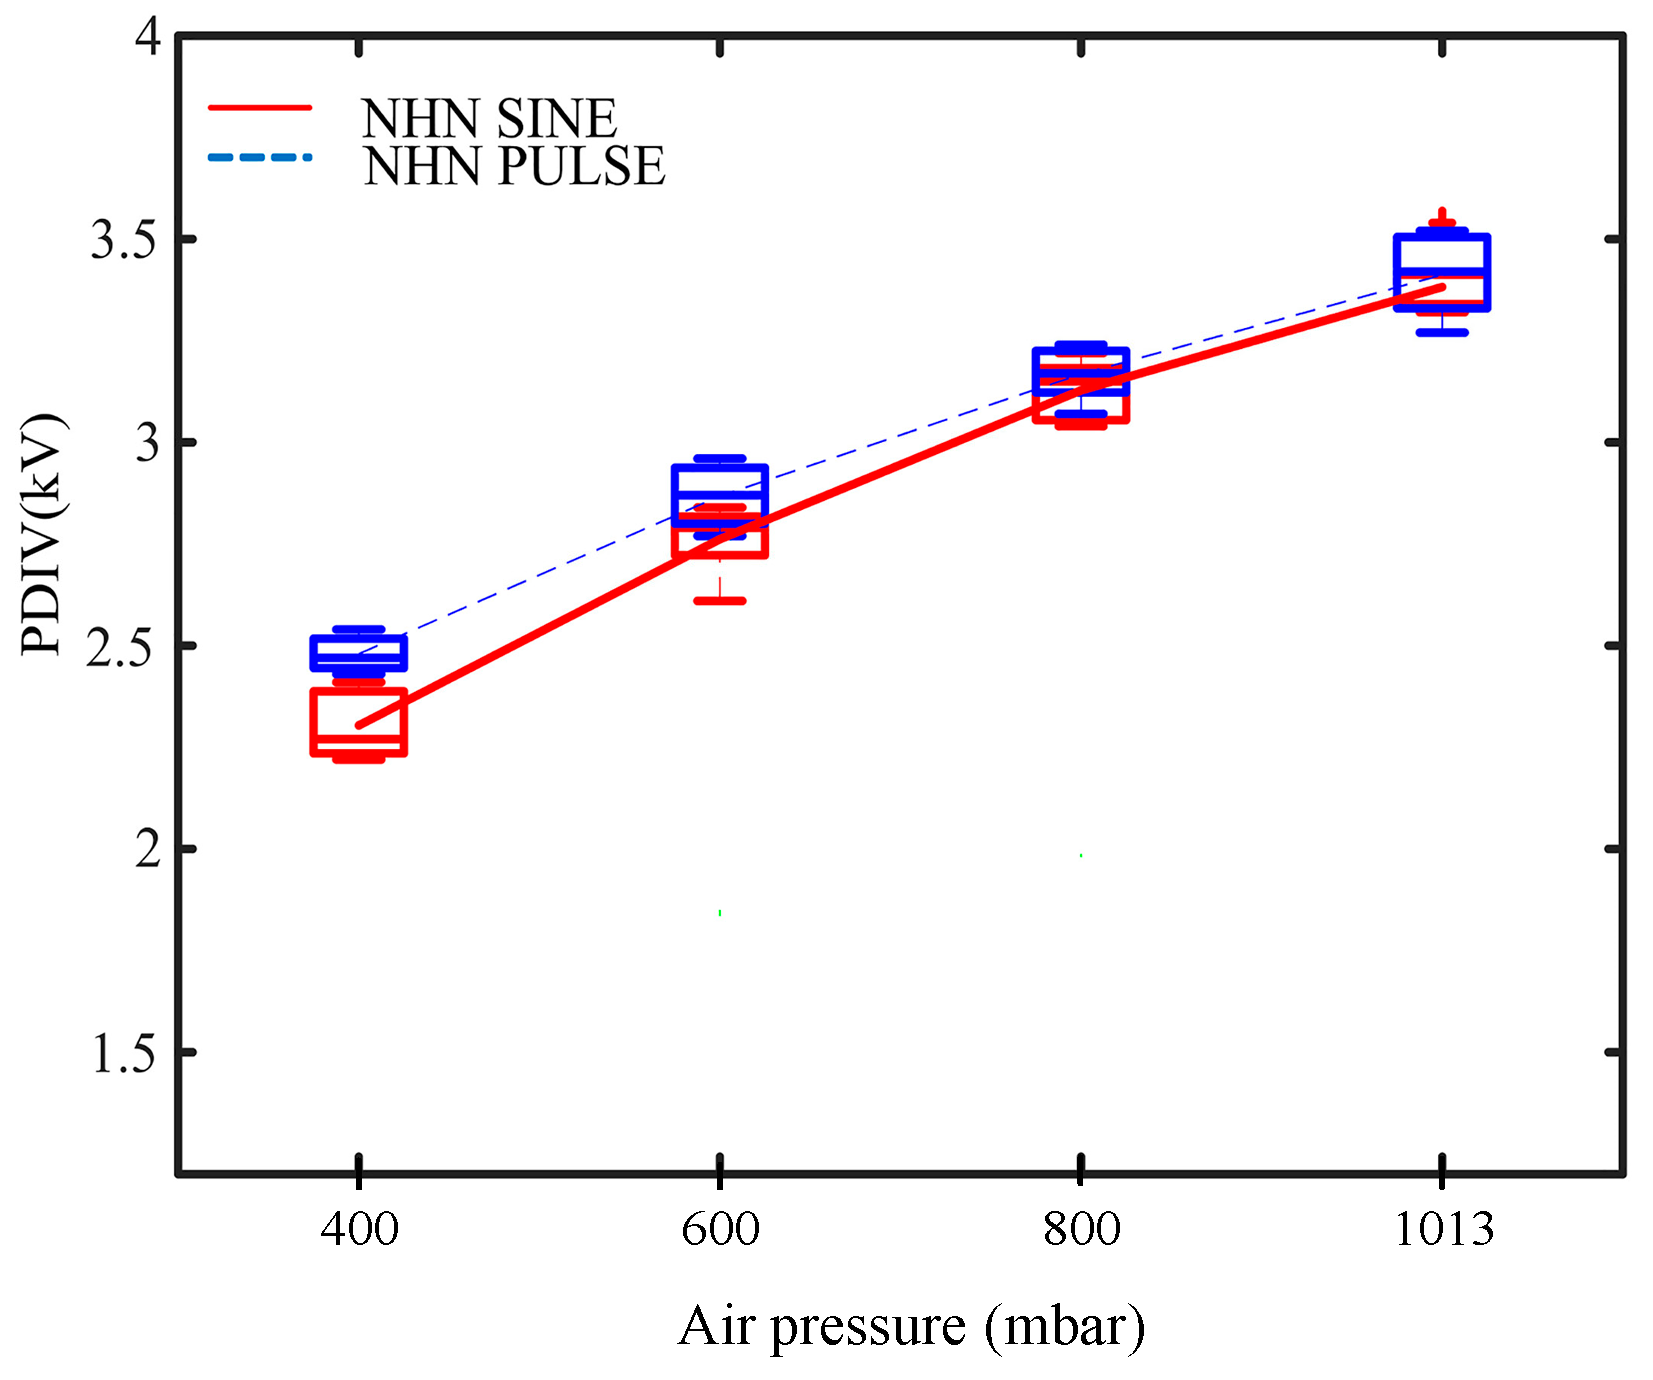
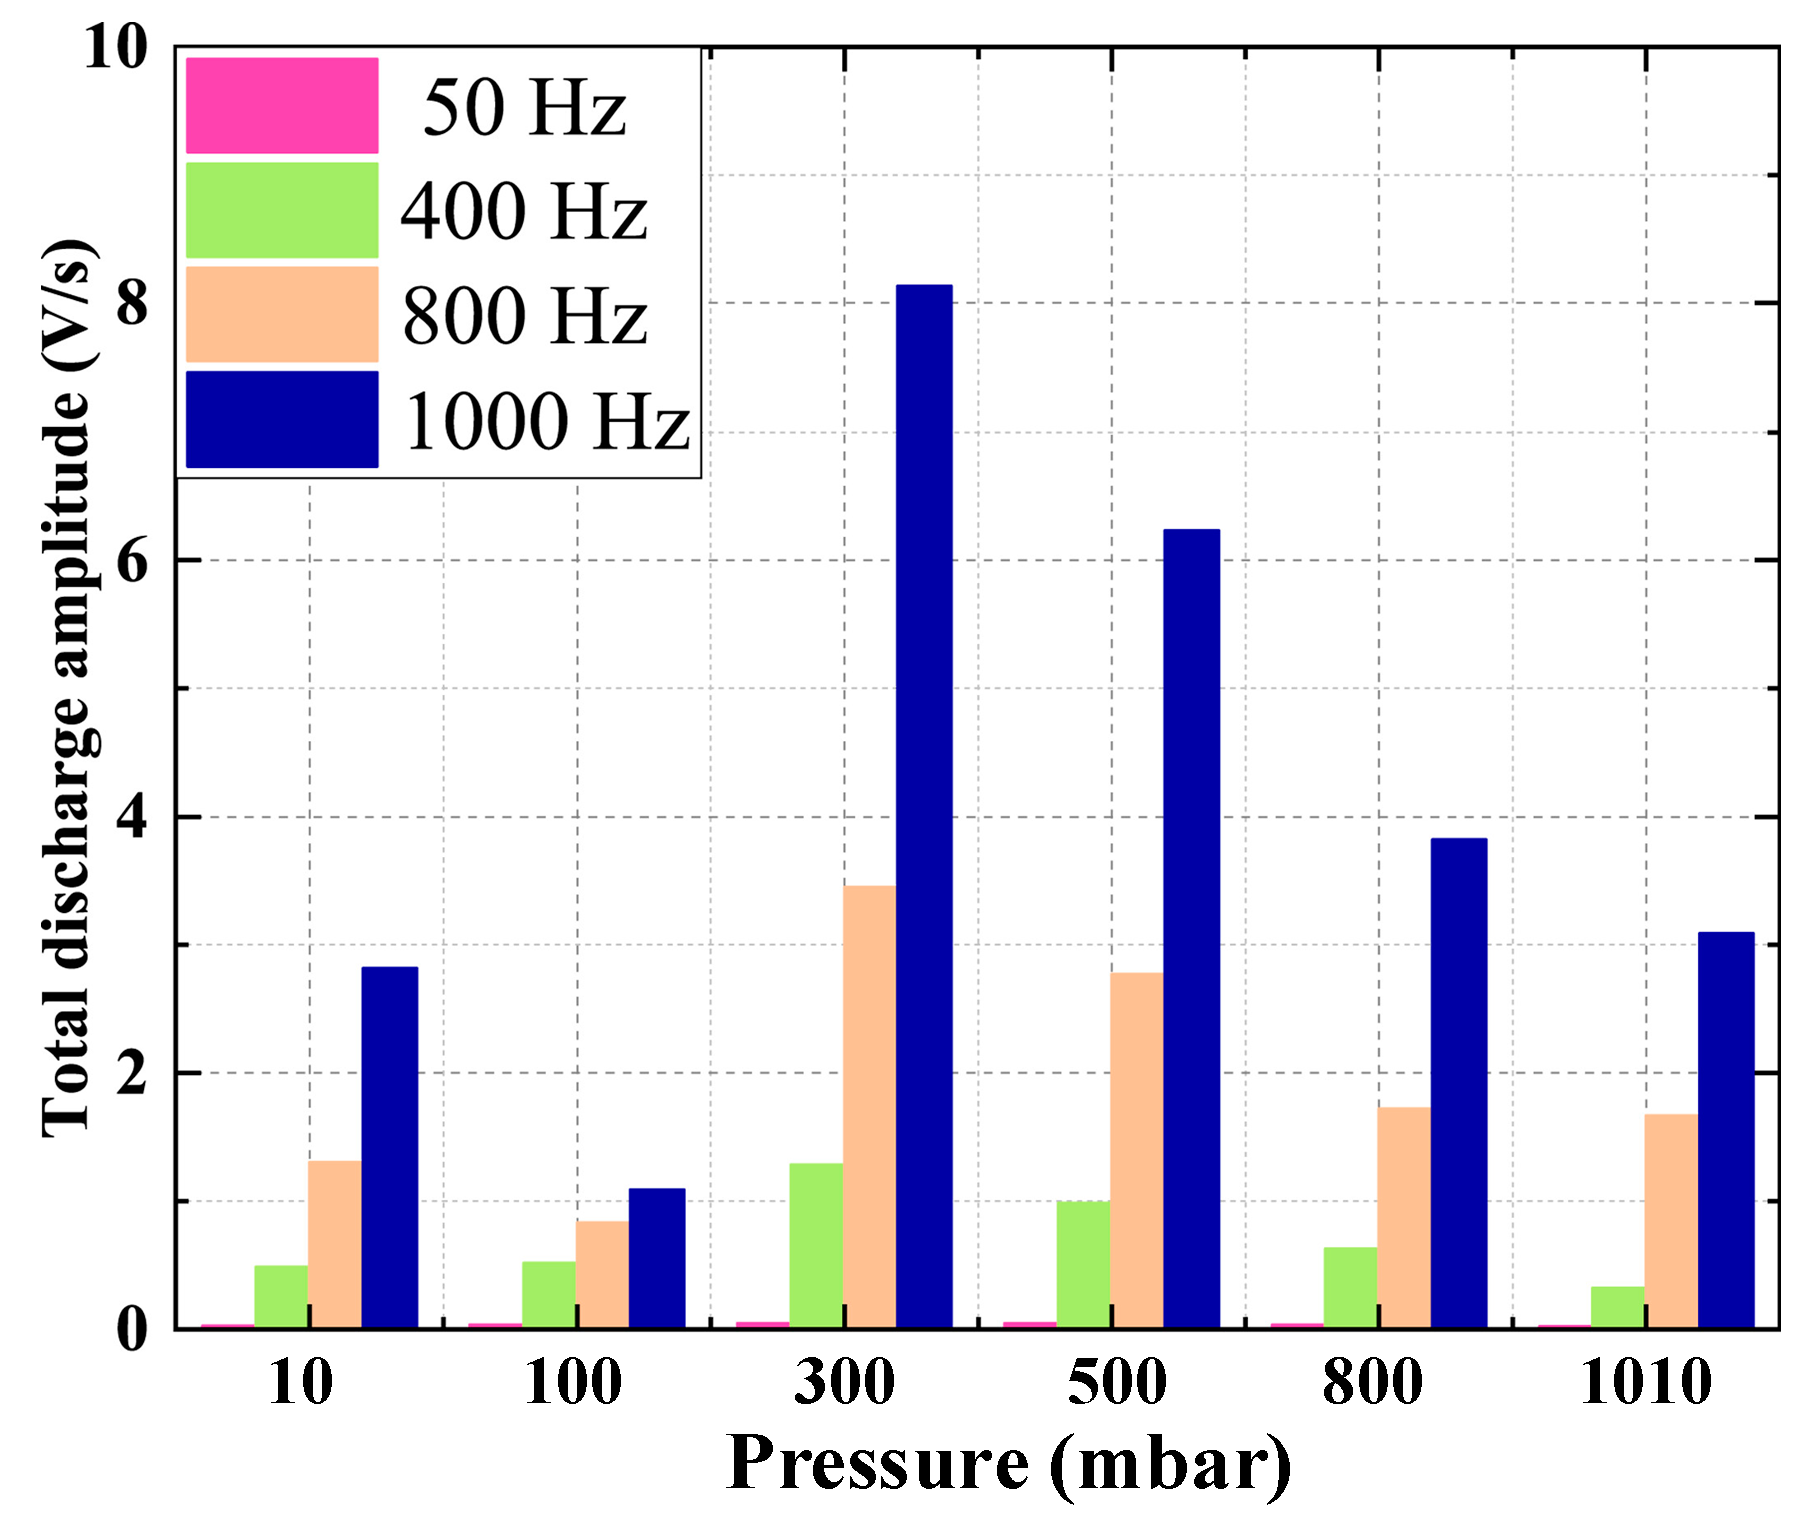
The role played by the impulse excitation voltage’s switching frequency as a function of the pressure is analyzed in [86]. The impact of switching frequency on PDIV is not significant considering the range of 50–1000 Hz. However, the amplitude and number of discharges are greatly affected by both air pressure and switching frequency, as shown in Figure 13 [11]. A consistent trend is also found in [27], where PDIV is not much influenced by the switching frequency and rise time when 110 and 1013 mbar pressure conditions are evaluated. On the contrary, shorter rise times boost the PD risk in [87].
Unipolar impulse voltage is applied to stress the test samples in [88], and the collected results indicate a consistent decline in RPDIV as the switching frequency increases. However, the recorded RPDIV reaches a stable level at 100 kHz. A similar methodology is chosen in [32], where the AC test voltages (i.e., intrinsically bipolar) are adopted instead of impulse voltages. Despite the different excitation voltage waveforms, analogous deductions are reached. Nevertheless, the conclusions outlined in [32,88] are in contrast with those in these two papers and might go against the conclusions given in [27] and [27,86]. In fact, a non-monotonic trend of PDIV as a function of pressure is highlighted in [27] and shown in Figure 14. The experimental results in [27] compare PDIV measurements performed using both sinusoidal and bipolar impulse excitation voltages applied to twisted pair samples, and the minimum PDIV value is detected within the range 50÷70 mbar. A similar trend is reported in [89], where motorette samples are used as test objects.
The mutual impact of pressure, voltage polarity, and pulse duration on PD characteristics is examined in [90]. A significant difference between the PD test under the square wave and pulse with short duration is pointed out by the measurements, which highlight the necessity of knowing the voltage waveform applied to the EIS in the actual service for extrapolating accurate findings.
As proved by [91], the PD detection method might affect the test results when the impact of pressure on PD is investigated. The test results underline that the choice of the sensor (i.e., Rogowski sensor, Jack-SMA sensor, and Jack-SMA sensor with additional capacitive effect) might lead to different PDIV values, and cut-off frequency influence becomes evident at 100 mbar.

3.3. PD Modeling Approach Considering Pressure Conditions

A PD modeling approach including the pressure effect based on Schumann’s streamer inception criterion is discussed in [92]. The model is implemented relying on the rough expression of the cavity’s inception field proposed by [82], and the pressure effect is accounted for through the expression given by Equation (2) [94].
E i = 25.2 p 1 + 8.6 p l [ V m ]
where Ei represents the inception field in a cavity, p and l are the pressure level inside the cavity, and the diameter of the cavity (or delamination thickness), respectively. However, the limitation of this method considering both pressure and frequency is pointed out in [32]. Indeed, a quite large mismatch between predictions and experiments is obtained. Conversely, a PD modeling approach based on Paschen’s law is presented in [69], whose predictions are in good agreement with the experimental results. A similar modeling methodology (i.e., Paschen’s law) is employed in [44], where the predictions at two specific pressure levels, i.e., 1013 and 500 mbar, are determined.
A comparative analysis between Schumann’s and Paschen’s models is presented in [88], where it is concluded that the PD model, according to Paschen’s law, should be avoided when attempting to forecast RPDIV values in repetitive surge scenarios. On the other hand, neglecting the change in the Schumann constant K with pressure represents a limitation of the streamer inception criterion.

3.4. Application of PD Test Results under Different Pressure Levels

The applicability of the PD test results at several pressure conditions for PD risk assessment purposes is discussed in this subsection. The PD risk for aeronautical EMs is addressed in [93] based on PDIV tests under pressure levels ranging from 100 to 1013 mbar. Similarly, a failure risk assessment relying on PD measurements at different pressure levels is presented in [73]. In particular, an eightfold increase in discharge power is observed when the pressure decreases from 1750 to 100 mbar.
In [17], the pressure enhancement factor of 1.25 is derived considering the worst-case of 500 mbar for automotive applications. The pressure enhancement factor is also determined in [55], where both impregnated and non-impregnated samples are considered.
In [44], the normalized RPDIV reduction for EMs operating at different altitudes is outlined, as shown in Figure 15 [44]. Considering an EM meant for the primary flight control surface actuator, the most critical flight phase is represented by the cruise one due to the low-pressure environment.

3.5. Influence of Pressure on PD Activity under Variable Temperature Level

As mentioned earlier, the EIS of EMs is simultaneously affected by temperature and pressure; thus, it is important to study this combined effect on PD activity. The trend of PDIV with the variation in temperature and pressure is commonly interpreted through Paschen’s curve together with Dunbar’s correction [17], as expressed by Equation (3):
E ( T , p ) = B · p · T 0 / T I n ( A · p · T 0 / T · d ) I n ( 1 1 / γ )
The breakdown field of the air, denoted as E(T, p), is affected by the temperature T and pressure p. The room temperature is represented as T0, while the distance between two electrodes is indicated by d. Parameters A and B are specific to the gas being studied (normally air if the EM is not encapsulated). The coefficient γ for secondary electron emission depends on the material used for the cathode. Referring to Figure 16 [47], a higher temperature and a lower pressure would shift Paschen’s curve towards the bottom right, and thus, a lower voltage is required to trigger the PD.
The results in [47] are collected on twisted pairs, while tests on whole stators are performed in [95]. In either case, the samples are excited through a sinusoidal voltage, and both PDIV and the number of PD are examined. However, the maximum temperature level considered is relatively low compared to the actual EM operating temperature.
In [96], a total of 25 different test conditions are considered, and Equation (4) is used to fit the trend of RPDIV(T, p) with temperature T and pressure p:
R P D I V ( T , p ) = ( a p I n p b + c ) ( 293.15 T ) d
where a, b, c, and d are parameters determining the shape of the fitting curve. An R2 of 0.9639 is obtained for the curve fitting using Equation (4). On the contrary, a linear relationship is adopted in [97] as shown in Figure 17, and a reasonable goodness of fit correlation is still achieved, i.e., R2 equal to 0.955.
In addition to the curve fitting approach, PDIV modeling based on Schumann’s inception criterion is adopted, as chosen in [98], where both temperature and pressure effects are considered. In fact, these models or test results are mainly used to evaluate the PD risk of EMs for aerospace applications (e.g., propulsion motors [99] and aerospace actuators [100]), since these EMs suffer from both high service temperature and low pressure simultaneously.
Litz wire is a preferred choice for EM design working at high frequency due to its reduced AC copper losses, albeit at a higher cost. Since Litz wires are gaining attention in some applications, their behavior in terms of PD is studied. PD tests on Litz wire reveal that the air pressure impact is more pronounced compared to standard enameled, as discussed in [101].
Similarly to Litz wire, CR wire is also becoming popular, as mentioned earlier. A comparative analysis between CR and NCR wires is given in [102], where not much difference in terms of PDIV and PDEV is detected. The effect of rise time on PDIV is also examined in [102], and stress voltage with rise time in the range of 30 ÷ 200 ns has less impact on PDIV. The literature discussed in this subsection is summarized in Table 3, including both pressure and temperature ranges.

4. Effect of Humidity on PD Activity

The last ambient factor, i.e., humidity, is reviewed in this section. In practical terms, EM’s windings are often protected from humidity by increasing the protection degree of the EM enclosure. Similarly to the air pressure, the humidity is also affected by the ambient temperature. Indeed, compared to cold air, warm air has the capacity to hold a greater amount of water vapor (moisture). Consequently, when the absolute humidity remains constant, cooler air will exhibit higher RH, while warmer air will display lower RH. Thus, the research conducted at a fixed temperature is reviewed in Section 4.1 and Section 4.2, while the experiments performed under a variable temperature are discussed in Section 4.3. The main contributions dealing with constant temperature investigations are listed and categorized in Table 4, whereas the literature addressing the humidity effect on PD activity considering variable temperature is listed in Table 5.

4.1. Influence of Humidity on PD Activity under a Fixed Temperature

The present subsection groups the investigations where only humidity variations are evaluated, while Section 4.2 addresses the combined impact of humidity and distinguishing factors, such as insulation material and rise time, on PD activity.
A monotonic decrease in PDIV with RH is found when different test samples are considered. A test object of polyimide film is used in [25], while twisted pairs are adopted in [45]. Although different test samples are employed, the PD tests are performed by applying impulse voltage. Assuming a fixed terminal voltage of 0.9 kV, a clear increase in PD frequency with humidity is noted in [45]. The stator coil winding samples are adopted in [103,104], and a linear function is used to fit the trend of RPDIV with humidity [104]. Finally, the test performed on a whole motor is performed in [49], where a discrepancy between the RPDIV value of phase U and the other two phases is pointed out, which is caused by the time taken by the humidity to spread out.
In addition to investigating the inception mechanisms of PD under varying humidity conditions, it is imperative to pay special attention to the characteristics of PD activity across different humidity levels. The results in [105] show a good correlation between PD characteristics with humidity. To be more specific, lower PDIV, smaller PD magnitude, higher PD pulses, and shorter PD time lag are observed for a greater humidity level. These results are collected under sinusoidal voltage excitation, while a similar study is carried out in [106], where the measurements are performed under impulse voltage. By changing the excitation source, the highest PD magnitude and the shortest discharge time are detected under 90% of RH [106].
The previous paper’s results rely on the direct detection of PD inception, while an indirect method could be also employed via a dissipation factor test. The dissipation factor tip-up test is introduced to explain the humidity impact on PDIV [107]. In fact, by observing different trends of dielectric properties under different RH levels, the formation of water film is deduced and electrostatic field simulations are used to validate the water film presence. Similarly, in [108], the electric field distribution is simulated using finite element analysis considering rectangular wire samples. The obtained results indicate that variations in the moisture layer’s positioning led to peculiar electric field distributions, which subsequently affect the PDIV value.
Table 4. Summary of literature related to humidity impact on PD activity at constant temperatures.
Ref.RH Range %Influencing FactorsMeasured QuantityTest Sample (Insulation Material)Test Voltage (Impulse Voltage Parameters)
[25]40 to 95 PDIVBar-plate electrode (0.1 mm PI film)Sinusoidal
[45]5 to 70 PDIV, PD-frequencyTwisted pairsPWM (tr: 225 ns, f: 16 kHz (pulse) and 0.4 kHz (fundamental))
[47]30 to 90 PDIVTwisted pairsUnipolar impulse (tr: 40 ns, dc: 20%, f: 1 kHz)
[49]10 to 90Different phaseRPDEVMotorImpulse
[51]55 to 100Insulation material (100 μm PAI, 100 and 130 μm PEEK)PDIVTwisted pairs Bipolar impulse (tr: 80 ns, f: 60 kHz)
[52]50 to 95Insulation material (40 μm PAI and Polyphenylene-sulfide)PDIVRectangular wireSinusoidal
[55]30 to 90ImpregnationPDIV, PDEVTwisted pairs (0.03 mm PEI + PAI and silicon resin)Unipolar impulse (pw: 0.2 ms)
[103]18 to 70 RPDIVStator coil windingBipolar impulse (pw: 2.6 ms,
tr: 0.14 μs)
[104]30 to 90 RPDIVStator coil windingBipolar impulse
(pw: 7.6 μs, tr: 0.14 μs)
[105]33 to 98 PDIV, surface resistivity, average PD magnitude, number of PD pulses, time lagCIGRE method II type (1 mm polymethylmethacrylate (PMMA))Sinusoidal
[106]30 to 90 Discharge time, PD magnitudeTwisted pairs (PI)Unipolar impulse (tr: 10 ns, voltage duration: 200 ns)
[107]30 to 90 PDIV, dissipation factor, capacitanceTwisted pairs (Grade II PEI)Sinusoidal
[108]20 and 90Pre-discharge time, insulation thickness (40 and 160 μm PAI)PDIVRectangular wireSinusoidal
[109]30 to 90Pulse repetition frequency (60 to 106 pulse per second (pps))PDIV, RPDIVTwisted pairs (0.036 mm PAI)Unipolar impulse
[110]39 to 89Rise time (514, 967 ns)PDIVTwisted pairsImpulse
[111]30 to 60Thermal agingPDIV, capacitanceTwisted pairs (Grade II PEI)Sinusoidal
Table 5. Summary of literature related to humidity impact on PD activity at variable temperatures.
Reference NumberRH Range % Temperature Range (°C)Influencing FactorsMeasured QuantityTest Sample (Insulation Material)Test Voltage (Impulse Voltage Parameters)
[17]30 to 8520 to 80 PDIV, PDEVTwisted pairs (Grade II PEI + PAI)Bipolar impulse (tr: 80 ns, f: 60 kHz)
[112]40 to 9530 to 80 PDIV, light intensityTwisted pairs (PEI)Sinusoidal
[113]20 to 9525 to 90 PDIV, surface conductivityTwisted pairs (Grade II PEI + PAI)Sinusoidal
[114]50 to 9730 and 90 PDIV, discharge current, accumulated charge, cumulative energyMotorSinusoidal
[115]30 to 8030 to 80Insulation material (PEI + with/without nano-sized inorganic material of layered silicate)PDIV, PD charge, relative permittivity, dielectric lossTwisted pairsSinusoidal
[116]30 to 9030 to 90 PDIV, dissipation factor, capacitanceTwisted pairs (0.035 mm PEI)Sinusoidal
[117]20 to 9025 to 90 PDIVTwisted pairs (28.5 µm PEI + PAI)Sinusoidal

4.2. Combined Effects of Humidity and Other Factors on PD Activity under a Fixed Temperature

The investigation of multiple factors poses challenges due to the significant interaction effect, particularly when considering the impact of humidity. Unraveling the intricate interplay among these factors is crucial for achieving a comprehensive understanding of PD physics.
In [51], three RH levels (55, 80, and 100%) are considered, and the tests are performed on twisted pairs. Two PEEK wires with different insulation thicknesses, and an enameled wire coated with PAI insulation are investigated. A much higher drop in PDIV is recorded for the PEEK wire when the RH changes from 80% to 100%.
Twisted pair samples are also used in [55], where a comparative analysis between impregnated and non-impregnated samples is presented. The impregnated sample is more influenced by humidity variation due to the porosity of the impregnation varnish. Additionally, the collected results feature a higher level of discrepancy caused by the different degrees of moister absorption.
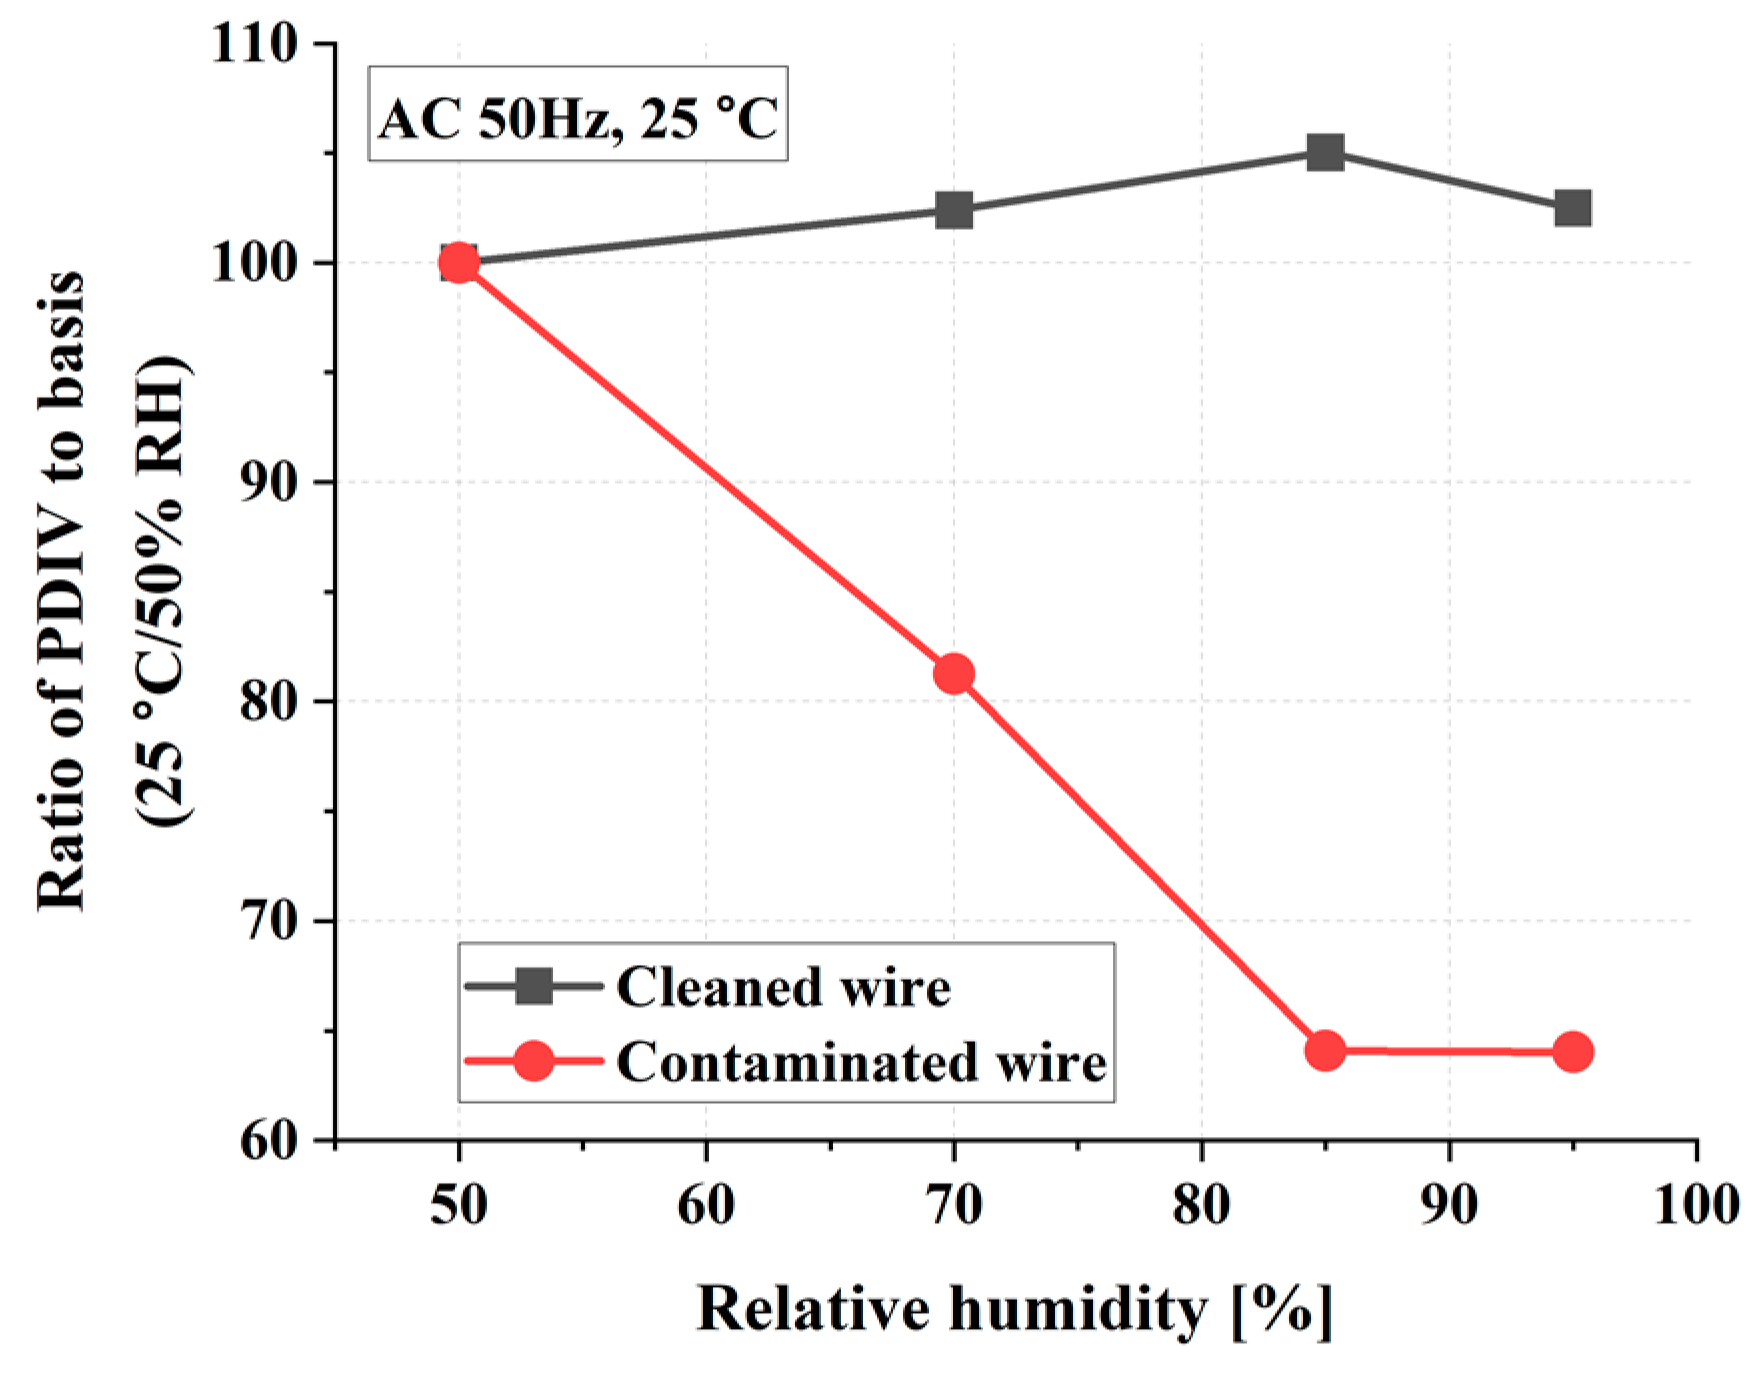
Apart from twisted pair samples made of round enameled wire, investigations on rectangular wire samples are also available in the literature, since wires with rectangular cross-sections are becoming attractive in the automotive sector. An example is found in [52], where the dependence of PDIV on humidity is affected by contamination, as shown in Figure 18. For a clean wire, the PDIV is almost irrelevant to the humidity level. However, for a contaminated wire, a decrease in PDIV at higher humidity levels is measured. In fact, contaminants facilitate the occurrence of PD on the insulation surface.
The mutual impact of testing voltage parameters (e.g., stress voltage rise time) and humidity on PD activity is also examined. The findings in [109] indicate that the impact of humidity on RPDIV is less pronounced at high pulse repetition frequencies (PRFs) exceeding 10 kilo pulses per second (kpps) compared to low PRFs. The study demonstrates that a pulse generator operating at a high PRF (i.e., above 10 kpps) can effectively assess reliable RPDIV in insulation tests conducted on real motor coils, where controlling ambient humidity is challenging. In [110], two rise time values (i.e., 514 and 967 ns) are considered, and the monotonic trend of PDIV with humidity still holds regardless of humidity level. However, a large drop is found when RH changes from 39 to 50% for voltage featuring 967 ns rise time.
The paper previously analyzed performed the experimental tests campaign on brand new samples, although the insulation aging and the resulting decay of the dielectric properties might affect the PD inception mechanism in a relevant humidity environment. This aspect is dealt with in [111], where the impact of thermal aging is experimentally investigated at different RH conditions. From this investigation, the trend of PDIV as a function of the RH is drawn after thermally aging the samples at 250 °C for 96 h.

4.3. Influence of Humidity on PD Activity under Variable Temperature

As already mentioned, the impact of RH on PD is influenced by the ambient temperature, and in this subsection, a comprehensive review of the research conducted at variable humidity and temperature values is presented.
In [112], the utilization of optical emission spectroscopy (OES) is employed to examine the PD inception on twisted pairs. The findings indicate a correlation between humidity and an increase in the electric field within the air gap, which serves as compelling evidence for a reduction in PDIV when operating in high-humidity conditions. While the electric field strength determined by the OES data is influenced by both humidity and temperature, the temperature has a minimal impact on the calculated electric field within the air gap between wires.
The measurement of surface conductivity is conducted at various conditions in [113], and the increase in surface conductivity caused by higher temperature and humidity levels may lead to a decrease in the electric field within the air gap, thereby potentially reducing the occurrence of PD. An opposite trend of PD characteristics with RH is observed in [114], when 30 °C and 90 °C are evaluated as ambient temperatures. The corresponding results are reported in Figure 19, highlighting both inception voltage and discharge current values. These results are primarily explained by the interaction between the byproducts of the discharge and the molecules present in water, leading to the creation of a conductive path on the insulation’s surface [114].
Considering the advancements in insulation materials, the impact of ambient humidity and temperature on the PD properties in twisted pairs using conventional and nanocomposite enameled magnet wires is investigated in [115]. In particular, PDIV and apparent PD charge are measured when a 60 Hz AC sinusoidal waveform voltage is applied to stress the samples. The obtained PDIV trend is attributed to variations in the dielectric constant of the enameled wires caused by moisture absorption and changes in surface wettability.
In [17], a humidity enhancement factor is introduced, and its value is equal to 1.24 at 85% RH (i.e., worst-case scenario). The humidity enhancement factor is determined by measuring PDIV and PDEV on twisted pairs at three temperatures (i.e., 20, 50, and 80 °C) and RH levels ranging from 30 to 85%.
The reciprocal humidity and temperature impact on PDIV is also studied by means of indirect PD measurements via the dissipation factor tip-up tests. A study employing indirect PD measurements is found in [116], where the different trends of dielectric properties at several RH and temperature levels as shown in Figure 20 denote the formation of water film on the insulating material surface.
The PDIV modeling approach for humidity variation considering the temperature effect is addressed in [117]. The proposed PDIV model is based on the Schumann inception criterion and the Schumann constant is derived as a function of both RH and temperature.

5. Discussion and Conclusions

According to the performed review, the temperature impact on PD activity was extensively studied considering a wide range of temperatures from 0 to 500 °C (ceramic coated wire). Pressure plays a significant effect on PD activity and its impact is not negligible in EMs meant for transportation applications. The combined effect of pressure and temperature on PD activity is well-studied, and accurate PDIV prediction models are available. The data collected under the combined influence of both temperature and pressure are extremely important for the PD risk assessment of transportation EMs. Indeed, these EMs are prone to experience higher temperatures and lower pressure levels during service. Considering the current research progress, a future step in developing more accurate and comprehensive PDIV models would consist of extending the model by including the influence of the stress voltage parameters (i.e., rise time, waveform polarity, etc.).
The impact of RH on PD activity remains the key difficulty considering the complex mechanisms. In fact, the trend of PDIV with RH differs from paper to paper especially considering the temperature effect. One possible reason is that the effect of RH on electrical field distortion caused by water film formation varies from sample to sample. In addition, the RH environment provided by the humidity chamber might differ from lab to lab. For example, distilled water or non-distilled water used during the experiment might cause a significant variation in the collected results. Thus, more work aiming at understanding the physics of PD under humidity influence is required and more fundamental research should be performed in the frame of standardized recommendations.
From a test sample point of view, twisted pairs are the most frequently adopted samples, according to Table 1, Table 2, Table 3, Table 4 and Table 5, due to their easy structure and affordable cost. In terms of the stress voltage waveforms, sinusoidal voltage is the preferable choice for PD tests, although most EMs for transportation are driven by PWM voltage. Indeed, sinusoidal test voltage is often chosen for research purposes and even for insulation qualifications, referring to the IEC 60034-18-41 [16]. The reason behind the dominance of PD tests performed under sinusoidal excitation is the simplicity of the equipment arrangement and the mitigated impact of voltage parameters. Further, the PD tests carried out under sinusoidal excitation often serve as references for future studies where the impulse voltage with different rise times, polarity, and pulse widths are investigated. Considering the measurement quantity, (R)PDIV is mostly employed, because it is directly related to the PD risk, which is the primary source of failure in Type I EIS.
Summarizing, recent works dealing with the environmental conditions effect on PD activity were reviewed with the purpose of providing a global overview of the current status of the research on the subject. Several aspects, including phenomenon discussion, modeling approach, and results applications, were included. The main details about all the analyzed publications are summarized into separate tables for other researchers’ convenience, in order to make available an index of content for scholars approaching this research field.

Author Contributions

Conceptualization, Y.J. and P.G.; methodology, Y.J.; software, Y.J.; validation, Y.J., P.G. and W.Z.; formal analysis, Y.J. and P.G.; investigation, Y.J.; resources, Y.J.; data curation, W.Z.; writing—original draft preparation, Y.J.; writing—review and editing, P.G. and W.Z.; visualization, Y.J.; supervision, P.G. and W.Z.; project administration, W.Z.; funding acquisition, Y.J. and W.Z. All authors have read and agreed to the published version of the manuscript.

Funding

This research is supported by the Postdoctoral Fellowship Program of CPSF under Grant Number GZB20240332. This work was supported by the Ningbo Natural Science Foundation under Grant 2023J192.

Data Availability Statement

The article information collected in this review is data available publicly accessible repositories: IEEE Xplore (https://ieeexplore.ieee.org/Xplore/home.jsp); Wiley Online Library (https://onlinelibrary.wiley.com/); IOPscience (https://iopscience.iop.org/); Springer (https://link.springer.com/) and were accessed on 2 July 2024.

Conflicts of Interest

The authors declare no conflicts of interest.

References

  1. Bilgin, B.; Magne, P.; Malysz, P.; Yang, Y.; Pantelic, V.; Preindl, M.; Korobkine, A.; Jiang, W.; Lawford, M.; Emadi, A. Making the Case for Electrified Transportation. IEEE Trans. Transp. Electrif. 2015, 1, 4–17. [Google Scholar] [CrossRef]
  2. Sarlioglu, B.; Morris, C.T. More electric aircraft: Review, challenges, and opportunities for commercial transport aircraft. IEEE Trans. Transp. Electrif. 2015, 1, 54–64. [Google Scholar] [CrossRef]
  3. Madonna, V.; Giangrande, P.; Galea, M. Electrical Power Generation in Aircraft: Review, Challenges, and Opportunities. IEEE Trans. Transp. Electrif. 2018, 4, 646–659. [Google Scholar] [CrossRef]
  4. European Environment Agency. Greenhouse Gas Emissions from Transport in Europe. 2020. Available online: https://www.eea.europa.eu/data-and-maps/indicators/transport-emissions-of-greenhouse-gases/transport-emissions-of-greenhouse-gases-12 (accessed on 15 March 2023).
  5. European Environment Agency. Air Pollution Still Too High across Europe. 2018. Available online: https://www.eea.europa.eu/highlights/air-pollution-still-too-high (accessed on 15 March 2023).
  6. European Commission JRC Technical Reports. Identifying Key Priorities in Support to the EU Macro-Regional Strategies Implementation; An Ex-Ante Assessment for the Adriatic-Ionian and Alpine Regions Focusing on Clean Growth in Transport and Bioenergy. 2019. Available online: https://www.researchgate.net/publication/331864691_Identifying_key_priorities_in_support_to_the_EU_Macro-regional_Strategies_implementation_An_ex-ante_assessment_for_the_Adriatic-Ionian_and_Alpine_regions_focusing_on_clean_growth_in_transport_and_bioe/references (accessed on 15 March 2023).
  7. Samaras, Z.; Vouitsis, I. 3.13—Transportation and Energy. In Climate Vulnerability; Pielke, R.A., Ed.; Academic Press: Oxford, UK, 2013; pp. 183–205. [Google Scholar]
  8. NASA. Global Climate Change; Vital Signs of the Planet; Understanding Our Planet to Benefit Humankind. Available online: https://climate.nasa.gov (accessed on 15 March 2023).
  9. Giangrande, P.; Galassini, A.; Papadopoulos, S.; Al-Timimy, A.; Calzo, G.L.; Degano, M.; Galea, M.; Gerada, C. Considerations on the development of an electric drive for a secondary flight control electromechanical actuator. IEEE Trans. Ind. Appl. 2019, 55, 3544–3554. [Google Scholar] [CrossRef]
  10. Aghabali, I.; Bauman, J.; Kollmeyer, P.J.; Wang, Y.; Bilgin, B.; Emadi, A. 800-V Electric Vehicle Powertrains: Review and Analysis of Benefits, Challenges, and Future Trends. IEEE Trans. Transp. Electrif. 2021, 7, 927–948. [Google Scholar] [CrossRef]
  11. Jiang, J.; Li, Z.; Li, W.; Ranjan, P.; Wei, X.; Zhang, X.; Zhang, C. A review on insulation challenges towards electrification of aircraft. High Volt. 2023, 8, 209–230. [Google Scholar] [CrossRef]
  12. Seri, P.; Montanari, G.C. A Voltage Threshold in Operating Condition of PWM Inverters and its Impact on Reliability of Insulation Systems in Electrified Transport Applications. IEEE Trans. Transp. Electrif. 2021, 7, 69–77. [Google Scholar] [CrossRef]
  13. Morya, A.K.; Gardner, M.C.; Anvari, B.; Liu, L.; Yepes, A.G.; Doval-Gandoy, J.; Toliyat, H.A. Wide Bandgap Devices in AC Electric Drives: Opportunities and Challenges. IEEE Trans. Transp. Electrif. 2019, 5, 3–20. [Google Scholar] [CrossRef]
  14. Ju, X.; Cheng, Y.; Yang, M.; Cui, S.; Sun, A.; Liu, X.; He, M. Voltage Stress Calculation and Measurement for Hairpin Winding of EV Traction Machines Driven by SiC MOSFET. IEEE Trans. Ind. Electron. 2021, 69, 8803–8814. [Google Scholar] [CrossRef]
  15. Shamsi, P.; McDonough, M.; Fahimi, B. Wide-Bandgap Semiconductor Technology: Its impact on the electrification of the transportation industry. IEEE Electrif. Mag. 2013, 1, 59–63. [Google Scholar] [CrossRef]
  16. IEC 60034-18-41; Rotating Electrical Machines—Part 18–41: Partial Discharge Free Electrical Insulation Systems (Type I) Used in Rotating Electrical Machines Fed from Voltage Converters—Qualification and Quality Control Tests. IEC Standard: Geneva, Switzerland, 2014.
  17. Driendl, N.; Pauli, F.; Hameyer, K. Influence of Ambient Conditions on the Qualification Tests of the Interturn Insulation in Low-Voltage Electrical Machines. EEE Trans. Ind. Electron. 2021, 69, 7807–7816. [Google Scholar] [CrossRef]
  18. Ji, Y.; Giangrande, P.; Zhao, W.; Madonna, V.; Zhang, H.; Galea, M. Determination of electrical aging test voltage level under a low-pressure environment for accurate lifetime prediction. In Proceedings of the 2023 26th International Conference on Electrical Machines and Systems (ICEMS), Zhuhai, China, 5–8 November 2023; pp. 550–554. [Google Scholar] [CrossRef]
  19. Ji, Y.; Giangrande, P.; Zhao, W.; Madonna, V.; Zhang, H.; Galea, M. Lifetime estimation of corona-resistance wire for electrical machines operating under the partial discharge regime. In Proceedings of the 2023 IEEE Workshop on Electrical Machines Design, Control and Diagnosis (WEMDCD), Newcastle upon Tyne, UK, 13–14 April 2023; pp. 1–6. [Google Scholar] [CrossRef]
  20. Rumi, A.; Marinelli, J.G.; Seri, P.; Kohler, M.; Cavallini, A. Performance of Corona Resistant Insulation for Aerospace. In Proceedings of the 2021 IEEE Electrical Insulation Conference (EIC), Denver, CO, USA, 7–28 June 2021; pp. 22–25. [Google Scholar] [CrossRef]
  21. Zheng, C.; Wang, Q.; Shen, Z.; Bak, C.L.; Da Silva, F.F.; Wang, H. Influence of pressure on the PD and induced aging behavior of polyimide insulation under repetitive pulse voltage. IEEE Trans. Dielectr. Electr. Insul. 2023, 30, 1283–1293. [Google Scholar] [CrossRef]
  22. Wang, P.; Yu, C.; Akram, S.; Fan, Z.; Zhao, W. Impact of air pressure variations on electrical vehicle motor insulation. High Volt. 2023, 8, 1011–1019. [Google Scholar] [CrossRef]
  23. Gavrilenko, V.; Leonov, A.; Bukharkin, A.; Hlioui, S.; Lefebvre, S. A Method for Endurance Testing of Enameled Round and Rectangular Wires for Motors Controlled by SiC-based Inverters. IEEE Trans. Dielectr. Electr. Insul. 2021, 28, 2091–2098. [Google Scholar] [CrossRef]
  24. Alkhalid, K.; Wang, J.; Fu, P.; Schweickart, D.; Grosjean, D. Temperature Impact on Partial Discharge Induced Aging of Aviation Wires Under High DV/DT Voltage Excitations. In Proceedings of the 2023 IEEE Workshop on Power Electronics for Aerospace Applications (PEASA), Nottingham, UK, 18–19 July 2023; pp. 1–5. [Google Scholar] [CrossRef]
  25. Wang, P.; Gu, Y.; Wu, Q.; Cavallini, A.; Zhang, Q.; Zhang, J.; Li, P.; Li, Y. Influence of ambient humidity on PDIV and endurance of inverter-fed motor insulation. In Proceedings of the 2019 IEEE Electrical Insulation Conference (EIC), Calgary, AB, Canada, 16–19 June 2019; IEEE: Piscataway, NJ, USA, 2020; pp. 201–204. [Google Scholar]
  26. Sili, E.; Cambronne, J.; Naude, N.; Khazaka, R. Polyimide lifetime under partial discharge aging: Effects of temperature, pressure and humidity. IEEE Trans. Dielectr. Electr. Insul. 2013, 20, 435–442. [Google Scholar] [CrossRef]
  27. Lusuardi, L.; Rumi, A.; Cavallini, A.; Barater, D.; Nuzzo, S. Partial Discharge Phenomena in Electrical Machines for the More Electrical Aircraft. Part II: Impact of Reduced Pressures and Wide Bandgap Devices. IEEE Access 2021, 9, 27485–27495. [Google Scholar] [CrossRef]
  28. Wei, Z.; You, H.; Fu, P.; Hu, B.; Wang, J. Partial Discharge Inception Characteristics of Twisted Pairs under Single Voltage Pulses Generated by Silicon-Carbide Devices. IEEE Trans. Transp. Electrif. 2021, 8, 1674–1683. [Google Scholar] [CrossRef]
  29. Kaufhold, M.; Borner, G.; Eberhardt, M.; Speck, J. Failure mechanism of the interturn insulation of low voltage electric machines fed by pulse-controlled inverters. IEEE Electr. Insul. Mag. 1996, 12, 9–16. [Google Scholar] [CrossRef]
  30. Driendl, N.; Pauli, F.; Hameyer, K. Modeling of Partial Discharge Processes in Winding Insulation of Low-Voltage Electrical Machines Supplied by High du/dt Inverters. In Proceedings of the IECON 2019—45th Annual Conference of the IEEE Industrial Electronics Society, Lisbon, Portugal, 14–17 October 2019; Volume 1, pp. 7102–7107. [Google Scholar] [CrossRef]
  31. Lusuardi, L.; Rumi, A.; Neretti, G.; Seri, P.; Cavallini, A. Assessing the severity of partial discharges in aerospace applications. In Proceedings of the 2019 IEEE Conference on Electrical Insulation and Dielectric Phenomena (CEIDP), Richland, WA, USA, 20–23 October 2019; pp. 267–270. [Google Scholar] [CrossRef]
  32. Cavallini, A.; Lusuardi, L.; Meyer, D.R.; Machipeddy, S. Modelling Partial Discharge Inception in magnet wires at different altitudes. In Proceedings of the 2016 IEEE Conference on Electrical Insulation and Dielectric Phenomena (CEIDP), Toronto, ON, Canada, 16–19 October 2016; pp. 449–452. [Google Scholar] [CrossRef]
  33. Fuerst, M.; Bakran, M. Influence of the PWM Voltage Waveform on Partial Discharge Occurrence in Motor Windings. In Proceedings of the PCIM Europe Digital Days 2020, International Exhibition and Conference for Power Electronics, Intelligent Motion, Renewable Energy and Energy Management, Toronto, ON, Canada, 7–8 July 2020; pp. 1–8. [Google Scholar]
  34. Kaufhold, M.; Aninger, H.; Berth, M.; Speck, J.; Eberhardt, M. Electrical stress and failure mechanism of the winding insulation in PWM-inverter-fed low-voltage induction motors. IEEE Trans. Ind. Electron. 2000, 47, 396–402. [Google Scholar] [CrossRef]
  35. Fabiani, D.; Montanari, G.; Cavallini, A.; Mazzanti, G. Relation between space charge accumulation and partial discharge activity in enameled wires under PWM-like voltage waveforms. IEEE Trans. Dielectr. Electr. Insul. 2004, 11, 193–205. [Google Scholar] [CrossRef]
  36. Hayakawa, N.; Morikawa, M.; Okubo, H. Partial discharge inception and propagation characteristics of magnet wire for inverter-fed motor under surge voltage application. IEEE Trans. Dielectr. Electr. Insul. 2007, 14, 39–45. [Google Scholar] [CrossRef]
  37. Kaji, T.; Asai, H.; Kojima, H.; Hayakawa, N. Combined Effect of Temperature and Humidity of Magnet-Wires on Partial Discharge Inception Voltage under Inverter-Surge Voltage. In Proceedings of the 2018 IEEE Conference on Electrical Insulation and Dielectric Phenomena (CEIDP), Cancun, Mexico, 21–24 October 2018; pp. 554–557. [Google Scholar] [CrossRef]
  38. Montanari, G.C.; Seri, P.; Hebner, R. Type Of Supply Waveform, Partial Discharge Behavior And Life Of Rotating Machine Insulation Systems. In Proceedings of the 2018 IEEE International Power Modulator and High Voltage Conference (IPMHVC), Jackson, WY, USA, 3–7 June 2018; pp. 176–179. [Google Scholar] [CrossRef]
  39. Montanari, G.C.; Seri, P. About the Definition of PDIV and RPDIV in Designing Insulation Systems for Rotating Machines Controlled by Inverters. In Proceedings of the 2018 IEEE Electrical Insulation Conference (EIC), San Antonio, TX, USA, 17–20 June 2018; pp. 554–557. [Google Scholar] [CrossRef]
  40. Hayakawa, N.; Okubo, H. Partial discharge characteristics of inverter-fed motor coil samples under ac and surge voltage conditions. IEEE Electr. Insul. Mag. 2005, 21, 5–10. [Google Scholar] [CrossRef]
  41. IEC TS 61934:2011; Electrical Insulating Materials and Systems. Electrical Measurement of Partial Discharges (PD) under Short Rise Time and Repetitive Voltage Impulses. IEC Standard: Geneva, Switzerland, 2011.
  42. Greg, C.S.; Andrea, C.; Glenn, B.; Angelo, S.C. PD Measurement System Instrumentation and Software. In Practical Partial Discharge Measurement on Electrical Equipment; IEEE: Piscataway, NJ, USA, 2023; pp. 159–191. [Google Scholar]
  43. Balachandran, T.; Sirimmana, S.; Jin, A.; Haran, K.S. Partial Discharge Testing of Form-Wound Air-Core Armature Windings for a High-Frequency PMSM for Electric Aircraft Applications. In Proceedings of the 2018 IEEE International Conference on Information and Automation for Sustainability (ICIAfS), Colombo, Sri Lanka, 21–22 December 2018; pp. 1–6. [Google Scholar] [CrossRef]
  44. Madonna, V.; Giangrande, P.; Zhao, W.; Zhang, H.; Gerada, C.; Galea, M. Electrical Machines for the More Electric Aircraft: Partial Discharges Investigation. IEEE Trans. Ind. Appl. 2020, 57, 1389–1398. [Google Scholar] [CrossRef]
  45. Busch, R.; Pohlmann, F.; Muller, K. The influence of several environmental conditions on the partial discharge characteristics and on the lifetime of magnet wires under inverter pulse operation. In Proceedings of the 2001 International Symposium on Electrical Insulating Materials (ISEIM 2001). 2001 Asian Conference on Electrical Insulating Diagnosis (ACEID 2001). 33rd Symposium on Electrical and Ele, Himeji, Japan, 22 November 2001; pp. 645–648. [Google Scholar] [CrossRef]
  46. Wang, P.; Xu, H.; Wang, J.; Cavallini, A.; Montanari, G.C. Temperature effects on PD statistics and endurance of inverter-fed motor insulation under repetitive square wave voltages. In Proceedings of the 2016 IEEE Electrical Insulation Conference (EIC), Montreal, QC, Canada, 19–22 June 2016; pp. 202–205. [Google Scholar] [CrossRef]
  47. Ji, Y.; Giangrande, P.; Zhao, W.; Madonna, V.; Zhang, H.; Galea, M. Determination of Dominant Influencing Factors on Partial Discharge Inception Voltage. In Proceedings of the 2023 IEEE 14th International Symposium on Diagnostics for Electrical Machines, Power Electronics and Drives (SDEMPED), Chania, Greece, 28–31 August 2023; pp. 324–329. [Google Scholar] [CrossRef]
  48. Luo, Y.; Wu, G.N.; Jia, P.; Liu, J.W.; Wang, P.; Cao, K.J.; Cui, Y. Partial discharge characteristics of polyimide films used in inverter-fed traction motor under different temperatures. In Proceedings of the 2013 Annual Report Conference on Electrical Insulation and Dielectric Phenomena, Chenzhen, China, 20–23 October 2013; pp. 809–812. [Google Scholar] [CrossRef]
  49. Weisenseel, L.; Sieling, D.; Gudelhofer, J. Increasing the Reproducibility of Impulse PD Measurements and Development of an Online Interturn Fault Monitoring Routine for External Rotor Motors. In Proceedings of the 2020 International Conference on Electrical Machines (ICEM), Gothenburg, Sweden, 23–26 August 2020; Volume 1, pp. 1356–1362. [Google Scholar] [CrossRef]
  50. Nishigaki, Y.; Matsuzoe, T.; Kubo, T.; Nakano, Y.; Kozako, M.; Hikita, M.; Nakamura, T.; Sun, J.; Izumi, A.; Sakurai, T.; et al. Temperature Dependence of RPDIV of Motorette Sample with Varnish Treatment. In Proceedings of the 2019 IEEE Electrical Insulation Conference (EIC), Calgary, AB, Canada, 16–19 June 2019; IEEE: Piscataway, NJ, USA, 2020; pp. 18–21. [Google Scholar]
  51. He, C.; Beltle, M.; Tenbohlen, S.; Hubert, T.; Schmidt, S.; Schneider, J. Partial Discharge Characteristic of Hairpin Windings for Inverter-Fed Motors. In Proceedings of the 2022 IEEE 4th International Conference on Dielectrics (ICD), Palermo, Italy, 3–7 July 2022; pp. 49–52. [Google Scholar] [CrossRef]
  52. Muto, D.; Oya, M.; Aoi, T.; Ueno, T. A study on partial discharge phenomena of winding wires. Furukawa Rev. 2014, 45, 13–21. [Google Scholar]
  53. Ota, S.; Yamauchi, M.; Mizoguchi, A.; Yoshida, K. Rectangular Magnet Wire for Electric and Hybrid Electric Inverter-Drive Motors. SEI Tech. Rev. 2019, 88, 44–48. [Google Scholar]
  54. Rumi, A.; Seri, P.; Cavallini, A. Electric Field Distribution at High Temperatures in Impregnated Enameled Conductors Used in Electrical Machines. In Proceedings of the 2023 International Symposium on Electrical Insulating Materials (ISEIM), Shimane, Japan, 24–28 September 2023; pp. 1–4. [Google Scholar] [CrossRef]
  55. Ji, Y.; Giangrande, P.; Zhao, W.; Madonna, V.; Zhang, H.; Galea, M. Derivation of Ambient Enhancement Factors of Impregnated Twisted pairs for Partial Discharge Risk Evaluation. IEEE Trans. Transp. Electrif. 2023, 10, 485–495. [Google Scholar] [CrossRef]
  56. Guastavino, F.; Rossi, F.; Gianoglio, C.; Torello, E.; Cordano, D. PDIV and RPDIV on different temperatures on different kind of type I insulating system. In Proceedings of the 2017 IEEE Conference on Electrical Insulation and Dielectric Phenomenon (CEIDP), Fort Worth, TX, USA, 22–25 October 2017; pp. 369–372. [Google Scholar] [CrossRef]
  57. Rumi, A.; Cavallini, A.; Marinelli, J. The Impact of Impregnating Resins in Ensuring the Reliability of Inverter-Fed Machines. In Proceedings of the 2020 International Symposium on Electrical Insulating Materials (ISEIM), Tokyo, Japan, 13–17 September 2020; pp. 253–256. [Google Scholar]
  58. Duchesne, S.; Moeneclaey, J.; Velu, G.; Roger, D. Is thermo-bonded coils a good solution for electric machines fed by fast PWM inverters? In Proceedings of the 2014 IEEE Electrical Insulation Conference (EIC), Philadelphia, PA, USA, 8–11 June 2014; pp. 425–429. [Google Scholar] [CrossRef]
  59. Boughamni, W.; Manata, J.-P.; Ait-Amar, S.; Roger, D. Electrical machines insulation: Towards low environmental impact solutions. In Proceedings of the 2013 IEEE International Conference on Solid Dielectrics (ICSD), Bologna, Italy, 30 June–4 July 2013; pp. 557–560. [Google Scholar] [CrossRef]
  60. Iosif, V.; Roger, D.; Duchesne, S.; Malec, D. Assessment and improvements of inorganic insulation for high temperature low voltage motors. IEEE Trans. Dielectr. Electr. Insul. 2016, 23, 2534–2542. [Google Scholar] [CrossRef]
  61. Cozonac, D.; Mihaila, V.; Velu, G.; Duchesne, S.; Lecointe, J.-P.; Roger, D. Performance comparision of winding wires for high-temperature rotating machines. In Proceedings of the 2013 IEEE International Conference on Solid Dielectrics (ICSD), Bologna, Italy, 30 June–4 July 2013; pp. 318–321. [Google Scholar] [CrossRef]
  62. Cozonac, D.; Babicz, S.; Ait-Amar-Djennad, S.; Velu, G.; Cavalini, A.; Wang, P. Study on ceramic insulation wires for motor windings at high-temperature. In Proceedings of the 2014 IEEE Conference on Electrical Insulation and Dielectric Phenomena (CEIDP), Des Moines, IA, USA, 19–22 October 2014; pp. 172–175. [Google Scholar] [CrossRef]
  63. Zenda, Y.; Takenouchi, S.; Kozako, M.; Hikita, M.; Okamoto, T.; Jintong, S.; Izumi, A.; Karasawa, K. Effect of Temperature on RPDIV of Enamel Twisted Pair under Repetitive Impulse Voltage Application with Different Rise Time. In Proceedings of the 2021 IEEE Conference on Electrical Insulation and Dielectric Phenomena (CEIDP), Vancouver, BC, Canada, 12–15 December 2021; pp. 603–606. [Google Scholar] [CrossRef]
  64. Guastavino, F.; Cotella, G.; Dardano, A.; Massa, G.F.; Ratto, A.; Squarcia, S.; Torello, E. Influence of the rise time and of the temperature on the PD inception voltage of enameled wires. In Proceedings of the 2010 Annual Report Conference on Electrical Insulation and Dielectic Phenomena, West Lafayette, IN, USA, 17–20 October 2010; pp. 1–4. [Google Scholar] [CrossRef]
  65. Hammarstroem, T.J. Evaluation of Different Waveforms to Study the Insulation Performance on Electrical Vehicle Motors. In Proceedings of the 2022 IEEE Conference on Electrical Insulation and Dielectric Phenomena (CEIDP), Denver, CO, USA, 30 October–2 November 2022; pp. 1–4. [Google Scholar] [CrossRef]
  66. Sahlén, F.; Takala, M. Factors influencing the partial discharge inception voltage in Type I insulation systems. In Proceedings of the 2023 IEEE Electrical Insulation Conference (EIC), Quebec City, QC, Canada, 18–21 June 2023; pp. 1–4. [Google Scholar] [CrossRef]
  67. La De Calle, M.G.; Martinez-Tarifa, J.M.; Solanilla, A.M.G.; Robles, G. Uncertainty Sources in the Estimation of the Partial Discharge Inception Voltage in Turn-to-Turn Insulation Systems. IEEE Access 2020, 8, 157510–157519. [Google Scholar] [CrossRef]
  68. Rain, P.; Loubeau, F.; Durieux, A.; Le Strat, F.; Fresnet, F. Using motorettes for the experimental and numerical determinations of the PDIV in an electric motor. In Proceedings of the 2016 IEEE International Conference on Dielectrics (ICD), Montpellier, France, 3–7 July 2016; Volume 2, pp. 967–970. [Google Scholar] [CrossRef]
  69. Kaji, T.; Amano, Y.; Asai, H. Analysis of Influence Factors for Partial Discharge Inception Voltage between Magnet-Wires on Rotating Machines. In Proceedings of the SAE 2016 World Congress and Exhibition, Detroit, MI, USA, 12–14 April 2016. [Google Scholar] [CrossRef]
  70. Gao, J.; Rumi, A.; He, Y.; Cavallini, A. Towards a Holistic Approach to Inverter-Fed Machine Design: FEM-Based PDIV Prediction of Complete Windings. IEEE Trans. Dielectr. Electr. Insul. 2023, 30, 2870–2877. [Google Scholar] [CrossRef]
  71. Lusuardi, L.; Cavallini, A.; de la Calle, M.G.; Martinez-Tarifa, J.M.; Robles, G. Insulation design of low voltage electrical motors fed by PWM inverters. IEEE Electr. Insul. Mag. 2019, 35, 7–15. [Google Scholar] [CrossRef]
  72. Li, P.; Zhang, X.; Wang, P.; Wang, J.; Shang, Z. A data-driven approach for exploring partial discharge inception voltage of turn-to-turn insulation in inverter-fed motors. Electr. Eng. 2023, 105, 2861–2870. [Google Scholar] [CrossRef]
  73. Hassan, W.; Hussain, G.A.; Mahmood, F.; Shafiq, M.; Montanari, G.C. Effects of Temperature and Pressure on Failure Risk of Electric Motors based on Partial Discharge Measurements. IEEE Trans. Aerosp. Electron. Syst. 2023, 59, 5624–5633. [Google Scholar] [CrossRef]
  74. Ji, Y.; Giangrande, P.; Zhao, W.; Madonna, V.; Zhang, H.; Galea, M. Determination of Hotspot Temperature Margin for Rectangular Wire Windings Considering Insulation Thermal Degradation and Partial Discharge. IEEE Trans. Transp. Electrif. 2023, 10, 2057–2069. [Google Scholar] [CrossRef]
  75. Madonna, V.; Migliazza, G.; Giangrande, P.; Lorenzani, E.; Buticchi, G.; Galea, M. The rebirth of the current source inverter: Advantages for aerospace motor design. IEEE Ind. Electron. Mag. 2019, 13, 65–76. [Google Scholar] [CrossRef]
  76. Kuffel, J.; Kuffel, P.; Kuffel, J. High Voltage Engineering Fundamentals; Elsevier Science & Technology: Oxford, UK, 2000. [Google Scholar]
  77. Haghighi, H.; Cotton, I.; Gardner, R.; Sauvage, B. Definitions of Test Conditions for High Voltage Aerospace Systems Using the IAGOS Atmospheric Dataset. In Proceedings of the Aerospace Systems and Technology Conference, Warrendale, PA, USA, 6–8 November 2018. [Google Scholar] [CrossRef]
  78. Han, Q.; Chen, L.; Cotton, I.; Khan, J. Insulating Gases for Partial Discharge Management of Electrical Machines in Aerospace Applications. IEEE Trans. Transp. Electrif. 2023, 9, 3590–3600. [Google Scholar] [CrossRef]
  79. Billard, T.; Abadie, C.; Taghia, B. Non-intrusive partial discharges investigations on aeronautic motors. In Proceedings of the SAE 2016 (Aerospace and Technology Conference-ASTC), Tampa, FL, USA, 20–25 September 2016; pp. 1–18. [Google Scholar]
  80. Billard, T.; Abadie, C.; Lebey, T. Partial discharge testing in aeronautic environment on magnet wire and feeder cables. In Proceedings of the 2016 IEEE Electrical Insulation Conference (EIC), Montreal, QC, Canada, 19–22 June 2016; pp. 101–104. [Google Scholar] [CrossRef]
  81. Rui, R.; Cotton, I. Impact of low pressure aerospace environment on machine winding insulation. In Proceedings of the 2010 IEEE International Symposium on Electrical Insulation, San Diego, CA, USA, 6–9 June 2010; pp. 1–5. [Google Scholar] [CrossRef]
  82. Rumi, A.; Marinelli, J.G.; Barater, D.; Cavallini, A.; Seri, P. The challenges of reliable dielectrics in modern aerospace applications: The hazard of Corona Resistant materials. IEEE Trans. Transp. Electrif. 2022, 8, 4646–4653. [Google Scholar] [CrossRef]
  83. Wang, Y.; Balachandran, T.; Hoole, Y.; Yin, Y.; Haran, K.S. Partial Discharge Investigation of Form-Wound Electric Machine Winding for Electric Aircraft Propulsion. IEEE Trans. Transp. Electrif. 2020, 6, 1638–1647. [Google Scholar] [CrossRef]
  84. Wei, Z.; Kasten, D.G.; Hu, B.; Abdullah, Y.; Wang, J.; Grosjean, D.; Schweickart, D. Study of Partial Discharge Behavior at Flight-Altitude Pressures under 60 Hz and Impulse Voltages for Samples Related to Aircraft Motors. In Proceedings of the 2018 IEEE International Power Modulator and High Voltage Conference (IPMHVC), Jackson, WY, USA, 3–7 June 2018; IEEE: Piscataway, NJ, USA, 2019; pp. 180–185. [Google Scholar]
  85. Gardner, R.; Cotton, I.; Kohler, M. Comparison of power frequency and impulse based Partial Discharge measurements on a variety of aerospace components at 1000 and 116 mbar. In Proceedings of the 2015 IEEE Electrical Insulation Conference (EIC), Seattle, WA, USA, 7–10 June 2015; pp. 430–433. [Google Scholar] [CrossRef]
  86. Jiang, J.; Zhang, B.; Li, Z.; Zhang, C.; Ranjan, P.; Zhang, X. Partial Discharge Investigation under Low Air Pressure and Variable Frequency for More-electric-aircraft. IEEE Trans. Dielectr. Electr. Insul. 2021, 28, 1793–1801. [Google Scholar] [CrossRef]
  87. Wei, Z.; Alkhalid, K.; Alsaif, F.; Wang, J.; Grosjean, D.; Schweickart, D. Study of Partial Discharge Inception Characteristics of Aviation Wire Stressed by PWM Voltages Under Various Air Pressures. In Proceedings of the 2022 IEEE International Power Modulator and High Voltage Conference (IPMHVC), Knoxville, TN, USA, 19–23 June 2022; pp. 133–136. [Google Scholar] [CrossRef]
  88. Meyer, D.R.; Cavallini, A.; Lusuardi, L.; Barater, D.; Pietrini, G.; Soldati, A. Influence of impulse voltage repetition frequency on RPDIV in partial vacuum. IEEE Trans. Dielectr. Electr. Insul. 2018, 25, 873–882. [Google Scholar] [CrossRef]
  89. Pietrini, G.; Barater, D.; Franceschini, G.; Mancinelli, P.; Cavallini, A. An open problem for More Electrical Aircraft (MEA): How insulation systems of actuators can be qualified? In Proceedings of the 2016 IEEE Energy Conversion Congress and Exposition (ECCE), Milwaukee, WI, USA, 18–22 September 2016; pp. 1–8. [Google Scholar] [CrossRef]
  90. Emersic, C.; Cotton, I. Experimental comparison of partial discharge between fast-switching pulse waves and square waves. J. Phys. D Appl. Phys. 2022, 55, 385502. [Google Scholar] [CrossRef]
  91. Abadie, C.; Billard, T.; Lebey, T. Partial Discharges in Motor Fed by Inverter: From Detection to Winding Configuration. IEEE Trans. Ind. Appl. 2019, 55, 1332–1341. [Google Scholar] [CrossRef]
  92. Naderiallaf, H.; Ji, Y.; Giangrande, P.; Galea, M. Air Pressure Impact on the Avalanche Size for Turn-to-Turn Insulation of Inverter-Fed Motors. IEEE Trans. Dielectr. Electr. Insul. 2024, 31, 85–94. [Google Scholar] [CrossRef]
  93. Taghia, B.; Billard, T.; Carayon, J.-P.; Malec, D.; Piquet, H.; Belinger, A. Investigations on Partial Discharges Risk in Aeronautical Rotating Machine Fed by HVDC 540VDC Network. In Proceedings of the 2018 IEEE Electrical Insulation Conference (EIC), San Antonio, TX, USA, 17–20 June 2018; pp. 491–494. [Google Scholar] [CrossRef]
  94. Niemeyer, L. A generalized approach to partial discharge modeling. IEEE Trans. Dielectr. Electr. Insul. 1995, 2, 510–528. [Google Scholar] [CrossRef]
  95. Fulnecek, J.; Kabot, O.; Kedron, P. Partial discharges analysis of electrical machine winding in low pressure enviroment. In Proceedings of the 2022 International Conference on Diagnostics in Electrical Engineering (Diagnostika), Pilsen, Czech Republic, 6–8 September 2022; pp. 1–4. [Google Scholar] [CrossRef]
  96. Sun, H.; Wang, Y.; Ding, Y.; Rui, Y.; Fan, L.; Yin, Y. Partial Discharge Detection of Electrical Machine Insulation Under PWM Voltage with High dv/dt for More Electric Aircraft. In Proceedings of the 2022 IEEE Energy Conversion Congress and Exposition (ECCE), Detroit, MI, USA, 9–13 October 2022; pp. 1–5. [Google Scholar] [CrossRef]
  97. Ji, Y.; Giangrande, P.; Zhao, W.; Wang, H.; Madonna, V.; Zhang, H.; Galea, M. Moving Towards Partial Discharge-Free Design of Electrical Machines for More Electric Aircraft Applications. IEEE Trans. Transp. Electrif. 2023, 9, 4668–4679. [Google Scholar] [CrossRef]
  98. Naderiallaf, H.; Ji, Y.; Giangrande, P.; Galea, M. Temperature Impact on PDIV for Turn-to-Turn Insulation of Inverter-Fed Motors: From Ground Level to Cruising Altitude. IEEE Trans. Dielectr. Electr. Insul. 2023, 31, 1044–1053. [Google Scholar] [CrossRef]
  99. Wang, Y.; Yi, X.; Wang, Y.; Zhang, X.; Yin, Y.; Han, T.; Haran, K.S. Partial-Discharge-Free Insulation Design of Air-Core Permanent Magnet Synchronous Machine for Aircraft Propulsion. IEEE Trans. Transp. Electrif. 2020, 7, 78–90. [Google Scholar] [CrossRef]
  100. Ji, Y.; Giangrande, P.; Wang, H.; Zhao, W.; Madonna, V.; Zhang, H.; Galea, M. Time-to-failure analysis of short-duty cycle, inverter-fed electrical machines exposed to prevailing electrical stress. IEEE Trans. Aerosp. Electron. Syst. 2023, 59, 9368–9378. [Google Scholar] [CrossRef]
  101. Hoffmann, J.; Linde, T.; Schlegel, S.; Schulz, F.; Machetti, D. PDIV Measurements on Aviation Electric Motor Insulation Systems—Influence of Operating Temperature and Low Air Pressure. In Proceedings of the Elektromechanische Antriebssysteme 2023, 9. Fachtagung (VDE OVE), Wien, Österreich, 8–9 November 2023; pp. 112–117. [Google Scholar]
  102. Ji, Y.; Giangrande, P.; Zhao, H.; Zhao, W.; Madonna, V.; Zhang, H.; Galea, M. Electrical Machine Design Considering Corona-Resistant Wire for More Electric Aircraft Applications. IEEE Trans. Transp. Electrif. 2022, 9, 3192–3202. [Google Scholar] [CrossRef]
  103. Kikuchi, Y.; Ishida, T.; Ueno, T.; Kanazawa, S.; Nagao, M.; Hikita, M.; Murakami, Y.; Nagata, M. Recent progress in round-robin test of repetitive partial discharge inception voltage measurements on complete winding of 4 Kw random-wound motor. In Proceedings of the 2017 International Symposium on Electrical Insulating Materials (ISEIM), Toyohashi, Japan, 11–15 September 2017; Volume 1, pp. 159–162. [Google Scholar] [CrossRef]
  104. Kikuchi, Y.; Nagata, M.; Kanazawa, S.; Ishida, T.; Nagao, M.; Murakami, Y.; Ueno, T.; Hikita, M. Round-robin test of repetitive partial discharge inception voltage measurements on complete winding of 4 kW random-wound motor. In Proceedings of the 2016 IEEE Electrical Insulation Conference (EIC), Montreal, QC, Canada, 19–22 June 2016; pp. 248–251. [Google Scholar] [CrossRef]
  105. Nawawi, Z.; Murakami, Y.; Hozumi, N.; Nagao, M. Effect of Humidity on Time Lag of Partial Discharge in Insulation-Gap-Insulation System. In Proceedings of the 2006 IEEE 8th International Conference on Properties & applications of Dielectric Materials, Bali, Indonesia, 26–30 June 2006; pp. 199–203. [Google Scholar] [CrossRef]
  106. Wang, P.; Li, Y.; Cavallini, A.; Zhang, J.; Xiang, E.; Wang, K. The Influence of Relative Humidity on Partial Discharge and Endurance Features under Short Repetitive Impulsive Voltages. In Proceedings of the 2018 IEEE Conference on Electrical Insulation and Dielectric Phenomena (CEIDP), Cancun, Mexico, 21–24 October 2018; pp. 506–509. [Google Scholar] [CrossRef]
  107. Ji, Y.; Giangrande, P.; Zhao, W.; Madonna, V.; Zhang, X.; Zhang, H.; Galea, M. Partial discharge investigation under humidity conditions via dissipation factor and insulation capacitance tip-up test. IEEE Trans. Dielectr. Electr. Insul. 2022, 29, 1483–1490. [Google Scholar] [CrossRef]
  108. Wakimoto, T.; Kojima, H.; Hayakawa, N. Measurement and evaluation of partial discharge inception voltage for enameled rectangular wires under AC voltage. IEEE Trans. Dielectr. Electr. Insul. 2016, 23, 3566–3574. [Google Scholar] [CrossRef]
  109. Kikuchi, Y.; Matsusue, J.; Yamada, F.; Okuda, T.; Nishimura, Y.; Nakamura, T. Partial Discharge Characteristics in Twisted Enameled Wires Under High Repetition Voltage Pulses Generated by a SiC-MOSFET Inverter Power Supply. In Proceedings of the 2023 International Symposium on Electrical Insulating Materials (ISEIM), Shimane, Japan, 24–28 September 2023; pp. 80–83. [Google Scholar] [CrossRef]
  110. Fenger, M.; Stone, G.; Lloyd, B. The impact of humidity on PD inception voltage as a function of rise-time in random wound motors of different designs. In Proceedings of the Annual Report Conference on Electrical Insulation and Dielectric Phenomena, Cancun, Mexico, 20–24 October 2002; pp. 501–505. [Google Scholar] [CrossRef]
  111. Ji, Y.; Giangrande, P.; Madonna, V.; Zhao, W.; Galea, M.; Li, J.; Zhang, H. Investigation on Humidity Effect on Partial Discharge Considering Thermal Aging. In Proceedings of the 2022 International Conference on Electrical Machines (ICEM), Valencia, Spain, 5–8 September 2022; pp. 2325–2330. [Google Scholar] [CrossRef]
  112. Kikuchi, Y.; Murata, T.; Fukumoto, N.; Nagata, M.; Wakimoto, Y.; Yoshimitsu, T. Investigation of partial discharge with twisted enameled wires in atmospheric humid air by optical emission spectroscopy. IEEE Trans. Dielectr. Electr. Insul. 2010, 17, 839–845. [Google Scholar] [CrossRef]
  113. Rumi, A.; Cavallini, A.; Lusuardi, L. Combined Effects of Temperature and Humidity on the PDIV of Twisted Pairs. In Proceedings of the 2020 IEEE 3rd International Conference on Dielectrics (ICD), Valencia, Spain, 5–31 July 2020; pp. 906–909. [Google Scholar] [CrossRef]
  114. Hassan, W.; Hussain, G.A.; Mahmood, F.; Amin, S.; Lehtonen, M. Effects of Environmental Factors on Partial Discharge Activity and Estimation of Insulation Lifetime in Electrical Machines. IEEE Access 2020, 8, 108491–108502. [Google Scholar] [CrossRef]
  115. Kikuchi, Y.; Murata, T.; Uozumi, Y.; Fukumoto, N.; Nagata, M.; Wakimoto, Y.; Yoshimitsu, T. Effects of ambient humidity and temperature on partial discharge characteristics of conventional and nanocomposite enameled magnet wires. IEEE Trans. Dielectr. Electr. Insul. 2008, 15, 1617–1625. [Google Scholar] [CrossRef]
  116. Ji, Y.; Giangrande, P.; Zhao, W.; Madonna, V.; Zhang, H.; Li, J.; Galea, M. Investigation on combined effect of humidity–temperature on partial discharge through dielectric performance evaluation. IET Sci. Meas. Technol. 2022, 17, 37–46. [Google Scholar] [CrossRef]
  117. Naderiallaf, H.; Ji, Y.; Giangrande, P.; Galea, M. Modeling Humidity Impact on PDIV for Turn-to-Turn Insulation of Inverter-Fed Motors at Different Temperatures. IEEE Trans. Dielectr. Electr. Insul. 2023, 31, 1573–1582. [Google Scholar] [CrossRef]
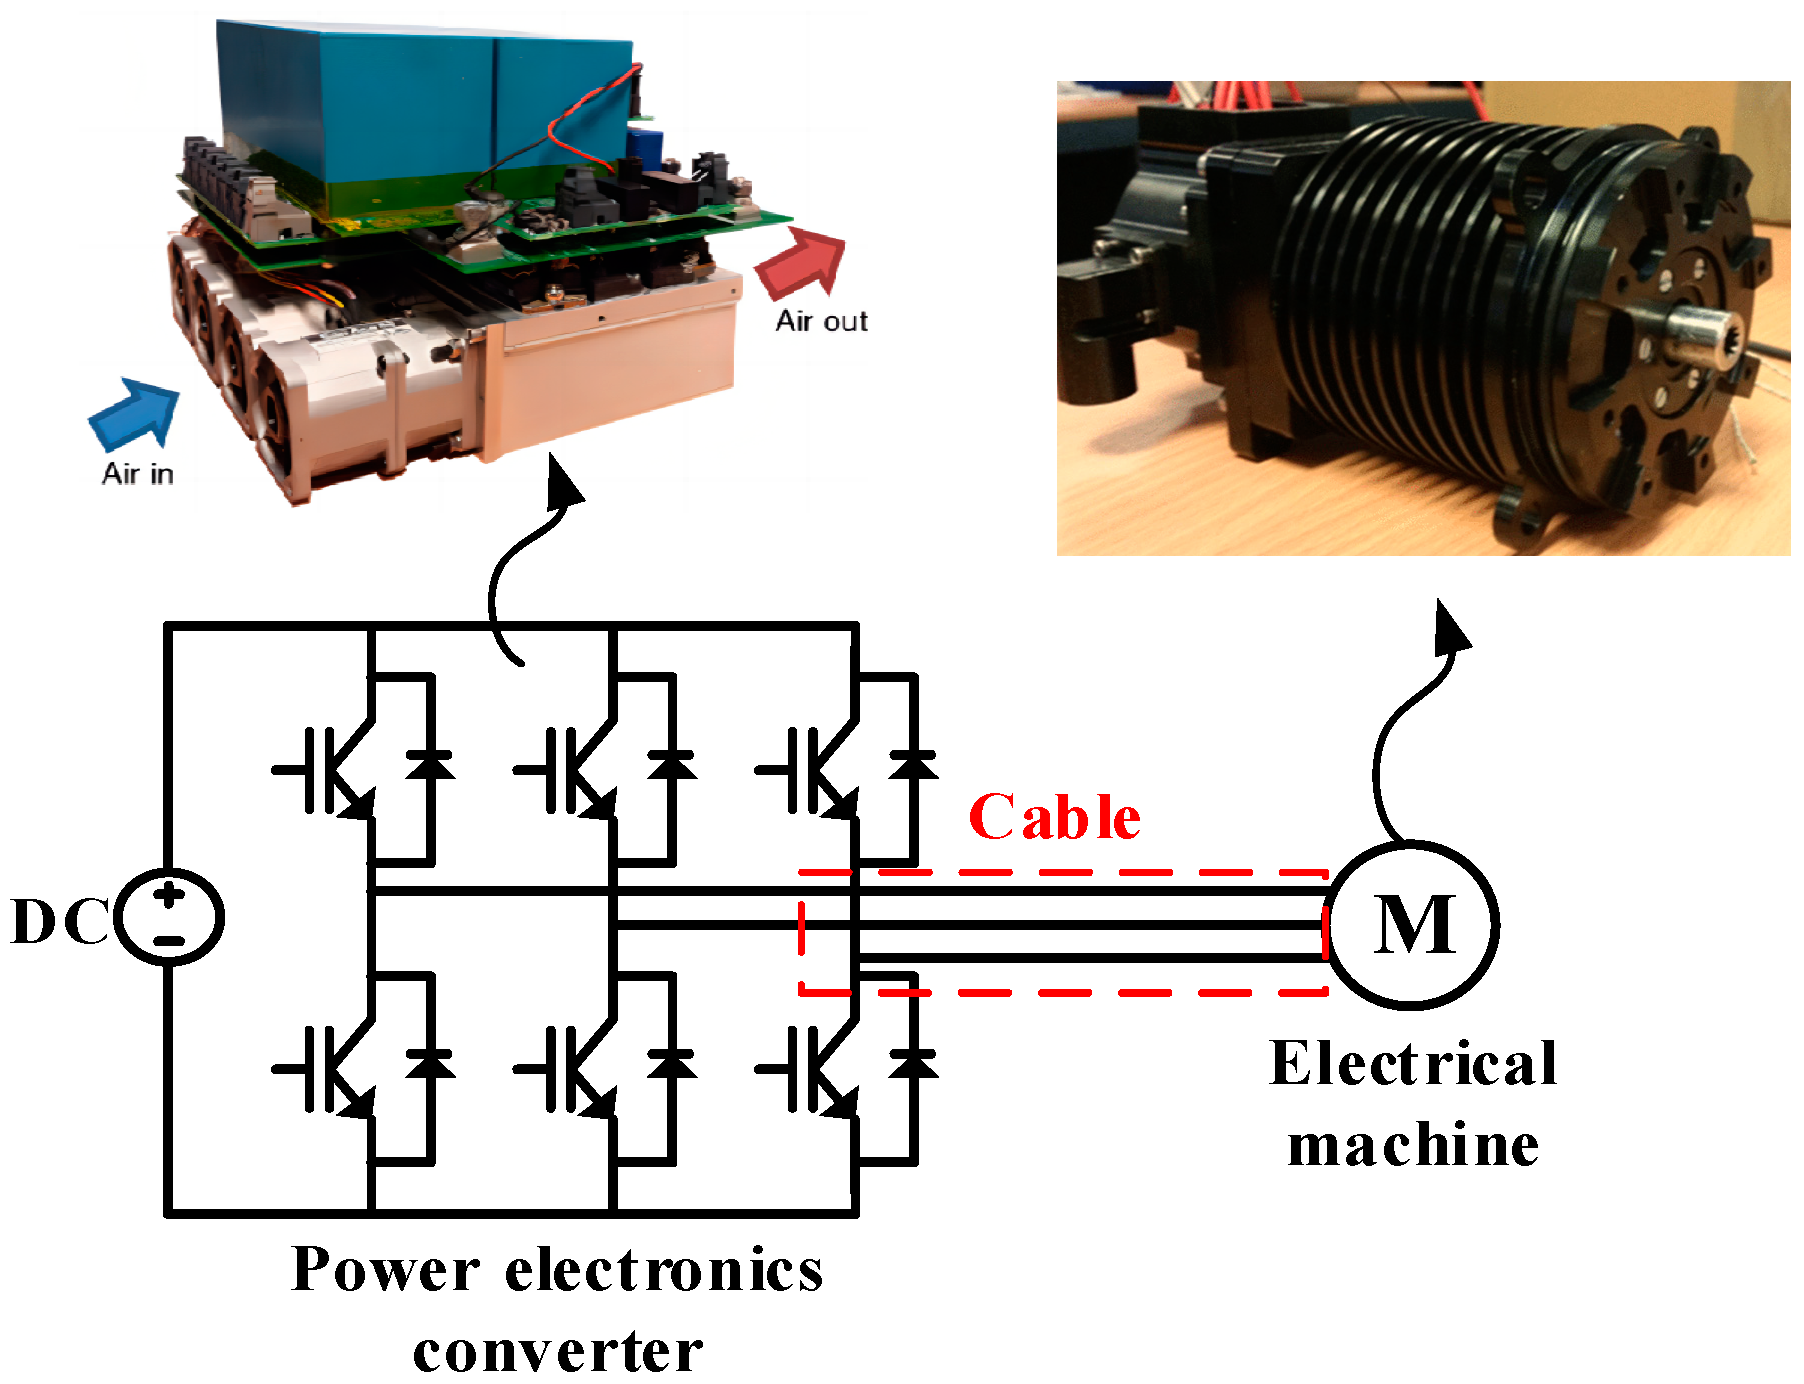
Figure 1. Illustration of a typical electric drive layout [9].
Energies 17 03980 g001
Figure 2. Thermal map for forced-air cooled high-power density EMs fed with 9 A/mm2.
Energies 17 03980 g002
Figure 3. Illustration of PDIV, RPDIV, RPDEV, and PDEV.
Energies 17 03980 g003
Figure 4. An example of a PRPD plot [22].
Energies 17 03980 g004
Figure 5. A linear function for fitting the trend PDIV with temperature T [44].
Energies 17 03980 g005
Figure 6. Test layout for PRPD pattern measurements using rod-plate electrode arrangement.
Energies 17 03980 g006
Figure 7. The trend of PDIV with temperature for impregnated and non-impregnated samples [55].
Energies 17 03980 g007
Figure 8. Maximum winding hotspot temperature considering lifetime constraint and PD risk [74].
Energies 17 03980 g008
Figure 9. The temperature and pressure conditions during flight [11].
Energies 17 03980 g009
Figure 10. Comparison of PDIV for both CR and NCR wires at 1000 and 100 mbar [82].
Energies 17 03980 g010
Figure 11. The trend of normalized PDIV with pressure for four different types of defects [83].
Energies 17 03980 g011
Figure 12. The trend of PDIV with pressure for two different voltage waveforms [22].
Energies 17 03980 g012
Figure 13. The trend of total discharge amplitude vs. pressure under different test voltage frequencies [11].
Energies 17 03980 g013
Figure 14. The trend of PDIV vs. pressure measured on twisted pairs [27].
Energies 17 03980 g014
Figure 15. Variation of normalized RPDIV during different flight phases [44].
Energies 17 03980 g015
Figure 16. The impact of temperature and pressure on the PD inception voltage.
Energies 17 03980 g016
Figure 17. A linear model for fitting the trend of PDIV with temperature and pressure [97].
Energies 17 03980 g017
Figure 18. The impact of contaminants on the humidity dependence of the PDIV [52].
Energies 17 03980 g018
Figure 19. Trend of inception voltage and discharge current with humidity at (a) 30 °C and (b) 90 °C [114].
Energies 17 03980 g019
Figure 20. Dissipation factor with applied voltage at different RH under (a) 30 °C, (b) 60 °C, and (c) 90 °C [116].
Energies 17 03980 g020
Table 2. Summary of literature related to pressure impact on PD activity at constant temperature.
Ref.Pressure Range (mbar)Influencing FactorsMeasured QuantityTest Sample (Insulation Material)Test Voltage (Impulse Voltage Parameters)
[17]200 to 1000 PDIV, PDEVTwisted pairs (Grade II PEI + PAI)Bipolar impulse (tr: 80 ns, f: 60 kHz)
[22]400 to 1013 PDIV, PRPDInsulation paper (0.3 mm Nomex-polyimide-Nomex) Sinusoidal, bipolar impulse (tr: 100 ns, f: 50 Hz)
[27]5 to 1013 Rise time (7, 15, 150 ns), frequency (10, 50, 100 kHz)PDIVTwisted pairs (Grade II PEI + PAI)Sinusoidal, bipolar impulse
[32]200 to 1000 FrequencyPDIVTwisted pairsSinusoidal
[43]51 to 1013 PDIV, PDEVForm-winding with Litz wire (Duralco resin, glass fiber, PI)Sinusoidal
[44]50 to 1000 PDIV, PDEV, RPDIVTwisted pairs (PAI, Grade II)Unipolar impulse (tr: 150 ns, f: 2.5 kHz)
[51]590 to 1000 Insulation material (100 μm PAI, 100 and 130 μm PEEK)PDIVTwisted pairs Bipolar impulse (tr: 80 ns, f: 60 kHz)
[53]470 to1013 Insulation material (PI, PI with microcellular coating)PDIVParallel wireSinusoidal
[55]200 to 1000 Impregnation statusPDIV, PDEVTwisted pairs (0.03 mm PEI + PAI and silicon resin)Unipolar impulse (pw: 0.2 ms)
[69]200 to 1013 PDIVTwisted pairsSinusoidal
[73]100 to 1750 PDIV, average discharge current, quadratic rate, accumulative apparent current, discharge powerMotorSinusoidal
[78]200 to 1000Insulating gases (air, CO2, SF6, CF3I, C3H2F4, C3F7CN)PRDIV, PDIV, discharge magnitudeTwisted pairsSinusoidal, unipolar impulse (tr: 10 ns, pw: 15 ms)
[79]100 and 1013 PDIV, PDEVTwisted pairs, stator, motorette (0.15 mm Nomex-410, 0.5 mm ISOVALFR4, 0.065 mm Intertape, 0.2 mm Siligaine)Sinusoidal, bipolar impulse (f: 1 kHz, dc: 50%)
[80]100 and 1013Insulation thicknessPDIV, PRPD patternsTwisted pairs (28, 53, 80 μm PEI + PAI)Sinusoidal
[81]100 to 1000 PDIV, discharge magnitude, PRPD patternsTwisted pairs, insulated wire wound with a plain metallic conductor (0.04 mm Kapton®FCR PI film)Sinusoidal
[82]100 and 1000Rise time (12, 237 ns), insulation material (Grade II PEI + PAI + with/without an inorganic nano-filler)PDIVTwisted pairsBipolar impulse
[83]203 to 1013Insulation defectsPDIV, PRPD patternsForm-wound winding (Duralco 128 resin, glass fiber, PI)Sinusoidal
[84]67 to 1013 PDIV, PDEV, RPDIVTwisted pairs, shielded wire samples (Polytetrafluoroethylene (PTFE)), motorette (200 μm Nomex-polyimide-Nomex, Nomex phase separator, impregnation resin and PEI), PCB boardSinusoidal, bipolar impulse (tr: 150 ns, pw: 180 ms)
[85]116 and 1000 PDIV, PDEVTwisted pairs, stator, motoretteSinusoidal, impulse (dv/dt: 2500 V/μs)
[86]10 to 1000FrequencyPDIV, average discharge amplitude, total discharge amplitude, discharge repetition rate, PRPDTwisted pairs (0.025 mm PI)Sinusoidal
[87]116 to 1013Rise time (55, 130, 200 ns), pulse numberPDIV, PRDIV, PDEV, RPDEVWire wrapped on a stainless-steel mandrelUnipolar impulse
[88]200 to 1000Frequency (5 to 200 kHz)RPDIVTwisted pairsUnipolar impulse
[89]12 to 750EISPDIVMotorette (Dophon 1105/LV)Impulse (f: 5 kHz)
[90]116 and 1000Voltage type, pulse width (50 ns to 50 ms)PDIV, PD time delayTwisted pairs (75 µm PI)Impulse
[91]100 to 1013Sensor typePDIV, PD spectrumTwisted pairsSinusoidal, PWM
[92]100 to 1000 PDIVTwisted pairs (28.5 µm, PEI + PAI)Sinusoidal
[93]100 to 1013 PDIVInsulating paper set-up (125 µm, PI)Sinusoidal
Table 3. Summary of literature related to pressure impact on PD activity under variable temperature.
Ref.Pressure Range (mbar)Temperature Range (°C)Influencing FactorsMeasured QuantityTest Sample (Insulation Material)Test Voltage (Impulse Voltage Parameters)
[95]200 to 100020 to 80 PDIV, number of PDStatorSinusoidal
[96]200 to 100020 to 180 RPDIVTwisted pairs (50 μm PI)Unipolar impulse (tr: 100 ns, f: 5 kHz, dc: 50%)
[97]200 to 100020 to 220Rise time (20 to 200 ns)PDIVTwisted pairs (Grade II PEI + PAI)Unipolar impulse (tr: 50 ns, f: 1 kHz, dc: 20%)
[98]200 and 100020 to 120 PDIVTwisted pairs (28.5 μm PEI + PAI)Sinusoidal
[99]203 to 101330 to 210 PDIVForm-wound winding (0.013 mm PI, 0.127 mm Nomex, 0.178 mm Glass fiber, Duralco 128 resin)Sinusoidal
[100]200 to 100020 to 200 PDIVTwisted pairs (PEI + PAI + inorganic layer)Bipolar impulse
[101]200 to 100020 to 140 PDIVLitz wireSinusoidal
[102]200 to 100020 and 180Rise time (30 to 200 ns), insulation material (PEI + PAI + with/without inorganic layer)PDIV, PDEVTwisted pairs Unipolar impulse
Disclaimer/Publisher’s Note: The statements, opinions and data contained in all publications are solely those of the individual author(s) and contributor(s) and not of MDPI and/or the editor(s). MDPI and/or the editor(s) disclaim responsibility for any injury to people or property resulting from any ideas, methods, instructions or products referred to in the content.