
Simulation and Energy Analysis of Integrated Solar Combined Cycle Systems (ISCCS) Using Aspen Plus


Abstract
:1. Introduction
1.1. Energy and Conversion
1.2. Thermal Power Plants
1.3. Parabolic Trough Technologies and ISCC
1.4. Using Simulation
1.5. Local Power Plant in Oman
1.6. Problem Statement, Objective, and Novelty
2. Materials and Methods
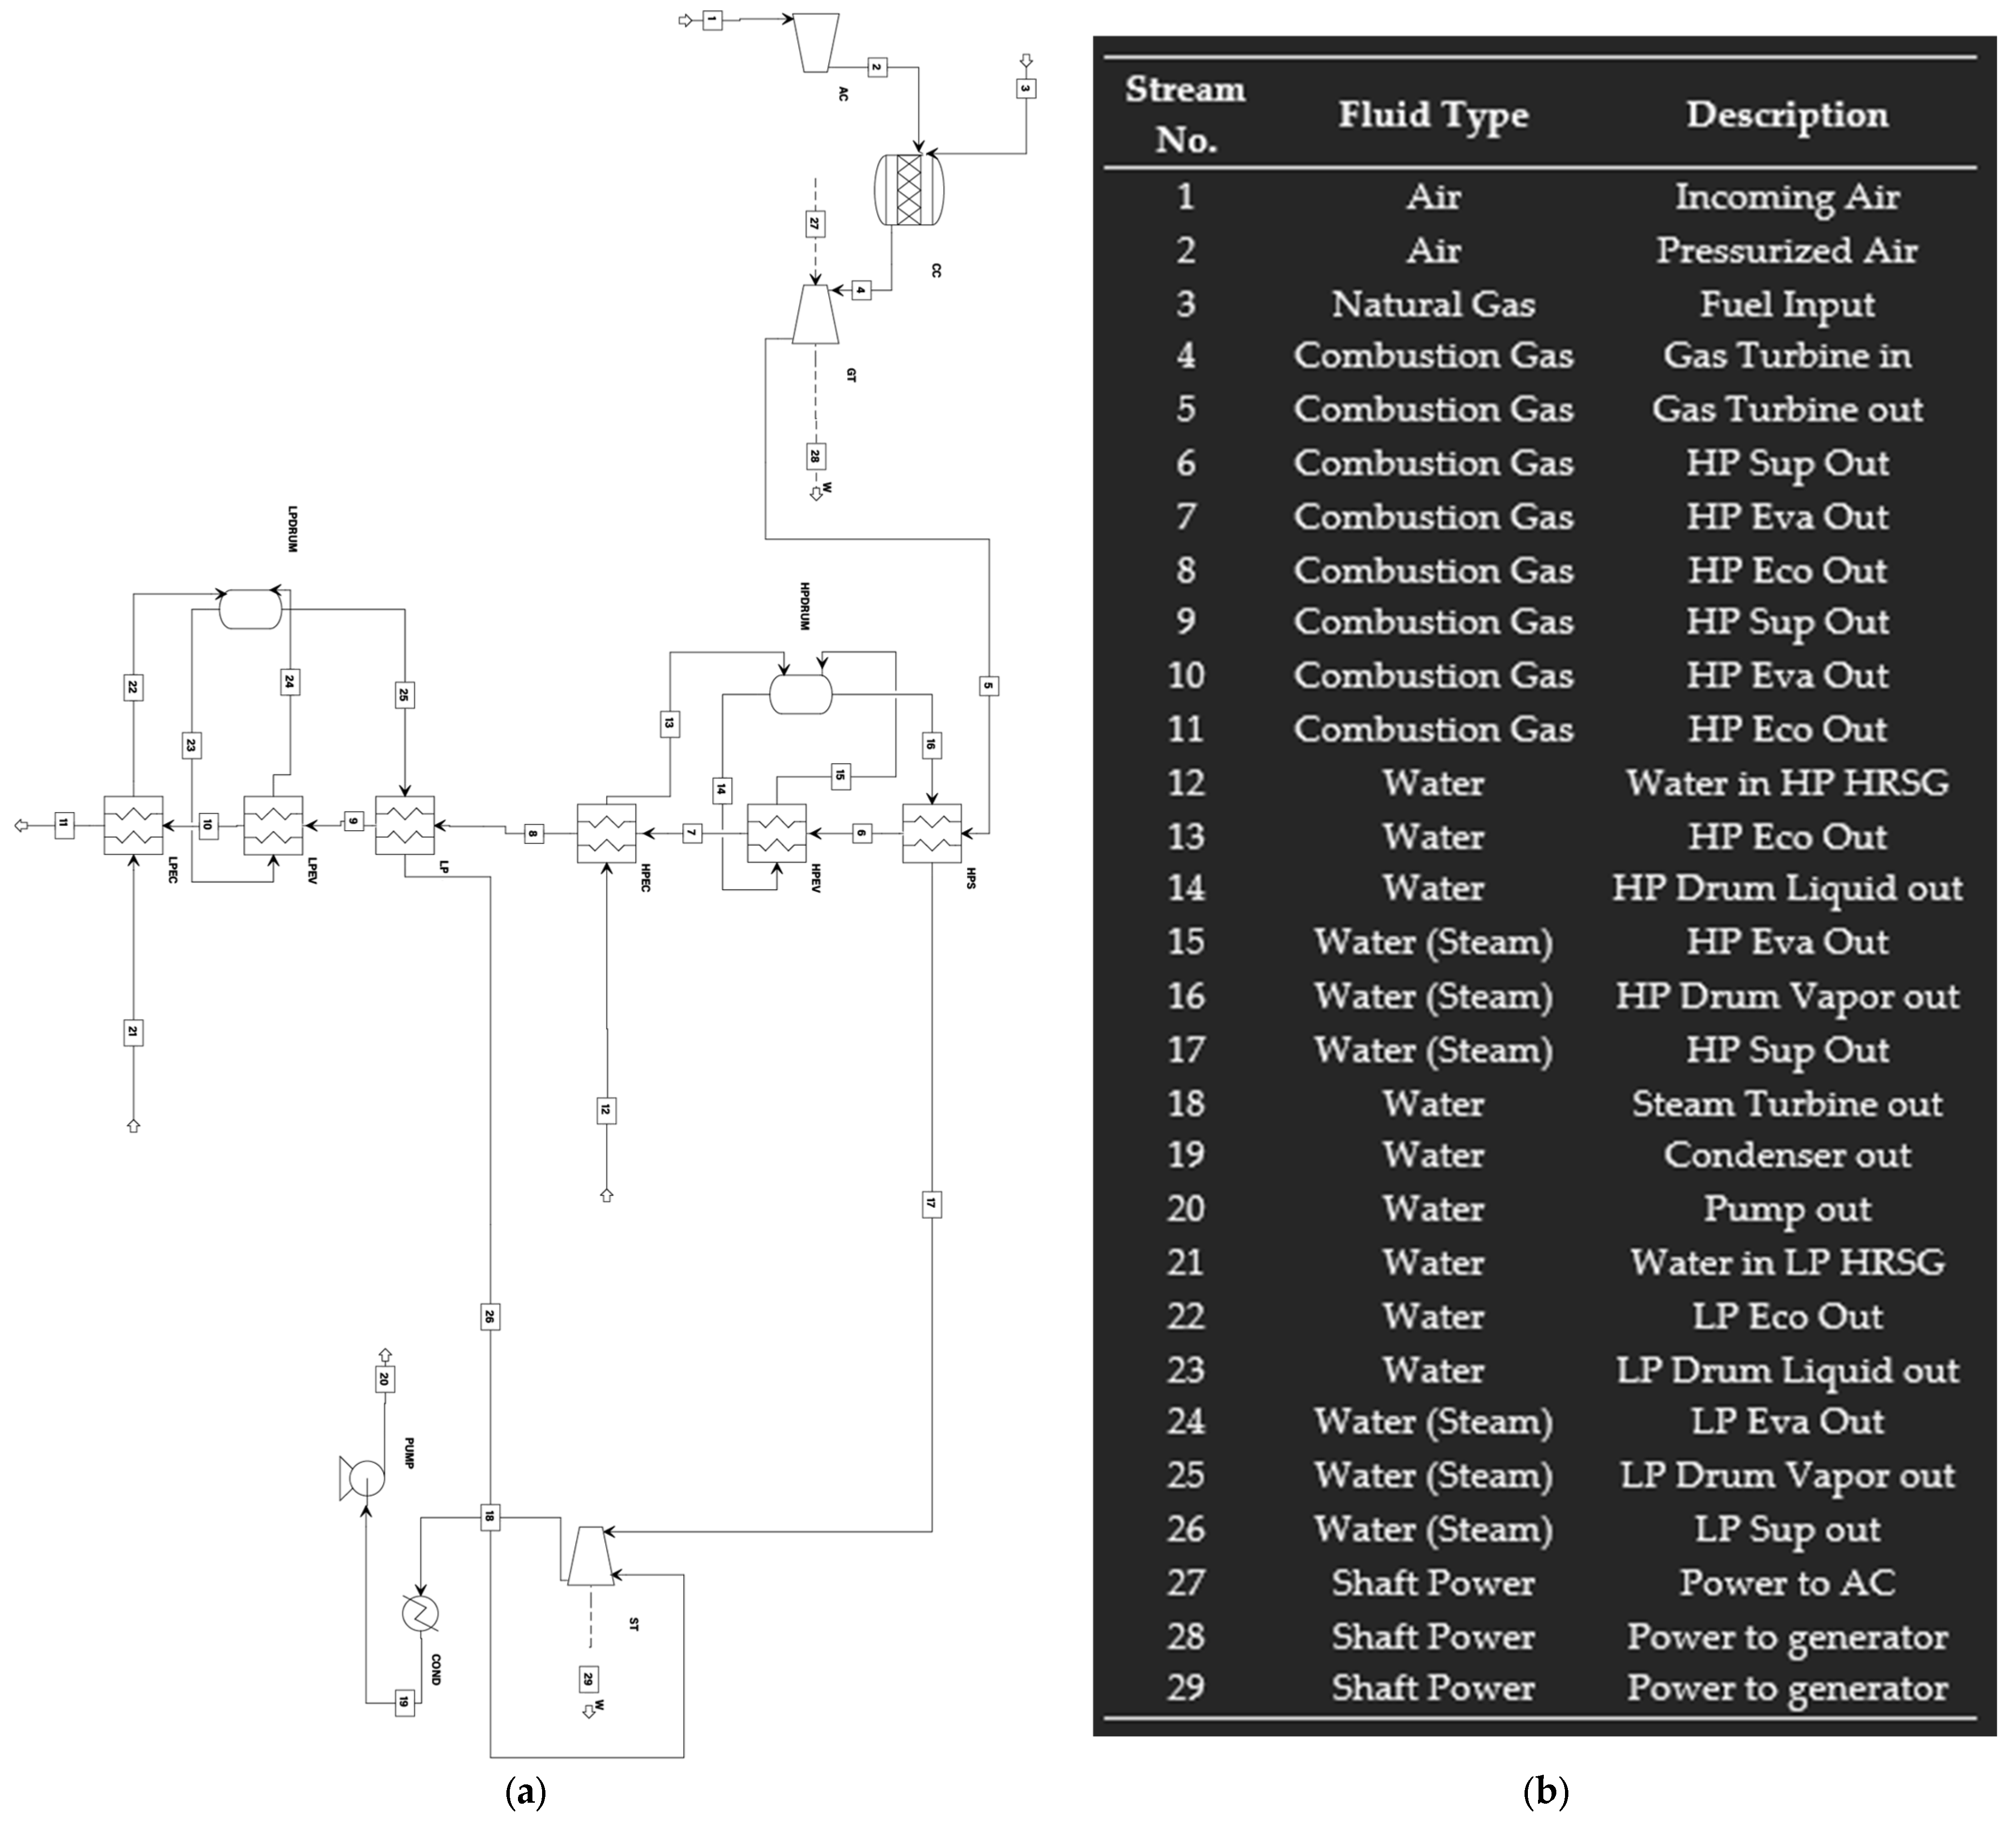
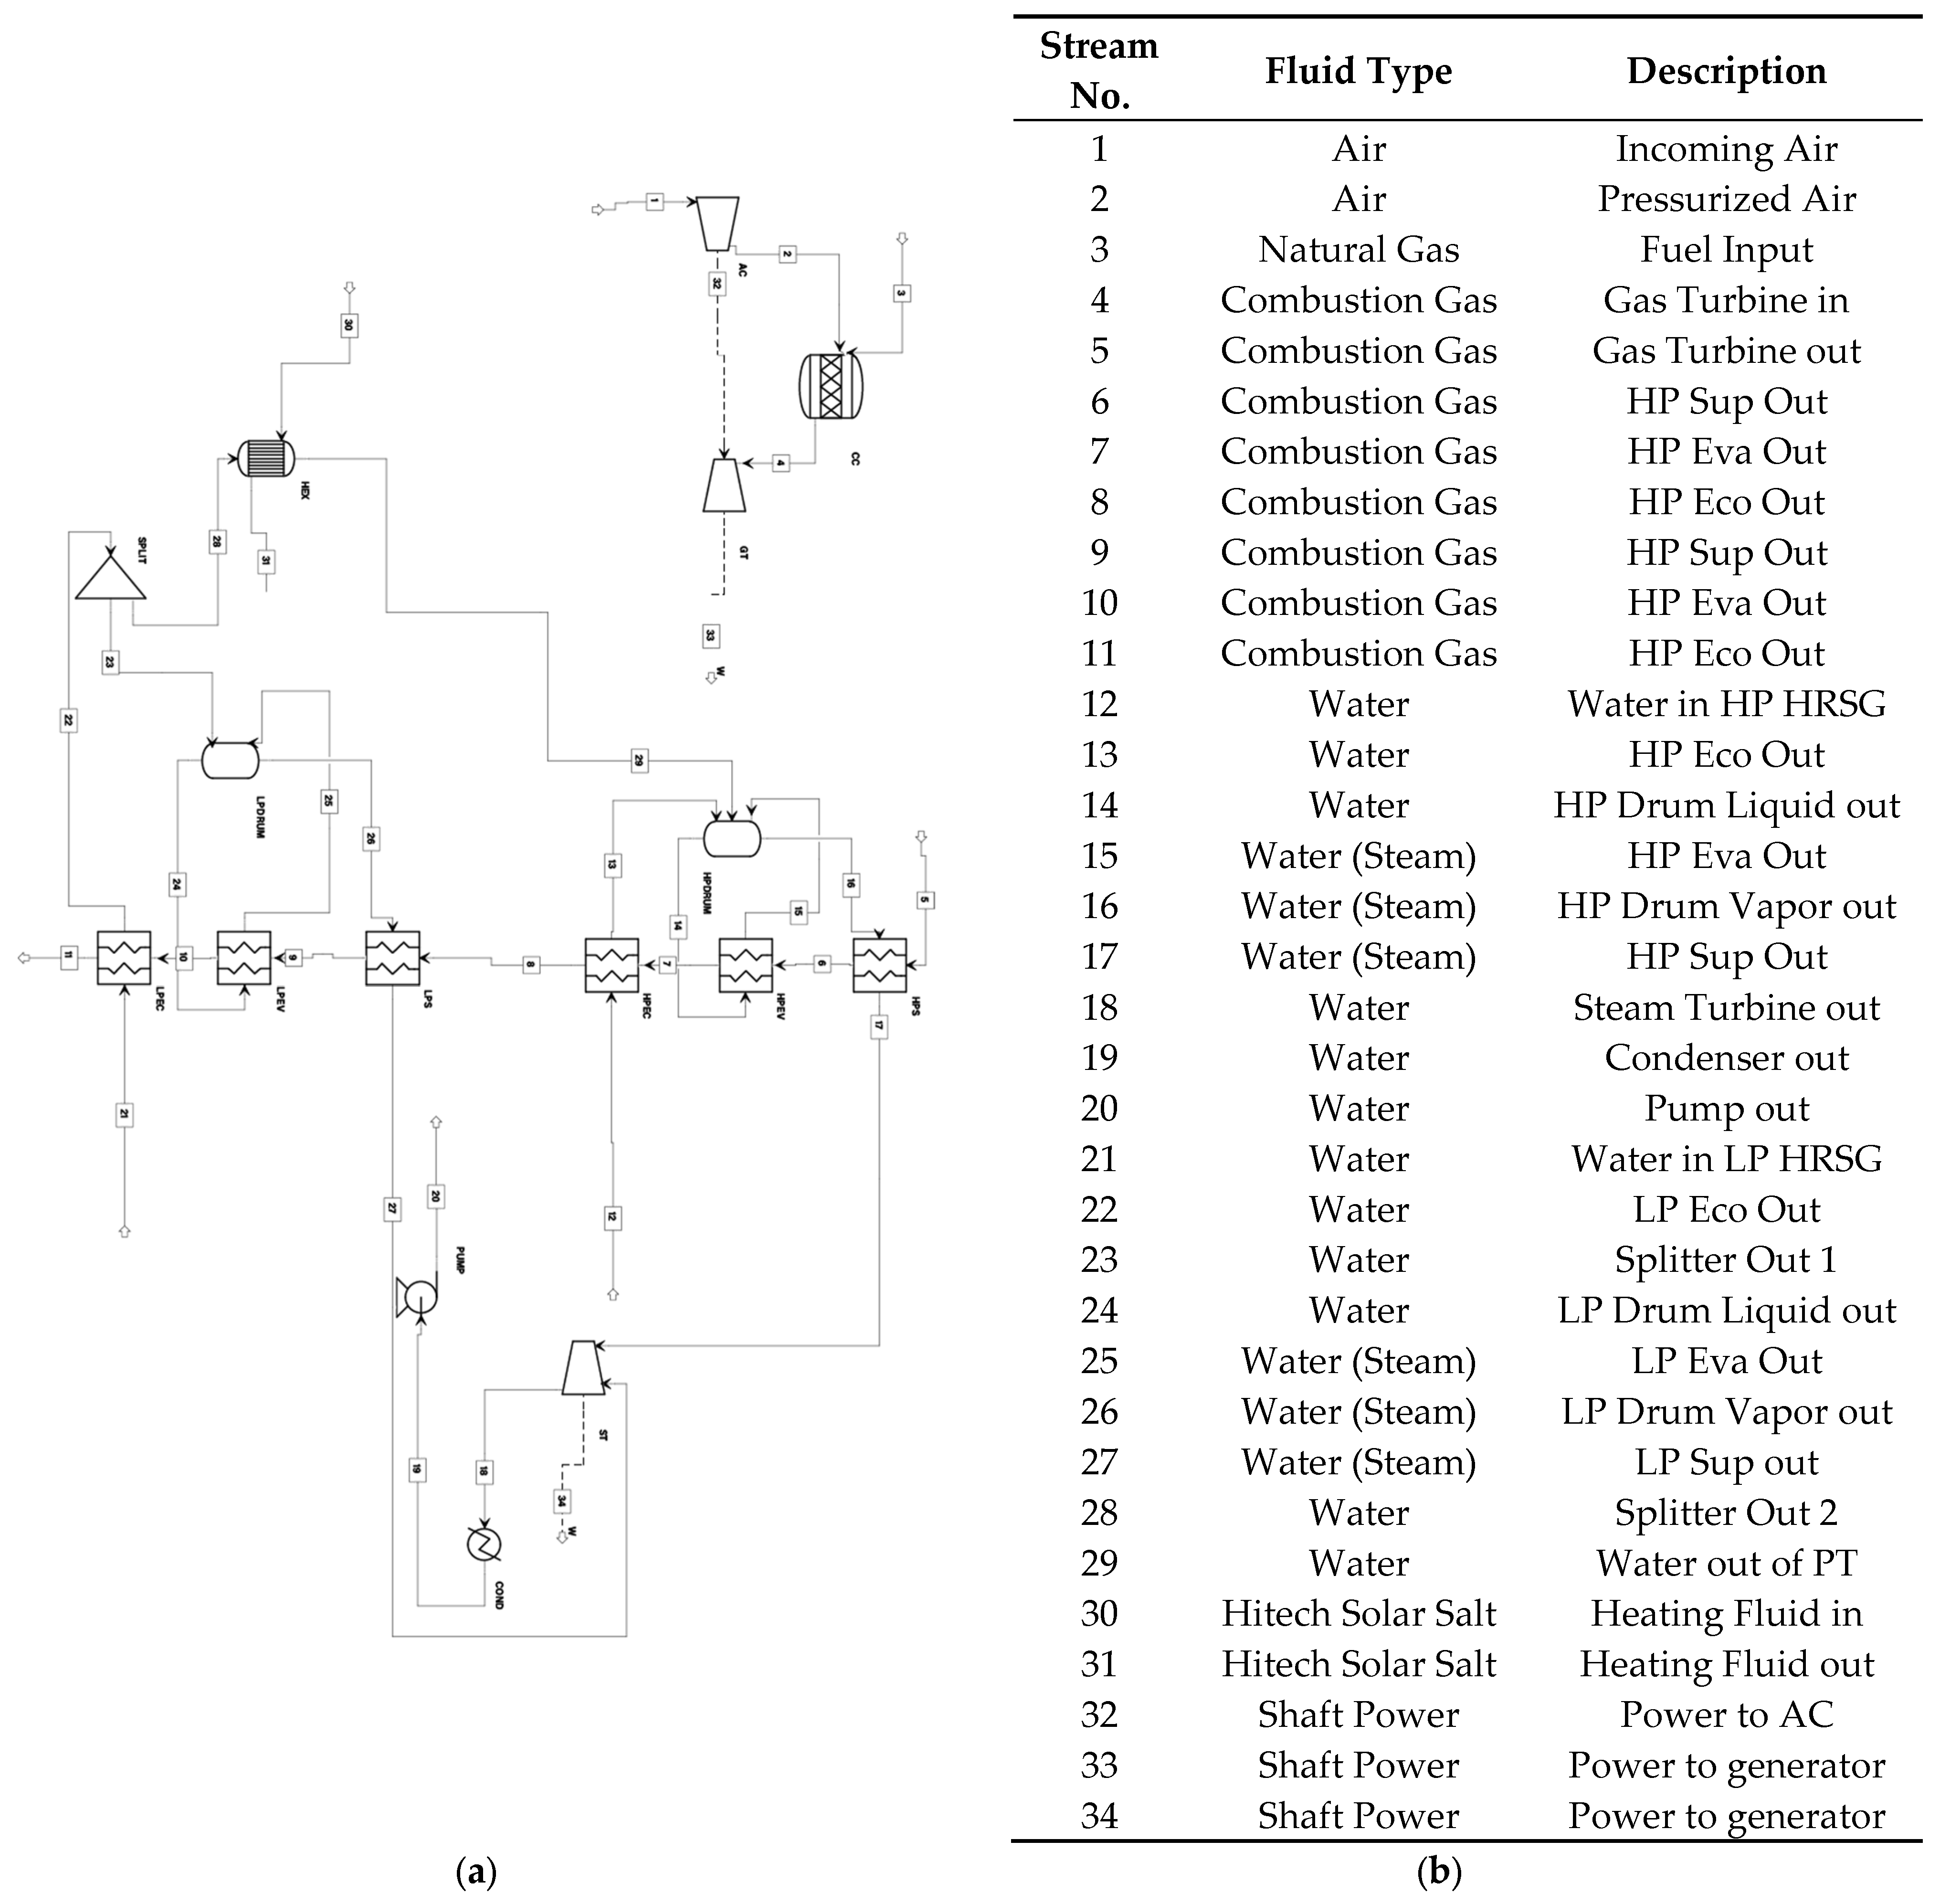
2.1. Process Description
2.2. Energy Balance and Simulation
2.3. System Simulation
Aspen Plus
2.4. Sensitivity Analysis
2.4.1. Sensitivity Study 1 (Main Cycle)
- The air flow rate was controlled to keep the air-to-fuel ratio constant during the study.
- The high-pressure water going into the HP HRSG was controlled to keep the exhaust gas stream temperature constant to keep the system from failing.
- The low-pressure water going into the LP HRSG was controlled to keep the exhaust gas stream temperature constant to keep the system from failing.
- Gas Flow (kg/s).
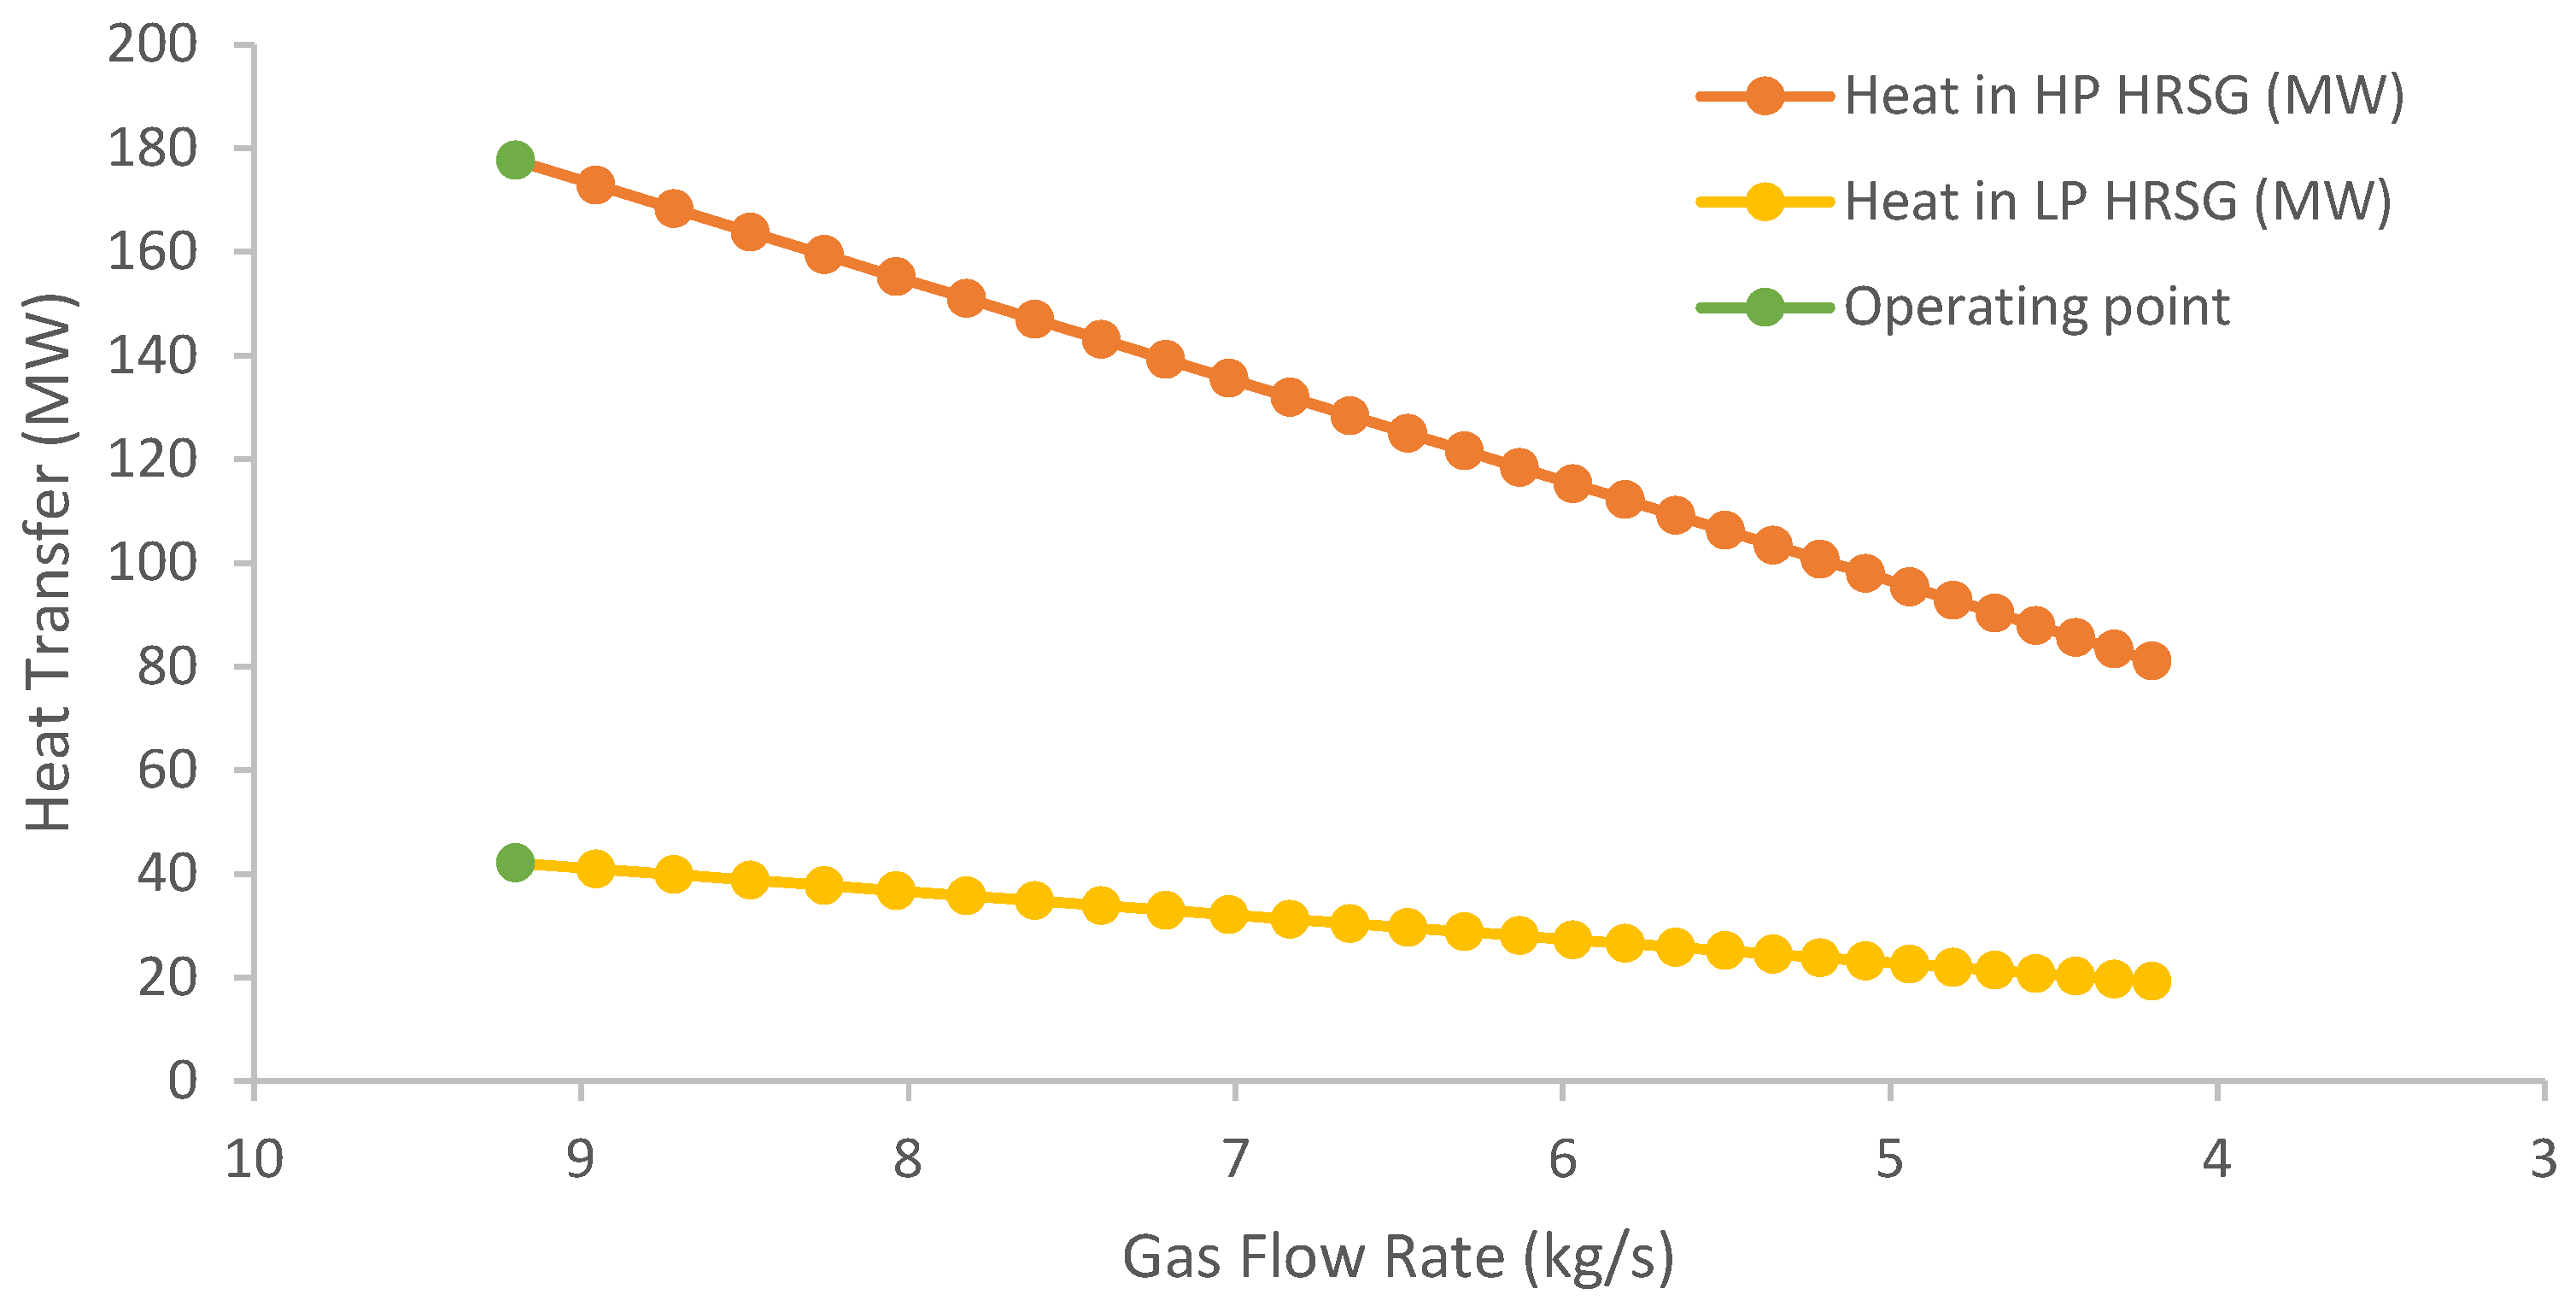
- Heat in HP HRSG (MW).
- Heat in LP HRSG (MW).
- Steam Turbine Power (MW).
- Gas Turbine Power (MW).
- Total Power (MW).
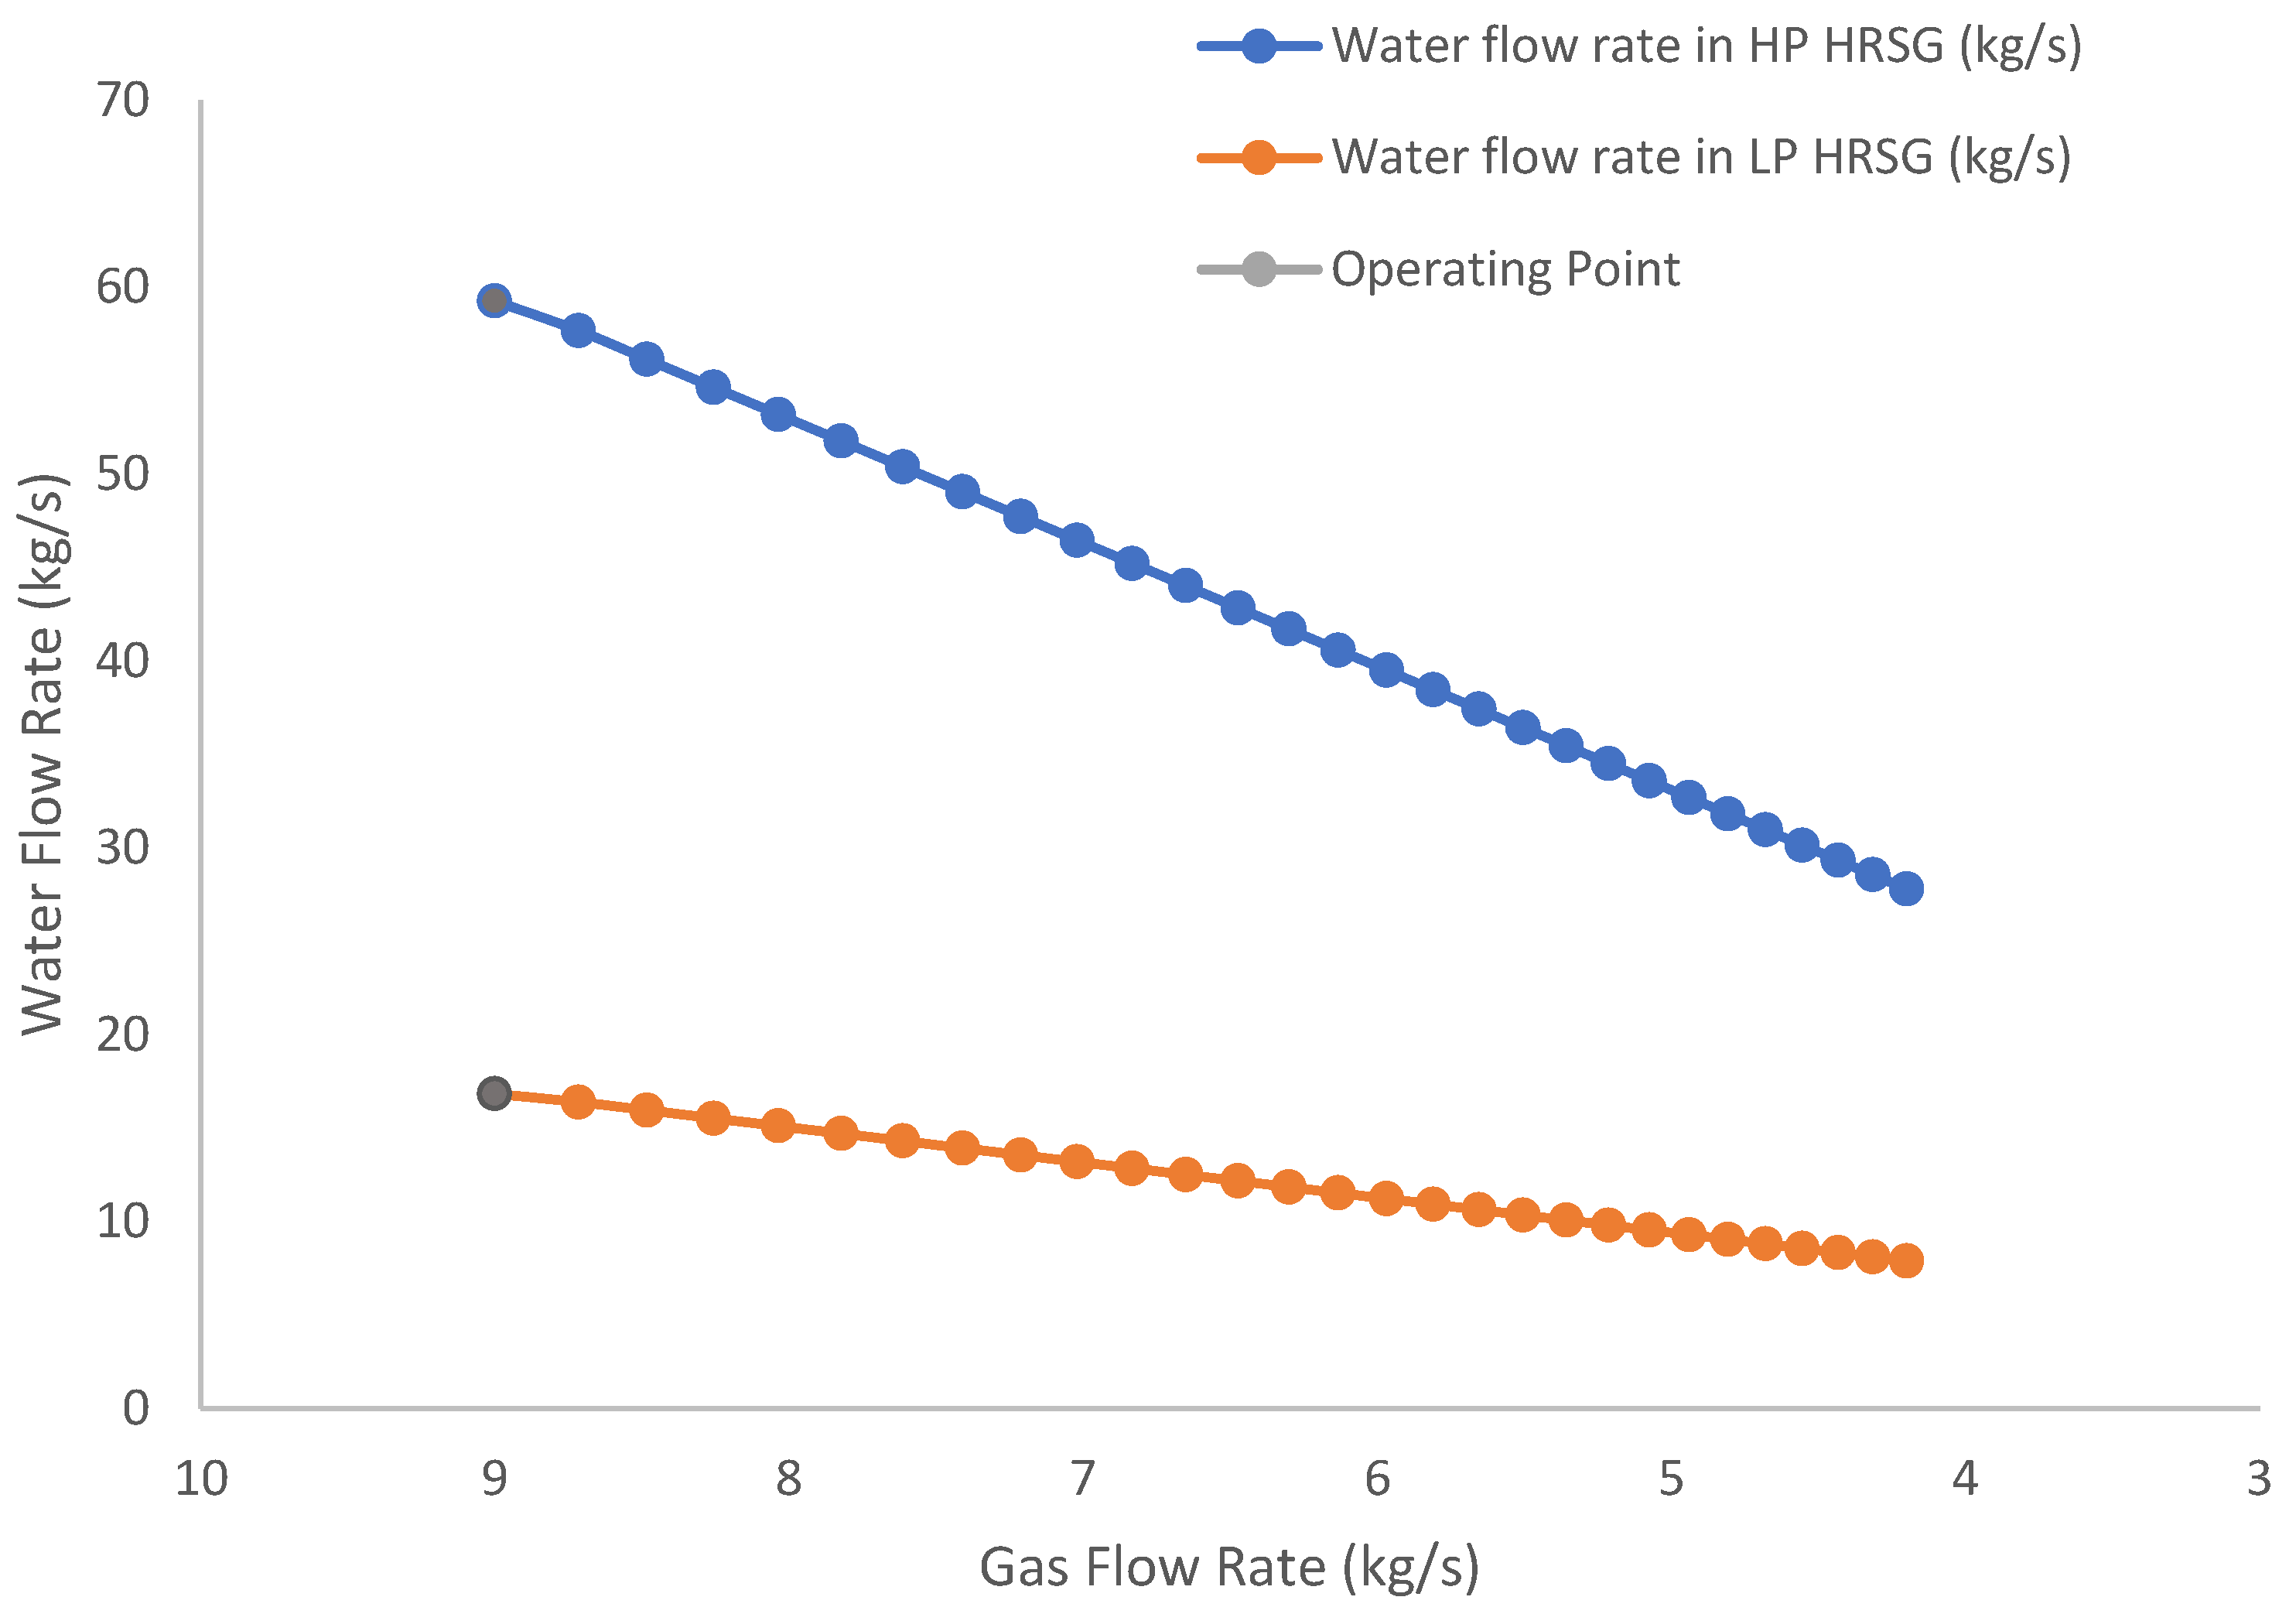
- Water Flow Rate in HP HRSG (kg/s).
- Water Flow Rate in LP HRSG (kg/s).
2.4.2. Sensitivity Study 2 (ISCC)
- The air flow rate was controlled to keep the air to fuel ratio constant during the study.
- The high-pressure water going into the HP HRSG was controlled to keep the exhaust gas stream from LP HRSG temperature constant to keep the system from failing.
- The amount of heating fluid was controlled by only using the needed amount.
- The amount of water coming into the HFHX was controlled to always give a total power of 180 MW from the two turbines.
- Gas Flow (kg/s).
- Heat in HP HRSG (MW).
- Heat in LP HRSG (MW).
- Steam Turbine Power (MW).
- Gas Turbine Power (MW).
- Total Power (MW).
- Water Flow Rate in HP HRSG (kg/s).
- Water Flow Rate in LP HRSG (kg/s).
- Heating Fluid Flow Rate (kg/s).
- Water in HFHX Flow Rate (kg/s).
3. Results and Discussion
3.1. Simulation Validation
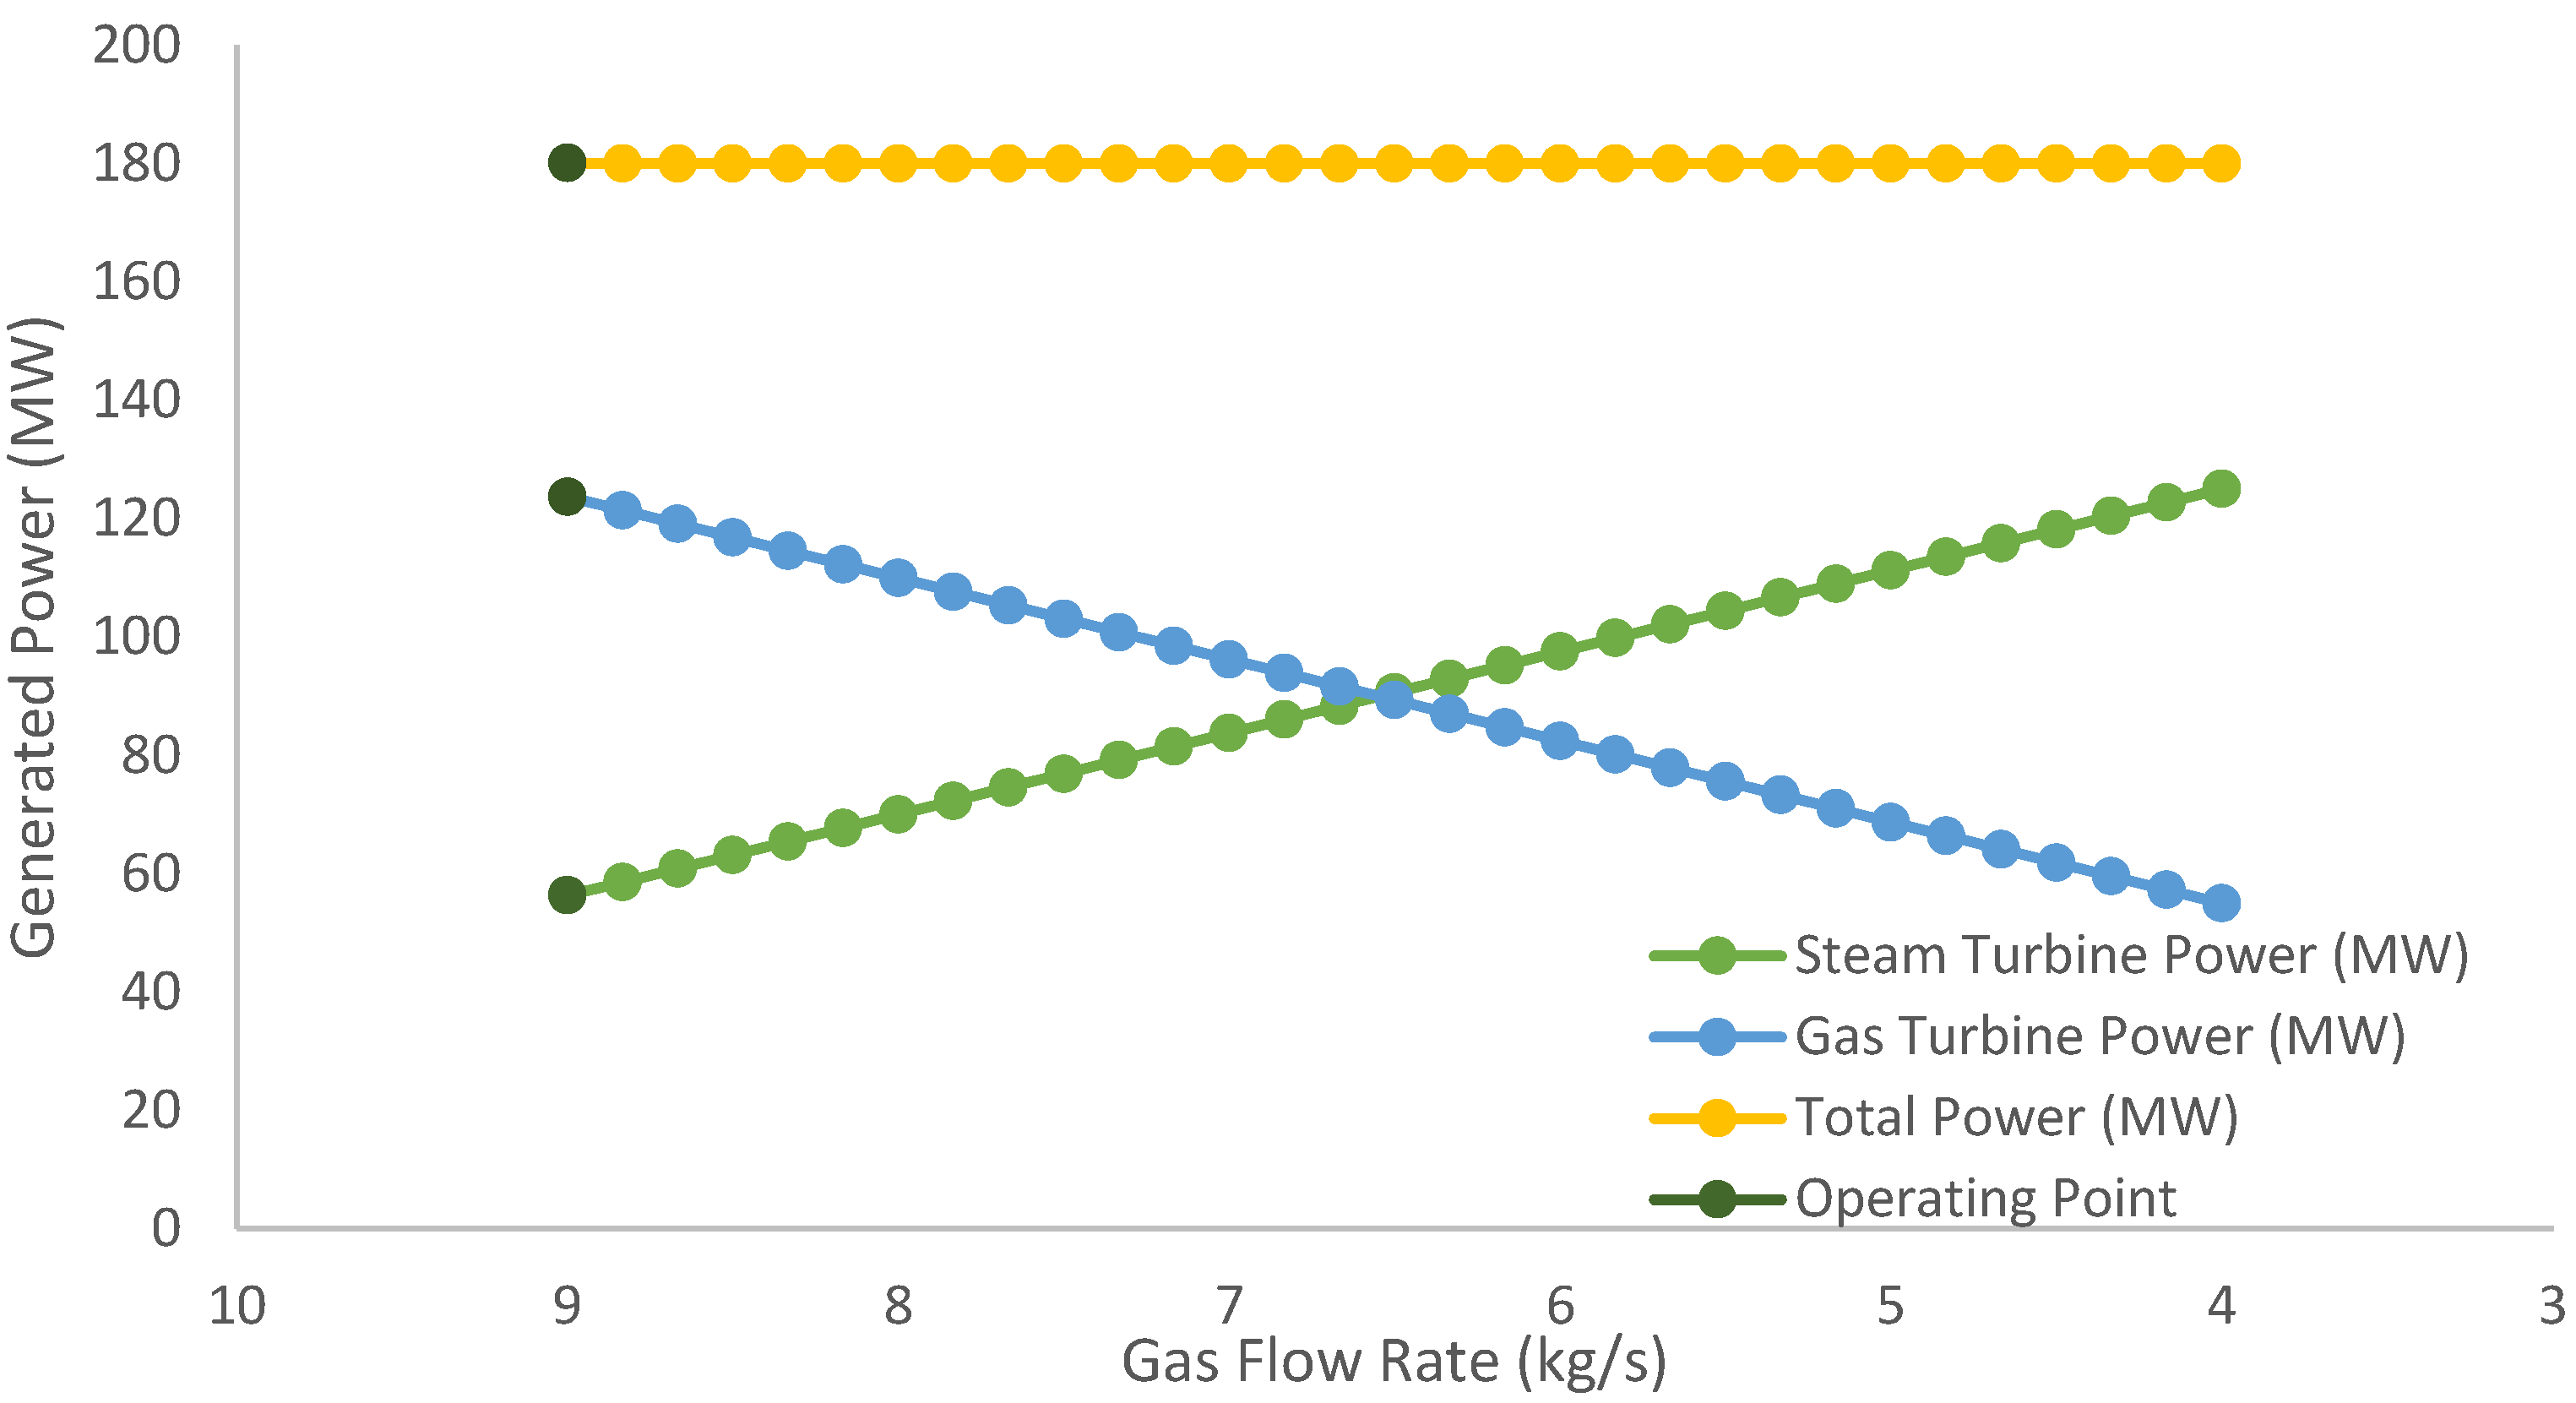
3.2. Sensitivity Study 1: Study the Effect of Reducing the Natural Gas Flow Rate on the Main Cycle Parameters
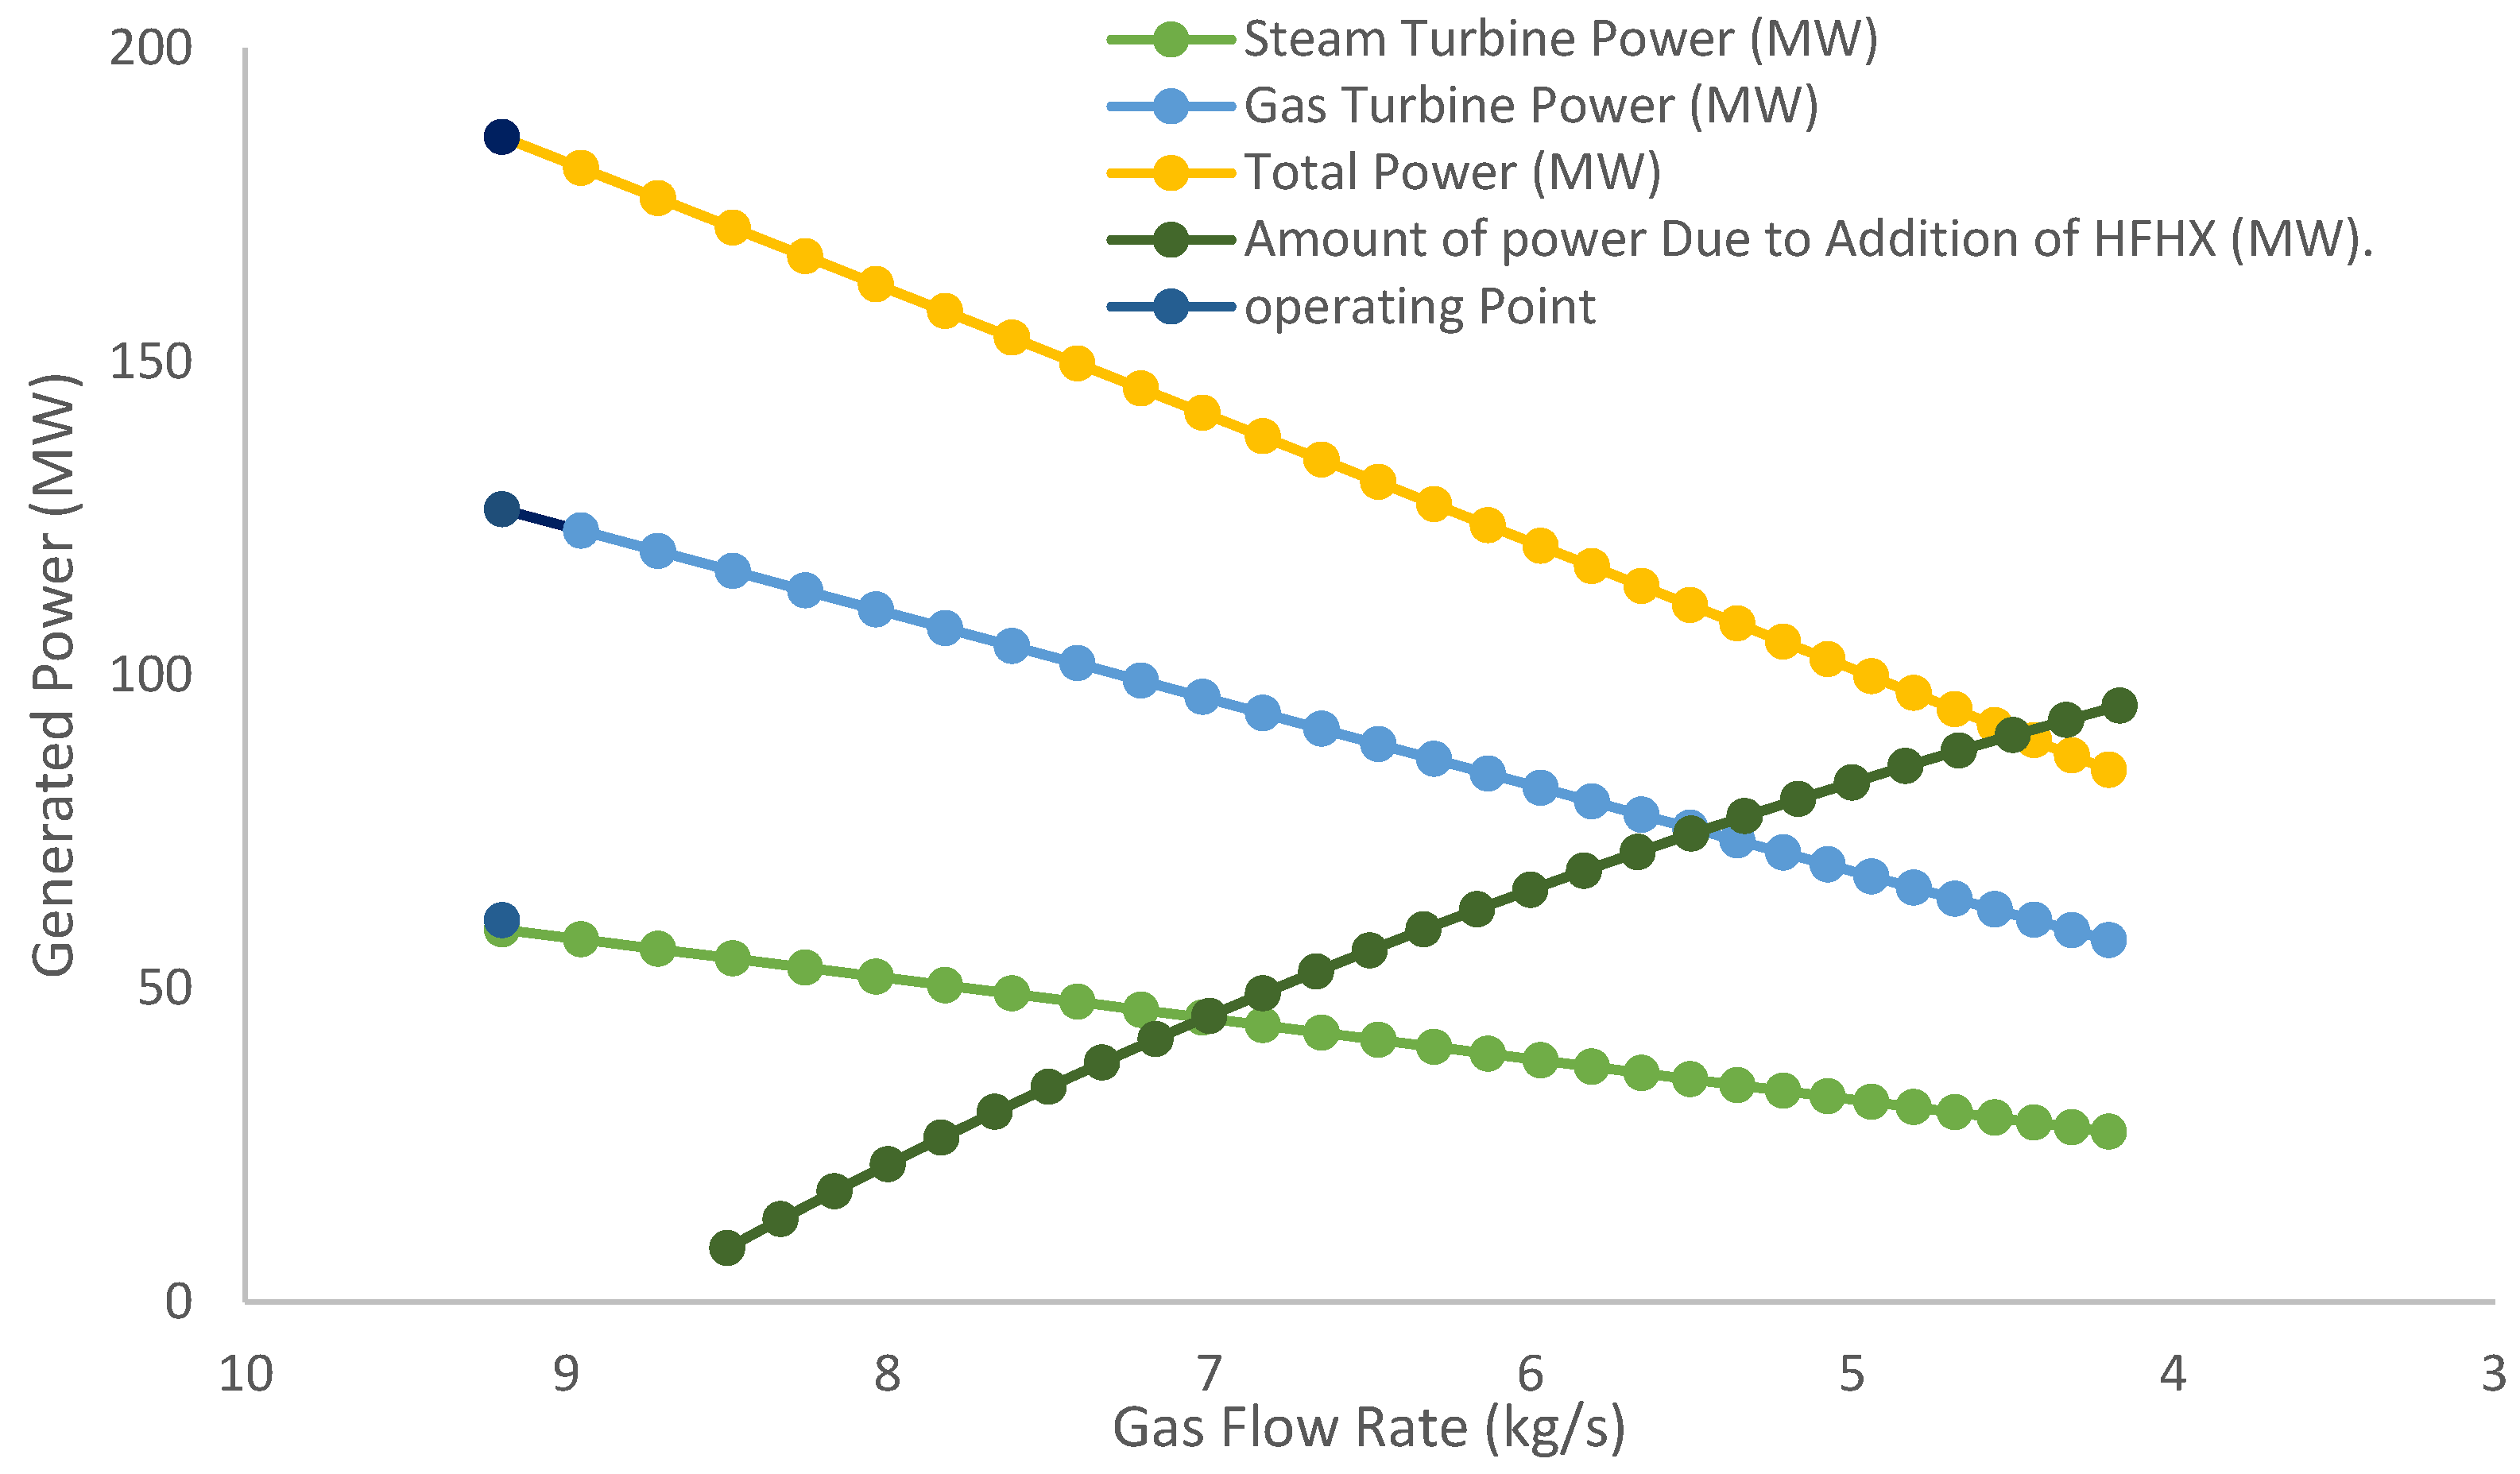
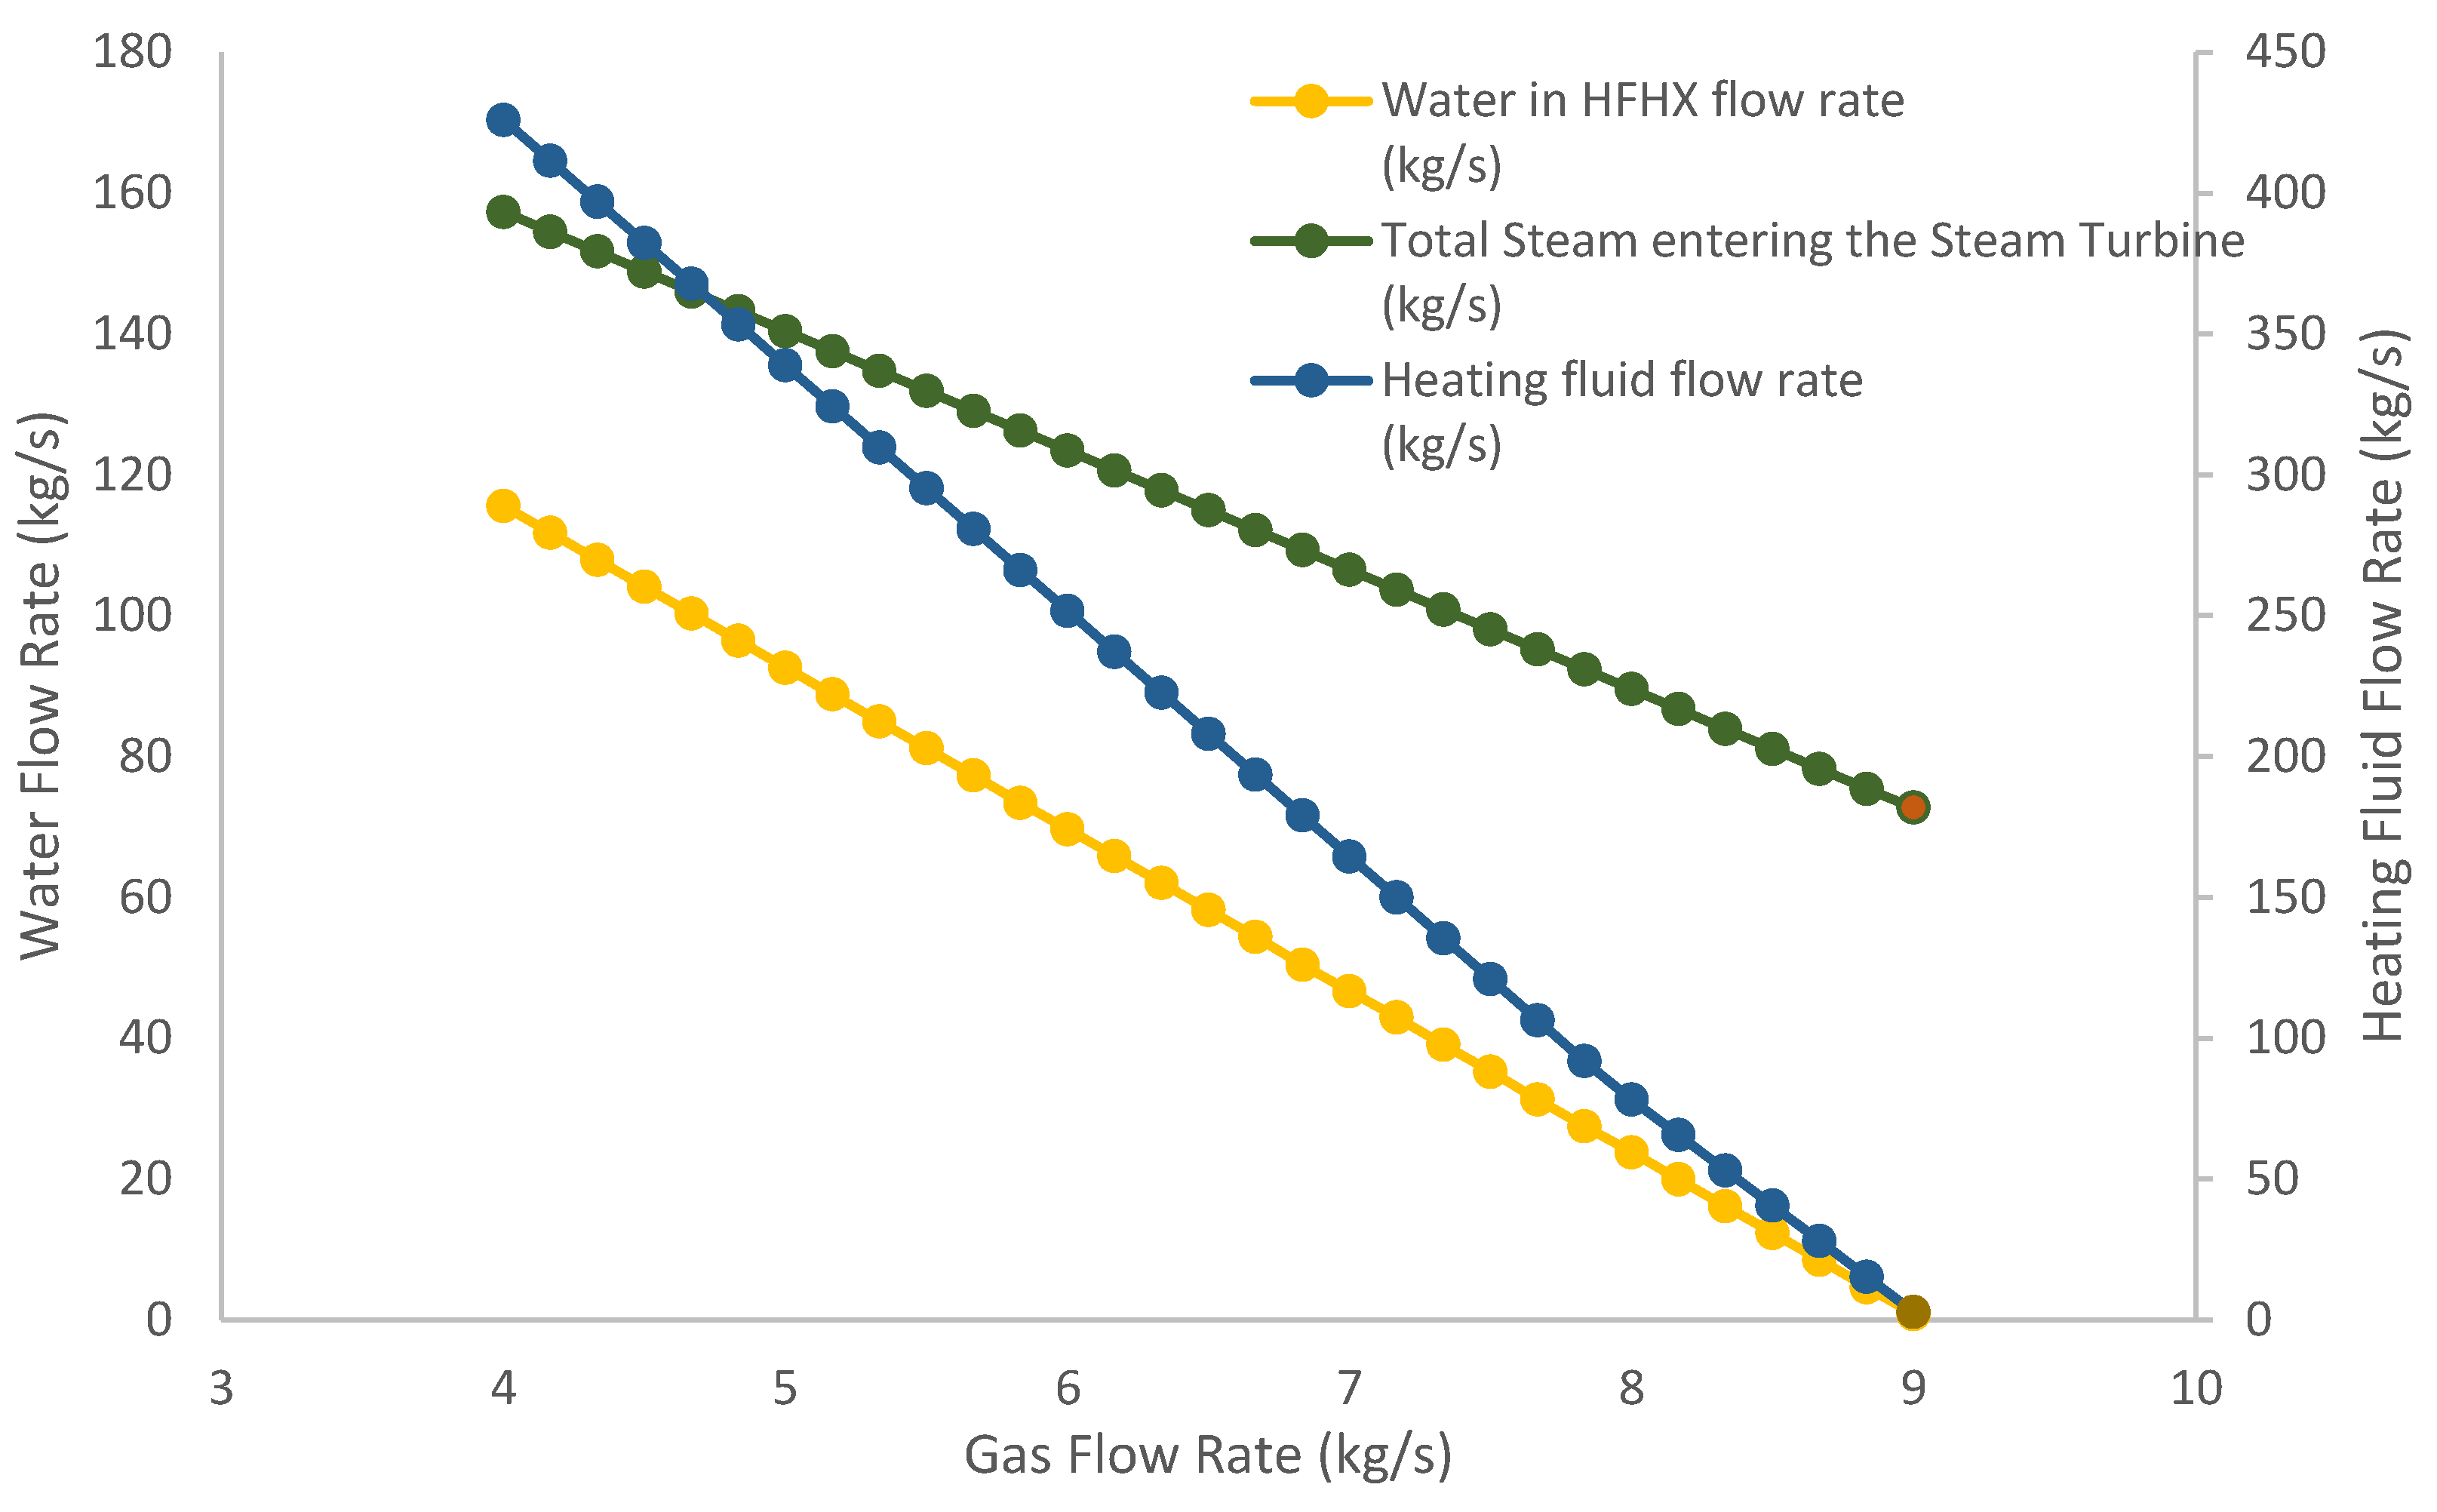
3.3. Sensitivity Study 2: ISCC Study of the Effect of Dropping the Natural Gas Flow Rate on the ISCC
4. Conclusions
- The research indicates that the development of an integrated cycle is a promising approach to reduce CO2 emission significantly since the amount of burned NG fuel is reduced.
- It is concluded that the HFHX can be heated up by using an external parabolic trough system. This integration has advanced the power cycle towards using renewable energy sources, i.e., developing an Integrated Solar Combined Cycle (ISCC).
- The results indicate that commercial software can be used in the simulation and analysis of actual power plants, as the data were validated with insignificant errors, i.e., ranging 0.443–3.77%.
- Study 1 shows a direct relationship between the consumed natural gas flow rate and the total developed power, i.e., a reduction in the developed power happens from 180 to 84.86 MW when the natural gas flow rate was decreased from 9 to 4.2 kg/s, respectively.
- The analysis of study 2 proves that the total power output can be kept constant despite the fact that the used NG flow rate is dropped. For instance, 180 MW power was developed when the NG flow rate was reduced from 9 to 4.2 kg/s. This is achieved by adding external heat sources (HFHXs), which increase the generated steam from 72.7 kg/s to 157.31 kg/s. Therefore, the steam turbine power output was increased from 56.4 to 125 MW, respectively.
- Consideration of the turbine size should be taken in defining the natural gas flow rate.
5. Future Work
Author Contributions
Funding
Data Availability Statement
Acknowledgments
Conflicts of Interest
References
- Bolivar, N. Physics of Energy Sources; Arcler Press: Ashland, OR, USA, 2019. [Google Scholar]
- King, G.C. Physics of Energy Sources; Wiley: Chichester, UK; Hoboken, NJ, USA, 2018. [Google Scholar]
- Chung, D.K.H. Techno-economic analysis of a novel gas-fired power plant integrated with solar thermal energy. Energy 2021, 215, 119146. [Google Scholar]
- Matar, W.A.M. Prospects and challenges of renewable energy in the MENA region. Renew. Sustain. Energy Rev. 2020, 123, 109764. [Google Scholar]
- Tiwari, A.K.K.N. Multi-objective optimization of integrated solar combined cycle power plant using har-mony search algorithm. Renew. Energy 2021, 174, 91–105. [Google Scholar]
- Krischer, K.; Schönleber, K. Physics of Energy Conversion; De Gruyter: Berlin, Germany, 2015. [Google Scholar]
- Singal, R.K.; Tabatabaian, M. Direct Energy Conversion Technologies; Mercury Learning & Information: Dulles, VA, USA, 2020. [Google Scholar]
- Çengel, Y.A.; Boles, M.A.; Kanoglu, M. Thermodynamics: An Engineering Approach, 9th ed.; McGraw-Hill: New York, NY, USA, 2019. [Google Scholar]
- Tangellapalli, S. Thermal Cycles of Heat Recovery Power Plants; Bentham Science Publishers Ltd.: Singapore, 2021. [Google Scholar]
- Moran, M.J.; Shapiro, H.N.; Boettner, D.D.; Bailey, M.B. Principles of Engineering Thermodynamics: SI Version; Wiley: Singapore, 2015. [Google Scholar]
- Reisel, J.R. Principles of Engineering Thermodynamics, SI Edition; John R. Reisel.: Milwaukee, WI, USA,, 2021. [Google Scholar]
- U.S. Department of Energy. Concentrated Solar Power. 2021. Available online: https://www.energy.gov/eere/solar/parabolic-trough (accessed on 10 April 2023).
- Power Technology. Noor Ouarzazate Solar Complex, Morocco. 6 March 2020. Available online: https://www.power-technology.com/projects/noor-ouarzazate-solar-complex/?cf-view (accessed on 10 April 2023).
- Khalaf, I.; Fadhil, E.; Weis, M. Methods for improving the thermal efficiency of a parabolic trough solar collector: A review. AIP Conf. Proc. 2022, 2885, 020010. [Google Scholar] [CrossRef]
- Fuentes-Morales, R.F.; Diaz-Ponce, A.; Peña-Cruz, M.I.; Rodrigo, P.M.; Valentín-Coronado, L.M.; Martell-Chavez, F.; Pineda-Arellano, C.A. Control Algorithms Applied to Active Solar Tracking Systems: A Review. Sol. Energy 2020, 212, 203–219. [Google Scholar] [CrossRef]
- U.S. Department of Energy. Solar Parabolic Trough. 2009. Available online: https://www1.eere.energy.gov/ba/pba/pdfs/solar_trough.pdf (accessed on 10 April 2023).
- AlKassem, A. A performance evaluation of an integrated solar combined cycle power plant with solar tower in Saudi Arabia. Renew. Energy Focus 2021, 39, 123–138. [Google Scholar] [CrossRef]
- Kelly, B.; Herrmann, U.; Hale, M.J. Optimization studies for integrated solar combined cycle systems. In Proceedings of the International Solar Energy Conference, Washington, DC, USA, 21–25 April 2001. [Google Scholar] [CrossRef]
- Yuanyuan, L.; Yongping, Y. Thermodynamic analysis of a novel integrated solar combined cycle. Appl. Energy 2014, 122, 133–142. [Google Scholar] [CrossRef]
- Binamer, A.O. Al-Abdaliya integrated solar combined cycle power plant: Case study of Kuwait, part I. Renew. Energy 2019, 131, 923–937. [Google Scholar] [CrossRef]
- Jubran, A.B.; Dalia, P.-E. Integrated Solar Combined Cycle Power Plants: Paving the way for thermal solar. Appl. Energy 2016, 169, 927–936. [Google Scholar] [CrossRef]
- Sofiane, M. Design, economic, and environmental assessments of linear Fresnel solar power plants. Environ. Prog. Sustain. Energy 2019, 39, e13350. [Google Scholar] [CrossRef]
- Duan, L.; Wang, Z. Performance Study of a Novel Integrated Solar Combined Cycle System. Energies 2018, 11, 3400. [Google Scholar] [CrossRef]
- Chaves, I.D.G.; López, J.R.G.; Zapata, J.L.G.; Robayo, A.L.; Niño, G.R. Process Analysis and Simulation in Chemical; Springer: London, UK, 2015. [Google Scholar]
- Al-Malah, K.I. Aspen Plus®: Chemical Engineering Applications; John Wiley & Sons, Inc.: Hoboken, NJ, USA, 2017. [Google Scholar]


| Component | Model in Aspen Plus | Specifications |
|---|---|---|
| Air Compressor, Steam Turbine, Gas Turbine | Compressor Model (Compr) | Discharge pressure, Isentropic efficiency |
| Combustion Chamber | Stoichiometric Reactor (RStoic) | Pressure, Heat Duty |
| Economizer, Evaporator, Superheater, HFHX | Heat Exchanger (MHeatX) | Outlet Temperature |
| Flash Drum | Flash (Flash2) | Pressure, Heat Duty |
| Condenser | Heat Exchanger (Heater) | Pressure, Vapor Fraction |
| Pump | Pump (Pump) | Discharge Pressure, Isentropic Efficiency |
| Split | Fraction Splitter (FSplit) | Flow Rate Fraction |
| Parameter | Unit | Value |
|---|---|---|
| Air Flow Rate | kg/s | 505.3600003 |
| Incoming Air Pressure | bar | 0.9981 |
| Incoming Air Temperature | °C | 26.6 |
| Compressor Discharge Pressure | bar | 9.4 |
| Compressor Efficiency | - | 0.883 |
| Fuel Flow Rate | kg/s | 9.2 |
| Fuel Pressure | bar | 22.8 |
| Fuel Temperature | °C | 15.6 |
| Fuel Composition | 92.47% Methane, 0.738 CO2 1.68 C3H8 0.20 i-C4H10, 0.22 n-C4H10, 0.06 i-C5H12, 0.05 n-C5H12, 3.53 N2 | |
| Fuel (LHV) | KJ/kg | 43,662.14 |
| Turbine Discharge Pressure | bar | 1 |
| Turbine Isentropic Efficiency | - | 0.85 |
| Water Flow Rate entering the HP HRSG | kg/h | 235,400 |
| Water Flow Rate entering the LP HRSG | kg/h | 40,000 |
| HP Eco Exhaust Temperature | °C | 263 |
| HP Eva Exhaust Temperature | Vapor fraction | 1 |
| HP Sup Exhaust Temperature | °C | 471.48 |
| LP Eco Exhaust Temperature | °C | 169 |
| LP Eva Exhaust Temperature | Vapor fraction | 1 |
| LP Sup Exhaust Temperature | °C | 217 |
| HP Drum Pressure | bar | 37.38 |
| LP Drum Pressure | bar | 6.72 |
| Steam Turbine Exhaust Pressure | bar | 0.08 |
| Condenser Vapor Fraction | - | 0 |
| Cooling Water Inlet Temperature | °C | 26.6 |
| Cooling Water Outlet Temperature | °C | 34.5 |
| Pump Discharge Pressure | bar | 21.6 |
| Pump Isentropic Efficiency | - | 0.85 |
| Steam Turbine Net Power | MW | 61.5 |
| Gas Turbine Net Power | MW | 127 |
| Heating Fluid Composition | 7%NaNO3, 53% KNO3, 40%NaNO2 | |
| Heating Fluid Inlet Temperature | °C | 570 |
| Heating Fluid Exhaust Temperature | °C | 240 |
| Heating Fluid Pressure | bar | 100 |
| Parameter | Local Plant Date | Simulation Results | Error % |
|---|---|---|---|
| Gas Turbine Work Output | 127 MW | 126.45 MW | 0.433 |
| Steam Turbine Work Output | 61.5 MW | 59.47 MW | 3.3 |
| Gas Turbine Inlet Temperature | 1050 °C | 1010.46 °C | 3.77 |
| Gas Turbine Exhaust Temperature | 540.7 °C | 556.93 °C | 3.00 |
| Efficiency | 46.93% | 46.28% | 1.39 |
Disclaimer/Publisher’s Note: The statements, opinions and data contained in all publications are solely those of the individual author(s) and contributor(s) and not of MDPI and/or the editor(s). MDPI and/or the editor(s) disclaim responsibility for any injury to people or property resulting from any ideas, methods, instructions or products referred to in the content. |
© 2024 by the authors. Licensee MDPI, Basel, Switzerland. This article is an open access article distributed under the terms and conditions of the Creative Commons Attribution (CC BY) license (https://creativecommons.org/licenses/by/4.0/).
Share and Cite
Al Mhanna, N.M.; Al Hadidi, I.; Al Maskari, S. Simulation and Energy Analysis of Integrated Solar Combined Cycle Systems (ISCCS) Using Aspen Plus. Energies 2024, 17, 3986. https://doi.org/10.3390/en17163986
Al Mhanna NM, Al Hadidi I, Al Maskari S. Simulation and Energy Analysis of Integrated Solar Combined Cycle Systems (ISCCS) Using Aspen Plus. Energies. 2024; 17(16):3986. https://doi.org/10.3390/en17163986
Chicago/Turabian StyleAl Mhanna, Najah M., Islam Al Hadidi, and Sultan Al Maskari. 2024. "Simulation and Energy Analysis of Integrated Solar Combined Cycle Systems (ISCCS) Using Aspen Plus" Energies 17, no. 16: 3986. https://doi.org/10.3390/en17163986
APA StyleAl Mhanna, N. M., Al Hadidi, I., & Al Maskari, S. (2024). Simulation and Energy Analysis of Integrated Solar Combined Cycle Systems (ISCCS) Using Aspen Plus. Energies, 17(16), 3986. https://doi.org/10.3390/en17163986