
Investigation of the Performance and Use of a Solar Cell Integrated with a Reverse-Osmosis Water-Desalination System
 , , ,
, , ,
Abstract
:1. Introduction
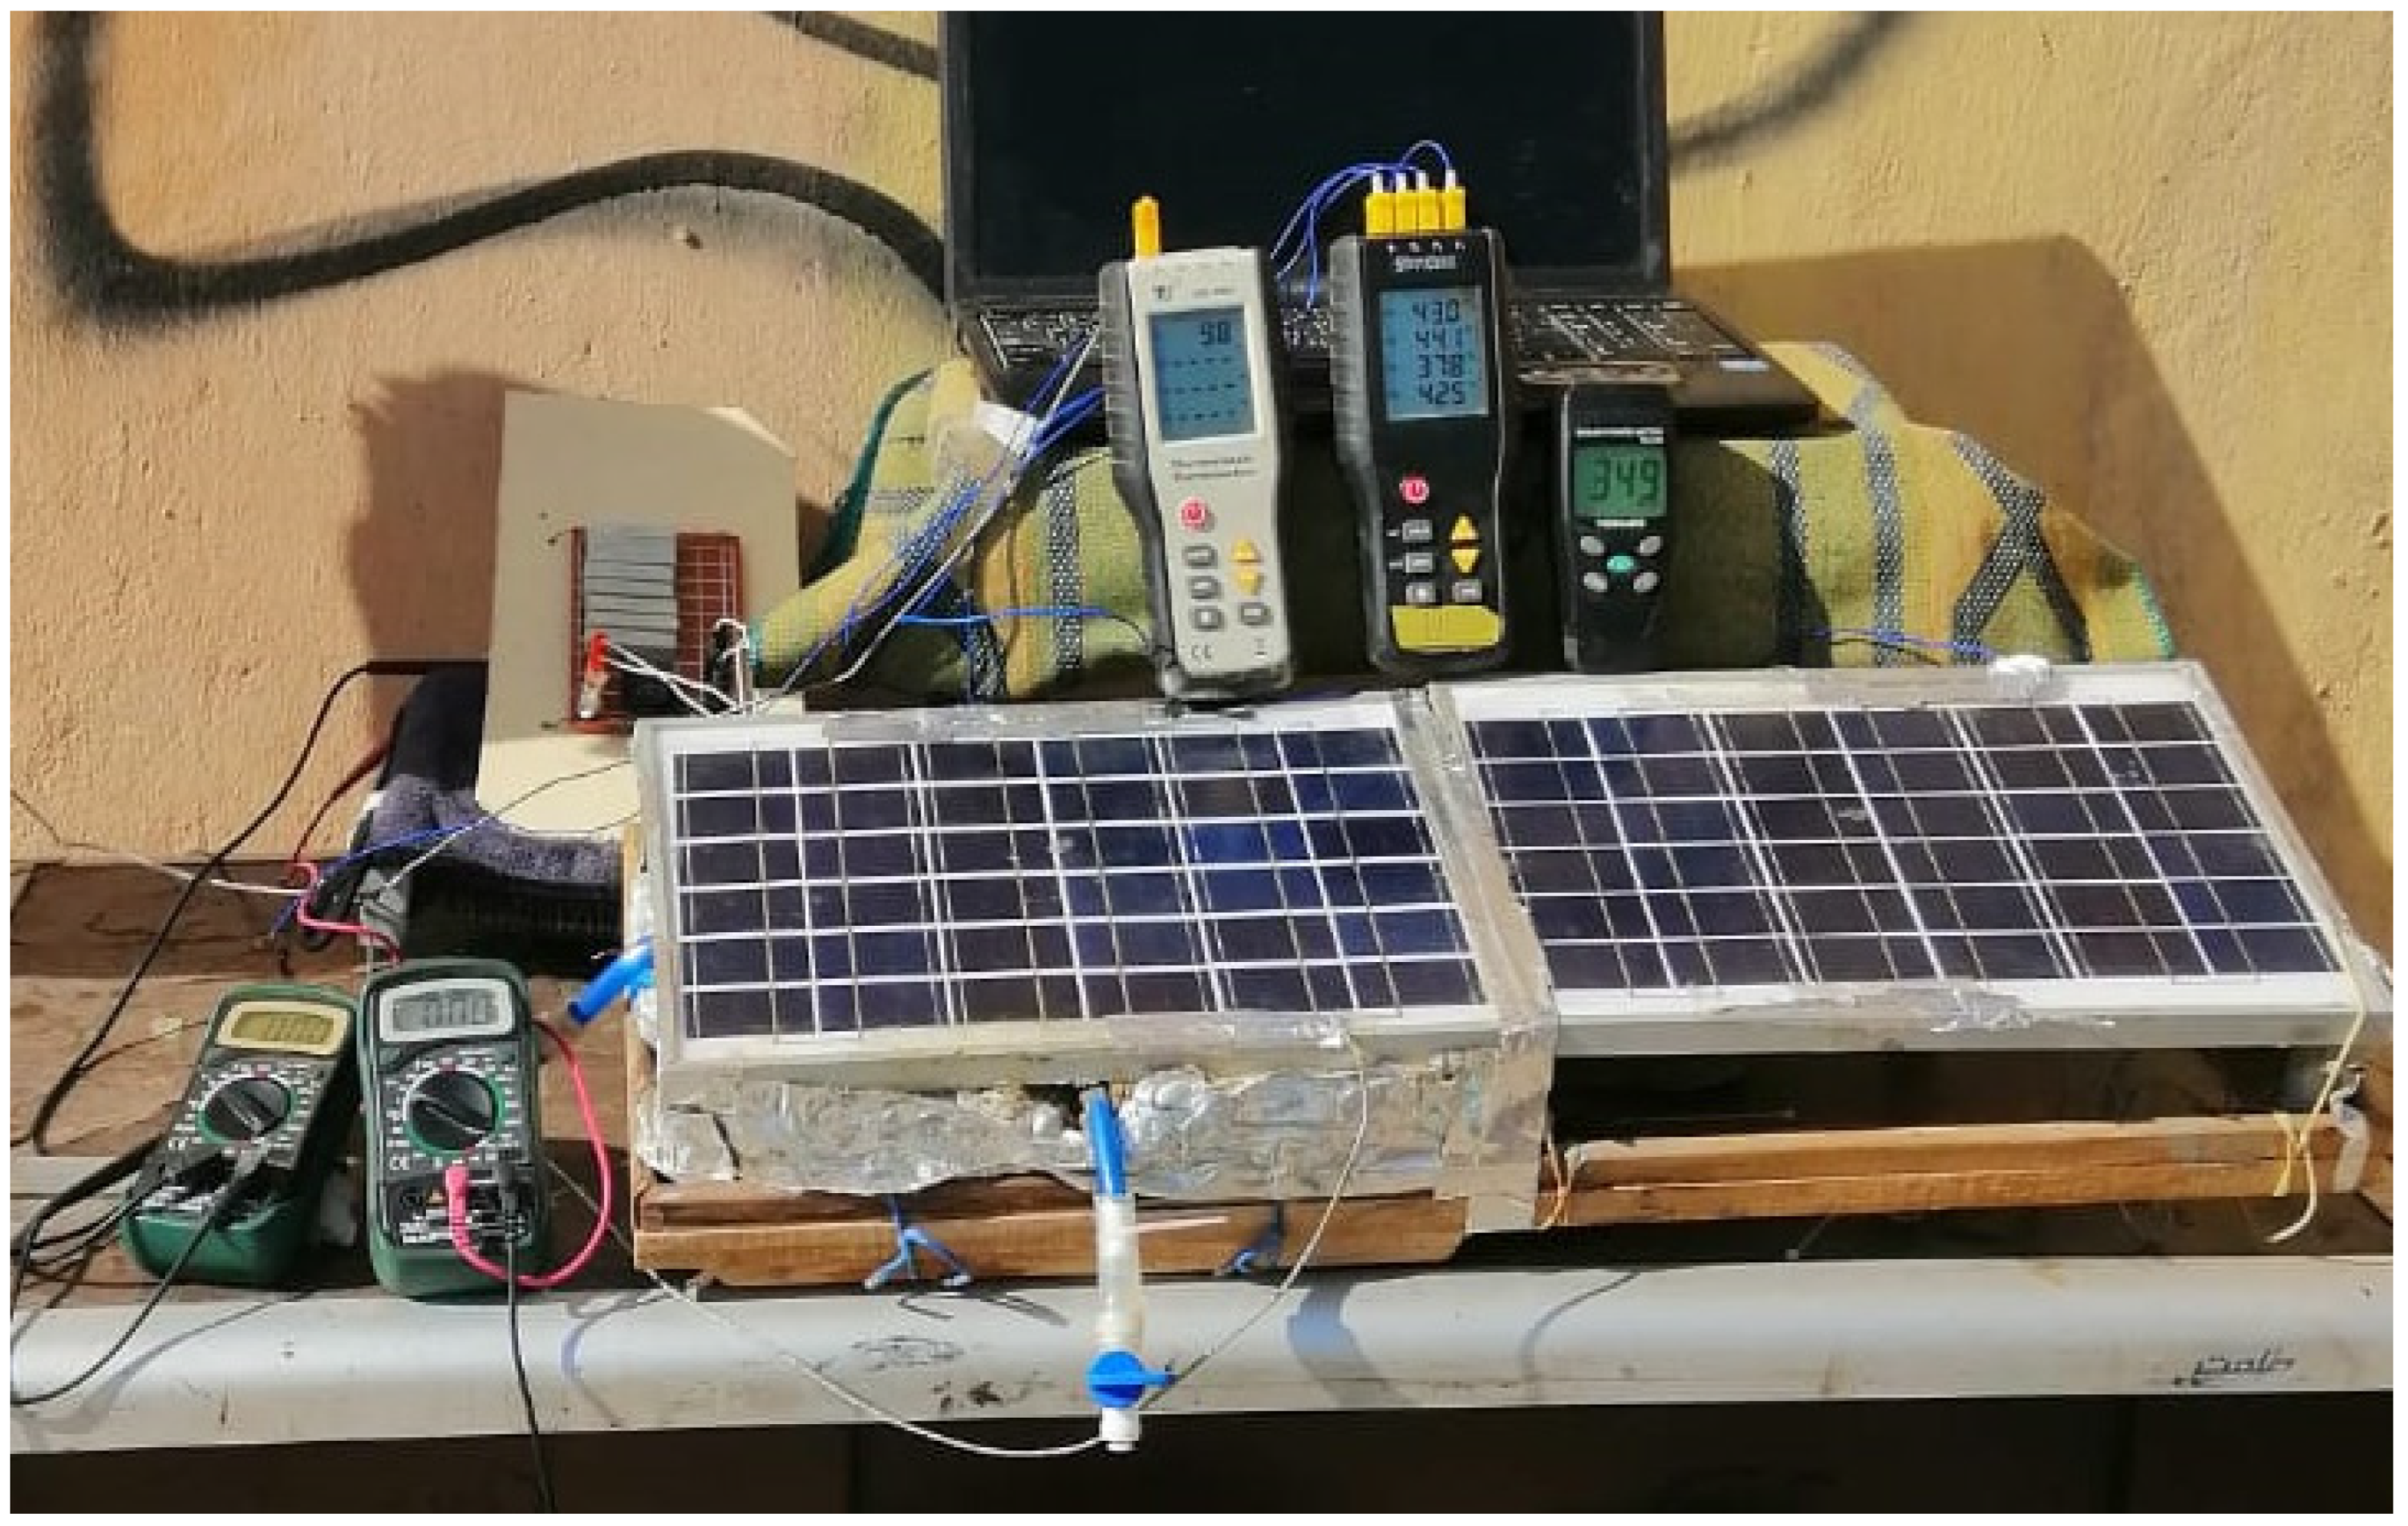
2. Experimental Procedures
3. Uncertainty Analysis
4. Physical Model
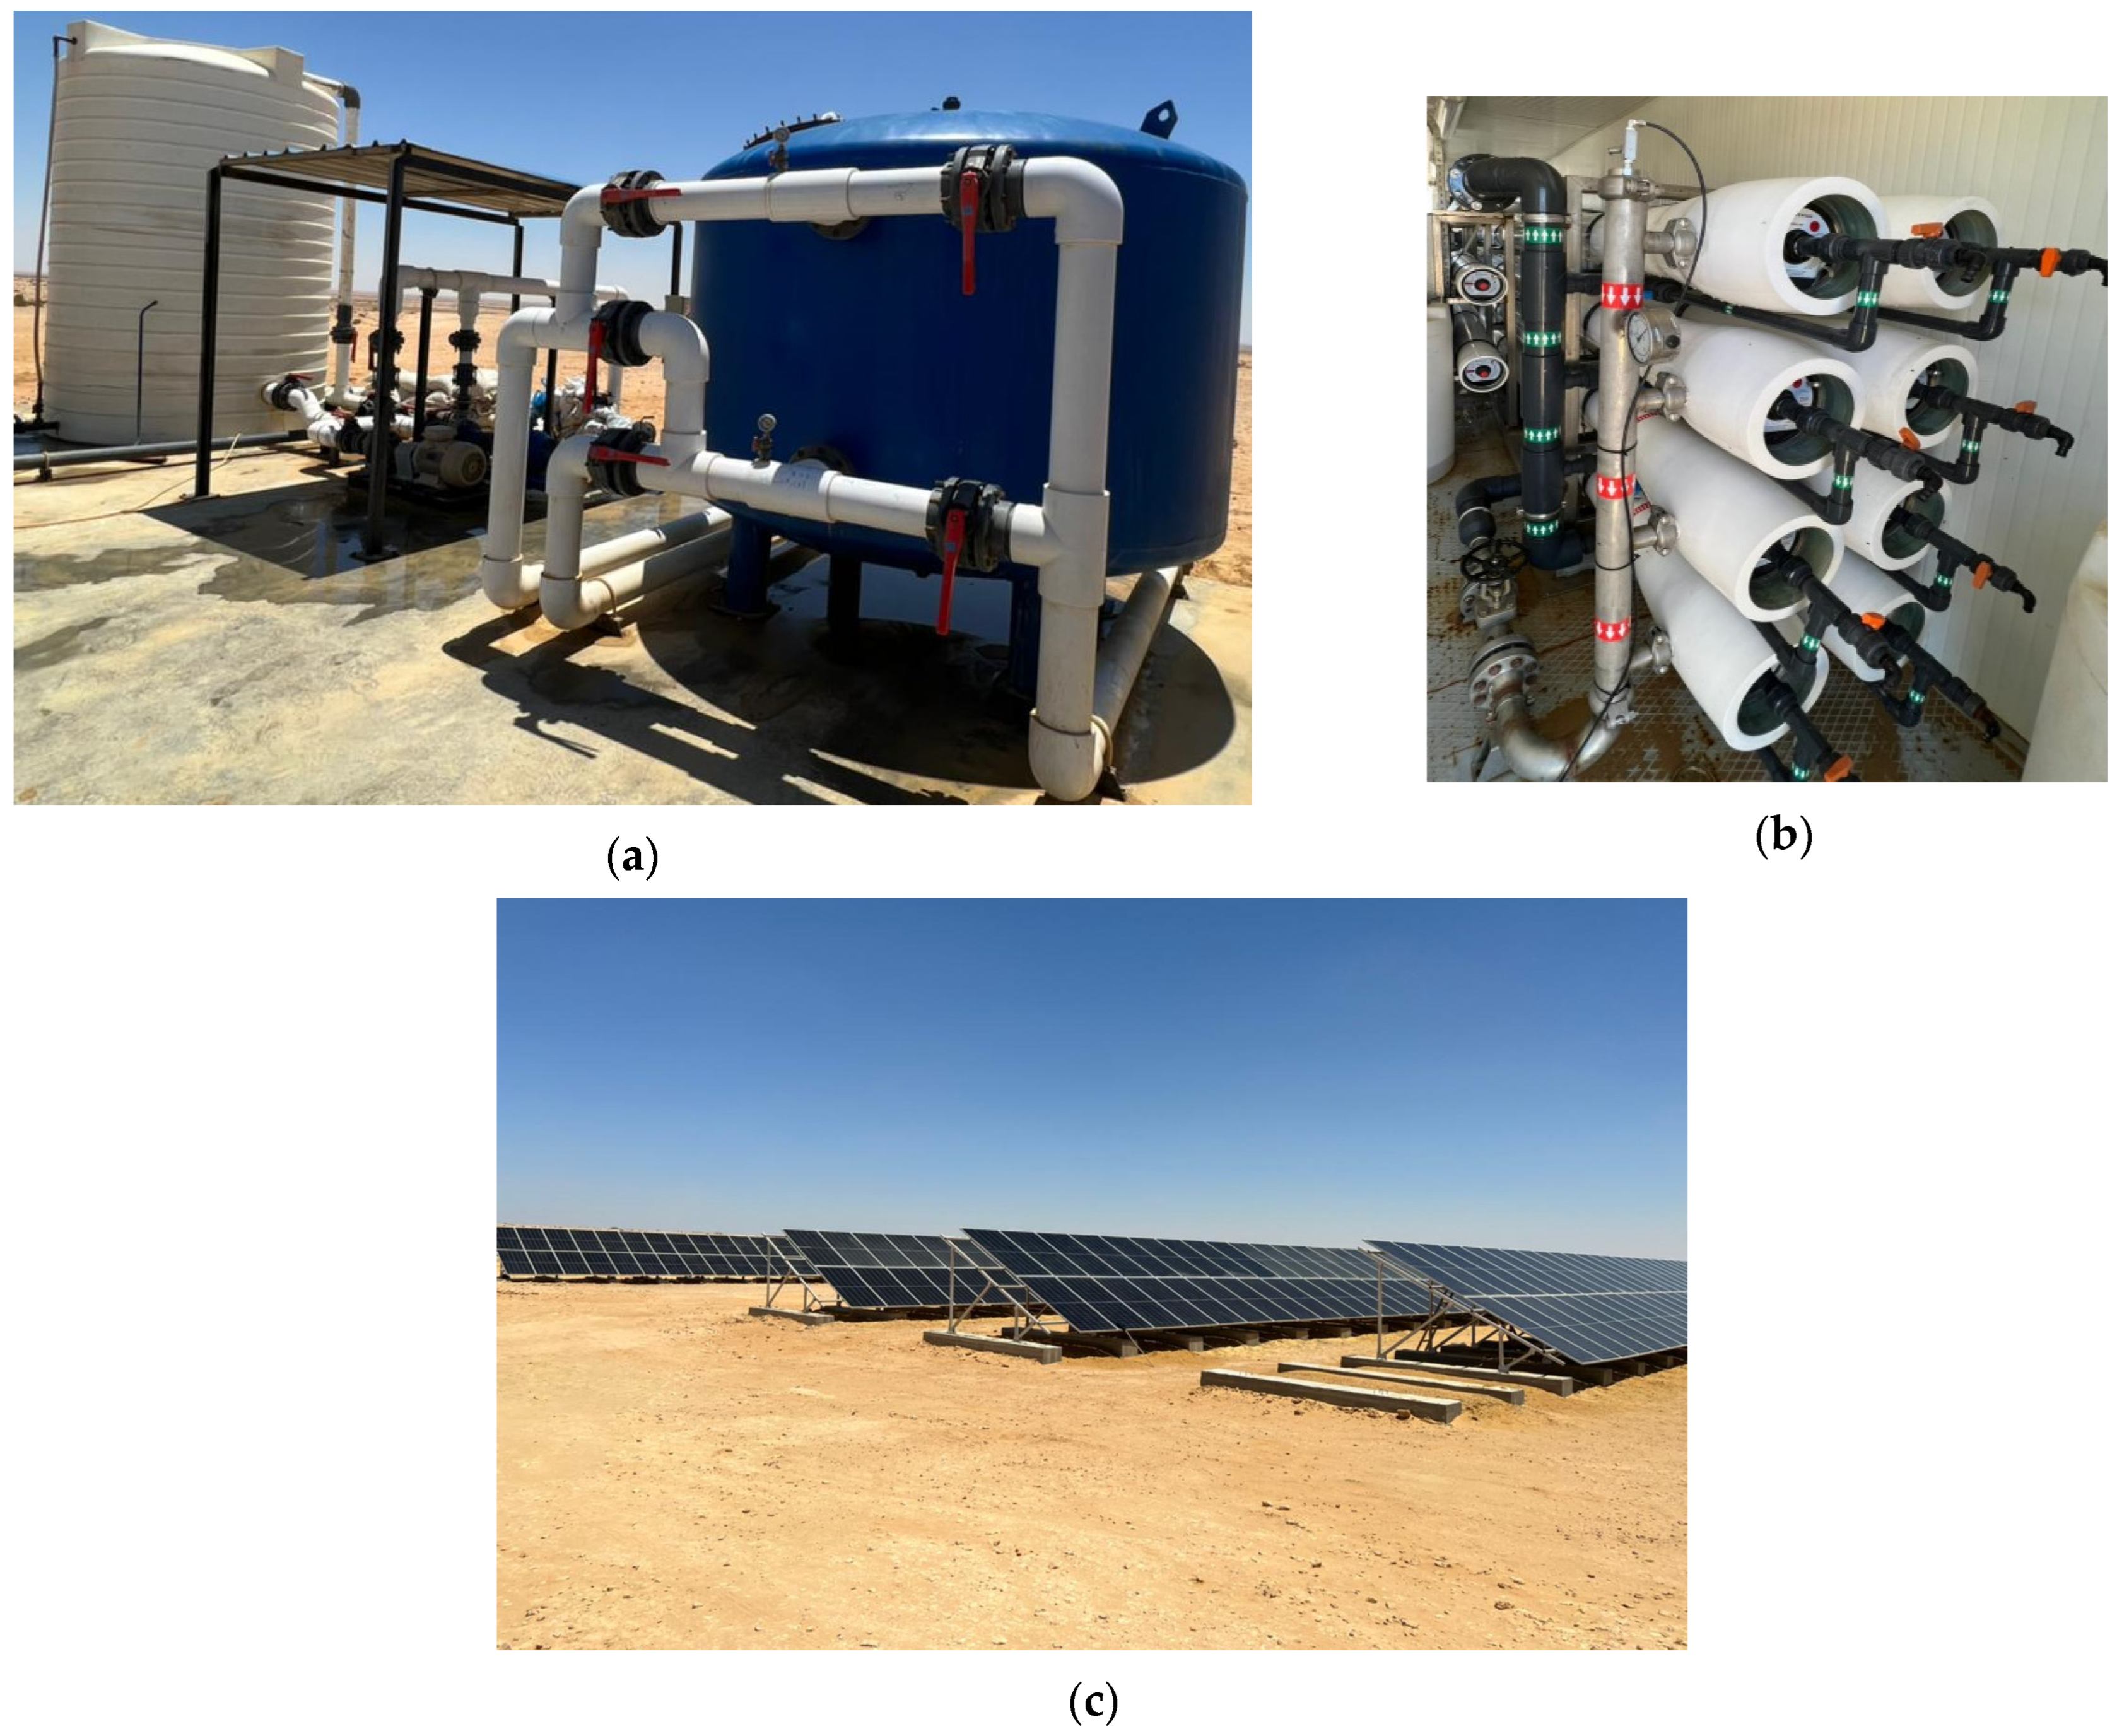
5. RO Desalination Plant
6. Validation of Software
7. Results
7.1. Solar Radiation
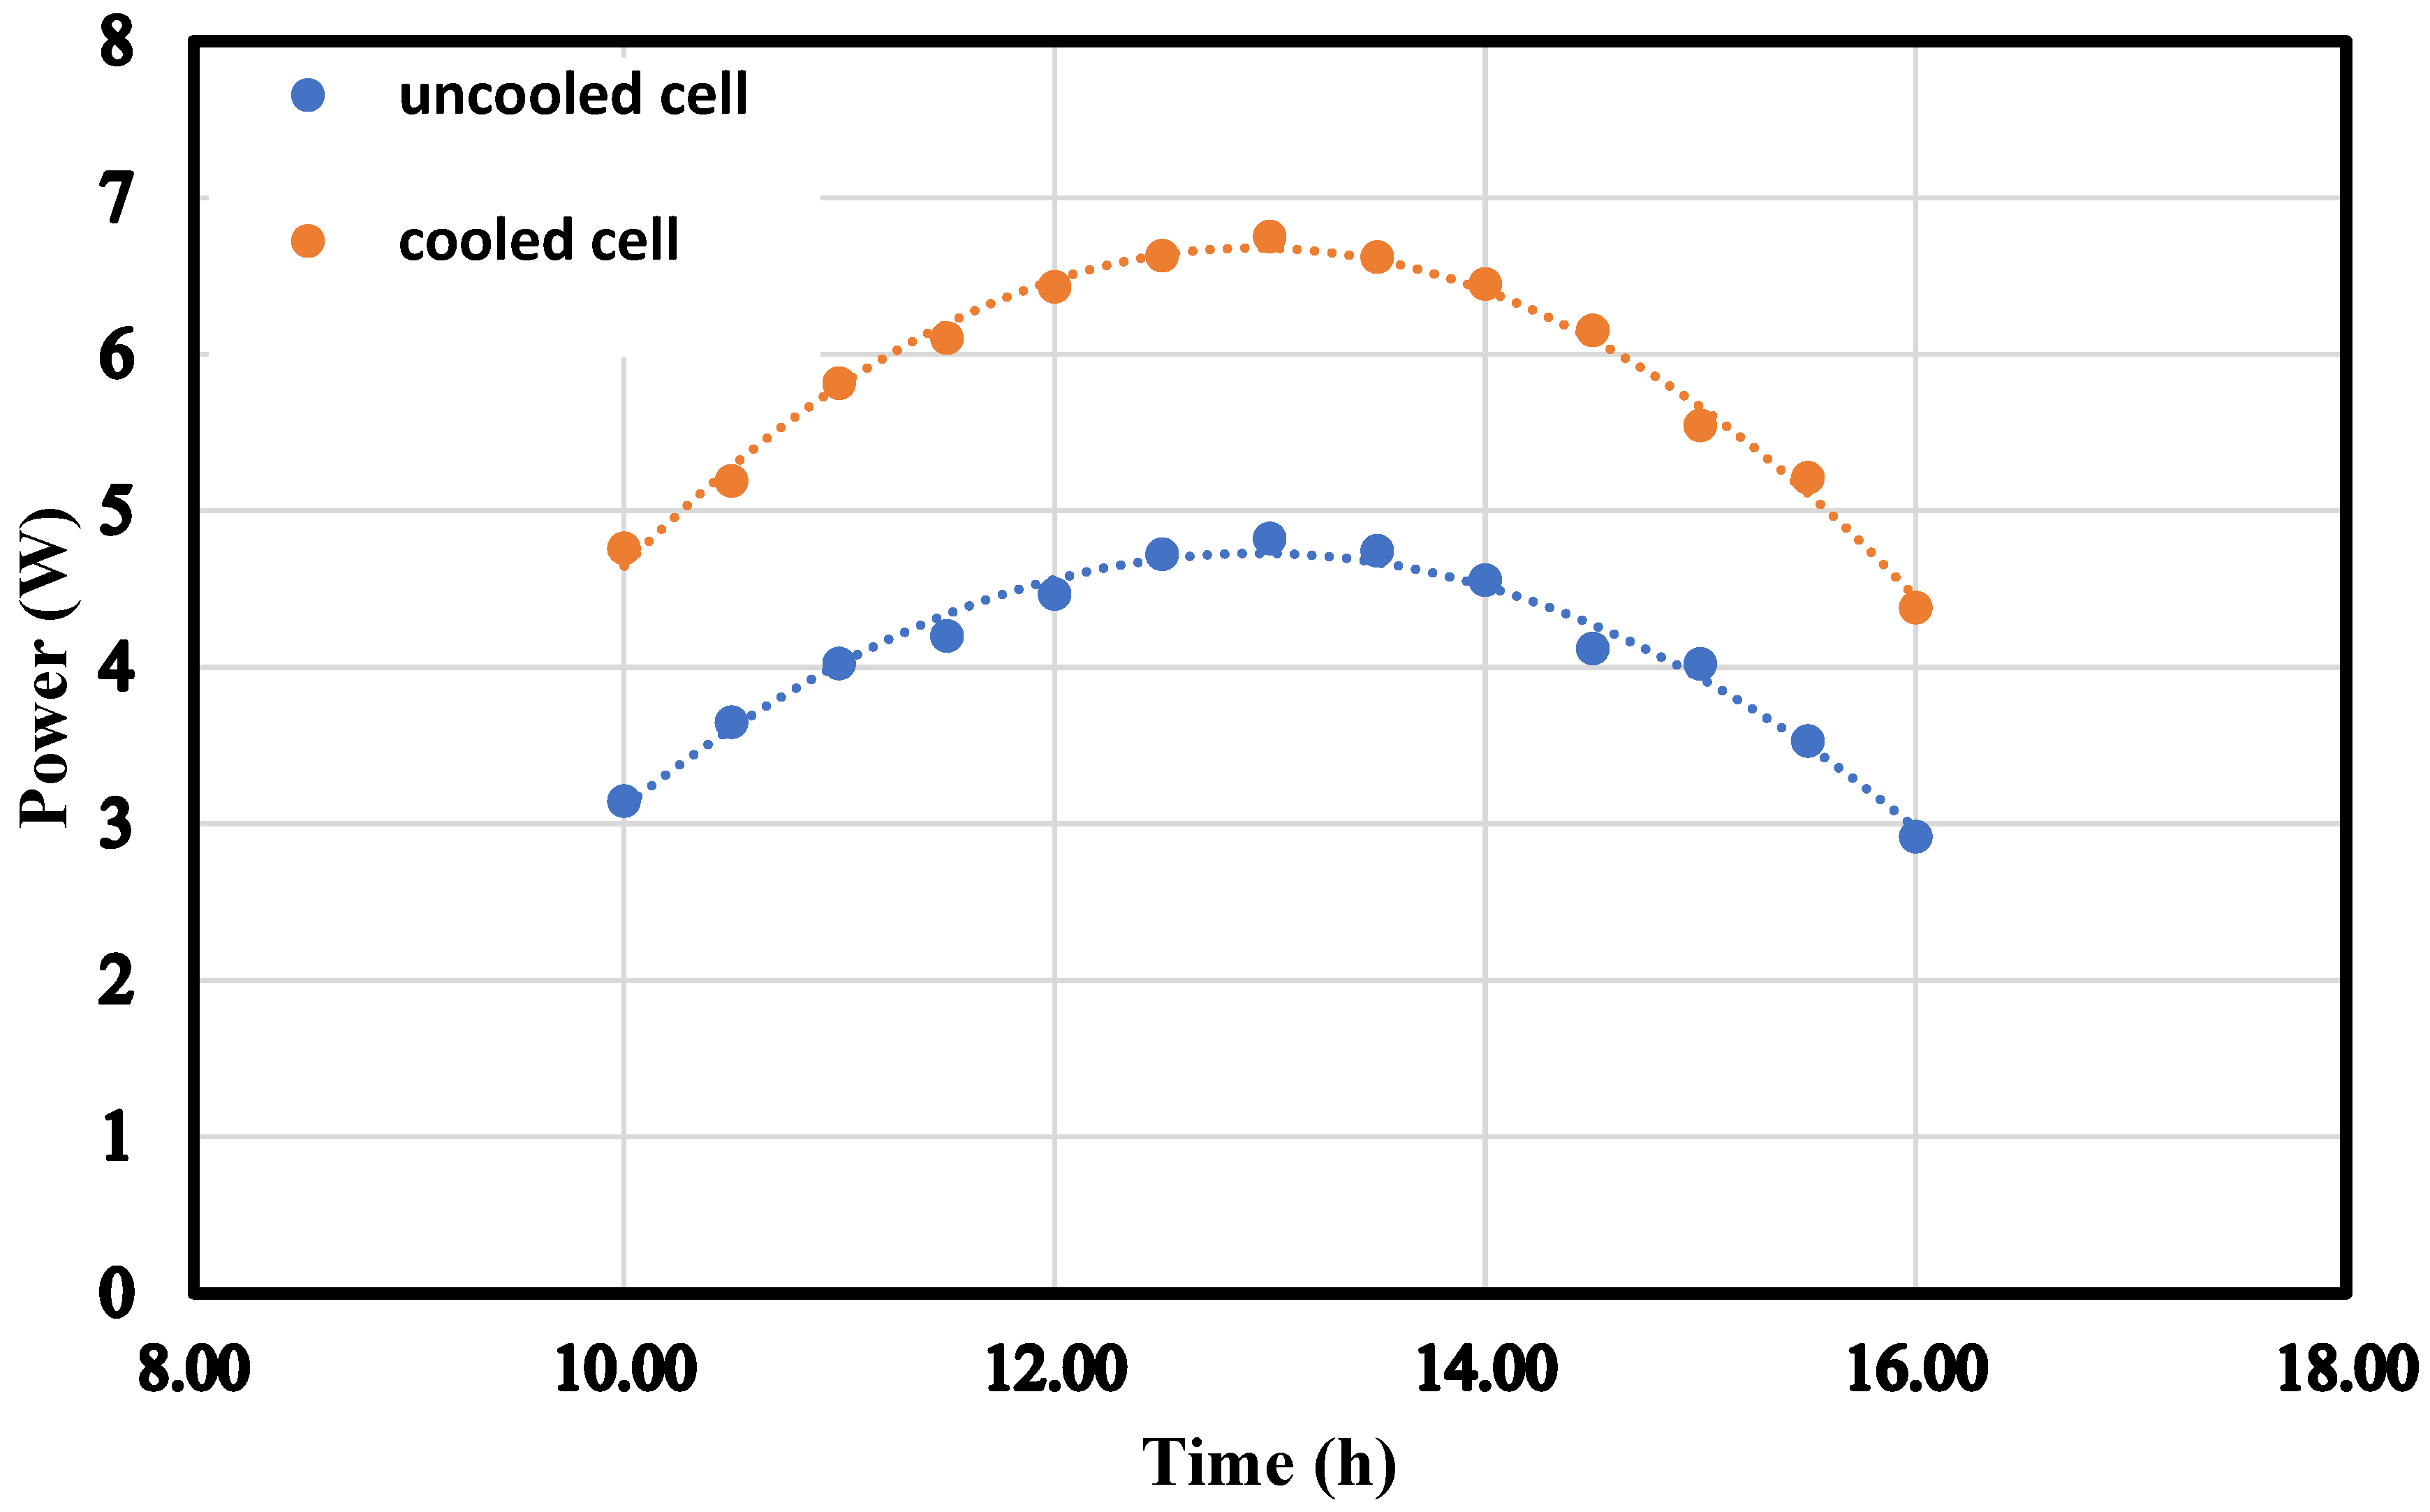
7.2. Electrical Power Output
7.3. Electrical Efficiency
7.4. Cell Surface Temperature
7.5. Reverse-Osmosis Simulation Results
8. Application of Results to Desalination Plant
9. Compression
10. Conclusions
- The electrical power generated from the cooled cell reached 6.75 W.
- The electrical efficiency of the cell could be enhanced to 51.4% if it was cooled with water.
- The maximum decrease in cell surface temperature was 9.44%.
- The increase in feed water temperature led to a decrease in the feed water pressure.
- TDS increased with the rise in feed water temperature.
- The specific energy consumed to produce 1 m3 of freshwater was decreased to 2.74 kWh with the increase in feed water temperature to 40 °C.
- A 3.2% reduction in consumed energy in the RO destination plant was achieved with the cooled system.
- The TDS increased from 50.51 to 62.71 ppm when the feed temperature was increased from 22 °C to 25.8 °C in the RO destination plant.
- A 6% reduction in feed pressure in the RO destination plant was achieved when the feed temperature was increased from 22 to 25.8 °C.
- In a real case study of a desalination plant, the energy consumed was reduced by 3.2%.
Author Contributions
Funding
Data Availability Statement
Conflicts of Interest
Nomenclature
| A | Cell area (m2) |
| D | Depth (mm) |
| Normal solar radiation (W/m2) | |
| Imp | Maximum-power current (Amper) |
| Isc | Short-circuit current (Amper) |
| Output current (Amper) | |
| L | Length (mm) |
| Pmax | Peak power (W) |
| Power input (W) | |
| Vmp | Maximum-power voltage (volt) |
| Voc | Open-circuit voltage (volt) |
| Output voltage (volt) | |
| W | Width (mm) |
| Greek symbols | |
| Electrical efficiency of cell | |
| Abbreviation | |
| RO | Reverse osmosis |
| PV | Photovoltaic |
| MFS | Membrane fouling simulator |
| PPM | Part per million |
| WAVE | Water application value engine |
References
- Nikiel, C.A.; Eltahir, E.A.B. Past and future trends of Egypt’s water consumption and its sources. Nat. Commun. 2021, 12, 4508. [Google Scholar] [CrossRef] [PubMed]
- Shafaghat, A.H.; Eslami, M.; Baneshi, M. Techno-enviro-economic study of a reverse osmosis desalination system equipped with photovoltaic-thermal collectors. Appl. Therm. Eng. 2023, 218, 119289. [Google Scholar] [CrossRef]
- Armendáriz-Ontiveros, M.M.; Dévora-Isiordia, G.E.; Rodríguez-López, J.; Sánchez-Duarte, R.G.; Álvarez-Sánchez, J.; Villegas-Peralta, Y.; Martínez-Macias, M.d.R. Effect of Temperature on Energy Consumption and Polarization in Reverse Osmosis Desalination Using a Spray-Cooled Photovoltaic System. Energies 2022, 15, 7787. [Google Scholar] [CrossRef]
- Cervantes-Rendón, E.; Ibarra-Bahena, J.; Cervera-Gómez, L.E.; Romero, R.J.; Cerezo, J.; Rodríguez-Martínez, A.; Dehesa-Carrasco, U. Rural Application of a Low-Pressure Reverse Osmosis Desalination System Powered by Solar–Photovoltaic Energy for Mexican Arid Zones. Sustainability 2022, 14, 10958. [Google Scholar] [CrossRef]
- Talebnejad, R.; Kamfiroozi, S.; Ebadi, H.; Vahabi, S.H.; Sepaskhah, A.R.; Ghobadian, B.; Savoldi, L. A new cooling method for photovoltaic panels using brine from reverse osmosis units to increase efficiency and improve productivity. Energy Convers. Manag. 2022, 251, 115031. [Google Scholar] [CrossRef]
- Kensara, M.; Dayem, A.M.A.; Nasr, A. Reverse osmosis desalination plant driven by solar photovoltaic system-case study. Int. J. Heat Technol. 2021, 39, 1153–1163. [Google Scholar] [CrossRef]
- Monjezi, A.A.; Chen, Y.; Vepa, R.; Kashyout, A.E.-H.B.; Hassan, G.; Fath, H.E.-B.; Kassem, A.E.-W.; Shaheed, M.H. Development of an off-grid solar energy powered reverse osmosis desalination system for continuous production of freshwater with integrated photovoltaic thermal (PVT) cooling. Desalination 2020, 495, 114679. [Google Scholar] [CrossRef]
- Jbari, Y.; Abderafi, S. Parametric study to enhance performance of wastewater treatment process, by reverse osmosis-photovoltaic system. Appl. Water Sci. 2020, 10, 217. [Google Scholar] [CrossRef]
- Kelley, L.C.; Dubowsky, S. Thermal control to maximize photovoltaic powered reverse osmosis desalination systems productivity. Desalination 2013, 314, 10–19. [Google Scholar] [CrossRef]
- Vyas, H.; Suthar, K.; Chauhan, M.; Jani, R.; Bapat, P.; Patel, P.; Markam, B.; Maiti, S. Modus operandi for maximizing energy efficiency and increasing permeate flux of community scale solar powered reverse osmosis systems. Energy Convers. Manag. 2015, 103, 94–103. [Google Scholar] [CrossRef]
- Ntavou, E.; Kosmadakis, G.; Manolakos, D.; Papadakis, G.; Papantonis, D. Experimental evaluation of a multi-skid reverse osmosis unit operating at fluctuating power input. Desalination 2016, 398, 77–86. [Google Scholar] [CrossRef]
- Freire-Gormaly, M.; Bilton, A.M. Design of photovoltaic powered reverse osmosis desalination systems considering membrane fouling caused by intermittent operation. Renew. Energy 2019, 135, 108–121. [Google Scholar] [CrossRef]
- Alghoul, M.A.; Poovanaesvaran, P.; Mohammed, M.H.; Fadhil, A.M.; Muftah, A.F.; Alkilani, M.M.; Sopian, K. Design and experimental performance of brackish water reverse osmosis desalination unit powered by 2 kW photovoltaic system. Renew. Energy 2016, 93, 101–114. [Google Scholar] [CrossRef]
- Raval, H.D.; Maiti, S. Ultra-low energy reverse osmosis with thermal energy recovery from photovoltaic panel cooling and TFC RO membrane modification. Desalin. Water Treat. 2016, 57, 4303–4312. [Google Scholar] [CrossRef]
- Shigidi, I.; Anqi, A.E.; Elkhaleefa, A.; Mohamed, A.; Ali, I.H.; Brima, E.I. Temperature Impact on Reverse Osmosis Permeate Flux in the Remediation of Hexavalent Chromium. Water 2022, 14, 44. [Google Scholar] [CrossRef]
- Altmann, T.; Buijs, P.J.; Farinha, A.S.F.; Borges, V.R.P.; Farhat, N.M.; Vrouwenvelder, J.S.; Das, R. Seawater Reverse Osmosis Performance Decline Caused by Short-Term Elevated Feed Water Temperature. Membranes 2022, 12, 792. [Google Scholar] [CrossRef]
- Shaaban, S.; Yahya, H. Detailed analysis of reverse osmosis systems in hot climate conditions. Desalination 2017, 423, 41–51. [Google Scholar] [CrossRef]
- Hawari, A.H.; Kamal, N.; Altaee, A. Combined influence of temperature and flow rate of feeds on the performance of forward osmosis. Desalination 2016, 398, 98–105. [Google Scholar] [CrossRef]
- Farhat, N.M.; Vrouwenvelder, J.S.; Van Loosdrecht, M.C.M.; Bucs, S.S.; Staal, M. Effect of water temperature on biofouling development in reverse osmosis membrane systems. Water Res. 2016, 103, 149–159. [Google Scholar] [CrossRef]
- Kotb, H.; Amer, E.H.; Ibrahim, K.A. Effect of operating conditions on salt concentration at the wall of RO membrane. Desalination 2015, 357, 246–258. [Google Scholar] [CrossRef]
- Jawor, A.; Hoek, E.M.V. Effects of feed water temperature on inorganic fouling of brackish water RO membranes. Desalination 2009, 235, 44–57. [Google Scholar] [CrossRef]
- Mostafa, M.; Moawed, M.; Refaey, H.A.; Salem, M.R. Performance evaluation of a Sea water reverse osmosis system at different operating scenarios. Eng. Res. J. Fac. Eng. 2021, 49, 67–79. [Google Scholar] [CrossRef]
- Hamada, A.; Emam, M.; Refaey, H.A.; Moawed, M.; Abdelrahman, M.A. Investigating the performance of a water-based PVT system using encapsulated PCM balls: An experimental study. Energy 2023, 284, 128574. [Google Scholar] [CrossRef]
- N.W.S. “Cob” and “conners”. Notes Queries 1853, s1-VIII, 43. [Google Scholar] [CrossRef]
- Kim, J.; Park, K.; Hong, S. Application of two-stage reverse osmosis system for desalination of high-salinity and high-temperature seawater with improved stability and performance. Desalination 2020, 492, 114645. [Google Scholar] [CrossRef]
- Hadipour, A.; Rajabi Zargarabadi, M.; Rashidi, S. An efficient pulsed-spray water cooling system for photovoltaic panels: Experimental study and cost analysis. Renew. Energy 2021, 164, 867–875. [Google Scholar] [CrossRef]
- Piotrowski, L.J.; Simões, M.G.; Farret, F.A. Feasibility of water-cooled photovoltaic panels under the efficiency and durability aspects. Sol. Energy 2020, 207, 103–109. [Google Scholar] [CrossRef]
- Zanlorenzi, G.; Szejka, A.L.; Canciglieri, O. Hybrid photovoltaic module for efficiency improvement through an automatic water cooling system: A prototype case study. J. Clean. Prod. 2018, 196, 535–546. [Google Scholar] [CrossRef]


| Item | Specifications | Value |
|---|---|---|
| PV module | Cell type | Mono-crystalline |
| Peak power (Pmax) | 10 W ± 3% | |
| Dimensions (mm) W × L × D | 240 × 360 × 35 ± 2% | |
| Maximum-power voltage (Vmp) | 18 Volts | |
| Maximum-power current (Imp) | 0.56 Amper | |
| Open-circuit voltage (Voc) | 21.6 Volts | |
| Short-circuit current (Isc) | 0.612 Amper |
| Parameter | Value | Unit |
|---|---|---|
| Active membrane area | 37 | m2 |
| Permeate flow rate | 28 | m3/d |
| Minimum salt rejection | 99.65 | % |
| Stabilized salt rejection | 99.80 | % |
| Boron rejection | 92 | % |
| Element length | 1016 | mm |
| Element diameter | 201 | mm |
| Max. applied pressure | 83 | bar |
| Max. chlorine concentration | <0.1 | ppm |
| Max. operating temperature | 45 | °C |
| pH operation range | 2–11 | |
| Max. feed water turbidity | 1 | NTU |
| Max. feed water SDI (15 min) | 5 | |
| Max. pressure drop (ΔP) for each element | 1 | bar |
| Time (h) | Efficiency of Cooled Cell | Efficiency of Uncooled Cell | % Increase in Efficiency |
|---|---|---|---|
| 10:00:00 | 19.64% | 12.97% | 51.4 |
| 10:30:00 | 16.86% | 11.86% | 42.2 |
| 11:00:00 | 16.37% | 11.32% | 44.5 |
| 11:30:00 | 15.84% | 10.90% | 45.3 |
| 12:00:00 | 15.12% | 10.50% | 43.9 |
| 12:30:00 | 14.42% | 10.27% | 40.4 |
| 13:00:00 | 14.15% | 10.11% | 40.0 |
| 13:30:00 | 13.95% | 9.99% | 39.5 |
| 14:00:00 | 13.74% | 9.71% | 41.5 |
| 14:30:00 | 13.83% | 9.26% | 49.3 |
| 15:00:00 | 13.51% | 9.79% | 37.9 |
| 15:30:00 | 14.03% | 9.50% | 47.6 |
| 16:00:00 | 13.62% | 9.07% | 50.2 |
| Time (h) | Surface Temperature of Uncooled Cell | Surface Temperature of Cooled Cell | % Decrease in Surface Temperature of Cell |
|---|---|---|---|
| 10:00:00 | 35.8 | 34.7 | −3.07 |
| 10:30:00 | 37 | 36.2 | −2.16 |
| 11:00:00 | 38.6 | 37.4 | −3.11 |
| 11:30:00 | 40.3 | 37.9 | −5.96 |
| 12:00:00 | 41.3 | 38.9 | −5.81 |
| 12:30:00 | 41.8 | 39.3 | −5.98 |
| 13:00:00 | 42.3 | 39.5 | −6.62 |
| 13:30:00 | 43 | 39.7 | −7.67 |
| 14:00:00 | 42.8 | 39.4 | −7.94 |
| 14:30:00 | 42.5 | 39 | −8.24 |
| 15:00:00 | 42.2 | 38.9 | −7.82 |
| 15:30:00 | 41.7 | 38.5 | −7.67 |
| 16:00:00 | 41.3 | 37.4 | −9.44 |
| Duct dimension | 240 × 360 mm |  |
| Water-filled duct | 2.5 L | |
| Daily operating time | 8.3 h | |
| Refilled times to 37 | Five times | |
| Daily heated water for cell | 5 × 2.5 = 12.5 L/day/cell | |
| Daily heated water/m2 | 12.5/(240 × 360) = 144.6 L/m2/day |
| Number of solar panels | 552 panels | 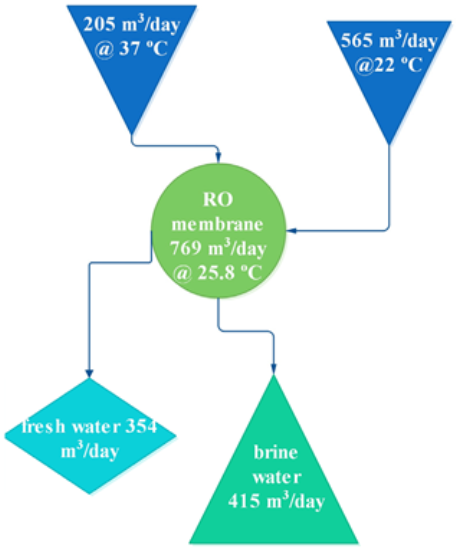 |
| Solar panel dimension | 2274 × 1134 mm2 | |
| Total area of solar panels | 552 × 2274 × 1134 = 1423 m2 | |
| Brine pump flow rate | 50 m3/h | |
| Operating time | 8.3 h | |
| Daily brine water | 50 × 8.3 = 415 m3/day | |
| Freshwater produced | 354 m3/day | |
| Total membrane water | 415 + 354 = 769 m3/day | |
| Temperature of water after mixing | = 25.8 |
Disclaimer/Publisher’s Note: The statements, opinions and data contained in all publications are solely those of the individual author(s) and contributor(s) and not of MDPI and/or the editor(s). MDPI and/or the editor(s) disclaim responsibility for any injury to people or property resulting from any ideas, methods, instructions or products referred to in the content. |
© 2024 by the authors. Licensee MDPI, Basel, Switzerland. This article is an open access article distributed under the terms and conditions of the Creative Commons Attribution (CC BY) license (https://creativecommons.org/licenses/by/4.0/).
Share and Cite
Alshareef, R.S.; Almohammadi, B.A.; Refaey, H.A.; Farhan, M.; Sharafeldin, M.A. Investigation of the Performance and Use of a Solar Cell Integrated with a Reverse-Osmosis Water-Desalination System. Energies 2024, 17, 4010. https://doi.org/10.3390/en17164010
Alshareef RS, Almohammadi BA, Refaey HA, Farhan M, Sharafeldin MA. Investigation of the Performance and Use of a Solar Cell Integrated with a Reverse-Osmosis Water-Desalination System. Energies. 2024; 17(16):4010. https://doi.org/10.3390/en17164010
Chicago/Turabian StyleAlshareef, Rayed S., Bandar Awadh Almohammadi, Hassanein A. Refaey, Mohammed Farhan, and Mahmoud A. Sharafeldin. 2024. "Investigation of the Performance and Use of a Solar Cell Integrated with a Reverse-Osmosis Water-Desalination System" Energies 17, no. 16: 4010. https://doi.org/10.3390/en17164010