Abstract
The rapid expansion of energy storage integration has not provided sufficient time to strengthen and expand the transmission and distribution network. This issue can lead to PCC congestion in green multi-microgrid (MMG) systems. In these systems, microgrids operate independently and connect to the grid at a point of common coupling (PCC) without sharing operational data with neighboring microgrids. To address this issue, this paper proposes a bi-level optimization model designed to reschedule hydrogen storage systems. The first level allows each microgrid to optimize its energy transactions with the grid and communicates any unbalanced energy to the second level, where a hydrogen management system (HMS) is introduced. The HMS optimizes virtual hydrogen prices to address the PCC congestion and maximize the MMG’s profit. These virtual prices are then sent to the first level, allowing the microgrids to reschedule the hydrogen storage systems based on these virtual prices. Finally, the MMG’s profit is fairly allocated among the microgrids using the Shapley value method. The proposed method’s effectiveness is demonstrated using simulations, which show a six percent increase in MMG profit compared to scenarios that only share PCC capacity while maintaining the data privacy of all the involved microgrids.
1. Introduction
In recent decades, microgrids (MGs) have emerged as pivotal technologies that enhance the sustainability and efficiency of power systems. MGs offer significant benefits to power systems and electrical consumers. These benefits include reduced network peaks and costs. Among these technologies, green microgrids stand out for their specific contribution through the use of renewable energy sources, further contributing to environmental and economic improvements. Geographically close microgrids are often linked together to leverage their combined strengths, creating multi-microgrids (MMGs). MMGs typically connect to the grid through a point of common coupling (PCC).
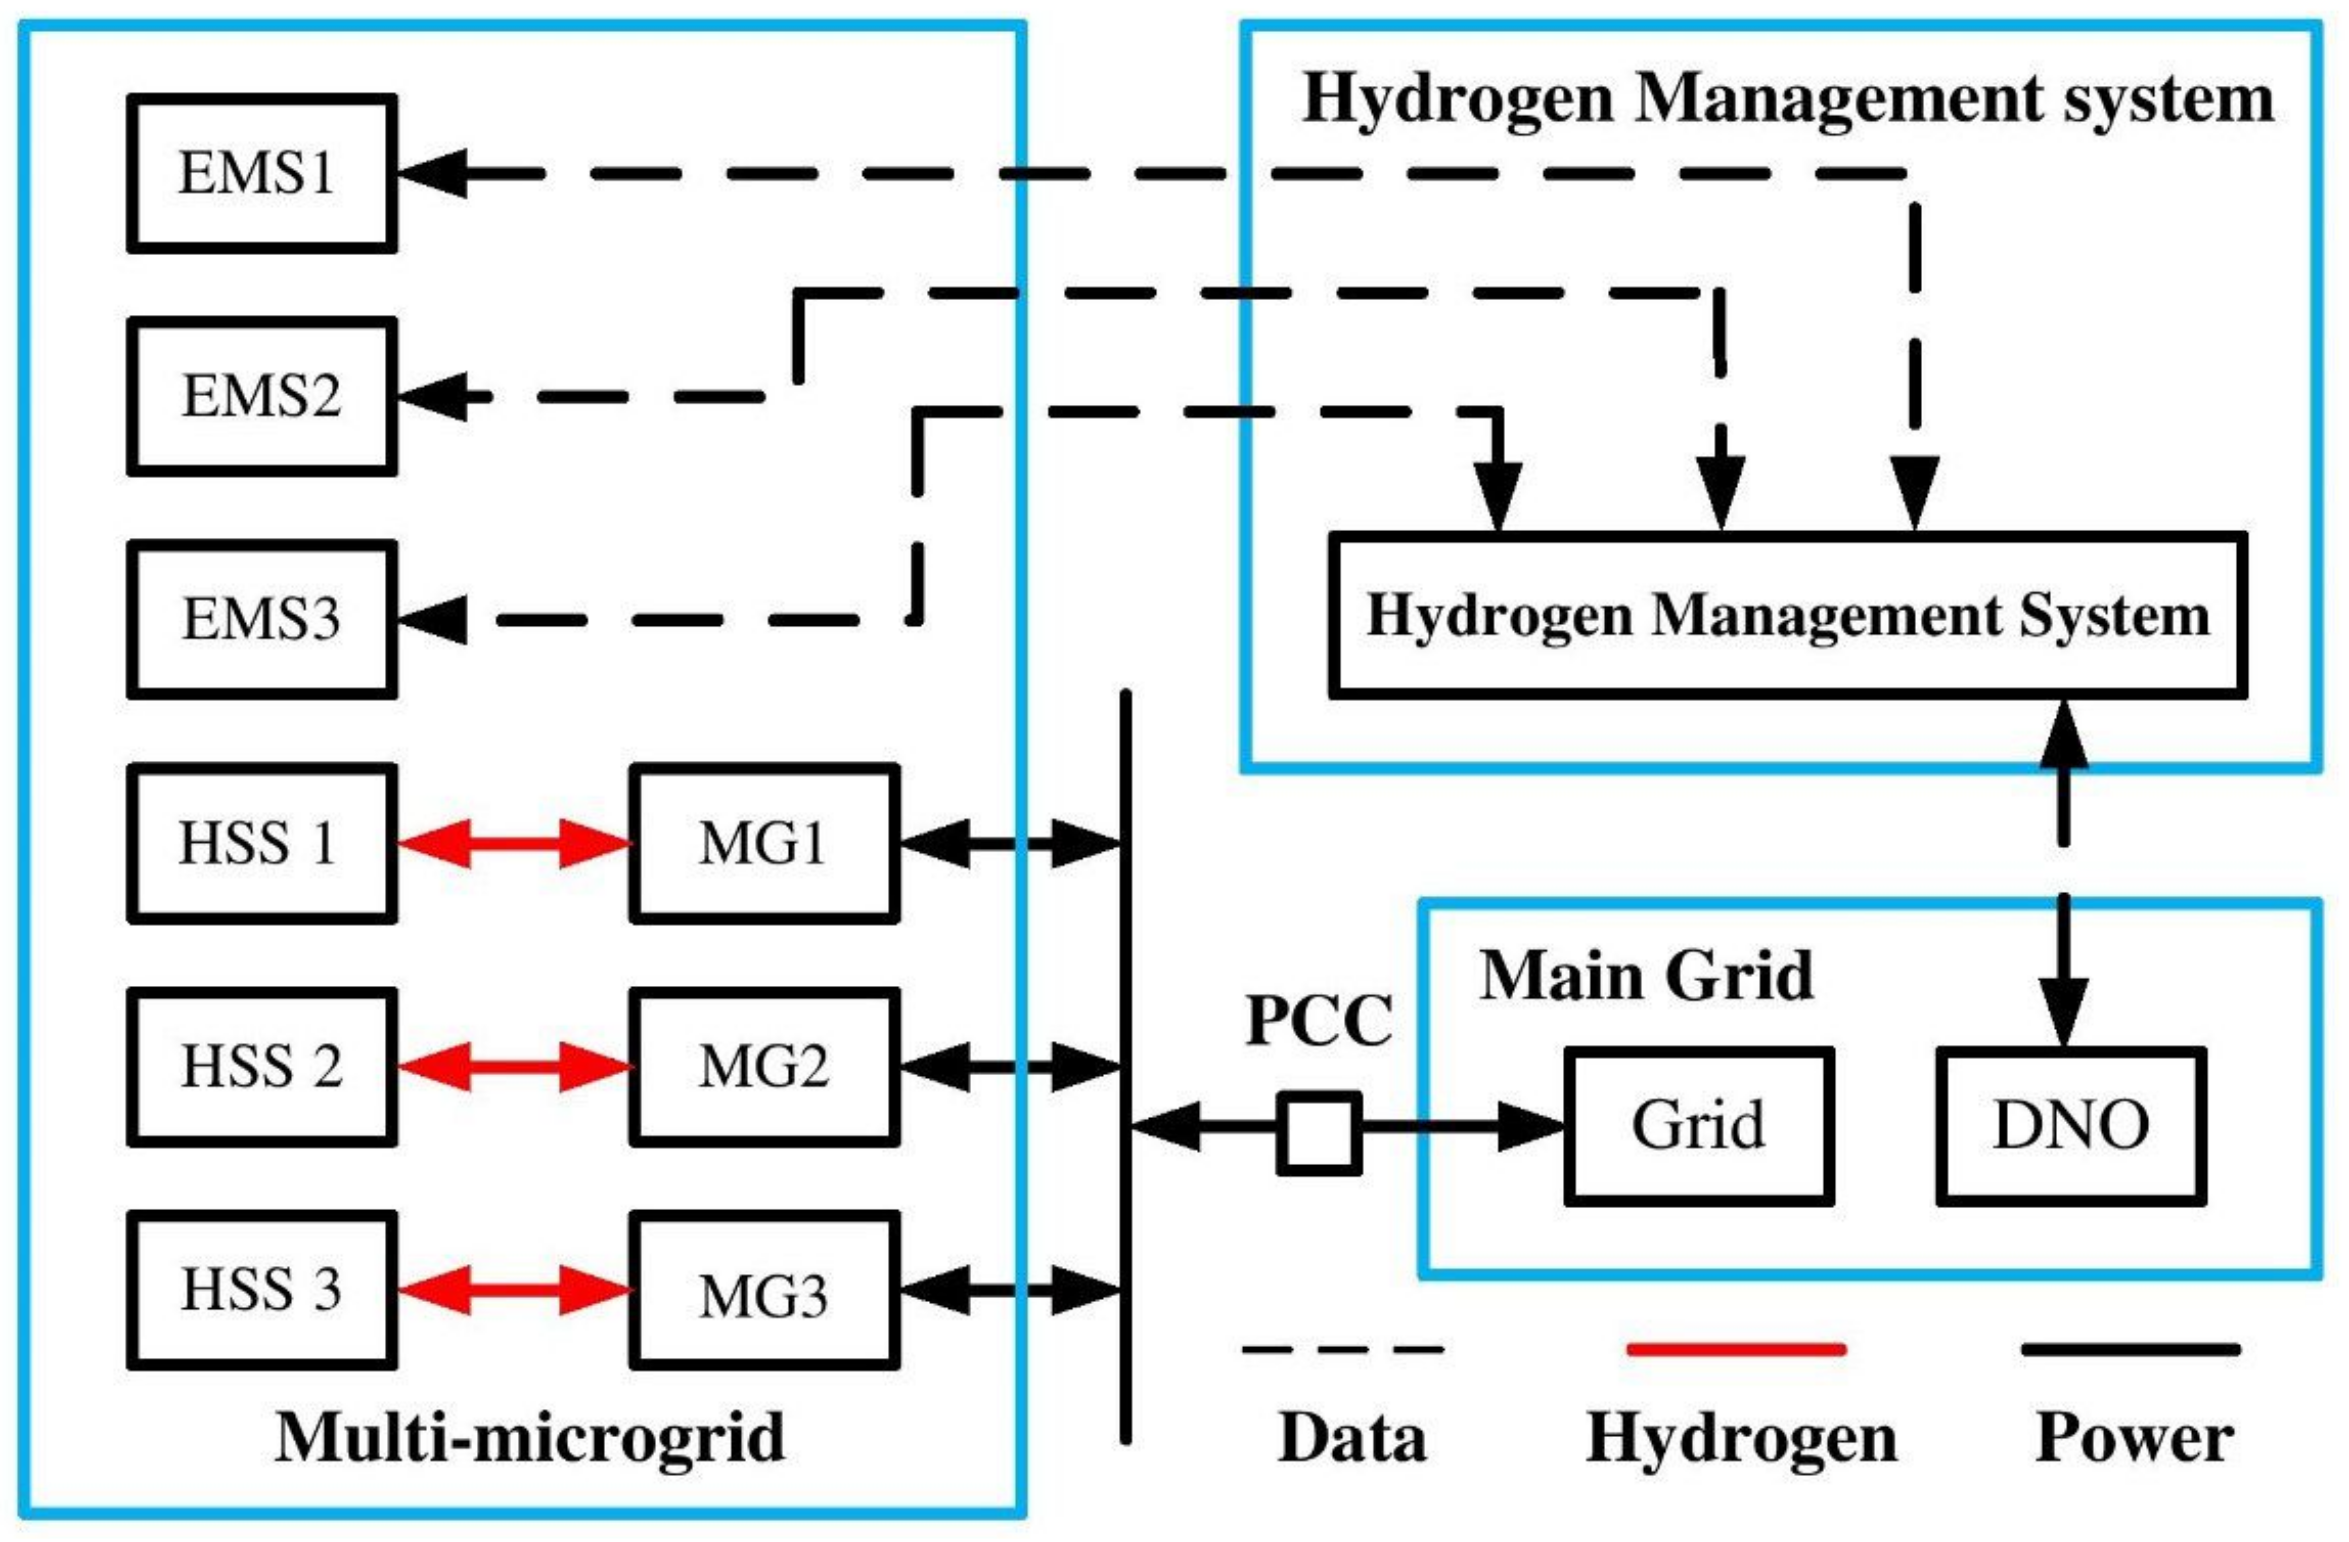
The typical configuration of multi-microgrids and the grid is shown in Figure 1. In this figure, the MG consists of a centralized energy management system, hydrogen storage systems, electrical and hydrogen loads, photovoltaic systems, and a wind turbine, all connected to the grid through a point of common coupling. The strategic importance of energy management in MMGs cannot be overstated. It is fundamental to maximizing operational efficiency, ensuring the stability of supply, and achieving sustainable energy objectives [1].
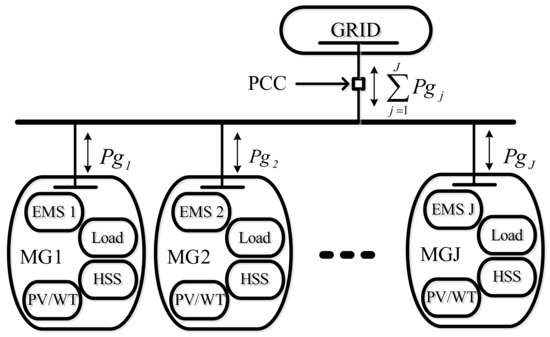
Figure 1.
Electrical connection for green microgrids: integration to the grid via a common bus and point of common coupling (PCC).
MMG energy management presents significant challenges and complexities [2]. Researchers have developed various models over time to effectively manage energy in MMGs. These models are crucial for dictating the distribution, consumption, storage, and trading of energy among the microgrids, ensuring operational efficiency and sustainability. A global classification identifies two energy management system (EMS) models: centralized and decentralized [3]. For MMGs owned by different entities, decentralized EMS models emerge as viable solutions, although they may lead to increased operational costs and excessive power trading between the microgrids and the grid. In this model, each microgrid aims to maximize its profits, seeking maximum utilization of the common line. They use a common line to connect with the grid without sharing data about their operations with neighboring microgrids. This isolation can cause power congestion on the shared line when the price of energy in the grid is low [4]. To clarify, congestion in the power system context refers to transmission lines operating at or even exceeding their designed capacity [5].
The need to address tie-line capacity limits in MMG studies is crucial for two main reasons. Firstly, the rapid expansion of energy storage integration has not allowed for sufficient time to strengthen and expand the transmission and distribution network. Secondly, technical constraints might lead the grid to impose restrictions on MMG connections.
Congestion management in microgrids is critical to ensure efficient energy flow and maintain microgrid stability. Several methods have been developed to address this concern. The use of flexible AC transmission system (FACTS) devices is one such technique, offering improved control over electrical network parameters. Demand response mechanisms are also utilized, allowing for real-time adjustments to consumption patterns based on grid needs. Additionally, generator rescheduling and load shedding can be employed to balance supply and demand during peak times. The integration of energy storage systems presents another promising solution, providing buffers during high-demand periods. The rise of electric vehicles (EVs) introduces new opportunities for grid management, with their charging and discharging processes contributing to load balancing [6]. However, with the increasing integration of renewable energy sources, microgrids face heightened levels of uncertainty. Traditional congestion management methods struggle to fully address these challenges. For instance, the inherent variability of renewable sources can lead to drastic and seasonal fluctuations in energy production.
To address congestion in feeders, Reference [7] proposes an exclusive DC feeder system for multiple electric vehicle (EV) charging stations, connected to the grid through a grid-tie converter. Daily quotas and day-ahead schedules are set based on profit curves developed by the EV stations and evaluated by the local market operator to maximize total profit while adhering to capacity constraints. Reference [8] investigates the use of a superconducting magnetic energy storage (SMES) device and its ability to regulate fluctuations in wind generation. A fuzzy logic controller is employed to modulate the duty cycle of the chopper circuit within the SMES, aiming to minimize the tie-line power fluctuations in the microgrid.
Congestion management has long been a pivotal issue, driving extensive research across the sector. Typically, congestion management approaches can be categorized into two models [9]: (i) the day-ahead scheduling model, which seeks to establish the most effective set of generating units for operation to satisfy demand while adhering to the system’s security constraints; (ii) the real-time operation model, which addresses real-time congestion that might arise from variability in renewable energy sources, load shifts, and system component malfunctions. These strategies are designed to lower the costs of re-dispatching generating units and decrease the need for control actions. This research concentrates on the first model.
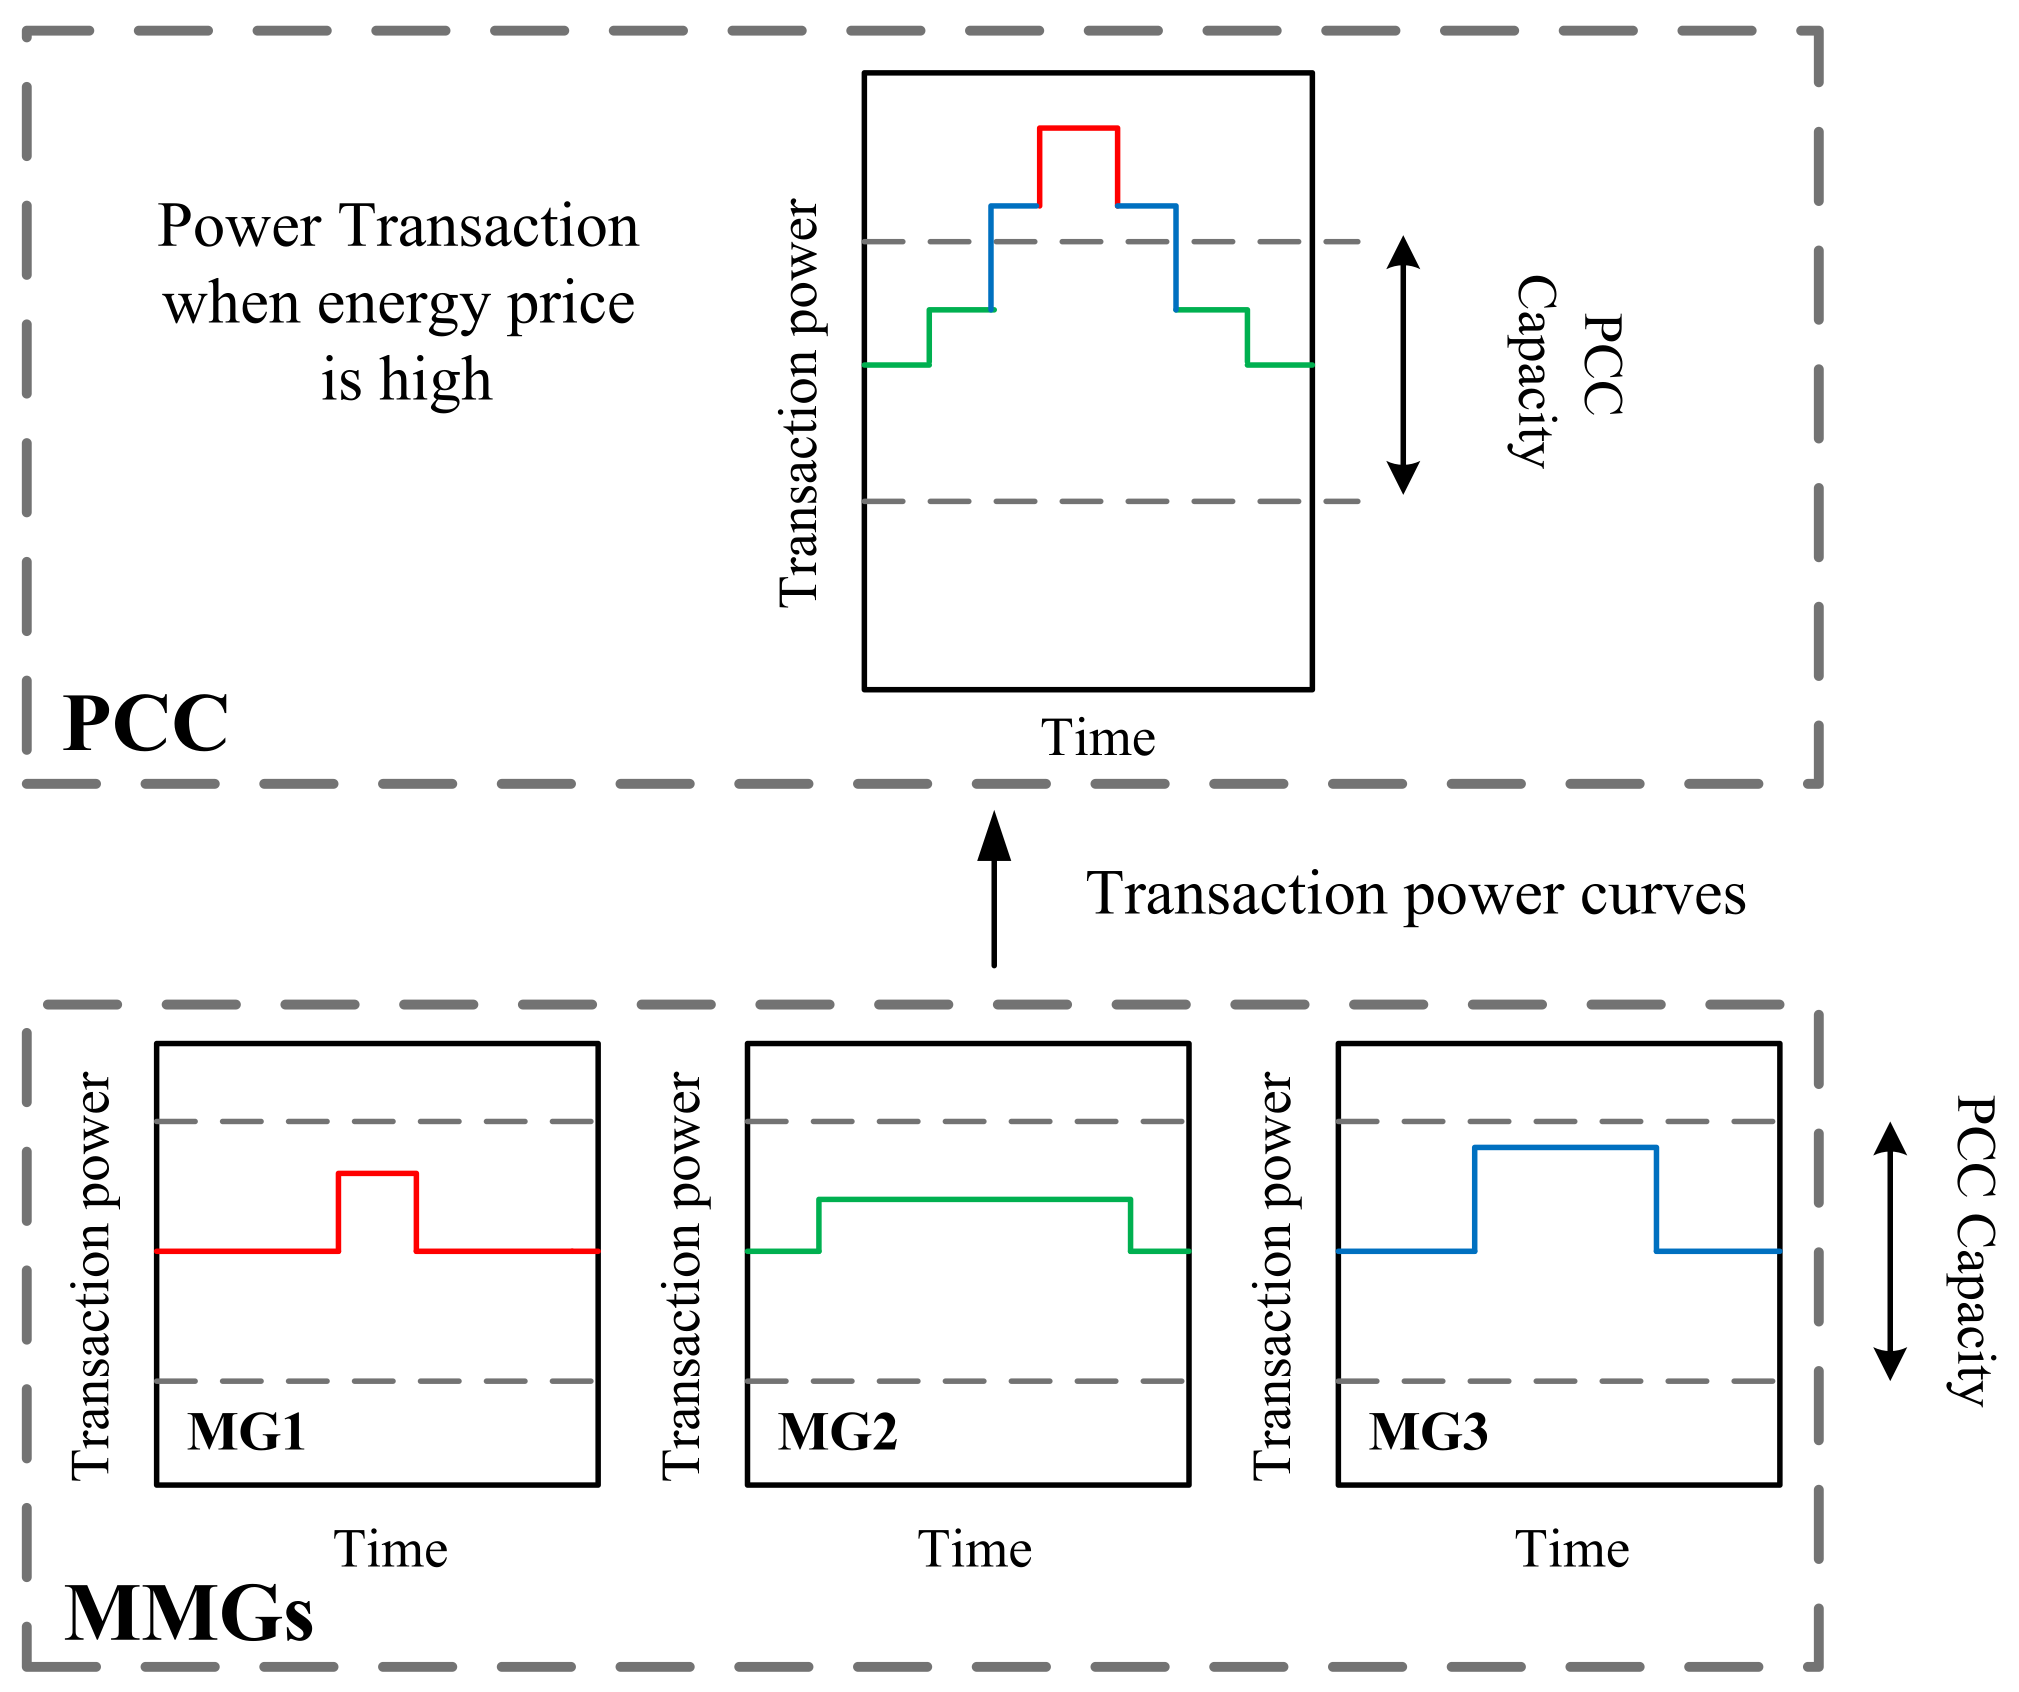
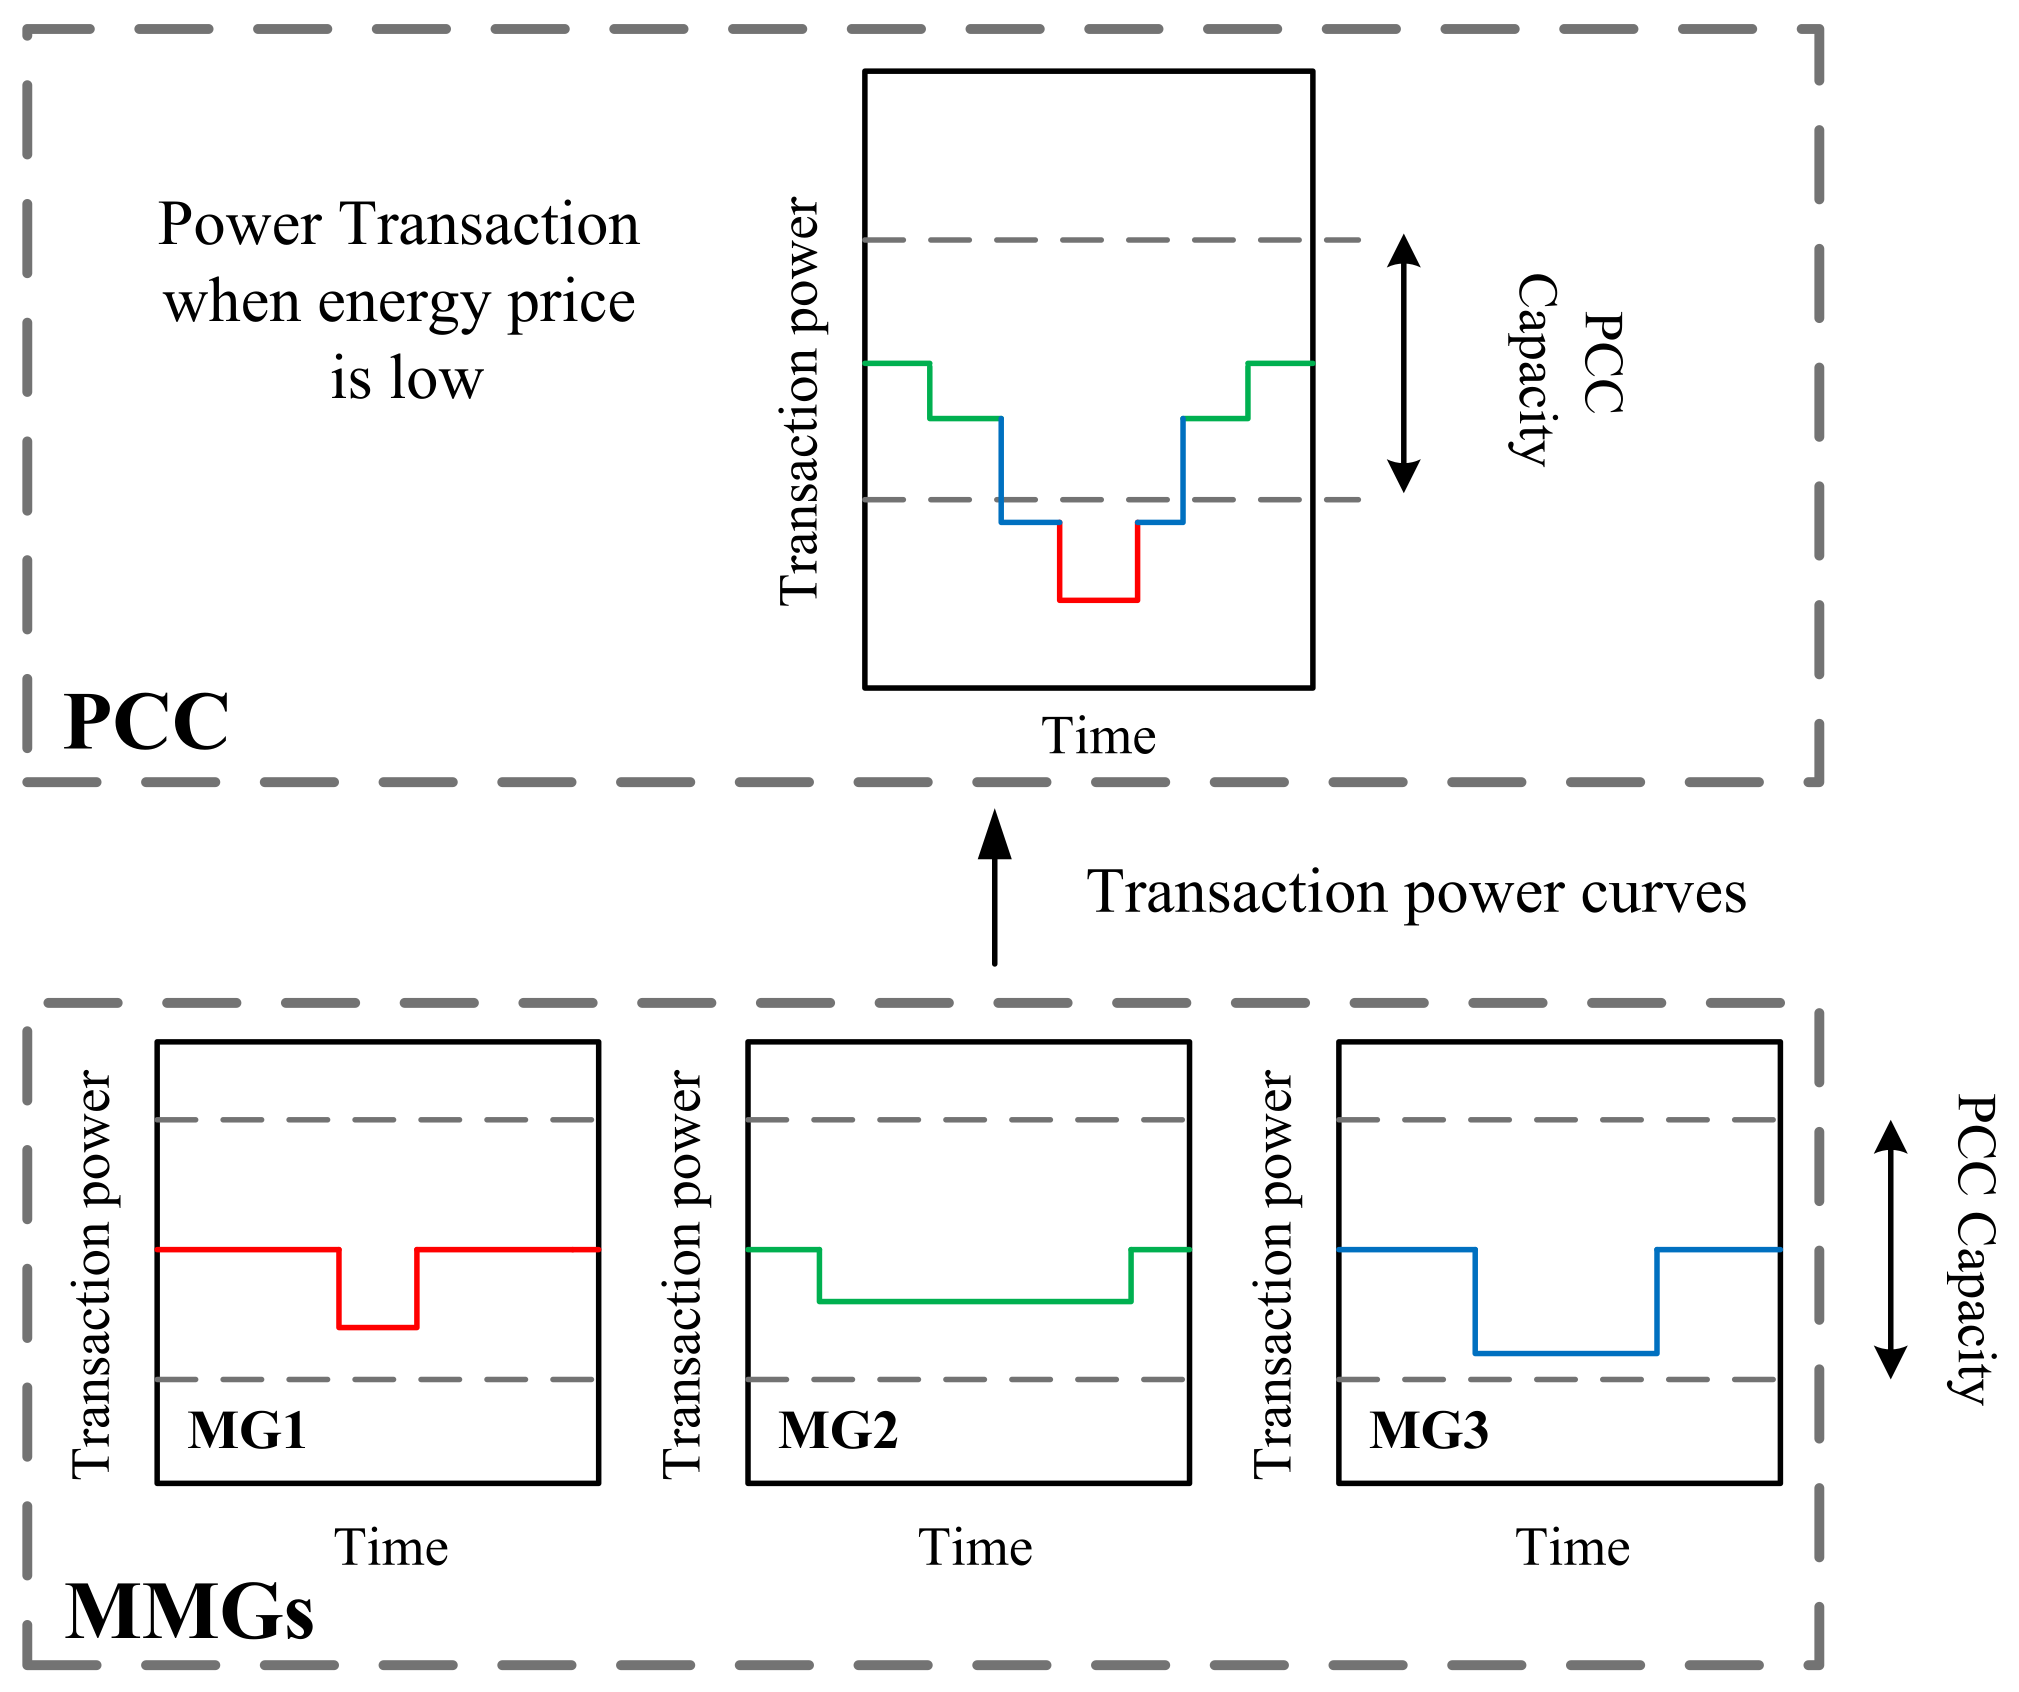
The power transactions among multi-microgrids and the grid in two different scenarios are shown in Figure 2 and Figure 3. In Figure 2, the price of power is high, so the microgrids tend to sell power to the grid to increase their profit, leading to energy flows from the MMGs to the grid. In these circumstances, energy storage systems discharge their energy to sell power to the grid to maximize the profit of the MG. However, as individual microgrids lack information about their neighboring microgrids, they use the PCC capacity as their power exchange limitation. This can result in congestion at the PCC. In contrast, in Figure 3, when the energy price is low, the energy flows from the grid to the MMGs, and energy storage systems also buy power from the grid to charge themselves to maximize the profit of the MG. Consequently, congestion may occur.
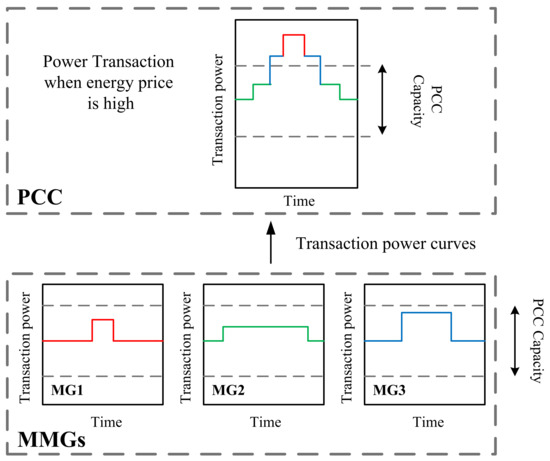
Figure 2.
The transaction power between each MG and the grid, and the aggregated power flow through the PCC when the energy price is high.

Figure 3.
The transaction power between each MG and the grid, and the aggregated power flow through the PCC when the energy price is low.
Therefore, despite this critical oversight, only a few research studies have considered this problem. A demand response strategy discussed in [4] is aimed at peak shaving and valley filling, although it can only redistribute a portion of the load, making it suitable primarily for minor congestion issues at the PCC. In ref. [10], a technique based on the Lagrange function is employed to determine the equitable distribution of line capacity among the microgrids. This methodology is stringent, delineating a specific quota for each microgrid on the tie-line. A limitation of this study is its assumption based on the most adverse hourly scenario for a day, potentially reducing the total profit. Moreover, due to variations in power exchanges across different seasons, this method might not fully address congestion, increasing the possibility of load shedding and generation curtailment.
A virtual pricing model described in ref. [11] is designed to manage the power output from micro-turbines. This regulation aids in alleviating PCC congestion. Despite its design, when renewable energy sources are highly prevalent, this method struggles to effectively handle resource generation. The advantages and disadvantages of three relevant studies, along with a comparative analysis between them and this study, are summarized in Table 1 and Table 2, respectively.

Table 1.
Advantages and disadvantages of congestion studies at the point of common coupling (PCC).
Table 2.
Comparative analysis of the proposed method versus prior research on PCC congestion management (BESS: battery energy storage system, HSS: hydrogen storage system, ✓: Yes, ×: No).
Energy storage is essential for maintaining the balance between supply and demand in power systems. While various energy storage options are available, including batteries, compressed air energy storage, and pumped hydro energy storage [12], hydrogen offers distinct advantages. High energy storage capacity: Hydrogen boasts a high energy density, allowing its storage capacity to scale up to MWh or even TWh levels, whereas batteries are typically limited to kWh to MWh applications [13]. To achieve greater a storage capacity using batteries, one would need to significantly expand the size of the installation. Long storage duration: Hydrogen’s storage duration far exceeds that of batteries. While batteries offer hourly or weekly storage, hydrogen can store energy for weeks or even months [14]. Flexibility and volatility mitigation: Hydrogen effectively smooths out energy volatility and uncertainty, making it particularly adept at absorbing excess renewable energy generation [15]. Energy time shift: Hydrogen facilitates the balancing of demand and supply by storing excess energy generated by renewables—particularly during periods of low demand—as hydrogen to optimize energy costs. During periods of high demand, this stored hydrogen can be converted back into electricity, thereby maximizing benefits. This energy conversion can be achieved through mechanisms like stationary fuel cells.
A limited number of studies have explored the role of hydrogen in managing congestion [16,17]. Ref. [16] presents a congestion management strategy employing an energy hub that incorporates hydrogen systems, microturbines, and wind turbines in medium- and high-voltage systems. In ref. [17], the study examines the optimal operation of virtual energy storage systems, including batteries, thermal energy storage systems, hydrogen storage systems, and electric vehicles, as well as demand response programs. The research also explores the interplay between electrical, thermal, and hydrogen markets, highlighting their potential in managing congestion.
This paper introduces a bi-level hierarchical energy management system (EMS) designed to address PCC congestion within grid-connected green multi-microgrids. In the first level, each microgrid’s centralized EMS conducts day-ahead scheduling and subsequently relays any potential energy imbalances to the hydrogen management system (HMS). Notably, the HMS is composed of representatives from multiple microgrids. At the second level, the primary objective is PCC congestion management, achieved by converting surplus electrical energy into hydrogen and vice versa. Additionally, the HMS ensures that the total profit from this process is fairly allocated among the microgrids using the Shapley value method.
To ensure data privacy within the decentralized EMS, our model adopts a strategy where each microgrid operates autonomously. This independent operation means that sensitive operational data, such as demand patterns, resource outputs, the technical data of energy storage systems, and internal load contracts, are managed locally and are not shared across the network. HMS, integral to addressing congestion at the PCC, further reinforces privacy by utilizing only aggregated, non-sensitive data from each microgrid’s EMS. These measures prevent any potential leakage of confidential information, maintaining the privacy integrity of each microgrid while enabling efficient congestion management and operational optimization through virtual hydrogen price adjustments communicated back to the microgrids. This approach not only upholds data privacy but also ensures that each microgrid can autonomously adjust its operations based on optimized data-driven insights provided by the HMS, thus balancing system-wide efficiency with stringent privacy standards.
The literature review highlights the significance of utilizing hydrogen storage systems to manage congestion in multi-microgrids with substantial penetration of renewable resources. Although extensive research has been conducted to address congestion through hydrogen storage solutions, this paper introduces, for the first time, a method for mitigating PCC congestion using hydrogen systems. Furthermore, the use of hydrogen to reduce congestion in the distribution network of green multi-microgrids has seldom been explored. The primary contributions of this study are outlined as follows:
- A novel bi-level hybrid energy management system has been introduced. This design is specifically tailored to manage PCC congestion, ensuring efficient energy distribution during times of varying electrical demand or generation.
- A hydrogen management system has been introduced. This system is capable of not only regulating hydrogen storage systems to mitigate congestion but also ensuring a just and equitable distribution of profits among participating microgrids.
- A dynamic hydrogen pricing method is proposed for mitigating the congestion and optimizing the MMGs’ profit. This approach regulates the hydrogen price during specific hours, resulting in the self-rescheduling of MGs.
2. Problem Formulation
A schematic of the proposed model is shown in Figure 4. The schematic provides a virtual representation of how electrical imbalances are addressed through the HMS. Initially, the microgrids’ EMSs transmit the data detailing these imbalances to the HMS. In response, the HMS aggregates these electrical discrepancies. When the aggregated imbalance surpasses the PCC capacity directed towards the grid, the HMS transfers the optimized virtual hydrogen price to the microgrids, which transform the excess electrical power into hydrogen using electrolysis, storing it for potential future needs. Conversely, if the accumulated imbalance exceeds the PCC capacity oriented toward the microgrid, the HMS transfers the optimized virtual hydrogen price to the microgrids to initiate the conversion of the stored hydrogen in the hydrogen storage system (HSS) back into electrical power through a fuel cell. After these processes, the HMS conveys the details of the power to the distribution network operator (DNO), which will be transferred through the PCC. Within the diagram itself, the black lines depict the flow of electrical power, the red lines indicate the flow of hydrogen, and the dotted lines represent the transmission of data or information.

Figure 4.
Integrated schematic of energy and data flows: hydrogen management system, multi-microgrid, and grid connections.
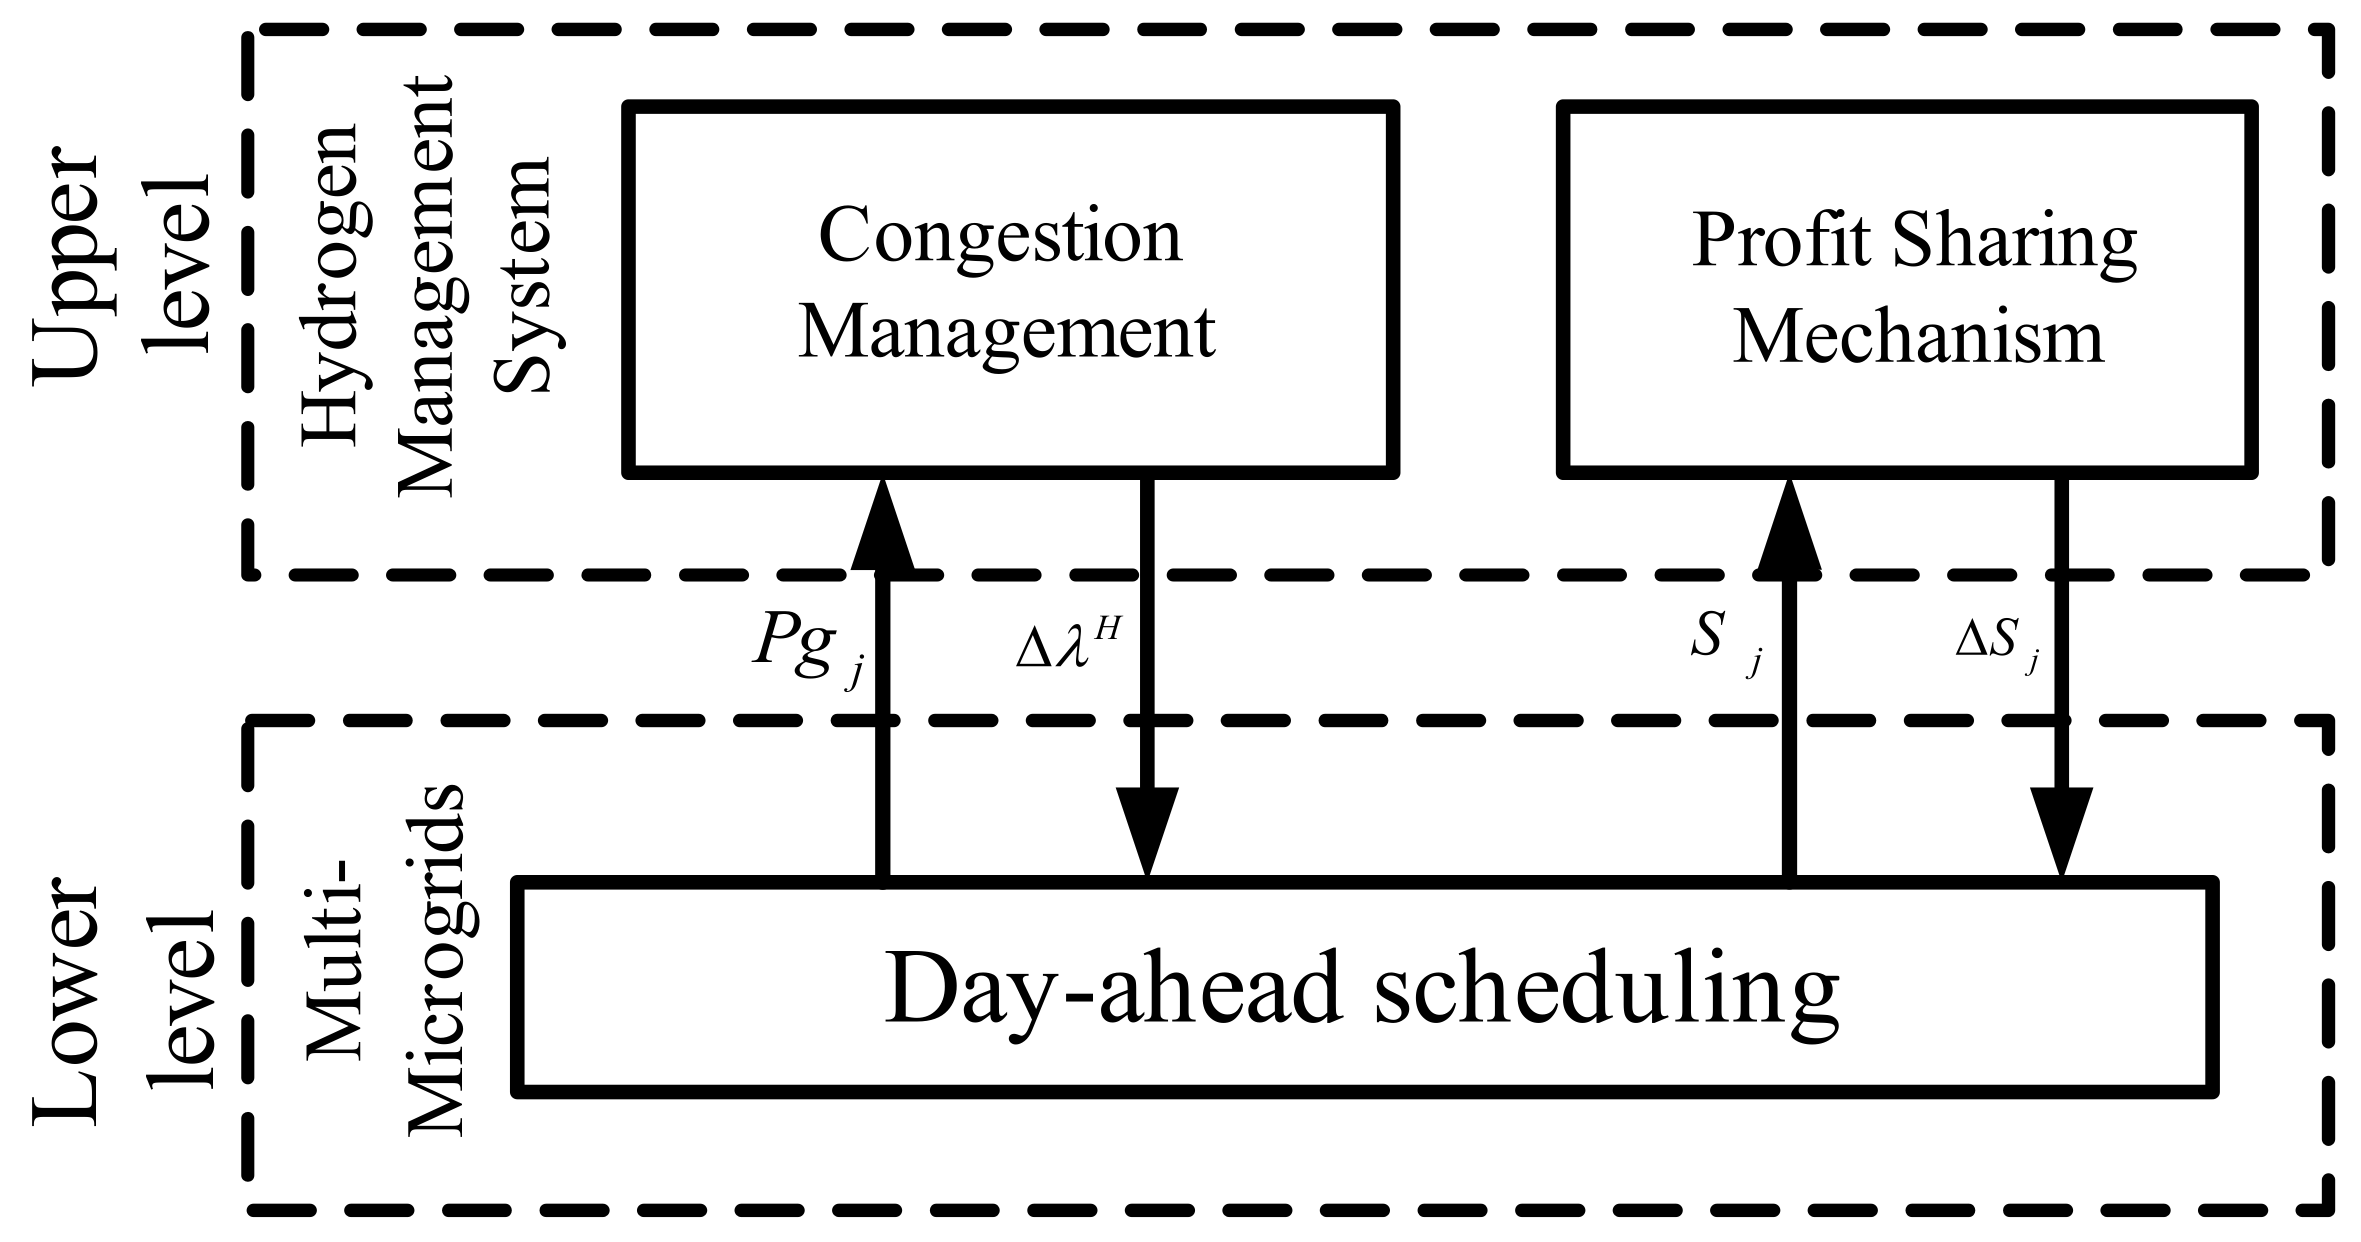
Figure 5 illustrates the information flow within the proposed bi-level model. In the lower level, each microgrid carries out its own scheduling and then communicates its imbalanced power to the HMS. In the upper level, the HMS initially ensures that the interaction power with the grid remains within acceptable limits. Subsequently, it logs the profit from each cooperation and divides the total profit among the MGs using the Shapley value. This approach also protects the privacy of the MGs.

Figure 5.
The proposed day-ahead operation to solve the congestion.
2.1. Lower Level: Microgrids
The profit from the integrated model proposed is derived from an objective function that focuses on maximizing the total expected profit. This objective function includes three components, as outlined in (1).
The first component represents the profit from the transaction power between the microgrid and the grid. The second component accounts for the profit derived from selling power to the microgrid’s electrical load. The third component accounts for the profit derived from selling hydrogen to the microgrid’s hydrogen load. The power transactions between the microgrid and the grid are calculated based on (2) [18]. This equation calculates the net power transaction between the microgrid and the grid. It subtracts the power bought from the grid () from the power sold to the grid ().
To ensure that supply meets demand, energy balancing is maintained as described in (3) [18]. This equation maintains the energy balance within the microgrid. It ensures that the total power generated from photovoltaic sources (), wind turbines (), and the power discharged from the hydrogen storage system () matches the sum of the demand within the microgrid (), the power used to charge the hydrogen storage system (), and the net power exchanged with the grid ().
MGs can transfer power to the grid, subject to the constraints of (4), which defines the PCC capacity [18]. This equation sets the limits for the power that can be transferred to or from the grid. represents the maximum power capacity at the PCC. transferred can range from negative (maximum import from the grid) to positive (maximum export to the grid).
The operational constraints of the hydrogen storage system are defined below [18]. Equation (5) describes the state of charge (SOC) of the hydrogen storage system. It accounts for the previous time step’s SOC, the power used for charging (), the power used for discharging (), and other hydrogen demands represented by .
where the coefficients and adjust for efficiency losses during charging and discharging.
Equation (6) shows that the SOC for the HSS within any given period t stays within the prescribed limits, where is the maximum state of charge for the HSS. The SOC condition at the end and beginning of the scheduling horizon is determined using (7).
Equation (8) ensures the charging limits for the hydrogen storage system, ensuring that the charging power does not exceed a maximum permissible value and does not drop below zero.
Similar to (8), (9) ensures the bounds for discharging power from the hydrogen storage system, placing limits on the minimum (0) and maximum allowable discharging power .
If instead of usibg (1), the microgrids are optimized using (10) considering , the result must be the same. The aim of this modification is explained in the following text.
2.2. Upper Level: Hydrogen Management System
The primary responsibility of the HMS is to maximize the multi-microgrid’s profit while ensuring that the transfer power stays within permissible limits. To achieve this objective, the optimization problem at this level is shown by (11)–(15) [4]. Equations (12) and (13) are alternative representations of (4), while Equations (14) and (15) are alternative representations of (8) and (9).
s.t:
As demonstrated in the Appendix A, maintaining optimal operation requires minimizing the fluctuations in hydrogen prices. Based on this, the HMS methodology is outlined below:
s.t.
For the first hour in which congestion occurs, the hydrogen price is determined using (16) and (17) and conveyed to the EMS. The dynamic hydrogen price procedure is presented as Algorithm 1 ( is a function of ).
| Algorithm 1 Optimize |
|
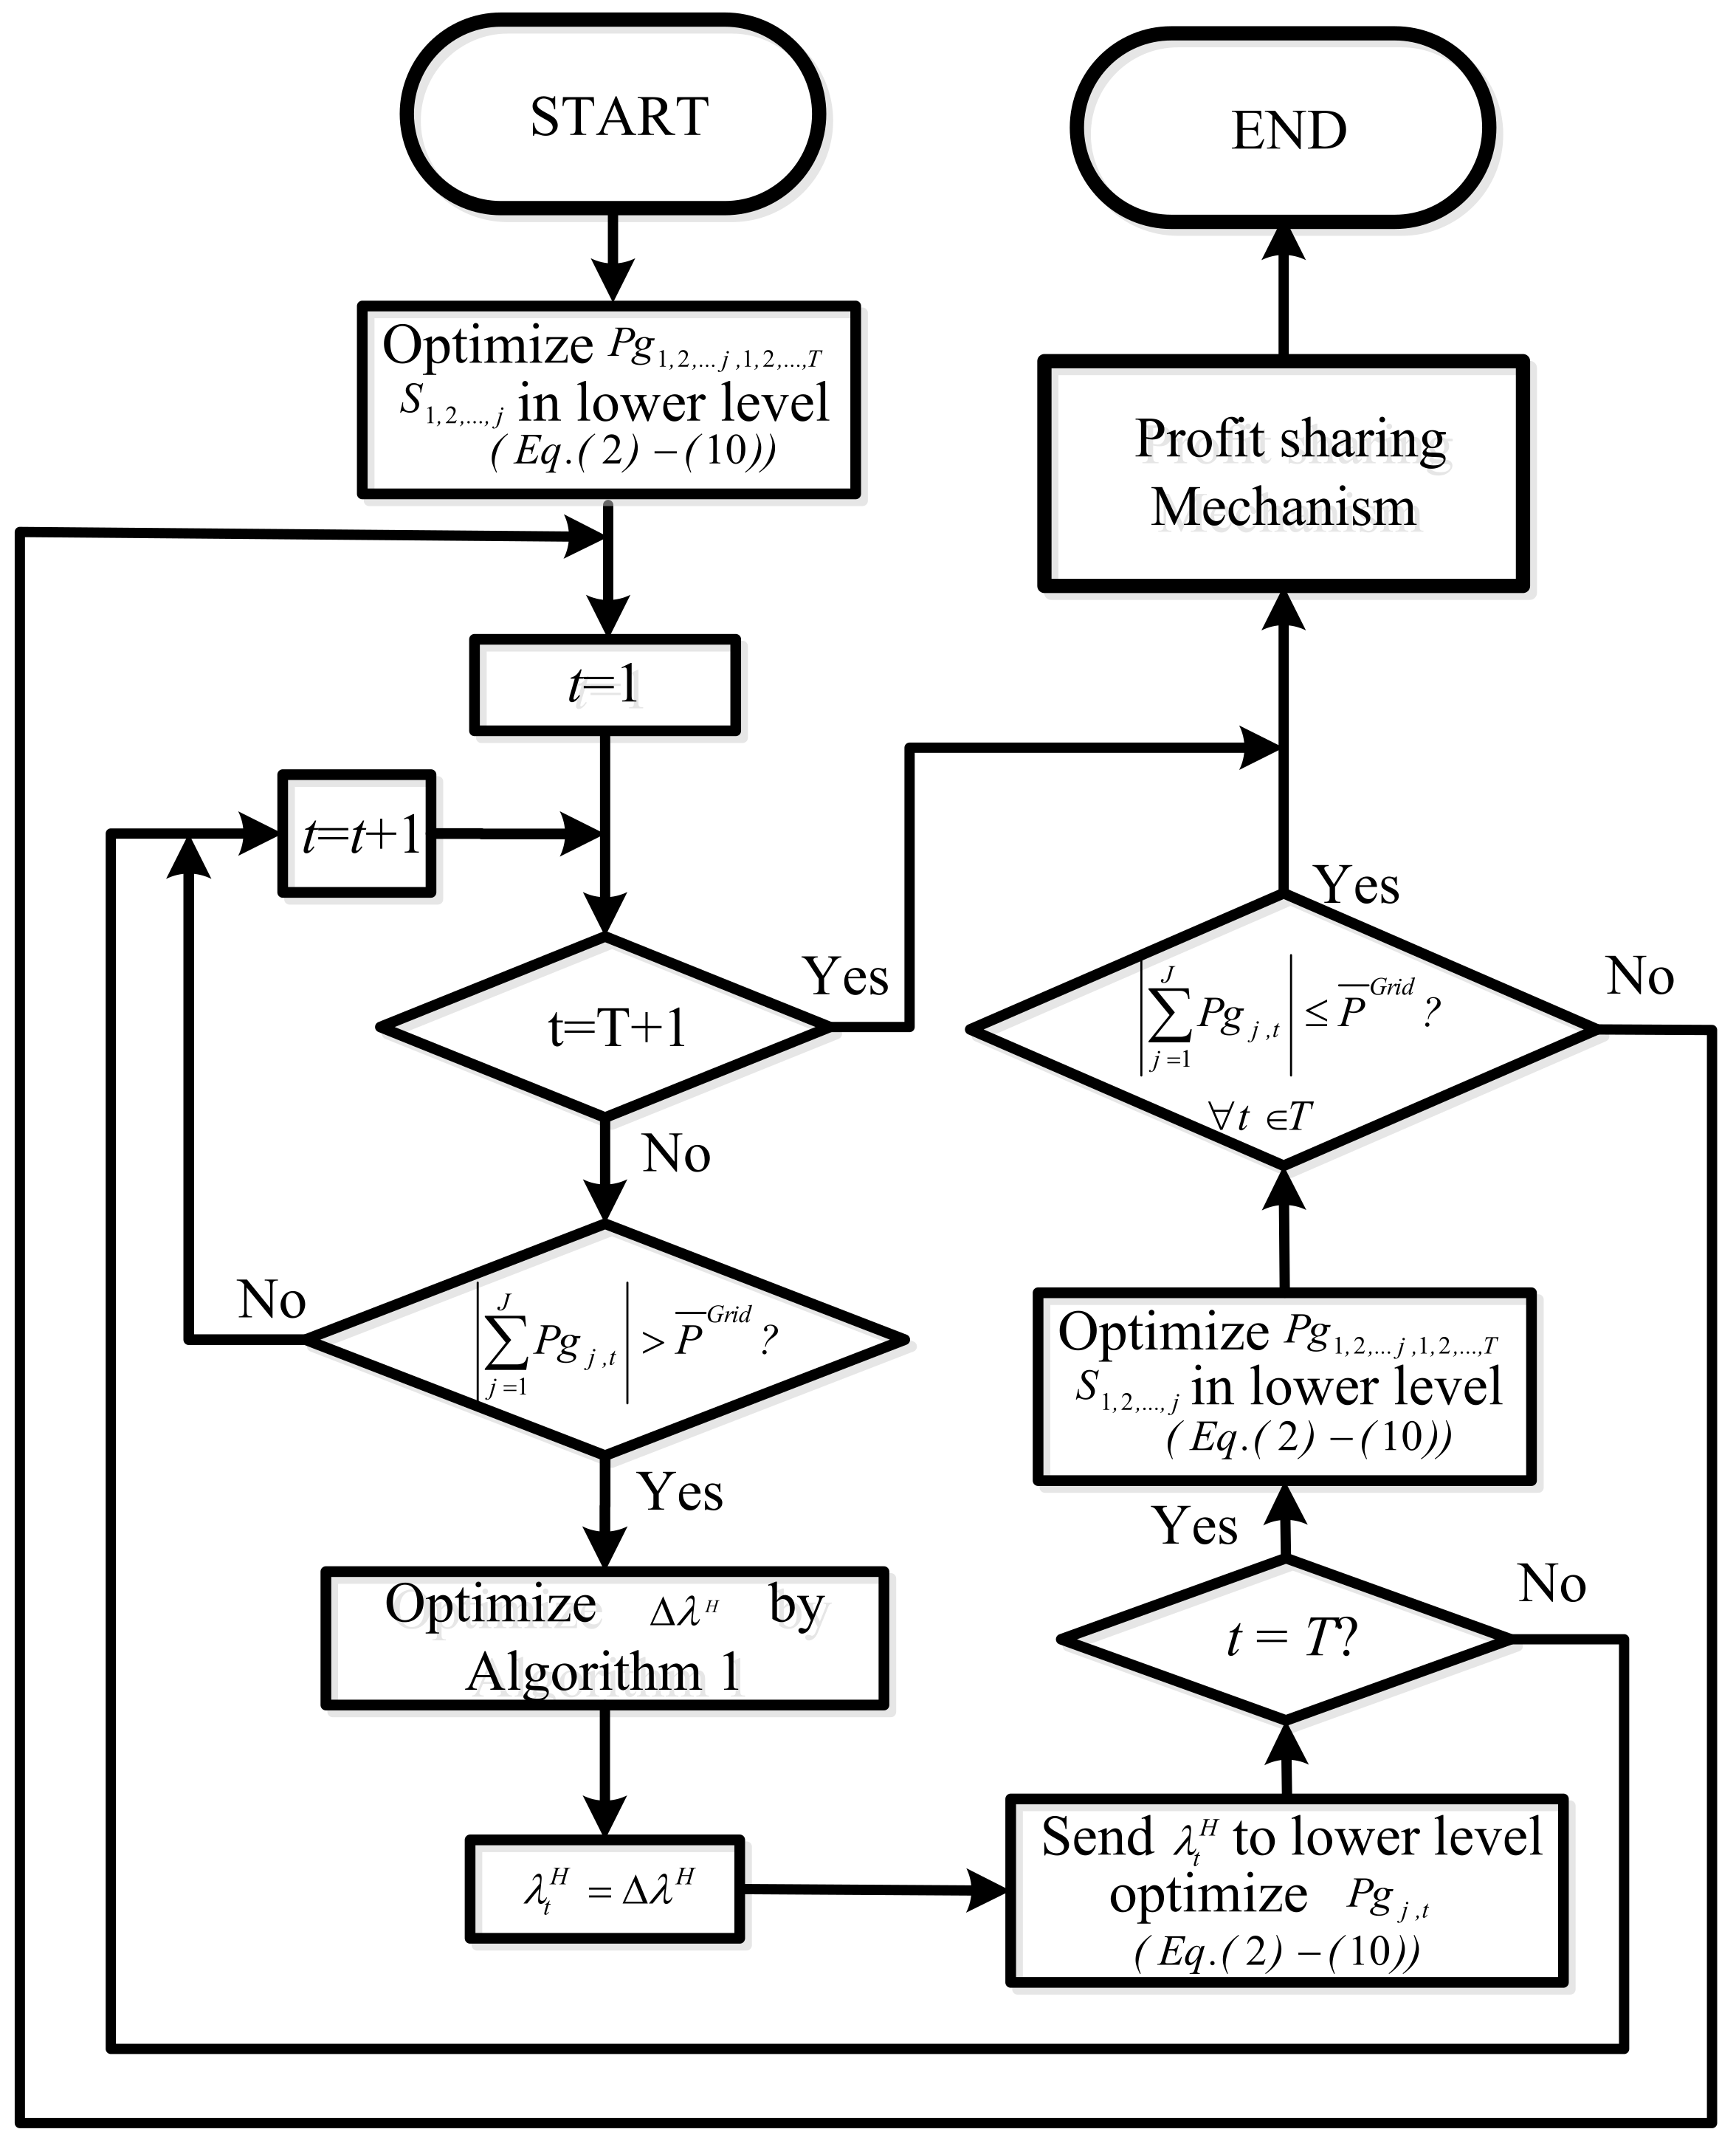
Initially, a broad bandwidth for the hydrogen price fluctuations is chosen. Subsequently, this bandwidth is incrementally narrowed until the optimal range is attained. The hydrogen price () is determined to manage congestion at the hour, with denoting the accuracy parameter. This algorithm continues for all the congested hours until the trading power stabilizes within the acceptable range for all hours.
After addressing congestion, the HMS takes on the responsibility of distributing the total profit among the microgrids. To achieve this, the Shapley value, a renowned profit-sharing mechanism, is employed [19]. The Shapley value of a cooperative game represents the collection of all steady results. In other words, these are the outcomes that adhere to (18) and do not deviate from it [4].
Within each coalition, identified as , the Shapley value of is denoted as . In this framework, x signifies the number of microgrids in the coalition, J symbolizes the total number of microgrids, indicates the value of the coalition, and indicates the value of the coalition when is excluded, accounting for the aforementioned issues. To determine the profit for Mg within each coalition, the HMS must optimize the profit of each Mg for each coalition. Given J microgrids, there are possible coalitions. The proposed method’s flowchart can be found in Figure 6.

Figure 6.
The flowchart for the proposed method (T denotes the total hours in a day, equating to 24).
In this research, we analyzed the uncertainties in electrical and hydrogen demand, price, photovoltaic (PV) output, and wind turbine (WT) output. The electrical demand and price uncertainties are modeled using a normal distribution function, while the uncertainties in the PV and WT outputs are captured using a bimodal and Weibull distribution function, respectively. The hydrogen demand is modeled by deploying an exponential function, as detailed in previous studies. This method leverages a scenario tree technique to effectively approximate the original range of scenarios and manage them more efficiently.
This approach facilitates handling a compact subset of scenarios that more accurately reflects the original distribution’s probability metrics. For the PV and WT output uncertainties, the distribution is categorized into 12 intervals for each variable. Similarly, the distributions for electricity and hydrogen demand are divided into 24 intervals—12 for working days and 12 for non-working days, each matching a specific month. This granular division allows for a detailed analysis of uncertainties across different months and conditions, thus generating a large number of scenarios for each hour: 165,888, making the optimization computationally challenging. This necessitates the selection of a limited number of representative scenarios to efficiently simulate the stochastic nature of these variables [20].
3. Results
This study tackles the optimization problem using GAMS software (version 30.3) alongside the CPLEX solver (IBM, Armonk, NY, USA) , facilitated by the GAMS/MATLAB (version 30.3) interface for efficient input and output data transfer. The optimization process utilizes the CPLEX solver within GAMS for the mathematical programming tasks, and iterative functions are managed using MATLAB (version R2023a) . This approach ensures robust and efficient computation of solutions. The solution computations were carried out using a desktop computer equipped with a 3.9 GHz processor and 32 GB of RAM.
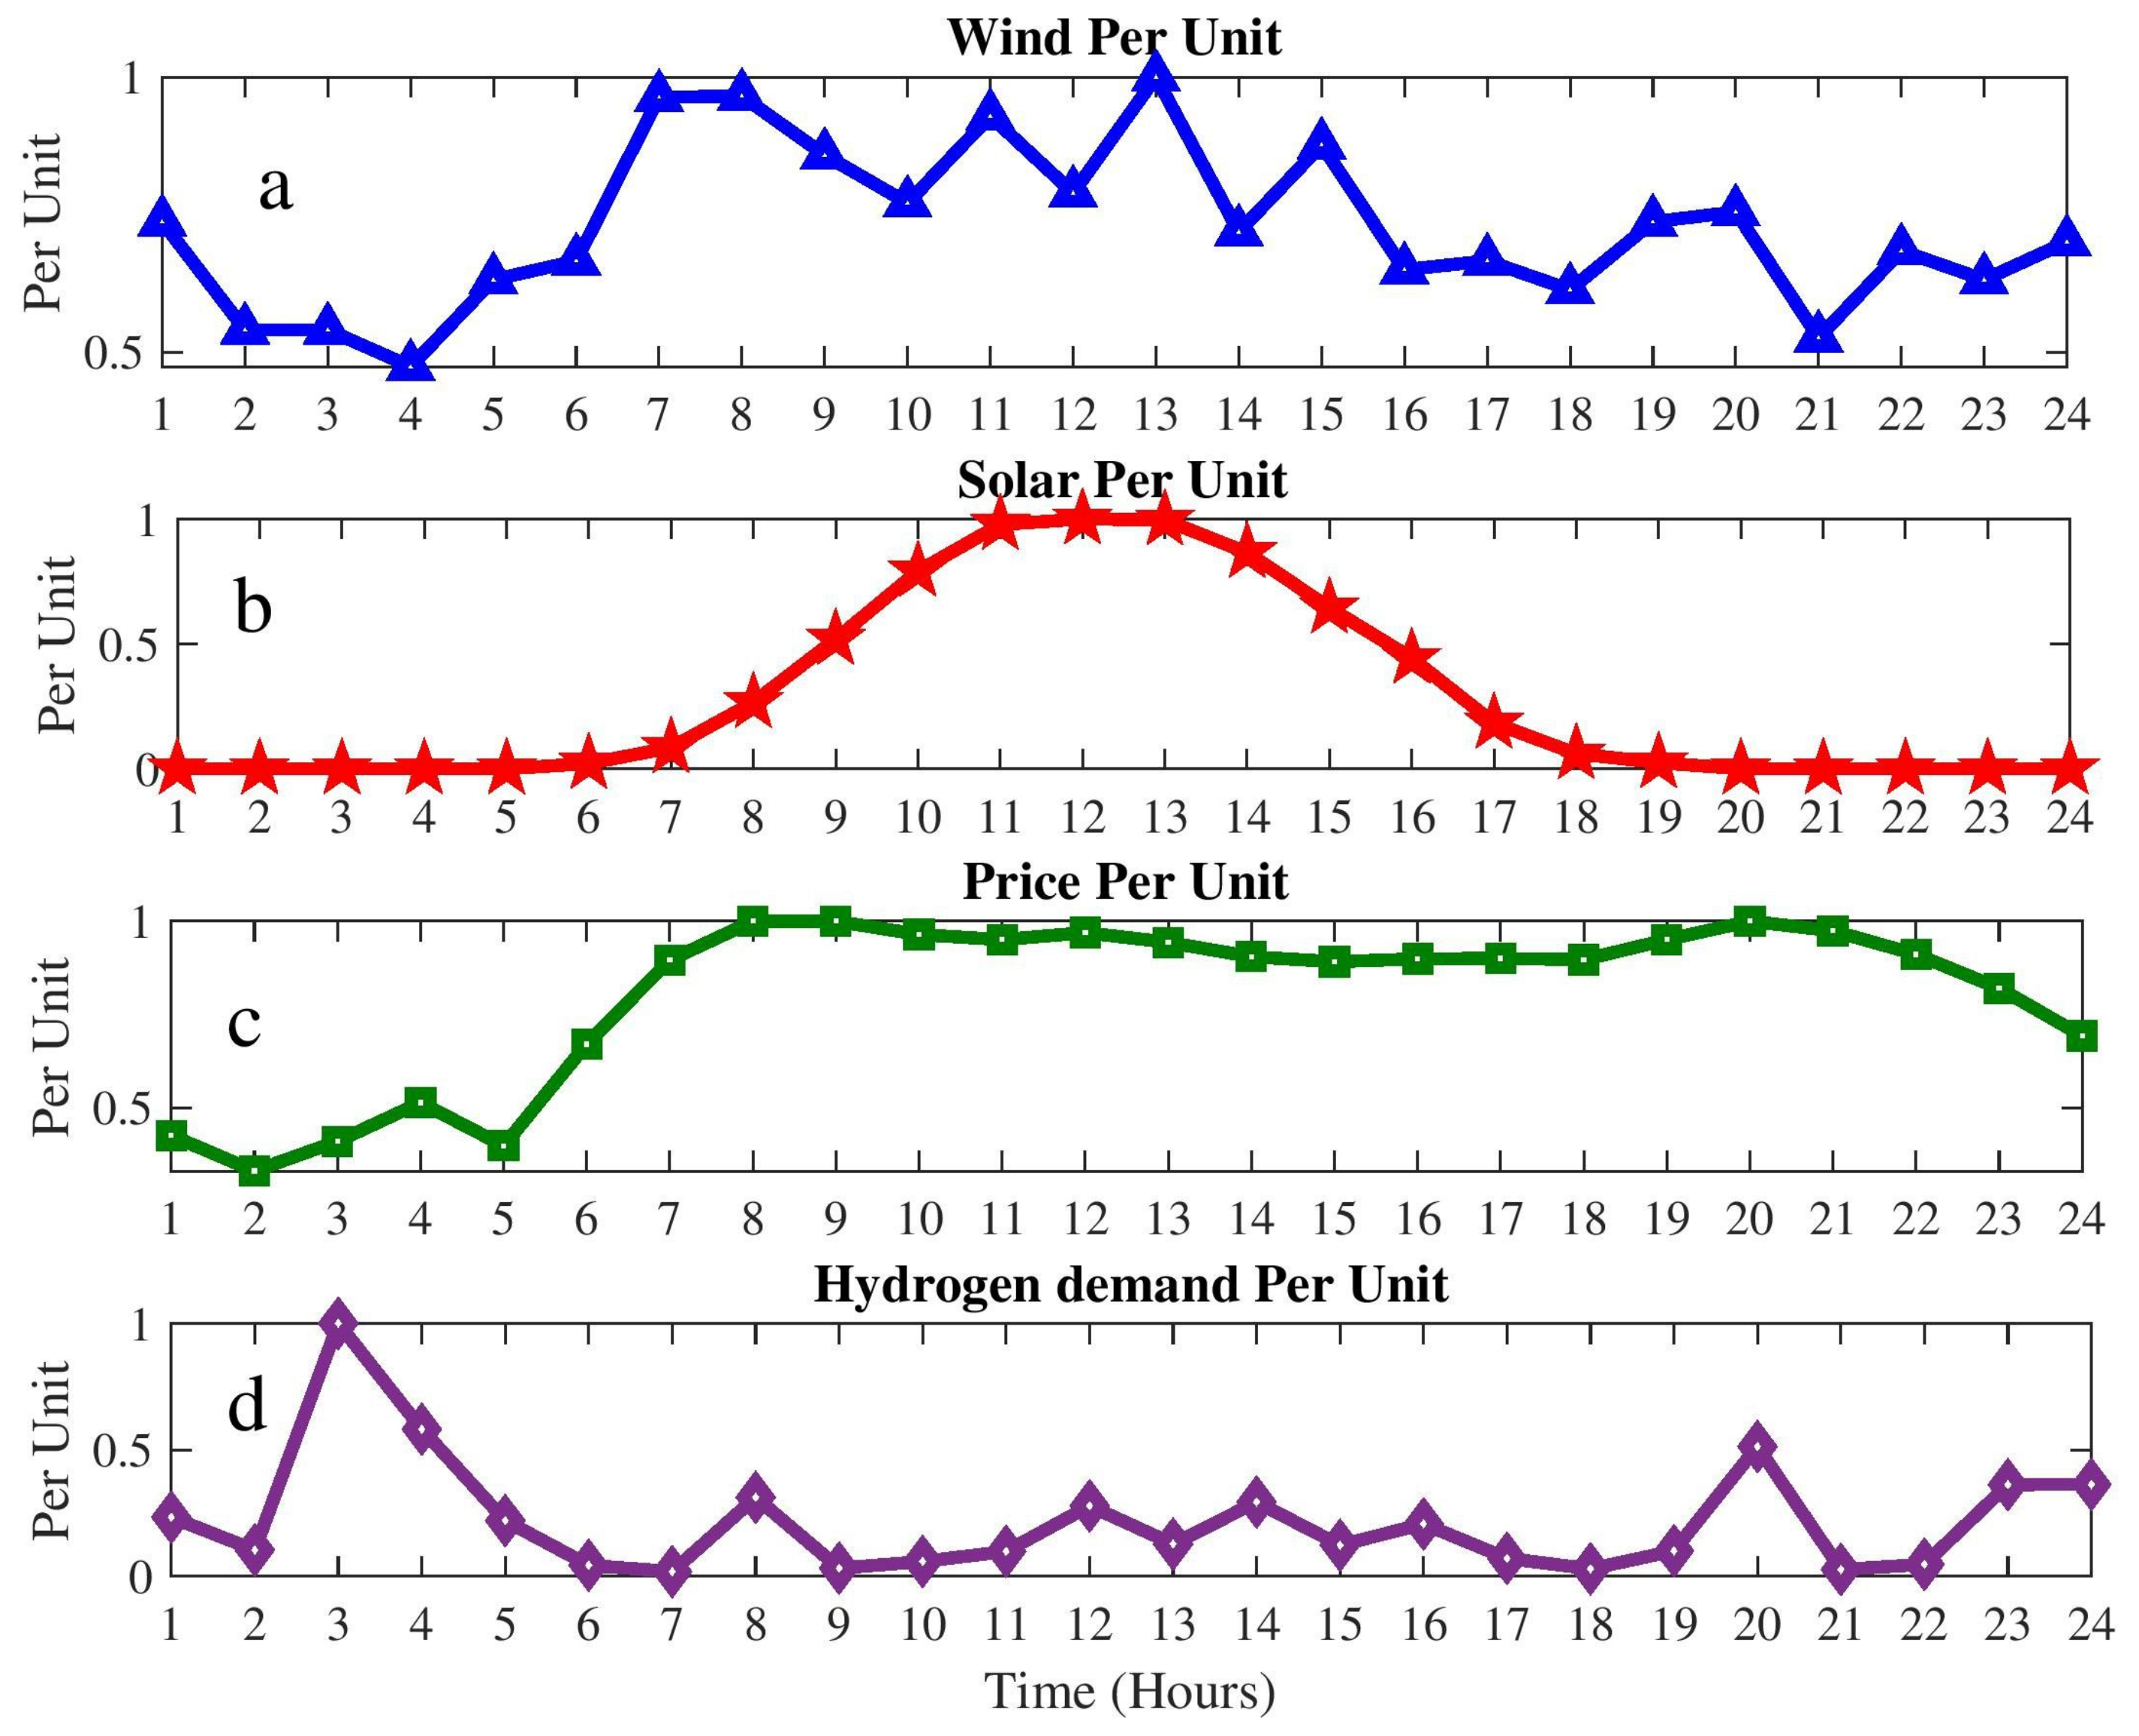
This section assesses the practicality and effectiveness of the proposed model using a case study. This study evaluates the mean scenario values for the electrical prices, PV output, WT output, and hydrogen demand profiles, as previously detailed in Section 2 and depicted in Figure 7 [21]. Although this method is applicable to any microgrid, it primarily examines three specific microgrids within the MMG framework.

Figure 7.
(a) Average WT generation per unit, (b) average PV generation per unit, (c) average of electrical price per unit, (d) average hydrogen demand per unit.
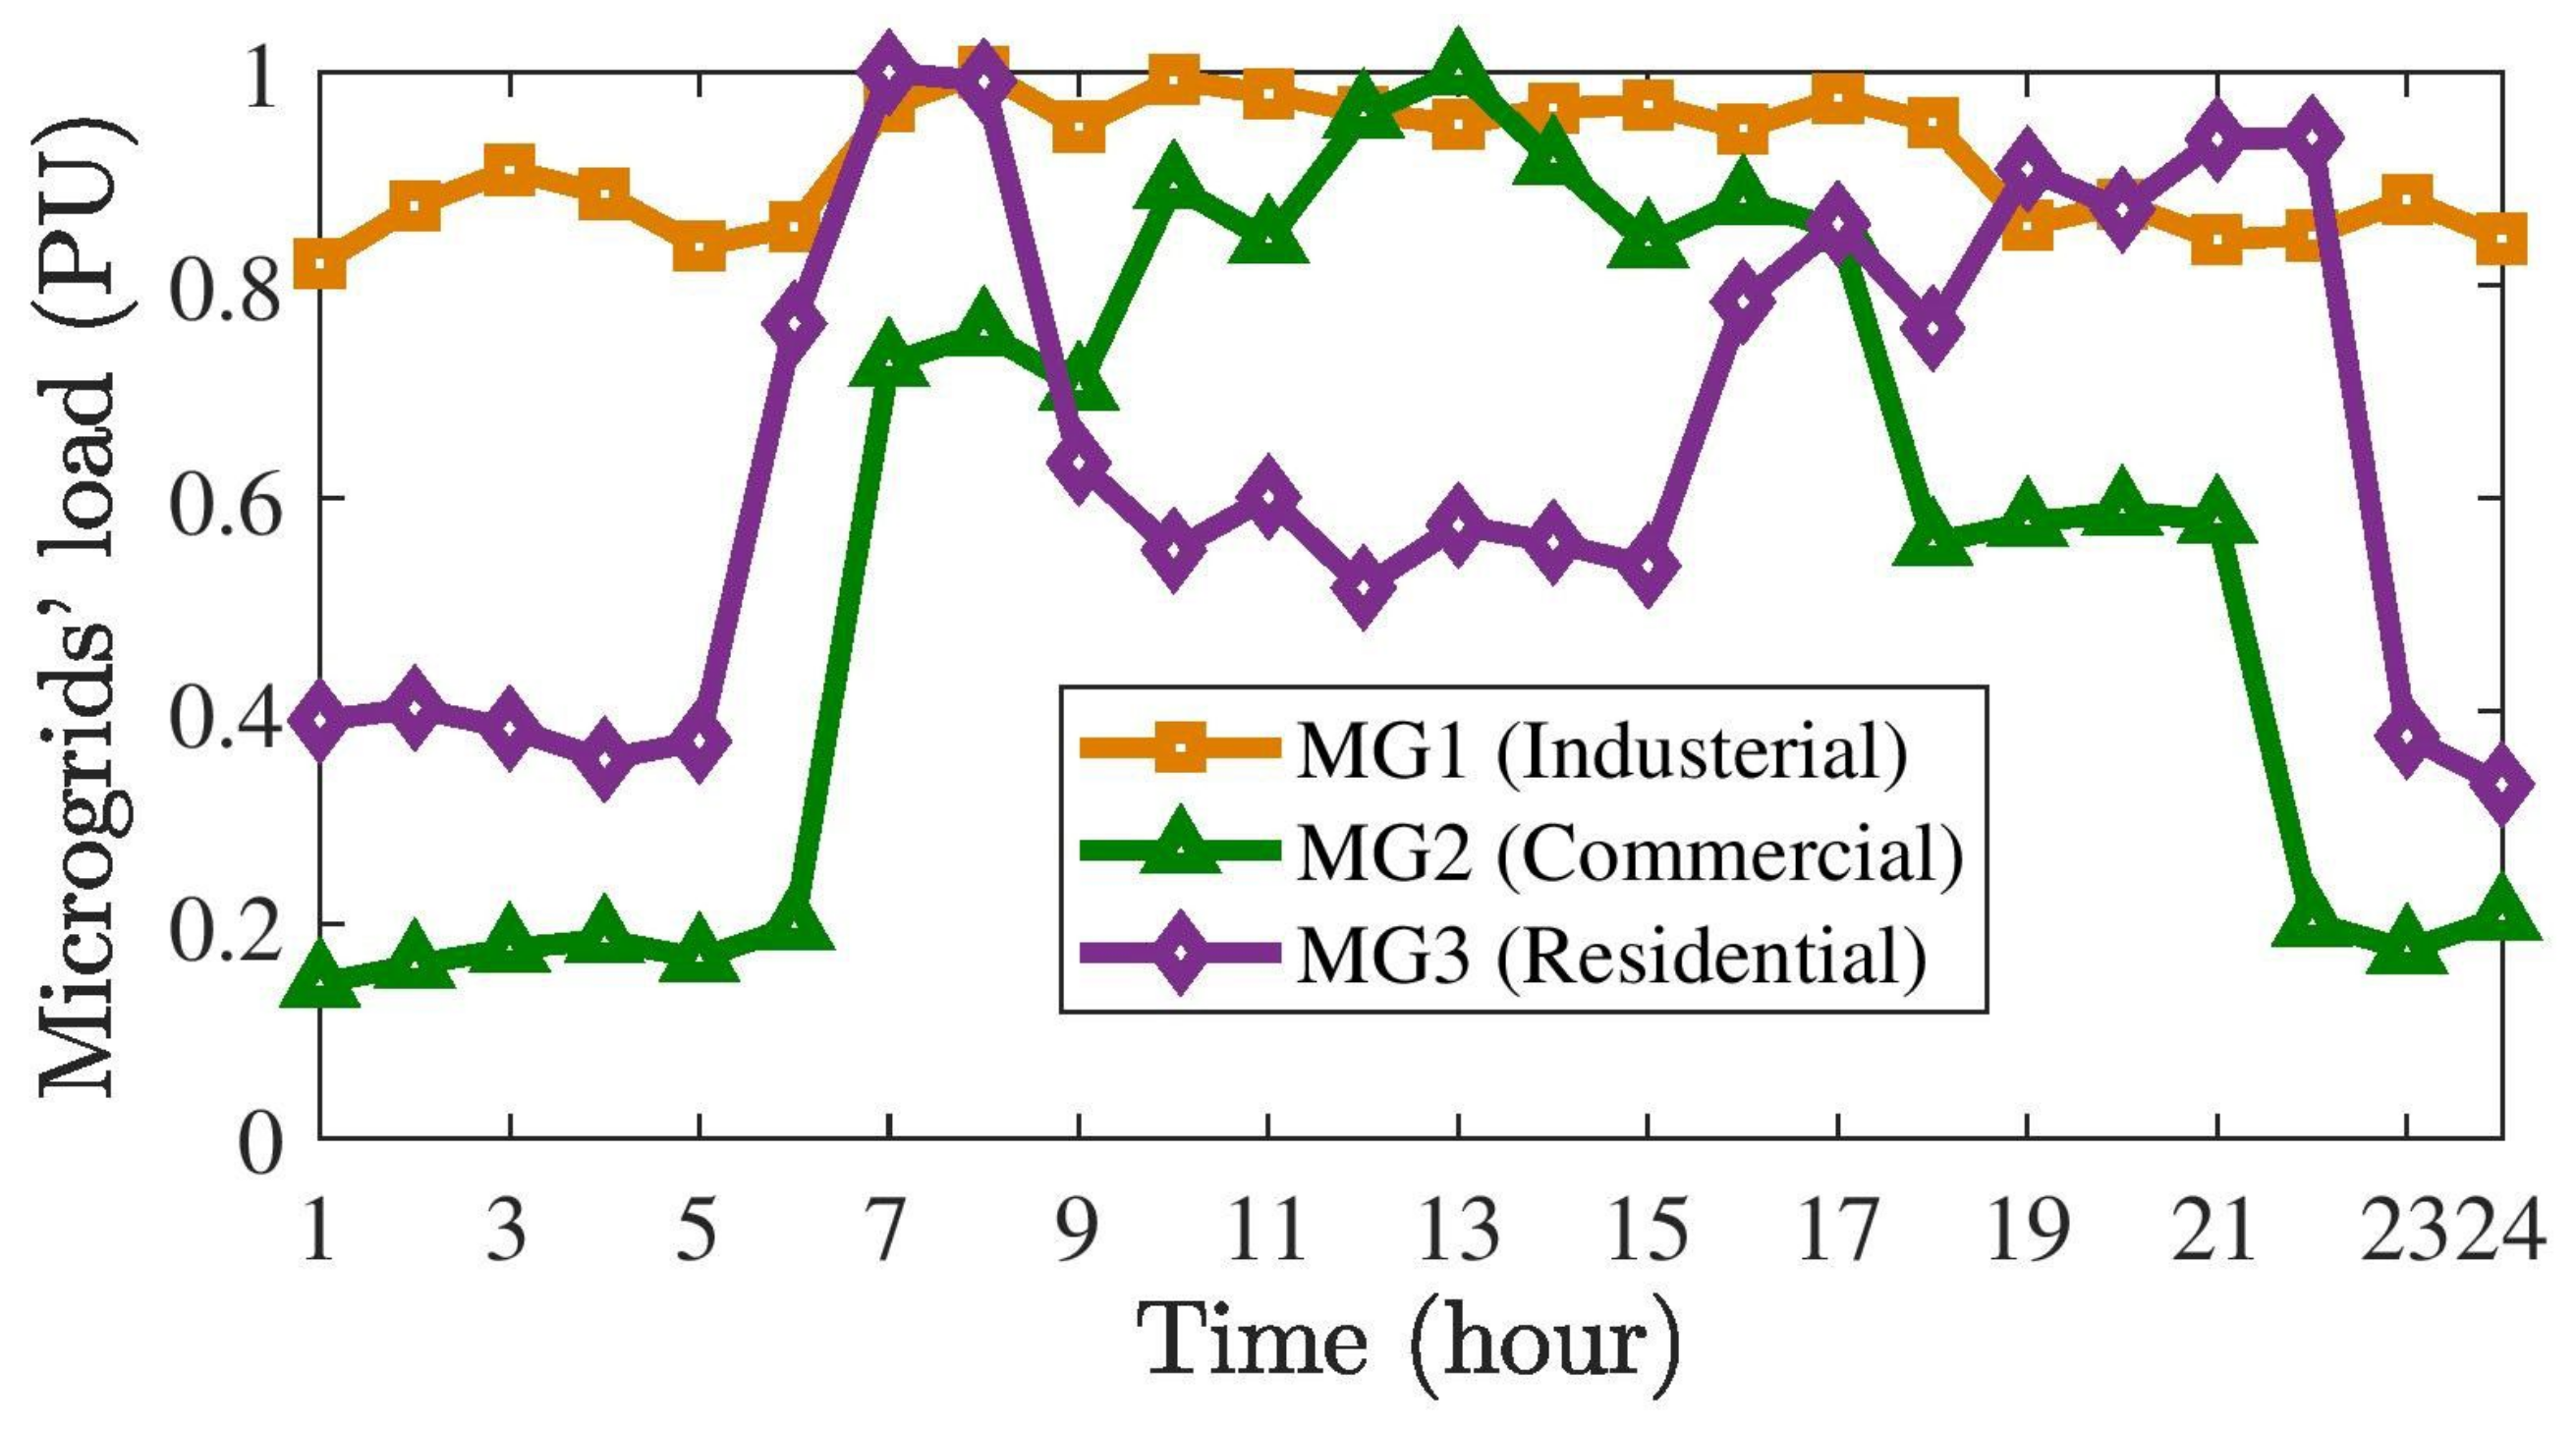
Figure 8 presents the average load scenario across three microgrids, segmented into industrial, residential, and commercial microgrids [21]. The technical details of the HSS in these microgrids are provided in Table 3. The highest electricity price recorded is 45.5 cents per kWh. For MG1, MG2, and MG3, the peak loads are consistently 1 MW, 0.9 MW, and 0.7 MW, respectively. In addition, across all the MGs, the peak output from the photovoltaic (PV) systems and wind turbine (WT) are 0.5 MW and 0.8 MW, respectively. Additionally, the peak hydrogen demand is 25 kg. The PCC capacity is set at 3 MW.

Figure 8.
Average of microgrid daily load profit.
Table 3.
Technical data of the HSSs in MGS [22].
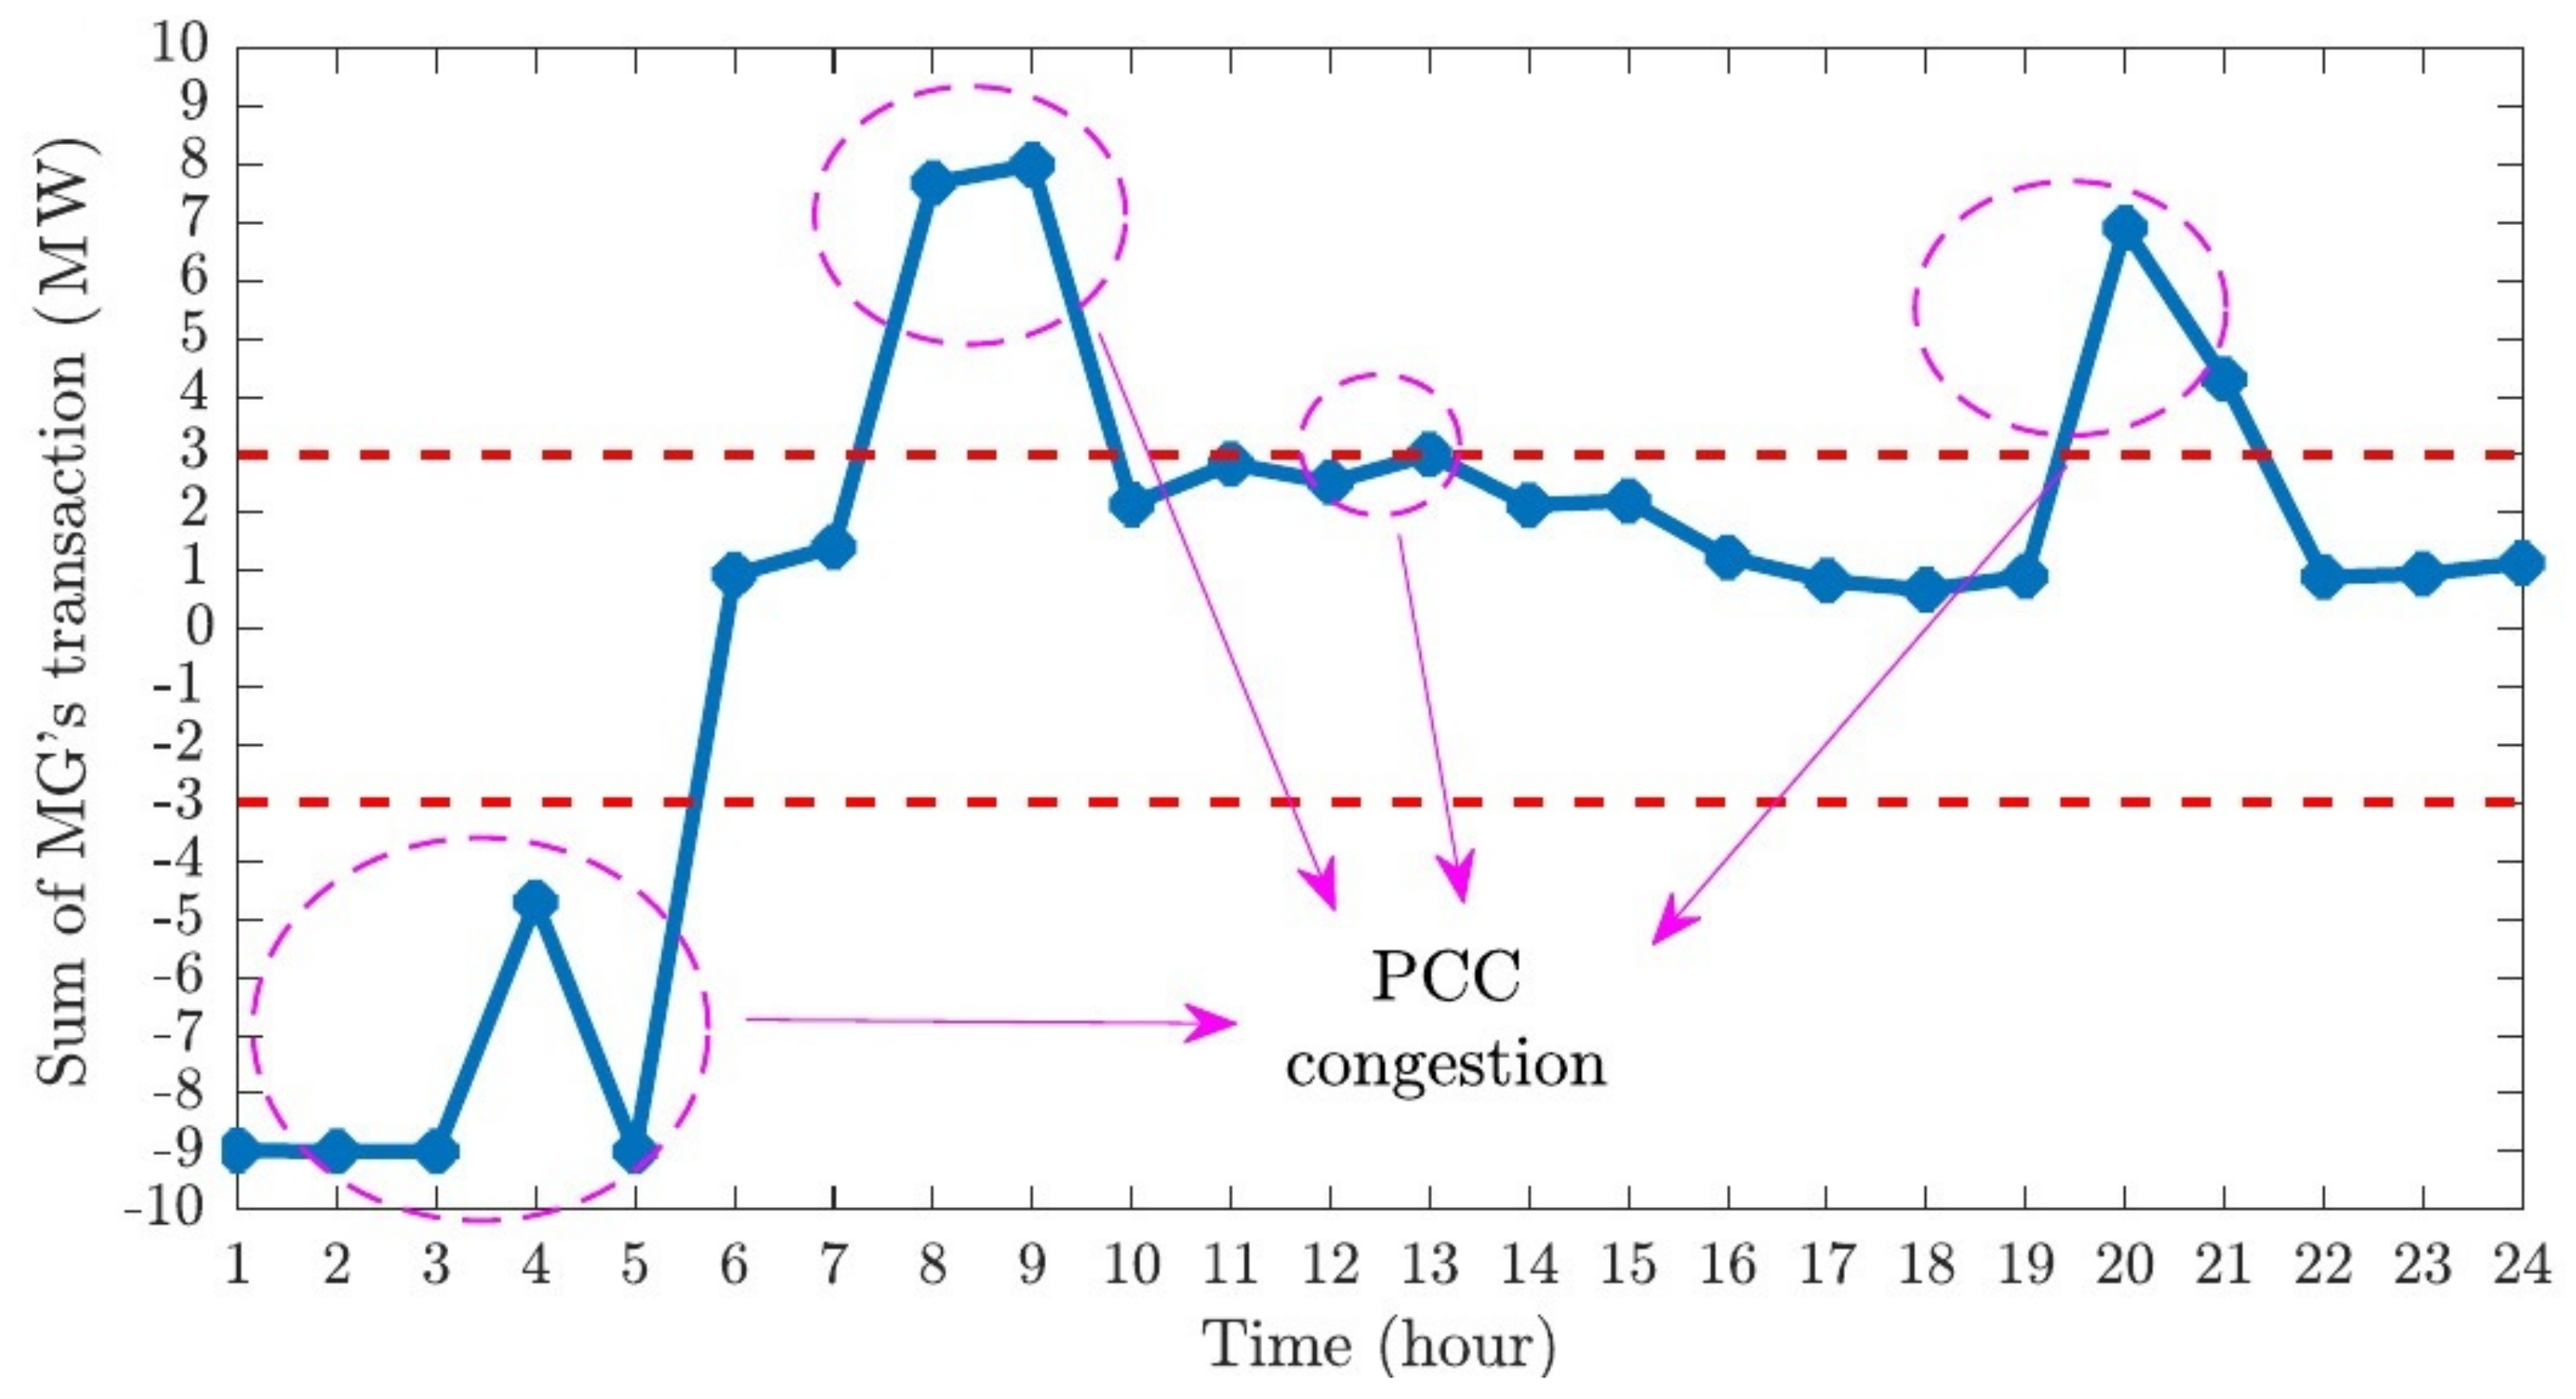
Each Microgrid transmits its power exchange profile to the HMS, which then calculates the total exchanged power by combining these profiles. Figure 9 illustrates the sum of the average exchanged power between the MMG and the grid across all the scenarios. As indicated, the exchanged power falls outside the acceptable limits during hours 1 to 5, 8 to 9, 13, and 20 to 21.

Figure 9.
Aggregated exchanged power calculated by the hydrogen management system.
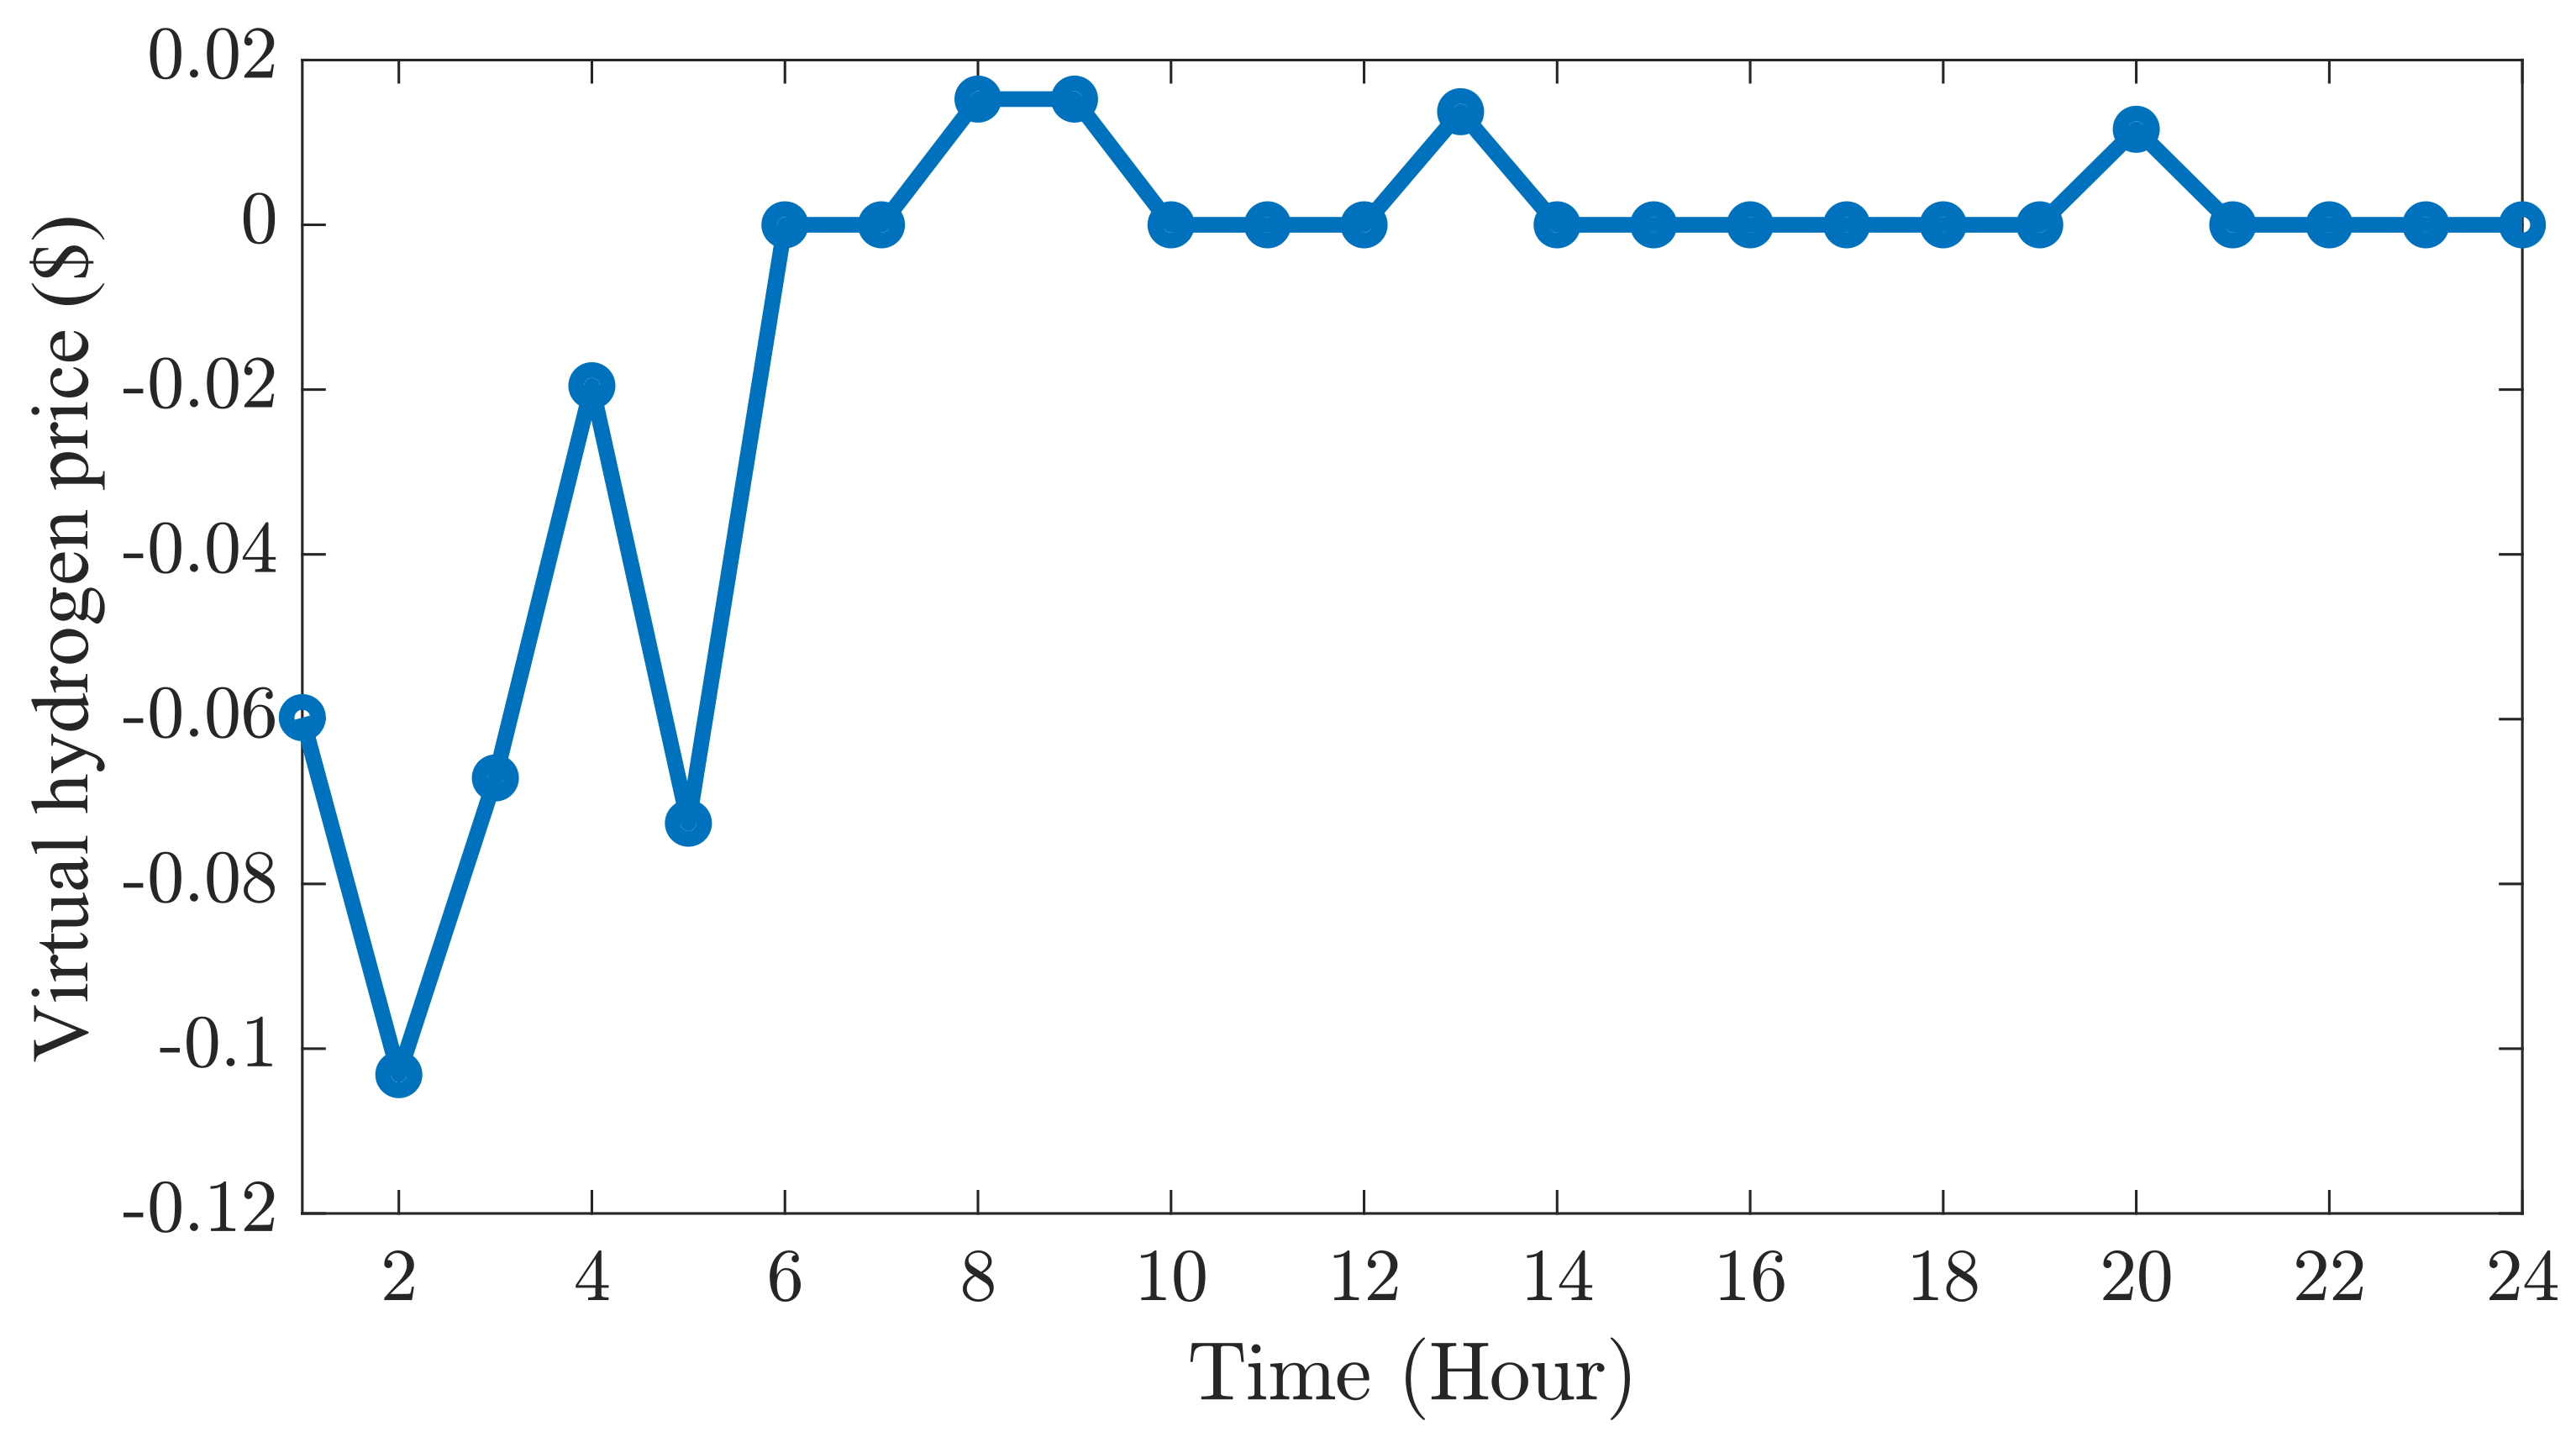
To ensure that the trading power remains within the acceptable range, the sum of the mismatch power must be confined within the area defined by the two dotted lines in Figure 10. For this purpose, the HMS based on Algorithm 1 optimizes virtual hydrogen prices and communicates them to the microgrids. This process continues until constraint (17) is satisfied.

Figure 10.
Virtual hydrogen prices optimized using Algorithm 1.
The optimized adjustments to virtual hydrogen prices are shown in Figure 10. As previously mentioned, the lower energy prices during hours 1 to 5 encourage the microgrids to buy power from the grid, convert it to hydrogen, and then store the hydrogen. Specifically, the HMS optimizes the negative prices by reducing the hydrogen price from zero to negative values during these hours, leading to a decrease in hydrogen charging. Conversely, during hours 8, 9, 13, and 20, the HMS increases the virtual hydrogen prices from zero to a positive value, thus encouraging the charging of hydrogen in the hydrogen tank instead of selling power to the grid.
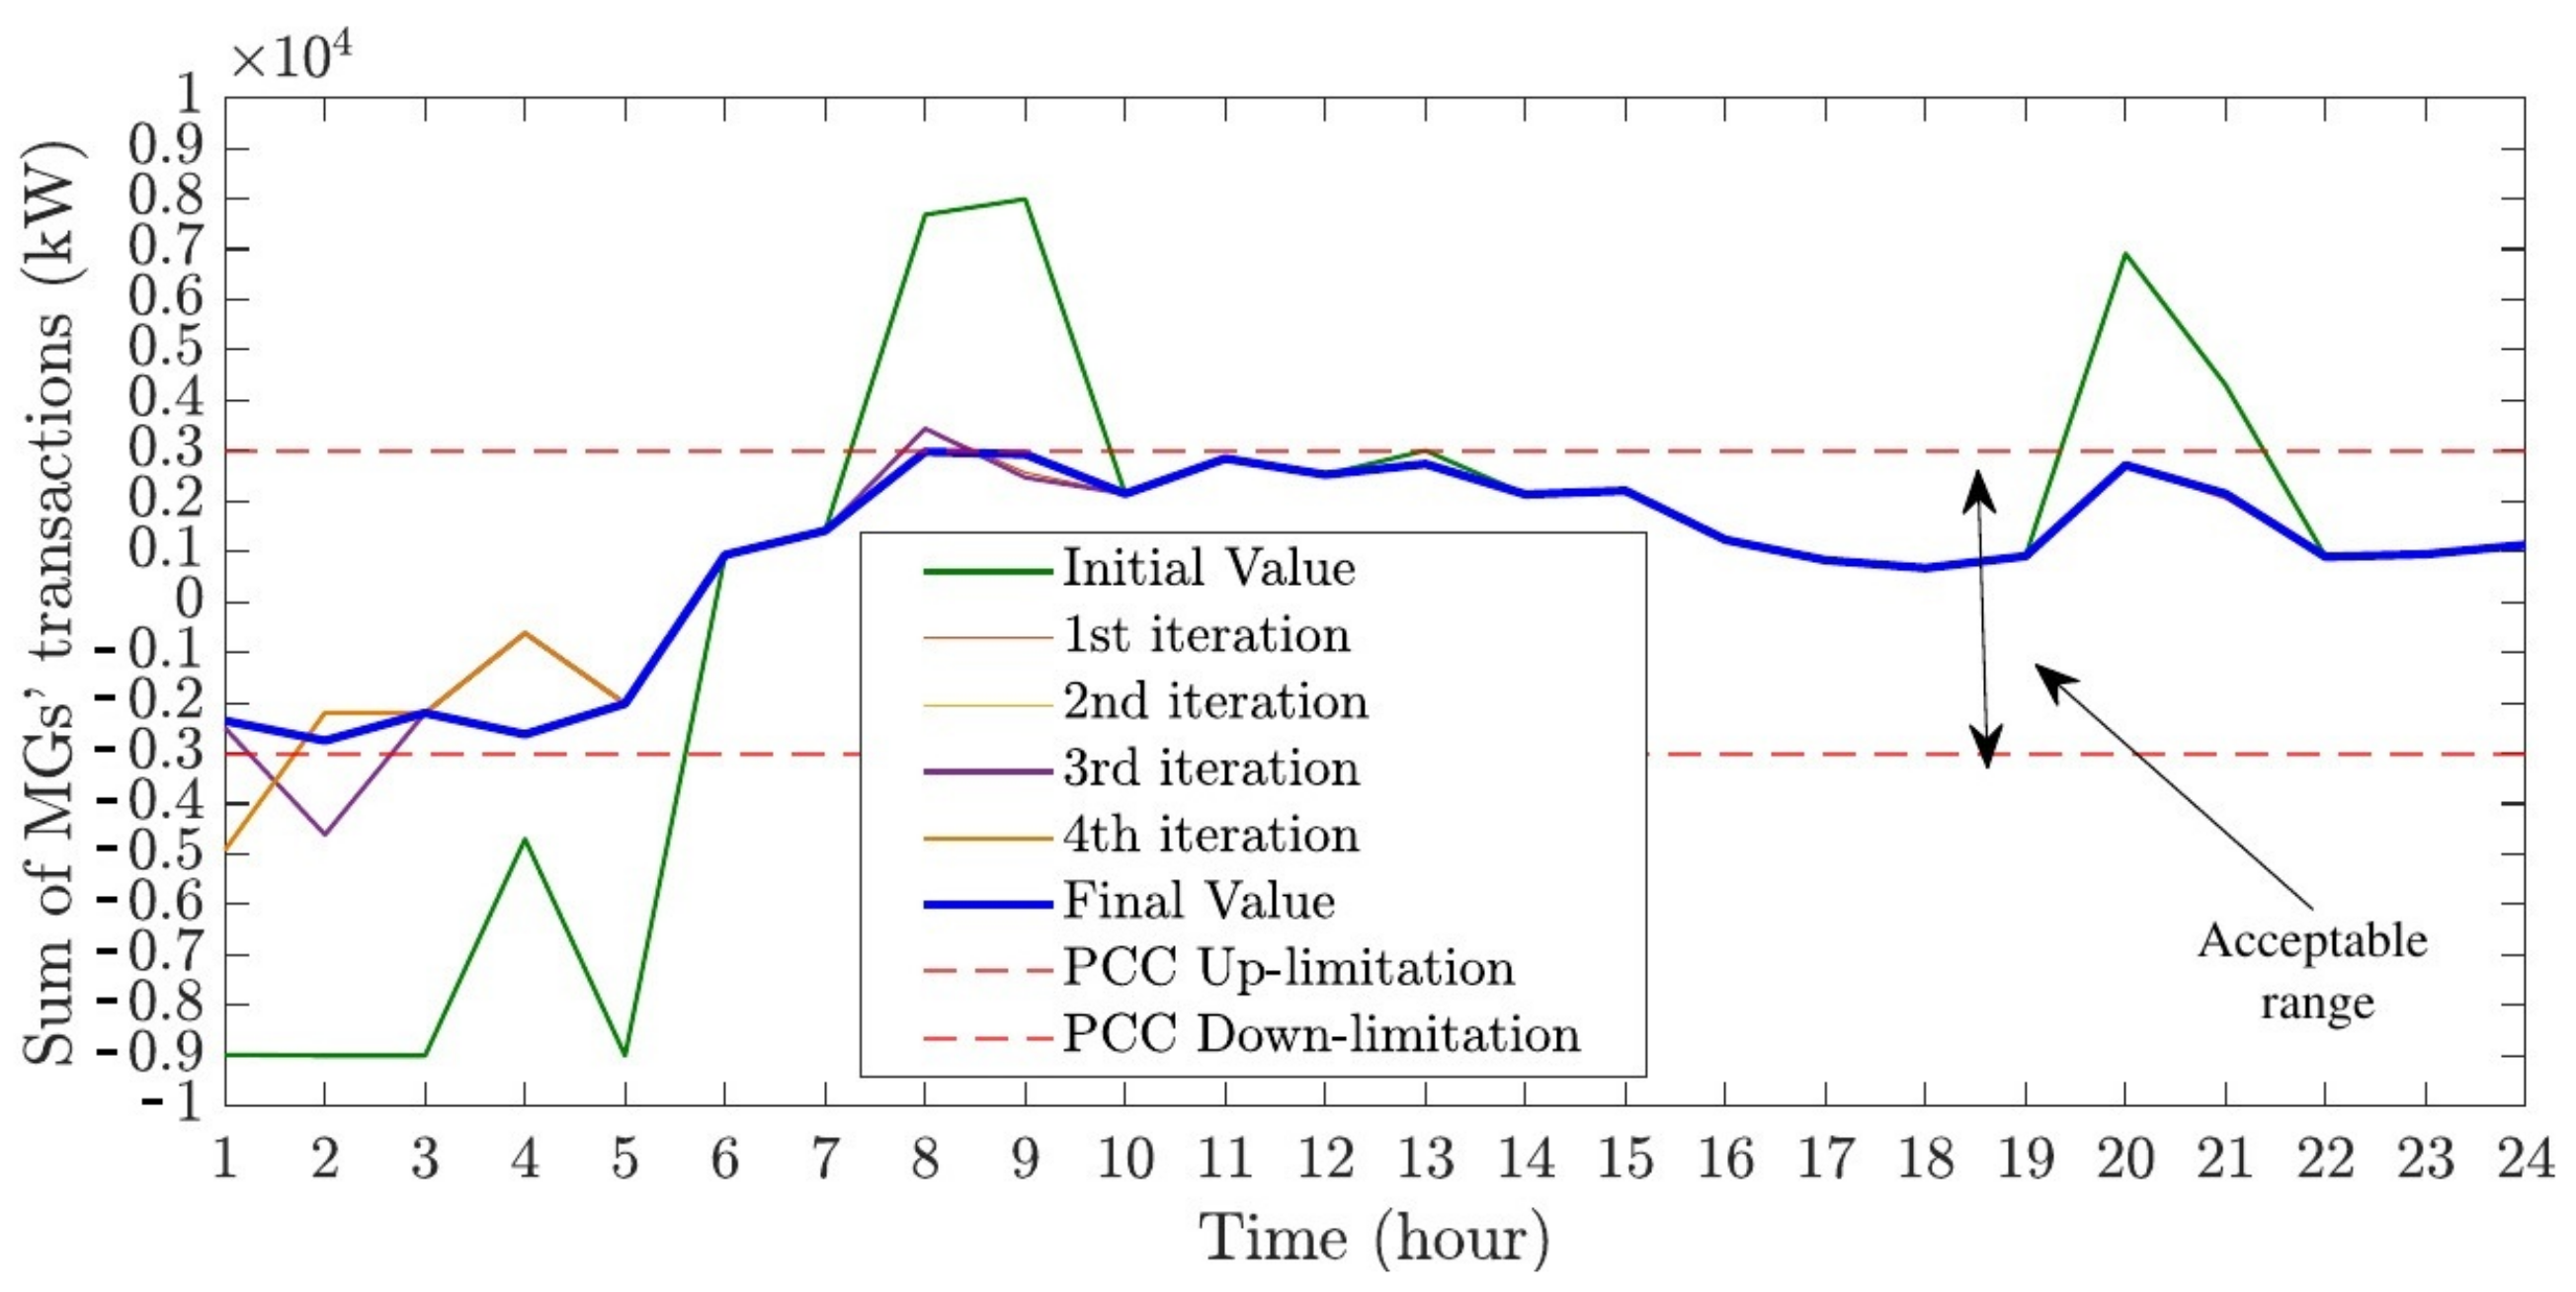
Figure 11 depicts the converge diagram of the average of transaction power between MG1, MG2, MG3, and the grid. The acceptable range for the power transactions is shown as the area between the two dashed horizontal lines. As mentioned before, initially, the exchanged power exceeds the acceptable range during hours 1 to 5, 8, 9, 13, 20 and 21. The proposed method in each iteration optimizes the virtual hydrogen prices, creating new values for power exchange. Although optimizing virtual hydrogen prices hourly using Algorithm 1 may cause violations in other hours, the proposed method iterates to ensure that the power exchange remains within the acceptable range at all times. In the case study, after five iterations, the method is converged. Although the PCC can temporarily withstand overloads, an overload approaching 300% of the rated capacity for as long as five hours represents an extreme scenario and will trigger protective systems to become active.
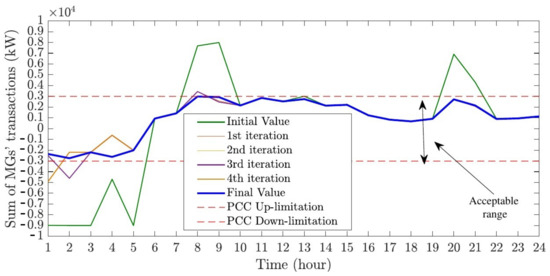
Figure 11.
Converge diagram of transaction powers between the MMG and the grid.
In this case, the HMS calculates the total profit of the microgrids at USD 19,375. This profit is subsequently allocated to the profit-sharing mechanism, which distributes it among the MGs based on the Shapley value. As a result, the earnings for MG1, MG2, and MG3 are USD 6358, USD 6558, and USD 6459, respectively. The problem reached convergence after five iterations, and the simulation time totaled approximately 691 s.
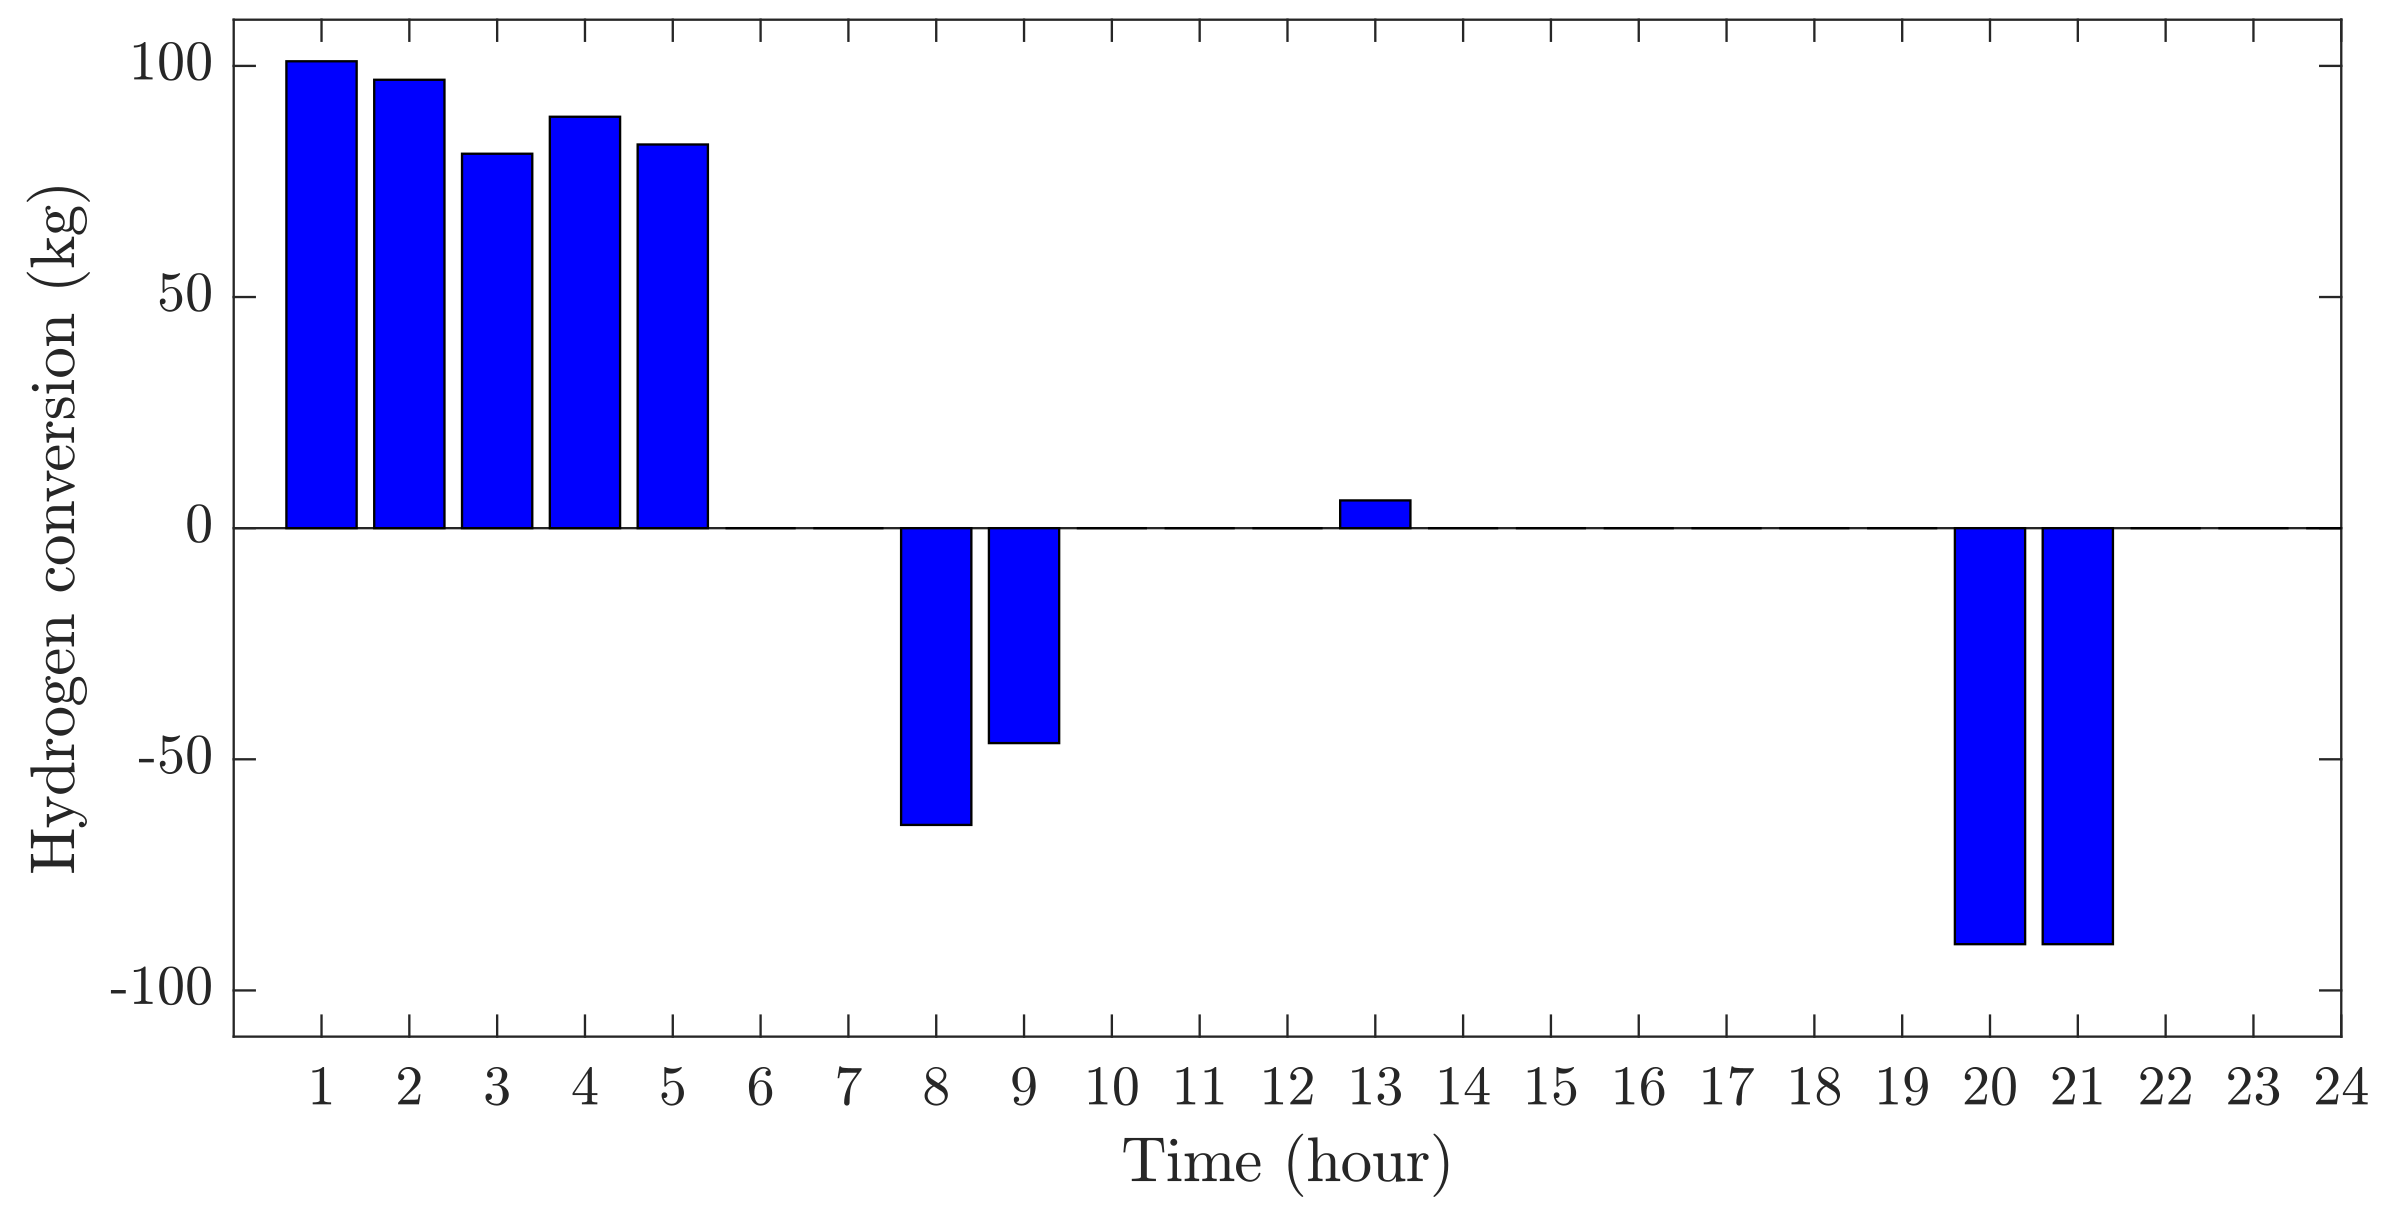
Figure 12 displays the conversion of hydrogen to power and the production of hydrogen from power over a day. As observed in Figure 11, during the initial five hours, when electricity prices are reduced (as illustrated in Figure 7), all the microgrids begin to charge their hydrogen storage. This activity is a primary cause of congestion at the PCC, as depicted in Figure 11. Similarly, in hours 8, 9, 20, and 21, when electricity prices are high (also shown in Figure 7), all the microgrids begin to discharge their hydrogen storage. The proposed algorithm optimizes the value of hydrogen conversion in these hours, optimizing the profit of the MMG and addressing the congestion in the PCC.

Figure 12.
The conversion of hydrogen to power and the production of hydrogen from power over a day.
As shown in Figure 12, the proposed algorithm addresses PCC congestion by readjusting the timing and amount of hydrogen transactions based on the virtual hydrogen prices (see Figure 10), which helps to reduce congestion during peak hours. For example, during the early hours (hours 1 to 5), when electricity is cheaper and demand is low, all the microgrids charge their hydrogen storage to take advantage of the lower prices and store energy. During peak price hours—specifically at hours 8 and 9 and from hours 20 to 21—the microgrids release their stored hydrogen to benefit from higher energy prices, thus maximizing profits. Additionally, at hour 13, when energy production exceeds what the PCC can handle, the system stores the excess energy as hydrogen instead of sending it to the grid. The gaps in the data shown in Figure 12 indicate periods when neither electrolyzers nor fuel cells are working; a strategy that maximizes the profits for the microgrids. These operational details are crucial for the efficiency of the proposed model, ensuring that the HSS is used optimally to maximize the profit with technical challenges like congestion at the PCC.
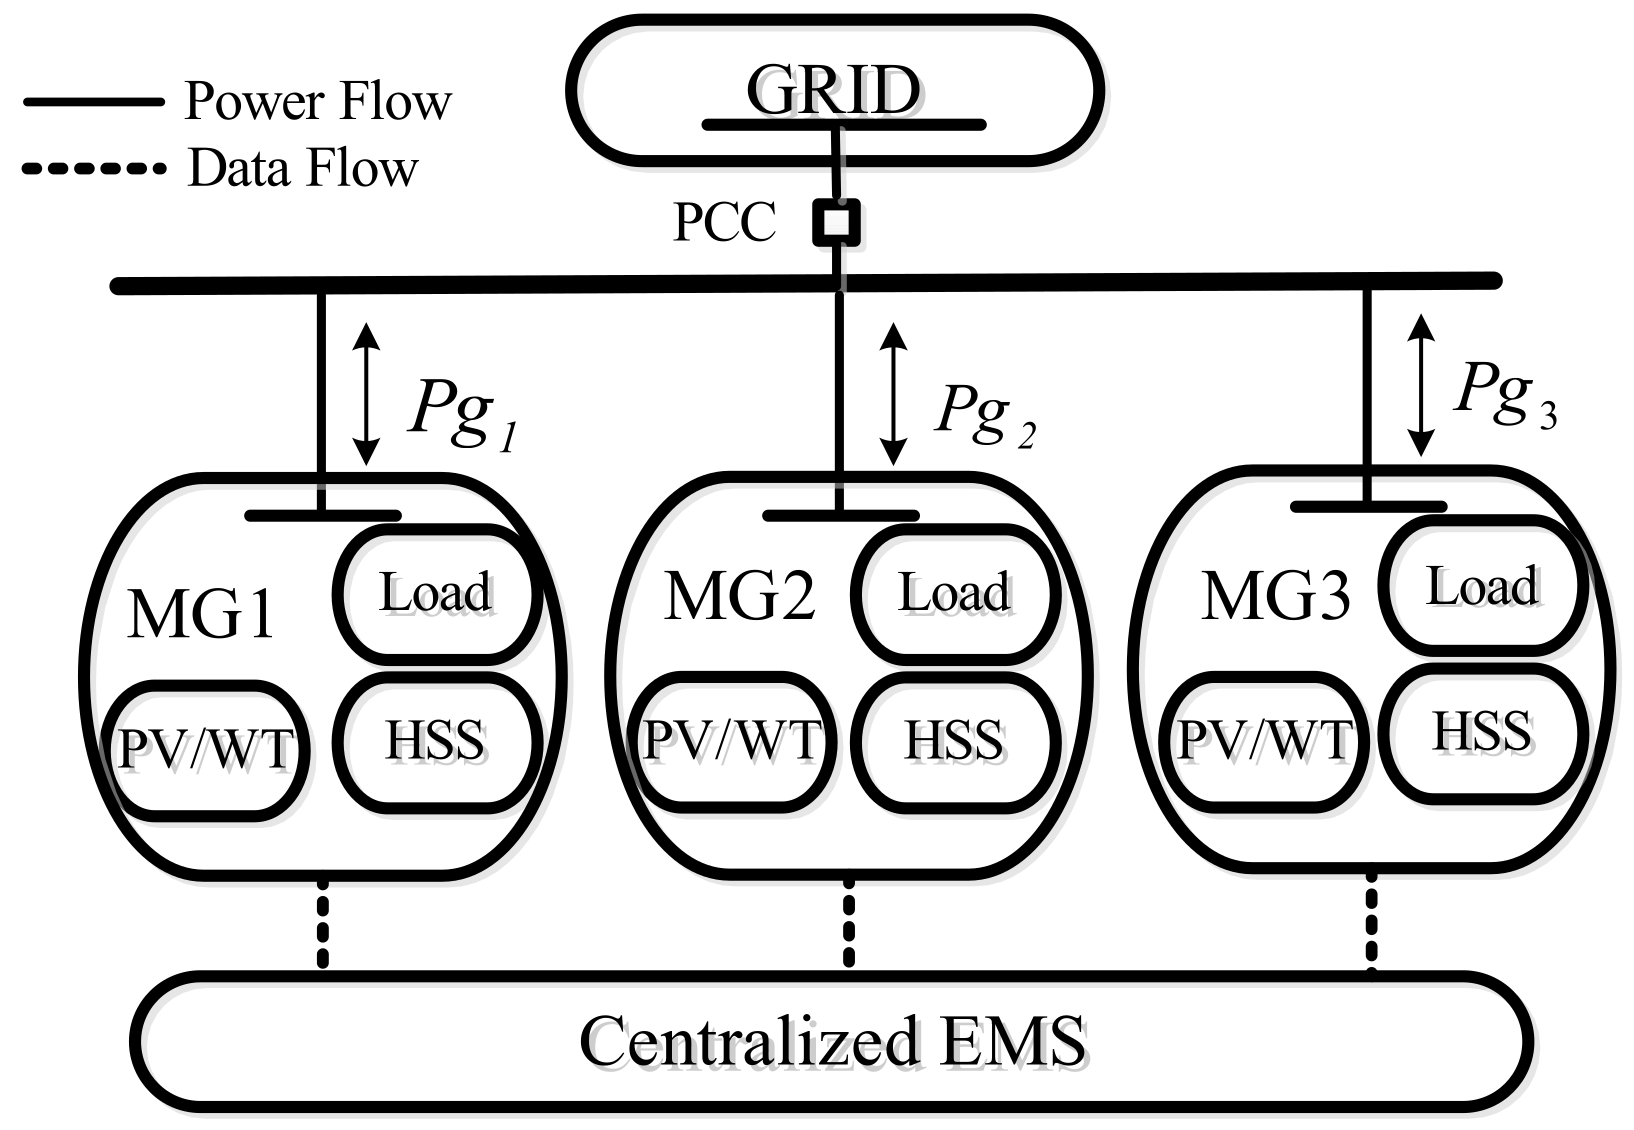
The proposed hybrid energy management systems, while preserving customer privacy, might decrease profits by potentially trapping solutions at local optimum points. To achieve global optimization, a centralized EMS (Figure 13) should be considered that schedules all the microgrids. The profit of the centralized model is obtained using (19):
subject to the constraints of (20), which defines the PCC capacity.

Figure 13.
Schematic diagram of MMG, centralized EMS, and grid.
Optimizing (19), considering (20) and the previous constraints, sharing all the data through the centralized EMS leads to the total profit of the MMG increasing by USD 20,324, indicating that although our proposed method preserves the privacy of the MGs, the total profit decreases by 4.9 % compared with the global solution.
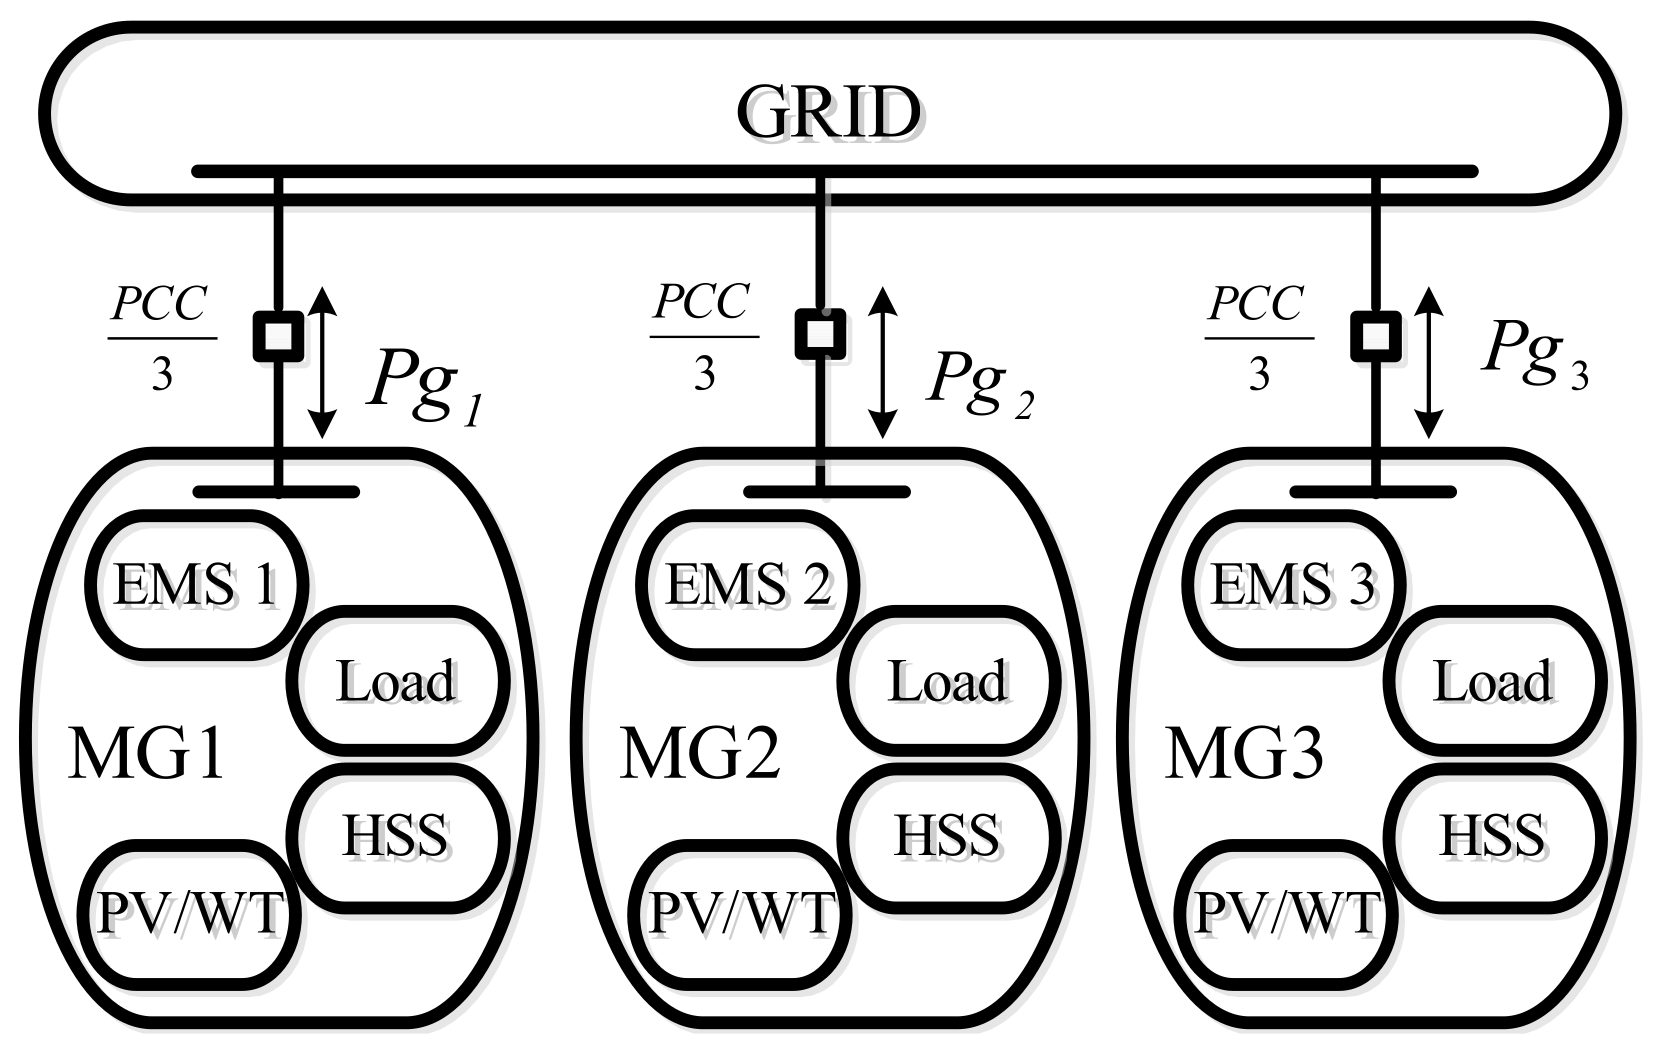
Another possible solution to preserve privacy among the MGs involves dividing the PCC capacity among them, meaning that each MG receives an equal share of the PCC capacity (Figure 14). In this solution, constraint (4), which defines the PCC capacity, is modified by (21).

Figure 14.
Schematic diagram of the MMG and grid when one-third of the PCC capacity is shared among them.
Optimizing (1) and considering (21) and the previous constraints of approach, the total profit of the microgrids amounts to USD 18,193. Consequently, the profits for MG1, MG2, and MG3 are USD 5902, USD 6210, and USD 6081, respectively. This method, while less burdensome, results in a total profit decrease of 6.1 % compared with the proposed method and 11.3 % compared with the global solution.
To validate the proposed method, the results were compared with those of previous studies. The findings in ref. [4] indicate that this method increases the MMG’s profit more effectively than the methods in refs [10,11]. Therefore, this study compares the proposed method with ref. [4]. Similar to the approach in ref. [4], for comparison, the demand response (DR) program based on the data from [4] has been incorporated into the proposed method for comparison with ref. [4]. The comparison between the results of the proposed method, ref. [4], and the global optimization solution is presented in Table 4.
Table 4.
Comparison of daily profits of the proposed method, a previous study, and the global solution including the demand response program.
The proposed method, which includes the DR program, increases the total profit of the microgrids by approximately 0.65% compared to ref. [4]. However, the global optimization solution yields a higher profit, surpassing the proposed method by approximately 8.97%. This demonstrates that the efficiency of the proposed method is comparable to that of ref. [4]. Consequently, it can increase the microgrids’ profit more than the profits reported in refs. [10,11].
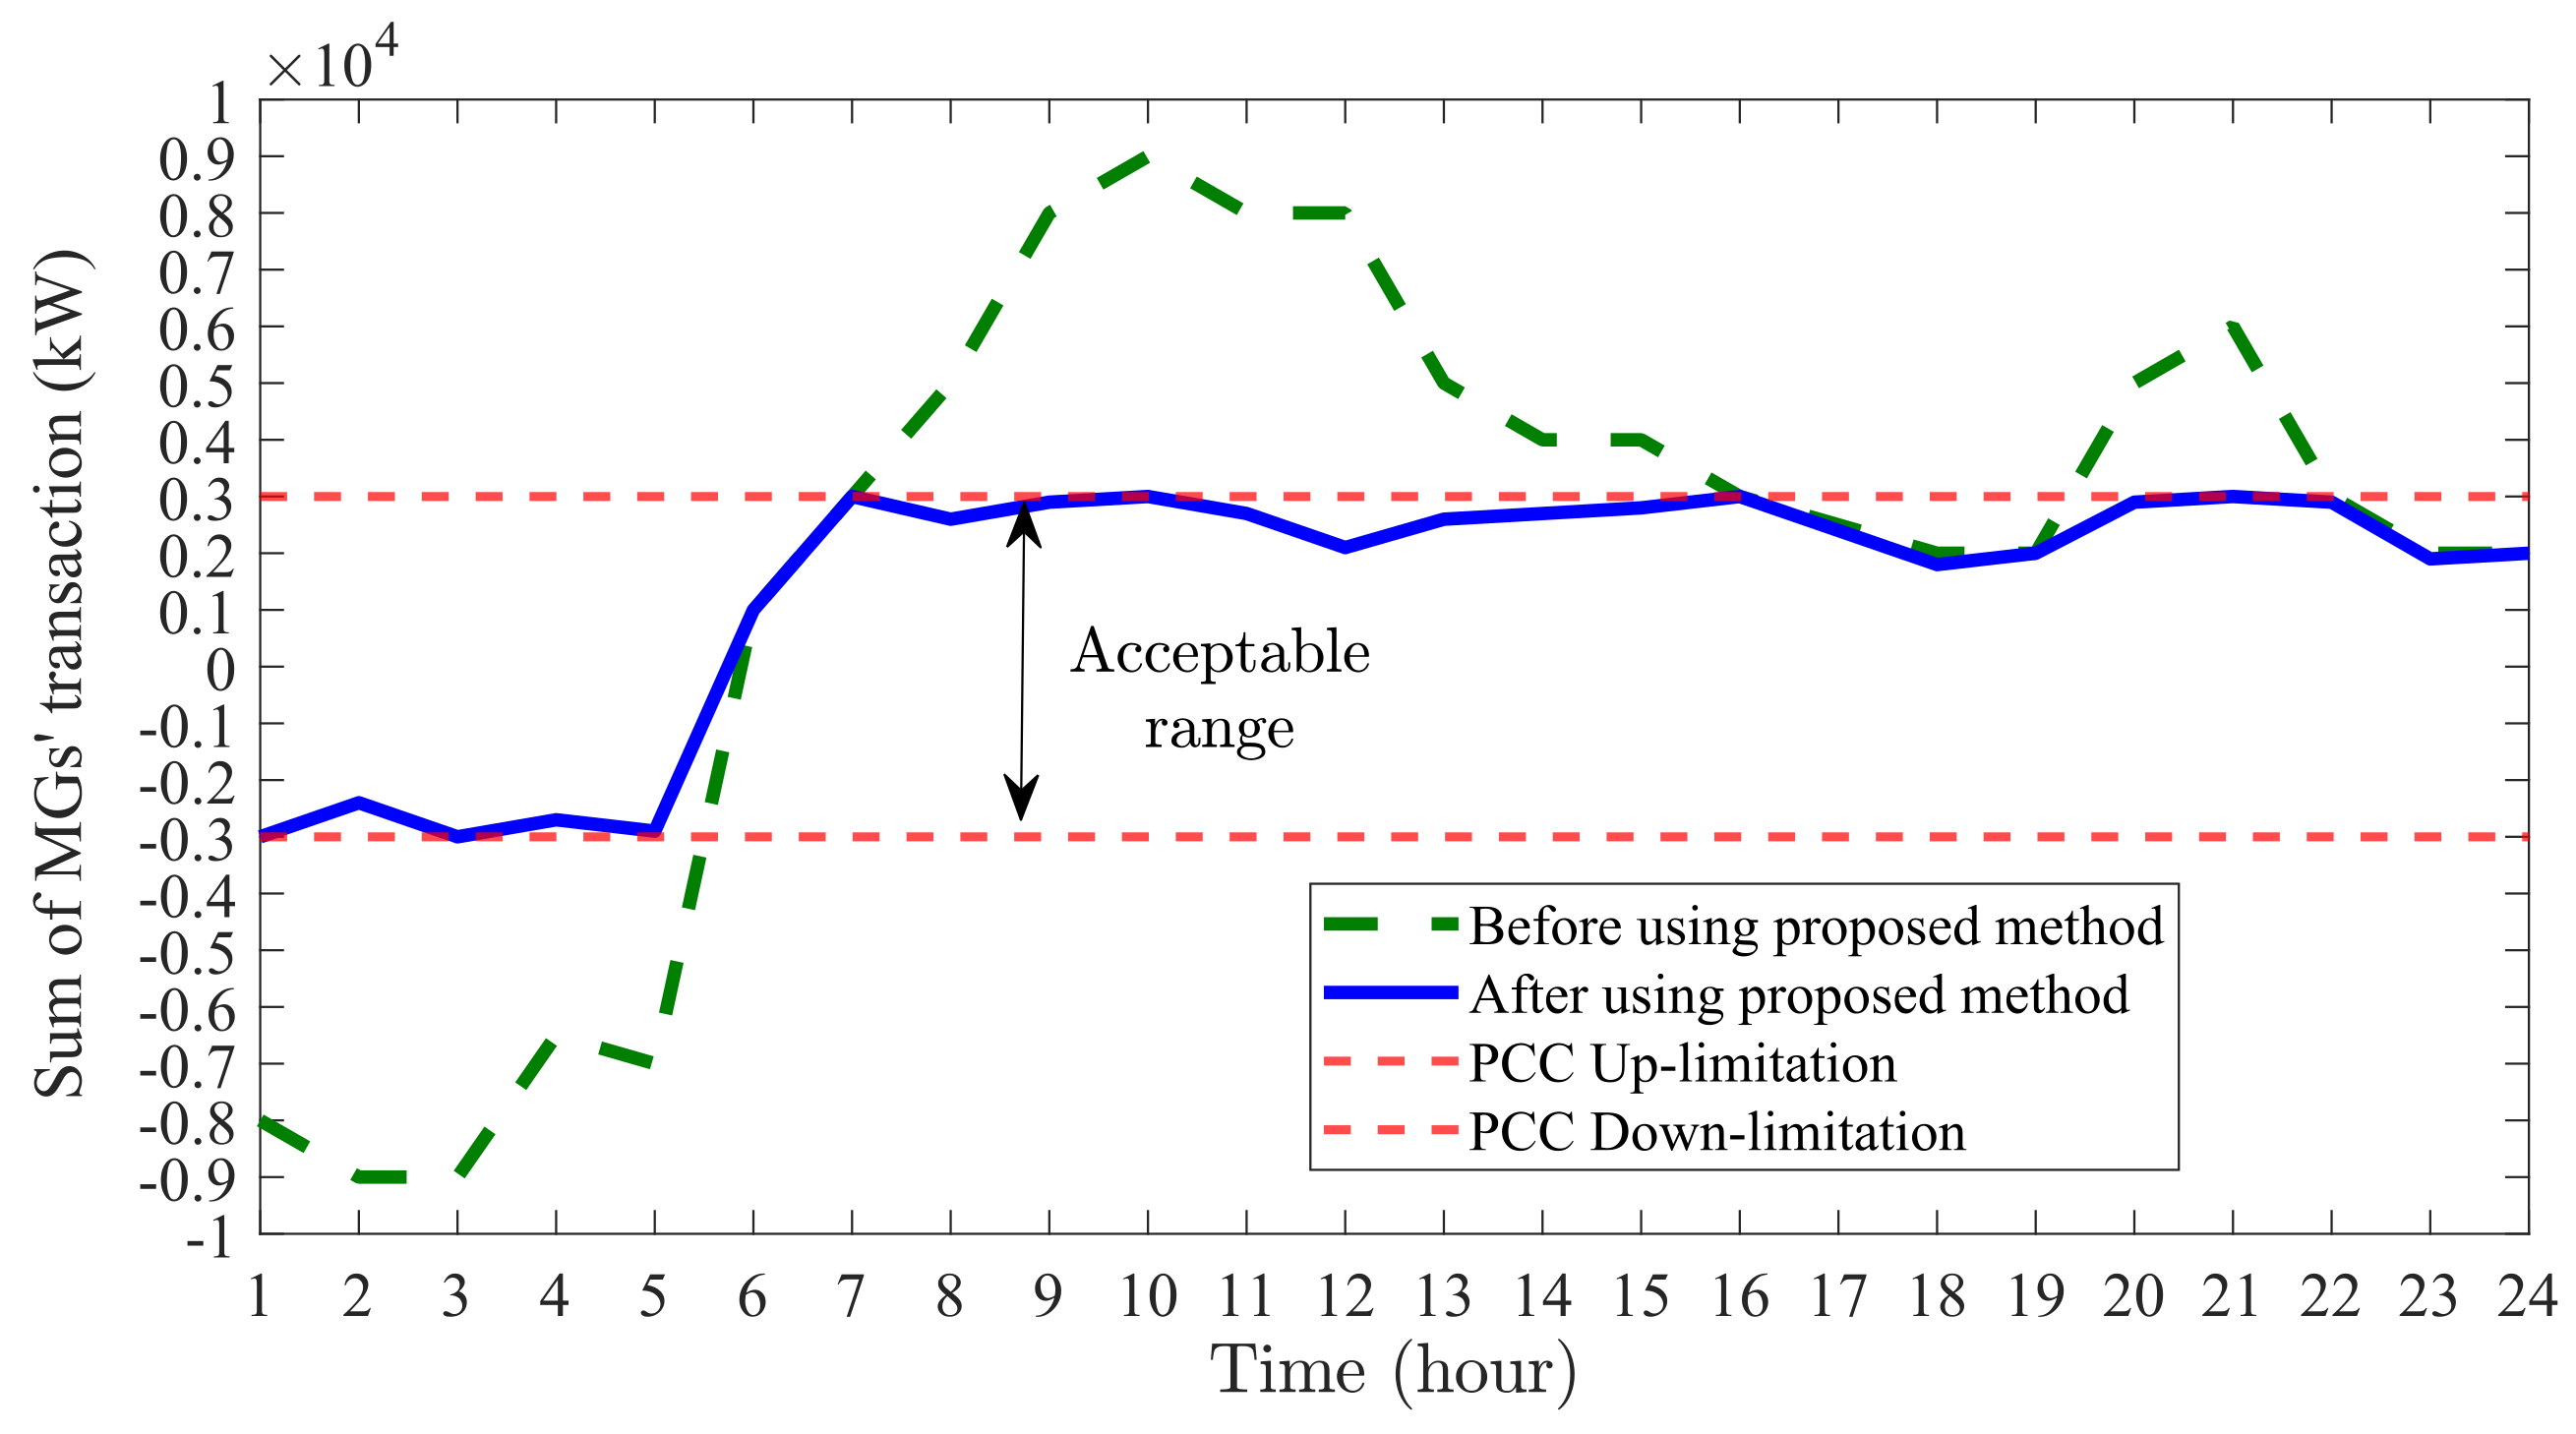
The proposed method was tested in two distinct scenarios: (i) summer (on the 14th day of the second month) and (ii) winter (on the 14th day of the second month). During the summer scenario, due to the increased output from photovoltaic systems, the microgrids tended to sell power back to the grid to maximize their profits. This often resulted in them exceeding the upper limit of the PCC capacity, particularly between hours 7 to 16, as shown in Figure 15. The proposed model enabled the individual microgrids to manage their energy transactions effectively, thereby resolving congestion at the PCC. Notably, during the early hours of the day, the microgrids tended to purchase electricity at lower prices to charge their hydrogen storage systems, which occasionally led to them exceeding the lower PCC limit.

Figure 15.
Energy transactions between the MMG and the grid on 14th day of the second month in summer.
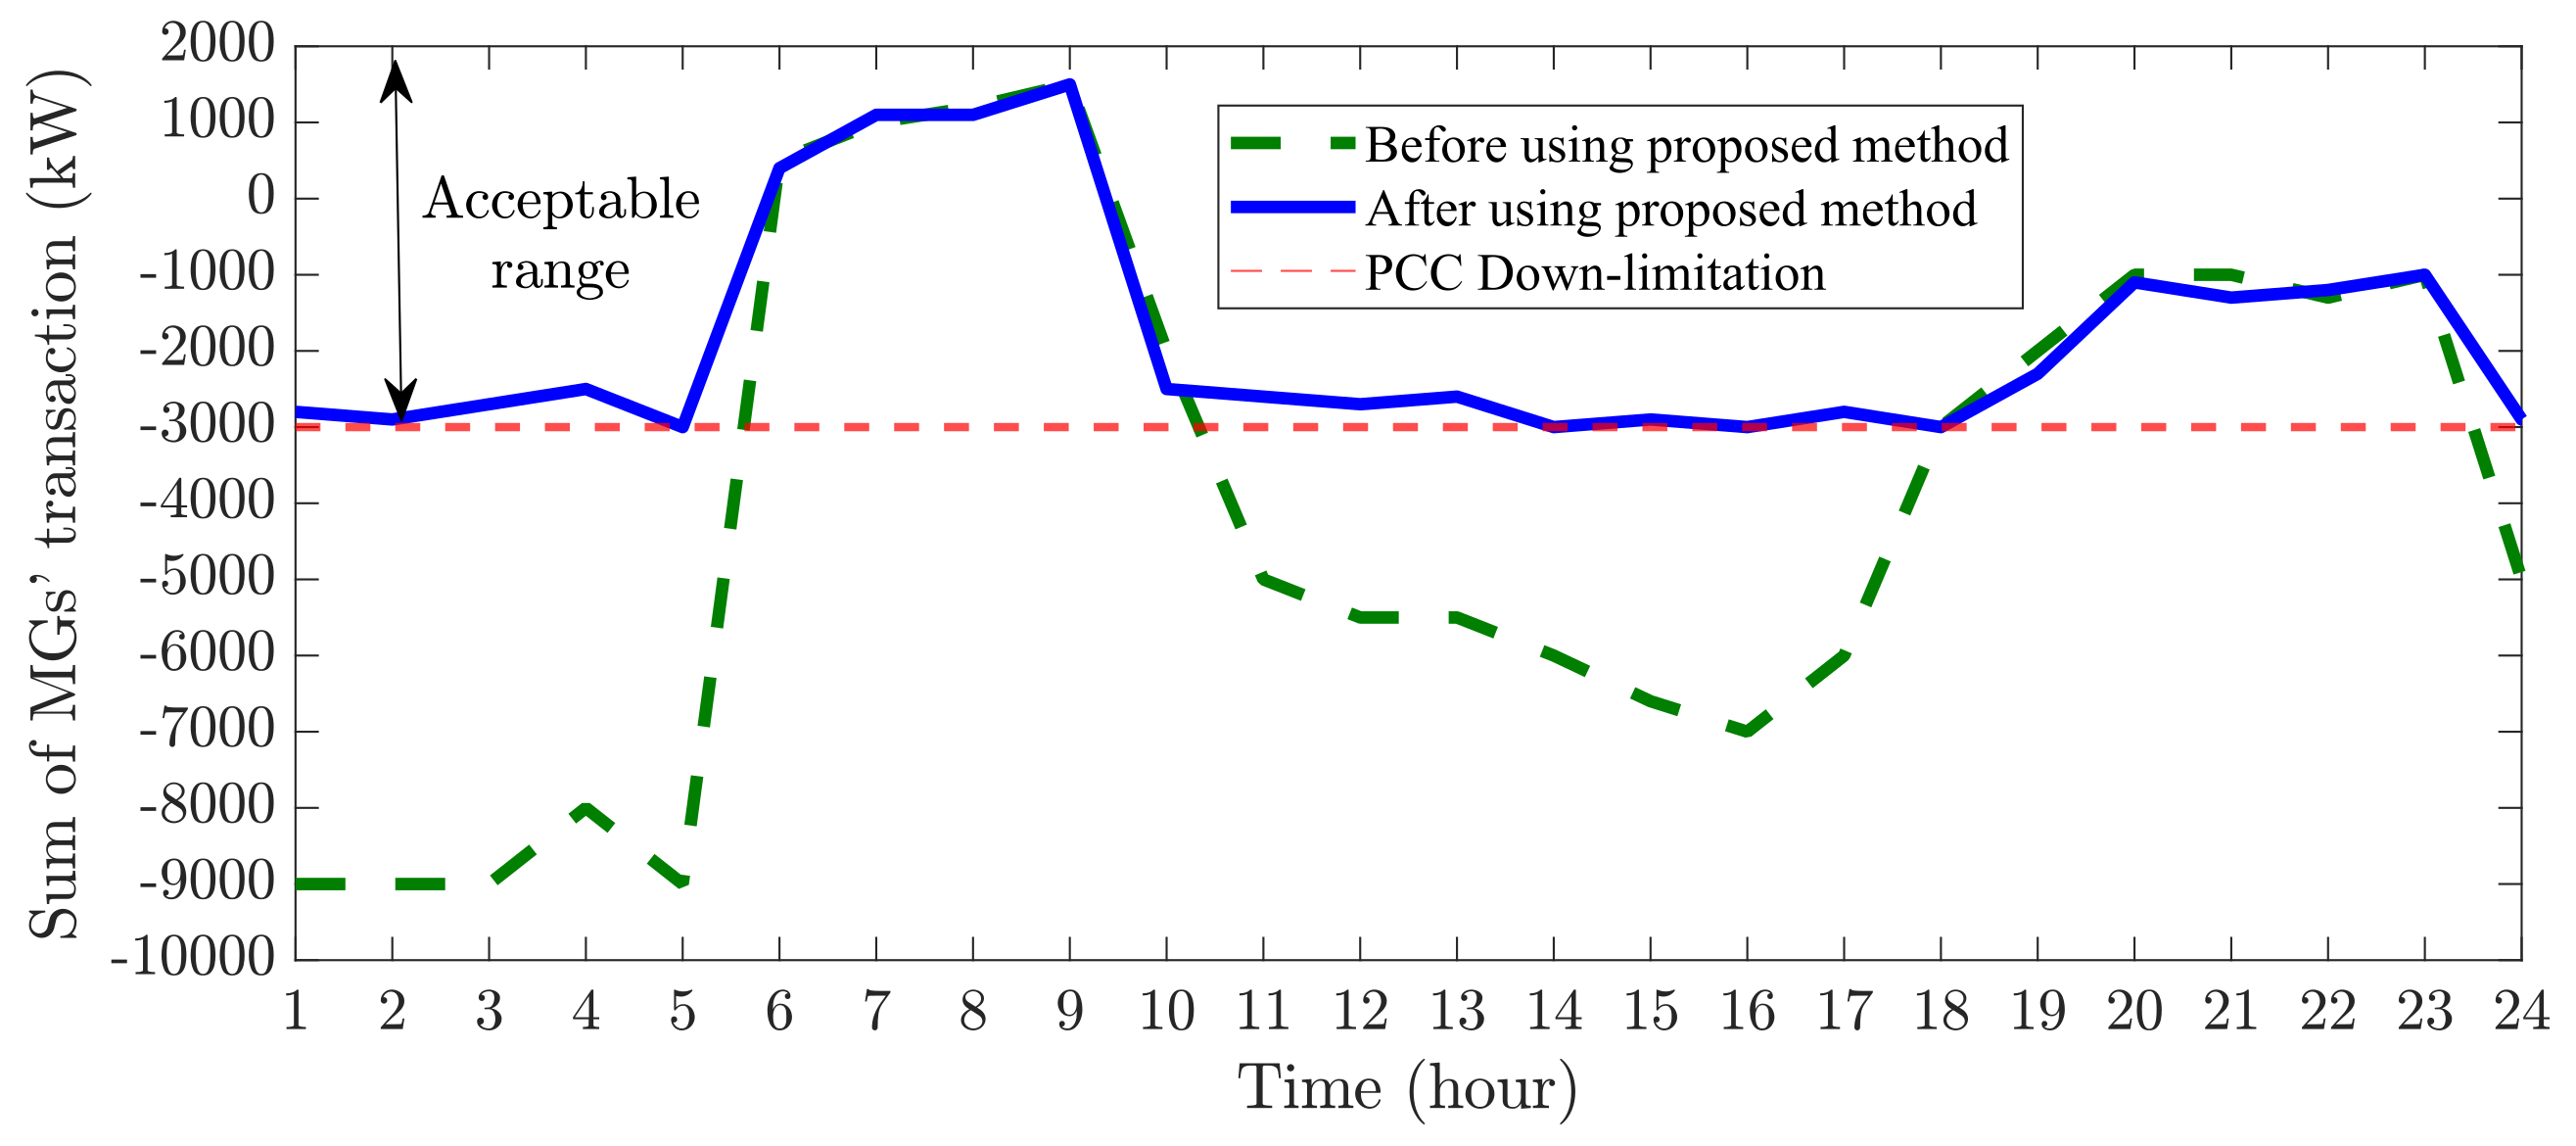
Conversely, the winter scenario, depicted in Figure 16, presented different challenges due to decreased solar energy availability and increased heating demands, leading to frequent exceedances of the lower PCC limit. The proposed method adeptly managed PCC congestion through the flexible operation of hydrogen storage systems, which balanced the energy supply, especially when renewable generation was insufficient. This scenario underscores the versatility and effectiveness of our model in handling seasonal fluctuations in energy demand and generation, affirming the proposed method as a reliable solution for PCC congestion across diverse environmental conditions.

Figure 16.
Energy transactions between MMG and the grid on 14th day of the second month in winter.
4. Conclusions
This paper introduces a hydrogen-integrated aggregator model designed to manage congestion at the PCC in green MMGs. The key findings of this study are summarized below:
- The common approach to maintaining data privacy in microgrids involves the sharing of PCC capacity among them. The simulation results suggest that the proposed model boosts the multi-microgrid group’s profit by 6.1% compared to the conventional sharing method.
- Implementing a centralized energy management system provides an optimal solution. It should be noted that such systems require sharing of data from microgrids, potentially compromising data privacy. Nonetheless, our proposed model upholds data privacy. The simulations indicate that our method results in a 4.9% reduction in profit compared to the optimal solution.
- A comparative analysis validated the proposed method against previous studies, showing that it enhances profit margins, as outlined in Table 4. Tested in both summer and winter scenarios, the method effectively managed PCC congestion by enabling the microgrids to optimize their energy transactions. In the summer, excess photovoltaic output led to PCC capacity exceedances, which the method successfully mitigated. In the winter, the method addressed the lower PCC limit exceedances caused by reduced solar availability and higher heating demands, demonstrating its versatility across diverse conditions.
Looking forward, our future research will explore congestion management using hydrogen storage systems, with a particular focus on the available hydrogen volume in storage tanks. We plan to use high-capacity hydrogen storage, especially underground hydrogen storage (UHS), to manage congestion effectively in larger power systems, including distribution networks and power grids.
Author Contributions
Conceptualization, F.K. and J.L.; methodology, F.K. and J.L.; software (MATLAB version R2023 and GAMS version 30.3) , F.K.; validation, F.K. and J.L.; formal analysis, F.K.; investigation, F.K.; resources, F.K.; data curation, F.K.; writing—original draft, F.K.; writing—review and editing, F.K. and J.L.; visualization, F.K.; supervision, J.L.; project administration, F.K. and J.L.; funding acquisition, J.L. All authors have read and agreed to the published version of the manuscript.
Funding
This research was supported by the Basic Science Research Program through the National Research Foundation of Korea (NRF), funded by the Ministry of Science and ICT (2021R1A4A3025742).
Data Availability Statement
The data will be made available upon request and can also be https://sendanywhe.re/BL4VOCN6 (accessed on 10 August 2024).
Acknowledgments
In the process of writing this article, the authors were fortunate to receive invaluable insights from Ehsan Hajipour, whose expertise on the subject matter greatly enriched this discussion. The authors are profoundly grateful for their thoughtful contributions.
Conflicts of Interest
The authors declare no conflicts of interest.
Nomenclature
| Conversion coefficient of HSS | |
| Grid electricity price | |
| Electrical demand price | |
| Hydrogen demand price | |
| Hydrogen price | |
| Lagrange multipliers | |
| Shapley value for each microgrid | |
| Virtual price variation | |
| Maximum and minimum value of virtual price variation | |
| Optimal virtual price variation | |
| Probability of scenario s | |
| b | Value of each coalition |
| j | Index of microgrid |
| J | Set of microgrids |
| Set of scenarios and hours | |
| PV power output | |
| WT power output | |
| Transaction power between and grid | |
| Power demand | |
| Charging/discharging power of HSS | |
| PCC capacity | |
| Power buying/selling from/to the grid | |
| Maximum HSS charging/discharging power | |
| s | Index for scenarios |
| S | Microgrid’s profit |
| State of charge for HSS | |
| Minimum state of charge for HSS | |
| Hydrogen demand | |
| Maximum state of charge for HSS | |
| t | Index of hour |
| x | Number of MGs in the coalition |
Appendix A
If constraints (12)–(15) are satisfied, the microgrid’s optimal scheduling will be approved by the HMS. Applying KKT conditions to Equations (10) and (12) to (15) would result in the following:
Derivation of (10) yields (A14).
According to (A14):
Based to (A1):
If , all constraints are respected.
If , , then based on (A15) and (A16):
If , , then based on (A15) and (A16):
If , , then based on (A15) and (A16):
If , then based on (A15) and (A16):
And consequently,
represents a virtual hydrogen price that could be announced to the microgrids’ EMSs. It is observed that is a function of the hydrogen price (). Therefore, it could be concluded that is defined such that . Hence, the HMS can announce prices to the centralized EMSs to control the transmitted power between the multi-microgrids and the grid. To stay anchored to the optimal points, fluctuations in the hydrogen price must be minimized. The proof presented herein is developed based on the methodologies described in refs. [4,11].
References
- Hussain, A.; Bui, V.H.; Kim, H.M. A resilient and privacy-preserving energy management strategy for networked microgrids. IEEE Trans. Smart Grid 2016, 9, 2127–2139. [Google Scholar] [CrossRef]
- Zhang, B.; Li, Q.; Wang, L.; Feng, W. Robust optimization for energy transactions in multi-microgrids under uncertainty. Appl. Energy 2018, 217, 346–360. [Google Scholar] [CrossRef]
- Kovaltchouk, T.; Blavette, A.; Aubry, J.; Ahmed, H.B.; Multon, B. Comparison between centralized and decentralized storage energy management for direct wave energy converter farm. IEEE Trans. Energy Convers. 2016, 31, 1051–1058. [Google Scholar] [CrossRef]
- Khavari, F.; Badri, A.; Zangeneh, A. A tie-line power smoothing via a novel dynamic real-time pricing mechanism in MMGs. Int. J. Electr. Power Energy Syst. 2022, 217, 107671. [Google Scholar] [CrossRef]
- Hosseini, A.; Mirzapour-Kamanaj, A.; Kazemzadeh, R.; Zare, K.; Mohammadi-Ivatloo, B. Congestion management for coordinated electricity and gas grids in the presence of multi-energy hubs: A risk-based optimal scheduling. Sustain. Energy Grids Netw. 2023, 36, 101153. [Google Scholar] [CrossRef]
- Gumpu, S.; Pamulaparthy, B.; Sharma, A. Review of congestion management methods from conventional to smart grid scenario. Int. J. Emerg. Electr. Power Syst. 2019, 20, 20180265. [Google Scholar] [CrossRef]
- Saber, H.; Ranjbar, H.; Hajipour, E.; Shahidehpour, M. Two-Stage Coordination Scheme for Multiple EV Charging Stations Connected to an Exclusive DC Feeder Considering Grid-Tie Converter Limitation. IEEE Trans. Transp. Electrif. 2024, 1, 11. [Google Scholar] [CrossRef]
- Said, S.M.; Ali, A.; Hartmann, B. Tie-line power flow control method for grid-connected microgrids with SMES based on optimization and fuzzy logic. J. Mod. Power Syst. Clean Energy 2020, 8, 941–950. [Google Scholar] [CrossRef]
- Khanabadi, M.; Fu, Y.; Liu, C. Decentralized transmission line switching for congestion management of interconnected power systems. IEEE Trans. Power Syst. 2018, 33, 5902–5912. [Google Scholar] [CrossRef]
- Khavari, F.; Badri, A.; Zangeneh, A. Energy management in multi-microgrids considering point of common coupling constraint. Int. J. Electr. Power Energy Syst. 2020, 115, 105465. [Google Scholar] [CrossRef]
- Khavari, F.; Badri, A.; Zangeneh, A. Energy management in multi-microgrids via an aggregator to override point of common coupling congestion. IET Gener. Transm. Distrib. 2019, 13, 634642. [Google Scholar] [CrossRef]
- Yue, M.; Lambert, H.; Pahon, E.; Roche, R.; Jemei, S.; Hissel, D. Hydrogen energy systems: A critical review of technologies, applications, trends and challenges. Renew. Sustain. Energy Rev. 2021, 146, 111180. [Google Scholar] [CrossRef]
- AL Shaqsi, A.Z.; Sopian, K.; Al-Hinai, A. Review of energy storage services, applications, limitations, and benefits. Energy Rep. 2020, 6, 288–306. [Google Scholar] [CrossRef]
- Bocklisch, T. Hybrid energy storage approach for renewable energy applications. J. Energy Storage 2016, 8, 2127–2139. [Google Scholar] [CrossRef]
- Mehrjerdi, H.; Iqbal, A.; Rakhshani, E.; Torres, J.R. Daily-seasonal operation in net-zero energy building powered by hybrid renewable energies and hydrogen storage systems. Energy Convers. Manag. 2019, 201, 112156. [Google Scholar] [CrossRef]
- Ban, M.; Yu, J.; Shahidehpour, M.; Yao, Y. Integration of power-to-hydrogen in dayahead security-constrained unit commitment with high wind penetration. J. Mod. Power Syst. Clean Energy 2017, 5, 337–349. [Google Scholar] [CrossRef]
- Aghdam, F.H.; Mudiyanselage, M.W.; Mohammadi-Ivatloo, B.; Marzband, M. Optimal scheduling of multi-energy type virtual energy storage system in reconfigurable distribution networks for congestion management. Appl. Energy 2023, 333, 120569. [Google Scholar] [CrossRef]
- Yu, L.; Xu, Z.; Guan, X.; Zhao, Q.; Dou, C.; Yue, D. Joint optimization and learning approach for smart operation of hydrogen-based building energy systems. IEEE Trans. Smart Grid 2022, 97, 199–216. [Google Scholar] [CrossRef]
- Sundararajan, M.; Najmi, A. The many Shapley values for model explanation. Int. Conf. Mach. Learn. 2020, 217, 9269–9278. [Google Scholar]
- Khaligh, V.; Anvari-Moghaddam, A. Stochastic expansion planning of gas and electricity networks: A decentralized-based approach. Energy 2019, 186, 115889. [Google Scholar] [CrossRef]
- Australian Energy Market Operator. Available online: https://www.aemo.com.au/ (accessed on 8 May 2024).
- Tostado-Véliz, M.; Arévalo, P.; Jurado, F. A comprehensive electrical-gas-hydrogen Microgrid model for energy management applications. Energy Convers. Manag. 2021, 288, 113726. [Google Scholar] [CrossRef]

Disclaimer/Publisher’s Note: The statements, opinions and data contained in all publications are solely those of the individual author(s) and contributor(s) and not of MDPI and/or the editor(s). MDPI and/or the editor(s) disclaim responsibility for any injury to people or property resulting from any ideas, methods, instructions or products referred to in the content. |
© 2024 by the authors. Licensee MDPI, Basel, Switzerland. This article is an open access article distributed under the terms and conditions of the Creative Commons Attribution (CC BY) license (https://creativecommons.org/licenses/by/4.0/).