
Profitability Analyses for Residential Battery Investments: A Norwegian Case Study


Abstract
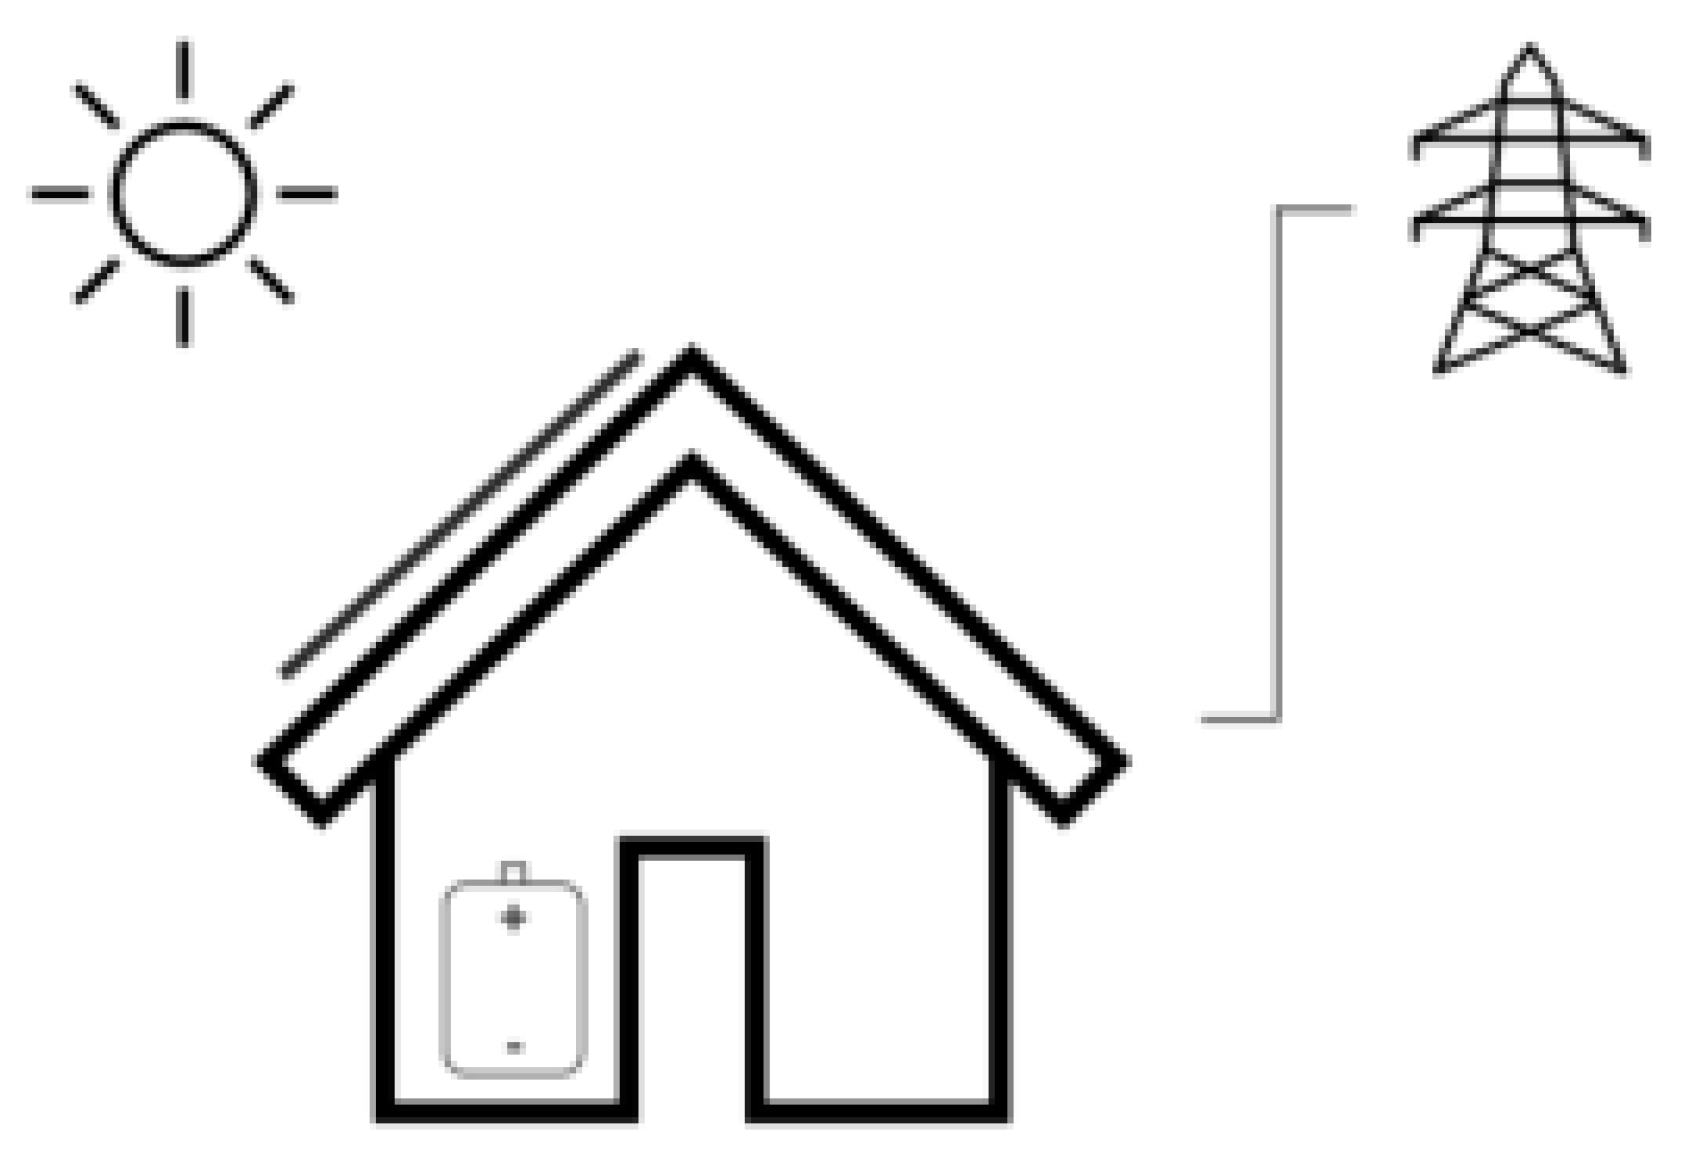
1. Introduction
2. Electricity Price and Consumption Data
2.1. Electricity Price Data
2.2. Consumption Data
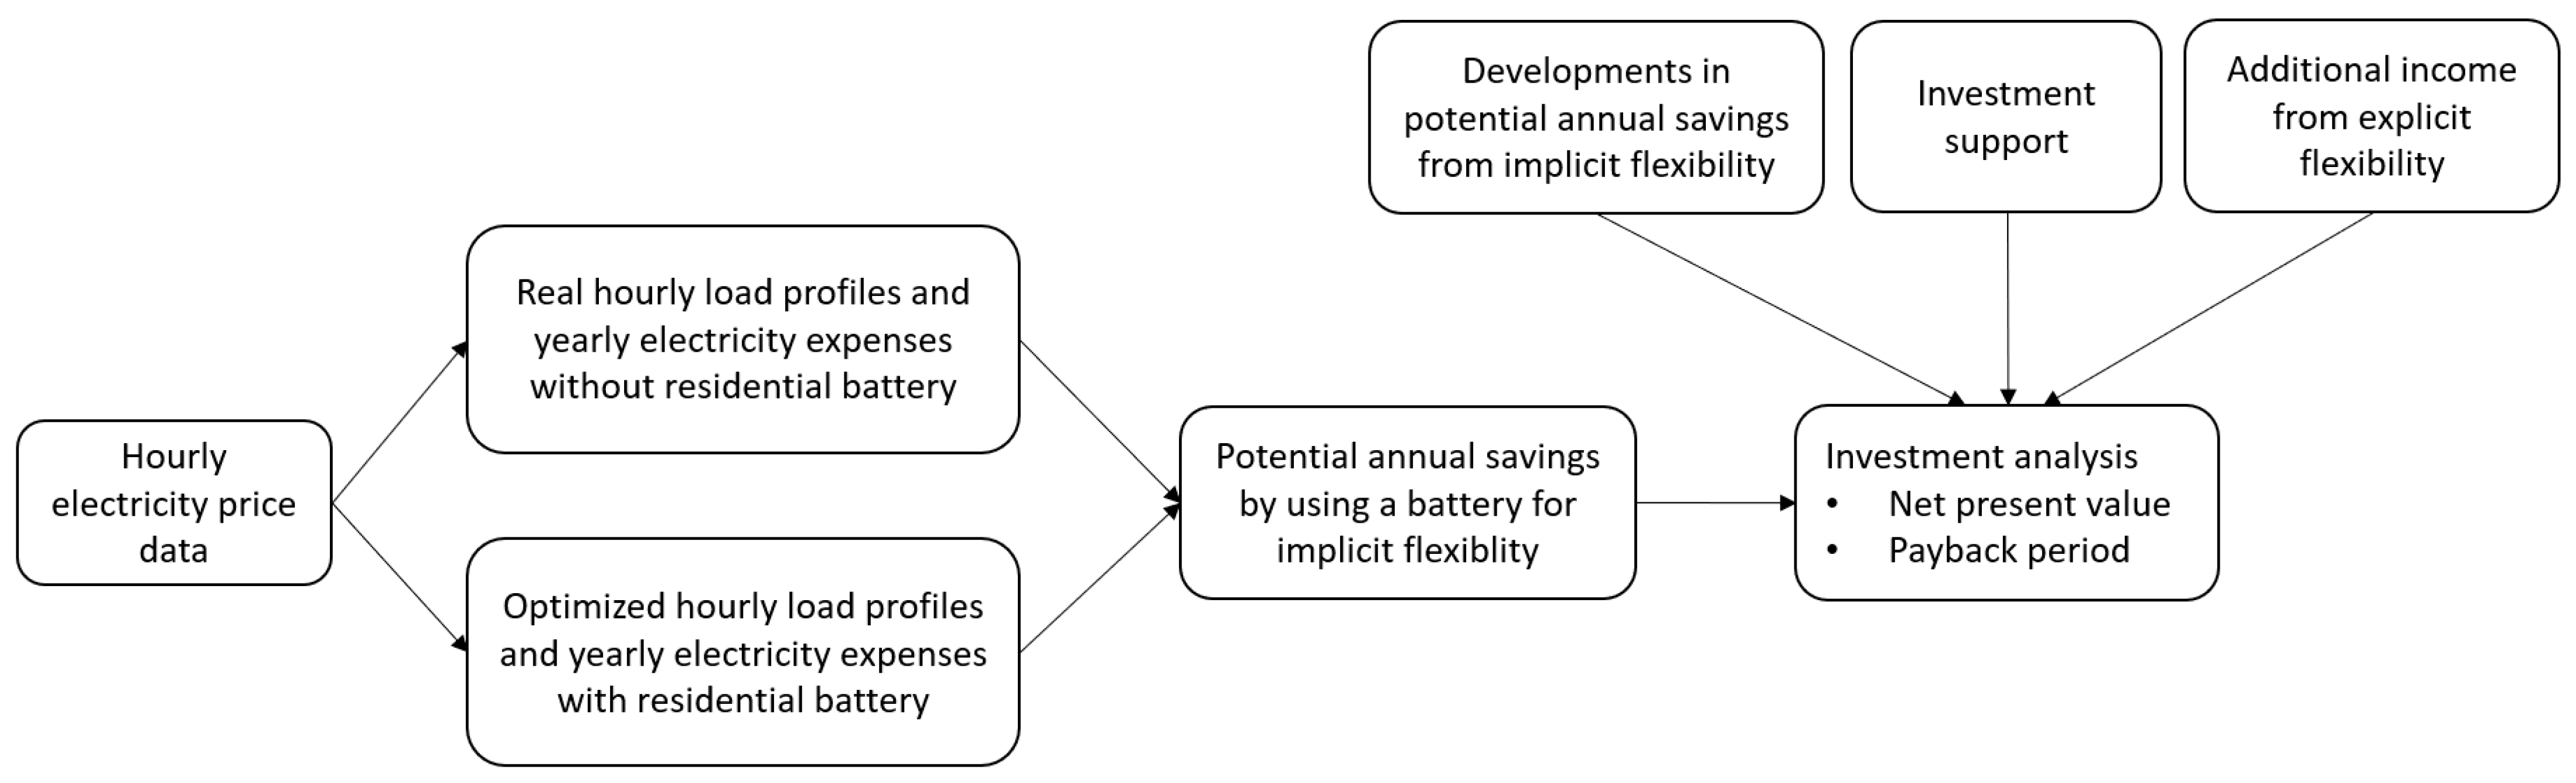
3. Methodology
3.1. Optimization Model
3.2. Profitability Analysis
4. Results and Discussion
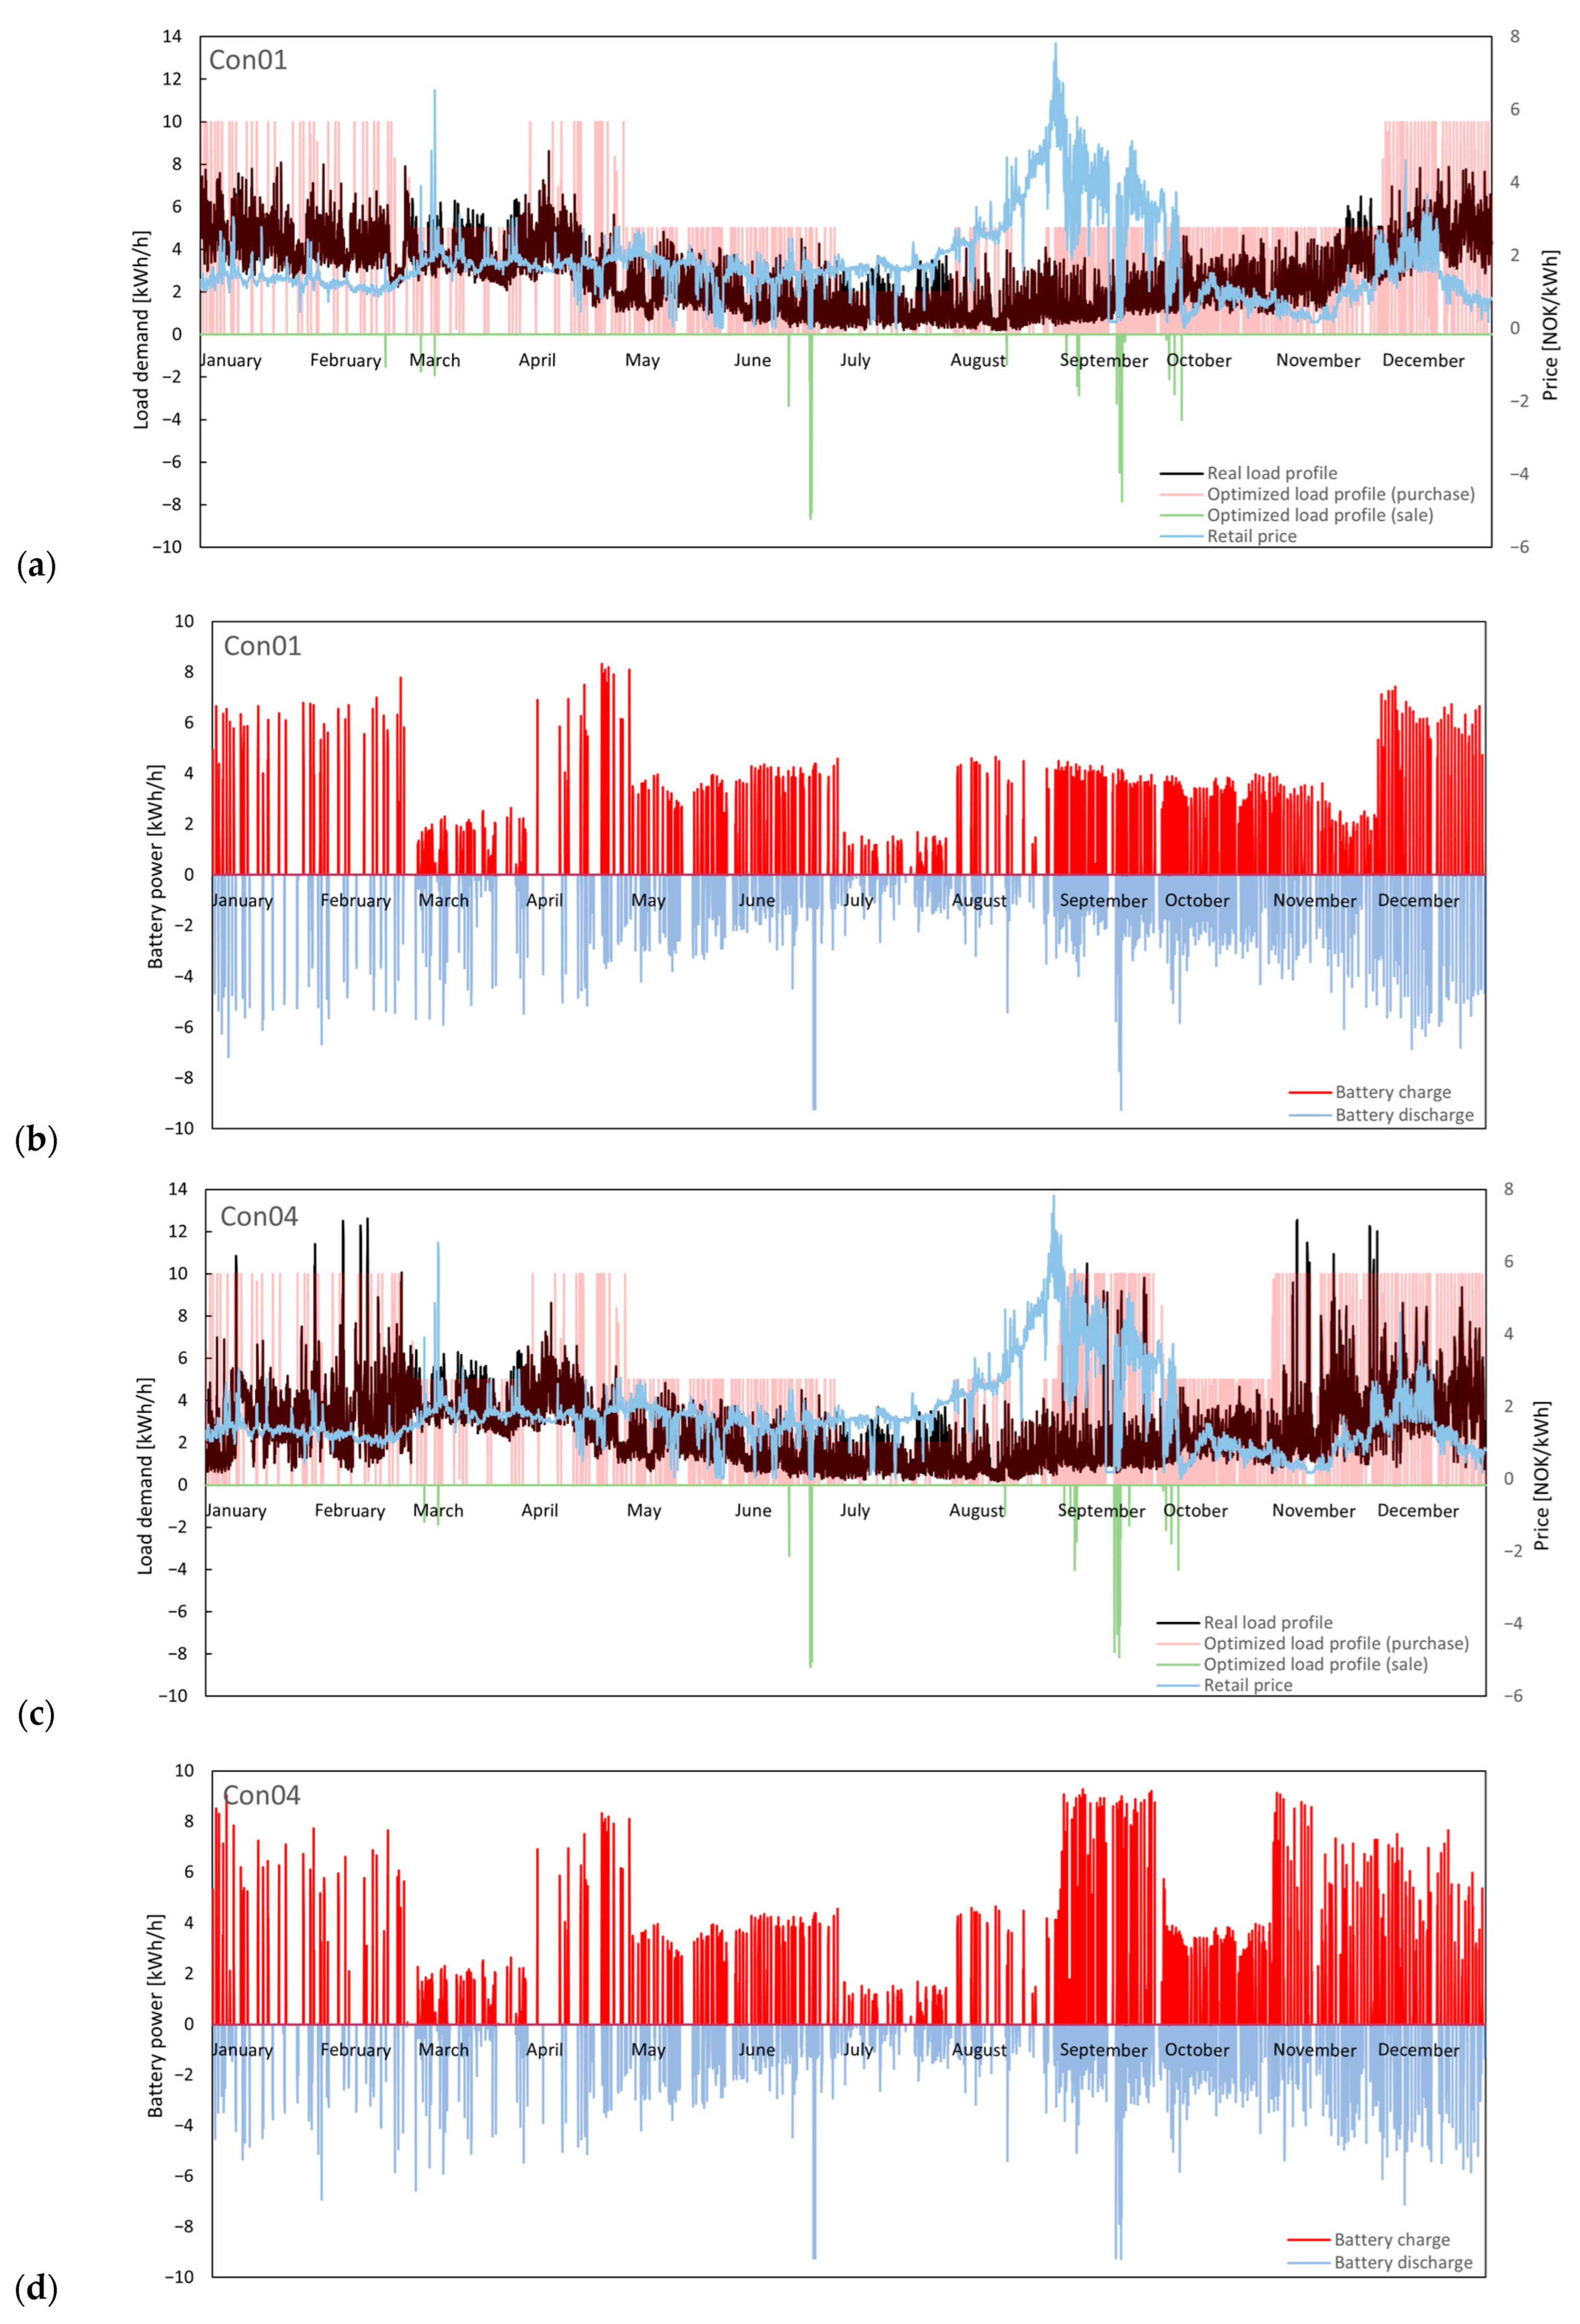
4.1. Optimized Load Profile
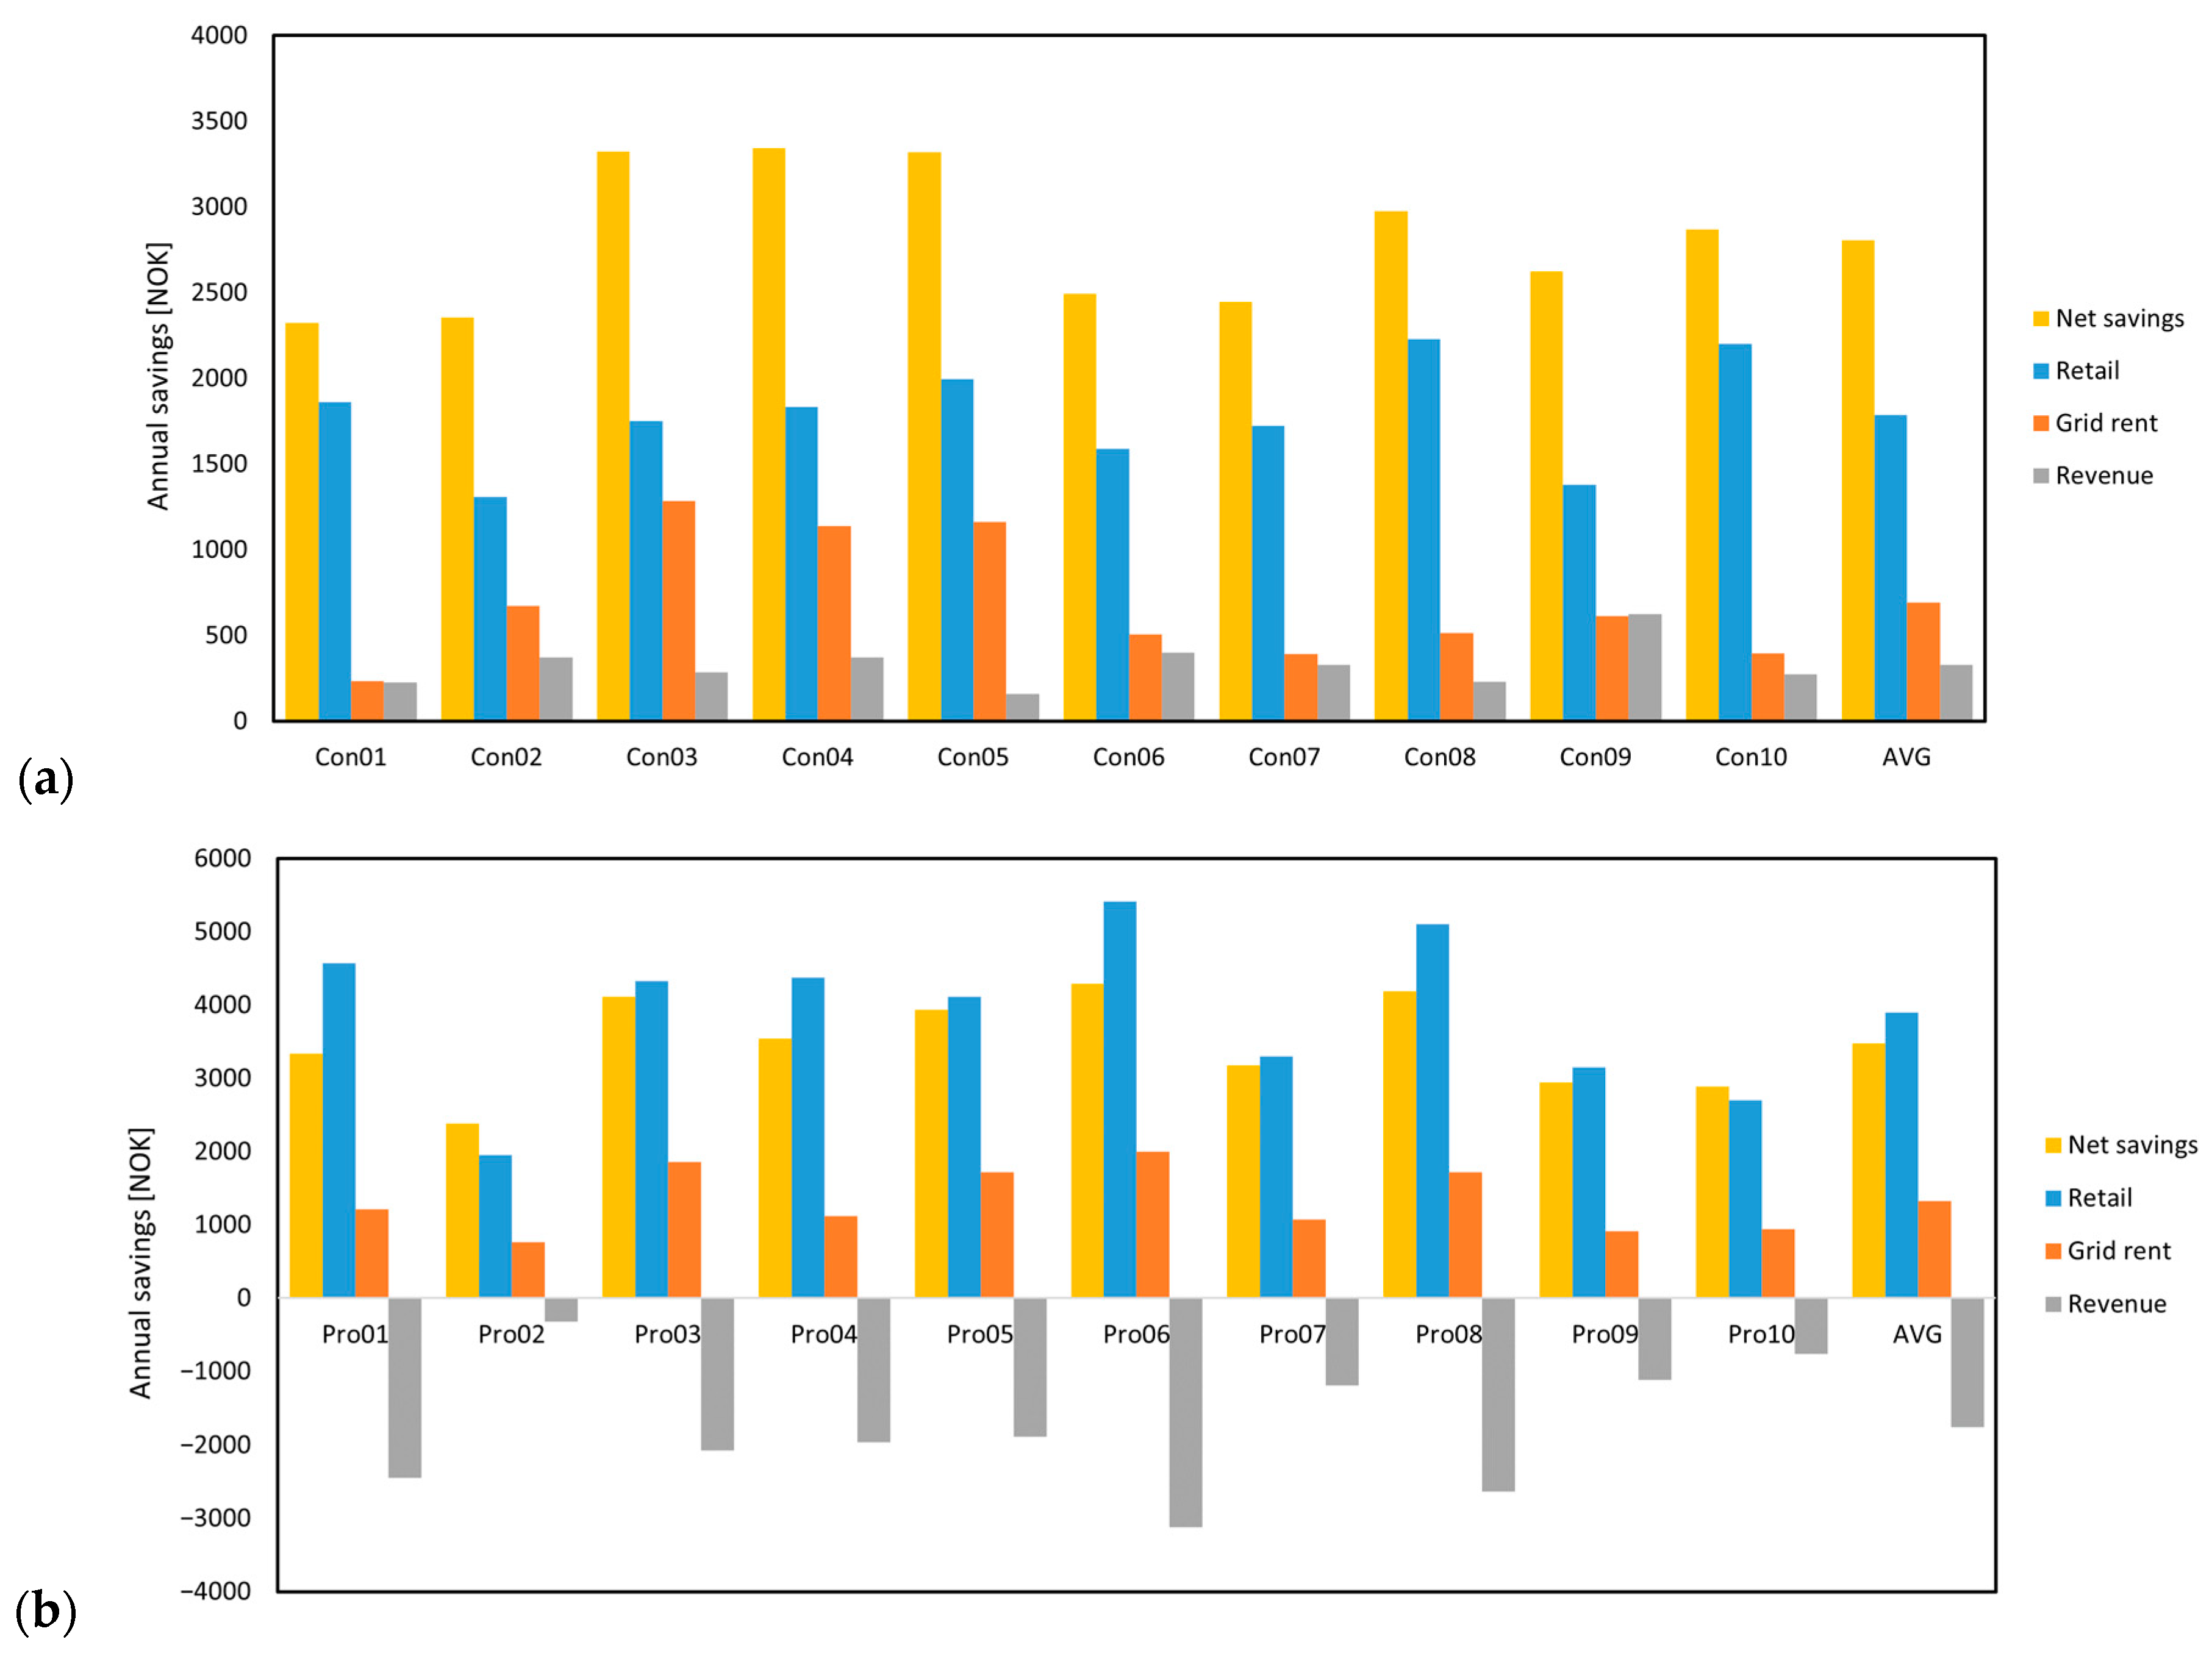
4.2. Annual Savings
4.3. Profitability Analyses
5. Conclusions
Author Contributions
Funding
Data Availability Statement
Conflicts of Interest
References
- Bouckaert, S.; Pales, A.F.; McGlade, C.; Remme, U.; Wanner, B.; Varro, L.; D’Ambrosio, D.; Spencer, T. Net Zero by 2050: A Roadmap for the Global Energy Sector; International Energy Agency: Paris, France, 2021. [Google Scholar]
- IEA. World Energy Outlook 2022; IEA: Paris, France, 2022. [Google Scholar]
- Mlilo, N.; Brown, J.; Ahfock, T. Impact of intermittent renewable energy generation penetration on the power system networks—A review. Technol. Econ. Smart Grids Sustain. Energy 2021, 6, 25. [Google Scholar] [CrossRef]
- Degefa, M.Z.; Sperstad, I.B.; Sæle, H. Comprehensive classifications and characterizations of power system flexibility resources. Electr. Power Syst. Res. 2021, 194, 107022. [Google Scholar] [CrossRef]
- Coalition, S.E.D. Explicit and Implicit Demand-Side Flexibility: Complementary Approaches for an Efficient Energy System; Position Paper; Smart Energy Deman Coalition: Brussels, Belgium, September 2016. [Google Scholar]
- Laan, E.K.M.v.d. Energy and Flexibility Services for Citizens Energy Communities; USEF White Paper; USEF: Arnhem, The Netherlands, 2019. [Google Scholar]
- Enrich, J.; Li, R.; Mizrahi, A.; Reguant, M. Measuring the impact of time-of-use pricing on electricity consumption: Evidence from Spain. J. Environ. Econ. Manag. 2024, 123, 102901. [Google Scholar] [CrossRef]
- Bartusch, C.; Wallin, F.; Odlare, M.; Vassileva, I.; Wester, L. Introducing a demand-based electricity distribution tariff in the residential sector: Demand response and customer perception. Energy Policy 2011, 39, 5008–5025. [Google Scholar] [CrossRef]
- Hofmann, M.; Lindberg, K.B. Residential demand response and dynamic electricity contracts with hourly prices: A study of Norwegian households during the 2021/22 energy crisis. Smart Energy 2024, 13, 100126. [Google Scholar] [CrossRef]
- Pon, S. The effect of information on TOU electricity use: An irish residential study. Energy J. 2017, 38, 55–79. [Google Scholar] [CrossRef]
- Vanthournout, K.; Dupont, B.; Foubert, W.; Stuckens, C.; Claessens, S. An automated residential demand response pilot experiment, based on day-ahead dynamic pricing. Appl. Energy 2015, 155, 195–203. [Google Scholar] [CrossRef]
- Freire-Barceló, T.; Martín-Martínez, F.; Sánchez-Miralles, Á. A literature review of Explicit Demand Flexibility providing energy services. Electr. Power Syst. Res. 2022, 209, 107953. [Google Scholar] [CrossRef]
- Leadbetter, J.; Swan, L. Battery storage system for residential electricity peak demand shaving. Energy Build. 2012, 55, 685–692. [Google Scholar] [CrossRef]
- Hoppmann, J.; Volland, J.; Schmidt, T.S.; Hoffmann, V.H. The economic viability of battery storage for residential solar photovoltaic systems—A review and a simulation model. Renew. Sustain. Energy Rev. 2014, 39, 1101–1118. [Google Scholar] [CrossRef]
- Jankowiak, C.; Zacharopoulos, A.; Brandoni, C.; Keatley, P.; MacArtain, P.; Hewitt, N. Assessing the benefits of decentralised residential batteries for load peak shaving. J. Energy Storage 2020, 32, 101779. [Google Scholar] [CrossRef]
- Nieta, A.A.S.d.l.; Ilieva, I.; Gibescu, M.; Bremdal, B.; Simonsen, S.; Gramme, E. Optimal midterm peak shaving cost in an electricity management system using behind customers’ smart meter configuration. Appl. Energy 2021, 283, 116282. [Google Scholar] [CrossRef]
- Goop, J.; Nyholm, E.; Odenberger, M.; Johnsson, F. Impact of electricity market feedback on investments in solar photovoltaic and battery systems in Swedish single-family dwellings. Renew. Energy 2021, 163, 1078–1091. [Google Scholar] [CrossRef]
- Uddin, M.; Romlie, M.F.; Abdullah, M.F.; Abd Halim, S.; Kwang, T.C. A review on peak load shaving strategies. Renew. Sustain. Energy Rev. 2018, 82, 3323–3332. [Google Scholar] [CrossRef]
- Nguyen, T.A.; Byrne, R.H. Maximizing the cost-savings for time-of-use and net-metering customers using behind-the-meter energy storage systems. In Proceedings of the 2017 North American Power Symposium (NAPS), Morgantown, WV, USA, 17–19 September 2017; pp. 708–713. [Google Scholar]
- Ahčin, P.; Berg, K.; Petersen, I. Techno-economic analyis of battery storage for peak shaving and frequency containment reserve. In Proceedings of the 2019 16th International Conference on the European Energy Market (EEM), Ljubljana, Slovenia, 18–20 September 2019; pp. 338–342. [Google Scholar]
- Mulder, G.; Six, D.; Claessens, B.; Broes, T.; Omar, N.; Mierlo, J.V. The dimensioning of PV-battery systems depending on the incentive and selling price conditions. Appl. Energy 2013, 111, 1126–1135. [Google Scholar] [CrossRef]
- Berg, K.; Resch, M.; Weniger, T.; Simonsen, S. Economic evaluation of operation strategies for battery systems in football stadiums: A Norwegian case study. J. Energy Storage 2021, 34, 102190. [Google Scholar] [CrossRef]
- Alavi, O.; Despeghel, J.; Ceuninck, W.D.; Meuris, M.; Driesen, J.; Daenen, M. Economic Study of Battery Profitability in Residential Solar Panel Systems: A Case Study of Belgium. In Proceedings of the 2020 IEEE 14th International Conference on Compatibility, Power Electronics and Power Engineering (CPE-POWERENG), Setúbal, Portugal, 8–10 July 2020; Volume 1, pp. 358–363. [Google Scholar]
- Uddin, K.; Gough, R.; Radcliffe, J.; Marco, J.; Jennings, P. Techno-economic analysis of the viability of residential photovoltaic systems using lithium-ion batteries for energy storage in the United Kingdom. Appl. Energy 2017, 206, 12–21. [Google Scholar] [CrossRef]
- Mauler, L.; Duffner, F.; Zeier, W.G.; Leker, J. Battery cost forecasting: A review of methods and results with an outlook to 2050. Energy Environ. Sci. 2021, 14, 4712–4739. [Google Scholar] [CrossRef]
- Naumann, M.; Karl, R.C.; Truong, C.N.; Jossen, A.; Hesse, H.C. Lithium-ion Battery Cost Analysis in PV-household Application. Energy Procedia 2015, 73, 37–47. [Google Scholar] [CrossRef]
- Schopfer, S.; Tiefenbeck, V.; Staake, T. Economic assessment of photovoltaic battery systems based on household load profiles. Appl. Energy 2018, 223, 229–248. [Google Scholar] [CrossRef]
- Madlener, R.; Kirmas, A. Economic Viability of Second Use Electric Vehicle Batteries for Energy Storage in Residential Applications. Energy Procedia 2017, 105, 3806–3815. [Google Scholar] [CrossRef]
- Topalović, Z.; Haas, R.; Ajanović, A.; Sayer, M. Prospects of electricity storage. Renew. Energy Environ. Sustain. 2023, 8, 2. [Google Scholar] [CrossRef]
- Al Khafaf, N.; Rezaei, A.A.; Moradi Amani, A.; Jalili, M.; McGrath, B.; Meegahapola, L.; Vahidnia, A. Impact of battery storage on residential energy consumption: An Australian case study based on smart meter data. Renew. Energy 2022, 182, 390–400. [Google Scholar] [CrossRef]
- Su, R.; He, G.; Su, S.; Duan, Y.; Cheng, J.; Chen, H.; Wang, K.; Zhang, C. Optimal placement and capacity sizing of energy storage systems via NSGA-II in active distribution network. Front. Energy Res. 2023, 10, 1073194. [Google Scholar] [CrossRef]
- Kobou Ngani, P.; Hadji-Minaglou, J.-R. Model Predictive Control for Residential Battery Storage System: Profitability Analysis. Batteries 2023, 9, 316. [Google Scholar] [CrossRef]
- The Power Market. 2023. Available online: https://energifaktanorge.no/en/norsk-energiforsyning/kraftmarkedet/ (accessed on 6 May 2024).
- Spotpriser Time for Time Fra Strømbørsen Nord Pool. Available online: https://www.forbrukerradet.no/strompris/spotpriser (accessed on 15 January 2024).
- Norway, S. Electricity Prices. Available online: https://www.ssb.no/en/energi-og-industri/energi/statistikk/elektrisitetspriser (accessed on 25 October 2023).
- Eliva. Grid Rent Prices for Private Customers. 2023. Available online: https://www.elvia.no/hva-er-elvia/elvia-transports-the-electricity-to-your-home/grid-rent-prices-for-private-customers/ (accessed on 15 January 2024).
- Cevik, S.; Ninomiya, K. Chasing the sun and catching the wind: Energy transition and electricity prices in Europe. J. Econ. Financ. 2023, 47, 912–935. [Google Scholar] [CrossRef]
- Bjarghov, S.; Farahmand, H.; Doorman, G. Capacity subscription grid tariff efficiency and the impact of uncertainty on the subscribed level. Energy Policy 2022, 165, 112972. [Google Scholar] [CrossRef]
- Haugneland, P.; Lorentzen, E.; Bu, C.; Hauge, E. Put a price on carbon to fund EV incentives–Norwegian EV policy success. In Proceedings of the EVS30 Symposium, Stuttgart, Germany, 9–11 October 2017. [Google Scholar]
- Dusonchet, L.; Telaretti, E. Comparative economic analysis of support policies for solar PV in the most representative EU countries. Renew. Sustain. Energy Rev. 2015, 42, 986–998. [Google Scholar] [CrossRef]
- Minniti, S.; Haque, N.; Nguyen, P.; Pemen, G. Local markets for flexibility trading: Key stages and enablers. Energies 2018, 11, 3074. [Google Scholar] [CrossRef]
- Modig, N.; Eriksson, R.; Ruokolainen, P.; Ødegård, J.N.; Weizenegger, S.; Fechtenburg, T.D. Overview of Frequency Control in the Nordic Power System; Nordic Analysis Group: Brussels, Belgium, 2022. [Google Scholar]
- Ramos, A.; De Jonghe, C.; Gómez, V.; Belmans, R. Realizing the smart grid’s potential: Defining local markets for flexibility. Util. Policy 2016, 40, 26–35. [Google Scholar] [CrossRef]
- Ding, B.; Li, Z.; Li, Z.; Xue, Y.; Chang, X.; Su, J.; Jin, X.; Sun, H. A CCP-based distributed cooperative operation strategy for multi-agent energy systems integrated with wind, solar, and buildings. Appl. Energy 2024, 365, 123275. [Google Scholar] [CrossRef]
- Wang, Z.-H.; Ren, X.-Y.; Cui, H.-J.; Wang, W.-Q.; Liu, J.; He, Z.-F. A multi-stage two-layer stochastic design model for integrated energy systems considering multiple uncertainties. Energy 2024, 304, 131729. [Google Scholar] [CrossRef]


| Capacity Step [kW] | Fixed Monthly Fee | Energy Charge Day (06:00–22:00) | Energy Charge Night (22:00–06:00) and Weekend | |
|---|---|---|---|---|
| Step 1 | 0–2 kW | 125 NOK | 0.4310 NOK/kWh | 0.3685 NOK/kWh |
| Step 2 | 2–5 kW | 200 NOK | ||
| Step 3 | 5–10 kW | 325 NOK | ||
| Step 4 | 10–15 kW | 450 NOK | ||
| Step 5 | 15–20 kW | 575 NOK | ||
| Con01 | Con02 | Con03 | Con04 | Con05 | Con06 | Con07 | Con08 | Con09 | Con10 | |
|---|---|---|---|---|---|---|---|---|---|---|
| Yearly electricity demand [kWh] | 23,773 | 15,028 | 17,548 | 22,581 | 28,151 | 25,011 | 19,482 | 36,188 | 25,608 | 37,078 |
| Maximum peak load demand [kWh/h] | 8.62 | 5.70 | 8.74 | 12.63 | 11.88 | 11.72 | 10.67 | 14.36 | 11.84 | 20.13 |
| Average peak load demand [kWh/h] | 2.71 ±1.53 | 1.72 ±0.99 | 2.00 ±1.14 | 2.58 ±1.96 | 3.21 ±1.95 | 2.86 ±2.02 | 2.22 ±1.80 | 4.13 ±2.22 | 2.92 ±2.29 | 4.23 ±3.30 |
| Pro01 | Pro02 | Pro03 | Pro04 | Pro05 | Pro06 | Pro07 | Pro08 | Pro09 | Pro10 | |
|---|---|---|---|---|---|---|---|---|---|---|
| PV installation [kWp] | 10 | 2.5 | 4.3 | 7.7 | 9.3 | 8.3 | 3.2 | 9.7 | 3.3 | 3.5 |
| Yearly electricity import [kWh] | 10,972 | 10,215 | 19,286 | 20,734 | 20,125 | 14,120 | 19,960 | 22,067 | 16,734 | 11,995 |
| Maximum peak load import [kWh/h] | 10.85 | 5.2 | 18.3 | 16.98 | 16.56 | 8.65 | 10.08 | 12.08 | 9.3 | 9.18 |
| Average peak load import [kWh/h] | 1.25 ±1.37 | 1.17 ±0.87 | 2.20 ±2.48 | 2.37 ±2.62 | 2.30 ±2.14 | 1.61 ±1.40 | 2.28 ±1.99 | 2.52 ±2.24 | 1.91 ±1.54 | 1.37 ±1.51 |
| Yearly electricity export [kWh] | 8128 | 615 | 2303 | 4390 | 2922 | 6151 | 1293 | 4341 | 1313 | 1846 |
| Maximum peak load export [kWh/h] | 8.38 | 1.68 | 3.19 | 6.60 | 6.47 | 8.60 | 2.28 | 7.88 | 2.49 | 2.58 |
| Average peak load export [kWh/h] | 0.93 ±1.89 | 0.07 ±0.21 | 0.26 ±0.60 | 0.50 ±1.27 | 0.38 ±0.91 | 0.70 ±1.63 | 0.15 ±0.39 | 0.50 ±1.37 | 0.15 ±0.39 | 0.21 ±0.51 |
| Parameter | Value |
|---|---|
| Charging efficiency factor | 96.03% |
| Discharging efficiency factor | 90.21% |
| Minimum battery state of charge | 0 kWh |
| Maximum battery state of charge | 10.24 kWh |
| Maximum charging power | 10 kW |
| Maximum discharging power | 10 kW |
| Degradation cost charging | 0.0002 NOK/kWh |
| Degradation cost discharging | 0.0002 NOK/kWh |
| Parameter | Value |
|---|---|
| Investment cost | 100,000 NOK |
| Economic lifetime | 15 years |
| Discount rate | 6% |
| Potential Annual Savings [NOK] | Net Present Value [NOK] | Payback Time [years] | ||
|---|---|---|---|---|
| Consumers | Lowest annual savings (Con01) | 2323 | 77,438 | 44 |
| Highest annual savings (Con04) | 3344 | 67,522 | 30 | |
| Average annual savings (Con01–Con10) | 2808 | 72,728 | 36 | |
| Prosumers | Lowest annual savings (Pro02) | 2385 | 76,836 | 42 |
| Highest annual savings (Pro06) | 4295 | 58,286 | 24 | |
| Average annual savings (Pro01–Pro10) | 3481 | 66,192 | 29 |
Disclaimer/Publisher’s Note: The statements, opinions and data contained in all publications are solely those of the individual author(s) and contributor(s) and not of MDPI and/or the editor(s). MDPI and/or the editor(s) disclaim responsibility for any injury to people or property resulting from any ideas, methods, instructions or products referred to in the content. |
© 2024 by the authors. Licensee MDPI, Basel, Switzerland. This article is an open access article distributed under the terms and conditions of the Creative Commons Attribution (CC BY) license (https://creativecommons.org/licenses/by/4.0/).
Share and Cite
Nygård, H.S.; Ottesen, S.Ø.; Skonnord, O.H. Profitability Analyses for Residential Battery Investments: A Norwegian Case Study. Energies 2024, 17, 4048. https://doi.org/10.3390/en17164048
Nygård HS, Ottesen SØ, Skonnord OH. Profitability Analyses for Residential Battery Investments: A Norwegian Case Study. Energies. 2024; 17(16):4048. https://doi.org/10.3390/en17164048
Chicago/Turabian StyleNygård, Heidi S., Stig Ødegaard Ottesen, and Olav Henrik Skonnord. 2024. "Profitability Analyses for Residential Battery Investments: A Norwegian Case Study" Energies 17, no. 16: 4048. https://doi.org/10.3390/en17164048
APA StyleNygård, H. S., Ottesen, S. Ø., & Skonnord, O. H. (2024). Profitability Analyses for Residential Battery Investments: A Norwegian Case Study. Energies, 17(16), 4048. https://doi.org/10.3390/en17164048