Article

Profitability Analyses for Residential Battery Investments: A Norwegian Case Study

by
Heidi S. Nygård
1,*,
Stig Ødegaard Ottesen
2 and
Olav Henrik Skonnord
2
1
Faculty of Science and Technology, Norwegian University of Life Sciences (NMBU), 1432 Ås, Norway
2
Smart Innovation Norway, 1783 Halden, Norway
*
Author to whom correspondence should be addressed.
Energies 2024, 17(16), 4048; https://doi.org/10.3390/en17164048
Submission received: 5 July 2024 / Revised: 6 August 2024 / Accepted: 13 August 2024 / Published: 15 August 2024
(This article belongs to the Special Issue Demand Response and Optimization Decisions for Energy Systems)

Abstract

:
With the higher penetration of intermittent renewable energy sources in the electric power grid, more flexibility is needed to cope with challenges related to stability and reliability. Consumers can be part of the solution through demand response, for example, by investing in residential batteries that can charge and discharge based on price signals (implicit flexibility) or externally controlled based on grid-related needs (explicit flexibility). In this study, we investigate the feasibility of deploying residential batteries through a case study consisting of 20 households located in south-eastern Norway. The potential annual savings from implicit flexibility are optimized based on the retail electricity price, a power-based tariff, and potential revenues by selling electricity to the grid. Real historical price and consumption data with hourly resolutions from the entire year of 2022 are used as input for the optimization, yielding a theoretical profit potential. Based on this, profitability analyses are performed. The results show that the battery investments will not reach an economic break-even point during their lifetime under today’s electricity price conditions. However, future developments in profit increase from implicit flexibility, substantial investment support, or additional revenues from emerging flexibility markets could make the investment economically attractive for a regular consumer.

1. Introduction

Replacing fossil fuel-based energy with electricity from renewable energy sources is essential for reducing greenhouse gas emissions and meeting the climate goals set by the Paris Agreement [1]. Consequently, the global electricity demand is projected to rise by 47% in the next 30 years, from about 25,000 TWh in 2020 to more than 36,000 TWh in 2050. A large part is expected to be covered by intermittent solar and wind power [2]. With higher energy consumption and the larger penetration of intermittent renewable energy sources, challenges related to the stability and reliability of the electric power grid arise [3], triggering a need for more flexibility. Consumers can be part of the solution through demand response, in which they adapt to electricity production and grid capacity to a greater extent [4], either implicitly or explicitly. Implicit flexibility is when the consumer responds to price signals to adjust demand [5]. According to the Universal Smart Energy Framework (USEF), this involves the time of use optimization (load shifting), maximum power control (peak shaving), or self-balancing of the local electricity production, such as solar PV [6]. Several studies have demonstrated the positive effect the electricity price has on both the reduction and shifting of the residential electricity demand [7,8,9], but information about real-time usage [10] and automated demand response systems [11] are regarded as essential for permanent behavioral change. Explicit flexibility, on the other hand, involves external load control based on grid-related needs, for example, congestion management and balancing services [5]. Proper regulatory frameworks and business models are still in the development stage [12].
A flexible asset that can help consumers take an active role related to both implicit and explicit flexibility without reducing the comfort impact is a residential battery. This is a small-scale household-level battery energy storage system that is typically installed behind the meter [13]. The battery can store electricity from the grid or own solar PV production and discharge it when needed, either to the consumer or to the grid [14]. Related to implicit flexibility, the battery can lower the consumer’s electricity expenses through load shifting and/or peak shaving [15,16]. By exploiting variations in electricity prices, the battery can achieve gains by charging at low prices and discharging at high prices, often referred to as price arbitrage [17]. Peak shaving is relevant for consumers with a grid contract including a power-based tariff [18]. In this case, the battery’s task will be to lower the power peaks by shifting the demand from periods with high consumption to periods with low consumption [13,19]. The potential electricity bill savings are highly dependent on the local electricity price structure [20,21] as well as the battery operation strategy [15,22].
A battery may also be used to maximize the value of local solar PV production through self-balancing. This is often referred to as increasing self-consumption under the assumption that it is profitable that the own production should be used locally to the greatest extent possible [17]. In this case, the battery will be used to store excess electricity and further retrieve this when the building has a deficit, for example, in the evening/night when the sun is not shining. Whether this is more profitable than selling surplus electricity to the grid depends on the electricity price models, especially with respect to feed-in tariffs [15,17,23,24].
In any case, the battery investment must be economically attractive to be a realistic solution. The gain from exploiting implicit flexibility must at least make up for the loss of efficiency in the battery system. Furthermore, the gain over the battery’s lifetime should add up to cover for the investment cost, thus making the investment profitable. Batteries are known to have high investment costs, but the prices have fallen drastically in the last few years, and projections show that they will continue to decrease [25]. Nevertheless, economic analyses show that residential batteries are still too expensive to make the investment worthwhile for a regular consumer [15,26]. Several studies have concluded that higher and more volatile electricity prices [21,26] or significantly lower battery costs [23,27] are necessary for batteries to reach an economic break-even point during their lifetime. Some authors have suggested using second-life electric vehicle (EV) batteries for a lower investment cost, but with this approach, there is a risk of substantially reducing the lifetime [28]. Technological advancements [29], subsidy programs [30], or other battery services, such as participating in explicit flexibility markets, may also motivate residential battery investments [31,32].
The aim of this paper is to explore the feasibility of deploying residential batteries to lower consumers’ electricity expenses through implicit flexibility in Norway. A concern often disregarded in the literature is that using a battery for several services may lead to conflicting wishes, for example, if there is a need for power reduction when the price is low. To address this issue, we establish an optimization model considering the retail electricity price, the newly introduced scheme for grid rent, including a power-based tariff, and potential revenues by selling electricity to the grid. As the basis for this study, we use the hourly electricity demand during the entire year of 2022 for 20 real households located in south-eastern Norway, half of which have installed rooftop solar PV. Based on the optimized savings, an investment analysis is performed to examine the profitability of the battery system under today’s electricity price conditions in a baseline scenario. Moreover, we explore the impact of potential developments related to implicit flexibility, investment support, and additional revenue from explicit flexibility on profitability.

2. Electricity Price and Consumption Data

2.1. Electricity Price Data

The hourly electricity prices used as input in the optimization model are based on the Norwegian scheme for residential consumers, consisting of three main components: retail electricity price, grid rent, and taxes. The retail price is determined by the market and reflects the supply and demand of electricity. The grid rent is set by the distribution system operators (DSOs) and covers the costs of building, maintaining, and operating the power system. The taxes are imposed by the government and vary depending on the policy objectives and incentives [33]. Since the massive roll-out of residential smart meters was completed in 2019, a large share of the Norwegian retail contracts has been tied to the day-ahead price, meaning that the consumers pay a variable electricity price that follows the hourly fluctuations of the wholesale market. This contrasts with other European countries, where fixed-price contracts are more common. To reflect the physical limitations of the electric power grid, Norway is divided into five price zones with individual day-ahead prices. Figure 1 shows the prices in south-eastern Norway (NO1) during the years 2019–2023, acquired from Nord Pool [34], without value-added tax (VAT). The year 2022 stands out with exceptionally high and volatile prices. This was due to, among other things, low water levels in the reservoirs, high carbon prices, and the global energy crisis [35]. The battery’s task in the optimization is to take advantage of the electricity price fluctuations to gain revenues through price arbitrage, and 2022 was thus chosen as a basis for the prices to maximize its potential.
A new scheme for grid rent was introduced in Norway in July 2022, with the aim of providing incentives to limit the peak load demand. The new scheme consists of a monthly fixed fee related to the power peaks [kWh/h] and an energy component, which is a variable cost related to the electricity consumption [kWh]. The fixed fee is organized in capacity steps, where the step is determined by the average of the three hours the consumer demands the most power spread across three different days in a month. Most DSOs operate with the same steps but with different prices for each step. The DSOs have the freedom to choose how the energy component is built up, depending on the challenges they have in their local distribution network. The price could be differentiated between day or night/weekends and between seasons. Elvia, the largest DSO in Norway, operates most of the grid in NO1 [36]. Their grid rent (including all taxes) for the five first capacity steps that were valid in 2022 are shown in Table 1. The energy component was lower at night (22:00–06:00) and on weekends than during the day (06:00–22:00), but there were no seasonal differences. The battery’s task related to the grid rent is to change the demand profile so that the household is placed in a lower capacity step to lower the monthly expenses.
The electricity prices used as input in the optimization model are the hourly day-ahead prices in NO1 without surcharge, acquired from Nord Pool (shown in blue in Figure 1), and the grid rent from Elvia (Table 1), assuming the new scheme for the entire year of 2022. It is further assumed that the battery owners follow the Norwegian feed-in tariff scheme for prosumers, in which they receive the day-ahead price and the energy component of the grid rent for their electricity sold, but they do not receive any subsidy or premium, and they do not need to pay a fee for feed-in. The battery’s task related to the prosumer role is to optimize self-consumption and selling of electricity to the grid.

2.2. Consumption Data

The load profiles used in this study are based on the hourly demand (kWh/h) in 2022 from 20 real households (detached houses) located in NO1. The datasets are of high quality, with no missing data points. The households are divided into two groups: 10 households without PV (Con01–Con10) and 10 households with PV (Pro01–Pro10). Consumption data for the households in the two groups are given in Table 2 and Table 3, respectively. For the second group, the PV installations range from 3.2 to 10 kWp. The data in this group consist of electricity import (purchase) and export (sale), recorded by smart meters; therefore, we do not know the exact PV production and total consumption. However, it has been verified that this does not affect the optimization results for one of the houses where PV production data were available.

3. Methodology

The starting point for the analyses is residential households connected to the grid (Figure 2). Half of the houses have installed solar PV panels, and we investigated how a battery can adjust the electricity demand based on implicit flexibility.
An overall flow chart for the methodology is illustrated in Figure 3. The operation strategy for the battery is to minimize the consumers’ yearly electricity expenses assuming a perfect price forecast. The calculated electricity expenses for the real and optimized load profiles are compared, and the difference is evaluated as potential annual savings by installing a residential battery. Based on this, an investment analysis is performed by calculating the net present value and payback period for the battery for each household under a baseline scenario and different potential future scenarios.

3.1. Optimization Model

The optimization method is based on classical linear programming. We establish a mathematical model where an objective function z is to be minimized without violating a defined set of constraints. In our case, the objective is to minimize the total electricity expenses, as given by Equation (1). t   ϵ   T defines the set of all the time slots within the optimization horizon, which, in our case, is one month at a time because the capacity step in the grid rent is determined monthly. The optimization within each month is performed with hourly time steps.
min z = t   ϵ   T P t r e t a i l b u y + P t g r i d b u y + P t t a x χ t b u y P V A T P t r e t a i l s e l l + P t g r i d s e l l χ t s e l l + Δ P c a p s t e p P V A T + ς f l e x i b i l i t y
The first parenthesis in Equation (1) includes the costs directly related to the amount of electricity bought χ t b u y [kWh], i.e., imported to the site in hour t . These costs are affected by the retail electricity buy price P t r e t a i l b u y [NOK/kWh], the energy component of the grid rent P t g r i d b u y [NOK/kWh], and the taxes P t t a x [NOK/kWh]. The second parenthesis covers the revenues from selling electricity χ t s e l l [kWh] to the grid in hour t , summed up by the retail electricity sales price P t r e t a i l s e l l [NOK/kWh] and the energy component of the grid rent P t g r i d s e l l [NOK/kWh]. The third term is the price difference between the capacity steps Δ P c a p s t e p [NOK] in the monthly fixed fee of the grid rent. Both the cost of the bought electricity and capacity step are subject to VAT and are thus multiplied by P V A T [%]. The last part of the objective function, ς f l e x i b i l i t y , is the cost of utilizing the battery for implicit flexibility [NOK]. This can be related to battery aging.
A simplified battery model is introduced to ensure that physical limitations are followed. The battery state of the charge  σ t s o c [kWh] in hour t depends on the state of charge in the previous hour σ t 1 s o c [kWh] and the amount of electricity charged σ t c h [kWh] or discharged σ t d i s c h [kWh] in the current hour as described by Equation (2). Here, we have introduced efficiency factors for charging A c h [%] and discharging A d i s c h [%], which includes the total battery and inverter efficiency.
  σ t s o c =   σ t 1 s o c + σ t c h · A c h σ t d i s c h A d i s c h ,   t   ϵ   T
According to Equation (3), the battery state of the charge must be within the battery’s minimum and maximum limits, O m i n [kWh] and O m a x [kWh], respectively.
O m i n σ t s o c O m a x ,   t   ϵ   T
Before the optimization model can determine what to do in the first hour, the initial state of the charge must be determined. Additionally, the battery should be prohibited from emptying completely at the end of the optimization horizon, which, in our case, is by the end of each month. In our model, this is solved by forcing the initial and last hour of the optimization horizon to be half of the maximum capacity, as given by Equation (4).
  σ t s o c = O m a x 2 ,   t = 0 ,   T
The charging σ t c h [kWh] and discharging σ t d i s c h [kWh] within each hour must always be below the maximum charging Q c h [kW] and discharging Q d i s c h [kW] levels, as described by Equation (5) and Equation (6), respectively. Here, we have introduced periods per hour N h o u r   [#/h], which, in our case, is 1/h.
σ t c h Q c h N h o u r ,   t   ϵ   T
σ t d i s Q d i s c h N h o u r ,   t   ϵ   T
To prevent the battery from degrading too quickly and considering both cycle aging and calendar aging without adding too much complexity to the model, a fixed cost is introduced through ς f l e x i b i l i t y in Equation (1). This parameter equals κ c h _ c o s t [NOK] (Equation (7)) when the battery is charging and κ c h _ c o s t [NOK] (Equation (8)) when the battery is discharging. The monthly cost is based on a fixed price per kWh for charging K c h [NOK/kWh] and discharging K d i s c h [NOK/kWh], respectively.
κ c h _ c o s t = K c h 0 T σ t c h ,   t   ϵ   T
κ d i s c h _ c o s t = K d i s c h 0 T σ t d i s c h ,   t   ϵ   T
The stored energy in the final step in the optimization horizon has a value κ S S o c V a l u e [kWh] that must be considered when deciding the battery schedule. This is calculated by Equation (9) and gives a kWh taken from the battery as values based on the average cost of utilizing a kWh bought from the grid in the optimization horizon.
κ S S o c V a l u e = σ t = T s o c σ t = 0 s o c 0 T P t r e t a i l b u y + P t g r i d b u y + P t t a x t = T t = 0 + 1 A d i s c h ,     t   ϵ   T
More detailed formulations could be added to handle nonlinear conditions when the battery is close to full or empty, nonlinear efficiency, different behaviors at different temperatures, more realistic degradation, and so forth. For simplicity, these effects are not covered in the present study.
Finally, energy balances for the households must be formulated (Equation (10)). Overall, the bought electricity χ t b u y [kWh] and the generation from PV panels G t [kWh] plus the discharging of the battery σ t d i s c h [kWh] must equal the charging of the battery σ t c h [kWh] and the total consumption C t [kWh] plus the sold electricity χ t s e l l [kWh]). In general, the total consumption may be divided into several terms, where one can be the sum of unmetered loads and the other may be one or more metered loads. As previously described, the generation from the PV panels are unknown in the present study. Therefore, C t gives the net consumption, as seen from the connection point to the grid, in which the PV production is subtracted from the consumption.
χ t b u y + G t + σ t d i s c h = σ t c h + C t + χ t s e l l
The parameters used in the battery model are set in dialog with a commercial battery system provider operating in Norway. The values are given in Table 4. The simulation is based on a battery pack consisting of two battery modules (5.12 kWh each), which is the most commonly requested battery size in Norway. Based on experience, this battery size is sufficient for flattening power peaks in a regular Norwegian household, in addition to supplying energy for basic appliances over a short period of time in case of a power black-out.

3.2. Profitability Analysis

The profitability analysis is based on net present value calculations using Equation (11).
N P V = C 0 + i = 1 N R 1 + r i
C 0 is the investment cost [NOK] for the battery system. The households in the second group (Pro01–Pro10) have already made PV investments in the past, and these costs are thus not included in the current analysis. R denotes the yearly revenue [NOK/year], calculated as potential annual savings based on the optimization model. The revenue would normally vary from year to year, but we assume that the yearly load profiles and electricity expenses remain constant over the economic lifetime of the battery, meaning that the yearly revenue R is the same from one year to another. N is the economic lifetime of the battery [years], and r is the discount rate [%]. The values for these parameters are set in dialog with a commercial battery system provider operating in Norway and summarized in Table 5. The payback time is calculated as the number of years before the total gain exceeds the investment cost.
For future scenarios, the impact of different market services on profitability is explored by considering profit developments from implicit flexibility, investment support, and additional revenue through explicit flexibility.
The potential annual savings in the baseline scenario are calculated based on the electricity prices in 2022. Historically, electricity prices have been relatively stable due to the controllable nature of primary energy sources such as hydropower in Norway and fossil fuels in other European regions. However, with the shift towards more variable energy production such as solar and wind power, more volatile prices are expected due to the stochastic nature of electricity provision [37], potentially giving larger incentives for using a battery for price arbitrage. Other grid tariff models are also suggested to better cope with the challenges the grid faces with increasing peak demands [38]. Overall, we can expect these factors to generate higher annual savings through implicit flexibility in the future. In the present work, we do not focus on the details of electricity price developments but rather aim to determine the percentage increase in annual savings needed for the residential battery to be an economically feasible solution.
Another factor that could influence profitability is investment support. Today, no investment support scheme exists for consumers to purchase residential batteries in Norway. It is reasonable to believe that a support scheme is needed to promote the market until the investment becomes more affordable [30], as observed for other markets, such as EVs [39] and solar PV [40]. For the future scenarios in the present study, we investigate how much support is necessary for a residential battery investment to break even.
In the baseline scenario, only battery services related to implicit flexibility are considered. However, batteries could also be used for explicit flexibility if the flexibility is sold to an external party based on grid-related needs [5]. In this context, demand-side flexibility can be used to provide system services to the transmission system operator (TSO), grid services to the local DSO, or market services to a balancing responsible party (BRP) [41]. In Norway, Statnett is the TSO and has various markets that may be relevant for explicit flexibility, such as Fast Frequency Reserves (FFR), Frequency Containment Reserves (FCR), and automatic and manual Frequency Restoration Reserves (aFRR and mFRR) [42]. Sales to DSOs can be made via emerging local flexibility markets or bilateral contracts [43]. For residential consumers to participate in these markets, flexibility from several end users must be aggregated into a portfolio through an aggregator to reach the minimum volume requirements. In Norway, local flexibility markets are under development through the market platform NODES (https://nodesmarket.com/nodes-platform/, accessed on 3 June 2024), but on a general basis, proper regulatory frameworks and business models are still regarded as immature [12]. It should be noted that participating in explicit flexibility markets will introduce another factor in the optimization model (Equation (1)), meaning that the optimized demand profile and, consequently, the baseline revenues, will be altered. For simplicity, we keep the potential annual savings from the baseline optimization constant and investigate how much additional revenue is needed for residential batteries to become a feasible solution.

4. Results and Discussion

4.1. Optimized Load Profile

Figure 4a shows how the battery alters the demand profile for Con01 on a day with high price fluctuations (8 March 2022). Figure 4b shows the hourly battery charge and discharge for the same day. The battery reacts to a sudden increase in the retail price at 07:00. The optimized load (purchase) drops to zero, and the consumer draws power from the battery (battery discharge) instead of the grid. Additionally, the battery feeds power to the grid, taking advantage of the high retail price. When the price is lowered a few hours later, the demand from the grid rises, and the battery starts to recharge. A new price increase, although smaller, occurs at 18:00, resulting in a new battery discharge period. However, the price increase is not sufficient for the battery to sell power back to the grid. During the whole day, the battery makes sure that the demand does not exceed 5 kWh/h, which is the upper limit of the second capacity step in the grid rent (Table 1).
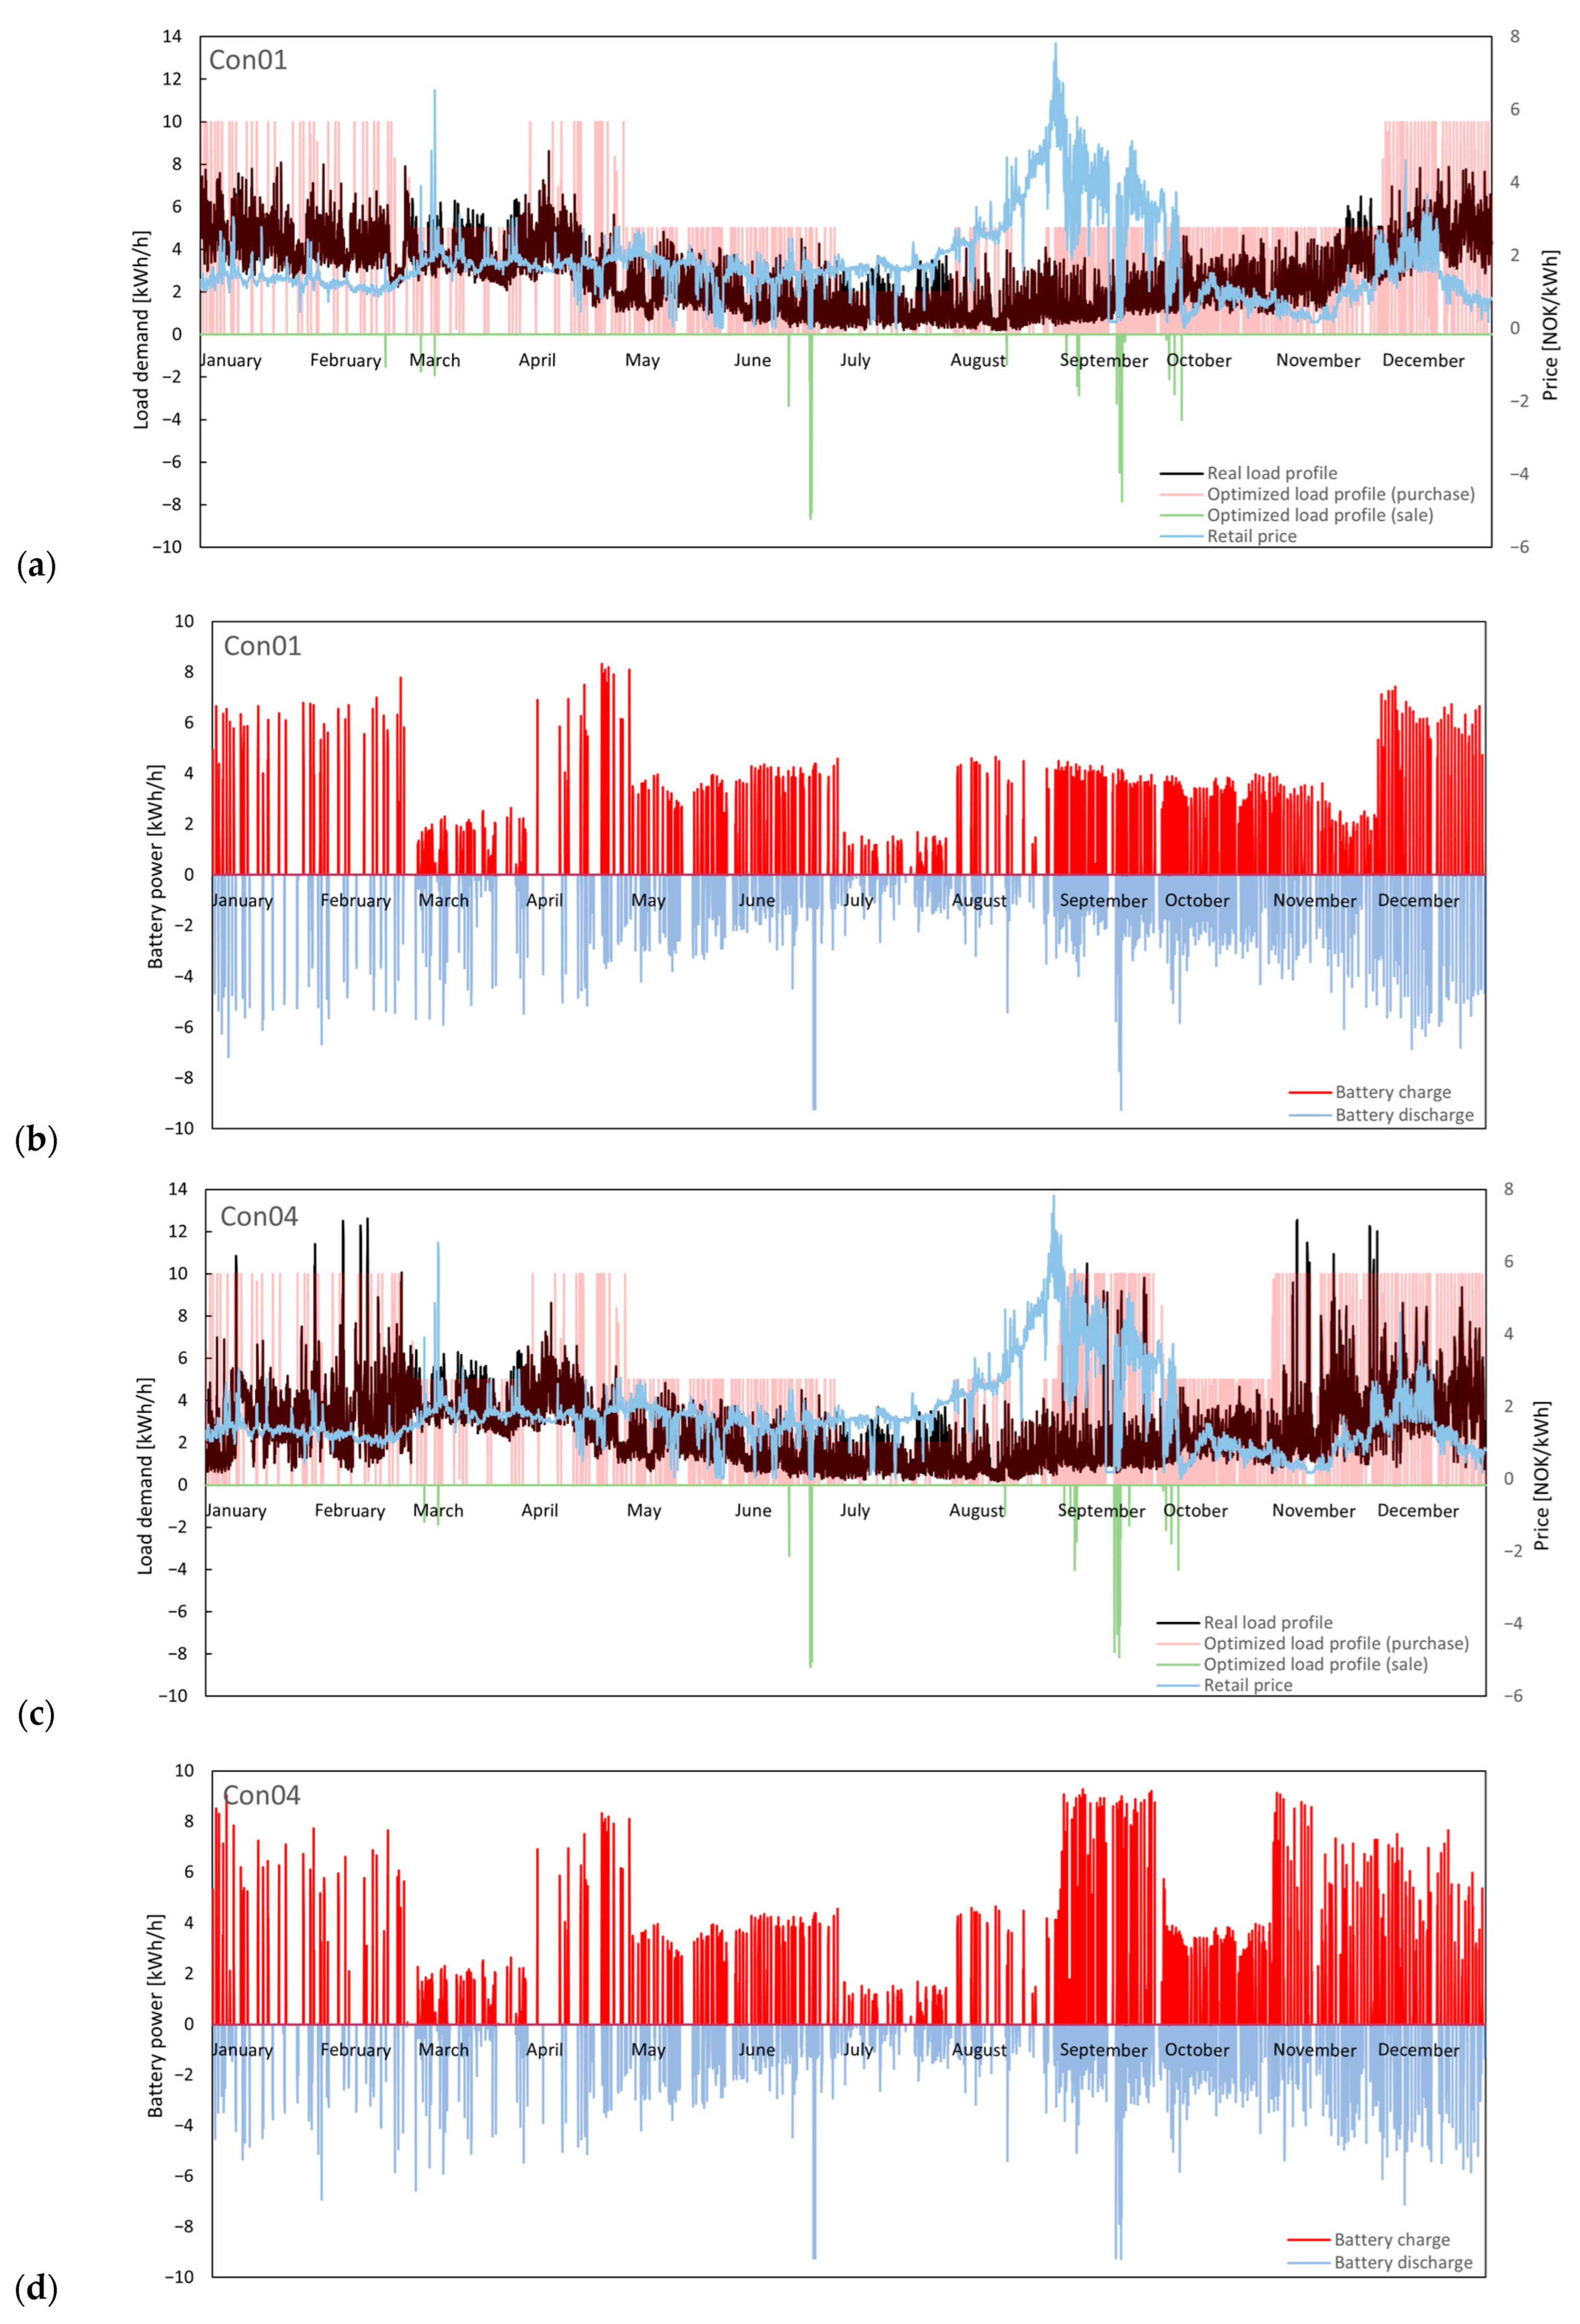
To illustrate the optimization for the entire year, the real and optimized demand profiles for Con01 and Con04 are shown in Figure 5a,c, together with the retail price. Figure 5b,d show the hourly battery charge and discharge for the two households in the same period. Overall, utilizing a residential battery to minimize the consumers’ yearly electricity costs gives a much more volatile load profile, where the value of energy arbitrage is often greater than the value of reducing the power. With the expectation of increased price volatility [37], this effect could be more prominent in the future.
The demand fluctuates between high power and zero power, with the peaks clearly limited by the capacity steps in the grid rent (Table 1). When a capacity step is reached within a month, there is no economic incentive for the consumer to reduce the demand below the upper limit in this step for the rest of the month. In the model’s approach, it is sought to maximize the use of the month’s step when the retail price is low. This results in a clear stepwise separation in the transition between months for the optimized load profiles. The exception is August, in which the prices in the second half are so high and volatile that the potential of the capacity step is not utilized fully for either of the consumers. The general battery behavior is also demonstrated by the load duration curves in Figure 6, illustrating how the batteries have mainly altered the maximum and minimum loads during the year.
For Con01, the economically optimized peaks are higher than the real demand, and Figure 5 shows that these occur during the winter months. For Con04, the winter peaks are successfully reduced, never exceeding the third capacity step (10 kWh/h) with optimization. The maximum load of 10 kWh/h, however, occurs for a larger share of the year for both households. On the other hand, the load duration curves also show that both households do not consume any electricity from the grid approximately 10% of the time and only deliver electricity to the grid for a few hours.
The optimization in the present study has been performed from the consumers’ perspective. Whether the observed changes in the demand profiles are beneficial or not from the grid’s perspective depends on both the time and the location. Peak shaving and shifting can, in principle, have positive effects on the upper grid by moving consumption from periods of high demand to periods of low demand [15]. However, as the battery optimization in the present study shows, it can also cause new peaks, and these are not necessarily beneficial for the grid. This result demonstrates a weakness of today’s grid tariff in the sense that it incentivizes consumers to reduce their individual peak demand whether there is a system peak or not. An improved solution proposed by [38] is a dynamic tariff, where capacity limits are only activated when there is a scarcity of grid capacity; the study demonstrated that the annual electricity costs would remain stable and similar for most consumers, but the economic impact would be higher for those with high coincidental peaks.

4.2. Annual Savings

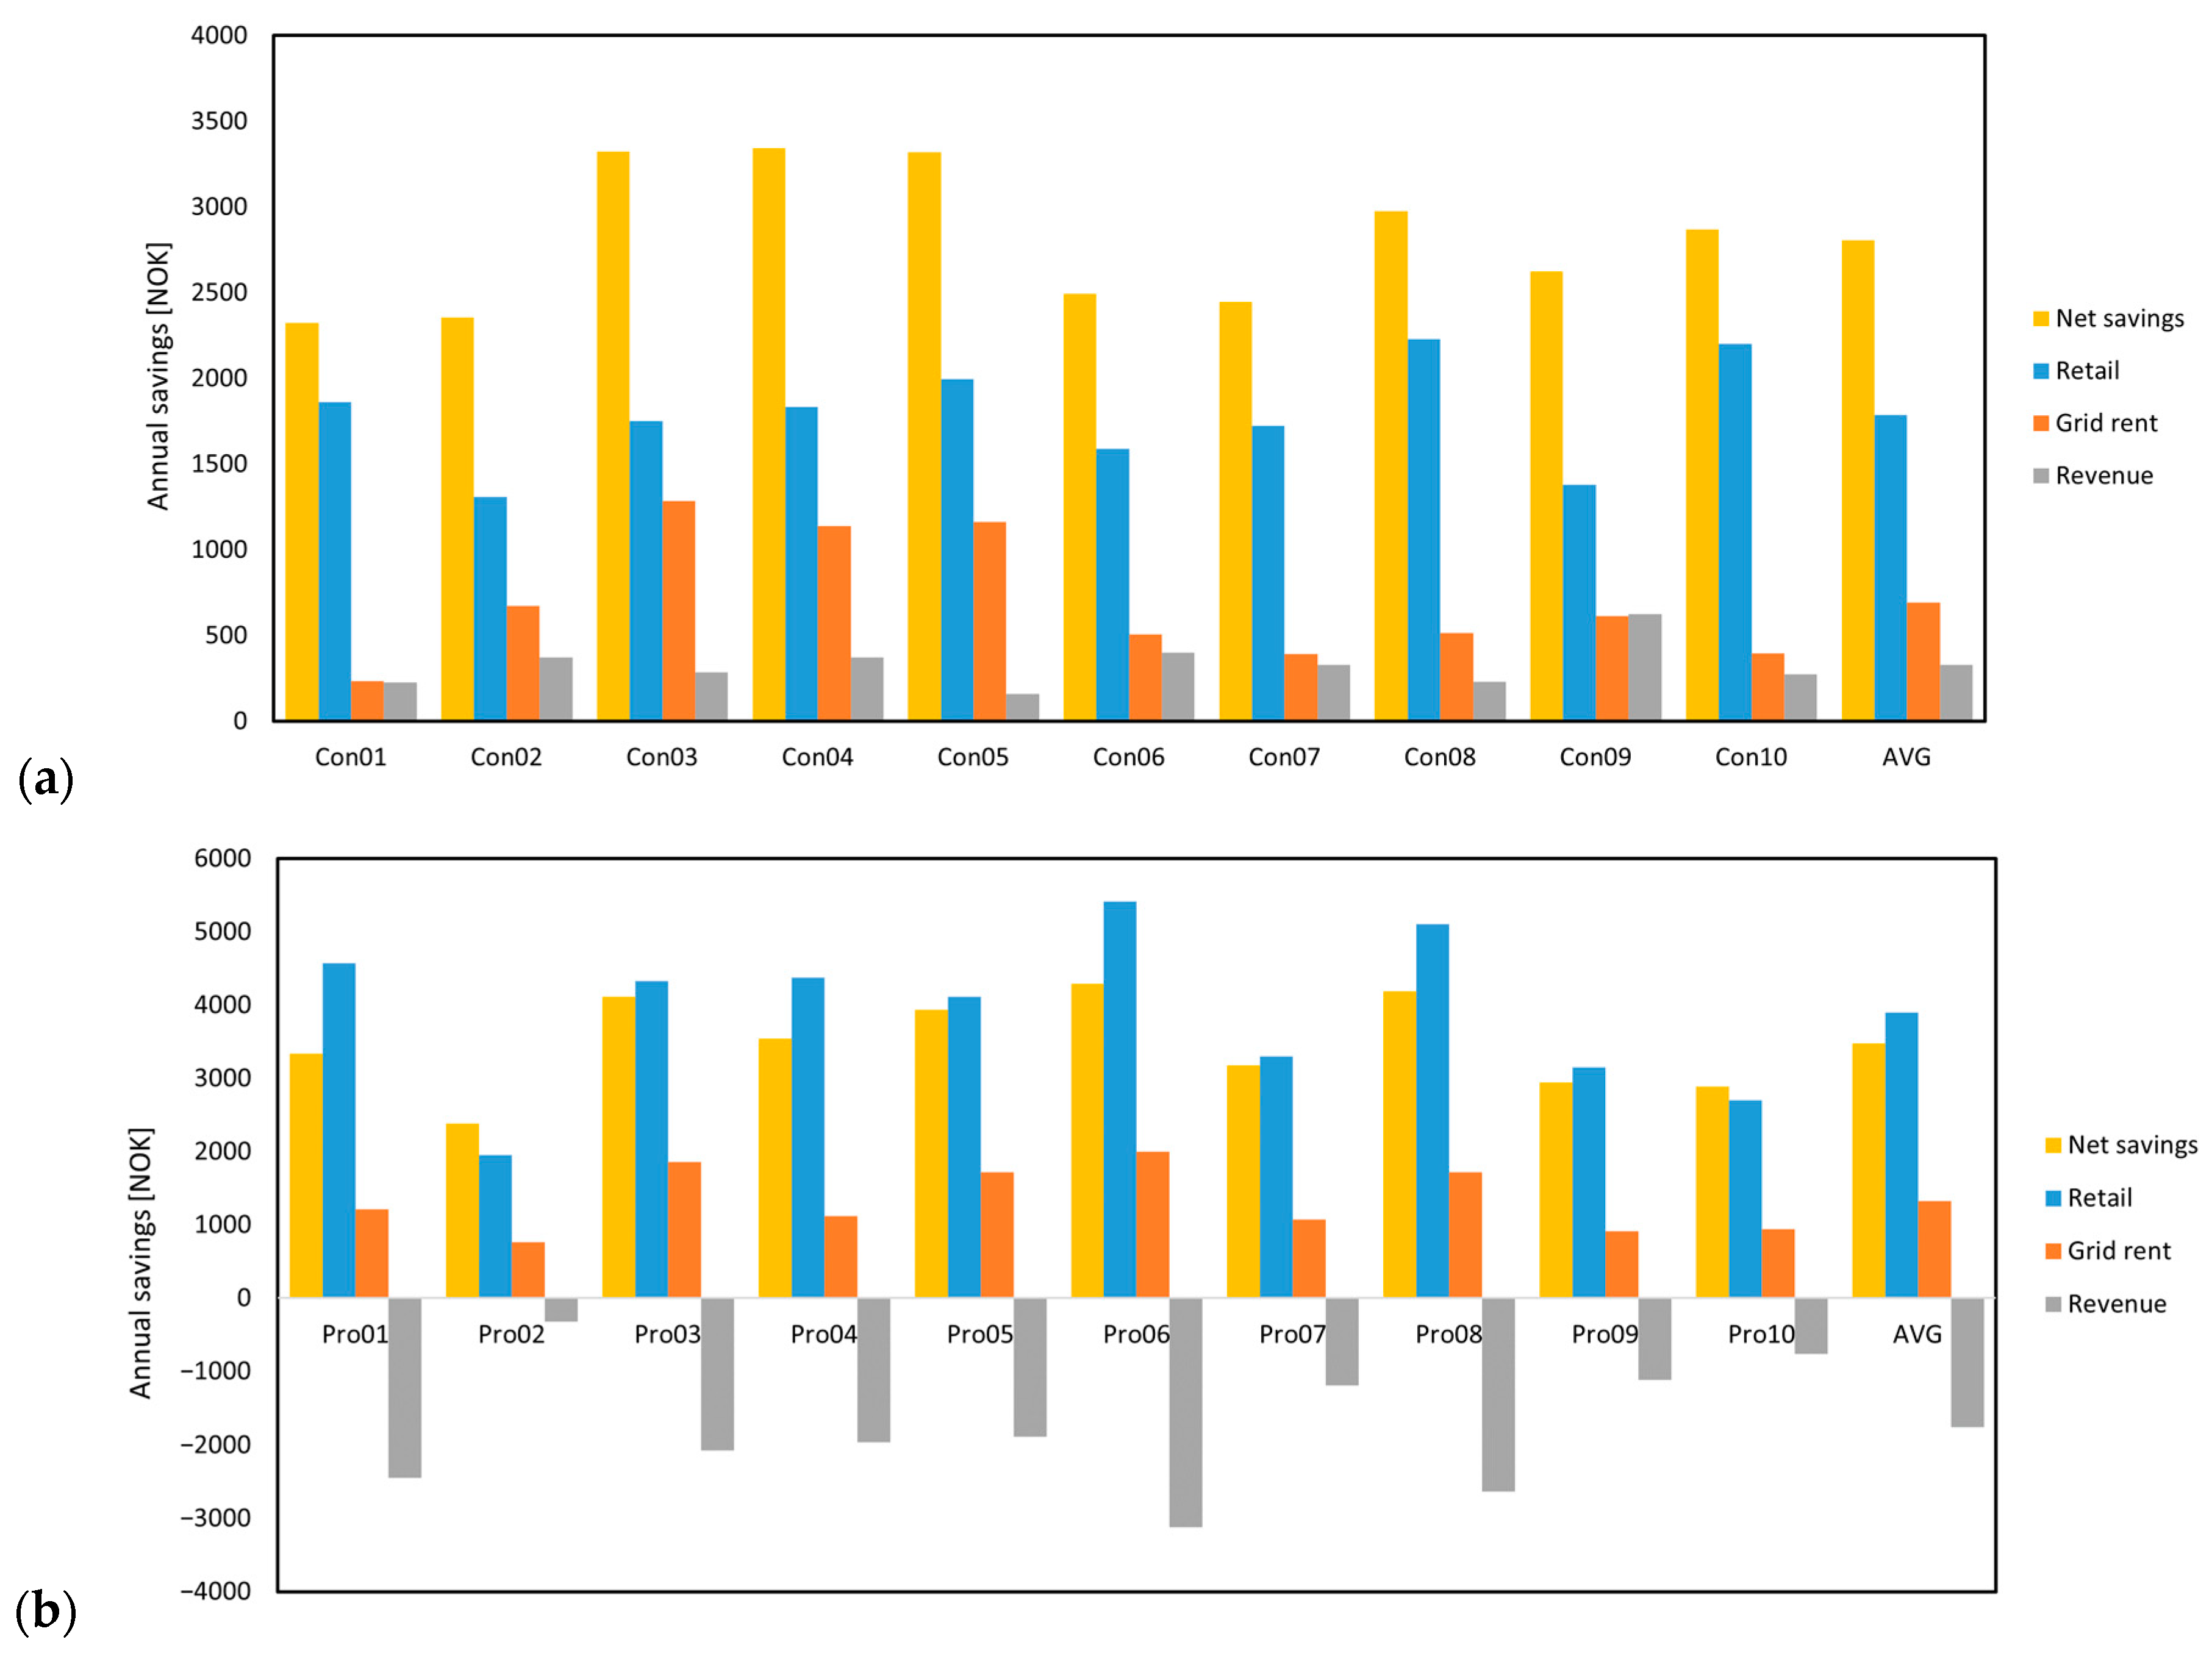
The calculated potential annual savings for all the studied households are shown in Figure 7. The previously described Con01 and Con04 are the households with the lowest and highest net savings in the first household category, respectively. The yellow bars represent the net savings, ranging from 2323 NOK to 3344 NOK for Con01–Con10 and 2385 NOK to 4295 NOK for Pro01–Pro10. The largest part of the savings is the retail savings (shown in blue), corresponding to savings based on buying electricity at low prices and storing it in the battery for later use. The grid rent savings are shown in orange. These are savings from the differences in energy charges and capacity steps and small amounts related to taxes. The grey bars represent revenues, consisting of both retail revenues and grid energy revenues. These are generated when it is more profitable to sell electricity back to the grid rather than self-consuming.
The general trend for both households with and without PV installations is that retail savings contribute the most to the net savings. Since the model minimizes the total costs, this means that the disadvantage of taking a higher capacity step is less than the gain from price arbitrage based on the volatile prices from 2022. It should be noted that the prices were exceptionally volatile in 2022, giving a large potential for price arbitrage. With the more stable prices seen in the other years (Figure 1), it is expected that the optimization model would force the households into lower capacity steps and thus yield grid rent revenues, accounting for a larger share of the net savings. From the grid’s perspective, this would mean lower power peaks.
For households with PV, it can be observed that the potential annual savings are reduced by the revenues generated from selling electricity to the grid. This is because the households already have sale revenues from their PV production, but introducing batteries makes it more profitable to increase PV self-consumption rather than selling the PV electricity to the grid. Note that this result is based on Norwegian prosumer conditions, and this might not always be the case, for example, if a fixed high price is guaranteed for the sale of surplus electricity. Nevertheless, the net annual savings for these households are generally higher than for the households without PV.
The annual savings represent the maximum profit potential given that all the necessary information is available. In real life, this will not be the case: consumption and production will only be known for hours that have already passed, and day-ahead prices will only be known for a few hours ahead (between 12 and 35 h, depending on the time of the day). Although unrealistic, the numbers provide insight into basic conditions and illustrate a theoretical potential. The savings in real life will depend on the consumers’ a priori insight. Since the future electricity prices are unknown, it would be necessary to make decisions based on predictions. However, the uncertainty of solar and wind energy will affect the accuracy of electricity price predictions. One way of dealing with the uncertainty is through a cubic densest stacking method [44]. Alternatively, a stochastic two-tier optimal allocation method can be used to ensure the interest of different agents are met under the uncertainty of electricity prices [45].

4.3. Profitability Analyses

Based on the potential annual savings, the net present value and payback time for the residential batteries are calculated. The results for the households with the lowest and highest savings, in addition to the average annual savings for each household group, are presented in Table 6. For the studied households, the lowest calculated payback time is 24 years (Pro06). Since it is assumed that the battery’s lifetime is 15 years, this means that none of the residential battery investments are found profitable from the consumers’ point of view under the electricity price conditions from 2022.
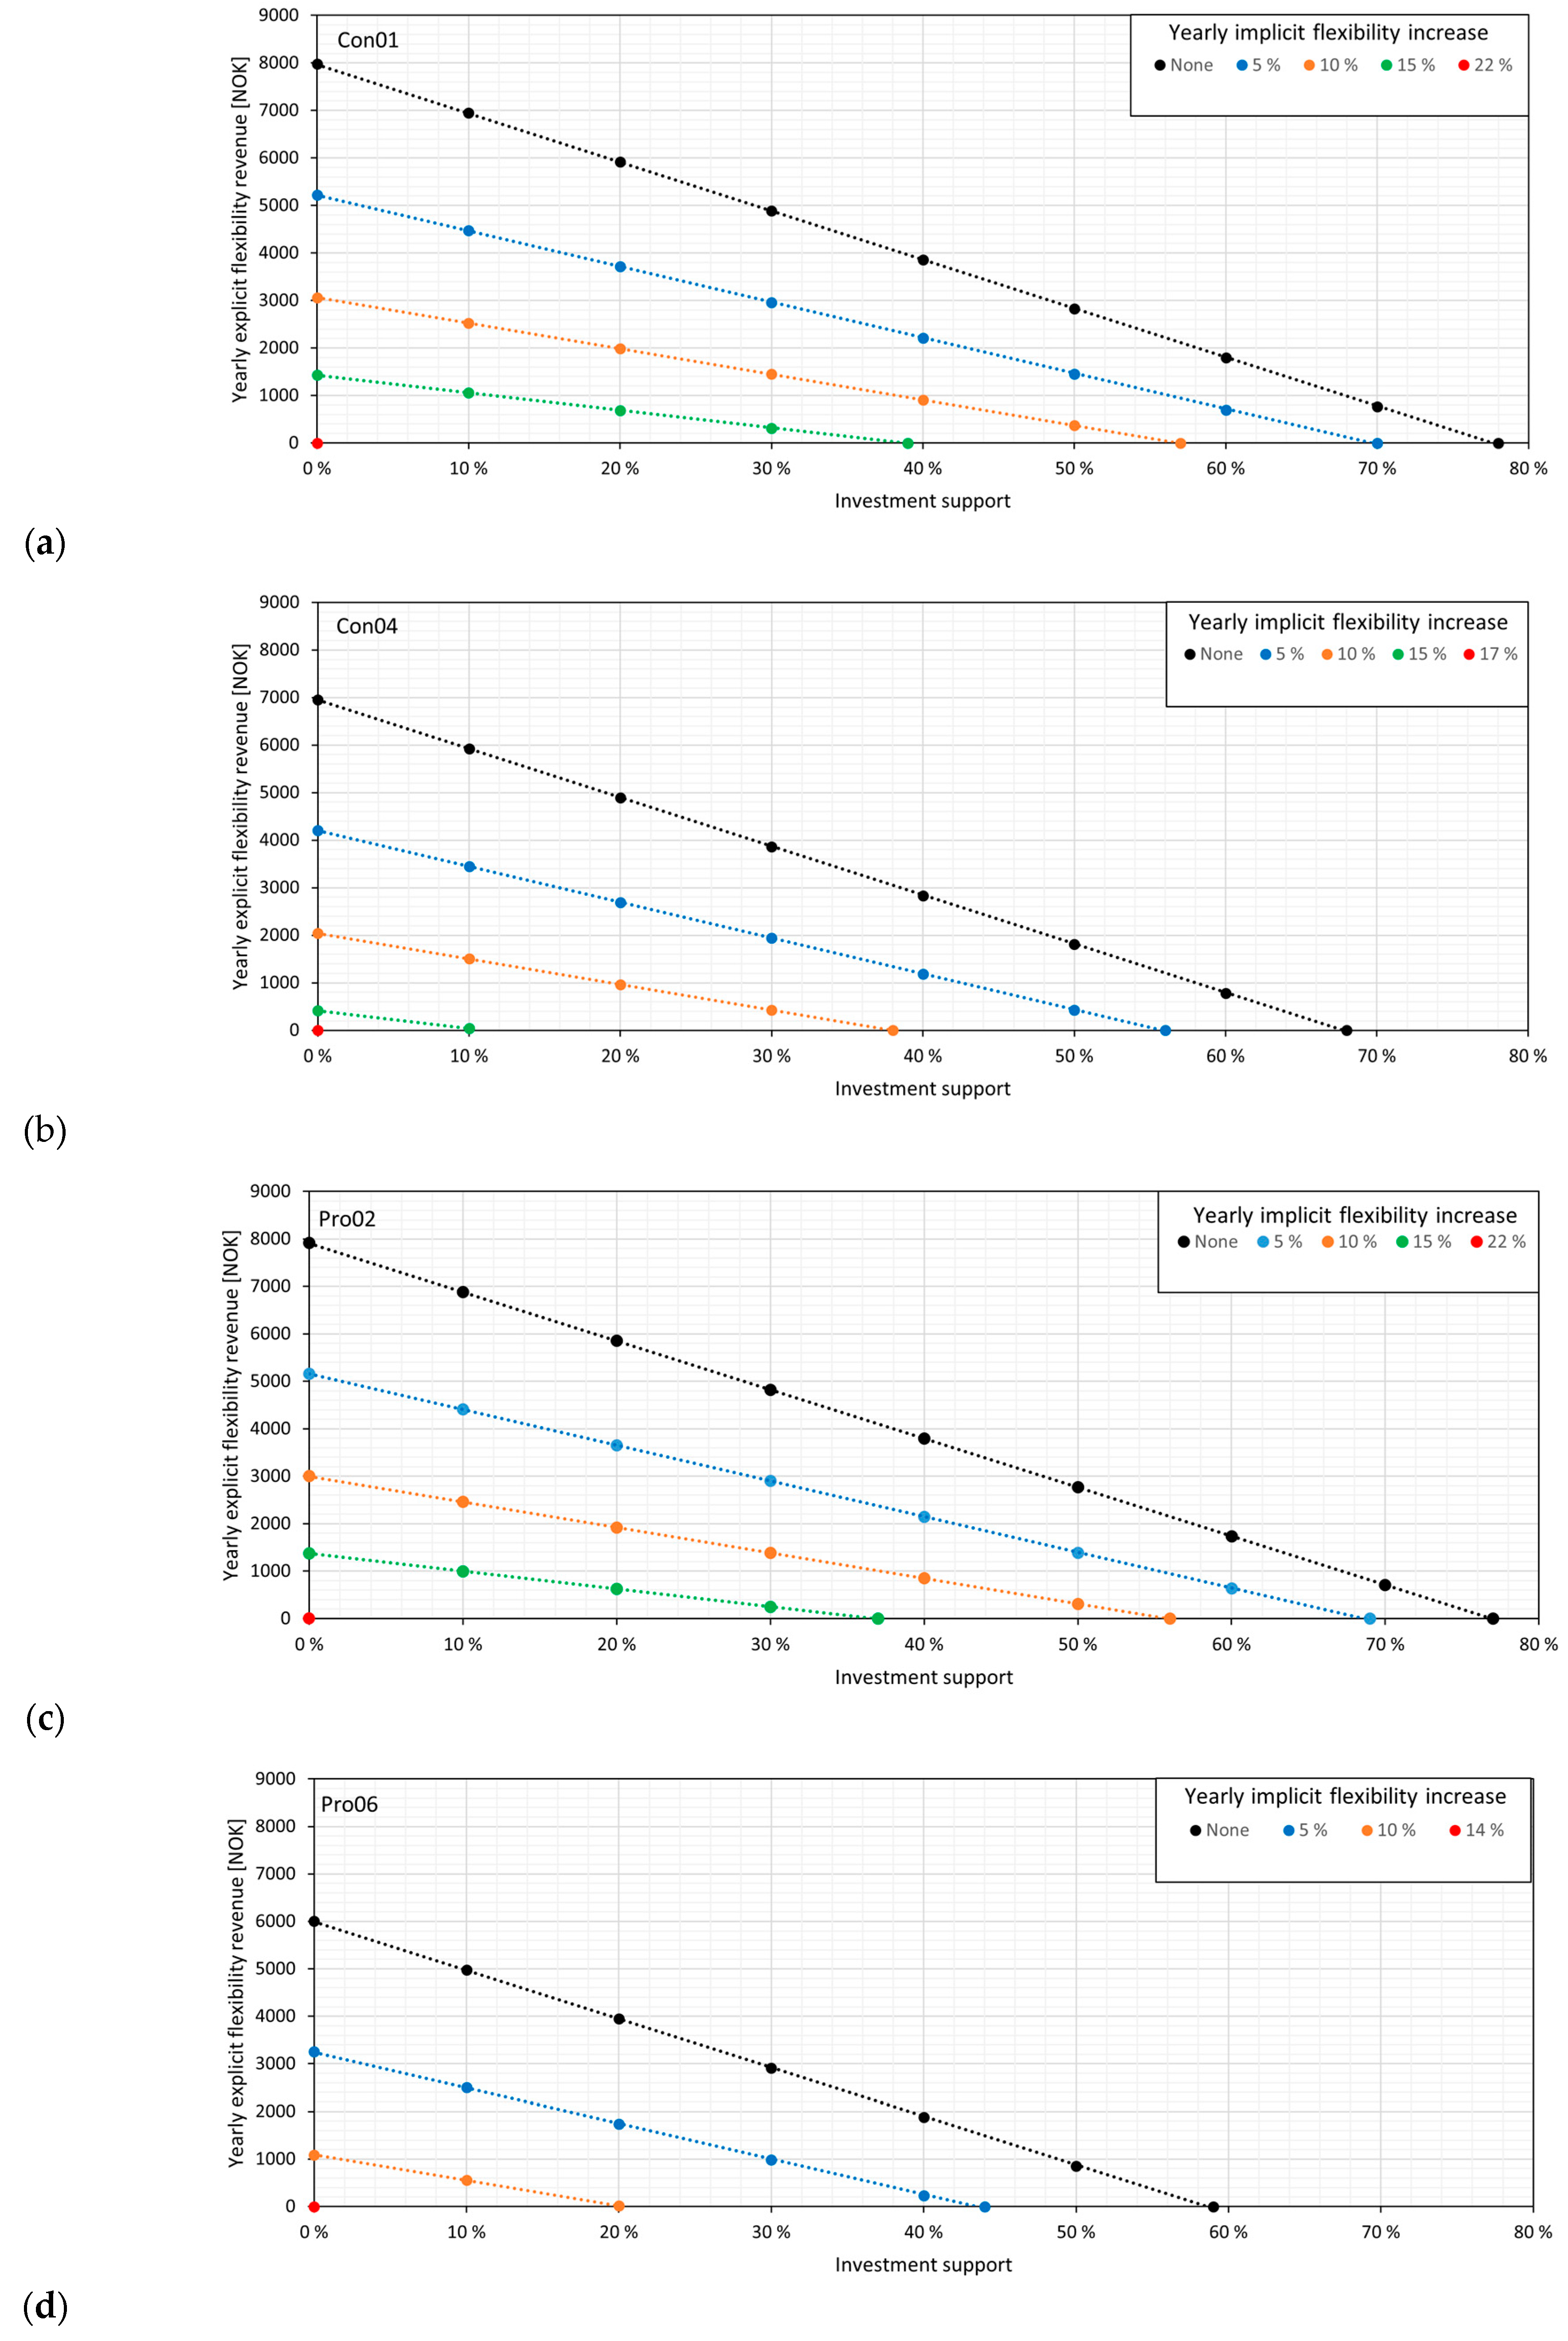
Even though the high and fluctuating electricity prices from 2022 are not enough to incentivize battery investments, future developments could alter these results. Figure 8 shows the impact of developments related to implicit flexibility, investment support, and additional revenue from explicit flexibility on profitability for the households with the lowest and highest net savings in each group. The corners of the triangles spanned out by the black and red dots mark economic break-even points for each category. For the consumer household with the lowest annual savings (Con01, Figure 8a), a 22% increase in the yearly implicit flexibility is necessary to make the battery investment profitable. Alternatively, the break-even point could be reached with 78% investment support or a yearly flexibility revenue of 8000 NOK. For the household with the highest annual savings (Pro06, Figure 8d), a 14% increase in the yearly implicit flexibility, 59% investment support, or a yearly flexibility revenue of 6000 NOK are necessary. All these developments are considered unrealistic separately. However, more realistic future scenarios would be combinations of different service developments, as shown in Figure 8. Substantial investment support is regarded as essential for the other values to be satisfactory. Typically, the investment support in other areas such as solar PV has been around 30%. For Pro06, for example, this number would give a break-even point for a residential battery, together with a 5% increase in the yearly implicit flexibility (blue line) and a flexibility revenue of 1000 NOK per year, which are regarded as more feasible.
Given the positive effects a battery can have on the grid, a recommendation based on the present analyses is to establish funding regimes for residential batteries. It has been shown that consumers react to economic incentives, with the upfront cost being a strong influencing factor in the decision to buy. For comparison, the comprehensive EV policy in Norway has been crucial to the market development, fostering the most advanced EV market in the world [39].

5. Conclusions

The theoretical annual savings by utilizing a residential battery for implicit flexibility have been explored for 20 households in south-eastern Norway, of which half have installed rooftop solar PV. The hourly load profiles for the entire year of 2022 were economically optimized monthly with respect to the electricity price, the newly introduced scheme for grid rent, including a power-based tariff, and potential revenues from selling electricity to the grid. The results showed that economic optimization from the consumer’s perspective leads to more uneven demand profiles but is clearly limited by the capacity steps in the Norwegian grid rent.
Introducing residential batteries in Norwegian households will potentially result in electricity bill savings for consumers. With the volatile prices from 2022, the savings are mainly due to retail savings because the gain from price arbitrage is higher than the loss of being placed in a higher capacity step. For the households with PV, the sale revenues were reduced by the batteries, but the net savings were still higher than for households without PV. Nevertheless, the net savings were not sufficient to make the investment profitable with the volatile electricity prices from 2022 for any of the households. Investment support in the order of 30% is regarded as essential until the battery price becomes more affordable, together with reasonable developments in revenues from both implicit flexibility and explicit flexibility.
In the present study, the optimal operation strategy of the battery was decided based on revenues from implicit flexibility, while explicit flexibility revenues were included in the profitability analyses. In future research, the optimization model can be extended to include revenues from explicit flexibility.

Author Contributions

Conceptualization, H.S.N. and S.Ø.O.; methodology, H.S.N. and S.Ø.O.; validation, H.S.N., S.Ø.O., and O.H.S.; formal analysis, H.S.N., S.Ø.O., and O.H.S.; investigation, S.Ø.O. and O.H.S.; data curation, S.Ø.O. and O.H.S.; writing—original draft preparation, H.S.N.; writing—review and editing, H.S.N., S.Ø.O., and O.H.S.; visualization, H.S.N.; project administration, S.Ø.O.; funding acquisition, S.Ø.O. All authors have read and agreed to the published version of the manuscript.

Funding

This research was funded by RFFVIKEN, grant number 332674 (AI Battery Optimizer—Prediction and Control Algorithms for Household Battery Storage Systems).

Data Availability Statement

The datasets presented in this article are not readily available due to privacy restrictions.

Conflicts of Interest

The authors declare no conflicts of interest.

References

  1. Bouckaert, S.; Pales, A.F.; McGlade, C.; Remme, U.; Wanner, B.; Varro, L.; D’Ambrosio, D.; Spencer, T. Net Zero by 2050: A Roadmap for the Global Energy Sector; International Energy Agency: Paris, France, 2021. [Google Scholar]
  2. IEA. World Energy Outlook 2022; IEA: Paris, France, 2022. [Google Scholar]
  3. Mlilo, N.; Brown, J.; Ahfock, T. Impact of intermittent renewable energy generation penetration on the power system networks—A review. Technol. Econ. Smart Grids Sustain. Energy 2021, 6, 25. [Google Scholar] [CrossRef]
  4. Degefa, M.Z.; Sperstad, I.B.; Sæle, H. Comprehensive classifications and characterizations of power system flexibility resources. Electr. Power Syst. Res. 2021, 194, 107022. [Google Scholar] [CrossRef]
  5. Coalition, S.E.D. Explicit and Implicit Demand-Side Flexibility: Complementary Approaches for an Efficient Energy System; Position Paper; Smart Energy Deman Coalition: Brussels, Belgium, September 2016. [Google Scholar]
  6. Laan, E.K.M.v.d. Energy and Flexibility Services for Citizens Energy Communities; USEF White Paper; USEF: Arnhem, The Netherlands, 2019. [Google Scholar]
  7. Enrich, J.; Li, R.; Mizrahi, A.; Reguant, M. Measuring the impact of time-of-use pricing on electricity consumption: Evidence from Spain. J. Environ. Econ. Manag. 2024, 123, 102901. [Google Scholar] [CrossRef]
  8. Bartusch, C.; Wallin, F.; Odlare, M.; Vassileva, I.; Wester, L. Introducing a demand-based electricity distribution tariff in the residential sector: Demand response and customer perception. Energy Policy 2011, 39, 5008–5025. [Google Scholar] [CrossRef]
  9. Hofmann, M.; Lindberg, K.B. Residential demand response and dynamic electricity contracts with hourly prices: A study of Norwegian households during the 2021/22 energy crisis. Smart Energy 2024, 13, 100126. [Google Scholar] [CrossRef]
  10. Pon, S. The effect of information on TOU electricity use: An irish residential study. Energy J. 2017, 38, 55–79. [Google Scholar] [CrossRef]
  11. Vanthournout, K.; Dupont, B.; Foubert, W.; Stuckens, C.; Claessens, S. An automated residential demand response pilot experiment, based on day-ahead dynamic pricing. Appl. Energy 2015, 155, 195–203. [Google Scholar] [CrossRef]
  12. Freire-Barceló, T.; Martín-Martínez, F.; Sánchez-Miralles, Á. A literature review of Explicit Demand Flexibility providing energy services. Electr. Power Syst. Res. 2022, 209, 107953. [Google Scholar] [CrossRef]
  13. Leadbetter, J.; Swan, L. Battery storage system for residential electricity peak demand shaving. Energy Build. 2012, 55, 685–692. [Google Scholar] [CrossRef]
  14. Hoppmann, J.; Volland, J.; Schmidt, T.S.; Hoffmann, V.H. The economic viability of battery storage for residential solar photovoltaic systems—A review and a simulation model. Renew. Sustain. Energy Rev. 2014, 39, 1101–1118. [Google Scholar] [CrossRef]
  15. Jankowiak, C.; Zacharopoulos, A.; Brandoni, C.; Keatley, P.; MacArtain, P.; Hewitt, N. Assessing the benefits of decentralised residential batteries for load peak shaving. J. Energy Storage 2020, 32, 101779. [Google Scholar] [CrossRef]
  16. Nieta, A.A.S.d.l.; Ilieva, I.; Gibescu, M.; Bremdal, B.; Simonsen, S.; Gramme, E. Optimal midterm peak shaving cost in an electricity management system using behind customers’ smart meter configuration. Appl. Energy 2021, 283, 116282. [Google Scholar] [CrossRef]
  17. Goop, J.; Nyholm, E.; Odenberger, M.; Johnsson, F. Impact of electricity market feedback on investments in solar photovoltaic and battery systems in Swedish single-family dwellings. Renew. Energy 2021, 163, 1078–1091. [Google Scholar] [CrossRef]
  18. Uddin, M.; Romlie, M.F.; Abdullah, M.F.; Abd Halim, S.; Kwang, T.C. A review on peak load shaving strategies. Renew. Sustain. Energy Rev. 2018, 82, 3323–3332. [Google Scholar] [CrossRef]
  19. Nguyen, T.A.; Byrne, R.H. Maximizing the cost-savings for time-of-use and net-metering customers using behind-the-meter energy storage systems. In Proceedings of the 2017 North American Power Symposium (NAPS), Morgantown, WV, USA, 17–19 September 2017; pp. 708–713. [Google Scholar]
  20. Ahčin, P.; Berg, K.; Petersen, I. Techno-economic analyis of battery storage for peak shaving and frequency containment reserve. In Proceedings of the 2019 16th International Conference on the European Energy Market (EEM), Ljubljana, Slovenia, 18–20 September 2019; pp. 338–342. [Google Scholar]
  21. Mulder, G.; Six, D.; Claessens, B.; Broes, T.; Omar, N.; Mierlo, J.V. The dimensioning of PV-battery systems depending on the incentive and selling price conditions. Appl. Energy 2013, 111, 1126–1135. [Google Scholar] [CrossRef]
  22. Berg, K.; Resch, M.; Weniger, T.; Simonsen, S. Economic evaluation of operation strategies for battery systems in football stadiums: A Norwegian case study. J. Energy Storage 2021, 34, 102190. [Google Scholar] [CrossRef]
  23. Alavi, O.; Despeghel, J.; Ceuninck, W.D.; Meuris, M.; Driesen, J.; Daenen, M. Economic Study of Battery Profitability in Residential Solar Panel Systems: A Case Study of Belgium. In Proceedings of the 2020 IEEE 14th International Conference on Compatibility, Power Electronics and Power Engineering (CPE-POWERENG), Setúbal, Portugal, 8–10 July 2020; Volume 1, pp. 358–363. [Google Scholar]
  24. Uddin, K.; Gough, R.; Radcliffe, J.; Marco, J.; Jennings, P. Techno-economic analysis of the viability of residential photovoltaic systems using lithium-ion batteries for energy storage in the United Kingdom. Appl. Energy 2017, 206, 12–21. [Google Scholar] [CrossRef]
  25. Mauler, L.; Duffner, F.; Zeier, W.G.; Leker, J. Battery cost forecasting: A review of methods and results with an outlook to 2050. Energy Environ. Sci. 2021, 14, 4712–4739. [Google Scholar] [CrossRef]
  26. Naumann, M.; Karl, R.C.; Truong, C.N.; Jossen, A.; Hesse, H.C. Lithium-ion Battery Cost Analysis in PV-household Application. Energy Procedia 2015, 73, 37–47. [Google Scholar] [CrossRef]
  27. Schopfer, S.; Tiefenbeck, V.; Staake, T. Economic assessment of photovoltaic battery systems based on household load profiles. Appl. Energy 2018, 223, 229–248. [Google Scholar] [CrossRef]
  28. Madlener, R.; Kirmas, A. Economic Viability of Second Use Electric Vehicle Batteries for Energy Storage in Residential Applications. Energy Procedia 2017, 105, 3806–3815. [Google Scholar] [CrossRef]
  29. Topalović, Z.; Haas, R.; Ajanović, A.; Sayer, M. Prospects of electricity storage. Renew. Energy Environ. Sustain. 2023, 8, 2. [Google Scholar] [CrossRef]
  30. Al Khafaf, N.; Rezaei, A.A.; Moradi Amani, A.; Jalili, M.; McGrath, B.; Meegahapola, L.; Vahidnia, A. Impact of battery storage on residential energy consumption: An Australian case study based on smart meter data. Renew. Energy 2022, 182, 390–400. [Google Scholar] [CrossRef]
  31. Su, R.; He, G.; Su, S.; Duan, Y.; Cheng, J.; Chen, H.; Wang, K.; Zhang, C. Optimal placement and capacity sizing of energy storage systems via NSGA-II in active distribution network. Front. Energy Res. 2023, 10, 1073194. [Google Scholar] [CrossRef]
  32. Kobou Ngani, P.; Hadji-Minaglou, J.-R. Model Predictive Control for Residential Battery Storage System: Profitability Analysis. Batteries 2023, 9, 316. [Google Scholar] [CrossRef]
  33. The Power Market. 2023. Available online: https://energifaktanorge.no/en/norsk-energiforsyning/kraftmarkedet/ (accessed on 6 May 2024).
  34. Spotpriser Time for Time Fra Strømbørsen Nord Pool. Available online: https://www.forbrukerradet.no/strompris/spotpriser (accessed on 15 January 2024).
  35. Norway, S. Electricity Prices. Available online: https://www.ssb.no/en/energi-og-industri/energi/statistikk/elektrisitetspriser (accessed on 25 October 2023).
  36. Eliva. Grid Rent Prices for Private Customers. 2023. Available online: https://www.elvia.no/hva-er-elvia/elvia-transports-the-electricity-to-your-home/grid-rent-prices-for-private-customers/ (accessed on 15 January 2024).
  37. Cevik, S.; Ninomiya, K. Chasing the sun and catching the wind: Energy transition and electricity prices in Europe. J. Econ. Financ. 2023, 47, 912–935. [Google Scholar] [CrossRef]
  38. Bjarghov, S.; Farahmand, H.; Doorman, G. Capacity subscription grid tariff efficiency and the impact of uncertainty on the subscribed level. Energy Policy 2022, 165, 112972. [Google Scholar] [CrossRef]
  39. Haugneland, P.; Lorentzen, E.; Bu, C.; Hauge, E. Put a price on carbon to fund EV incentives–Norwegian EV policy success. In Proceedings of the EVS30 Symposium, Stuttgart, Germany, 9–11 October 2017. [Google Scholar]
  40. Dusonchet, L.; Telaretti, E. Comparative economic analysis of support policies for solar PV in the most representative EU countries. Renew. Sustain. Energy Rev. 2015, 42, 986–998. [Google Scholar] [CrossRef]
  41. Minniti, S.; Haque, N.; Nguyen, P.; Pemen, G. Local markets for flexibility trading: Key stages and enablers. Energies 2018, 11, 3074. [Google Scholar] [CrossRef]
  42. Modig, N.; Eriksson, R.; Ruokolainen, P.; Ødegård, J.N.; Weizenegger, S.; Fechtenburg, T.D. Overview of Frequency Control in the Nordic Power System; Nordic Analysis Group: Brussels, Belgium, 2022. [Google Scholar]
  43. Ramos, A.; De Jonghe, C.; Gómez, V.; Belmans, R. Realizing the smart grid’s potential: Defining local markets for flexibility. Util. Policy 2016, 40, 26–35. [Google Scholar] [CrossRef]
  44. Ding, B.; Li, Z.; Li, Z.; Xue, Y.; Chang, X.; Su, J.; Jin, X.; Sun, H. A CCP-based distributed cooperative operation strategy for multi-agent energy systems integrated with wind, solar, and buildings. Appl. Energy 2024, 365, 123275. [Google Scholar] [CrossRef]
  45. Wang, Z.-H.; Ren, X.-Y.; Cui, H.-J.; Wang, W.-Q.; Liu, J.; He, Z.-F. A multi-stage two-layer stochastic design model for integrated energy systems considering multiple uncertainties. Energy 2024, 304, 131729. [Google Scholar] [CrossRef]
Figure 1. Electricity day-ahead prices in south-eastern Norway (NO1) from 2019 to 2023, acquired from Nord Pool [34]. The numbers are in NOK, where 1 NOK = 0.099 EUR (the average exchange rate in 2022).
Energies 17 04048 g001
Figure 2. Simplified sketch of a residential household with solar panels and a battery. The house is connected to the grid.
Energies 17 04048 g002
Figure 3. The overall method for the optimization model and investment analysis of residential batteries.
Energies 17 04048 g003
Figure 4. Data for Con01 for an example day (8 March 2022). (a) Real and optimized load profiles and retail price given in NOK, where 1 NOK = 0.099 EUR. (b) Battery charge and discharge.
Energies 17 04048 g004
Figure 5. (a) Real and optimized load profiles and retail price for Con01. (b) Battery charge and discharge for Con01. (c) Real and optimized load profiles and retail price for Con04. (d) Battery charge and discharge for Con04. The prices are in NOK, where 1 NOK = 0.099 EUR.
Energies 17 04048 g005
Figure 6. Load duration curves for Con01 and Con04.
Energies 17 04048 g006
Figure 7. Potential annual savings [NOK] by introducing a residential battery. (a) Households without PV (Con01–Con10). (b) Households with PV (Pro01–Pro10). The numbers are in NOK, where 1 NOK = 0.099 EUR.
Energies 17 04048 g007
Figure 8. Future scenarios that yield break-even points for residential battery investments. (a) The consumer with the lowest annual savings (Con01). (b) The consumer with the highest annual savings (Con04). (c) The prosumer with the lowest annual savings (Pro02). (d) The prosumer with the highest annual savings (Pro06). The numbers are in NOK, where 1 NOK = 0.099 EUR.
Energies 17 04048 g008
Table 1. Grid rent prices introduced in July 2022 for consumers in the area, operated by Elvia, the largest DSO in Norway [36]. The numbers are in NOK, where 1 NOK = 0.099 EUR.
Capacity Step [kW]Fixed Monthly Fee Energy Charge
Day (06:00–22:00)
Energy Charge Night (22:00–06:00) and Weekend
Step 10–2 kW125 NOK0.4310 NOK/kWh0.3685 NOK/kWh
Step 22–5 kW200 NOK
Step 35–10 kW325 NOK
Step 410–15 kW450 NOK
Step 515–20 kW575 NOK
Table 2. Consumption data for households without PV (Con01–Con10). The data are based on the hourly demand (kWh/h) for the entire year of 2022.
Con01Con02Con03Con04Con05Con06Con07Con08Con09Con10
Yearly electricity demand [kWh]23,77315,02817,54822,58128,15125,01119,48236,18825,60837,078
Maximum peak load demand [kWh/h]8.625.708.7412.6311.8811.7210.6714.3611.8420.13
Average peak load demand [kWh/h]2.71
±1.53
1.72
±0.99
2.00
±1.14
2.58
±1.96
3.21
±1.95
2.86
±2.02
2.22
±1.80
4.13
±2.22
2.92
±2.29
4.23
±3.30
Table 3. Consumption data for households with PV (Pro01–Pro10). The data are based on the hourly demand (kWh/h) for the entire year of 2022.
Pro01Pro02Pro03Pro04Pro05Pro06Pro07Pro08Pro09Pro10
PV installation [kWp] 10 2.5 4.3 7.7 9.3 8.3 3.2 9.7 3.3 3.5
Yearly electricity import [kWh] 10,972 10,215 19,286 20,734 20,125 14,120 19,960 22,067 16,734 11,995
Maximum peak load import [kWh/h] 10.85 5.2 18.3 16.98 16.56 8.65 10.08 12.08 9.3 9.18
Average peak load import [kWh/h]1.25
±1.37
1.17
±0.87
2.20
±2.48
2.37
±2.62
2.30
±2.14
1.61
±1.40
2.28
±1.99
2.52
±2.24
1.91
±1.54
1.37
±1.51
Yearly electricity export [kWh] 8128 615 2303 4390 2922 6151 1293 4341 1313 1846
Maximum peak load export [kWh/h] 8.38 1.68 3.19 6.60 6.47 8.60 2.28 7.88 2.49 2.58
Average peak load export [kWh/h]0.93
±1.89
0.07
±0.21
0.26
±0.60
0.50
±1.27
0.38
±0.91
0.70
±1.63
0.15
±0.39
0.50
±1.37
0.15
±0.39
0.21
±0.51
Table 4. Battery parameters in dialog with a commercial battery system provider operating in Norway.
ParameterValue
Charging efficiency factor A c h 96.03%
Discharging efficiency factor A d i s c h 90.21%
Minimum battery state of charge O m i n 0 kWh
Maximum battery state of charge O m a x 10.24 kWh
Maximum charging power Q c h 10 kW
Maximum discharging power Q d i s c h 10 kW
Degradation cost charging K c h 0.0002 NOK/kWh
Degradation cost discharging K d i s c h 0.0002 NOK/kWh
Table 5. Parameters for profitability analyses set in dialog with a commercial battery provider operating in Norway.
ParameterValue
Investment cost C 0 100,000 NOK
Economic lifetime N 15 years
Discount rate r 6%
Table 6. Potential annual savings, net present value, and payback time for residential battery investments. The numbers are in NOK, where 1 NOK = 0.099 EUR.
Potential Annual Savings [NOK]Net Present Value [NOK]Payback Time [years]
ConsumersLowest annual savings (Con01)232377,43844
Highest annual savings (Con04)334467,52230
Average annual savings (Con01–Con10)280872,72836
ProsumersLowest annual savings (Pro02)238576,83642
Highest annual savings (Pro06)429558,28624
Average annual savings (Pro01–Pro10)348166,19229
Disclaimer/Publisher’s Note: The statements, opinions and data contained in all publications are solely those of the individual author(s) and contributor(s) and not of MDPI and/or the editor(s). MDPI and/or the editor(s) disclaim responsibility for any injury to people or property resulting from any ideas, methods, instructions or products referred to in the content.