Article

Effects and Mechanisms of Dilute-Foam Dispersion System on Enhanced Oil Recovery from Pore-Scale to Core-Scale

1
College of Petroleum Engineering, China University of Petroleum, Beijing 102249, China
2
Key Laboratory of Petrophysics and Fluid Flow through Porous Media, China National Petroleum Corporation, Beijing 100083, China
3
Research Institute of Petroleum Exploration & Development, PetroChina, Beijing 100089, China
*
Author to whom correspondence should be addressed.
Energies 2024, 17(16), 4050; https://doi.org/10.3390/en17164050
Submission received: 13 June 2024 / Revised: 16 July 2024 / Accepted: 24 July 2024 / Published: 15 August 2024

Abstract

:
The dilute-foam dispersion system improves oil recovery by reducing interfacial tension between oil and water, altering wettability, and diverting displaced fluids by plugging larger pores. An optimized foaming system is obtained by formability evaluation experiments, in which the half-life for drainage and foaming volume by different types and concentrations of surfactants are analyzed, followed by the addition of partially hydrolyzed polyacrylamide (HPAM) with varied concentrations to enhance the foam stability. Using COMSOL Multiphysics 5.6 software, the Jamin effect and plugging mechanism of the water–gas dispersion system in narrow pore throats were simulated. This dispersion system is applied to assist CO2 huff-n-puff in a low-permeability core, combined with the online NMR method, to investigate its effects on enhanced oil recovery from the pore scale. Core-flooding experiments with double-pipe parallel cores are then performed to check the effect and mechanism of this dilute-foam dispersion system (DFDS) on enhanced oil recovery from the core scale. Results show that foam generated by combining 0.6% alpha-olefin sulfonate (AOS) foaming agent with 0.3% HPAM foam stabilizer exhibits the strongest foamability and the best foam stability. The recovery factor of the DFDS-assisted CO2 huff-n-puff method is improved by 6.13% over CO2 huff-n-puff, with smaller pores increased by 30.48%. After applying DFDS, the minimum pore radius for oil utilization is changed from 0.04 µm to 0.029 µm. The calculation method for the effective working distance of CO2 huff-n-puff for core samples is proposed in this study, and it is increased from 1.7 cm to 2.05 cm for the 5 cm long core by applying DFDS. Double-pipe parallel core-flooding experiments show that this dispersion system can increase the total recovery factor by 17.4%. The DFDS effectively blocks high-permeability layers, adjusts the liquid intake profile, and improves recovery efficiency in heterogeneous reservoirs.

1. Introduction

When a reservoir develops into a high water-cut stage, its high heterogeneity and interlayer contradictions cause severe water channeling in high-permeability layers and leave significant residual oil in low-permeability layers, resulting in a poor overall recovery factor. Many researchers have studied the water–gas dispersion system’s ability to redirect liquid flow and improve oil displacement efficiency through laboratory experiments [1,2,3,4].
The water–gas dispersion system consists of a mixture of water and gas, with gas dispersed into the liquid phase [5]. Foam is one type of water–gas dispersion system. Depending on the characteristic value (gas volume per unit volume of foam), the system can be categorized as either a dilute- or concentrated-foam dispersion system [5]. After a surfactant is added to the water–gas dispersion system, the surface of the bubbles will be covered with a thick, liquid film, and the system viscosity and dynamic shear force will increase. Typically, chemical agents are added to enhance the foam stability. The viscosity of the system, determined by the friction between the liquid films on the bubbles’ surface, mutual squeezing and collision of bubbles, and internal friction of the liquid phase, is further enhanced by the addition of foam stabilizers, delaying the liquid drainage process, achieving better water plugging and profile control, and redirecting liquid flow, thereby enhancing oil displacement efficiency [6,7]. After the addition of stabilizers and additives to the water–gas dispersion system, the dispersed phase is in the form of hexahedrons, resulting in better stability, higher apparent viscosity, and greater seepage resistance. Generally speaking, when the characteristic value is 52~74%, the water–gas dispersion system is called a dilute-foam dispersion system, and when the characteristic value is 74~97%, it is called a concentrated-foam dispersion system [5].
In porous media, the transport mechanisms of the water–gas dispersion system include the Jamin effect, coalescence mechanism, and selective plugging mechanism. The water–gas dispersion system can improve the oil recovery rate by rapidly reducing the gas phase’s relative permeability, delaying the gas breakthrough in the high-permeability layer, and blocking the high-permeability layer. The better the connectivity of the porous medium, the higher the oil recovery rate [8,9,10,11]. Based on these mechanisms, the water–gas dispersion system is effective in regulating the mobility ratio in different layers with different levels of permeability, including ultra-low, low, and medium permeability, achieving more uniform profile control, increasing sweep volume, and reducing residual oil saturation [2,3,12,13].
The M and N Block in Jidong oilfield belong to a low-permeability reservoir (≤50 mD). The M Block is a small, faulted block, and the water-flooding effect is poor because an effective well pattern cannot be established, so a suitable medium needs to be selected for the huff-n-puff method. The N Block shows strong heterogeneity after long-time water injection, leading to high-permeability channels. It is necessary to use the profile control and water plugging method to improve oil recovery. A suitable dilute-foam dispersion system is selected for both the M and N Blocks, in which a low concentration of HPAM is added as a foam stabilizer. The selected dispersion system is used as an assistant medium to CO2 huff-n-puff, and its enhanced oil recovery effect from the pore scale is investigated. This dispersion system is then studied from the core scale and used in a parallel two-pipe core-flooding experiment, from which the effect and mechanism of the dispersion system over water-flooding are concluded. At present, there is a lack of systematic research on the mechanism of the profile control and plugging of the dilute-foam dispersion system, and the law of foam migration is not clear. In this paper, COMSOL Multiphysics 5.6 software and laboratory experiments are combined to systematically study the blocking mechanism and enhanced oil recovery effect of a dilute-foam dispersion system from the micro to the macro scale through various experimental means, which provides guidelines for the application of a dilute-foam dispersion system in an oilfield.

2. Simulation of Jamin Effect in Water–Gas Dispersion System

The Jamin effect in the flow of the water–gas dispersion system generates greater flow resistance during displacement, preventing fluid channeling. Using COMSOL Multiphysics software, the Jamin effect of dispersed-phase bubbles moving through narrow pore throats under different surface tension conditions is simulated.

2.1. Simulation of Jamin Effect in Simplified Channels

2.1.1. Level-Set Function and Fluid Control Equation

(1)
Level-Set Function
The level-set function is an effective method to solve the gas–liquid interface movement on the pore scale which can naturally deal with the topological changes and simulate the migration mechanism of the water–gas dispersion system under the simplified pore channels. The level-set function is a smooth, continuous function with a value of 0.5 on the interface. In the transition layer near the interface, the function ϕ smoothly changes from 0 to 1. In the liquid-filled area, ϕ < 0.5, and in the CO2 area, ϕ > 0.5.
The discontinuity of fluid parameter changes at the interface when simulating moving boundary is solved by fixing interface thickness. In the CFD module of COMSOL, the following level-set equations are solved.
ϕ t + u · ϕ = γ · ( ε ϕ ϕ ( 1 ϕ ) ϕ | ϕ | )
In the formula, ε is the interface thickness control parameter, and the ideal value is half of the maximum cell size: ε = hc/2. γ is the interface initialization parameter (equal to the entry speed). In the simulation, the parameter γ defines the reinitialization intensity as 0.001 m/s.
(2)
Fluid Control Equation
The water–gas dispersion system is an incompressible fluid, and the fluid momentum equation is expressed by the incompressible Navier–Stokes equation of gas-liquid two-phase flow. The surface tension should be considered in the calculation process:
Navier–Stokes equations:
ρ u t + ρ u · u · p I + μ μ + μ T = F s t
· u = 0
F s t = σ δ κ n
δ = 6 ϕ 1 ϕ | ϕ |
In the formula, ρ : fluid density; u : fluid velocity vector; t: time; μ : hydrodynamic viscosity; p: pressure; I : identity matrix; F st : gas–liquid surface tension; n : the interface unit normal boundary vector pointing to the dispersed phase; σ: surface tension coefficient; κ: curvature, κ = − n ; δ : non-zero Dirac function at the fluid interface.

2.1.2. Establishment of Geometric Model

A two-dimensional plane model was established. The pore with radius R1 = 2.8 µm and length 15 µm were on the left side of the pore throat. On the right, there is a throat with a radius of R2 = 1.4 µm, a length of 15 µm, a radius ratio of 2:1, and a bubble radius of the water–vapor dispersion system R = 2.5 µm.

2.1.3. Setting Initial Values and Boundary Conditions

(1)
Initial value
The initial conditions for setting the model are shown in Table 1.
(2)
Setting of boundary conditions
The fluid Reynolds number in the simplified channel is very small, that is, Re < < 1, so the fluid flow state is laminar flow, and the boundary conditions are set as follows:
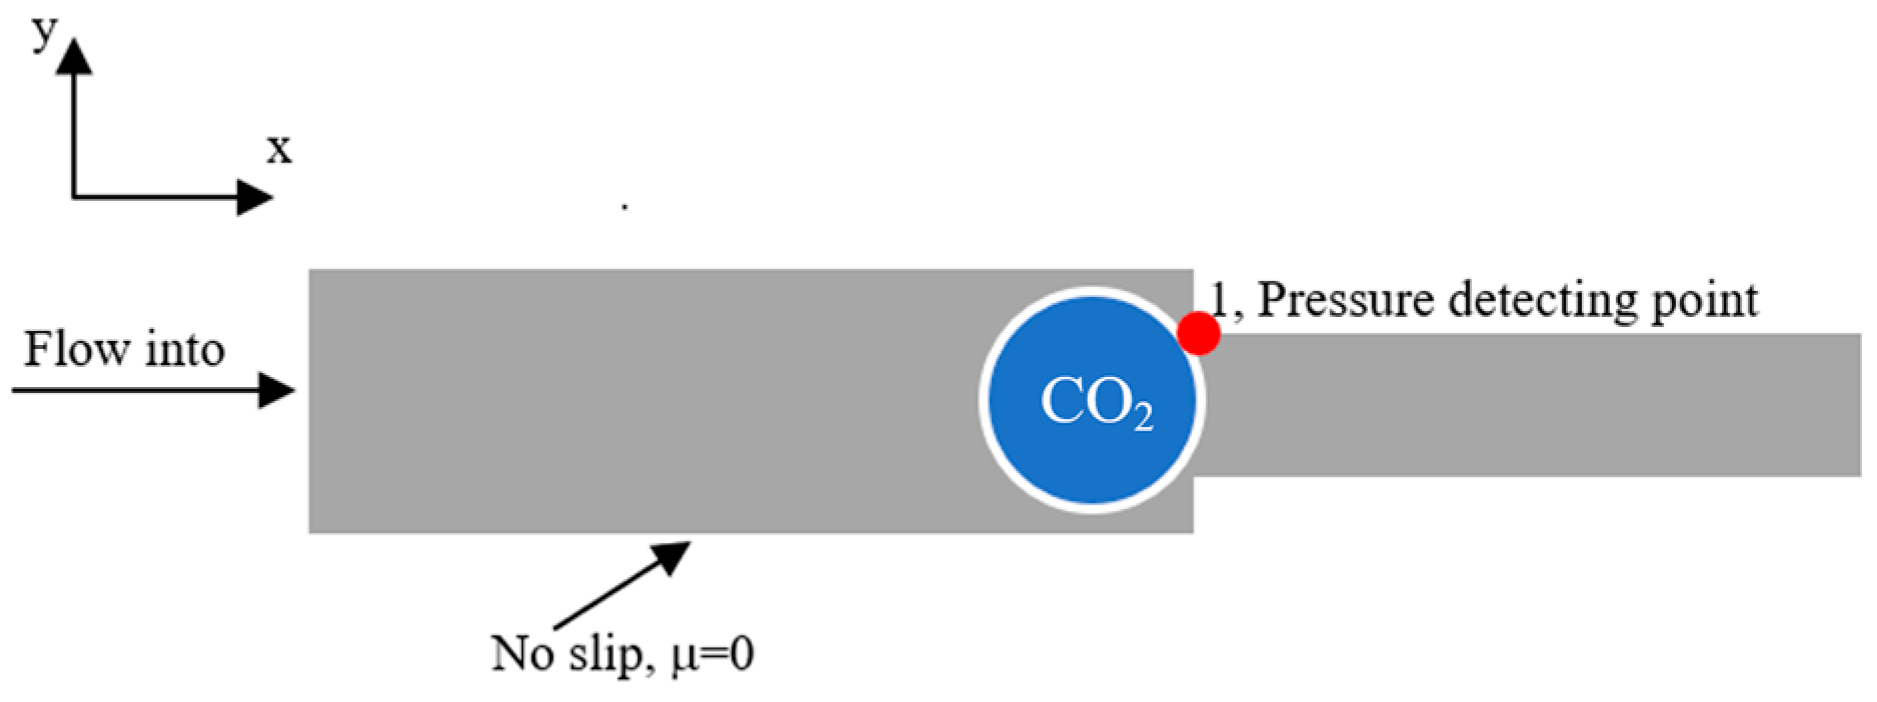
Inlet boundary conditions: The water–vapor dispersion system flows into the left inlet at a certain flow rate through the narrow throat, using the inlet boundary condition with a level-set function of 1.
Outlet boundary condition: The pressure of the water–gas dispersion system fluid flowing out of the fixed outlet is constant, and the outlet pressure is 0.
Wetting wall boundary conditions: the contact angle of the wetting degree of the wall is expressed as θ, and the slip length of the wetting wall is certain. The model and boundary conditions of the Jamin effect in the water–gas dispersion system are shown in Figure 1.

2.1.4. Mesh Division and Model Solving

In this paper, a free triangular mesh is used to divide the model. Key parameters of the grids are set as follows: the maximum cell growth rate is 0.8; the curvature factor is 0.2; and the narrow area resolution is 1. It contains 9846 triangular mesh cells and 5125 mesh vertices, with a minimum cell mass of 0.5337 and an average cell mass of 0.9346. “Transient study including phase initialization” is selected for the simulation of transient two-phase flow.

2.2. Simulation Results

A single CO2 bubble moving from a large pore to a small throat is depicted in Figure 2. At 0.02 s, the bubble undergoes stretching deformation; at 0.07 s, the deformation is at its maximum, with the bubble blocking the pore throat, causing maximum pressure and flow resistance. The cumulative effect of multiple CO2 bubbles can achieve effective plugging. At 0.3 s, most of the bubble passes through the pore throat with a rapid drop in pressure, causing a large change in the gas–liquid interface and resulting in negative pressure. By 0.5 s, the bubble has completely passed through the simulated pore channel.
The influence of surface tension on the pressure change at the pore throat connection point is further analyzed, as shown in Figure 3. It shows that, with the increase in surface tension, it is more difficult for bubbles to stretch and deform, and the pressure at the pore throat connecting point increases. When the surface tension is too low, the pressure decreases, the Jamin effect weakens, and the pores cannot be effectively blocked. Therefore, it is necessary to consider the stability of the dispersed phase bubble and the surface tension of the water–gas dispersion system.

3. Experimental Description

The dilute-foam dispersion system can regulate the profile of heterogeneous reservoirs, improving oil displacement efficiency. However, foam stability affects the system’s plugging effect and oil displacement performance [13]. The surfactants used to form the dilute-foam dispersion system can be anionic, cationic, amphoteric, or nonionic [14]. The types of surfactants used in the dilute-foam dispersion system are shown in Table 2.
The anionic surfactant has good stability and solubility, and the adsorption loss is small in the oil displacement process. Amphoteric surfactants exhibit excellent temperature and salt resistance and can be combined with other surfactants. Although cationic surfactants have good salt resistance, their price is high, and the adsorption loss is great during displacement. Non-ionic surfactants have a high price, low foam performance, poor temperature resistance, and a large adsorption capacity. Therefore, two anionic surfactants and one amphoteric surfactant were selected for screening evaluation. Foamability evaluation experiments were performed to select surfactants with strong foamability and efficient foam stabilizers, formulating a dilute-foam dispersion system. Core-flooding experiments were conducted to determine the blocking effect and mechanism of the foam system on enhanced oil recovery.

3.1. Experimental Materials and Instruments

The following surfactants were used for the experiment: anionic surfactants, sodium dodecyl sulfate (SDS) and alpha-olefin sulfonate (AOS); amphoteric surfactants, betaine surfactant (BS-12).
Foam stabilizer: polyacrylamide (HPAM) with a molecular weight of 15 million.
Gas: nitrogen (purity 99.2–99.999%).
Water: simulated formation water (total salinity of 7516 mg/L).
Oil: mixture of degassed crude oil from Jidong N Block and aviation kerosene, with a viscosity of 1.25 mPa·s (50 °C, 0.101 MPa) and density of 0.797 g·cm−3 (50 °C, 0.101 MPa).
Core: due to the inaccessibility of natural cores from the oilfield, artificial cores were used. Core data and experimental parameters are shown in Table 3.
Instruments: Waring Blender high-speed mixer, high-precision electronic balance (accuracy to 0.001 g), graduated cylinder, stopwatch, YRD-II electric thermostat, DSRT-II displacement pump, high-temperature and high-pressure core holder, etc.

3.2. Foamability and Foam Stability Experimental Methods

The static stability of the foam was evaluated at a temperature of (50 °C) using the Waring Blender method (high-speed stirring). The foaming volume and half-life for the drainage of foam formed by three surfactants were measured.
Experimental procedure:
(1)
Weigh a certain amount of surfactant and dissolve it in 100 mL of distilled water in a beaker. Pour the solution into a high-speed mixer and stir at 10,000 rpm for 1 min.
(2)
Quickly pour the generated foam into a 1000 mL graduated cylinder and start timing. The initial foam volume V (mL), measured at 0 s, indicates the foaming volume.
(3)
Record the time t (s) to drain 50 mL of liquid from the foam, representing the foam’s half-life for drainage and indicating foam stability.

3.3. Pore-Scale Investigation with Online NMR CO2 Huff-n-Puff Experiments

Experimental procedure:
(1)
Put the core in a 50 °C high-temperature and high-pressure gripper and vacuum for 48 h. Close the back pressure valve, and then inject the prepared simulated oil. When the system pressure reaches 20 MPa, stop the pump and stabilize it for a long enough time.
(2)
Close the inlet end and outlet end of the core holder and connect the return pressure valve to the inlet end.
(3)
Dilute-foam dispersive system (DFDS for short)-assisted CO2 huff-n-puff: inject 0.05 PV dilute foam alternately at a pressure of 25 MPa to strengthen the dispersion system and 0.05 PV CO2. When the system pressure reaches 25 MPa, stop the pump and wait for 5 h.
(4)
Then, carry out throughput until the pressure at the gas injection end drops to 15 MPa, and measure and record the oil production; proceed to the next injection huff. Repeat steps (2)–(3) three or more times until no oil is produced and the final huff pressure is reduced to atmospheric pressure. Test the NMR T2 spectra after each round of huff-n-puff and perform NMR imaging analysis after huff-n-puff. The experimental parameters are shown in Table 3.

3.4. Core-Scale Investigation with Core-Flooding Experimental Methods

Parallel double-pipe core displacement experiments were then performed to investigate the profile control and water-plugging effects of this system.
Experimental procedure:
(1)
After the core is vacuumed, saturate it with formation water, measure its wet weight, and calculate the effective pore volume. Measure the gas permeability and use crude oil to displace the water until no water is produced, calculating the oil saturation.
(2)
Age the core in a 50 °C electric thermostat for 12 h.
(3)
Water flooding: maintain the thermo-tank at 50 °C, set the back pressure to 10 MPa, and displace the core at a constant flow rate.
(4)
Parallel double-pipe core displacement: after water flooding, inject the DFDS (0.1 PV CO2 + 0.1 PV foaming solution + 0.1 PV CO2) into cores 3# and 4#, and then inject water again until the combined water cut at the outlet is 98%.
The experimental data error is about 2%.

4. Experimental Results and Analysis

4.1. Selection of Foaming Agent and Stabilizer

4.1.1. Selection of Type and Concentration of Foaming Agent

Using distilled water, 10 different concentrations (0.1~1%) of three surfactants were prepared. The foam performance was evaluated using the high-speed stirring method to determine the half-life for drainage and the foam volume.
The foam volume and the half-life for drainage at different surfactant concentrations are shown in Figure 4 and Figure 5, respectively. As the surfactant concentration increased, both the foam volume and the half-life for drainage increased until the concentration reached 0.6%, after which they remained relatively constant. At higher concentrations, micelles formed within the water phase, and the gas–liquid interface properties had no more significant change, leading to stable foam stability. Among the three surfactants, at concentrations of 0.6~1.0%, there was little difference in foaming volume, but AOS had a longer half-life for drainage, indicating better foam stability. Among the three surfactants, the half-life of AOS was the longest due to its high zeta potential, the large number of monomer molecules in the solution, and the increment in the elasticity and strength of the liquid film due to the repulsion between molecules [16]. At the same time, the negative charge in the molecular head group of an anionic surfactant forms a diffusion double electric layer on the gas–liquid surface. When the liquid films are close to a certain degree, liquid films with the same charge will repel each other to prevent them from thinning and will be more stable than the foam made by amphoteric surfactants [17]. Therefore, 0.6% AOS was selected as the foaming agent for the subsequent dilute-foam dispersion system.

4.1.2. Selection of Foam Stabilizer Concentration

Using 0.6% AOS as the foaming agent, the effect of varied HPAM concentrations on foam volume and half-life for drainage was studied, and the results are shown in Figure 6.
As the HPAM concentration increased, the foam volume decreased, but the decrease was relatively slow. The half-life for drainage increased with HPAM concentration from 0% to 0.3% but then remained stable as the concentration increased further. Therefore, 0.3% HPAM was chosen as the foaming stabilizer.
From these experiments, the composition of the foam dispersion system was determined to be 0.6% AOS + 0.3% HPAM. According to the foaming volume of the foam dispersion system, the characteristic value of the foam is 0.72, which belongs to the dilute foam dispersion system. This dilute foam dispersion system was then used in experiments for pore-scale and core-scale investigation.

4.2. Mechanisms of Enhanced Oil Recovery by DFDS from Pore-Scale

Experiments of CO2 huff-n-puff with and without DFDS combined with online Nuclear Magnetic Resonance (NMR) technology were performed. The relaxation time was converted into the pore radius for analysis with the following equation:
r = C × T 2
T 2 : T 2 spectrum; r : pore radius, µm; C : conversion coefficient. Generally, it is 0.02.
The T 2 spectrum of each huff-n-puff cycle is shown in Figure 7, and the extent of oil utilization in pores with different ranges of radium is shown in Figure 8.
The pore size distribution of the two cores, 1# and 2#, can be analyzed by T2 spectra after the cores are saturated with oil. The pore diameter distribution of the core is relatively simple due to the artificial effect, mainly concentrated in 0.6~10 µm, with a peak value of 3.6 µm, and there are fewer pores distributed between 0.02 and 0.6 µm. The crude oil signal gradually decreases with the increase in huff-n-puff cycles, and the pores of 0.6–10 µm are the main oil-producing pores. The oil signal decline of DFDS-assisted CO2 huff-n-puff (core 2#) is much greater than that of CO2 only (core 1#), and the recovery degree of core 2# is 42.13%, which is 6.13% higher than that of core 1#.
To be more generalized in pore size classification, the pore sizes were classified into small pores and large pores, with 2 µm being the characteristic value. Compared with the extent of crude oil production in pores with different radii, the minimum pore radius limit for single CO2 huff-n-puff is 0.0476 µm, and the recovery factor (RF) of crude oil in 0.2~2 µm after CO2 huff-n-puff is 26.67%, and in 2~200 µm, it is 40.54%. The minimum available pore radius for DFDS-assisted CO2 huff-n-puff is 0.029 µm. The RF of crude oil in 0.2~2 µm is 58.00%, and in 2~200 µm pores, it is 35.44%. DFDS-assisted CO2 huff-n-puff increased the lower limit of the pore radius and enhanced the productivity of crude oil in 0.2~2 µm pores, and the RF increased by 30.48% compared with CO2 only.
DFDS can effectively block the macropores after assisting CO2 huff-n-puff and improve the recovery degree of huff-n-puff.
The online NMR imaging results after huff-n-puff are shown in Figure 9. It is obvious from the images that, by applying DFDS, the residual oil is greatly reduced. To be more quantitative, the effective working distance is introduced to characterize oil utilization by CO2 huff-n-puff in the core with and without DFDS. The effective working distance is defined to be equal to the volume of oil produced at the end of the huff-n-puff, divided by the product of the cross-sectional area of the core and the porosity.
D = Q A × φ
D is the effective working distance, cm; Q is oil volume produced, cm3; φ is the porosity; A is the core cross-sectional area, cm2.
The results show that the effective distance of CO2 huff-n-puff is 1.70 cm, and the DFDS-assisted CO2 huff-n-puff distance is 2.05 cm, indicating once again that DFDS-assisted CO2 can further improve the huff-n-puff effect.

4.3. Mechanisms of Enhanced Oil Recovery by DFDS from Core-Scale

To study the profile control and water-plugging effect, a double-pipe parallel core displacement experiment was designed. The experiment used two long cores with a permeability ratio of 5, and the core data are shown in Table 3. The core displacement results are shown in Table 4.
The oil recovery factor curves in parallel cores and an illustration picture are shown in Figure 10. The relatively high-permeability core (3#) was first broken through during water flooding, while the relatively low-permeability core (4#) had a smaller swept volume. Therefore, during the water-flooding stage, when the total water cut at the core outlet reached 90%, 3# core had a higher oil recovery rate of 47.9%, while 4# core had a lower oil recovery rate of 17.3%, with a combined water-flooding oil-recovery factor of 36.9%.
Then DFDS was injected (0.1 PV CO2 + 0.1 PV Foaming solution + 0.1 PV CO2), reducing the combined water cut to 65%. Then, water was continuously injected until 2.3 PV, and finally the oil recovery factor of 3# core and 4# core increased significantly to 60.1% and 47.8% respectively. The ultimate increment in the combined oil recovery rate is 17.4%. The main reason for this phenomenon is that the DFDS can block dominant channels, playing a role in temporary plugging and diversion so that the injection pressure increases, allowing the system to enter the low-permeability core and displace more oil.

5. Conclusions

This study used foamability evaluation experiments to select surfactants and foam stabilizers, forming a new dilute-foam dispersion system. The system’s abilities and mechanisms to enhance oil recovery were examined by an online NMR CO2 huff-n-puff experiment and analyzed on a pore scale. Then, its plugging effect and profile control mechanism were also examined through double-pipe parallel core-flooding. The main conclusions are as follows:
(1)
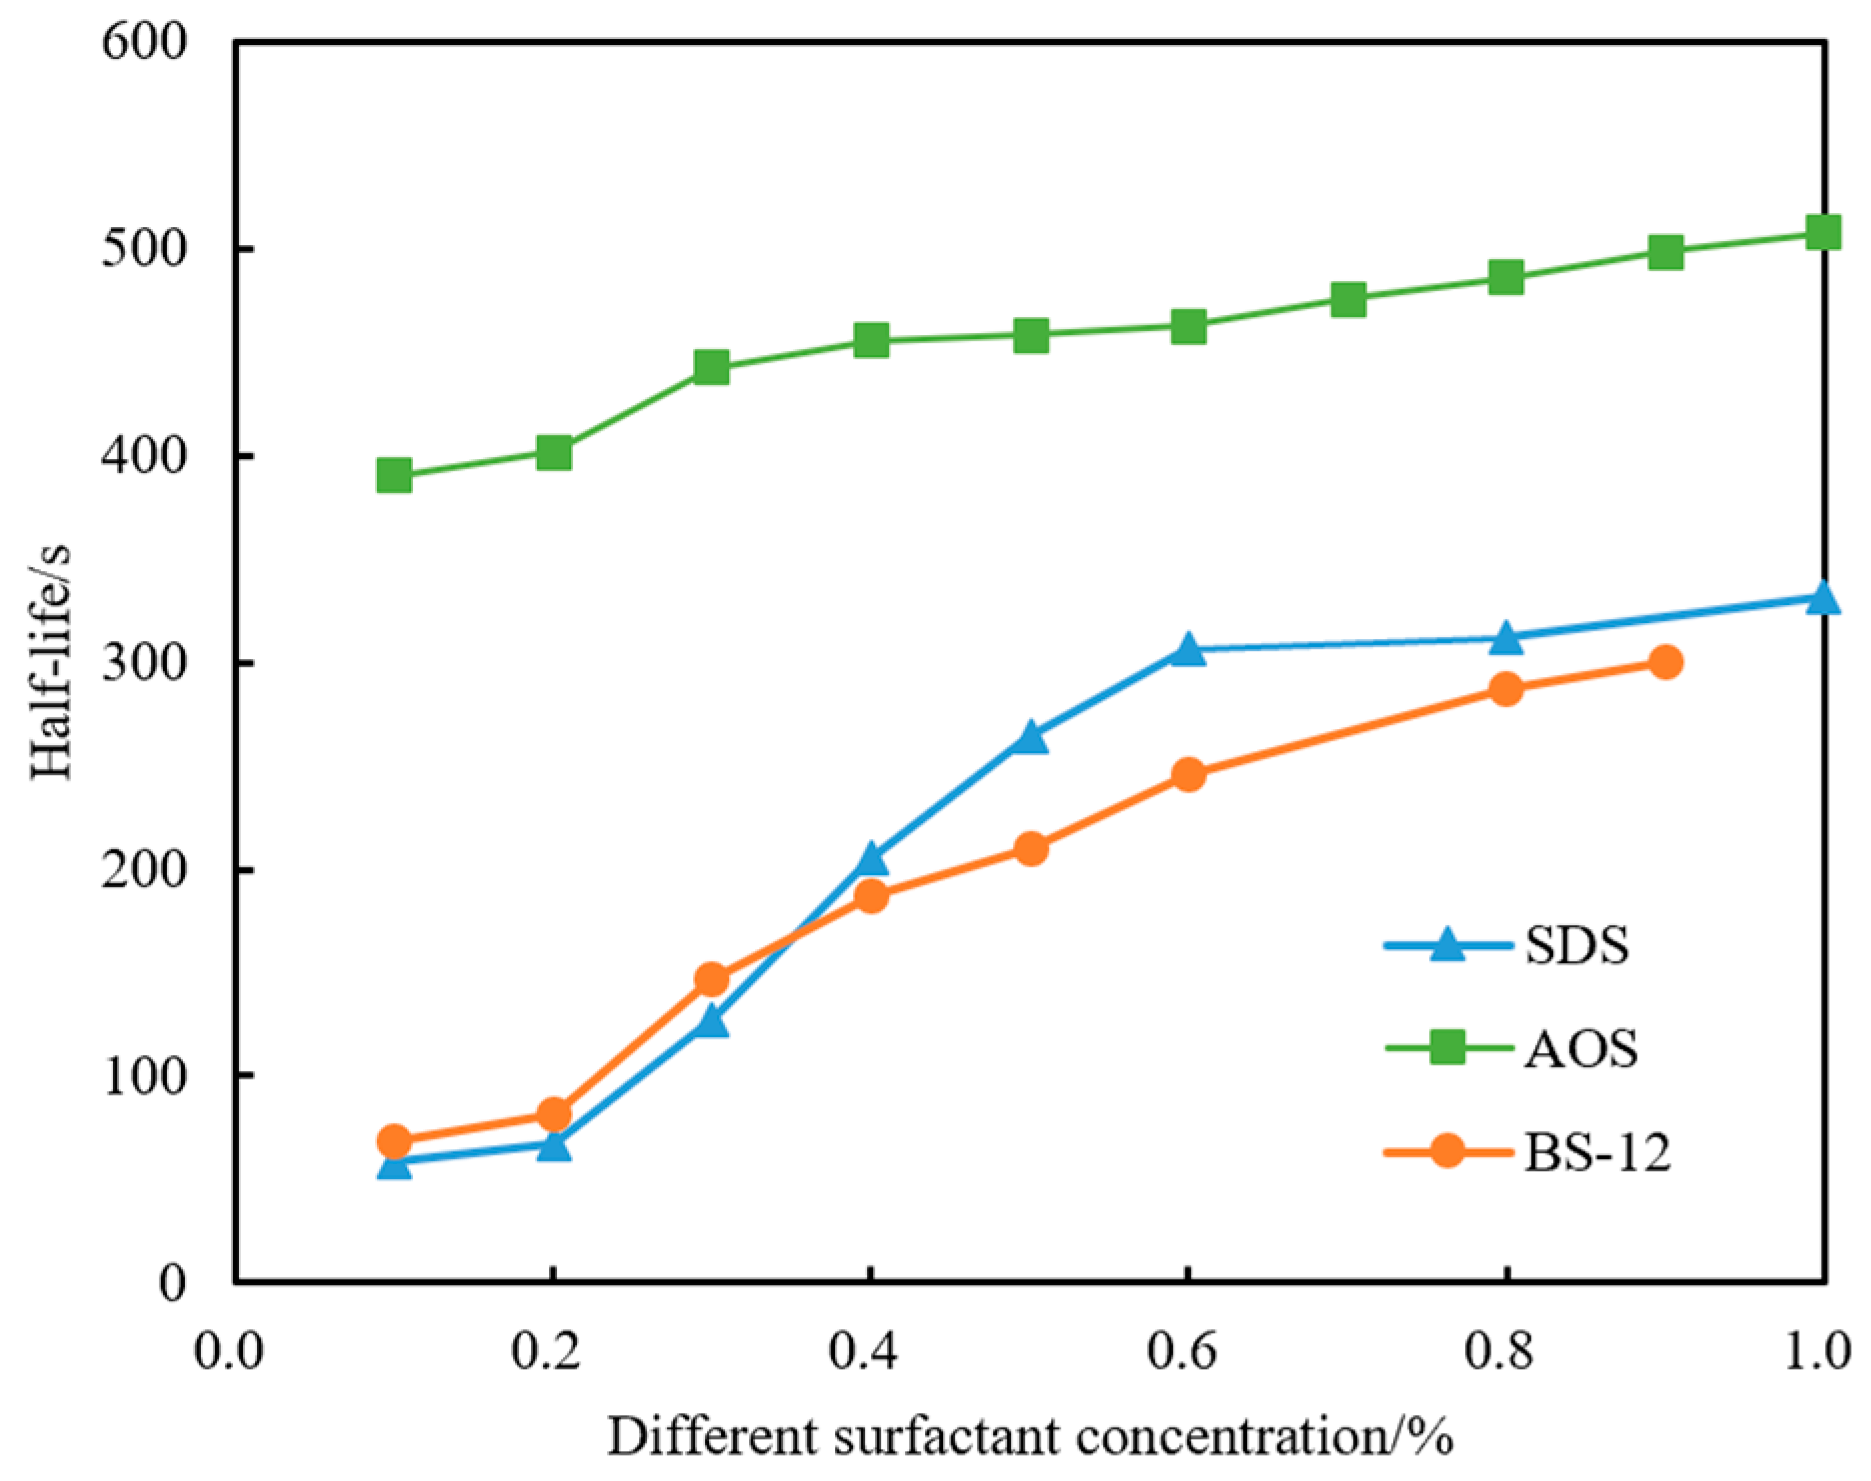
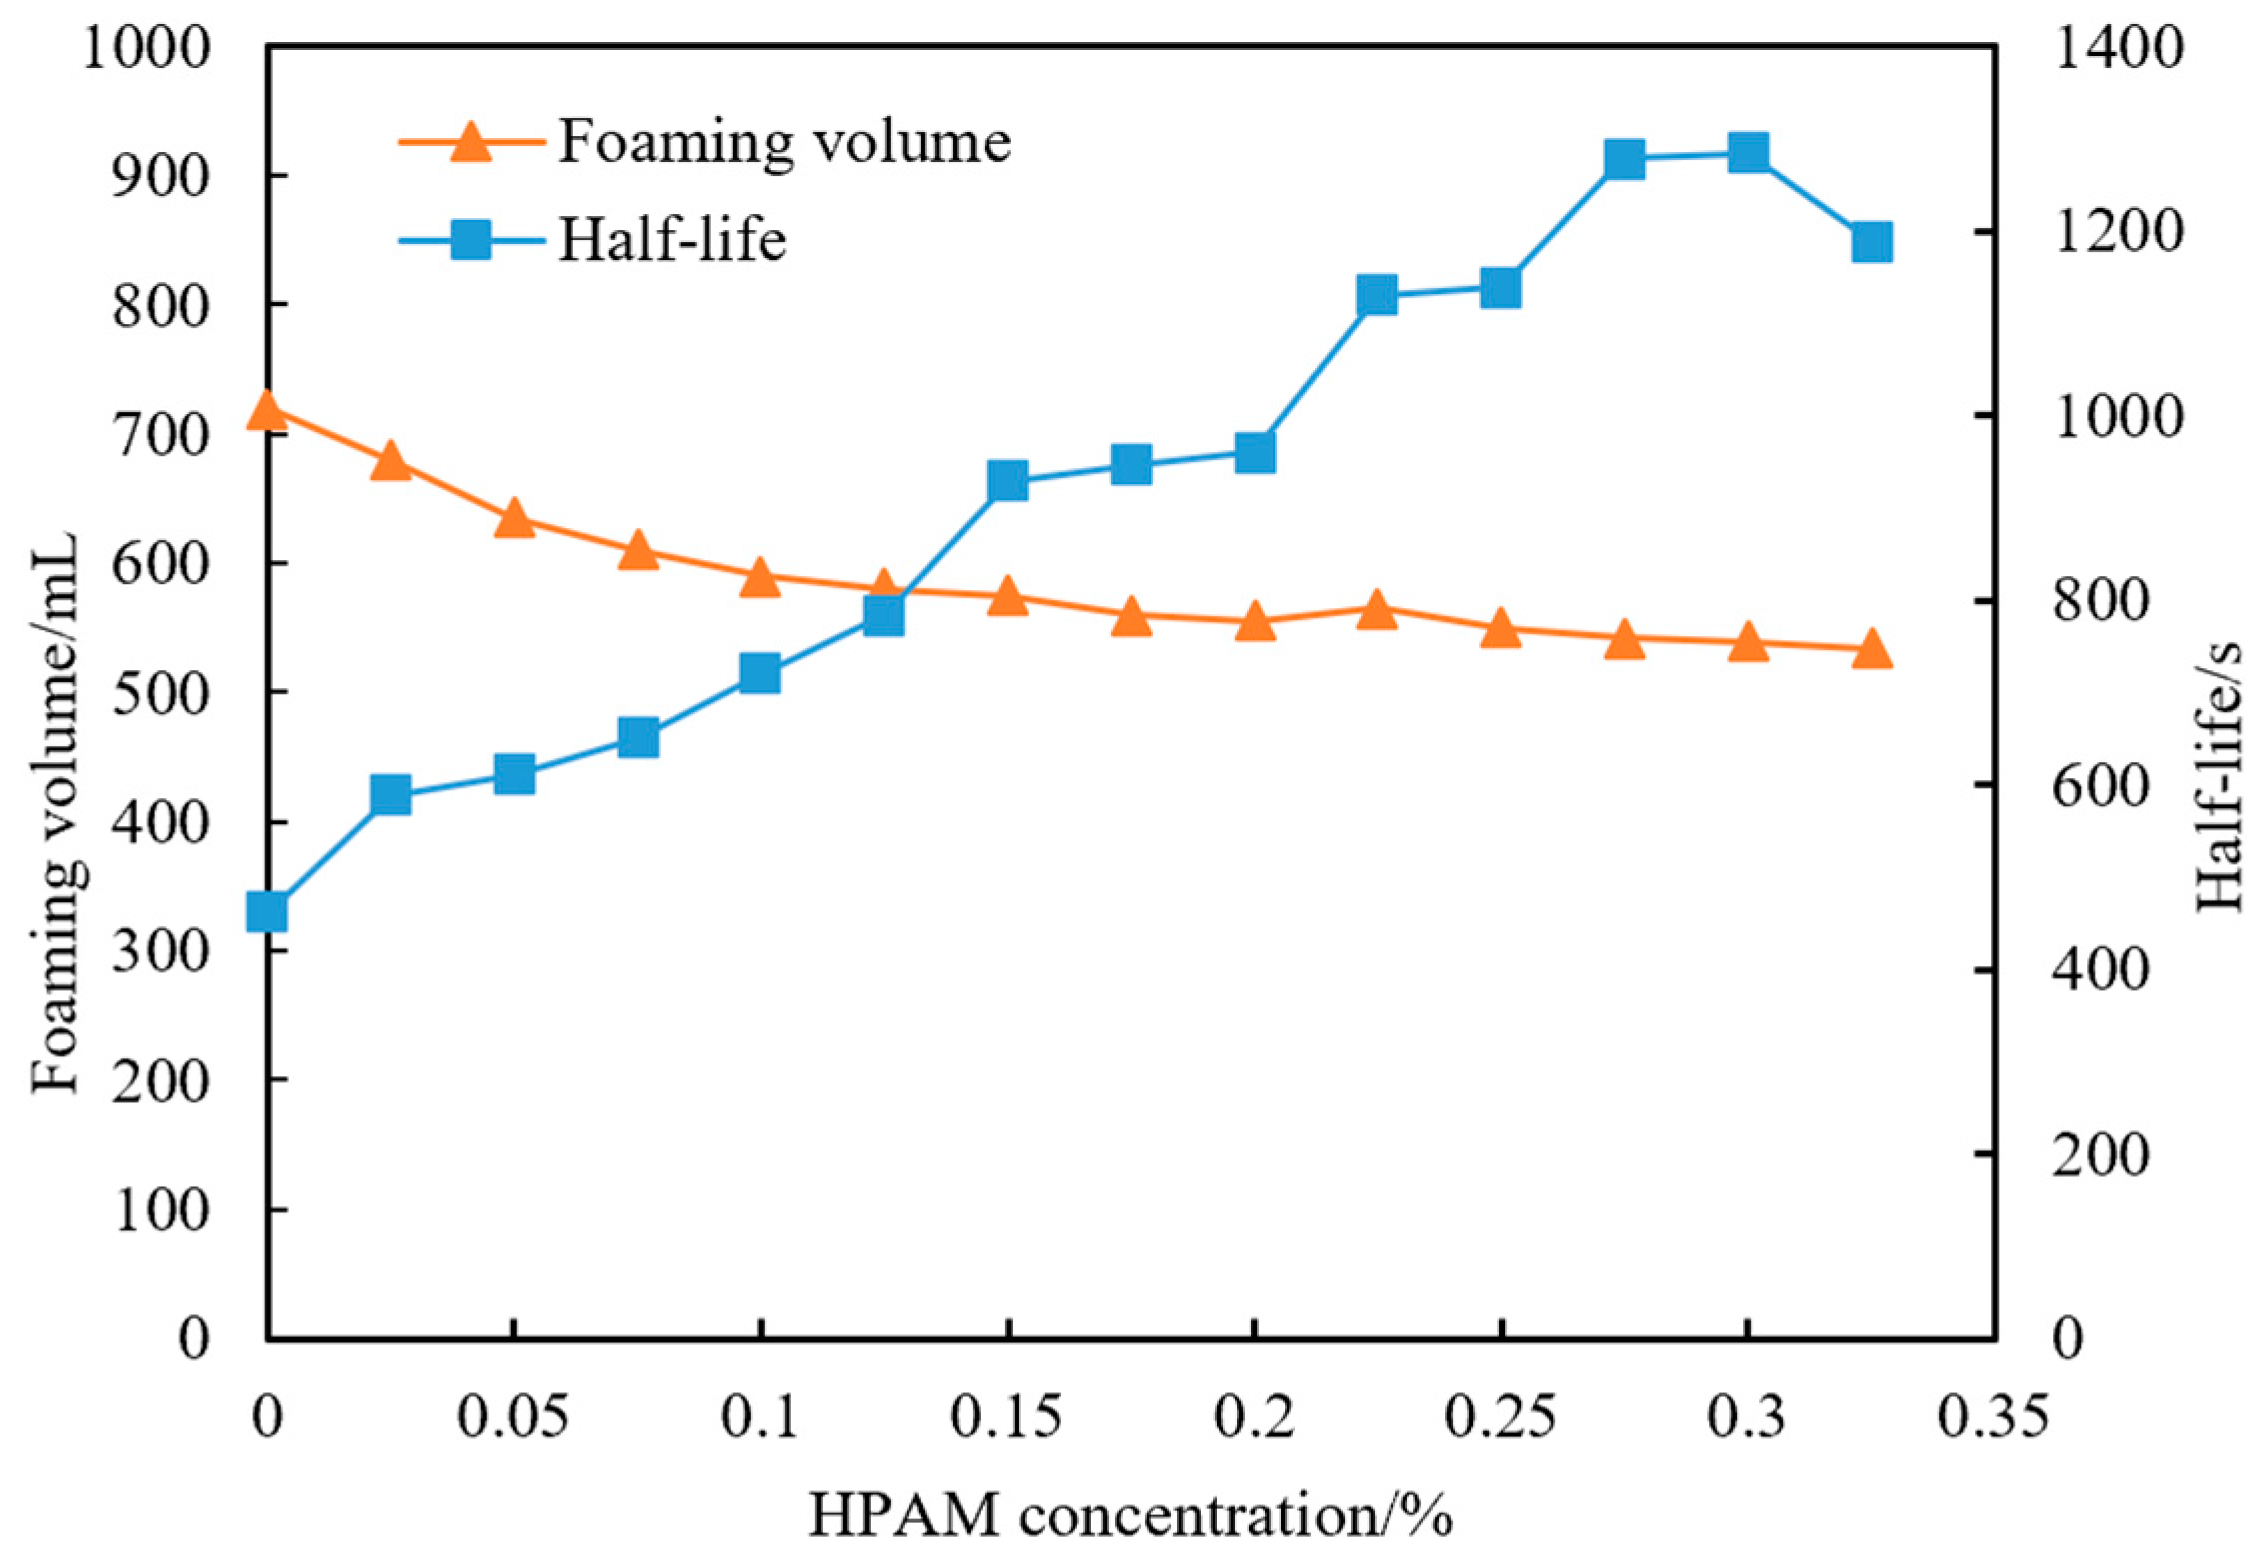
Foam stability evaluation: The static stability of the foam was evaluated using the high-speed stirring method, comparing three typical surfactants: sodium dodecyl sulfate (SDS), betaine surfactant (BS-12), and alpha-olefin sulfonate (AOS). The concentrations of foam stabilizers were also screened, with the optimal system being 0.6% AOS foaming agent + 0.3% HPAM.
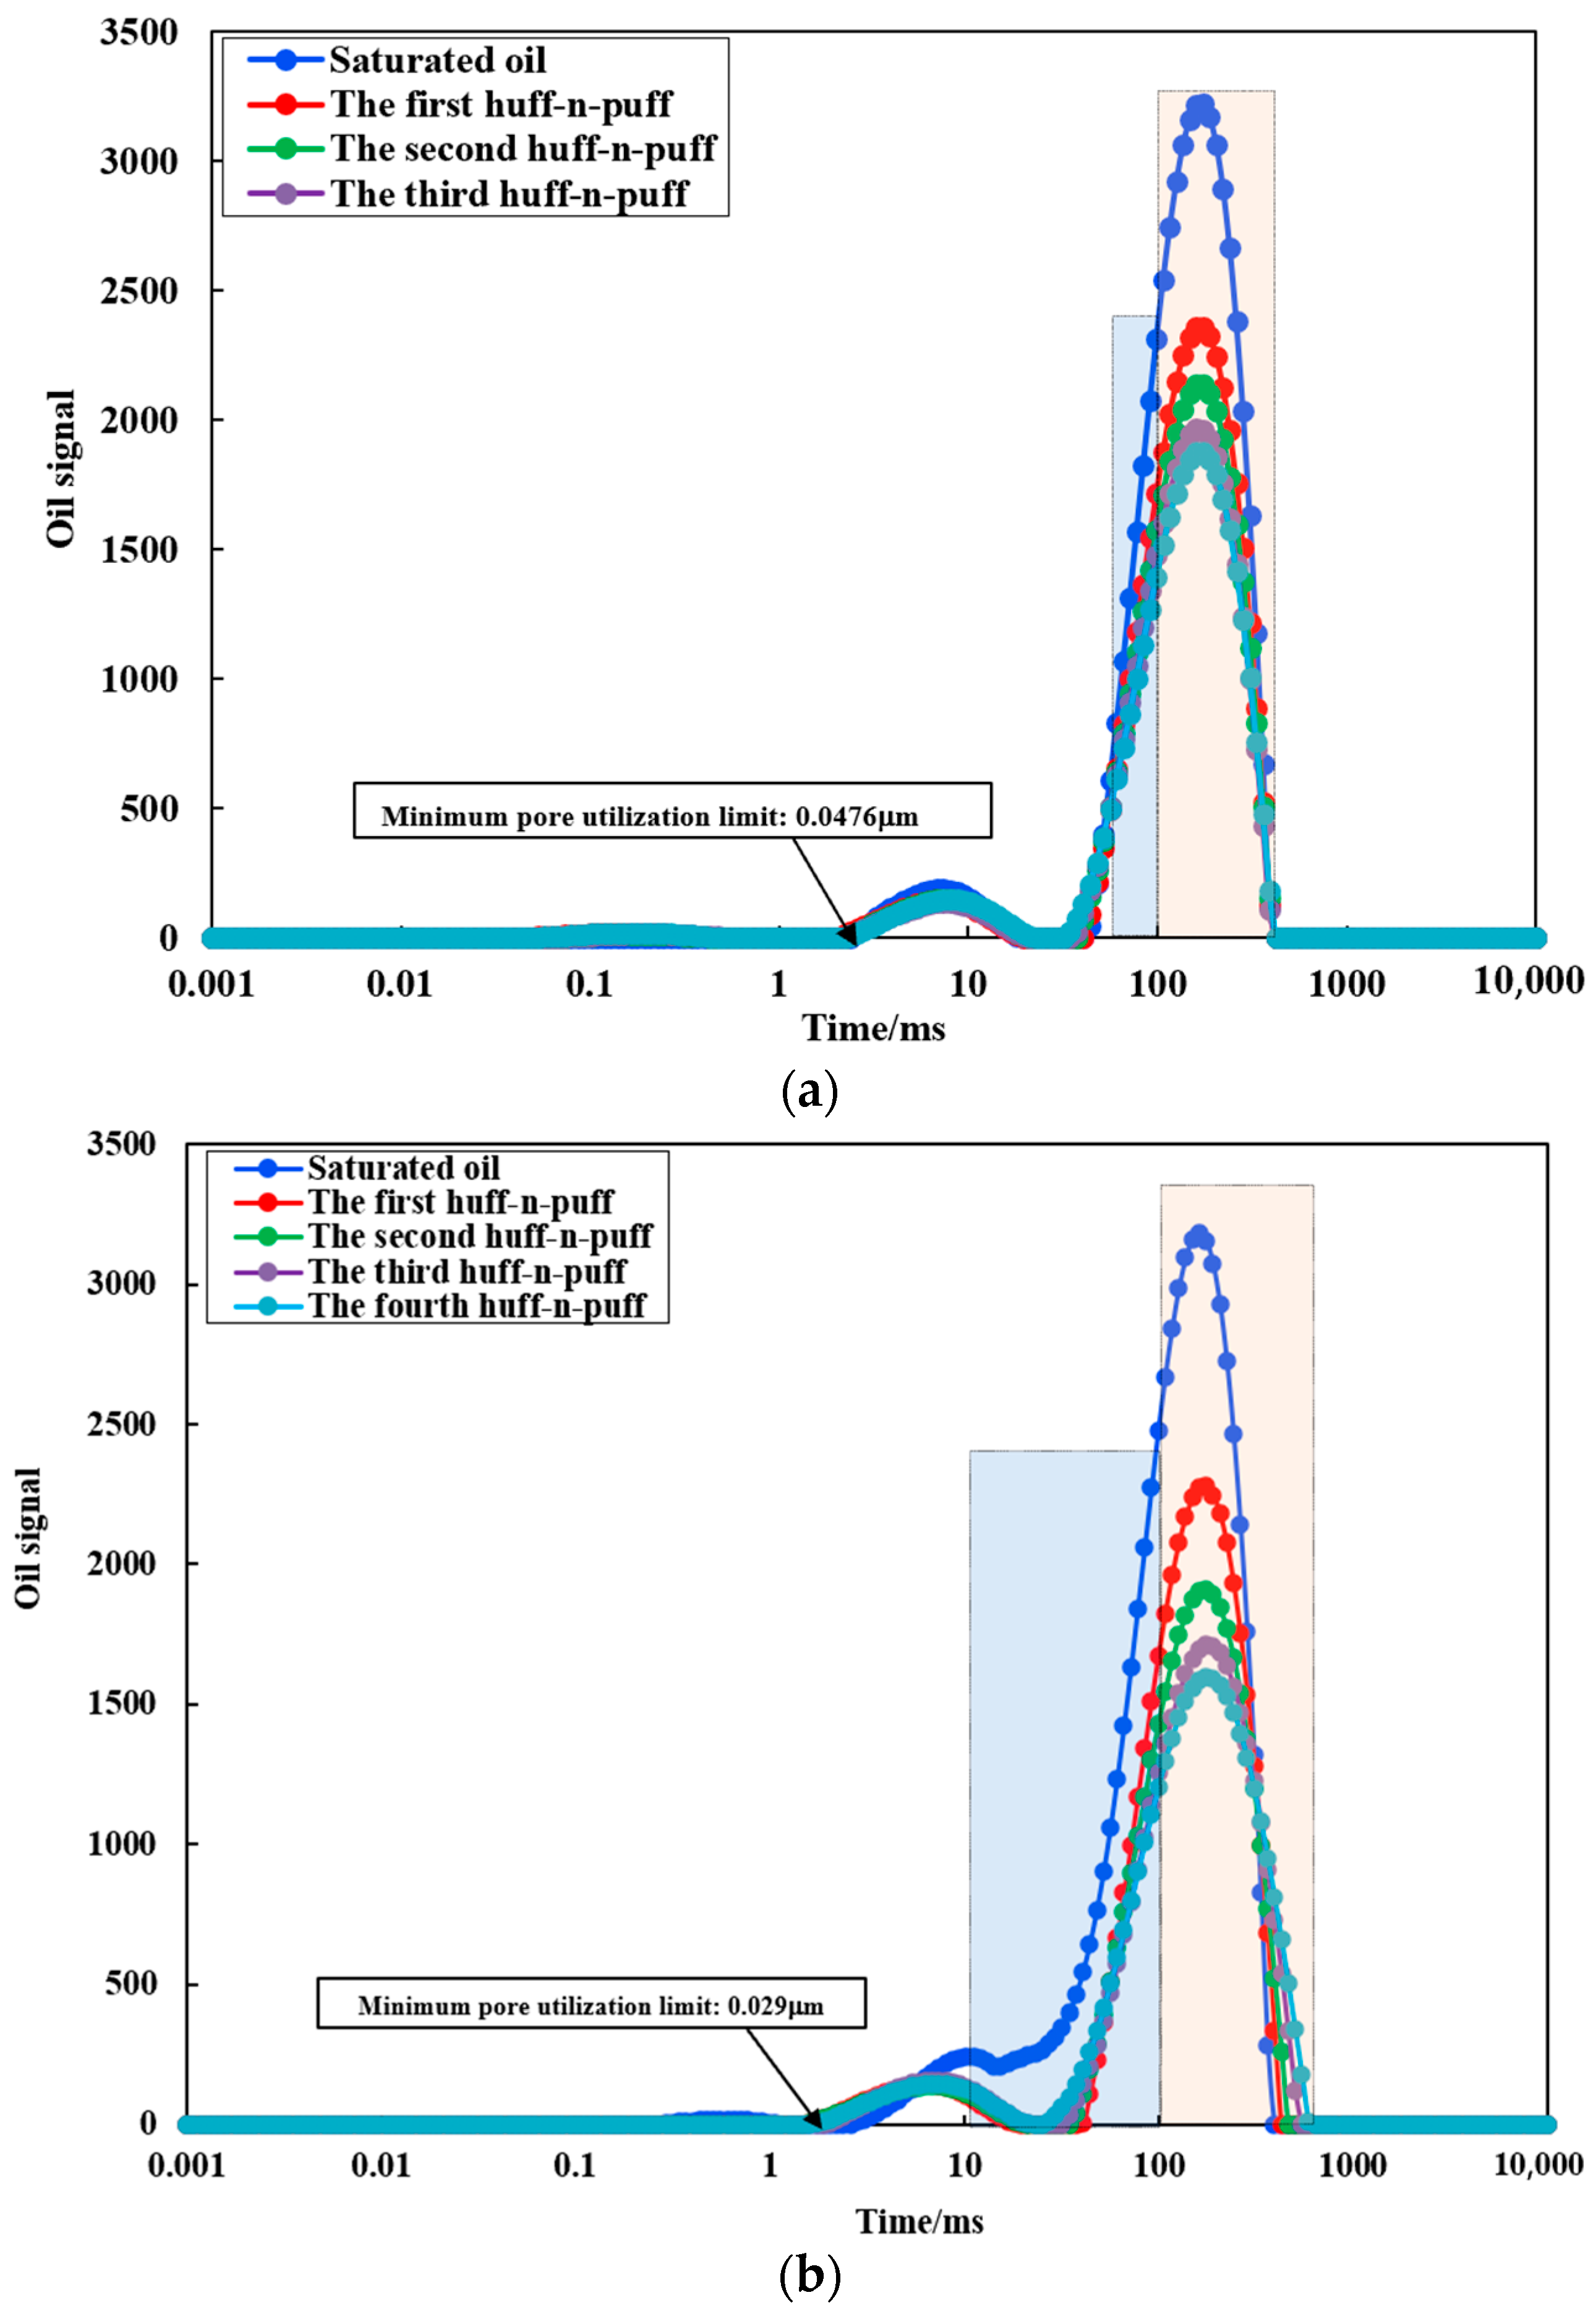
(2)
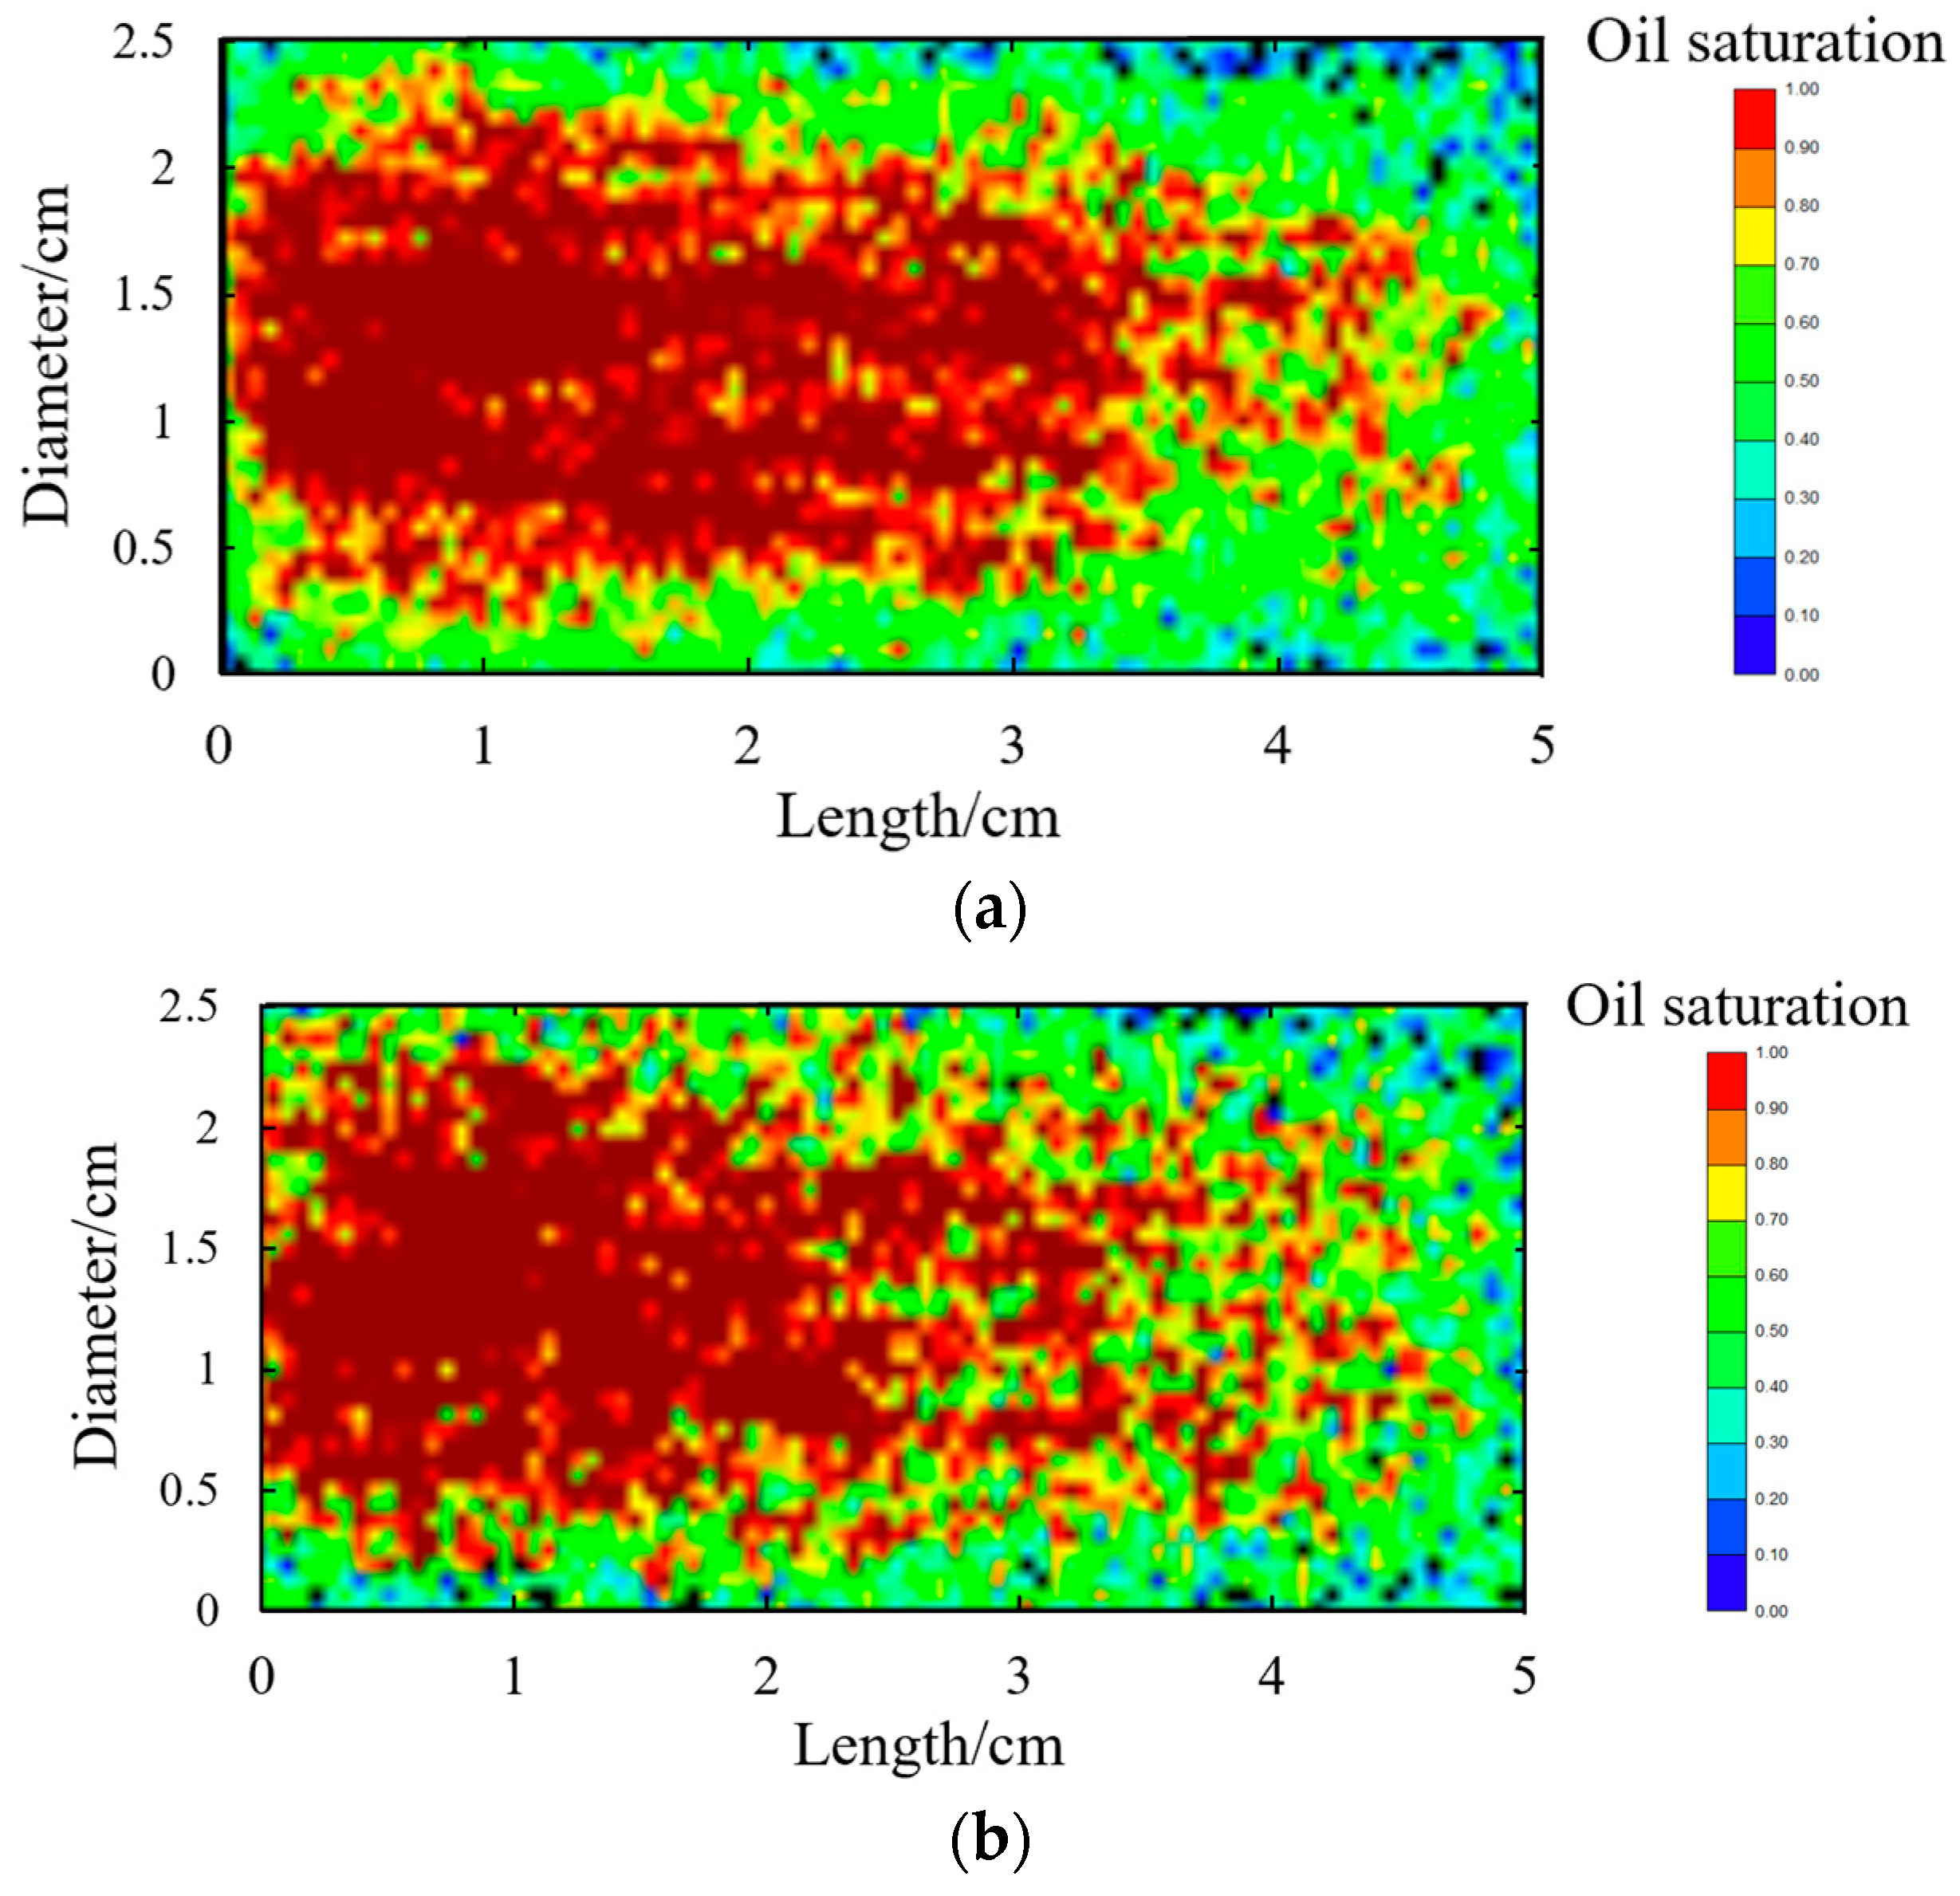
DFDS-assisted CO2 huff-n-puff can improve the degree of recovery in 0.2~2 µm pores. Compared with CO2 huff-n-puff, DFDS-assisted CO2 huff-n-puff reduced the lower limit of available pores from 0.0476 µm to 0.029 µm and increased the effective working distance from 1.7 cm to 2.05 cm on a 5 cm long core scale, increasing the contribution rate of 0.2–2 µm pores to the total recovery degree by 30.48%. This shows that DFDS can increase the swept volume and, thus, improve the recovery factor of CO2 huff-n-puff.
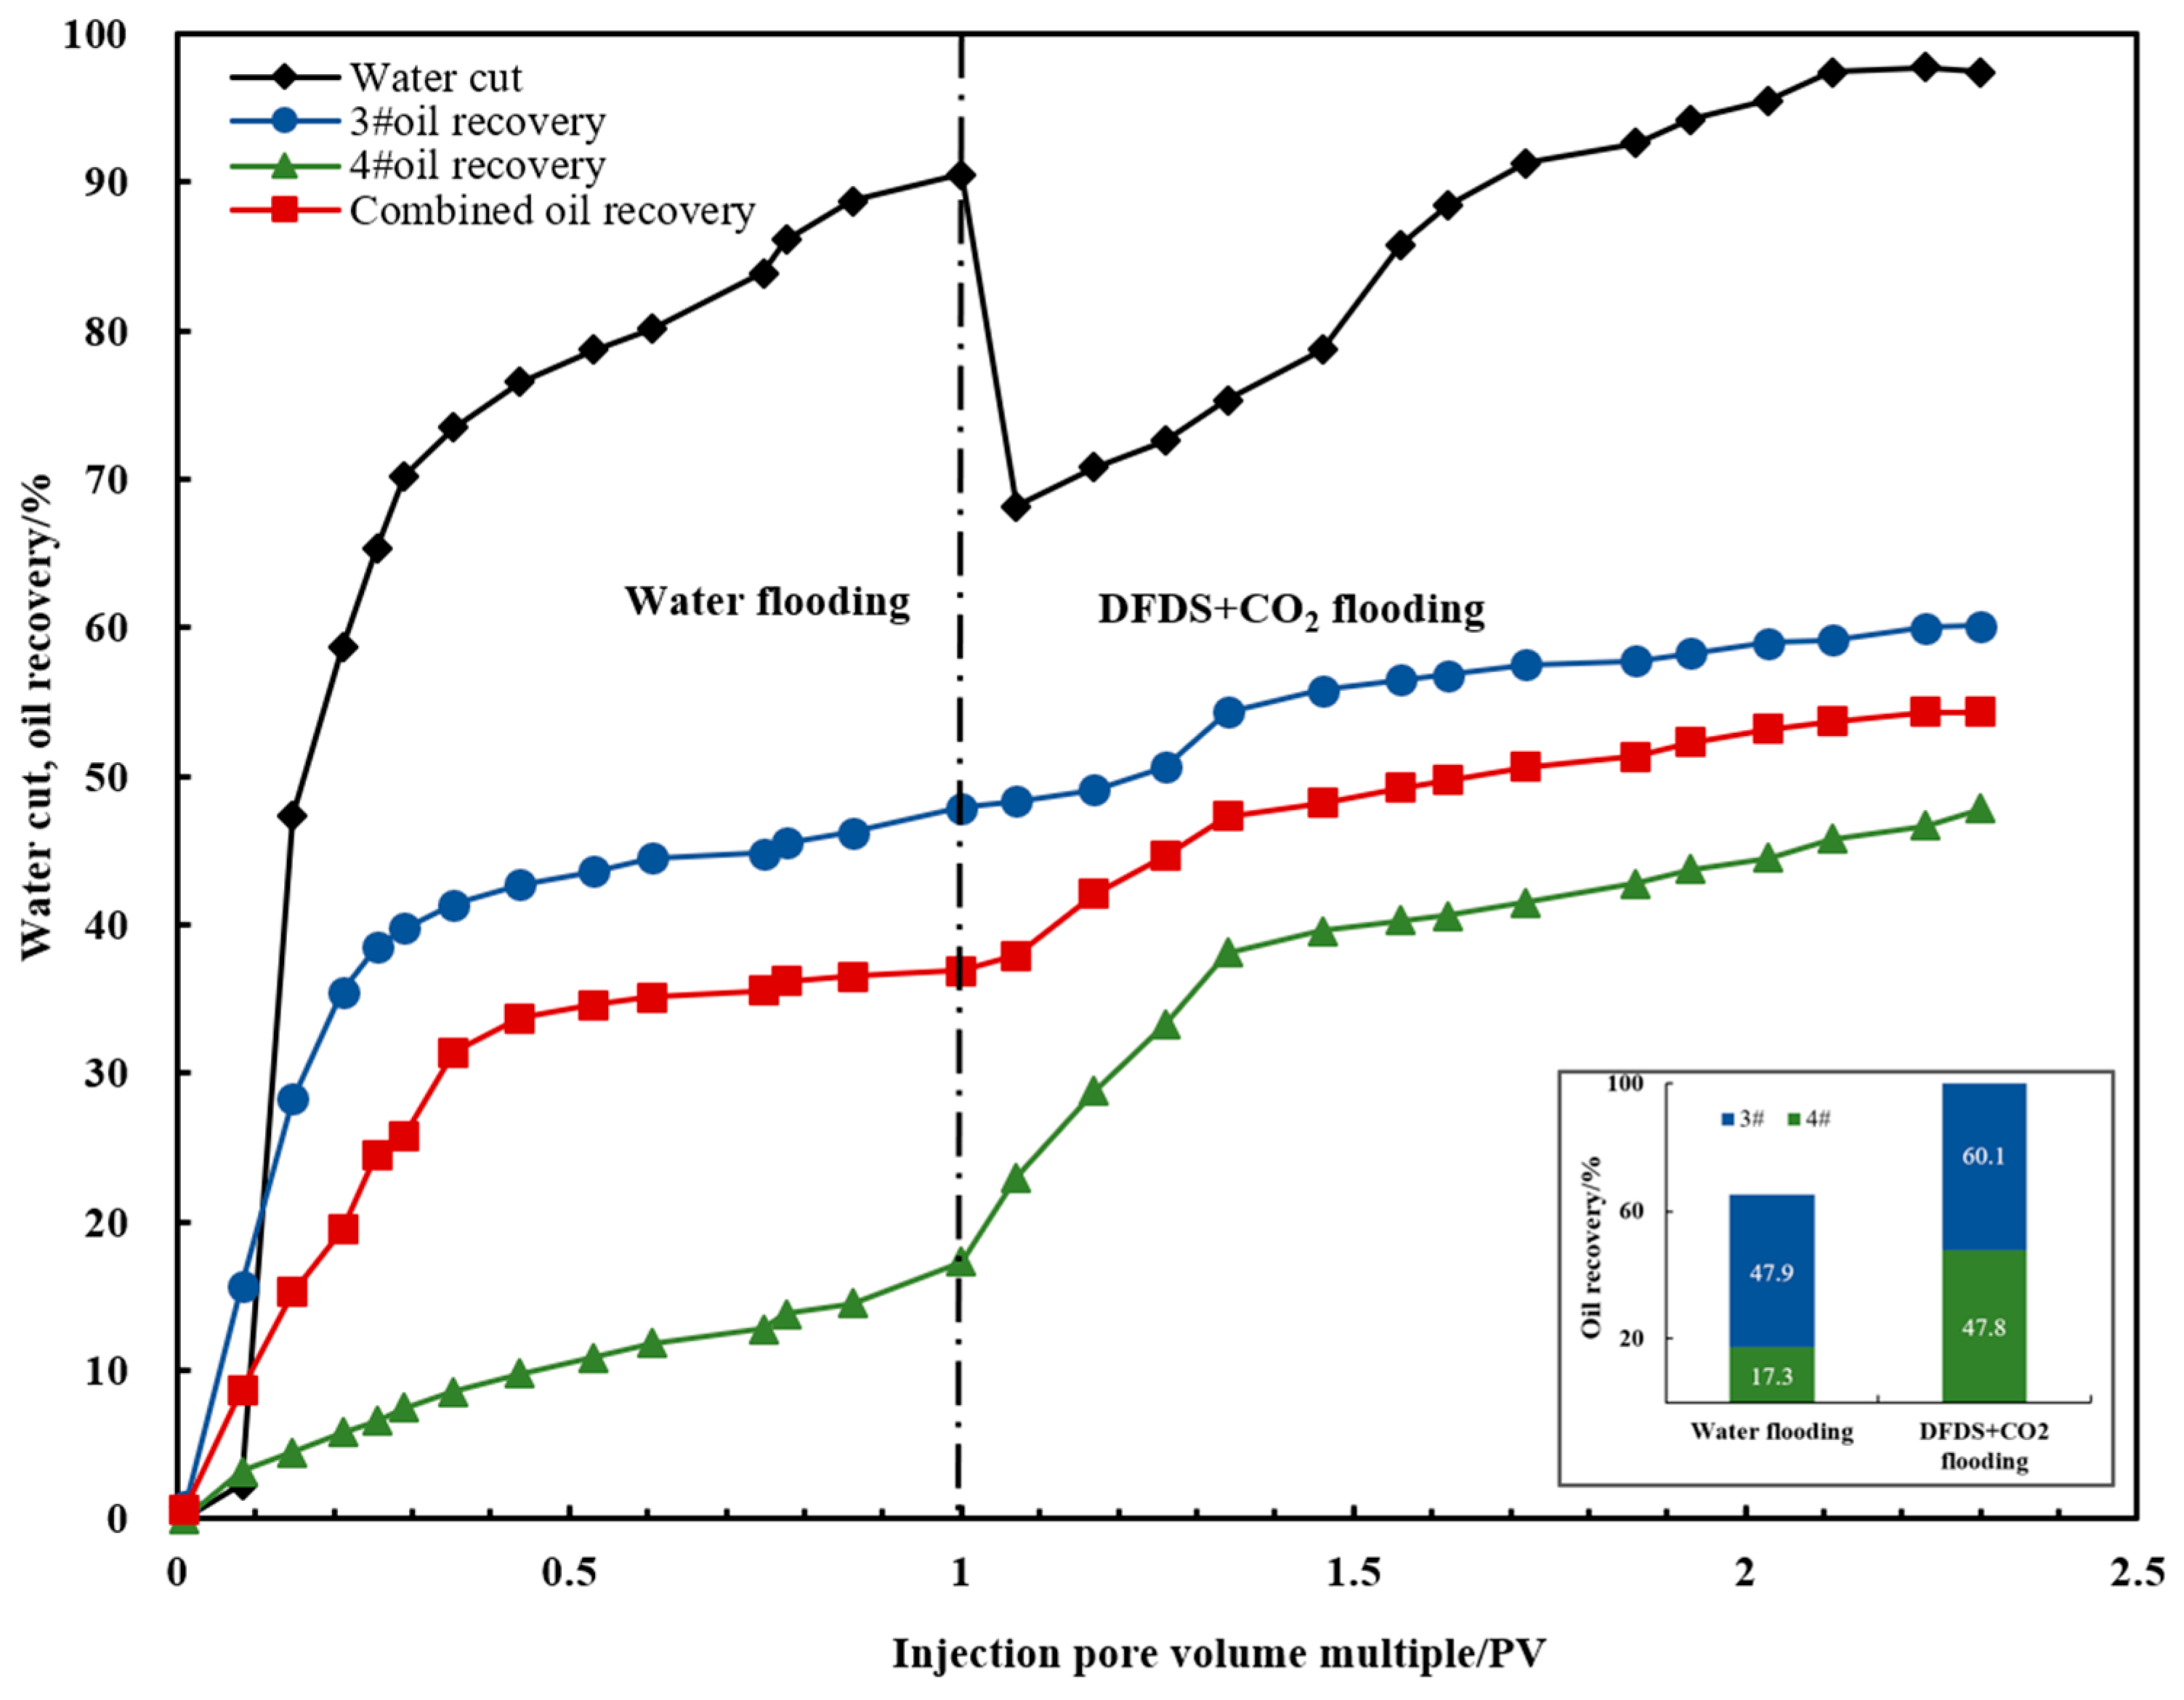
(3)
The DFDS showed good oil recovery enhancement capability in the parallel double-pipe core-flooding experiment. The dispersion system can block dominant channels and increase the swept volume of low-permeability cores, acting as a temporary plug and diversion agent. The results showed that the subsequent injection of the system after water flooding increased the low-permeability core’s oil recovery factor by 30.5% and ultimately increased the combined oil recovery factor by 17.4%, indicating a significant enhancement in oil recovery.

Author Contributions

Software, C.Z.; Writing—original draft, Y.G.; Writing—review & editing, X.W.; Project administration, R.S. and S.X. All authors have read and agreed to the published version of the manuscript.

Funding

The authors declare that this study received funding from Open Foundation of CNPC Key Laboratory of Petrophysics & Flow through Porous Media. Grant Number 2023-KFKT-17. The funder was not involved in the study design, collection, analysis, interpretation of data, the writing of this article or the decision to submit it for publication.

Data Availability Statement

The original contributions presented in the study are included in the article, further inquiries can be directed to the corresponding author.

Conflicts of Interest

R.S. and S.X. were employed by China National Petroleum Corporation and PetroChina. The remaining authors declare that the research was conducted in the absence of any commercial or financial relationships that could be construed as a potential conflict of interest.

References

  1. Liu, N. Research on Dynamic Mechanism and Application of Gas Displacement in Porous Media. Ph.D. Thesis, China University of Geosciences, Beijing, China, 2020. [Google Scholar]
  2. Chen, X.; Wu, J.; Han, H.; Liu, L. Formation of gas bubble-water dispersion system using ultrasonic vibration method and research on its impact on ultimate oil recovery. Nat. Gas Oil 2021, 39, 48–52. [Google Scholar]
  3. Xing, X. Microscopic oil displacement mechanism and oil displacement effect of foam flooding. Pet. Geol. Recovery Effic. 2020, 27, 7. [Google Scholar]
  4. Sun, Z.; Wu, X.; Kang, X.; Lu, X.; Li, Q.; Jiang, W.; Zhang, J. Comparison of oil displacement mechanisms and performances between continuous and dispersed phase flooding agents. Pet. Explor. Dev. 2019, 46, 9. [Google Scholar] [CrossRef]
  5. Li, Z. Application of Foam Fluid in Oil and Gas Exploitation; Petroleum Industry Press: Beijing, China, 2010; pp. 5–15. [Google Scholar]
  6. Duan, X. The Method and Theoretical Research on EOR of Water-Gas Dispersion System with Adjustable Resistance. Ph.D. Thesis, China University of Petroleum, Beijing, China, 2015. [Google Scholar]
  7. Yu, H.; Ma, D.; Li, S.; Ji, Z.; Chen, X.; Zhang, K. Experimental study on enhanced oil recovery by water-gas dispersion flooding system. Sci. Technol. Eng. 2013, 13, 9946–9949. [Google Scholar]
  8. Frled, A.N. The Foam-Drive Process for Increasing the Recovery of Oil; Department of the Interior, Bureau of Mines: Washington, DC, USA, 1961; pp. 1–63.
  9. Romero Zern, L.; Kantzans, A. Pore Level Displacement Mechanisms during Foam Flooding. In Proceedings of the Canadian International Petroleum Conference, Calgary, AB, Canada, 10–12 June 2003. [Google Scholar]
  10. He, G.; Li, H.; Guo, C.; Liao, J.; Deng, J.; Liu, S.; Dong, H. Stable foam systems for improving oil recovery under high-temperature and high-salt reservoir conditions. J. Pet. Sci. Eng. 2022, 211, 110145. [Google Scholar] [CrossRef]
  11. Hanssen, J.E. Foam as a gas-blocking agent in petroleum reservoirs I: Empirical observations and parametric study. J. Pet. Sci. Eng. 1993, 10, 117–133. [Google Scholar] [CrossRef]
  12. Kong, D.; Li, Y.; Yuan, H.; Asimu, A.; Sun, L.; Xu, S.; Chen, J. Study on migration characteristics and displacement effect of polymer reinforced foam in porous media. Chin. J. Chem. Eng. 2018, 32, 1027–1033. [Google Scholar]
  13. Norouzi, H.; Madhi, M.; Seyyedi, M.; Rezaee, M. Foam propagation and oil recovery potential at large distances from an injection well. Chem. Eng. Res. Des. 2018, 135, 67–77. [Google Scholar] [CrossRef]
  14. Wu, F.; Cao, H.; Cai, W.; Zhu, M. Review of petroleum additives and their applications. Energy Conserv. Technol. 2010, 28, 6. [Google Scholar]
  15. Wang, F. Study on Micro-Migration Mechanism and Oil Displacement Effect of Water-Gas Dispersion System in Porous Media. Master’s Thesis, China University of Petroleum, Beijing, China, 2023. [Google Scholar]
  16. Hu, G.; Dong, X.; Qiu, J.; Zhang, S.; Ren, T. Study on foam properties of sulfonates with different structure in pesticide saturated solution. Shanghai Chem. Ind. 2019, 45, 12–15. [Google Scholar]
  17. Lu, C.; Zhang, B.; Li, B.; Zheng, Z.; Wang, H.; Fan, H.; Kang, W. Study on Synergistic enhancement of foaming performance by amphoteric/anionic surfactants. J. Petrochem. Univ. 2015, 28, 55–59. [Google Scholar]
Figure 1. Boundary conditions of the Jamin effect model for the water–gas dispersion system.
Energies 17 04050 g001
Figure 2. Pressure variation curve at the pore throat connection point over time. In the figure, blue is the water and red is the CO2 bubble.
Energies 17 04050 g002
Figure 3. The pressure of the pore throat connection point under different surface tensions.
Energies 17 04050 g003
Figure 4. Foaming volume at different surfactant concentrations.
Energies 17 04050 g004
Figure 5. Half-life for drainage at different surfactant concentrations.
Energies 17 04050 g005
Figure 6. Foaming volume and half-life at different concentrations of HPAM.
Energies 17 04050 g006
Figure 7. T2 spectra of each huff-n-puff cycle in different media. (a) Core 1# CO2 huff-n-puff; (b) core 2# DFDS-assisted CO2 huff-n-puff. The blue rectangle indicates the pores with radius of 0.2~2 µm, and the pink rectangle indicates pores with radius of 2~200 µm.
Energies 17 04050 g007
Figure 8. Degree of micropore utilization. (a) Core 1# CO2 huff-n-puff; (b) core 2# DFDS-assisted CO2 huff-n-puff.
Energies 17 04050 g008
Figure 9. Online NMR imaging after four cycles of huff-n-puff in different media. (a) Core 1# CO2 huff-n-puff; (b) core 2# DFDS-assisted CO2 huff-n-puff.
Energies 17 04050 g009
Figure 10. Parallel core-flooding recovery factor and water cut change curve. The left side of the black dashed line is water flooding, and the right side is DFDS+CO2 flooding.
Energies 17 04050 g010
Table 1. Basic parameters of the model.
ItemContinuous Phase
(Water)
Dispersed Phase
(CO2)
Density/kg·m−310001.225
Viscosity/Pa·s0.002981.789 × 10−3
Surface tension/N·m5.6 × 10−2
Contact angle/°9090
Slip length/ μ m11
Table 2. Types of surfactants for dilute-foam dispersion systems [15].
TypeRepresentative MaterialSpecific Example
Anionic surfactantSulfonatesSodium dodecyl sulfonate
Sulfate saltsSodium lauryl sulfate
Phosphate ester saltsPotassium cetyl phosphate
Cationic surfactantAlkyl pyridine saltsStearate TEA salt
Alkyl amine saltsTetacylpyridine salt
Amphoteric
surfactant
Amino acid saltsSodium lauryl glutamate (LG-95P)
betaineDodecyl dimethyl betaine (BS-12)
Imidazoline typeSodium cocamyl amphoacetate (CAMC)
Nonionic
surfactant
Polyoxyethylene typePolysorbate
Polyol typeGlycerin stearate ester
Table 3. Parameters of cores for dilute-foam enhanced dispersion system displacement experiment.
Core NumberDiameter
/cm
Porosity
/%
Length
/cm
Permeability
/(10−3 μm2)
Experimental SchemeExperimental Content
1#2.5119.555.0050.42Online NMR
huff-n-puff
CO2 huff-n-puff
2#2.5122.135.0050.36DFDS-assisted CO2 huff-n-puff
3#2.5037.7329.9049.59Parallel core displacementWater flooding + DFDS flooding + water flooding
4#2.5012.1030.359.61
Table 4. Experimental results of parallel core displacement.
Core NumberPermeability
/(10−3 μm2)
Water Flooding Oil Recovery/%DFDS Oil Recovery/%Enhanced Oil Recovery/%
3#49.5947.960.112.2
4#9.6117.347.830.5
Combined oil recovery 36.954.317.4
Disclaimer/Publisher’s Note: The statements, opinions and data contained in all publications are solely those of the individual author(s) and contributor(s) and not of MDPI and/or the editor(s). MDPI and/or the editor(s) disclaim responsibility for any injury to people or property resulting from any ideas, methods, instructions or products referred to in the content.

