Article

Impact of Electric Vehicles Consumption on Energy Efficient and Self-Sufficient Performance in Building: A Case Study in the Brazilian Amazon Region

by
Ana Carolina Dias Barreto de Souza
1,*,
Filipe Menezes de Vasconcelos
1,
Gabriel Abel Massunanga Moreira
1,
João Victor dos Reis. Alves
1,
Jonathan Muñoz Tabora
2,
Maria Emília de Lima Tostes
1,
Carminda Célia Moura de Moura Carvalho
1 and
Andreia Antloga do Nascimento
1
1
Amazon Energy Efficiency Center (CEAMAZON), Federal University of Pará, Belém 66075-110, Brazil
2
Electrical Engineering Department, National Autonomous University of Honduras (UNAH), Tegucigalpa 04001, Honduras
*
Author to whom correspondence should be addressed.
Energies 2024, 17(16), 4060; https://doi.org/10.3390/en17164060
Submission received: 29 April 2024 / Revised: 17 June 2024 / Accepted: 25 June 2024 / Published: 16 August 2024
(This article belongs to the Special Issue Recent Advances in Energy Efficiency in Buildings and Transportation)

Abstract

:
The growth of electric vehicles (EVs) and their integration into existing and future buildings bring new considerations for energy efficiency (EE) and balance when combined with renewable energy. However, for buildings with an energy efficiency label, such as Near Zero Energy Building (NZEB) or Positive Energy Building (PEB), the introduction of EVs may result in the declassification of the EE label due to the additional energy required for the charging infrastructure. This underscores the increasing relevance of demand-side management techniques to effectively manage and utilize energy consumption and generation in buildings. This paper evaluates the influence of electric vehicle (EV) charging on NZEB/PEB-labeled buildings of the Brazilian Building Labeling Program (PBE Edifica). Utilizing on-site surveys, computational modeling, and thermos-energetic analysis with software tools such as OpenStudio v. 1.1.0 and EnergyPlus v. 9.4.0, an energy classification was conducted in a building in the city of Belem, State of Para, Brazil. Subsequently, power flow simulations employing probabilistic models and Monte Carlo approaches were executed in the OpenDSS software v. 10.0.0.2 to examine the impact of EV integration, both with and without the implementation of demand-side management techniques. Analyses using the labeling methodology demonstrated that the building has EE level C and NZEB self-sufficiency classification. The assessment of the impact of EV integration on the building’s total energy consumption in the base (current) scenario was carried out in two scenarios, with (2) and without (1) supply management. Scenario 01 generated a 69.28% increase in energy consumption, reducing the EE level to D and resulting in the loss of the NZEB class. Scenario 02 resulted in a smaller increase in energy consumption of 40.50%, and guaranteed the return of the NZEB class lost in scenario 1, but it was not enough to return the EE level to class C. The results highlight the need for immediate and comprehensive energy management strategies, as the findings show that the two scenarios present a difference of 41.55% in energy consumption. Nonetheless, these strategies are not enough if other consumption restrictions or energy efficiency measures are not applied to other building systems.

1. Introduction

1.1. General Considerations

In Brazil, the building sector is responsible for more than 50% of the energy consumption [1]. It is considered a strategic and priority sector for reducing the growing increase in energy demand. Implementing energy efficiency measures has proved to be one of the most feasible solutions in the implementation of the energy transition, both from an energy-finance and an environmental point of view [2]. The efficiency of building systems has resulted in a significant reduction in energy consumption, and considering the guidelines of regulations, standards, and normative instructions for energy efficiency (EE) can achieve a consumption reduction of 50% and 30% in new and existing buildings undergoing renovation, respectively [3].
Using renewable energy in buildings is another way to minimize the need to expand the energy matrix. In addition, the transition to a system of “clean” sources has gained significant adhesion in buildings. As this advance in the incorporation of clean energy generation in buildings is well known, this system has been incorporated into methodologies for analyzing the energy performance of buildings, such as [4,5], and now in [6]. However, these studies still do not consider the EV supply system as a building system for end use separate from outlet loads.
In Brazil, a 2018 review of the building labeling system included the classification of nearly zero energy buildings (NZEBs), in which at least 50% of the energy is produced on-site, and positive energy buildings (PEB), which surpass the annual demand with on-site production [6]. In Europe, the context of NZEBs is already consolidated, and the European Commission has already stipulated in the Energy Performance of Buildings Directive the transition of existing near-zero energy buildings (NZEBs) to zero-emission buildings (ZEB) by 2030. In addition, new public buildings, whether rented or owned by the government, must already be built with this characteristic [7].
The directive’s proposal considers a zero-emission building as: “a building with very high energy performance, with the meager amount of energy still required fully covered by energy from renewable sources and without on-site carbon emissions from fossil fuels [8]. According to the Energy Performance of Buildings Directive”, In addition to supporting long-term climate neutrality, ZEB buildings also bring other benefits, such as “improved air quality, the digitalization of energy systems for buildings, and the roll-out of infrastructure for sustainable mobility” [9].
Innovation and new technology also allow buildings to support the overall decarbonization of the economy, including the transport sector. For example, buildings can be leveraged to develop the infrastructure for charging electric vehicles.
According to the European Commission, buildings are crucial in changing the mobility landscape. They provide the options and resources needed to supply the electric modes incorporated into their private building electrical infrastructure and the external electro-posts on roads and in public places [10]. In this sense, the European Parliament’s Alternative Fuels Infrastructure Regulation (AFIR) already foresees that around 60% of recharging will occur in private buildings [11].
Around the world, in addition to renewable energy and energy efficiency, new forms of contribution and active participation in promoting the energy transition have emerged, such as demand response, manageable self-consumption, and energy storage, and the adoption of low-carbon transport through electromobility [12,13,14]. In the scope of electromobility, an excellent endorsement of electric vehicles brings challenges and opportunities in consumption, management, and efficiency.
Introducing renewable energy and electric vehicles poses new challenges for planners due to their intermittency. These factors affect the active power demand of a building based on the EV battery capacity, its state of charge, the time of arrival at the charging station, and the charging selected [15,16].
According to the European Commission (2022), the second preference of EV users is to recharge in the workplace, representing 15% of all energy charged in the European Union (EU). However, the commission predicts this demand will increase to around 25% by 2030, especially among those without access to home charging. Given this, some companies invest in their charging networks to promote electric mobility among their employees, offering reimbursement of charging costs or free charging in the workplace [10].
This can lead to electric vehicle owners preferring not to charge at home due to cost, lack of home charging, or distance requiring another recharge. This reinforces the need to examine workplaces more closely regarding increasing demand for EV charging and increasing energy consumption in commercial, service, and public buildings [10].

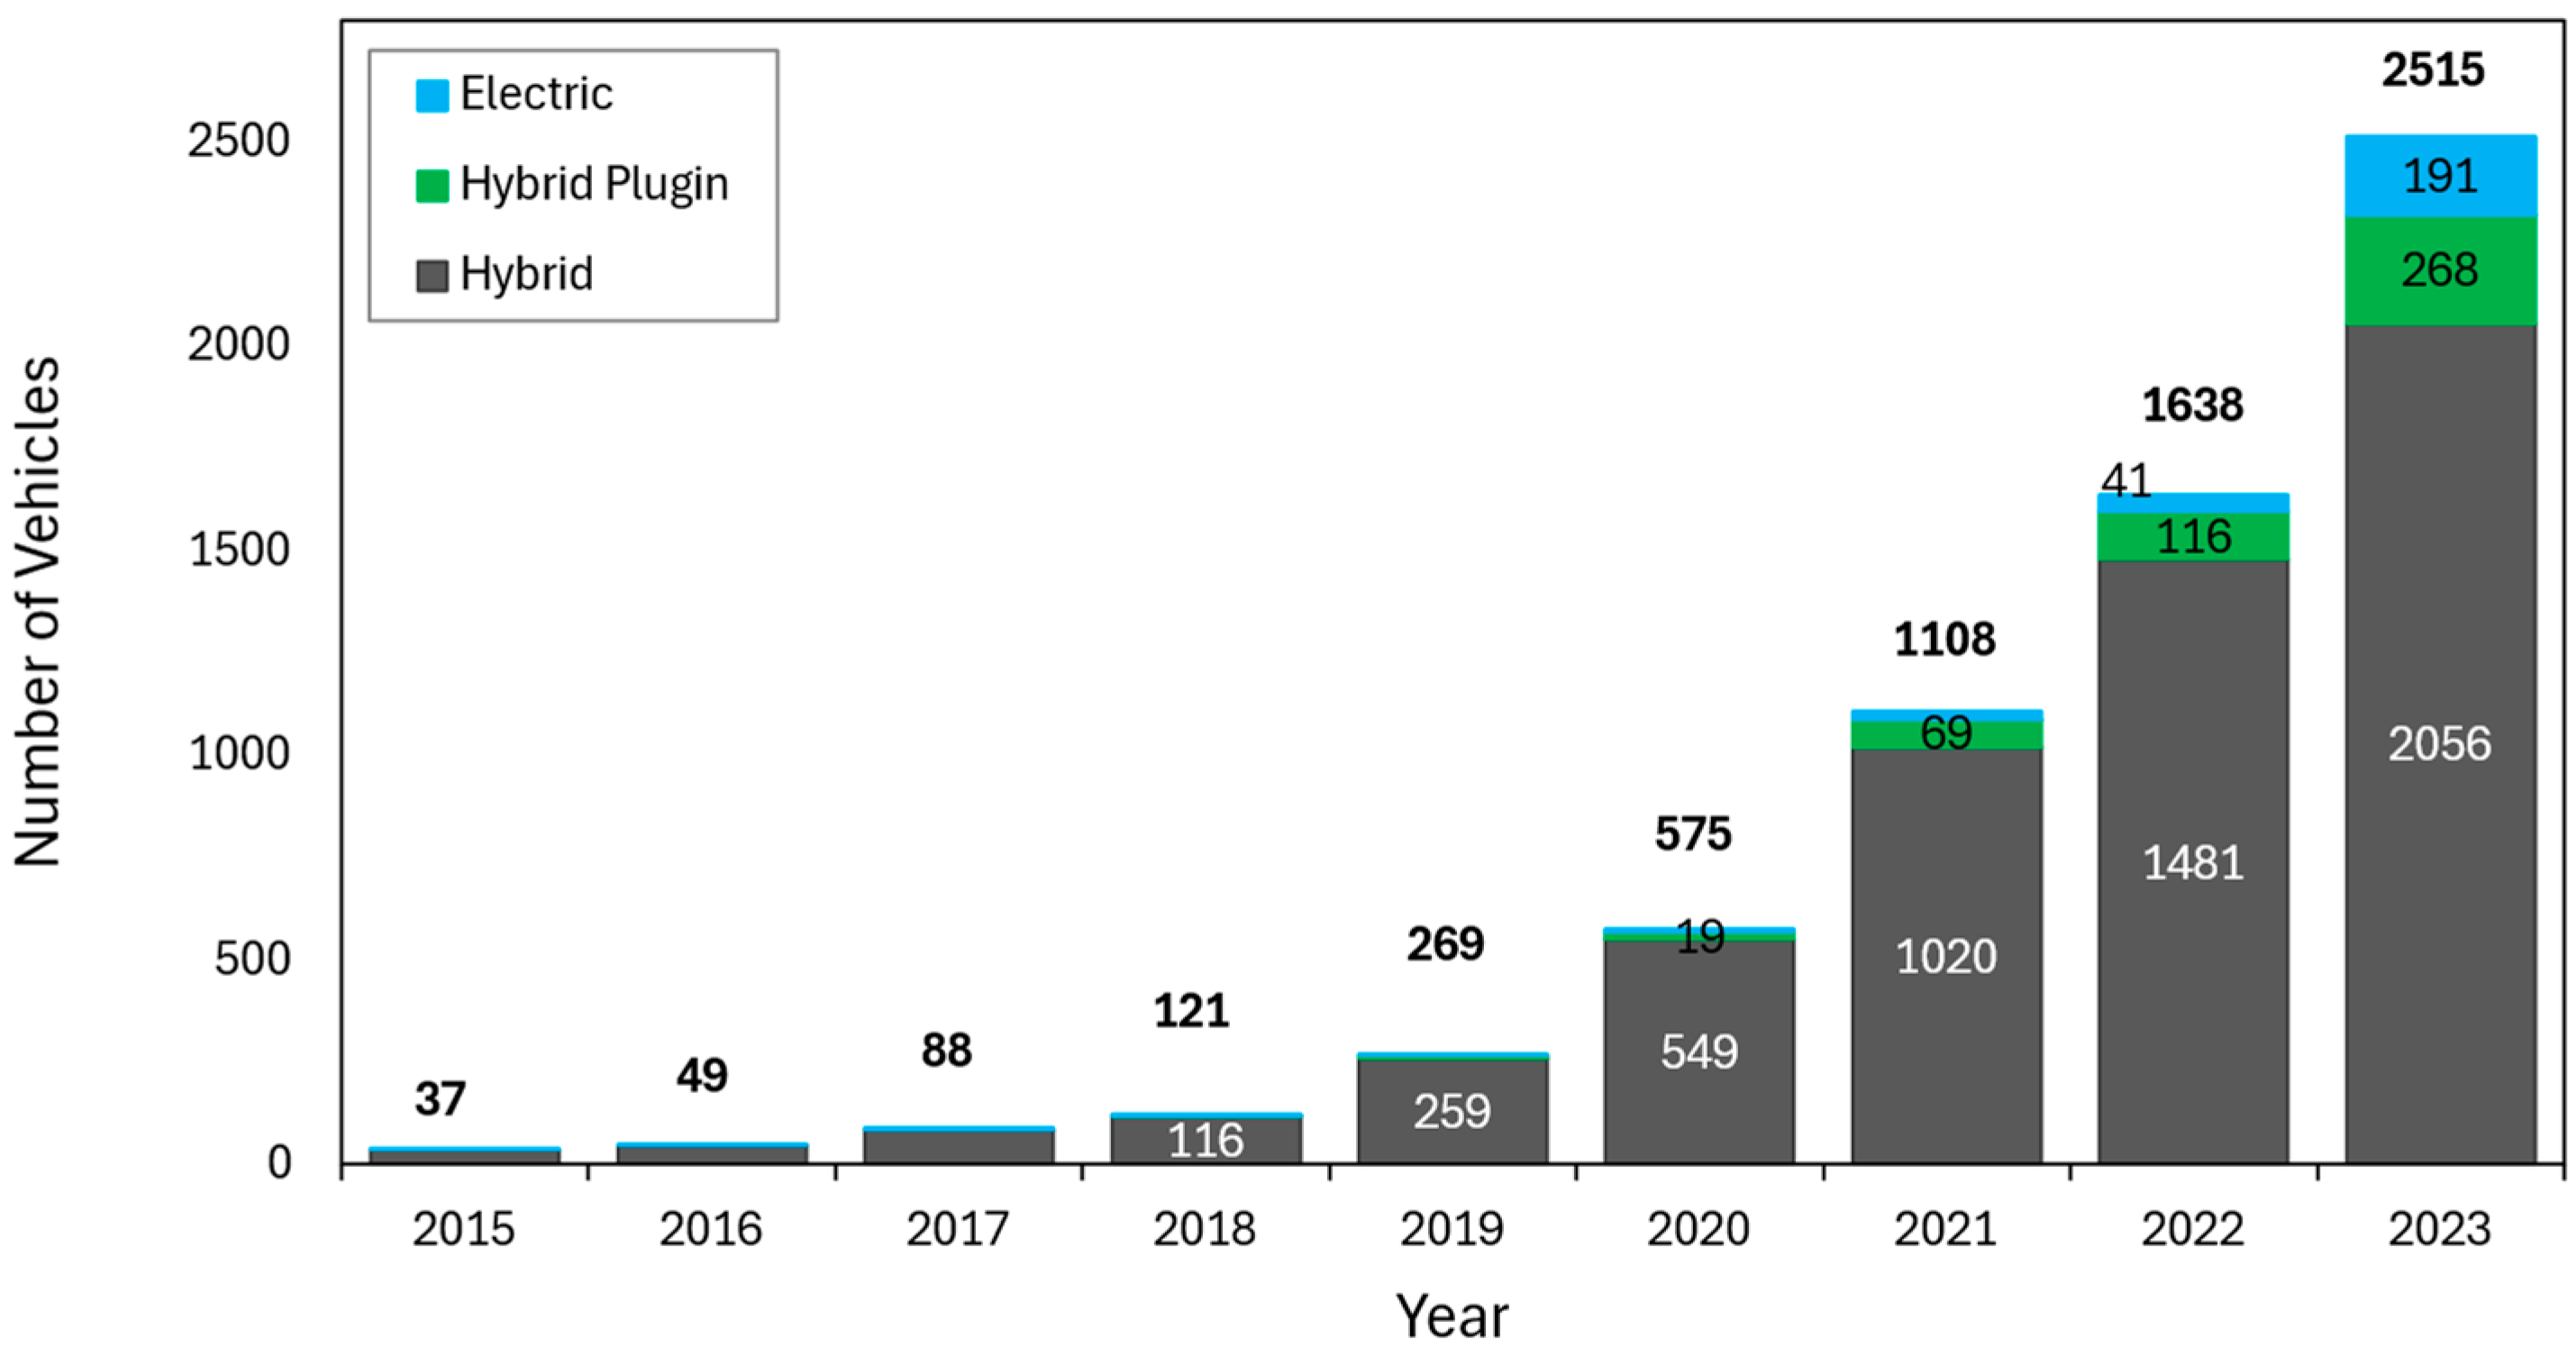
1.2. Country Overview: Brazil

Although Brazil is not one of the countries that use EVs, like China, Norway, South Korea, Sweden, Germany, and the United States, the growth in the use of passenger vehicles throughout the national territory is an increasingly present reality [16]. Driving factors include the vast consumer market for automobiles, strategic considerations of energy security, and environmental concerns. In addition, the high cost of fuel, the emphasis on corporate environmental and social practices (known as Environmental, Social, and Governance, ESG), and the national technological diversity are elements that solidify and stimulate this agenda in the country’s sector [17].
Figure 1 presents the annual expansion of the EV fleet in Brazil over the last nine years, showing an increase of 7250%.
The top five Brazilian states in terms of electric vehicles are São Paulo, with 72,562 units (32.66%); Rio de Janeiro, with 15,543 units (7%); Santa Catarina, with 14,959 (6.73%); Minas Gerais, with 14,586 (6.56%); and Paraná, with 13,673 (6.15%). Together, they account for 131,323 units, or about 59.10% of all vehicles in the country [18].
The other states account for 90,875 units (40.89%), with the State of Pará accounting for 2515 units (1.13%). Figure 2 shows the annual expansion of the EV fleet in Pará over the last nine years, with an increase of 6797% [18].
Pará’s cars are distributed in several cities, as shown in Figure 3. Still, the majority are concentrated in Belém, the state capital, with 1430 units, corresponding to 57% of the EVs of Pará. The following five cities with the most EVs are Ananindeua, with 209 units; Castanhal, with 107 units; Parauapebas, with 98 units; and Marabá, with 96 units. The other cities in the state together have 575 EVs [18].
Based on this market data, we can understand the advance of electromobility at the national, state, and local levels. This highlights the importance of analyzing this current and growing demand for energy consumption, which will affect the power grid of Brazil’s National Interconnected System (SIN, acronym in Portuguese) and the performance of buildings. This topic needs to be explored further, given that the impacts on the grid are more studied in academic papers and by market consultancies, according to [19].
According to the Mapping and Diagnosis of Electric Mobility initiatives in Brazil from 2018 to 2021, the literature has shown that the studies focus on the impact on the electricity grid, energy generation and storage, fuel cells in electric vehicles, vehicle charging, charging stations, and the influence of all elements of electric mobility on the energy supply network [19]. However, studies that analyze the impact of electric vehicle (EV) loads on buildings are rare [20]. Nevertheless, using electric cars in Brazil is not widespread, and the supply infrastructure is restricted, which allows for the analysis of this impact beforehand.

1.3. Literature Review

Introducing renewable energy and electric vehicles (EVs) poses new challenges for planners due to their intermittency. adequate electrical infrastructure and intelligent charging systems should be installed to manage and distribute the charging load in buildings, minimizing the impact of EV power consumption. These systems can optimize charging times to avoid peak electricity demand and reduce overall electricity consumption [21]. Sørensen et al. [22] conducted extensive research on EV charging and the relationship between it and buildings. Data collected from charge points and vehicle data are often used for EV studies.
The impact of EV power consumption on buildings depends on several factors, including the number of EVs being charged, the charging rate, and the capacity of the building’s electrical infrastructure. If a building has a limited electrical capacity and many electric vehicles are being charged simultaneously, the electrical system can overload, causing power outages and damage to electrical equipment.
Factors like EV battery capacity, state of charge, arrival time at the charging station, and selected charging method significantly affect active power demand [15,16].
Regarding the site’s electrical infrastructure, the Brazilian National Electric Mobility Platform (PNME, acronym in Portuguese) [23] highlights the importance of checking the number of phases, circuit breaker capacity, and input branch because, depending on the size of the power system, the installation may require adjustments related to increased load or changes in the supply voltage level. In addition to ensuring ease in installing conduits with suitable diameters or cable trays for electrical conductors, the publication also highlights the need to analyze the idle capacity of the feeder at low voltage with respect to the seasonal hourly energy demand at the recharge point.
Studies analyzing the integration of electric vehicles into buildings have been presented in [24,25,26,27,28]. Yan Zhu et al. [25] proposes an optimal configuration method for charging stations to meet the increasing demand and addresses the challenges of EV charging in office buildings. The framework includes predicting the EV charging load and using genetic algorithms for optimization, which significantly improves utilization and satisfaction rates. Satisfaction rates can reach 96.54% and 97.48% for design periods of 5 and 10 years, respectively, with significant performance improvements. The study highlights the effectiveness of this method and calls for further research as EV usage increases.
In the paper [27], Castillo-Calzadilla et al. comment on the small number of studies that analyze the energy balance in buildings. They investigate EV charging in Positive Energy Districts (PEDs) through a simulation-based analysis in six buildings in northern Spain. The study evaluates energy balances with 405 EVs using Ohm’s law and discusses smart EV charging hubs to reduce grid reinforcement costs. The authors prove that energy balances are limited by the energy performance of buildings, which in turn depends on the envelope’s efficiency level and the equipment that makes up the construction systems. They also comment on the high requirements that buildings must meet for an EE A or B classification, such as good thermal performance and building systems, and the difficulty that existing buildings, especially very old ones, have in complying with EE standards.
Castillo-Calzadilla et al. [27] concludes that the more inefficient the building is relative to its label, the more negative the annual energy balance becomes with integrating electric vehicles since this (energy balance) is directly proportional to the building’s energy rating.
In the study in [26], which includes vehicle-to-grid (V2G), energy storage systems, and photovoltaic systems, Sangmin Park et al. compare the benefits of integrating EVs in buildings considering the different seasons of the year. On cloudy days, EVs can be more important in consuming surplus energy in the building.
The time of arrival and percentage of EV charge can be represented by probabilistic models, such as the Poisson distribution, as discussed in [29,30,31]. Increased power consumption from electric vehicles (EVs) can result in higher electricity bills for building owners or occupants. Jang et al. [32] highlight the technical problems in adopting EV charging in high-penetration cases, which increase yearly in Korea, where most inhabitants live in apartment complexes and are expected to share parking spots and chargers. Such a setting may accrue extra penalty fees to the complexes facing this problem. When analyzing issues related to the installation of charging equipment, the PNME [23] addressed the importance of verifying the demand contract, depending on the sizing foreseen in the design of the EV supply system, aiming for adjustments that avoid fines for excess demand.
However, if the building has a renewable energy source, such as photovoltaic (PV) or wind energy generation, this can offset this increased power consumption [33,34]. Meanwhile, it is important to consider the limitations of photovoltaic systems, such as the low availability of sufficient roof areas or contractual restrictions that make it impossible to meet 100% of energy demands [27]. A PV-EV sizing framework for charging stations powered by local solar energy generation in buildings is essential. This framework should consider load-matching performance and the self-consumption–self-sufficiency balance (SCSB), reflecting the balance between self-consumption (SC) and self-sufficiency (SS) [35].
One major challenge with EV introduction is its technical impact on voltage profiles, feeder and transformer overloads, and grid stability. Research has analyzed EV charging’s impact on distribution transformers, noting that harmonic content from EV recharging increases transformer losses and causes voltage drops [36,37,38]. Shams Ashkezari et al. [39] explain that through studies of energy management systems (EMS), it is possible to mitigate concerns about grid reliability and reduce general grid power consumption, according to the simulations realized.
Management techniques for EV charging, such as those presented in [15,34,40,41], aim to improve grid voltage and load supply. For instance, the system in [41] restores critical voltages to normal levels within two control cycles, increasing load capacity and vehicle autonomy. In the study in [15], Moreira et al. use various criteria to manage charging power, avoiding peak-hour power violations and enabling well-managed recharging.
Research also examines integrating EVs and buses into Ecuador’s tram system, highlighting charging infrastructure challenges. Using OpenDSS software, different charging scenarios were evaluated. Slow charging at night was feasible, increasing tram system utilization from 11% to 32%, while fast and combined charging was not feasible due to increased losses and network congestion [42]. Similarly, OpenDSS software was used to analyze the grid impact of EV charging, focusing on voltage constraints, optimal charging patterns, and financial impacts, promoting sustainable public transportation [43].
Adequate electrical infrastructure and an intelligent charging system should be installed to manage and distribute the charging load in buildings to minimize the impact of electric vehicle power consumption. Intelligent charging systems can also optimize charging times to avoid peak electricity demand and reduce overall electricity consumption [44].
Based on the literature review, the effects of electric vehicle supply integration on building performance still need further investigation to guide energy consumption management decisions and energy efficiency measures. Therefore, this study aims to promote the formulation or review of energy diagnosis methodologies, including the EV charging system integrated into buildings.

1.4. Work Hypotheses

Due to the high energy of electric vehicles, their integration into buildings can have significant impacts on energy efficiency and the NZEB or PEB rating, depending on factors such as the initial energy performance level of the building, the amount of existing load, and the availability of photovoltaic generation [33], leading to the following hypotheses:
  • Depending on the number of electric cars being fueled simultaneously in the building, the integration of EVs may or may not impact the building’s energy performance and its NZEB/PEB rating unless a suitable charging management/strategy is implemented.
  • Based on a series of restrictions/limitations, a suitable charging strategy can successfully integrate EVs into buildings, regardless of the number of electric cars being fueled simultaneously, without the risk of losing the NZEB/PEB rating or reducing energy performance.

1.5. Goals and Contribution

The integration of EVs in buildings with photovoltaic systems is already a reality, as presented in the literature review. However, analysis and quantification of the implication of increased energy consumption on the energy balance and efficiency of buildings resulting from the EV supply system still need to be further explored in line with EE and NZEB standards. Energy diagnosis methodologies in buildings still do not consider the EV supply system as a building system for end use separate from outlet loads, considering only the air conditioning and air-cooling system, lighting, envelope, and water heating separately. Within the context of everything that has been exposed so far, and with a case study in Brazil, the work intends to contribute with:
  • A methodology that aims to insert the EV supply system as an end-use system in buildings, quantifying the impacts that the integration of EVs has on the level of efficiency and energy self-sufficiency of commercial, service, and public buildings, considering the guidelines of the Brazilian EE and NZEB assessment methodology determined by [6];
  • Simulation of load level scenarios for EV arrivals and departures, based on stochastic analyses, such as the Monte Carlo method, with a realistic approach based on on-site measurement values, and generating results with good approximations of what would happen in practice with the integration of EVs in buildings;
  • Energy management systems (EMS) methodology with optimization techniques, aiming to mitigate the impacts of EV consumption on demand, consumption, and EE and NZEB levels in buildings.
It is important to highlight that the methodology proposed in this article can be replicated nationally for all regions of Brazil, as it is aligned with the Inmetro Normative Instruction for the Energy Efficiency Classification of Commercial, Service and Public Buildings (INI-C), which is structured based on [45,46], the Brazilian bioclimatic zoning standard. In addition, it allows scalabilities for all non-residential buildings, that is, commercial, service, and public buildings. Therefore, to evaluate residential properties, it is necessary to align the methodology with the Inmetro Normative Instruction for the Energy Efficiency Classification of Residential Buildings (INI-R, acronym in Portuguese) [47].
Considering the integration of EV charging as an end-use system, this study aims to investigate the impact of EV charging in energy-self-sufficient buildings without any management and then apply demand-side management techniques to EV charging, considering different consumption conditions and voltage and power constraints. The Center of Excellence in Energy Efficiency of Amazon (CEAMAZON) building, located in the city of Belem, State of Para, Brazil, which already has an infrastructure for metering, photovoltaic generation, and EV charging, was selected as a case study for the analysis [14]. The architectural characteristics of CEAMAZON are presented in Appendix B. Due to the project’s complexity, it was divided into three parts, which were analyzed individually.
Based on this general goal, the following specific objectives have been defined:
  • Diagnose the energy performance of existing building systems to obtain the energy efficiency classification in existing conditions;
  • Calculate the energy balance for the determination of the NZEB or PEB classification;
  • Model the electric grid of the building and integrate electric vehicle charging, analyzed in two scenarios: one without management and the other with demand-side management techniques for EV charging.
The results and the discussions will make it possible to draw conclusions and recommendations for the appropriate integration of electric vehicles in buildings to reduce their energy impact.
This paper is structured into four sections. Section 2 presents a brief overview of the computer simulation of the CEAMAZON building, with the energy performance assessment and energy balance analysis for the NZEB/PEB rating, using the INI-C methodology, and the actual data of the building’s annual load curve, photovoltaic generation, and electric car charging measurement campaigns of approximately 20~80% of the batteries system, taking into account literature recommendations, as mentioned in [48]. The impact of integrating electric vehicles on the building’s energy performance and its NZEB/PEB rating is examined. Section 3 presents the analysis results in two scenarios of EV integration in the building. Finally, Section 4 presents the conclusions and future work.

2. Materials and Methods

This section describes the four general steps of analysis of the case study and their respective methodologies applied to achieve the main objective proposed in the article. Step 1 diagnoses the energy performance of the building’s systems to determine the energy efficiency level under existing conditions. Step 2 measures the energy balance to determine the NZEB or PEB rating. Step 3 consists of a predictive analysis of the increase in building load due to the integration of electric vehicle charging, analyzed in two scenarios described in more detail in Section 2.4.3. The impact of the EV charging load increase on the EE and NZEB/PEB ratings is examined in Step 4.
In steps 1 (computer simulated) and 2 (measured), the INI-C Energy Performance Rating Methodology is used. For step 3, probabilistic models and Monte Carlo simulation are used, and accurate data are presented for the building and the photovoltaic solar energy generation system.

2.1. Step 1—Energy Efficiency Classification Methodology

According to the Brazilian National Institute of Metrology, Standardization and Industrial Quality (INMETRO, acronym in Portuguese) Ordinance no. 309 (9/06/2022) [49], which establishes the INI-C, the classification of the general energy efficiency level of buildings is based on primary energy consumption, comparing the consumption of the actual building with the same building in a reference condition, which corresponds to classification D [6]. This D classification corresponds to a building with no shading on outside windows, specific materials for exterior walls, roof, and glass, as well as a fixed window–wall ratio (PAFT, acronym in Portuguese) and Lighting Potency Density (DPI, acronym in Portuguese), depending on the building’s type; for this case, it will be an educational building of college-level type. Floor insulation should be considered nonexistent, and the Coefficient of Performance (COP) for Heating, Ventilating, and Air Conditioning (HVAC) systems should be 2.6. It is important to note that all variable acronyms will be used following the ordinance. All such values can be seen in Appendix A.
This standard utilizes the bioclimatic zoning proposed by the Brazilian Association of Technical Standards (ABNT, acronym in Portuguese) [46,47], facilitating the replication of this methodology across the entire national territory. As an international alternative to this, other labeling systems can be used if the basis of the certification is an energy reduction analysis, as can be seen in Excellence in Design for Greater Efficiencies (EDGE) certification, which awards labels for energy savings, from 20% reduction to 100% reduction, depending on specific labeling standards [49].
The INI-C evaluates buildings that are fully air conditioned, fully naturally ventilated, or hybrid (natural ventilation and air conditioning). Energy consumption can be estimated using simplified or simulation methods or a combination. This research used the simulation method for the air conditioning, lighting, and envelope systems. Envelope systems refer to walls and roofs that separate interior spaces and the exterior of the building [6].
According to the normative instruction, the thermal-energy simulation method can be applied to any building. The requirements for the type of software to be used in the simulations are defined in point C.I.1 of the INI-C. Using this method, the final consumption that corresponds to each electrical energy system is obtained, besides the estimation of the total annual thermal load reduction of the building for the evaluation of the envelope, the energy consumption of the artificial lighting system, and the annual cooling consumption. The primary energy consumption of the real condition (CEP,real, acronym in Portuguese) and the building’s reference condition (CEP,ref) should be calculated from the simulation output data. The final step is to determine the building’s energy efficiency rating.
The assessment of the case study’s energy efficiency and self-sufficiency classification level was structured in steps, as shown in Figure 4. It consists of the following: I. collection of data and information on the building and its systems; II. based on the collected data, the computer model is prepared according to the normative instruction guidelines for a preliminary simulation; and III. carry out the thermos-energetic simulation based on the normative instruction INI-C, which presents the procedures related to the thermos-energetic simulation method (C. I), described in INI-C [6], to find the building systems’ consumption and the building’s thermal load.

2.1.1. Data Survey

The research methodology begins with collecting data on the three building systems (envelope, ventilation and air conditioning, and lighting) through an on-site architectural survey and interviews with staff and occupants of the space. The information obtained is presented in Table A1 in Appendix A.

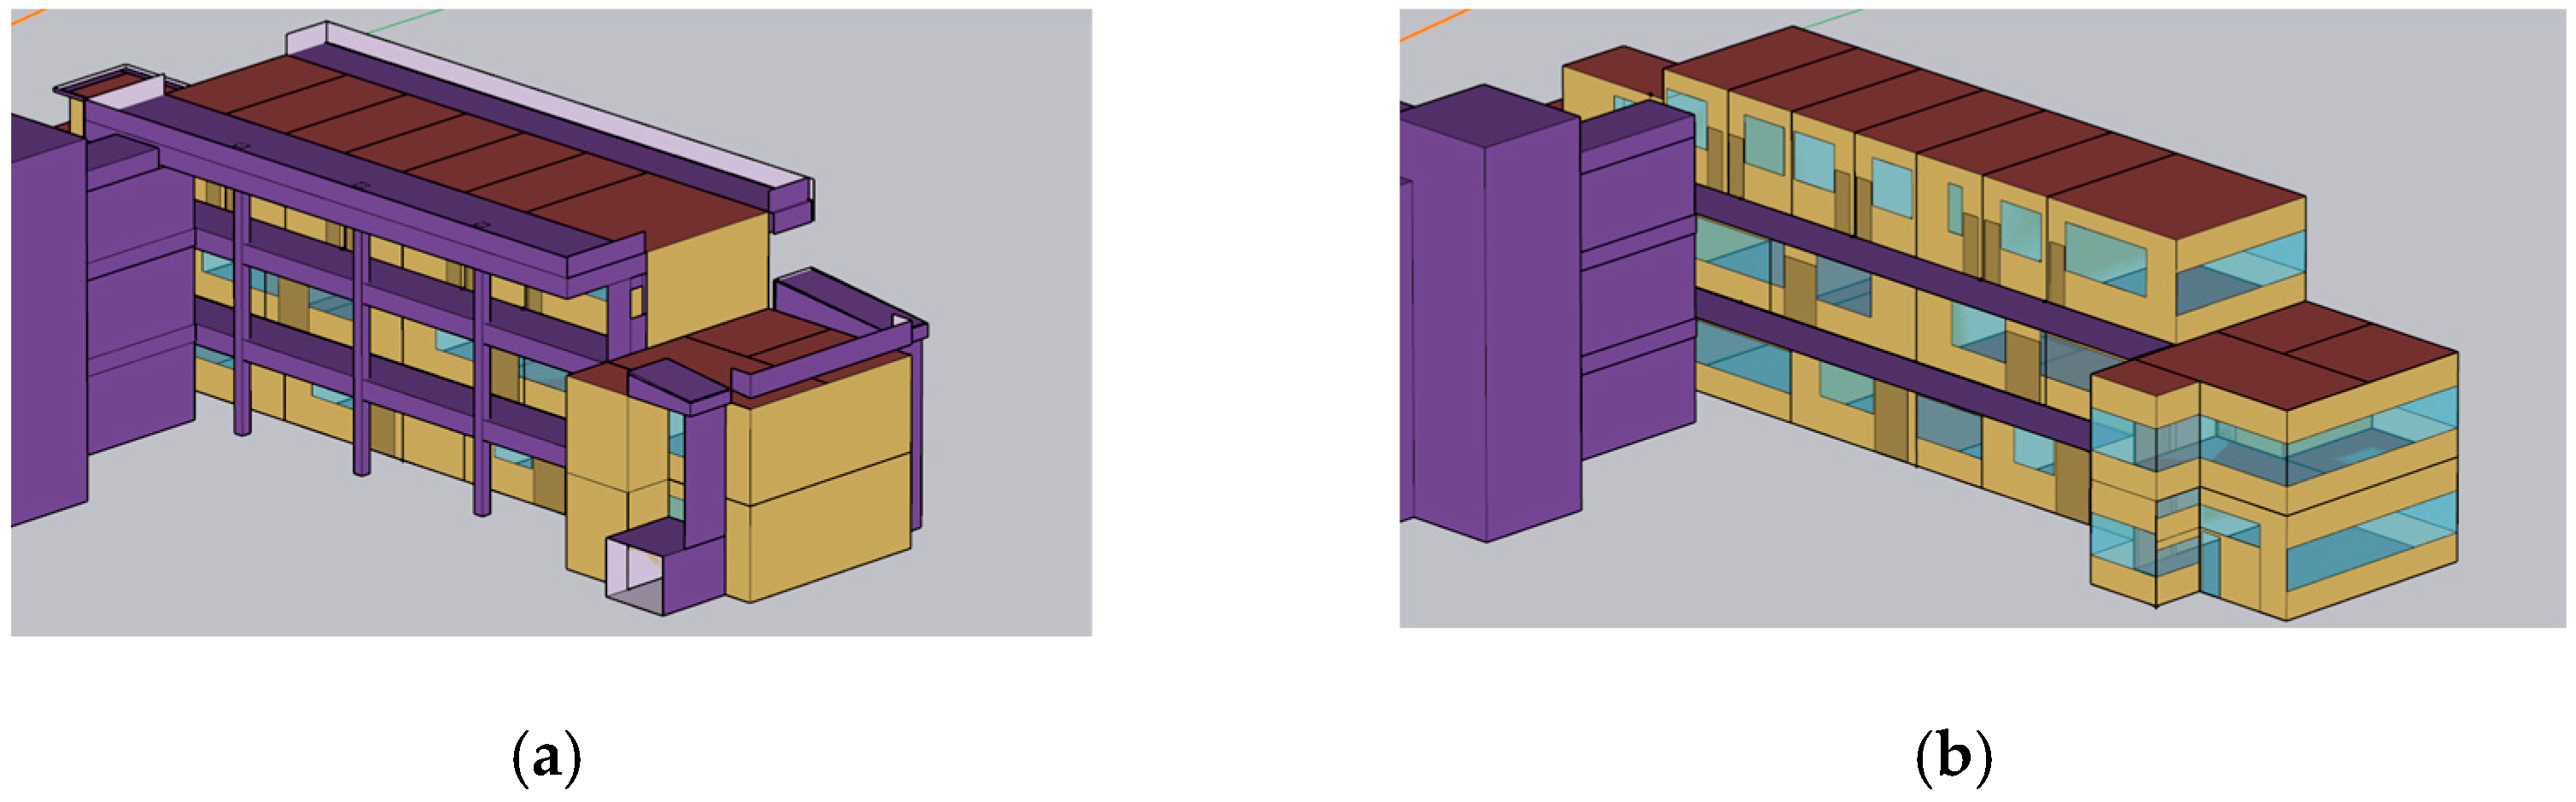
2.1.2. Computational Modeling

The modeling process consists of creating virtual spaces that resemble the real ones. According to the guidelines, real buildings with complex geometries must be divided into regularly shaped blocks. Each block must be modeled in separate files, with the other blocks kept as shading objects. Each space within the block must be marked with a thermal zone where heat transfer will occur. Each enclosed space will receive a thermal zone, as observed in previous works Outside, following modeling guidelines from [6], nearby buildings are included in simplified form, and vegetation will not be included in this study.
These requirements led to the adoption of the graphical interface of the OpenStudio 1.1.0 software. This software uses the EnergyPlus software (version 9.4.0) as a calculation engine for geometric modeling and characterization of operating schedules, internal occupancy loads, thermal properties of materials and internal occupancy loads, artificial lighting, and electrical equipment.
The OpenStudio software assigns schedules to the space types identified in the blocks according to user data. Each typology is classified according to the similarity of schedules, occupancy, and presence of electrical equipment and materials. The schedules are defined and assigned to the typologies and the construction materials with thickness, thermal conductivity, specific heat, density, and thermal absorption data. Those data are taken from ABNT NBR [45,46] or [49].
Finally, according to point C.I.2 of the INI-C, the climate file must contain information representative of the city’s climate where the building will be located. The normative instruction adopts the climate classification ABNT NBR [46] proposed to verify the climate’s influence. The climate file used for the city of Belém is available [50].
The output results to be analyzed in this step are appliance and artificial lighting electricity consumption, thermal transmittance, solar reflectance, and the percentage of total exterior openness.

2.1.3. Thermo-Energetic Simulation

Once the computer model is complete, the OpenStudio files are exported in .idf format for further configuration in EnergyPlus. At this stage, the soil models for each block are included. In this case, the Ground Finite Difference model is used as it provides more reliable results at the cost of computational time [51]. This ground model uses a one-dimensional finite difference heat transfer model to execute an annual simulation considering the INMET weather file [52]. This simulation is executed before the thermal zones to obtain a steady ground temperature profile that the zone simulation can use.
After soil configuration, the artificial conditioning systems are created using the HVAC Template object of EnergyPlus for heating, ventilation, and air conditioning (HVAC), commonly used for split systems [53]. All HVAC systems in this study are split systems. Therefore, the only EnergyPlus objects used are HVAC Template: System: Unitary and HVAC Template: Zone: Unitary to simulate air conditioning systems. These objects mainly require the variables of HVAC cooling capacity in W, COP, and setpoint temperature, which are all presented in Appendix A. The simulations are then calibrated using the building’s annual cooling consumption, total annual thermal load, and total monthly consumption.
The results obtained from the real model are compared with the values of a reference model (Figure 5), which is modeled based on the parameters of level D defined by INI-C, which considers a fixed window–wall ratio of 40%, no shading from the roof, and building elements such as brise-soleil while keeping neighboring shading from blocks. Both models are simulated with the same space shape, operating schedules, occupancy density, and electrical equipment power.
By comparison, it is possible to classify the block according to its bioclimatic zone (ZB, acronym in Portuguese) and form factor (FF, acronym in Portuguese), both for the envelope and artificial lighting. The form factor is the ratio between the envelope’s area and the block’s volume. For this study, the blocks’ envelope and volume areas are added together to make this classification.
The HVAC classification depends only on the bioclimatic zoning. After the simulation, it is possible to obtain the classification of the energy efficiency level and the definition of the general Brazilian National Energy Conservation Label (ENCE, acronym in Portuguese) using Equation (1) from [6]. All other consumption classifications stem from this equation through the same methods, as can be seen from Equations (2)–(4).
RedCEP A, B or C = ((CEP,refD A, B or C − CEPreal A, B or C)/CEP,refD A, B or C) × 100
where RedCEP A, B or C is the reduction in primary energy consumption for blocks A, B or C; CEPrefD A,B or C is the primary energy consumption of the reference (level D) building condition for all the blocks (kWh/year); and CEPrealA,B or C is the primary energy consumption of the real building for all the blocks (kWh/year).
RedCgTTA,B or C = ((CgTT,refDA, B or C − CgTTrealA, B or C)/CgTT,refDA, B or C) × 100
where RedCgTTA,B or C, is the reduction in total annual thermal loads for all the blocks; CgTT,refDA, B or C is the total annual thermal of the reference (level D) building condition for all blocks (kWh/year); and CgTTrealA, B or C is the total annual thermal load of the real building for all blocks (kWh/year).
RedCRA,B or C = ((CR,refDA, B or C − CRrealA, B or C)/CR,refDA, B or C) × 100
where RedCRA,B or C is the reduction in air conditioning consumption for the blocks; CR,refDA, B or C is the cooling consumption of the reference (level D) building condition for all blocks (kWh/year); and CRrealA, B or C is the cooling consumption of the real building for all block (kWh/year).
RedCIL A, B or C = ((CIL,refD A, B or C − CILreal A, B or C,)/CIL,refD A, B or C) × 100
where RedCIL A, B or C is a reduction in lighting consumption for all blocks; CIL,refDA, B or C is the lighting consumption of the reference (level D) building condition all blocks (kWh/year); and CILreal A, B or C is the lighting consumption of the real building for all blocks (kWh/year).
These variables can be calculated using Equations (5)–(7) from [6]:
CEP,real = (CEE,real × fCE) + (CET,real × fCT) − (GEE. fCE)
where CEP, is the primary energy consumption of the real building (CEP,real) (kWh/year); CEE is the total electrical energy consumption of the real building(CEE,real) (kWh/year); fCE is the conversion factor of electrical energy into primary energy; CET is the total thermal energy consumption of the real building (CET,real) (kWh/year), if applicable; fCT is the conversion factor of thermal energy into primary energy; GEE is the energy generated by local renewable energy sources (kWh/year); CET and GEE are not used for this analysis phase.
CEP,refD − (CEE,refD × fCE)
where CEP, is the primary energy consumption of the reference (level D) building condition (CEP,refD) (kWh/year); CEE is the total electrical energy consumption of the reference (level D) building condition (CEE,refD).
CEE,real or refD = CR,real or refD + CIL,real or refD + CAAE,real or refD + CEQ
where CR is the cooling consumption of the real building’s HVAC (CR,real) or in its reference (level D) condition (CR,refD) (kWh/year); CIL is the lighting consumption of the real building lighting system (CIL,real) or in its reference (level D) condition (CIL,refD) (kWh/year); CAAE is the electrical energy consumption of the water heating system of the real building (CAAE,real) or in its reference (level D) condition (CAAE,refD) (kWh/year); and CEQ is the equipment consumption (kWh/year). CAAE,real or refD is zero.
All these values are obtained at the end of the computer simulation in energy end uses in an HTML file. The conversion factor of electrical energy to primary energy fCE has a value of 1.6 [6]. In addition, CgTT,real or refD is obtained to classify the envelope system.
Finally, consumption is classified within efficiency classes, ranging from E to A. The factors needed to obtain these classes are the bioclimatic zone, the form factor, and the range, which depends on the system being evaluated. The methodology used to obtain the CEP and CgTT can be observed in (8).
i = (CRCEPD-A or CRCgTTD-A × 100)/3
where i is the calculated value representing the interval between classes, (%); CRCEPD-A is the primary energy consumption reduction coefficient from classification D to A; and CRCgTTD-A is the total annual thermal load reduction coefficient for classifications from D to A [6]. The application of these variables can be seen in Table 1 and Table 2, adapted from [6].
Only the bioclimatic zone is considered for the intervals for air conditioning systems. These intervals are shown in Table 3, adapted from [6].
Finally, for artificial lighting, the ranges depend on the lighting consumption for D and A ratings, as per (9):
i = (((CIL,refD − CIL,refA)/CIL,refD) × 100)/3
After identifying all ranges except refrigeration consumption, the classification for all other systems can be obtained by comparing the reduction coefficients and classes, as shown in Table 4.
The regulations follow the classification process by comparing electricity consumption and generation to achieve the NZEB target. Due to the existence of a central photovoltaic system that does not belong to a single block but to the building as a whole, it was necessary to add up and weight the consumption and reduction of primary energy consumption (RedCEPweighted) of the blocks to obtain a classification result and total final consumption for the building.
The weighting was done using the ratio between the RedCEP of each block and the sum of the consumption of each block (A, B, and C). Adding the envelope areas and volumes was also necessary to obtain a unified form factor. Equation (10) for weighting the building’s primary energy consumption is shown below:
RedCEPweighted = ∑ (RedCEPn × CEPn)/∑CEPn
where RedCEPweighted is the weighted reduction in primary energy consumption (kWh/year), ∑RedCEPn is the sum of the reduction in primary energy consumption of a block n (kWh/year), and ∑CEPn is the sum of the primary energy consumption of a block n (kWh/year).
After obtaining the weighted value of the reduction in primary energy consumption (RedCEPweighted), the final energy efficiency rating is obtained from Table 4. This value is compared with the calculated ranges to identify the final general energy efficiency rating.

2.2. Step 2—Near Zero Energy Building (NZEB) or Positive Energy Building (PEB) Classification Methodology

Next, the building’s energy balance is carried out, where it is possible to evaluate the contribution of local renewable energy generation systems generated on-site. According to INI-C [6], the level of this contribution can classify the building as near zero energy (NZEB) or positive energy (PEB) through the potential for energy generation (PG) by the use of local renewable energy sources, which is obtained using Equation (11).
PG = (GEE × fCE × 100)/(CEE,real . fCE) + (CET,real . fCT)
where PG is the energy generation potential (%); GEE is the energy generated by local renewable energy sources (kWh/year); CEE,real is the total electrical energy consumption of the consumer unit (CU) in real condition (kWh/year); CET,real is the total thermal energy consumption of the CU in real condition (kWh/year); fCE is the conversion factor of electrical energy into primary energy, which will be considered 1.6; fCT is the conversion factor of thermal energy into primary energy, which will be considered 1.1. Both conversion factors can be sourced from Table 8.1 of [6].
The PG can determine whether a building is NZEB or PEB. According to [6], if the PG was more significant than or equal to 50% but less than or equal to 100%, the building could be considered NZEB. It can be classified as a PEB if it is higher than 100%.

2.3. Step 3—Predictability of Integrating Electric Car Charging into Buildings

In step 3, actual energy consumption data for the building, the vehicle charging system, and photovoltaic generation (PV) are used, according to the database of the Electricity Consumption Management System (SISGEE) platform prepared by the CEAMAZON-UFPA team [22,54].
To predict the integration of electric car charging in buildings, this study’s methodology estimates the time of arrival and percentage of the electric vehicle (EV) charge using probabilistic models such as Poisson distribution models [30]. Given the additional load on the building due to EV charging, the solution proposed in this work includes demand-side management strategies to prevent EV charging from impacting building performance, as shown in Figure 6.
In this case, peak shaving has been used, which considers the reduction and/or cutting of part of the loads during peak hours of the day; this is associated with a maximum demand, considering that the user has contracted an energy tariff with cost per kW. In this case and aiming at the implementation of electric vehicles in the building, the load to which the DSM was applied was that of the electric vehicles to avoid their annual consumption due to their recharging from exceeding the photovoltaic generation of the building and, therefore, maintain the NZEB classification of the building.
The electric vehicle charging infrastructure comprises four (4) 7.6 kVA slow-charge chargers and three (3) 22 kVA semi-fast chargers. The algorithm developed to simulate the electricity consumption of EVs, made in the OpenDSS software, considers this information. All this information and the methodologies described above can be viewed in the flowchart of step 3, represented in Figure 6.

2.4. Demand Side Response Techniques and Algorithm Explanation

The demand-side response techniques used in this study are critical to managing energy consumption and maintaining the building’s energy efficiency rating despite the integration of electric vehicles (EVs). Techniques include probabilistic models and Monte Carlo simulations implemented in Python, using OpenDSS software to evaluate power flow scenarios.

2.4.1. Probabilistic Models and Monte Carlo Simulation

Monte Carlo is a technique that is particularly relevant in the context of electric vehicle charging to address problems with high levels of uncertainty and constraints. This study uses probabilistic models to estimate variability in EV charging demand. As presented before, the Poisson distribution is used to model the arrival number of EVs and their state of charge (SOC) at charging stations. This is done at each step of the OpenDSS simulation every ten minutes, using a random number based on a standard distribution of EVs arriving at the charging station to be charged; in addition, their battery charge state is also a random number based on a normal distribution. remembering that this only operates from 8 am to 4 pm, as cars arrive in the building’s parking lot during this period. The Monte Carlo method is used to simulate EV charging behavior, which helps understand the impact of EV integration on energy consumption and building efficiency rating.

2.4.2. Mathematical Foundation

Let λ be the average EV arrival rate per 10 min. The Poisson distribution gives the probability of k EVs arriving every 10 min.
The number of EVs arriving at charging points and the battery charge of the EVs upon arrival is modeled as a normal distribution with mean µ and standard deviation σ in (12):
X = µ + σZ
where Z is a random number drawn from the standard normal distribution; thus, X is a random number from the normal distribution with mean µ and standard deviation σ.
For the number of EVs that will arrive, an average of 1 and a standard deviation of 1 are used, while for the EV battery charge, an average of 20 and a standard deviation of 5 are used. It is worth noting that the simulation does not work with fractional values, as integer values are needed for the number of EVs, so before proceeding with the simulation, the absolute value of the value of X is obtained directly.

2.4.3. Demand-Side Management Strategy

Two scenarios were considered to manage the increase in load due to EV charging:
  • Scenario 1—Unrestricted loading: EVs can charge to their maximum capacity without restrictions. This leads to significant increases in the energy consumption of buildings. This means that during the simulation, the number of EVs remains a random number based on a normal distribution, and the amount of battery charge is also received as a random number based on a normal distribution. Therefore, EVs are inserted into the grid to start charging their batteries to full. Thus, this scenario aims to demonstrate the case in which EVs are charged without any restriction on their charging power and without restriction on the energy they consume from the building.
  • Scenario 2—Top-up management: Charging is optimized by reducing the power consumed by each EV and switching off EVs with a charge percentage greater than 80% if necessary. This strategy limits charging power by avoiding consumption peaks and ensures that total energy consumption remains within acceptable limits, mitigating the impact on the building’s energy efficiency rating. This means that during the simulation, the number of EVs remains a random number based on a normal distribution, and the amount of battery charge is also received at a random number based on a normal distribution. However, EVs can have their charging power reduced to avoid consumption peaks at a given time. This is done if the transformer is close to its maximum capacity; that is, the algorithm works by reducing the power of the EVs so that there are no overloads in the building’s transformer. Furthermore, the energy consumed by EVs directly affects the energy efficiency rating of the building. For this, there is also a limitation on the energy consumed, so the algorithm can turn off the charging of an EV so that it can no longer charge that day, seeking to limit this energy consumption of EVs.

2.4.4. Python Implementations

The Python script connects to the OpenDSS software to perform detailed power flow analysis in an electrical system. The process begins with establishing a connection to OpenDSS, followed by starting the simulation in ten-minute intervals.
Next, a loop applies the Monte Carlo method. Initially, a number is randomly chosen following a normal distribution to determine the number of cars arriving for charging. Another number is similarly selected to estimate the cars’ battery charge level. With this data, the simulation step is performed. The algorithm collects information such as voltage, power, and energy from all points in the electrical network. These data are used to evaluate the network’s performance. The management system checks if the transformer is overloaded or if there are any under-voltages, and calculates the energy of the equipment and analyzes the building’s classification. If overloads or under-voltages are detected, the algorithm adjusts the charging power of the electric vehicles (EVs). If the charging power has already been reduced to 50% of the nominal level and problems persist, the algorithm stops charging the EV with the highest battery charge while keeping the other EVs charging at 50% of the nominal power.
After adjusting the network conditions, the algorithm prepares for the next simulation step, ending the loop. Finally, the energy, power, and voltage data are processed to obtain detailed information about the simulated scenarios. The flowchart depicted in Figure 7 concisely represents the workflow for the simulation framework using OpenDSS. The procedure begins by importing necessary libraries and establishing a connection to OpenDSS, then preparing the DSS file and initializing simulation parameters. The main loop involves adjusting load conditions, solving the circuit, applying the Monte Carlo method for EV charging simulation, and recording energy data. Post-simulation, the framework analyzes and stores the results, which are then visualized for comprehensive data interpretation. This figure succinctly illustrates the methodological steps of the framework, ensuring robust analysis of EV impacts on power distribution networks.
The analysis of the scenarios aims to infer the extent to which the implementation of vehicle charging could compromise the classification of energy-efficient buildings, especially NZEBs (near zero energy buildings) and PEBs (positive energy buildings).
Finally, it is vital to note that total transformer power is another variable that was initially thought of. However, due to photovoltaic generation, no breach of this parameter was found from multiple simulations, so it is not discussed in the results.

2.5. Step 4—Assessment of Energy Performance in Buildings, Considering the EV Supply System
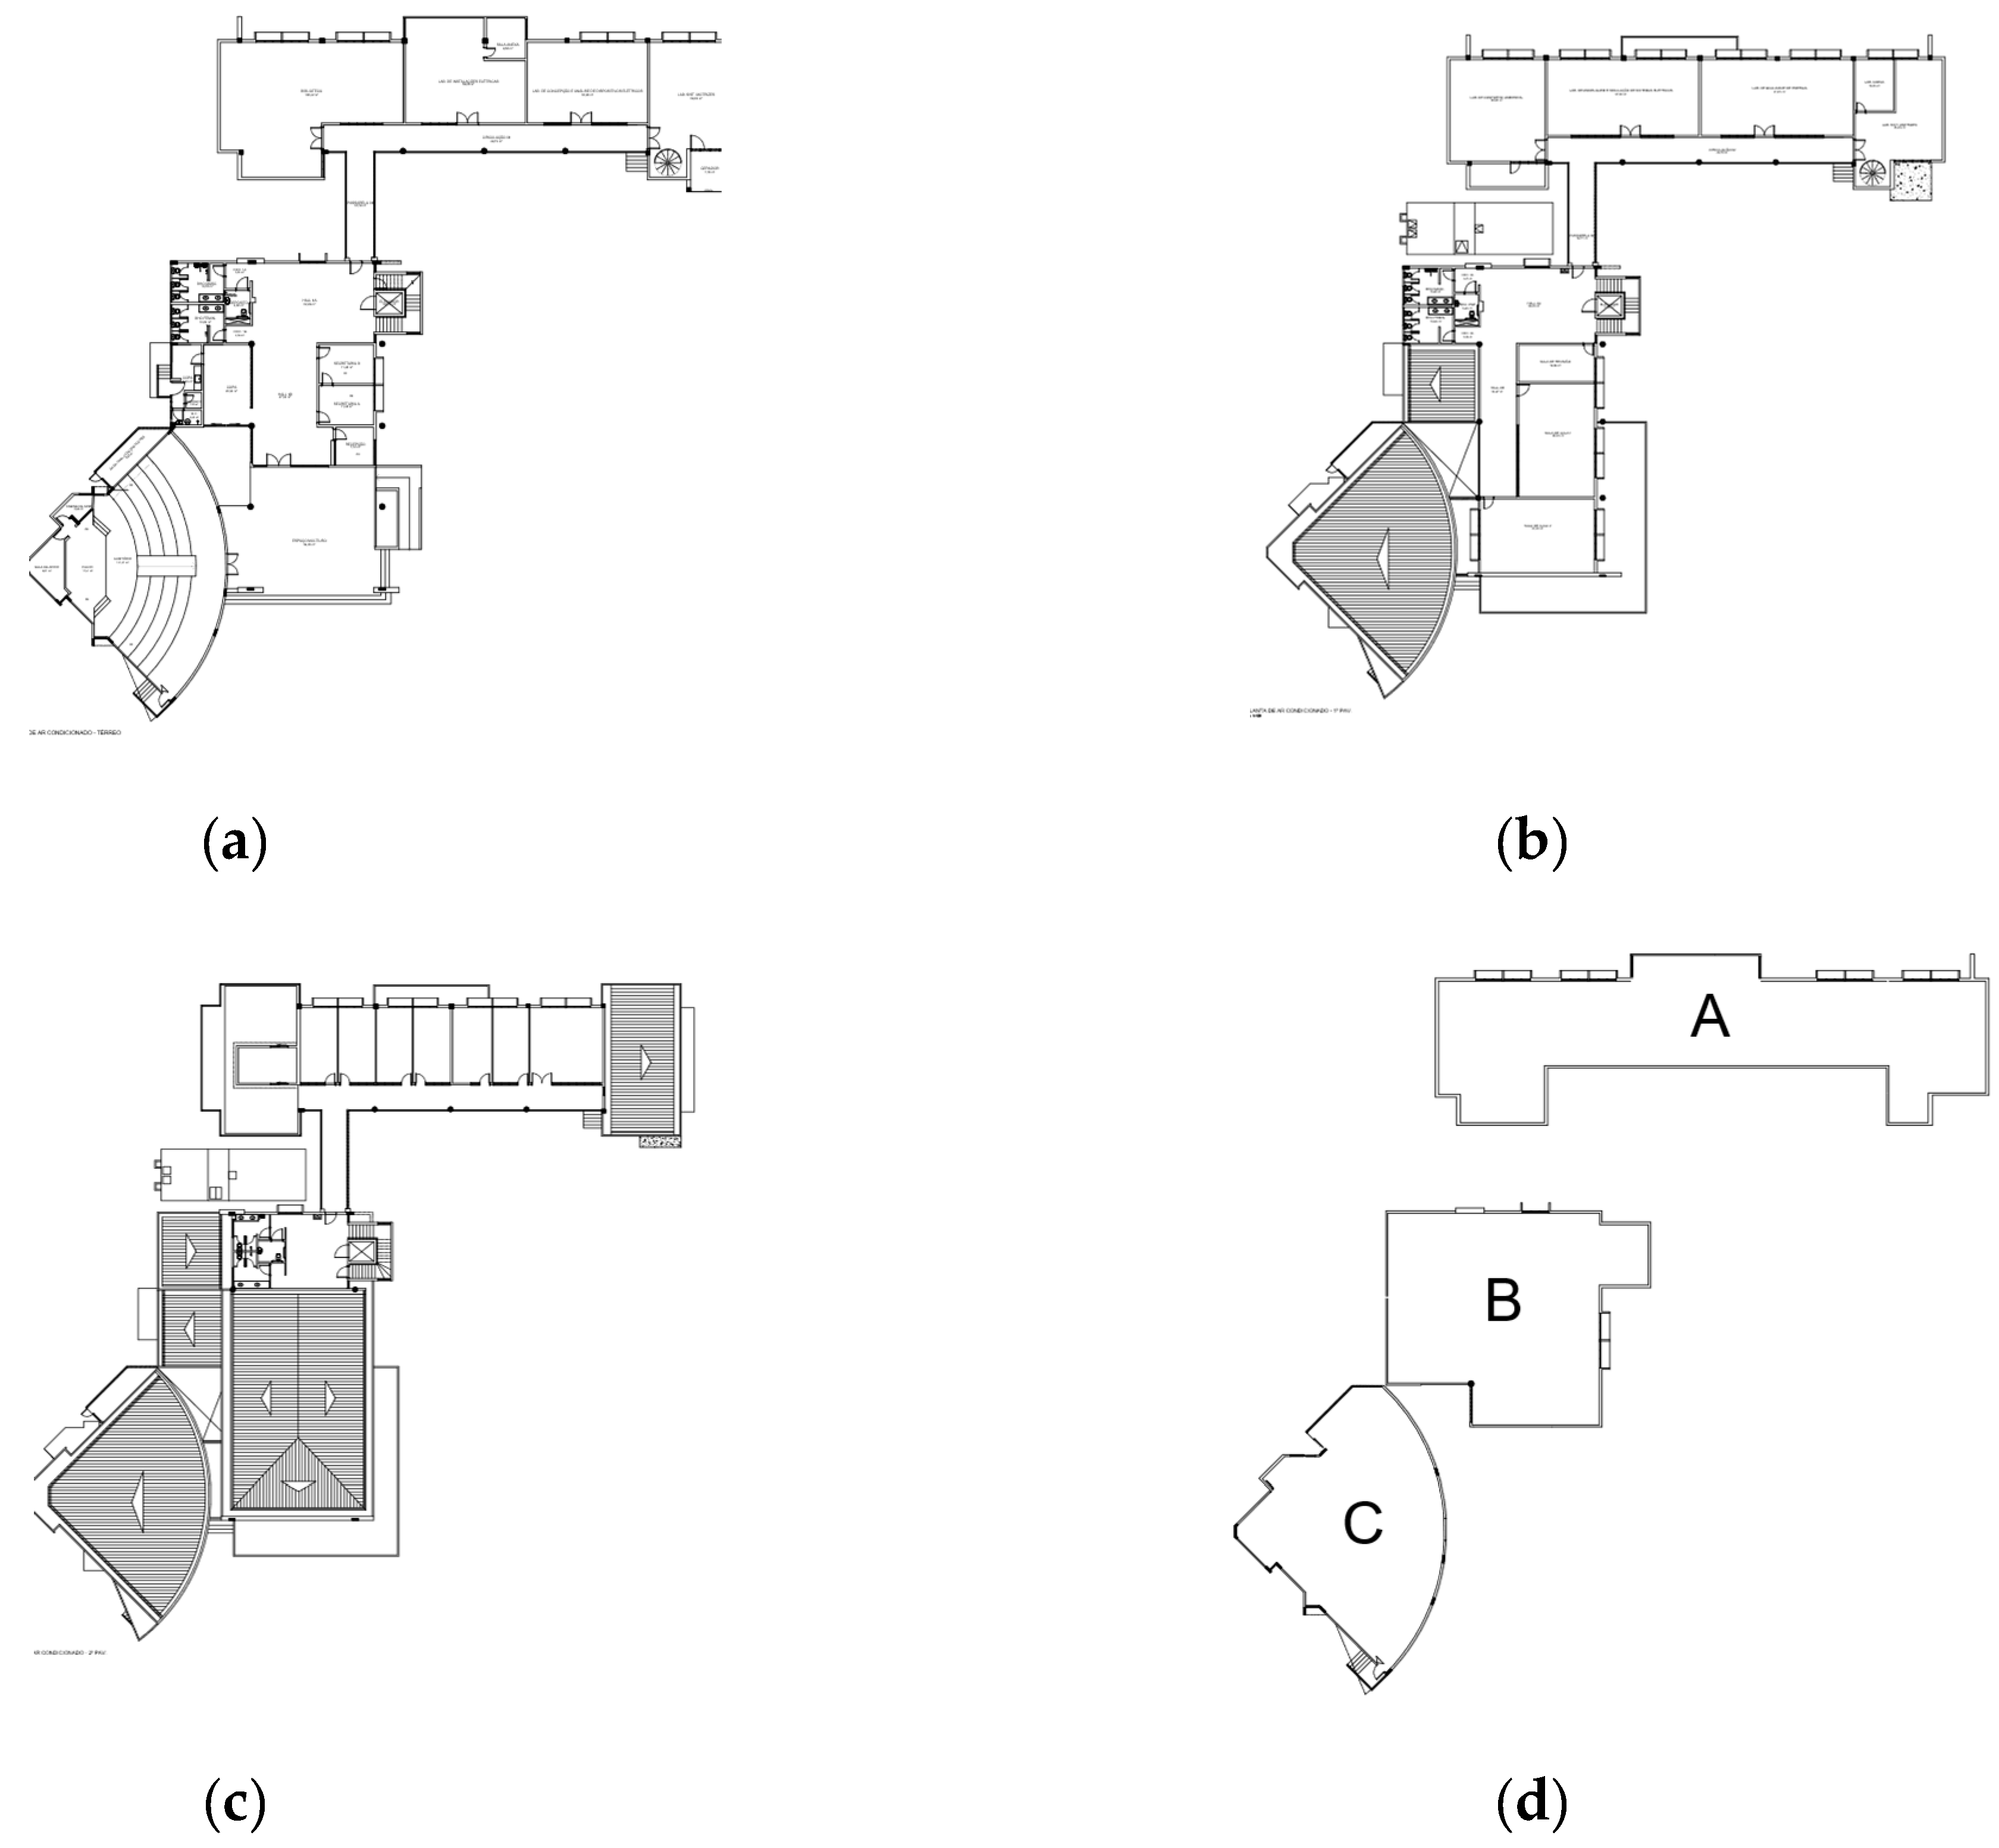
In the fourth and final step, the calculation methodology stipulates a reference value for energy consumption in a building. This helps the building manager verify whether the energy efficiency class, obtained through good practices in the design step or system refurbishment, is affected by the increase in consumption resulting from the integration of electric vehicles.
To do this, it is necessary to include EV consumption in the INMETRO certification calculation methodology. Currently, the methodology only considers the consumption of electrical equipment, lighting, air conditioning, and water heating, if any, according to Equation (1), which results in weighting presented in (10), both of which have already been given. At this step, the vehicle load is proposed to be included as a factor/coefficient in Equation (10) since it is connected to the building as a whole and not to a single block. This results in Equation (13):
RedCEPweighted = ∑RedCEPn × CEPn/∑CEPn + (CVE × fCE)
where CVE is electric vehicle consumption (kWh/year).

3. Case Study

As mentioned, the case study is applied in CEAMAZON (Figure 8), located within the Federal University of Para (UFPA), at the Guamá Science and Technology Park, Perimetral Avenue 2651, latitude −1.46667 and longitude −48.44575, building 01, Guamá neighborhood, city of Belém, State of Pará, Brazil. It is a multi-story building with a total built area of 2395.43 m2 and 1697.3 m2 of useful area, divided into three floors (Figure A1, Appendix B).
The lighting system consists of 276 lamps, totaling 16,612.00 W of installed power. The air conditioning system comprises 35 devices of all types, with power varying between 12,000 and 58,000 BTU/h, totaling 896,000 BTU/h of installed power. The building’s population consists of 75 people, including 8 teachers, 7 administrative technicians, and approximately 64 undergraduate, master’s, and doctorate students who work with research in the 7 laboratories that make up the center.
The building’s consumption history, which operates from 8 a.m. to 6 p.m. throughout the school term (174 days) and university vacation, was estimated based on the measurement data generated in 2022 through the Electricity Management System (SISGEE) platform prepared by the CEAMAZON-UFPA team. The data simulation in EnergyPlus found that the building in question has a total annual consumption of 140,567.88 kWh/year (Figure 9).
The building has an 80 kW photovoltaic system installed on its grounds, with 234 and 335 Wp photovoltaic modules operating without interruption since January 2021 and two charging stations (DC and AC). In 2022, the system’s reference year for this study, a total annual renewable energy generation of 115.854,00 kWh/year was achieved, as shown in Figure 9.
The CEAMAZON has meters installed that allow load metering in real time, 24 h a day. It was designed to be efficient but does not have the Brazilian efficiency label. It is essential to point out that the CEAMAZON is in the Amazon region, which presents significant advantages concerning photovoltaic generation, first because of the solar availability in the region, which does not vary significantly being an equatorial climate, and because most days of the year it rains in the late afternoon, which provides a natural cleaning of the solar cells and thus means solar generation is not affected by external factors such as dirt. However, scheduling cleaning programs to maximize waste at the bottom is always necessary due to the inclination. Furthermore, according to Brazilian Standard NBR 15220: Thermal Performance of Buildings [46], its corresponding bioclimatic zone (ZB) is 8.
The building has 26 parking spaces, but not all have electric charging stations. The electric vehicle supply infrastructure comprises four 7.6 kVA slow-charge chargers and three 22 kVA semi-quick-charge chargers. These numbers were determined by the availability of the transformer, which has 150 kVA of power. Of this capacity, 50 kVA is being used by loads of the building systems, leaving 75 kVA to supply the electric vehicles, without considering the use of the 25% (25 kVA) reserved for possible expansions in the building’s consumption.

4. Results

4.1. Energy Efficiency Level Classification of the CEAMAZON Building

4.1.1. Envelope Energy Efficiency Rating of the CEAMAZON Building

The building has 2646.54 m2 of envelope area and a total volume of 5320.55 m3, corresponding to a form factor (FF) of 0.50. Looking at INI-C [6], for bioclimatic zone 8, the 0.50 form factor corresponds to a Coefficient of Reduction of Primary Energy Consumption from classification D to classification A (CRCEPD-A) of 0.27. The classification interval (i) equal to 3.33 was obtained from this value, according to (5). This interval (i) resulted in Table 5:
As previously explained in Section 2.1.3—Thermo-Energetic Simulation, the case study building is analyzed in terms of three individual blocks. All values of the variables generated by the computer simulation for each individual block, in its real and reference condition, are presented in Appendix C. These individual data were used in the weightings to obtain the general values of the complete building.
The computer simulation resulted in a total annual thermal load for the real building (CgTT,real) of 271,459.51 kWh/year and a total yearly thermal load for the building in its reference condition (CgTT,ref) of 320,031.86 kWh/year. From these values, it was possible to see that the envelope has a reduction in total annual thermal load (RedCgTT) of 15.18%, which, in comparison with Table 5, corresponds to level A of the envelope’s energy efficiency class.

4.1.2. Efficiency Classification of the Air Conditioning System of the CEAMAZON Building

The air conditioning system is classified according to INI-C [6], with the limits of the energy efficiency classifications for each bioclimatic zone according to the corresponding climate classification. For bioclimatic zone 8, where the building under study is located, the limits are shown in Table 6.
The cooling consumption values for the building’s air conditioning system in its real condition (CR,real) and reference condition (CR,ref) were obtained from the CEAMAZON computer simulation, resulting in 110,476.84 kWh/year and 123,089.18 kWh/year, respectively.
Using the cooling consumption figures for the two cases, Equation (3) provides a percentage % reduction in the cooling system’s energy consumption (RedCR) of 10.25%. Comparing this to Table 6, we obtained energy efficiency class D for the building’s current air conditioning system.

4.1.3. Lighting System Efficiency Rating of the CEAMAZON Building

The lighting system analyzed by the computer simulation method resulted in lighting power limit values for classifications A and D (PILA and PILD) of 21,417.72 W and 38,157.98 W, respectively. In addition, the total installed lighting power (PIT), in its real condition, is 23,026.97 W.
Using these values, and the number of hours the building is in use per day and the number of occupancy days per year, according to the typology in INI-C [6]. The consumption values for the building’s lighting system in its reference condition D (CIL,refD) and classification A (CIL,refA) were 17,024.87 kWh/year and 9555.95 kWh/year, respectively.
Equation (9), using these values, provided a classification interval value of 14.62%. With this interval, the energy efficiency classification limits for the lighting system were established, as shown in Table 7.
The simulation also obtained a real building’s lighting system consumption value (CIL,real) of 10,263.43 kWh/year. Applying this value to Equation (4) results in an 8.47% reduction in the actual building’s lighting system (RedCIL) consumption, which, compared to Table 7, results in an energy efficiency class B for CEAMAZON’s current lighting system.

4.1.4. General Energy Efficiency Classification of the CEAMAZON Building

Looking at in INI-C [6], for bioclimatic zone 8, the 0.50 form factor corresponds to a Coefficient of Reduction of Primary Energy Consumption from classification D to classification A (CRCEPD-A) of 0.27. According to Equation (8), the classification interval (i) equal to 9 was obtained from this value. This interval (i) resulted in Table 8.
With the final values, the weighting is done, obtaining an overall primary energy classification of level C for the CEAMAZON building. The calculation procedure is applied to the Equation (10) presented in Section 2:
RedCEPweighted = [(10.195 × 181.501,904) + (21.724 × 33.624,18) + (9.78 × 9.782,53)]/(181.501,904 + 33.624,18 + 9.782,53) = 11.90%
Appendix C, Table A2, contains all consumption for real and reference cases, and Table A3, contains all reduction ratios and labels for each block, making it easier to use.

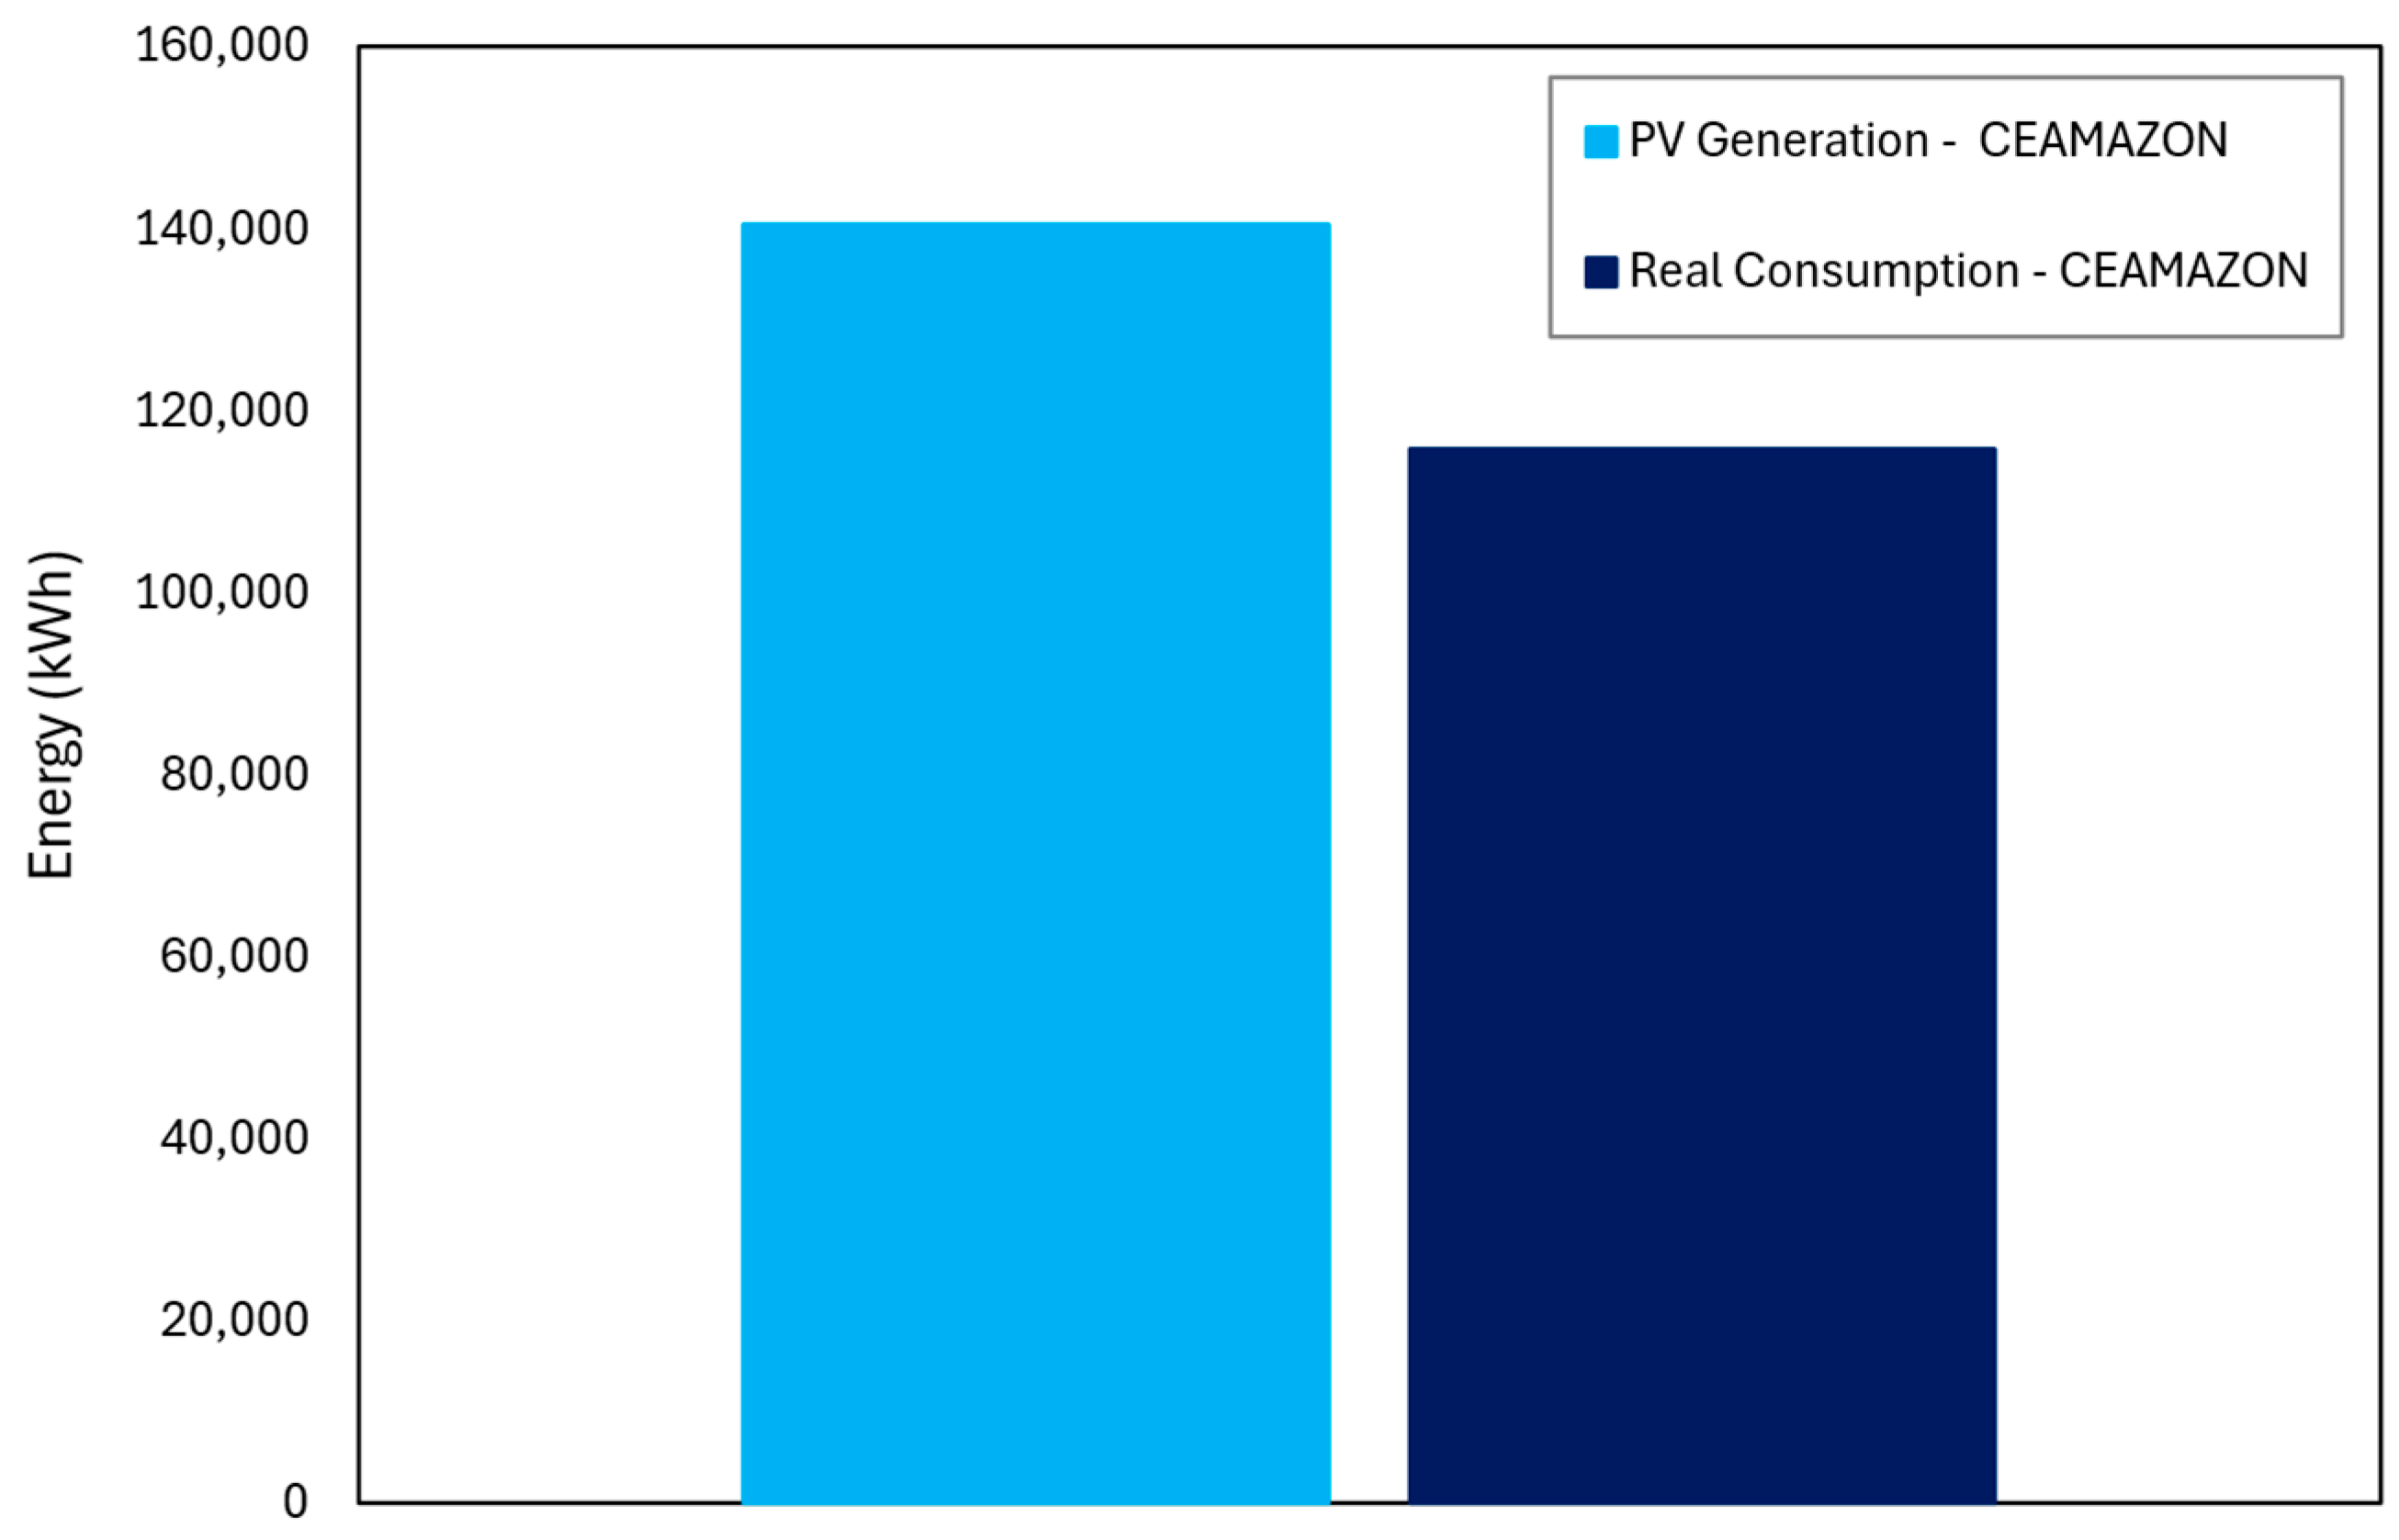
4.2. Near Zero Energy Building (NZEB) or Positive Energy Building (PEB) Classification of the CEAMAZON Building

With electricity consumption values (CEE,real) of 140,567.88 kWh/year, renewable energy generation (GEE) of 116,065.70 kWh/year, and the conversion factor of electricity into primary energy (fCE) of 1.6, the potential for energy generation (PG) can be obtained according to Equation (11):
PG = [116.065,70 × 1.6 × 100]/[140.567,88 × 1.6] = 82.57%
Generation potentials greater than or equal to 50% and less than 100% represent NZEB buildings, while potentials more significant than 100% show PEBs. The simulated results, therefore, classify CEAMAZON as an NZEB building [6].

4.3. Assessment of Energy Performance CEAMAZON in Buildings, Considering the EV Supply System

In Section 4, Section 4.1.4, the result of CEAMAZON’s overall energy performance rating was presented, resulting in a level of C for energy efficiency. The annual consumption figures in Section 3, obtained from EnergyPlus simulations, were used for the EV integration study.
Figure 9 shows the initial baseline scenario, which shows the building’s consumption (blue) and PV generation (cyan) curves for each month of the year. The values shown for this scenario are actual values from the photovoltaic (PV) generation system and the previous simulations in EnergyPlus. From the base case, the building can be categorized as an NZEB. The voltage per unit (p.u) is a parameter of interest in maintaining the power supply quality. Figure 10 shows the maximum and minimum voltage values recorded for the baseline. For this scenario, the voltages range from 0.95 p.u. to 1.05 p.u.

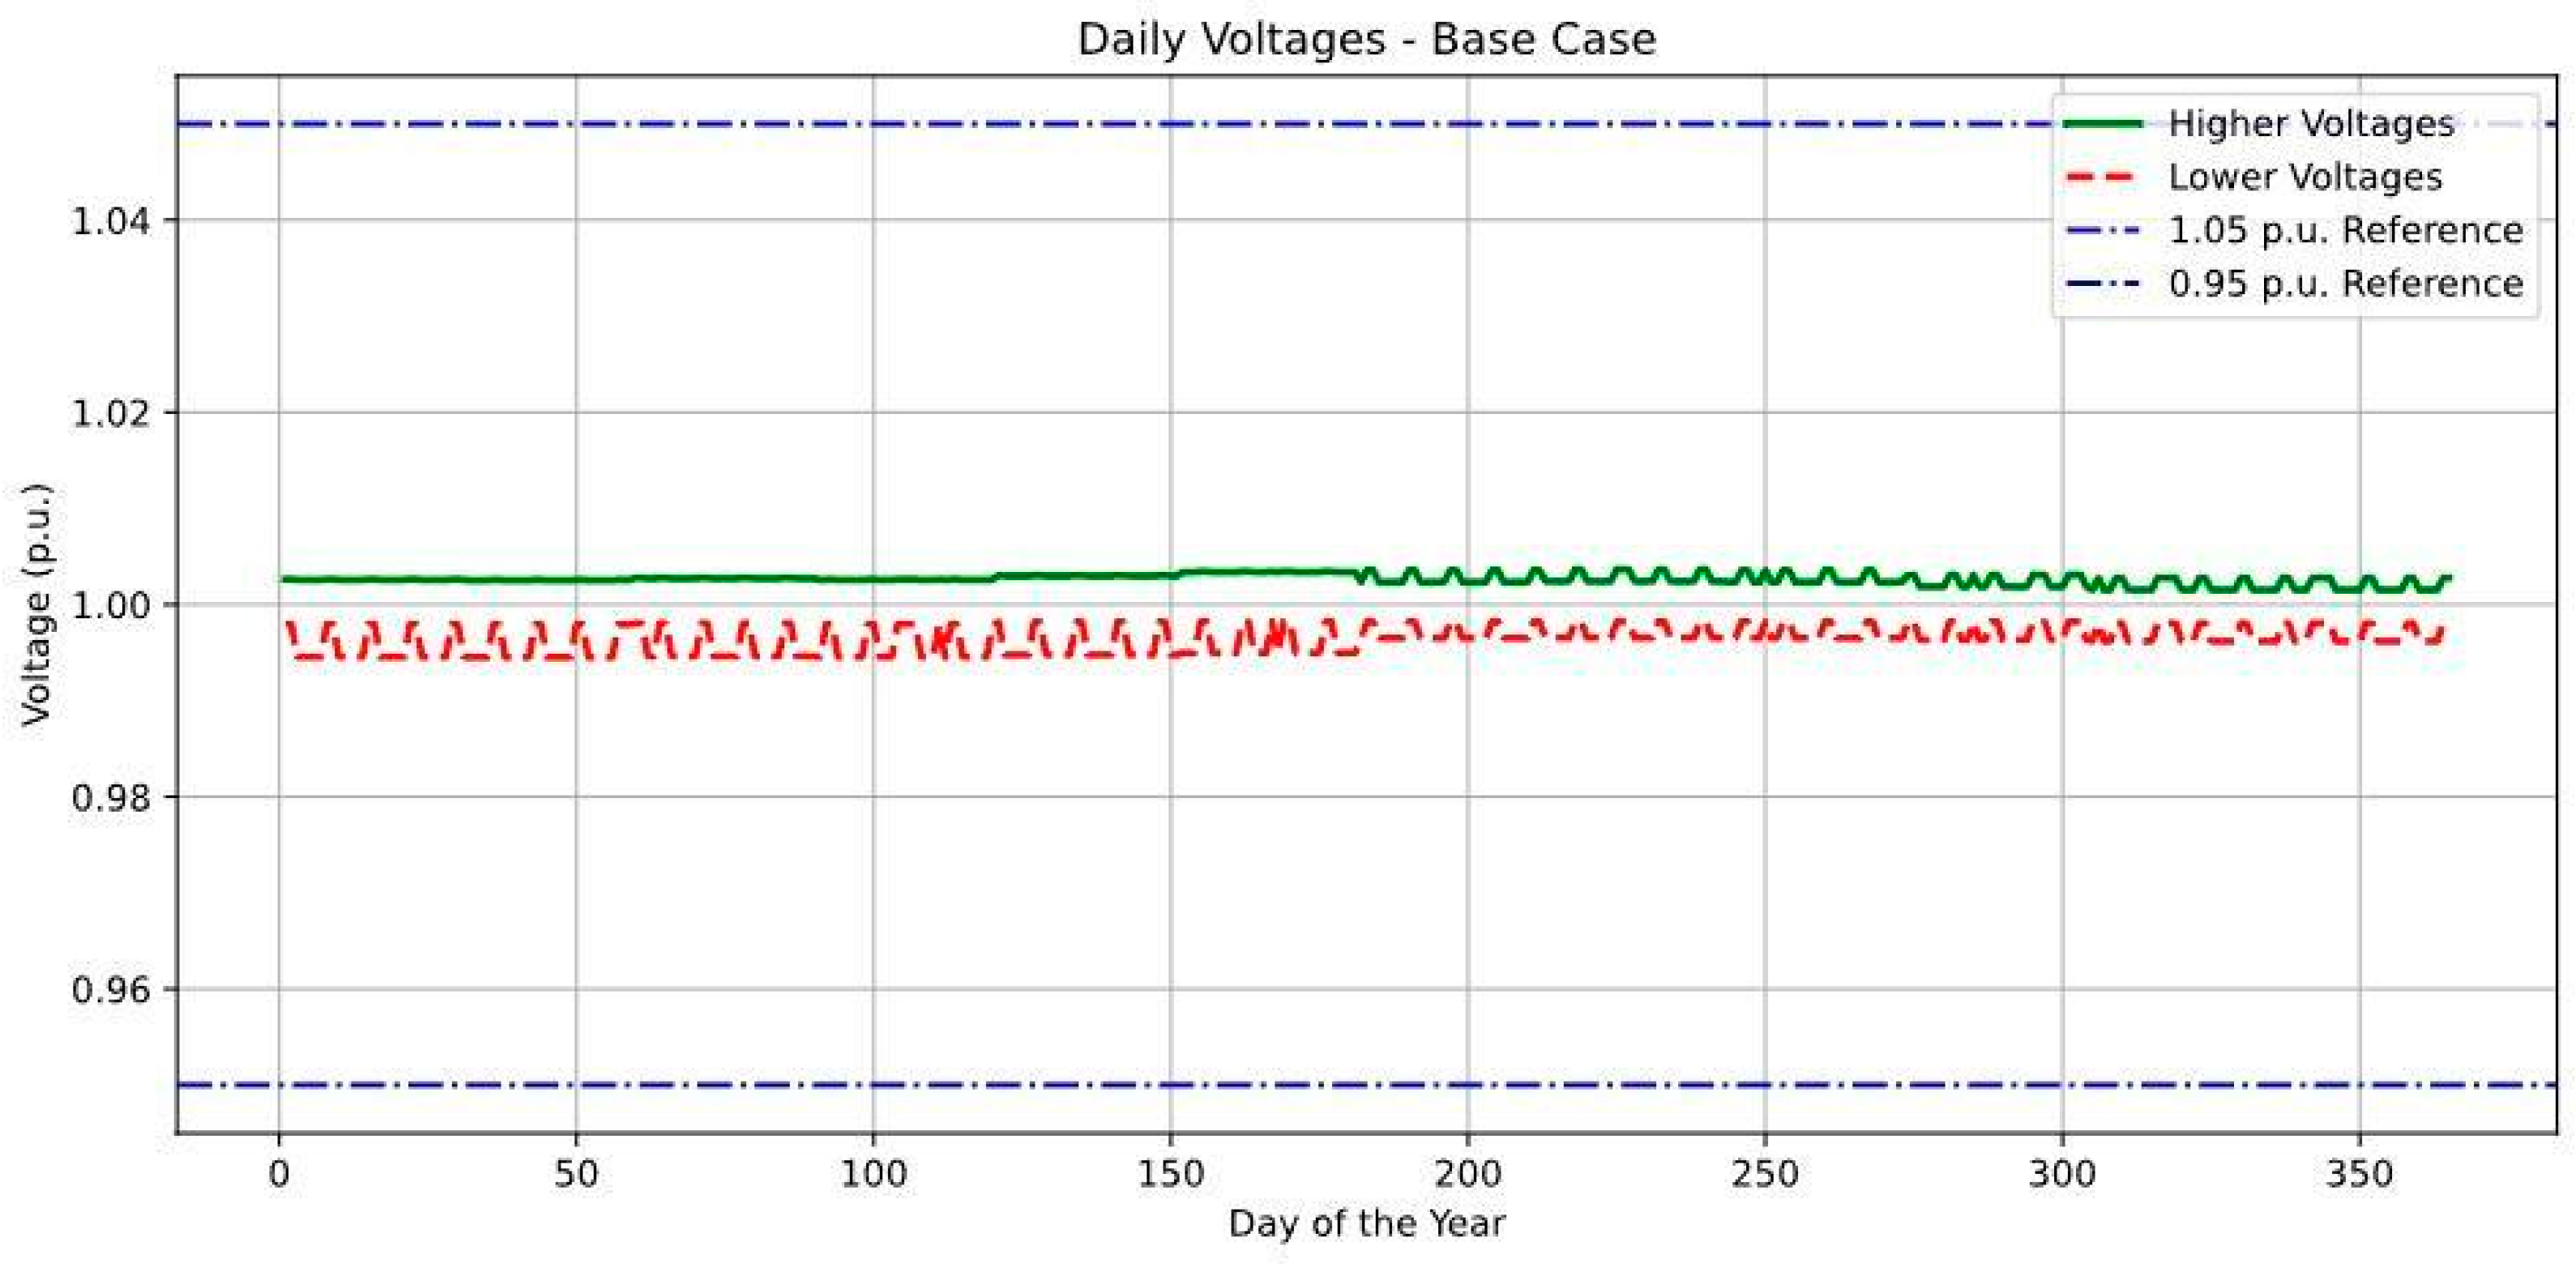
4.3.1. Energy Assessment of the CEAMAZON Building, Considering the Consumption of Electric Cars: Scenario 01, without Optimization

In the first scenario, illustrated in Figure 11, where there are no restrictions on EV charging, the energy consumed by EV charging leads to a significant increase in the energy consumption of the CEAMAZON building.
Using the computer simulation software OpenDSS, it was possible to obtain the electricity consumption of the electric car supply system for scenario 1, without considering restrictions, of 97,388.42 kWh/year and 155,821.47 kWh/year converted into primary energy. Maintaining the building’s consumption of the other energy systems and adding the consumption of the electric car supply system, CEAMAZON’s overall total electricity consumption changes from 140,567.88 kWh/year to 237,956.30 kWh/year, corresponding to an increase of 69.28%.
This consumption value, multiplied by the conversion factor of electrical energy into primary energy (fCT) of 1.6, results in a primary energy consumption of 380,730.07 kWh/year for the building in its actual condition with EV. In the reference case, primary energy consumption was 255,906.65 kWh/year, but this figure rises to 411,728.12 kWh/year using electric cars. Based on these new values for primary energy consumption in the real and reference cases, taking EV charging into account, a new weighting of the reductions in primary energy consumption (RedCEPweighted) for each block is carried out, giving the value of 7.03%, using Equation (13).
With this new figure for the percentage reduction in primary energy consumption in scenario 1, the CEAMAZON building, which reached level C without considering the consumption of electric cars, now has a level D overall energy performance rating, compared to the limit values in Table 8. This shows the impact of the supply system on the building’s energy efficiency performance.
With the values of total electricity consumption in the scenario 1 condition at 237,956.30 kWh/year, the conversion factor of electrical energy into primary energy of 1.6, and the value of energy generated by local sources of renewable energy of the center at 116,065.70 kWh, it was possible to obtain the power generation potential (PG) of 48.78%, using Equation (11). As a result, the CEAMAZON building’s status shifts from being categorized as an NZEB during the year (representing less than 50% of consumption) to a building without self-sufficiency. This highlights the significant impact of integrating electric vehicles into buildings on the classification of energy-efficient buildings, particularly those designated as NZEB or positive energy buildings.
When the voltage parameters are analyzed, they decrease slightly with the recharge of electric vehicles (Figure 12); however, they continue to be within the allowed range of 0.95 p.u. to 1.05 p.u.
Next, scenario 2, which considers optimizing EV consumption, is analyzed to see if the restrictions make it possible to integrate EVs without affecting the energy rating, as was the case in scenario 1.

4.3.2. Energy Assessment of the CEAMAZON Building, Considering the Consumption of Electric Cars: Scenario 02, with Optimization

The demand management actions presented in Section 2, Section 2.4.3 and Section 2.4.4, were implemented for the second scenario, which shows new CEAMAZON building consumption, as shown in Figure 13.
Scenario 2 differs from scenario 1 due to the restrictions (reducing the charging power and disconnecting all vehicles with a charge percentage exceeding 80%) considered. The simulation in the OpenDSS software showed that this new scenario consumed 56,927.00 kWh/year of electricity with the optimized electric car supply system, which resulted in a final consumption for the building with EV charging of 197,494.88 kWh/year.
In scenario 2, the energy consumption of the reference building is 216,868.66 kWh/year. When the converter uses this reference value and the total consumption value of the CEMAZON building with managed EV supply (scenario 2), it obtains 315,991.82 kWh/year and 346,989.86 kWh/year, respectively. Applying Equation (13), there is a reduction in primary energy consumption (RedCEP) of 8.47%. This value is evaluated in Table 8 of the classification limit, resulting in the level D classification of energy efficiency of the CEAMAZON building. It is possible to conclude that, even with restrictions, EV supply continues to impact the energy performance of the building.
Using the value of primary energy consumption from scenario 2 and renewable energy generation in Equation (11), the optimized scenario’s new energy generation potential (PG) is obtained at 58.77%. This value results in the energy self-sufficiency assessment of the CEAMAZON building in NZEB, resuming the classification that the building received in its current state when it did not have EV integration. With the management of the EV charge, Figure 14 shows a slight improvement in the magnitude of the voltages, which continues within the range of 0.95 p.u. to 1.05 p.u. Therefore, this criterion is met for the three scenarios evaluated.

5. Discussion

This section discusses the two scenarios proposed in this study when compared to the base case. The results are summarized in Figure 15, where the left Y axis corresponds to the bars and the right Y axis corresponds to the lines.
The CEAMZON building currently has level C energy efficiency and the NZEB building classification, as solar energy generation supplies 82.57% of its consumption in the base case. The analysis of the simulation of two scenarios of the integration of electric vehicles in the building made it possible to measure the impact of the supply system without management (scenario 1) and with loading management (scenario 2), as can be seen in the comparative summary of the results in Table 9.
Regarding the base case, scenario 1 presented an annual increase of 69.28% in electricity consumption in the CEAMAZON building, affected mainly by the consumption of EVs (97,388.41 kWh/year more). The increase in consumption resulted in the reduction in the energy performance classification to level D, remembering that the scale goes from level A (more efficient) to E (less efficient). In addition, the CEAMAZON building lost its energy self-sufficiency classification because photovoltaic generation now began to supply less than 50% of the building’s energy consumption, as demonstrated by the green point in the graph in Figure 14, where the dashed red line represents the limit for NZEB classification.
To mitigate the impact caused by the use of EV, scenario 2, with loading management measures considering power and voltage restrictions, was proposed. The results showed an annual increase of just 40.50% in energy consumption regarding the base case, and a decrease from 97,388.41 kWh/year to 56,927.00 kWh/year in energy consumption of the EV supply system in the building, from case 1 to case 2, respectively.
The optimization technique demonstrated good potential for minimizing impacts of EVs on building energy performance. However, the INI-C energy assessment methodology showed that the reduction in consumption was not sufficient to return the performance level to C, keeping the building at level D.
Regarding the energy self-sufficiency classification, scenario 2 allowed CEAMAZON to return to the NZEB building category, as the new energy balance resulted in an increase of 20.48% in PG 2, overcoming the minimum limit of 50%, as seen in Figure 14. A slight improvement in voltage magnitudes, which remained within the range of 0.95 p.u. to 1.05 p.u., was observed with the EV loading management. Therefore, this criterion was met for the two scenarios evaluated.

6. Conclusions

In recent years, two lines of research have converged within the same discussion, driven by the proliferation of electric vehicles (EVs) and their integration into buildings. Buildings that have been classified based on their envelope, lighting, and air conditioning systems, allied to energy sources that allow them to be classified as NZEB/PEB buildings, will now incorporate electric vehicles due to the proliferation of this mode of transport. In this context, the energy implications of the additional consumption of these EVs become relevant to the literature.
This work presented a comprehensive evaluation of an existing building, from its energy classification, including its energy balance, to NZEB or PEB, of the impact of uncontrolled integration of electric vehicles (EV) into its infrastructure. The findings prove the hypothesis that unplanned integration of EVs into a building may compromise its overall energy efficiency and self-sufficiency ratings. Consequently, the unplanned introduction of electric vehicles can reduce the benefits of these new technologies in the energy transition.
To address this issue, this study evaluated the implementation of some demand-side management actions for electric vehicle (EV) charging, restricting charging power when necessary and fully releasing it when possible, showing that final energy consumption can be controlled with these strategies and simultaneously avoiding problems with voltage and overloads that can occur with the insertion of EVs into electrical networks. The results showed that these management actions did not prevent the energy consumption of EVs from affecting the energy efficiency rating. Still, they helped the rating improve the self-sufficiency rating of the case study building from scenario 1 to scenario 2.
It was noticed that this new proposed scenario, even with the current management assumptions, the EVs’ consumption still impacts the building’s performance, demonstrating the need to apply new restrictions. However, as the building already has a low energy performance, regardless of EV integration, it is understood that the proposal for more restrictions will only be valid after the building undergoes a retrofit to improve the inefficient systems.
Therefore, it is concluded that in addition to the electrical energy management actions of the electric vehicle supply system, it is necessary to propose actions to improve the efficiency of other building systems, such as the lighting and air conditioning system, aiming to reduce consumption and improve the energy performance of the building. In a future study, it would be interesting to present this combination of energy efficiency and management actions and analyze how much these actions can contribute not only to the performance of the building, but also to the sustainable integration of EVs in buildings.

Author Contributions

Conceptualization, A.C.D.B.d.S. and M.E.d.L.T.; methodology, A.C.D.B.d.S., F.M.d.V. and J.M.T.; software, A.C.D.B.d.S., F.M.d.V., G.A.M.M. and J.V.d.R.A.; validation, A.C.D.B.d.S., F.M.d.V. and J.M.T.; formal analysis, A.C.D.B.d.S., F.M.d.V. and J.M.T.; investigation, A.C.D.B.d.S. and F.M.d.V.; resources, A.A.d.N.; data curation, A.C.D.B.d.S., F.M.d.V., G.A.M.M., J.M.T. and J.V.d.R.A.; writing—original draft preparation, A.C.D.B.d.S., F.M.d.V. and J.M.T.; writing—review and editing, A.C.D.B.d.S., F.M.d.V., J.M.T. and C.C.M.d.M.C.; supervision, C.C.M.d.M.C. and M.E.d.L.T.; project administration, M.E.d.L.T. and A.A.d.N. All authors discussed the results and the conclusions of the manuscript. All authors have read and agreed to the published version of the manuscript.

Funding

This research was funded by the Pro-Rectory for Research and Postgraduate Studies PROPESP/UFPA with call 01-2024 PAPQ-PROPESP.

Data Availability Statement

The data are contained within this article.

Acknowledgments

The authors of the article thank the support of the Coordination for the Improvement of Higher Education Personnel-Brazil (CAPES); Pro-Rectory for Research and Postgraduate Studies (PROPESP); and Norte Energia S.A. for the accomplishment of this work within the scope of the ANEEL R&D project 07427-0319/2019 entitled “Intelligent System of Efficient Management of Multimodal Electric Mobility”, carried out through the ANEEL Strategic Call nº 22/2018.

Conflicts of Interest

The authors declare no conflicts of interest.

Abbreviations

The following abbreviations are used in this manuscript:
ABNTBrazilian Association of Technical Standards
AFIRParliament’s Alternative Fuels Infrastructure Regulation
CAAE,real or refDElectrical energy consumption of the water heating system of the real building
CEAMAZONCenter of Excellence in Energy Efficiency of Amazon
CEE,realTotal electrical energy consumption of the real building
CEP,realPrimary energy consumption of the building’s real condition
CEP,refThe primary energy consumption of the building’s reference condition
CEP,refDA,B or CPrimary energy consumption of the reference (level D) building condition for all the blocks
CEPnPrimary energy consumption of a block n
CEPrealA,B or CPrimary energy consumption of the real building for all the blocks
CEQEquipment consumption
CET,realTotal thermal energy consumption of the real building
CgTT,refDA,B or CTotal annual thermal of the reference (level D) building condition for all blocks
CgTTrealA,B or CTotal annual thermal load of the real building for all blocks
CIL,refDA,B or CLighting consumption of the reference (level D) building condition all blocks
CILrealA,B or CLighting consumption of the real building for all blocks
COPCoefficient of Performance
CR,refDA,B or CCooling consumption of the reference (level D) building condition for all blocks
CRCEPD-ACoefficient of reduction of primary energy consumption from classification D to A
CRCgTTD-ATotal annual thermal load reduction coefficient for classifications from D to A
CRrealA,B or CCooling consumption of the real building for all block
CUConsumer unit
CVEElectric vehicle consumption
PDEEquipment Power Density
DPILighting Potency Density
EDGEExcellence in Design for Greater Efficiencies
EEEnergy efficiency
EMSEnergy management systems
ENCEBrazilian National Energy Conservation Label
ESGEnvironmental, Social & Governance
EUEuropean Union
EVsElectric Vehicles
FFForm Factor
GEEEnergy generated by local renewable energy sources
HVACHeating, Ventilating and Air Conditioning
INI-CInmetro Normative Instruction for the Energy Efficiency Classification of Commercial, Service and Public Buildings
INI-RInmetro Normative Instruction for the Energy Efficiency Classification of Residential Buildings
INMETROBrazilian National Institute of Metrology, Standardization and Industrial Quality
NZEBNear zero energy building
p.uVoltage per unit
PAFTTotal Facade Opening Area Percentage
PBE-EdificaBrazilian BuildingLabeling Program
PEBPositive Energy Building
PEDsPositive Energy Districts
PGEnergy generation potential
PILALighting power limit values for classification A
PILDLighting power limit values for classification D
PITTotal installed lighting power
PNMEBrazilian National Electric Mobility Platform
PVPhotovoltaic
RedCEPA,B OR CReduction in primary energy consumption for blocks A, B or C
RedCEPnReduction in primary energy consumption of a block n
RedCEPweightedWeighted reduction in primary energy consumption
RedCgTTA,B or CReduction in total annual thermal loads for all the blocks
RedCILA,B or CReduction in lighting consumption for all blocks
RedCRA,B or CReduction in air conditioning consumption for the blocks
SCSelf-consumption
SCSBSelf-consumption-sufficiency balance
SINBrazil’s National Interconnected System
SISGEEElectricity Consumption Management System
SSSelf-sufficiency
UFPAFederal University of Para
V2GVehicle-to-grid
ZBBioclimatic Zone
ZEBZero-emission Buildings
fCEConversion factor of electrical energy into primary energy
fCTConversion factor of thermal energy into primary energy

Appendix A

Table A1. Variables obtained through site survey, used in simulations.
VariablesDescriptionValuesSource
Architectural dimensions 1Dimensions of walls, frames, ceiling, floors, and levels.
  • A block: Volume 2693.38 m3; Envelope area: 1382.98 m2; Form factor: 0.51; PAFT 1: 17.34%.
  • B block: Volume 2176.93 m3; Envelope area: 990.86 m2; Form factor: 0.46; PAFT: 13.53%.
  • C block: Volume 450.24 m3; Envelope area; 272.7 m2; Form factor: 0.61; PAFT 5.16%.
  • Reference blocks: PAFT: 50%.
Site survey/INI-C
Building materialsPhysical characterization of materials used on the internal and external surfaces of the blocks.
  • Roof with EPS slab, air layer ≥ 5 cm, and plasterboard ceiling.
  • Roof with simple 10 cm concrete slab and asphalt membrane.
  • Roof with thermoacoustic tiles, air layer ≥ 5 cm.
  • Walls of 15, 16, 20, 25, and 32 cm, with internal and external mortar, ceramic bricks with 6 holes in various conditions.
  • Ceramic floors on solid 10cm concrete slab and ribbed concrete slab with EPS
  • Wood and aluminum fenestrations
  • Simple, clear 6 mm glass.
  • Reference Roof: with cement asbestos tiles, air layer ≥ 5 cm, and 10 cm concrete slab.
  • Reference Wall: 14 cm wall with internal and external mortar layer of 2.5 cm and 9 cm of ceramic bricks with 6 holes.
Site Survey/INI-C
SchedulesTimings and days of the year for the occupancy of a space.
  • Operational days: 01/03–11/07 (first semester); 24/08–12/12 (second semester).
  • Occupation schedule: 8–18 h for Libraries, Laboratories, Restrooms, Circulation, and Storage.
  • 8–12 h–14–18 h: Auditorium; Professor’s rooms; Classrooms; Meeting rooms; Administration.
  • 12–14 h: Canteen.
Site survey
Quantity of occupantsNumber of people in artificially conditioned environments.287 people, distributed between 25 spaces, considering maximum occupancy.Site survey/INI-C
DPE 2The electrical power of the equipment is distributed per square meter of the built space.15 w/m2INI-C
DPI 3Electrical power of artificial lighting per illuminated area of the block.9.34 W/m2 (Real value);
Reference value: 15.5 W/m2
Site survey/INI-C
Occupation densityQuantity of square meters per person in the building.1.5 m2/personINI-C
HVAC equipmentModels of cooling units for consultation in catalogs. 12,000; 18,000; 24,000; 30,000; 36,000; 58,000. (BTU/H) divided between 35 different HVAC machines.Site survey
IDRSSeasonal cooling performance coefficient for air conditioning machines.Reference cooling performance coefficient value: 2.6 reference model value/Variable between 2.51 and 3.40 in real model values Site survey/INI-C
Temperature SetpointTarget temperature is used to achieve thermal comfort in the space.24 °CINI-C
TipologyPredominant activity in the block under analysis.A.2. (Educational building of college-level)INI-C
Bioclimatic zoneBrazilian climatic classification of different regions.ZB8INI-C
1 Total Facade Opening Area Percentage. 2 Equipment Power Density. 3 Lighting Power Density.

Appendix B

Figure A1. (a) Ground plan; (b) first floor plan; (c) second floor plan and (d) building divided into three blocks.
Energies 17 04060 g0a1

Appendix C

Table A2. Consumption by block, for real and reference cases, in kWh.
BlockCEE,realCEE,refDCR,realCR,refDCIL,realCIL,refDCEQ,realCEQ,refDCEP,realCEP,refD
A113,438.6912,6317.4691,322.08101,454.944163.446909.3517,953.1717,953.17181,501.904202,107.94
B21,015.1126,847.5313,563.5815,508.225894.969782.751556.571556.5733,624.1842,956.06
C6114.086776.665591.186126.02205.03332.77317.87317.879782.5310,842.65
Table A3. Reductions and labeling values of thermos-energetic simulation of CEAMAZON.
Primary EnergyEnvelopeHVACLighting
BlockRedCEP (%)CEP LabelRedCgTT (%)CgTT LabelRedCR (%)CR LabelRedCIL (%)CIL Label
A10.20C12.97A9.99D39.74B
B21.72B22.28A12.54D39.74B
C9.78C33.82A8.73D38.39B
Weighted11.90C15.18A10.25D14.62B

References

  1. Brasil Ministério de Minas e Energia—MME; Empresa de Pesquisa Energética—EPE. Relatório Final. Balanço Energético Nacional 2023: Ano Base 2022. Rio de Janeiro. Available online: https://www.epe.gov.br/pt/publicacoes-dados-abertos/publicacoes/balanco-energetico-nacional-2023 (accessed on 25 March 2024).
  2. Tamietti, R.P. Financial Feasibility Analysis in Energy Efficiency Projects; Engeweb: Belo Horizonte, Brazil, 2011. [Google Scholar]
  3. Procel, E. Etiquetagem de Eficiência Energética Em Edificações. Programa Nacional de Conservação de Energia Elétrica Em Edificações (PBE Edifica). Available online: http://www.procelinfo.com.br/main.asp?View=%7BD3C90184-7BCF-454B-A22E-31B8F2E1EE3C%7D&Team=&params=itemID=%7BC28C2387-3172-4D9F-B769-EB386F0961E5%7D;LumisAdmin=1;&UIPartUID=%7BD90F22DB-05D4-4644-A8F2-FAD4803C8898%7D (accessed on 25 February 2022).
  4. GBC Brasil. GBC Brasil Zero Energy; GBC Brasil: Barueri, Brazil, 2022. [Google Scholar]
  5. Certification—EDGE Buildings. Available online: https://edgebuildings.com/certify/certification/ (accessed on 7 May 2024).
  6. Inmetro, I.N.d.M. Qualidade e Tecnologia Instrução Normativa Inmetro para a Classificação de Eficiência Energética de Edificações Comerciais, de Serviços e Públicas (INI-C). PORTARIA No 309/2022. Available online: https://pbeedifica.com.br/inic (accessed on 9 April 2024).
  7. Nearly Zero-Energy Buildings. Available online: https://energy.ec.europa.eu/topics/energy-efficiency/energy-efficient-buildings/nearly-zero-energy-buildings_pt (accessed on 9 July 2022).
  8. Directive—2023/1791—EN—EUR-Lex. Available online: https://eur-lex.europa.eu/legal-content/EN/TXT/?uri=OJ%3AJOL_2023_231_R_0001&qid=1695186598766 (accessed on 21 April 2024).
  9. European Commission. Energy Performance of Buildings Directive. Available online: https://energy.ec.europa.eu/topics/energy-efficiency/energy-efficient-buildings/energy-performance-buildings-directive_en (accessed on 14 July 2022).
  10. Direção-Geral da Energia (Comissão Europeia); Milieu; Panteia. Trinomics Promotion of E-Mobility through Buildings Policy: Final Report; Serviço das Publicações da União Europeia: Luxembourg, 2022; ISBN 978-92-76-59351-5. [Google Scholar]
  11. Proposal for a Regulation of the European Parliament and of the Council on the Deployment of Alternative Fuels Infrastructure, and Repealing Directive 2014/94/EU of the European Parliament and of the Council. 2021. Available online: https://eur-lex.europa.eu/legal-content/EN/TXT/?uri=CELEX%3A52021PC0559 (accessed on 21 April 2024).
  12. Sales e Silva, L.E.; Vieira, J.P.A.; Medeiros, R.L.P.; Veroneze, G.d.M.; de Freitas, P.R.R.; Ayres Júnior, F.A.d.C.; Lopes, A.d.C. Probabilistic Operational Costs Assessment of Combined PV–PEV Connections in LV Distribution Networks. Electr. Power Syst. Res. 2023, 214, 108906. [Google Scholar] [CrossRef]
  13. Tabora, J.M.; Dos Santos Júnior, L.C.; de Lima Tostes, M.E.; de Matos, E.O.; Bezerra, U.H. Efficient Electric Motors Performance Under Voltage Variation Conditions. In Proceedings of the 2023 IEEE Kansas Power and Energy Conference (KPEC), Manhattan, KS, USA, 27–28 April 2023; pp. 1–6. [Google Scholar]
  14. Cavalcante, I.; Júnior, J.; Manzolli, J.A.; Almeida, L.; Pungo, M.; Guzman, C.P.; Morais, H. Electric Vehicles Charging Using Photovoltaic Energy Surplus: A Framework Based on Blockchain. Energies 2023, 16, 2694. [Google Scholar] [CrossRef]
  15. Tabora, J.M.; Paixão Júnior, U.C.; Rodrigues, C.E.M.; Bezerra, U.H.; Tostes, M.E.d.L.; Albuquerque, B.S.d.; Matos, E.O.d.; Nascimento, A.A.d. Hybrid System Assessment in On-Grid and Off-Grid Conditions: A Technical and Economical Approach. Energies 2021, 14, 5284. [Google Scholar] [CrossRef]
  16. Moreira, G.A.M.; Tabora, J.M.; Soares, T.M.; de Lima Tostes, M.E.; Bezerra, U.H.; de M. Carvalho, C.C.M.; de Matos, E.O. Demand Side Management Strategies for the Introduction of Electric Vehicles: A Case Study. In Proceedings of the 2023 IEEE Colombian Caribbean Conference (C3), Barranquilla, Colombia, 22–25 November 2023; pp. 1–6. [Google Scholar]
  17. Global EV Outlook 2023—Analysis. Available online: https://www.iea.org/reports/global-ev-outlook-2023 (accessed on 15 April 2024).
  18. Chaves, A.F.; Barassa, E.; de Paula, R.A.S.R.; da Cruz, R.F.; Wolffenbüttel, R. 3o Anuário Brasileiro da Mobilidade Elétrica: Rumo à Expansão do Mercado, Políticas e Tecnologias No Brasil. Available online: https://pnme.org.br/biblioteca/3o-anuario-brasileiro-da-mobilidade-eletrica/ (accessed on 9 April 2024).
  19. Frota de Carros Elétricos No Brasil|NeoCharge. Available online: https://www.neocharge.com.br/carros-eletricos-brasil (accessed on 17 March 2024).
  20. PNME. Mapeamento E Diagnóstico Das Iniciativas Sobre Mobilidade Elétrica No Brasil; PNME: Belo Horizonte, Brazil, 2022. [Google Scholar]
  21. PNME. 1o Anuário Brasileiro da Mobilidade Elétrica; PNME: Belo Horizonte, Brazil, 2021. [Google Scholar]
  22. Dos Santos Junior, L.C.; Tabora, J.M.; Reis, J.; Andrade, V.; Carvalho, C.; Manito, A.; Tostes, M.; Matos, E.; Bezerra, U. Demand-Side Management Optimization Using Genetic Algorithms: A Case Study. Energies 2024, 17, 1463. [Google Scholar] [CrossRef]
  23. Sørensen, Å.L.; Morsund, B.B.; Andresen, I.; Sartori, I.; Lindberg, K.B. Energy Profiles and Electricity Flexibility Potential in Apartment Buildings with Electric Vehicles—A Norwegian Case Study. Energy Build. 2024, 305, 113878. [Google Scholar] [CrossRef]
  24. Plataforma Nacional de Mobilidade Elétrica—PNME. Eletropostos: Instalação de Equipamentos de Recarga Para Grandes Demandas. PNME. Available online: https://pnme.org.br/biblioteca/eletropostos-instalacao-de-equipamentos-de-recarga-para-grandes-demandas/ (accessed on 26 May 2024).
  25. Yoon, G.; Kim, S.; Shin, H.; Cho, K.; Jang, H.; Lee, T.; Choi, M.; Kang, B.; Park, S.; Lee, S.; et al. Carbon-Neutral ESG Method Based on PV Energy Generation Prediction Model in Buildings for EV Charging Platform. Buildings 2023, 13, 2098. [Google Scholar] [CrossRef]
  26. Zhu, Y.; Ding, Y.; Wei, S.; Zafar, H.M.Y.; Yan, R. Electric Vehicle Charging Facility Configuration Method for Office Buildings. Buildings 2023, 13, 906. [Google Scholar] [CrossRef]
  27. Park, S.; Park, S.; Yun, S.-P.; Lee, K.; Kang, B.; Choi, M.; Jang, H.; Park, S. Design and Implementation of a Futuristic EV Energy Trading System (FEETS) Connected with Buildings, PV, and ESS for a Carbon-Neutral Society. Buildings 2023, 13, 829. [Google Scholar] [CrossRef]
  28. Castillo-Calzadilla, T.; Alonso-Vicario, A.; Borges, C.E.; Martin, C. E-Mobility in Positive Energy Districts. Buildings 2022, 12, 264. [Google Scholar] [CrossRef]
  29. Mesarić, P.; Krajcar, S. Home Demand Side Management Integrated with Electric Vehicles and Renewable Energy Sources. Energy Build. 2015, 108, 1–9. [Google Scholar] [CrossRef]
  30. Abdelsamad, S.F.; Morsi, W.G.; Sidhu, T.S. Probabilistic Impact of Transportation Electrification on the Loss-of-Life of Distribution Transformers in the Presence of Rooftop Solar Photovoltaic. IEEE Trans. Sustain. Energy 2015, 6, 1565–1573. [Google Scholar] [CrossRef]
  31. Affonso, C.M.; Kezunovic, M. Probabilistic Assessment of Electric Vehicle Charging Demand Impact on Residential Distribution Transformer Aging. In Proceedings of the 2018 IEEE International Conference on Probabilistic Methods Applied to Power Systems (PMAPS), Boise, ID, USA, 24–28 June 2018; pp. 1–6. [Google Scholar]
  32. Palomino, A.; Parvania, M. Data-Driven Risk Analysis of Joint Electric Vehicle and Solar Operation in Distribution Networks. IEEE Open Access J. Power Energy 2020, 7, 141–150. [Google Scholar] [CrossRef]
  33. Jang, H.S.; Bae, K.Y.; Jung, B.C.; Sung, D.K. Apartment-Level Electric Vehicle Charging Coordination: Peak Load Reduction and Charging Payment Minimization. Energy Build. 2020, 223, 110155. [Google Scholar] [CrossRef]
  34. Rohloff, A.; Roberts, J.; Goldstein, N. Impacts of Incorporating Electric Vehicle Charging into Zero Net Energy (ZNE) Buildings and Communities. In Proceedings of the 2010 ACEEE Summer Study on Energy Efficiency in Buildings, Pacific Grove, CA, USA, 15–20 August 2010; pp. 312–324. [Google Scholar]
  35. Sehar, F.; Pipattanasomporn, M.; Rahman, S. Demand Management to Mitigate Impacts of Plug-in Electric Vehicle Fast Charge in Buildings with Renewables. Energy 2017, 120, 642–651. [Google Scholar] [CrossRef]
  36. Fachrizal, R.; Shepero, M.; Åberg, M.; Munkhammar, J. Optimal PV-EV Sizing at Solar Powered Workplace Charging Stations with Smart Charging Schemes Considering Self-Consumption and Self-Sufficiency Balance. Appl. Energy 2022, 307, 118139. [Google Scholar] [CrossRef]
  37. Syafruddin, H.; Rambe, A.H.; Prabowo, A.; Sutanto, E.; Puspitaningayu, P.; Fahmi, F. Analysis of Harmonics and Quality of Distribution Networks and Transformers on Public Electric Vehicle Charging Station. In Proceedings of the 2023 7th International Conference on Electrical, Telecommunication and Computer Engineering (ELTICOM), Medan, Indonesia, 13–14 December 2023; pp. 89–94. [Google Scholar]
  38. Visakh, A.; Thomas, B.; Selvan, M.P. Controlled Charging of Electric Vehicles to Reduce the Aging of Distribution Transformers. In Proceedings of the 2022 22nd National Power Systems Conference (NPSC), New Delhi, India, 17–19 December 2022; pp. 24–29. [Google Scholar]
  39. Mogos, A.S.; Liang, X.; Chung, C.Y. Impact of Plug-in Electric Vehicle Charging and Roof-Top PVs on Distribution Transformer Health: A Case Study in Saskatoon, Canada. In Proceedings of the 2023 IEEE Canadian Conference on Electrical and Computer Engineering (CCECE), Regina, SK, Canada, 24–27 September 2023; pp. 49–54. [Google Scholar]
  40. Shams Ashkezari, L.; Succetti, M.; Jabœuf, R.; Tosco, P.; Brenna, M. Are Commercial EV Chargers Ready to Aid with Household Power Consumption? Electronics 2023, 12, 2065. [Google Scholar] [CrossRef]
  41. Liao, W.; Xiao, F.; Li, Y.; Zhang, H.; Peng, J. A Comparative Study of Demand-Side Energy Management Strategies for Building Integrated Photovoltaics-Battery and Electric Vehicles (EVs) in Diversified Building Communities. Appl. Energy 2024, 361, 122881. [Google Scholar] [CrossRef]
  42. Carrillo, A.; Pimentel, A.; Ramirez, E.; Le, H.T. Mitigating Impacts of Plug-In Electric Vehicles on Local Distribution Feeders Using a Charging Management System. In Proceedings of the 2017 IEEE Transportation Electrification Conference and Expo (ITEC), Chicago, IL, USA, 22–24 June 2017; pp. 174–179. [Google Scholar]
  43. Toledo-Orozco, M.; Bravo-Padilla, E.; Álvarez-Bel, C.; Morales-Jadan, D.; Gonzalez-Morales, L. Methodological Evaluation to Integrate Charging Stations for Electric Vehicles in a Tram System Using OpenDSS—A Case Study in Ecuador. Sustainability 2023, 15, 6382. [Google Scholar] [CrossRef]
  44. Aljohani, T.; Mohammed, O. Modeling the Impact of the Vehicle-to-Grid Services on the Hourly Operation of the Power Distribution Grid. Available online: https://www.mdpi.com/2411-9660/2/4/55 (accessed on 31 May 2024).
  45. Gilleran, M.; Bonnema, E.; Woods, J.; Mishra, P.; Doebber, I.; Hunter, C.; Mitchell, M.; Mann, M. Impact of Electric Vehicle Charging on the Power Demand of Retail Buildings. Adv. Appl. Energy 2021, 4, 100062. [Google Scholar] [CrossRef]
  46. Brazilian Association of Technical Standards ABNT NBR 15220-3; Thermal Performance in Buildings—Part 3: Brazilian Bioclimatic Zones and Building Guidelines for Low-Cost Houses. Brazilian Association of Technical Standards: Rio de Janeiro, Brazil, 2005.
  47. Brazilian Association of Technical Standards ABNT TR 15220-3-1; Thermal Performance in Buildings—Part 3-1: Brazilian Bioclimatic Zones and Building Guidelines for Low-Cost Houses. Brazilian Association of Technical Standards: Rio de Janeiro, Brazil, 2024.
  48. INMETRO. Qualidade e Tecnologia Instrução Normativa Inmetro para a Classificação de Eficiência Energética de Edificações Residenciais (INI-R). Portaria no 309/2022. 2022. Available online: https://pbeedifica.com.br/inir (accessed on 31 May 2024).
  49. Kostopoulos, E.D.; Spyropoulos, G.C.; Kaldellis, J.K. Real-World Study for the Optimal Charging of Electric Vehicles. Energy Rep. 2020, 6, 418–426. [Google Scholar] [CrossRef]
  50. Isimbi, D.; Park, J. The Analysis of the EDGE Certification System on Residential Complexes to Improve Sustainability and Affordability. Buildings 2022, 12, 1729. [Google Scholar] [CrossRef]
  51. INMET. Climate Archives. Available online: http://pbeedifica.com.br/arquivos-climaticos (accessed on 31 May 2024).
  52. Eli, L.G.; Krelling, A.F.; Mendes, L.S.; Silva, R.M.; Mazzaferro, L.; Melo, A.P.; Lamberts, R. Manual de Simulação Computacional de Edifícios Com o Uso Do Objeto Ground Domain No Programa EnergyPlus—Versão 9.0.1. 2019. Available online: https://labeee.ufsc.br/pt-br/node/805 (accessed on 21 April 2024).
  53. U.S. Department of Energy. Table of Contents: Input Output Reference—EnergyPlus 24.1. Available online: https://bigladdersoftware.com/epx/docs/24-1/input-output-reference/ (accessed on 31 May 2024).
  54. Tabora, J.M.; Gomes França, R.E.; dos Santos Júnior, L.C.; Farias, T.; Ferreira, I.; C, C.; Carvalho, M.d.M.; de Matos, E.O.; de Lima Tostes, M.E. An Assessment of Power Factor Correction Strategies from Billing and Measurement Systems: A Case Study in Medium Voltage Consumers. In Proceedings of the 2023 15th IEEE International Conference on Industry Applications (INDUSCON), São Bernardo do Campo, Brazil, 22–24 November 2023; pp. 1451–1455. [Google Scholar]
Figure 1. Annual expansion of the electric car fleet in Brazil by type. Source: [18].
Energies 17 04060 g001
Figure 2. Annual expansion of the electric car fleet in Pará by type. Source: [18].
Energies 17 04060 g002
Figure 3. Ranking of electric cars by city in the state of Pará in 2023. Source: Adapted from [18].
Energies 17 04060 g003
Figure 4. Steps necessary to make an energy efficiency building simulation.
Energies 17 04060 g004
Figure 5. Comparative image of the real model (a) with the reference model (b).
Energies 17 04060 g005
Figure 6. Methodology flowchart for the predictability of integration of EV in the building.
Energies 17 04060 g006
Figure 7. Methodology flowchart for the OpenDSS and Monte Carlo simulations.
Energies 17 04060 g007
Figure 8. Perspective shot of the CEAMAZON building.
Energies 17 04060 g008
Figure 9. CEAMAZON’s annual electricity consumption and generation in 2022. Source: SISGEE/UFPA, 2024.
Energies 17 04060 g009
Figure 10. Voltage magnitude plot for the base case of the CEAMAZON building.
Energies 17 04060 g010
Figure 11. Photovoltaic generation and energy consumption of the CEAMAZON building, considering electric car charging, without optimization.
Energies 17 04060 g011
Figure 12. Voltage magnitude plot for the first scenario.
Energies 17 04060 g012
Figure 13. Photovoltaic generation and energy consumption of the CEAMAZON building, considering electric car charging, with optimization.
Energies 17 04060 g013
Figure 14. Voltage magnitude plot for the second scenario.
Energies 17 04060 g014
Figure 15. The CEAMAZON building energy annual PV generation and consumption for each scenario according to the 2022 database.
Energies 17 04060 g015
Table 1. Educational buildings: coefficient for reducing primary energy consumption from classification D to A (CRCEPD-A), based on the form factor and corresponding climate classification.
Climatic ClassificationCRCEPD-A
FF ≤ 0.200.20 < FF ≤ 0.300.30 < FF ≤ 0.400.40 < FF ≤ 0.50
ZB 80.280.300.280.27
Table 2. Educational buildings: coefficient for reducing the annual thermal load from classification D to A (CRCgTTD-A), based on the form factor and corresponding climate classification.
Climatic ClassificationCRCgTTD-A
FF ≤ 0.200.20 < FF ≤ 0.300.30 < FF ≤ 0.400.40 < FF ≤ 0.50
ZB 80.080.090.100.10
Table 3. Limits of the energy efficiency rating range according to the climate classification of the building in which the air conditioning system is being assessed.
Climatic ClassificationRedCR (%)
ABCDE
ZB 7 and 8RedCR > 4343 ≥ RedCR > 2929 ≥ RedCR > 1414 ≥ RedCR ≥ 0RedCR < 0
Table 4. Limits of the ranges of the energy efficiency ratings of the building envelope, lighting system, and general.
Energy Efficiency ClassificationRedCgTT, RedCIL e RedCEP or RedCEPweighted (%)
ABCDE
ZB 7 and 8Red > 3i%3i% ≥ Red > 2i%2i% ≥ Red > i%i% ≥ Red ≥ 0%Red < 0%
Table 5. Limits of the energy efficiency ratings ranges of the existing CEAMAZON envelope.
RedCgTT (%)
ABCDE
RedCgTT > 10%10% ≥ RedCgTT > 6.67%6.67% ≥ RedCgTT > 3.33%3.33% ≥ RedCgTT ≥ 0%RedCgTT < 0%
Table 6. Limits of the energy efficiency ratings ranges of the existing CEAMAZON air conditioning system, adapted from INI-C [6].
Climate ClassificationRedCR (%)
Bioclimatic ZonesABCDE
ZB 7 and 8RedCR > 43%43% ≥ RedCR > 29%29% ≥ RedCR > 14%14% ≥ RedCR ≥ 0%RedCR < 0%
Table 7. Limits of the energy efficiency ratings of the existing lighting system in the CEAMAZON building.
RedCIL (%)
ABCDE
RedCIL > 43.87%43.87% ≥ RedCIL > 29.25%29.25% ≥ RedCIL >14.62%14.62% ≥ RedCIL ≥ 0%RedCIL < 0%
Table 8. Limits of the ranges of the general energy efficiency rating of the CEAMAZON building.
RedCEP (%)
ABCDE
RedCEP > 27%27% ≥ RedCEP > 18%18% ≥ RedCEP > 9%9% ≥ RedCEP ≥ 0%RedCEP < 0%
Table 9. A comparative synthesis of consumption results and EE and NZEB/EEP levels of the scenarios analyzed for the CEAMAZON building.
ScenariosBase ScenarioScenario 01Scenario 02
Energy generation and consumptionPV Generation (kWh/year)Total consumption of the building (kWh/year)EV consumption (kWh/year)Total consumption of the building with EV (kWh/year)EV consumption (kWh/year)Total consumption of the building with EV (kWh/year)
Electrical energy116,065.70140,567.8897,388.42237,956.3056,927.00197,494.88
Primary energy18,570,512.22224,908.61155,821.46380,730.0791,083.21315,991.82
EE Rating LevelLevel CLevel DLevel D
NZEB/EEP Rating LevelPG of- 82.57% = NZEBPG of 48.78% = no classificationPG of 58.77% = NZEB
Disclaimer/Publisher’s Note: The statements, opinions and data contained in all publications are solely those of the individual author(s) and contributor(s) and not of MDPI and/or the editor(s). MDPI and/or the editor(s) disclaim responsibility for any injury to people or property resulting from any ideas, methods, instructions or products referred to in the content.

