Article

Evaluating Renewable Energy Sites in the Green Hydrogen Supply Chain with Integrated Multi-Criteria Decision Analysis

by
Kasin Ransikarbum
1,*,
Hartmut Zadek
2 and
Jettarat Janmontree
2
1
Department of Industrial Engineering, Ubonratchathani University, Ubonratchathani 34190, Thailand
2
Institute of Logistics and Material Handling Systems, Otto von Guericke University Magdeburg, 39106 Magdeburg, Germany
*
Author to whom correspondence should be addressed.
Energies 2024, 17(16), 4073; https://doi.org/10.3390/en17164073
Submission received: 17 July 2024 / Revised: 6 August 2024 / Accepted: 14 August 2024 / Published: 16 August 2024
(This article belongs to the Section B: Energy and Environment)

Abstract

:
Green hydrogen can be generated through electrolysis using electricity from renewable sources, such as wind and solar, to split water into hydrogen. This study evaluates the green hydrogen supply chain (GHSC) upstream process using the two-phase integrated multi-criteria decision analysis (MCDA) framework. In the first phase, the data envelopment analysis (DEA) technique is applied to measure the relative efficiency of provincial alternatives with multiple criteria. The input criteria include provincial area, population density, gross domestic product value, and land cost data. In contrast, the sustainability-based governmental criteria concerning people, prosperity, planet, peace, and partnership indices are used as output criteria. Then, the technique for order of preference by similarity to ideal Solution (TOPSIS) is further applied to evaluate regional districts for Ubonratchathani province, one of the twelve relatively efficient provinces, to obtain the ranking list of potential renewable energy sites in the GHSC. Criteria related to geographic and climate data relevant to the efficiency of solar and wind are, thus, collected and analyzed. Our results show that the top three district areas are Kut Khaopun District, Pho Sai District, and Na Tan District, respectively. Finally, the obtained results are verified to evaluate the robustness of the assessment. Our results offer a strategic and practical analysis for policymakers involved in the energy site appraisal process.

1. Introduction

The global shift towards sustainable energy solutions has intensified interest in green hydrogen, a clean fuel produced using renewable energy sources. Green hydrogen presents a promising alternative to fossil fuels, offering a pathway to significantly reduce carbon emissions and combat climate change. As the world aims for a decarbonized future, the establishment of an efficient and reliable green hydrogen supply chain becomes imperative. According to [1], the global green hydrogen production capacity is projected to reach around 1.5 million tons per year by 2023, with significant investments and scaling up in various regions around the globe. Additionally, Hydrogen Insights [2] also suggests that the cost of generating renewable hydrogen is projected to fall to between 2.5 and 4.0 USD/kg by 2030, thanks to progress in electrolyzer technology, economies of scale in manufacturing, design enhancements, and decreases in the cost of renewable energy. Currently, the application of hydrogen energy can be found in diverse sectors, including transportation, synfuel production, power, industry, ammonia production, building, and refining. The transportation sector, in particular, is projected to become the largest sector from 2050–2070 (Figure 1). The expected growth in hydrogen demand suggests that proper evaluation of the complex issues related to the infrastructure for the green hydrogen supply chain (GHSC) is needed.
The GHSC, in particular, encompasses the entire process from production, transmission, storage, and distribution to various end-use purposes. Unlike traditional hydrogen production methods that rely on natural gas, green hydrogen can be generated through the electrolysis technique, which splits water into hydrogen and oxygen using electricity derived from renewable sources, such as wind and solar (e.g., [4,5]). The green hydrogen production method also ensures that the produced hydrogen is entirely free from carbon emissions, which is pivotal in transitioning towards a low-carbon economy and aligning with global sustainability goals. Key competitive strategies in the GHSC not only can enhance energy security by diversifying the energy mix but also promote technological innovation and economic growth in the renewable energy sector [4]. The intersection of renewable energy and the GHSC is also fundamental to achieving sustainability goals. That is, sustainability can be further reinforced by the use of renewable energy to produce green hydrogen, which can significantly contribute to reducing greenhouse gas emissions, enhancing energy security, fostering economic growth, and decarbonizing various applications [6]. However, several studies have pointed out that the development of GHSC still encounters several challenges, such as the high costs of renewable energy, the efficiency of electrolysis technology, the infrastructure for hydrogen storage and transportation, and the integration of green hydrogen into existing energy systems [7,8].
One crucial aspect of optimizing the GHSC is the strategic selection of renewable energy locations. The feasibility of renewable energy sites, such as solar and wind farms in the GHSC, is heavily influenced by diverse criteria relevant to the availability of renewable energy sources and geographic information. Thus, an integrated multi-criteria decision analysis (MCDA) framework can provide a robust framework for evaluating complex decisions by considering various criteria in the realm of the sustainability paradigm [9,10,11,12]. In this research, we assess the upstream process of the GHSC using the case study of the northeastern part of Thailand. The two-phase integrated MCDA framework is proposed, such that the data envelopment analysis (DEA) technique is applied to measure the relative efficiency of provincial alternatives with multiple input and output criteria during the first phase, and the technique for order of preference by similarity to ideal solution (TOPSIS) is further modeled to evaluate regional districts for the relatively efficient province(s) found from the first-phase study to suggest potential renewable energy sites in the GHSC. The obtained results are further verified using selective MCDA tools to increase the robustness of the MCDA analysis.
This paper is organized as follows. An overview of the relevant literature for GHSC is presented in Section 2. Then, the integrative MCDA framework is discussed in Section 3. Next, the case study evaluation and managerial insights are presented in Section 4 and Section 5. Finally, conclusions and related future research directions are provided in Section 6.

2. Literature Review

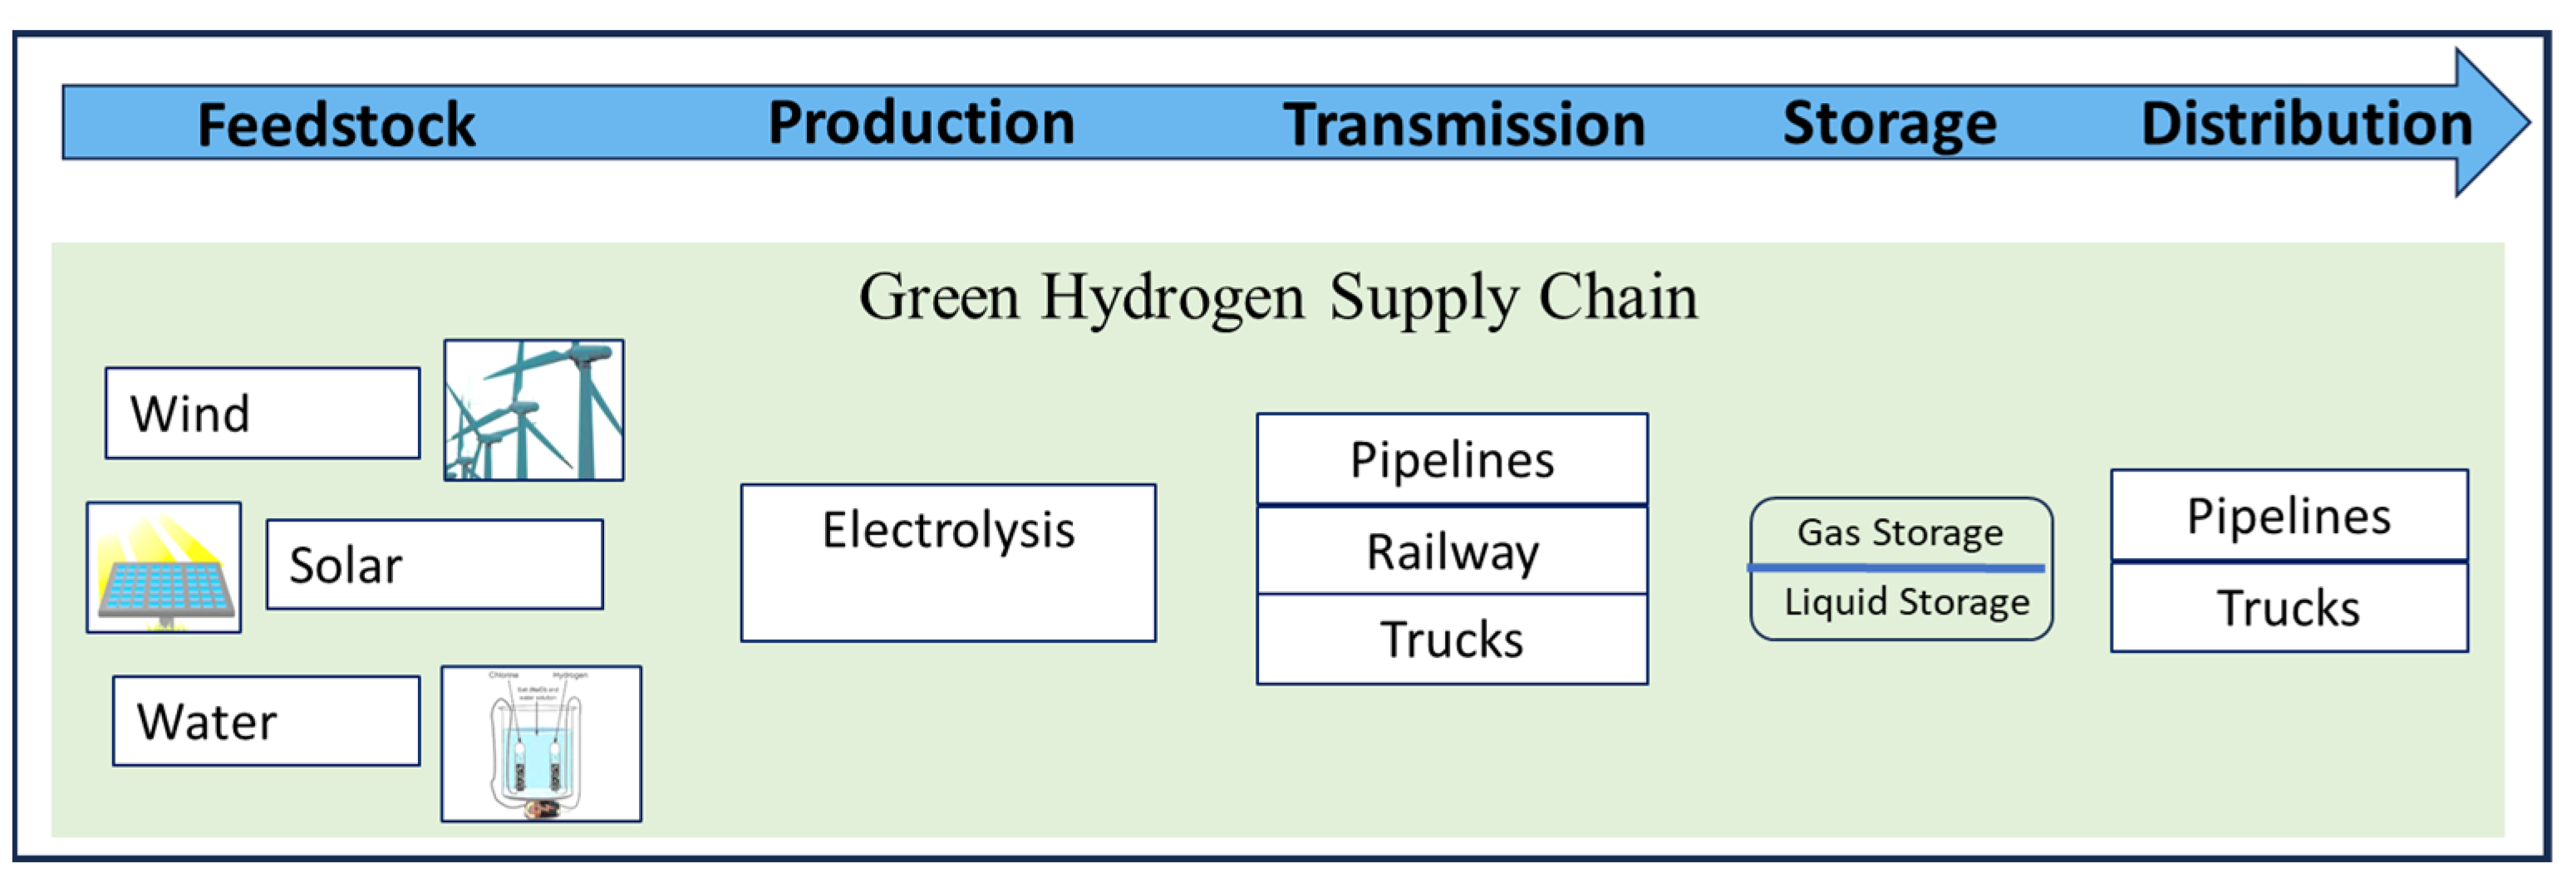
2.1. Green Hydrogen Supply Chain

The hydrogen economy refers to a system where clean hydrogen is used extensively as an energy carrier nationwide, providing energy and services while also promoting decarbonization initiatives [13,14]. Green hydrogen production also involves the electrolysis process, which uses water and electricity from renewable sources, such as solar and wind power. This electrolysis method shows great potential for widespread adoption in creating a low-carbon energy system, though it remains costly [15]. Next, the hydrogen produced can be distributed through a multimodal platform based on its physical state and energy demand profile. For instance, liquefied hydrogen can be transported in tankers via roads and railways, while gaseous hydrogen can be distributed through pipelines [16]. Furthermore, storage decisions are a critical and complex aspect of the GHSC, given the different physical forms of hydrogen (Figure 2). Several studies in the literature suggest challenges in operational, tactical, and strategic-level decisions for GHSC [17,18,19]. Additionally, recent studies also suggest diverse scenarios to systematically integrate renewable energy from solar and wind into interconnected sectors, such as buildings and vehicle fleets, to plan for the future energy system (e.g., [20,21,22,23]). These studies similarly emphasize the need to integrate different sectors and application areas in the design and planning for the future energy system. For instance, Ikuerowo et al. [24] suggest that renewable energy integration, especially from wind and solar sources, plays a critical role in ensuring the sustainability and reliability of green hydrogen production. Kumar and Lim [25] highlight the importance of technological advancements in green hydrogen production using electrolysis, emphasizing the need for efficiency improvements to reduce production costs and increase scalability. Zhou et al. [23] assess the techno-economic feasibility based on the proportion of battery and H2 capacities, which can provide guidelines for the design and operation of multi-energy and energy-sharing systems.
The storage and distribution of green hydrogen also present notable challenges and opportunities for innovation. Researchers have explored the use of hydrogen carriers, such as liquid organic hydrogen carriers (LOHCs), which can potentially simplify transportation and storage logistics [26,27,28]. Recent studies also suggest that uncertainty should be taken into account for the design of the integrated energy storage system (e.g., [29,30,31]). These studies similarly emphasize the application of robust modeling for assessing renewable energy profiles. Pawelczyk et al. [32] and Bosu and Rajamohan [33] suggest that compressed hydrogen gas and liquid hydrogen are currently the most common methods, each with distinct advantages and limitations in terms of cost, energy density, and infrastructure requirements. Kim et al. [34] suggest that pipeline infrastructure is found to be a preferred method for large-scale distribution but requires significant investment and poses technical challenges related to material compatibility and safety. Alternatively, Lundblad et al. [35] emphasize that decentralized production and distribution systems in GHSC can help to generate hydrogen close to the point of use and are being considered to reduce transportation costs and emissions. However, the decentralized approach faces challenges from advancements in small-scale electrolyzer technologies and local renewable energy integration. Research studies focusing on location analysis within the realm of GHSC are also limited in the literature. Mostafaeipour et al. [36] explore the upstream process of solar-powered hydrogen production through location analysis in Iran. Lin et al. [37] conduct a review centered on a downstream process of hydrogen station location models and highlight significant barriers to the implementation of policies driving fuel cell electric vehicle (FCEV) demand. Almutairi [38] examines the economic aspects of the sustainability paradigm for wind–hydrogen projects in the realm of GHSC, where six key criteria for electricity production, hydrogen production, CO2 emissions, capacity, levelized cost of energy, and levelized cost of hydrogen are assessed.
Several studies have discussed the strategic advantages of green hydrogen to promote sustainable development (e.g., [6,39]). That is, green hydrogen can serve as an essential strategy to endorse the widespread adoption of renewable energy. The incorporation of renewable energy projects related to green hydrogen with the grid infrastructure can also provide supplementary clean energy to area-based communities [40]. Green hydrogen production facilities also play a pivotal role as grid buffers, where the flexibility of the electrolyzers can facilitate the balancing of electricity systems during peak demand for electricity and surplus electricity [41]. In addition, utilizing renewable sources to enhance hydrogen production capacity can also boost the growth of a skilled workforce and access to front-line technologies [42]. Several studies have also recently discussed challenges related to the techno-economic practicability of renewable energy-based green hydrogen production [43,44]. The study provided by [45] suggests that renewably sourced hydrogen is around 2–3 times more expensive than gray hydrogen produced from other methods. The study from [22] suggests that the production cost is found to vary depending on the types of production methods and feedstocks.

2.2. Electrolysis in Green Hydrogen

Green hydrogen is a worthwhile solution for reducing fossil fuels and greenhouse gas (GHG) emissions. Given that green hydrogen is obtained by electrolysis of water and that this process can be powered entirely by renewable energy, such as solar and wind, the green hydrogen process is known to generate no polluting emissions into the atmosphere and is currently the cleanest and most sustainable hydrogen production method [46,47]. Thus, evaluating the potential of solar and wind farms is critical.
Current studies suggest that there are four common technologies for electrolyzers in use today, which are alkaline electrolyzers (A-EL), proton exchange membrane electrolyzers (PEM-EL), high-temperature electrolyzers (HT-EL), and anion exchange membrane electrolyzers (AEM-EL) [48,49,50]. In particular, the A-EL technology has been the most widely used and developed due to its long service life and the catalyst materials used. However, the desired hydrogen purity cannot be achieved without more complex post-processing, such as gas preparation or drying. The PEM-EL technology is also used for the separation of the product gases and proton conduction, in which a solid plastic electrolyte is used as a membrane and is characterized by dynamic operation. The expensive precious metal catalysts made of platinum and iridium are typically considered a disadvantage of this technology. Next, the HT-EL technology, known as the solid oxide electrolyzer cell (SOEC), is currently the method with the highest efficiency for splitting water. By using very hot steam, the required electrical energy is supplemented with additional thermal energy. However, the high temperatures also require long warm-up times, which limits the range of applications. Finally, the AEM-EL technology is the most recent technology and combines the advantages of PEM-EL and A-EL. Compared to PEM, the AEM-EL does not require expensive platinum metals and is characterized by cheap catalysts, which is advantageous for system costs. However, the service life and current density of AEM-EL still need to be further optimized and researched compared to other types of technology.
It is expected that declining costs for renewable energy-based electricity and the growing interest in green hydrogen can be anticipated. Thus, synchronizing electrolyzers at strategic locations in the GHSC could provide an efficient option for the end-users. Existing research gaps for the current studies can be summarized next. That is, while the MCDA tool has been utilized in numerous applications within the energy sector, research specifically targeting sustainability and renewable energy remains relatively scarce. In addition, current research in energy applications often employs a single MCDA tool, in which an integrated approach that leverages the strengths of different MCDA tools is called for. Next, current studies on renewable energy and green hydrogen assessments also generally feature limited case studies, highlighting a need for research focused on specific areas to inform infrastructure policy. Finally, existing studies lack a perspective to assess diverse types of renewable energy sources and the hierarchical structure of provincial district areas. Thus, our proposed study’s contributions are highlighted as follows.
  • Our study evaluates the upstream process of the GHSC to emphasize strategic and potential renewable energy sites for the electrolysis process, which can be further connected to the model and network analysis of the green hydrogen supply chain.
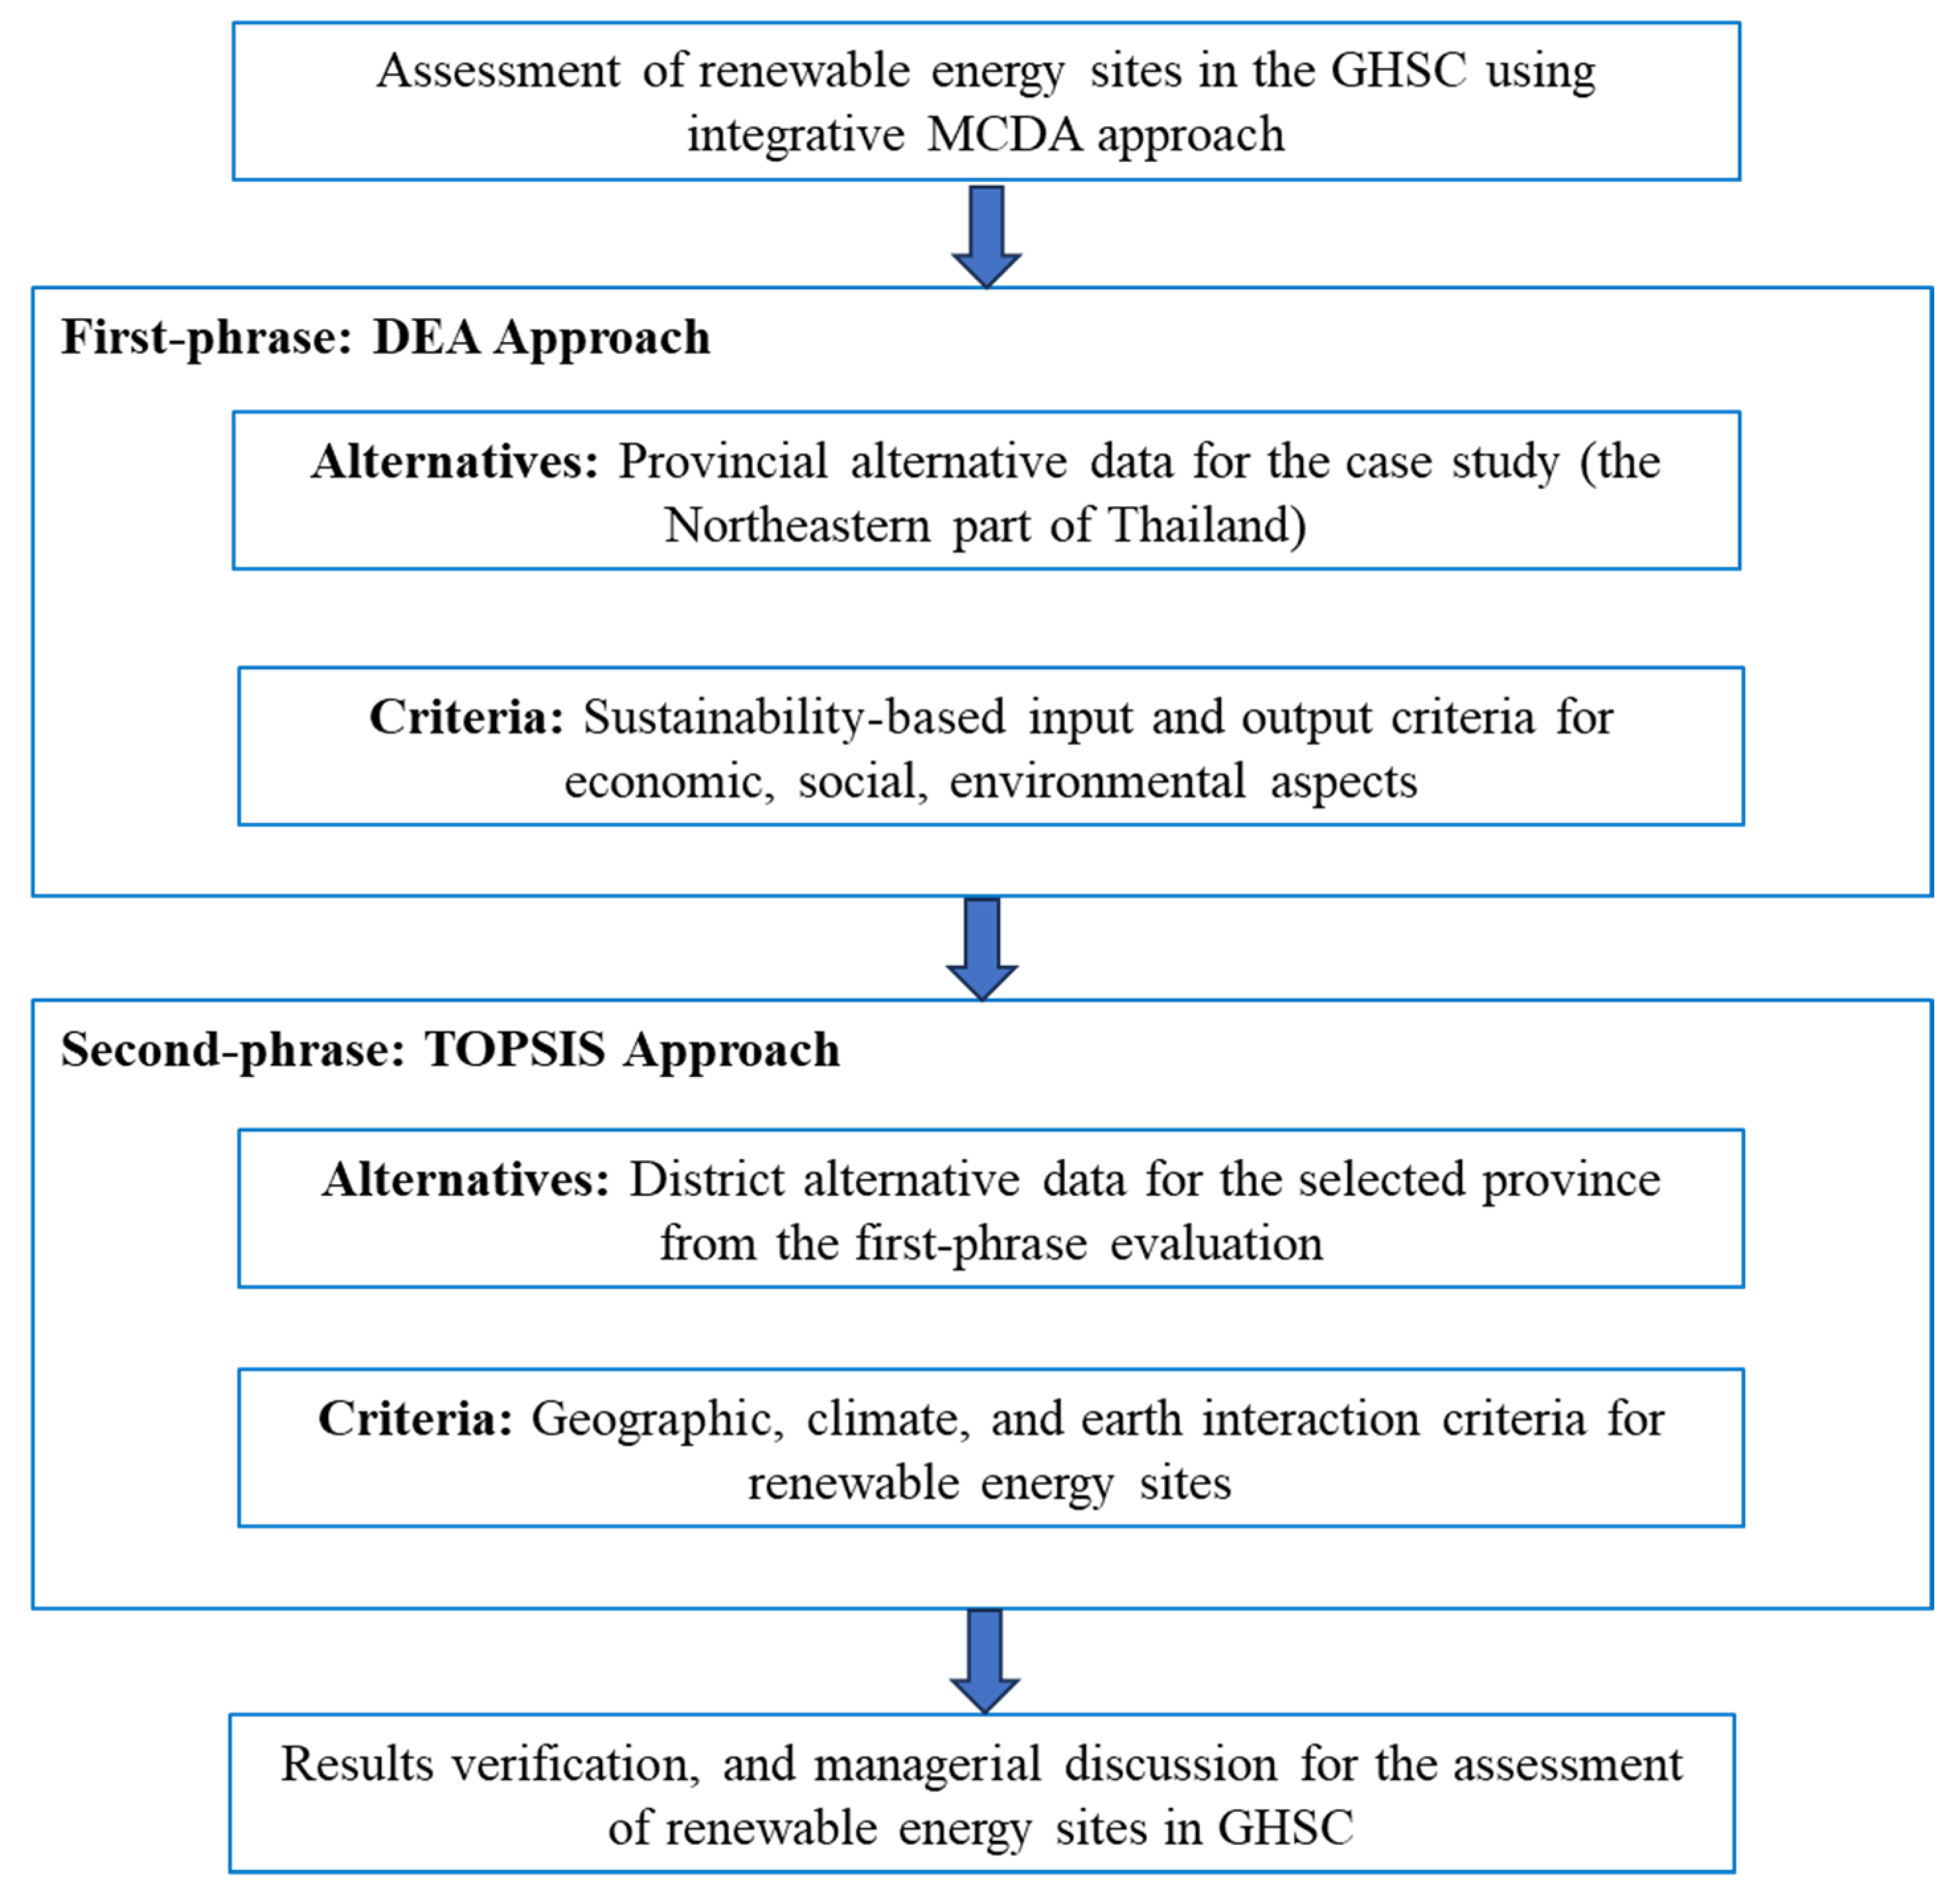
  • Rather than simply using a single methodology, our proposed two-phase integrated MCDA framework systematically incorporates both DEA and TOPSIS techniques in the study. Additionally, diverse MCDA tools (i.e., VIKOR and GRA) are further assessed and compared.
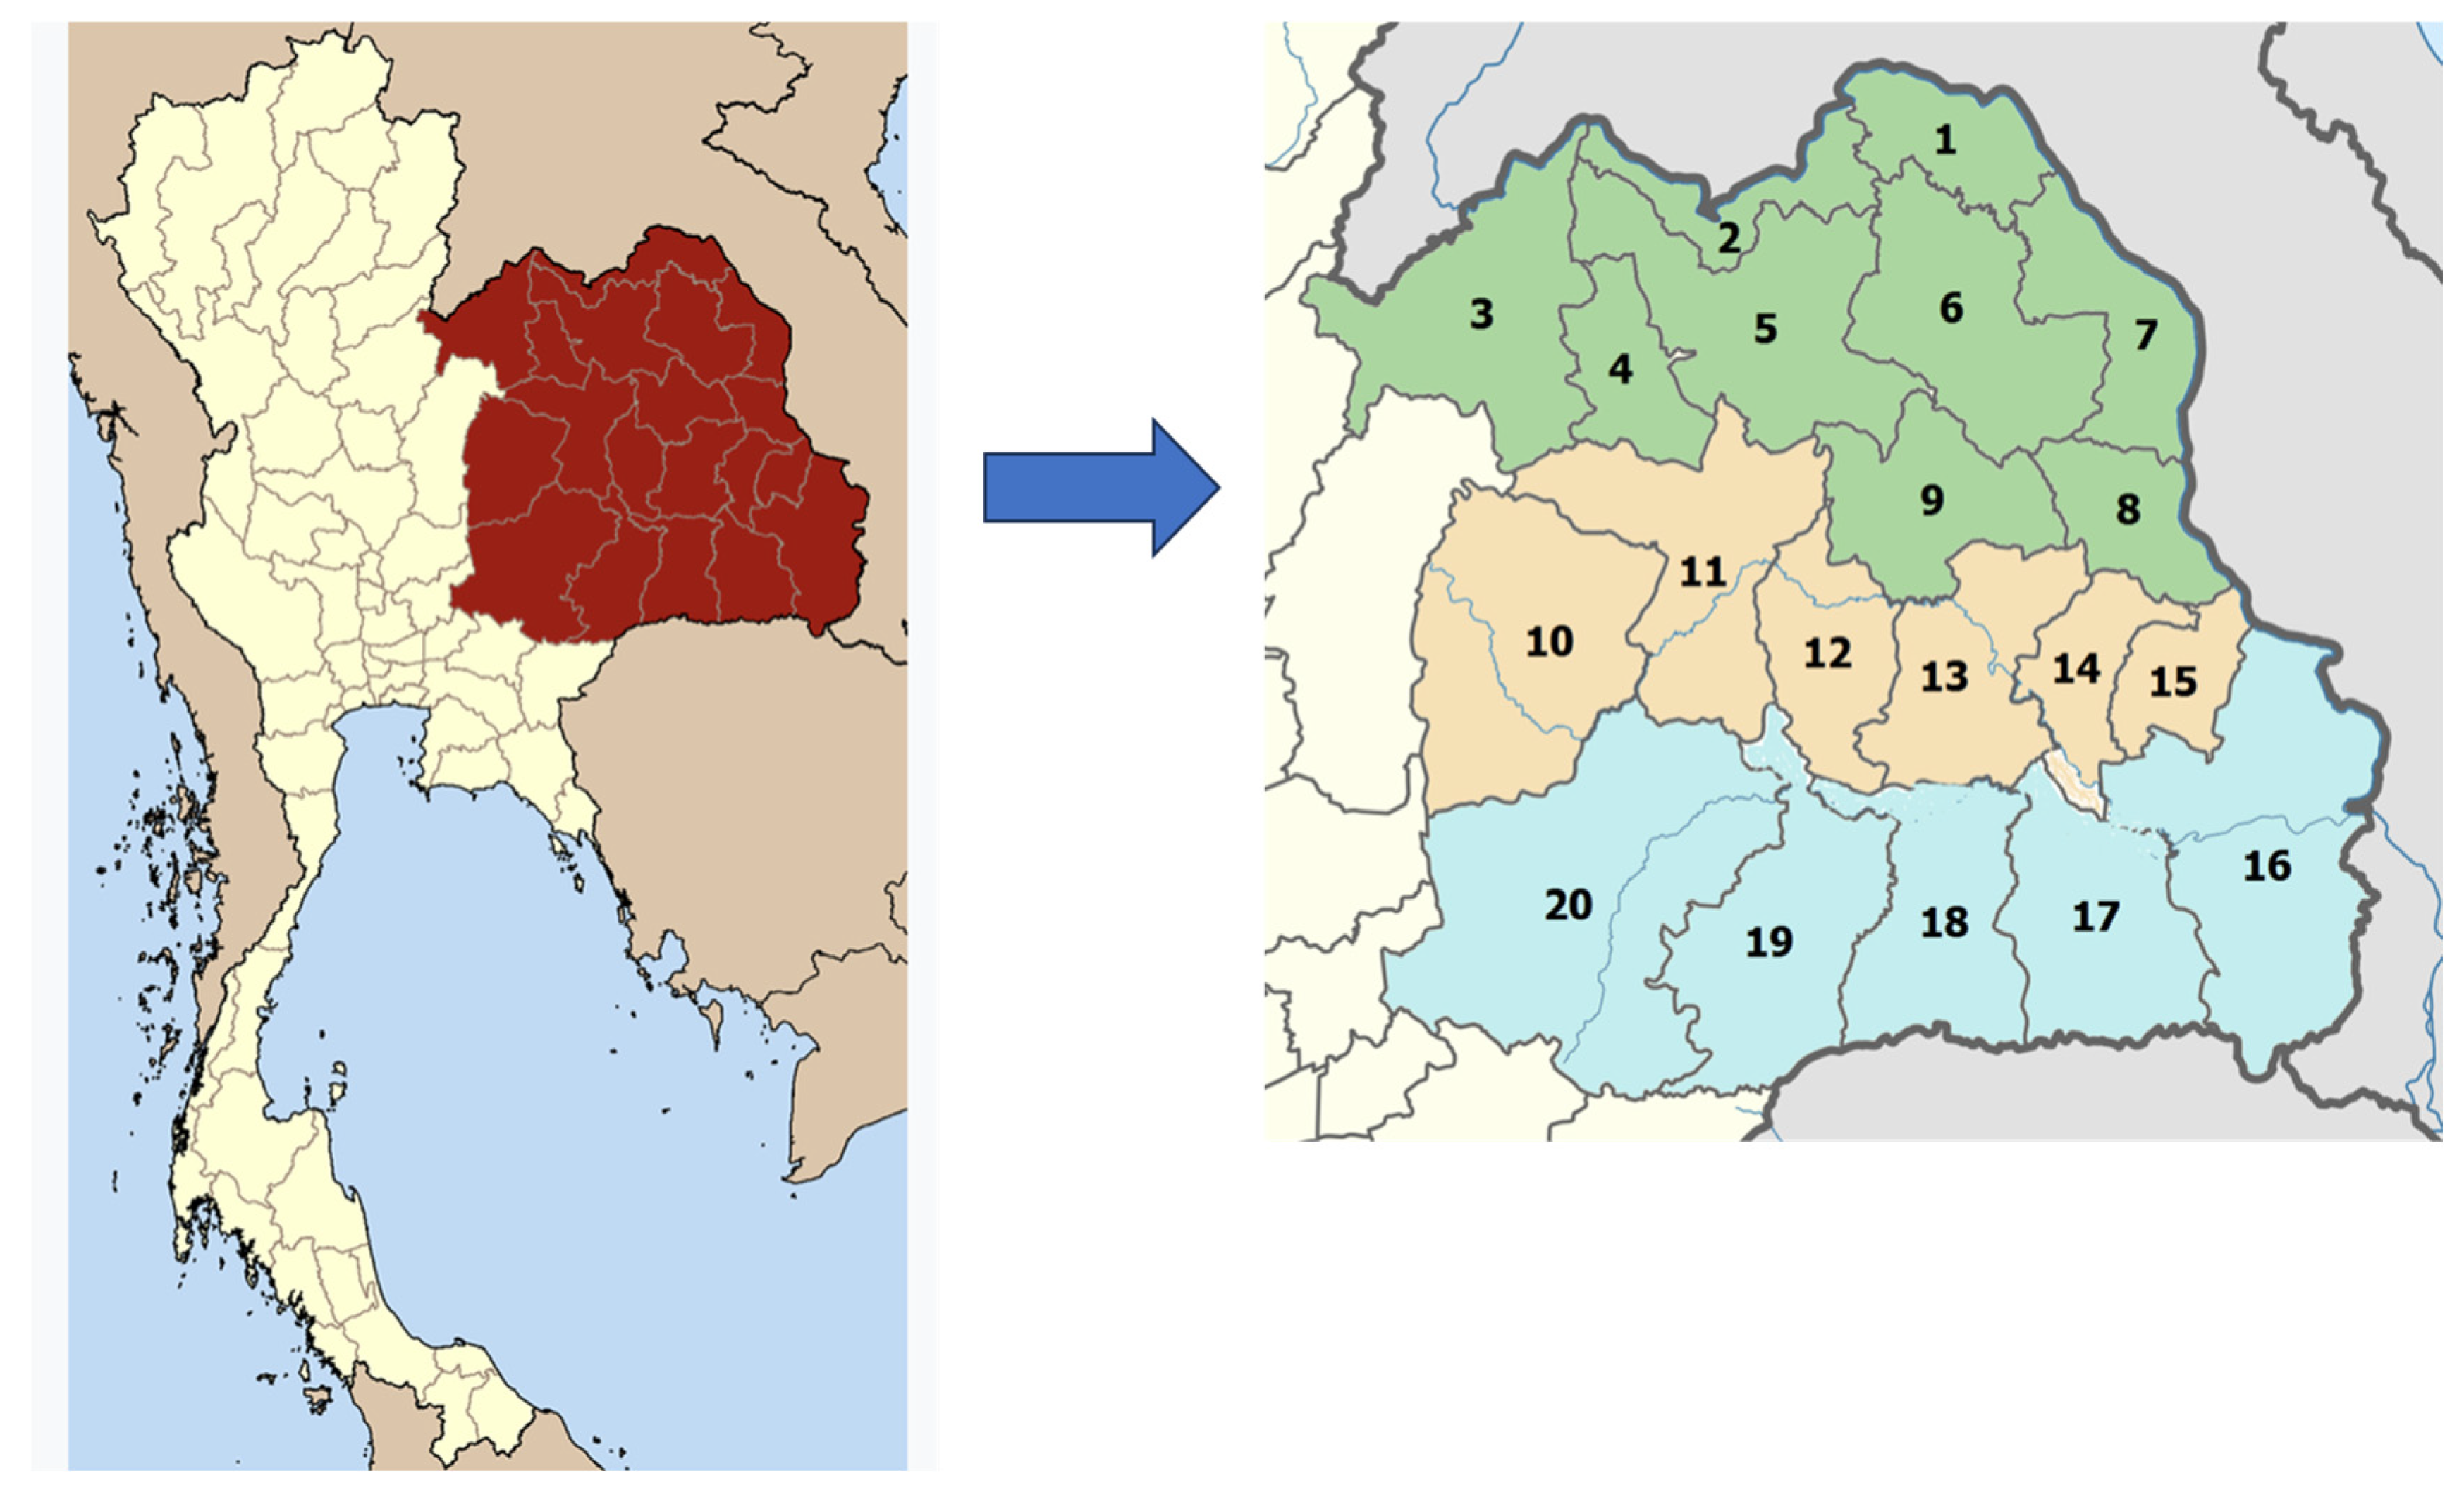
  • This study also proposes a detailed case study which takes the hierarchical structure of the governmental governance structure linking the provincial alternatives in the realm of sustainability to district areas to evaluate potential renewable energy locations sequentially.
  • Rather than focusing on a single case study region with a specific renewable energy type, our study uses real data from the northeastern part of Thailand with varied regional areas and evaluates potential renewable energy locations related to both solar and wind renewable energy types in an integrated way in this study.

3. Multi-Criteria Decision Analysis Framework

We next present the methodology section based on the integrative MCDA-based framework to evaluate multiple conflicting sustainability-based criteria for potential locations of renewable energy sites in the GHSC, as presented in Figure 3. In particular, the DEA approach is initially used to systematically assess the relative efficiency of provincial alternatives under consideration. During the first phase, provincial alternatives or decision-making units (DMUs) from the northeastern part of Thailand are evaluated, where the input and output criteria from the sustainability aspects (i.e., economic, social, and environmental aspects) are used in the analysis. Then, the TOPSIS technique is further examined to assess district areas to locate renewable energy solar and wind farms based on geographic, climate, and earth interaction criteria obtained from the Geographic Information System (GIS).
The TOPSIS technique, in particular, is based on the idea that the chosen alternative should have the shortest distance from the ideal solution and the farthest distance from the negative ideal solution. In addition, selective well-known MCDA tools called the grey relational analysis (GRA) method and ‘VIekriterijumsko KOmpromisno Rangiranje’ (VIKOR), a Serbian term for multi-criteria optimization and compromise solution, are further used as a part of the result verification and discussion to evaluate the robustness of the results [51,52]. The GRA method is based on gray system theory dealing with systems with uncertain or incomplete information, while the VIKOR method focuses on ranking and selecting from a set of alternatives and determining compromise solutions.
We next highlight the integrative MCDA framework to examine the renewable energy sites in the GHSC.

3.1. Data Envelopment Analysis (DEA)-Based Efficiency Analysis

DEA is a non-parametric method used in operational research and economics to estimate production frontiers, allowing the assessment of the relative efficiency of DMUs. DEA uses linear programming to construct an efficiency frontier from the input–output data of multiple DMUs. The technique then calculates efficiency scores by comparing each DMU to the best-performing ones, thus identifying those operating on the frontier (efficient DMUs) and those below the frontier (inefficient DMUs). DEA’s primary strength lies in its ability to handle multiple inputs and outputs without requiring a predefined functional form, making it flexible for various applications. Since its development, variations of DEA have been proposed and applied in many application areas including healthcare, education, manufacturing, and energy (e.g., [53,54]).
Recently, experts in MCDA applications have suggested that tool integration is needed to overcome the shortcomings of a particular method alone [55]. The DEA model is built upon two scale assumptions: constant returns to scale (CRS) and variable returns to scale (VRS). Specifically, the CRS assumption indicates that output changes proportionally with input changes. Conversely, the VRS assumption accounts for scenarios where the proportion of output to input changes may vary, whether increasing, constant, or decreasing. In this study, the input-oriented DEA model is applied, which seeks to minimize input for a specified output level, indicating how much a DMU can reduce its input while maintaining the same output level. The general linear programming mathematical model for the input-oriented DEA model with the CRS assumption is shown in Equations (1)–(5). Additionally, the input-oriented DEA model with the VRS assumption is described in Equations (6)–(11), where an additional convexity constraint (i.e., Equation (9)) is added to account for the VRS assumption [56].
The sets are as follows:
  • I : The set of input criteria; i     I .
  • J : The set of output criteria; j     J .
  • K : The set of alternatives or DMUs; k     K .
The parameters are as follows:
  • x i , k : The quantity of input i     I for DMU k     K ; where k 0 is the assessed DMU.
  • y j , k : The quantity of output j     J for DMU k     K ; where k 0 is the assessed DMU.
The decision variables are as follows:
  • λ k : The dual variable assigned to DMU k     K .
  • θ   : The scalar value for the efficiency score.
(DEA Input-Oriented CRS Model)
M i n i m i z e     E f f i c i e n c y     θ  
S u b j e c t   t o : k K λ k x i , k                 θ x i , k 0       ;   i I
k K λ k y j , k                 y j , k 0       ;   j J
λ k             0       ; k         K
θ               0  
(DEA Input-Oriented VRS Model)
M i n i m i z e     E f f i c i e n c y     θ  
S u b j e c t   t o : k K λ k x i , k                 θ x i , k 0       ;   i I
k K λ k y j , k                 y j , k 0       ;   j J
k K λ k   =     1  
λ k             0       ; k         K
θ               0  
Given the DEA model with CRS and VRS assumptions, scale efficiency (SE) can be evaluated as shown in Equation (12). This involves calculating the ratio of CRS efficiency to VRS efficiency to determine a DMU’s SE. Then, the SE score of 1 will indicate that the DMU is operating at the most productive scale size.
S E       =     C R S   b a s e d   E f f i c i e n c y V R S   b a s e d   E f f i c i e n c y  

3.2. Technique for Order of Preference by Similarity to Ideal Solution (TOPSIS)

We next discuss the TOPSIS technique [57,58,59,60]. The TOPSIS method is based on the concept that the optimal alternative should be closest to the positive ideal solution (PIS) and farthest from the negative ideal solution (NIS). Therefore, the PIS and NIS are first calculated, representing the best and worst scores, respectively. We also note a key assumption of the TOPSIS technique, in which evaluated criteria are assumed to be monotonically increasing or decreasing, meaning the numerical sequence always improves in one direction.
We next outline the TOPSIS method as shown in Equations (13)–(20). First, the decision-making matrix is normalized by scaling the data to be unitless (i.e., the matrix r i j in Equation (13)). Then, based on the given weight, the weighted normalized decision matrix is obtained (i.e., the matrix v i j in Equation (14)). Next, the PIS and NIS are calculated (i.e., the vector A * and A in Equations (15) and (16)), with the set J representing criteria with a positive impact (i.e., higher values are better) and the set J representing criteria with a negative impact (i.e., lower values are better). Then, the separation measure for each alternative can be computed, in which S i * is the separation measure from the PIS (i.e., Equation (17)) and S i the separation measure from the NIS (i.e., Equation (18)). Finally, the relative closeness is calculated, ranging from 0 to 1, where 0 indicates the worst condition and 1 indicates the best condition (see Equations (19) and (20)).
r i j =   x i j i = 1 m x i j 2  
v i j = w j r i j
A *   =   v 1 * , , v n *       ;   v j * = max ( v i j )   i f   j   J min ( v i j )   i f   j   J
A   =   v 1 , , v n       ; v j = min ( v i j )   i f   j   J max ( v i j )   i f   j   J
S i *     =   j = 1 n ( v i j v j * ) 2
S i     =   j = 1 n ( v i j v j ) 2
C i *   =   S i S i *       +         S i
C i *   =   1         i f   A i   =   A * 0         i f   A i   =   A      

4. Case Study and Results

4.1. Provincial-Level Analysis (Phase 1)

We next discuss the problem description relevant to the selection problem for the renewable energy sites in the GHSC using a case study of the northwestern part of Thailand. Specifically, the first-phase problem involves analyzing provincial alternatives by considering key input and output criteria related to the sustainability paradigm. Next, the second-phase problem is related to investigating potential solar and wind farm sites, given criteria data related to air temperature, terrain elevation, direct normal irradiation, photovoltaic power, wind speed, and power density. Figure 4 presents the map of the northwestern part of Thailand with 20 provinces. In addition, Table 1 lists details related to the latitude and longitude of each provincial area.
We next collect input and output data to evaluate the provincial DMUs in the northeastern part of Thailand. In particular, provincial area, population density, gross domestic product (GDP), and land cost data are used as input criteria. In contrast, the Thai governmental criteria concerning sustainability based on the 5P (i.e., people, prosperity, planet, peace, and partnership) indices are used as output criteria. We note that the Thai governmental criteria are collected from the ‘Indicators for Provincial and Regional Development’ report published by the Office of the National Economic and Social Development Council [61] in Thailand.
According to the report, the Sustainable Development Goals (SDGs) framework proposed by the United Nations (e.g., [62,63]) is used as a basis for indicators’ development to provide the province with indicator data that reflects the level of development in the area and to ensure consistency in preparing SDGs indicators at the national level. The report’s final score is called the composite index, which is normalized from five main criteria and sub-criteria with equal weight consideration to obtain the provincial overall score from 0 to 100, where the maximum number is considered better. We briefly discuss key sustainability-based criteria for the 5P indicators, as shown in Table 2. In particular, the people score, the prosperity score, the planet score, the peace score, and the partnership score are normalized from seven, eleven, five, five, and four sub-criteria, respectively. Interested readers are encouraged to consult the report for more details.
We next present data collection related to the provincial DMUs concerning the above input and output criteria as presented in Table 3. Then, both the DEA input-oriented CRS and VRS models are used to obtain the efficiency scores as presented in Table 4. The SE analysis is also conducted and reported as shown in the table. Figure 5 graphically displays the evaluated DEA concerning CRS, VRS, and SE analysis. In particular, 12 DMUs are considered relatively efficient when compared to other provincial DMUs and can serve as a set of benchmarking provinces. These efficient DMUs are DMU1 (i.e., Bueng Kan province), DMU2 (i.e., Nong Khai province), DMU3 (i.e., Loei province), DMU4 (i.e., Nongbua Lamphu province), DMU8 (i.e., Mukdahan province), DMU10 (i.e., Chaiyaphum province), DMU11 (i.e., Khon Kaen province), DMU13 (i.e., Roi Et province), DMU14 (i.e., Yasothon province), DMU15 (i.e., Amnat Charoen province), DMU16 (i.e., Ubon Ratchathani province), and DMU19 (i.e., Buriram province), respectively.

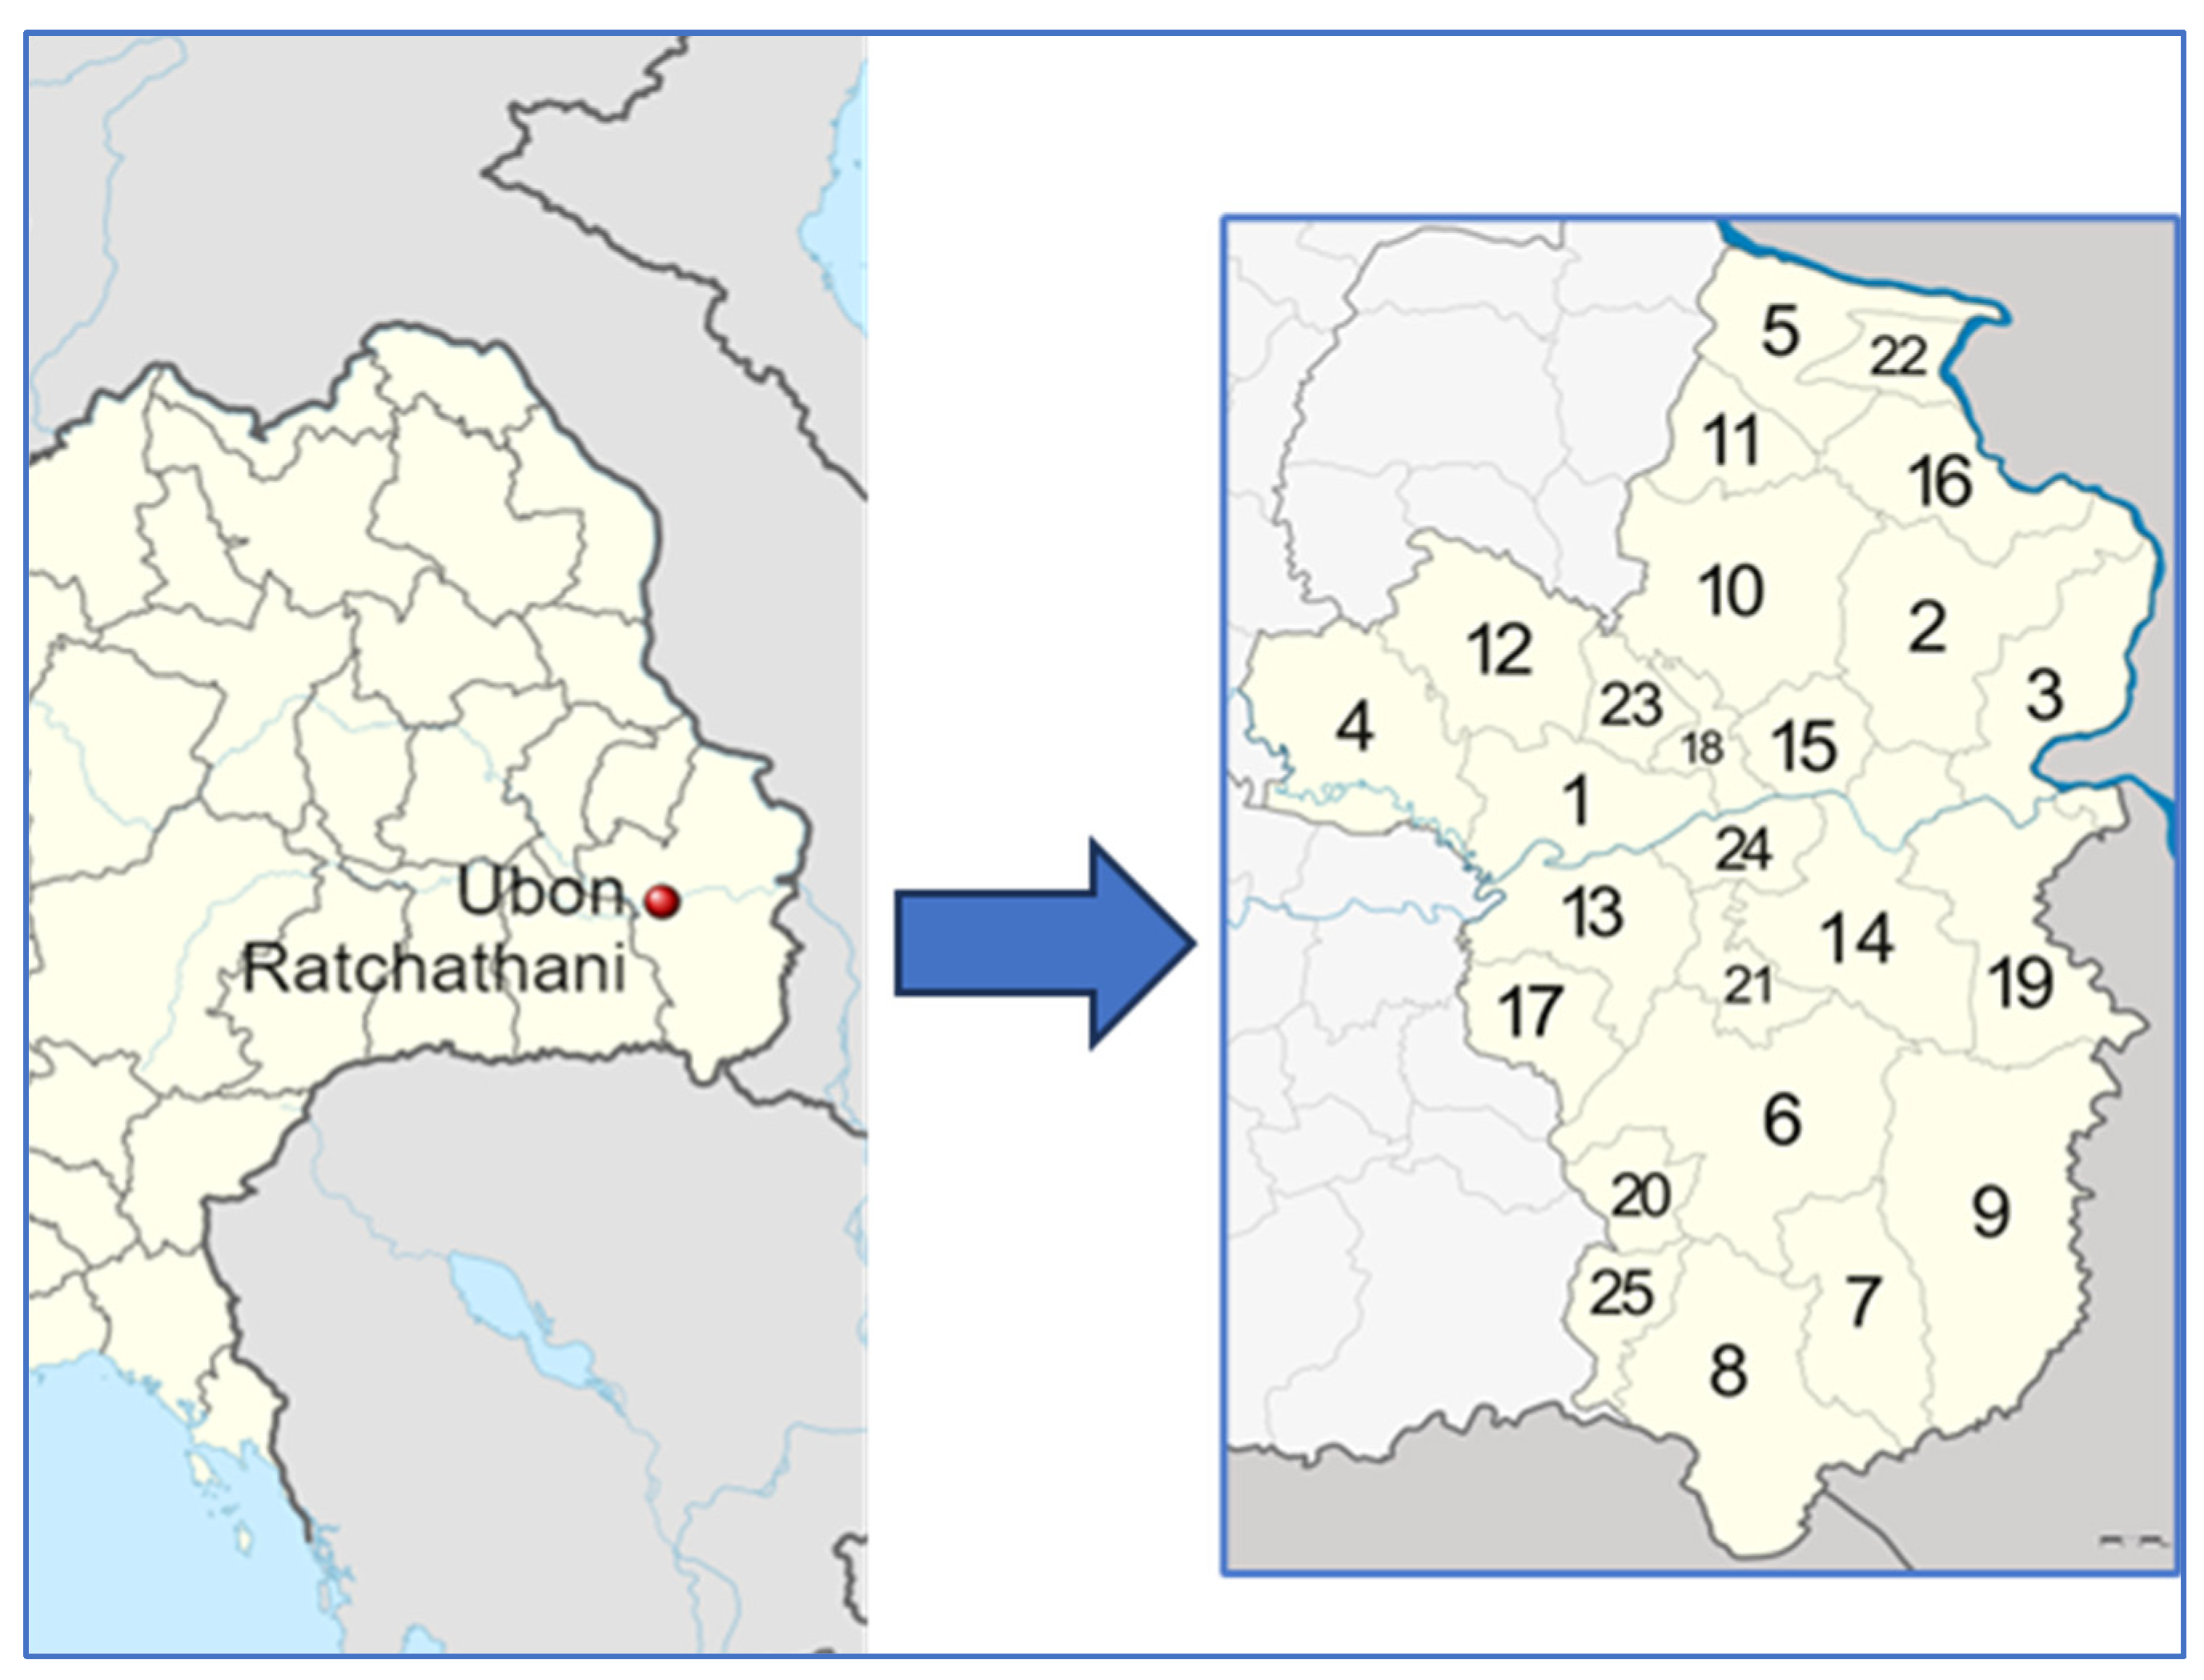
4.2. District-Level Analysis (Phase 2)

We next evaluate the second-phase problem to analyze regional districts for one of the relatively efficient provinces found from the first-phase study to obtain the ranking list of potential renewable energy sites in the GHSC. DMU16 (i.e., Ubon Ratchathani province) is, in particular, chosen to illustrate the district-level analysis in our case study. We note, however, that a similar analysis can also be performed for other relatively efficient provinces as well. Figure 6 presents 25 district areas in DMU16, in which key locational details are presented as shown in Table 5, respectively.
We will now examine the criteria for evaluating the potential district locations related to solar and wind farm areas within the GHSC framework. The criteria were selected based on a review of the literature concerning renewable sources (solar and wind) used in electrolysis for green hydrogen production [64,65,66,67,68]. Instead of concentrating on a single type of renewable energy, we consider both solar and wind, as they are commonly integrated into the GHSC grid infrastructure in various studies (e.g., [69,70]). Specifically, data for six criteria—air temperature, terrain elevation, direct normal irradiation, photovoltaic power, power density, and wind speed—were sourced from the Global Solar Atlas (GSA) and Global Wind Atlas (GWA) [71,72] as follows. We note that the six assessed criteria are assigned the same (i.e., equal) weights in this study, given that the renewable energy assessment criteria are based on GIS data and, thus, are considered with the same importance.
The first criterion is the (C1) Air temperature (°C), which represents the average monthly air temperature at 2 m above the ground. Higher temperatures can reduce the energy output of solar panels and decrease air density, thereby diminishing wind turbine energy output. Thus, lower air temperature is considered better for both solar and wind farm locations. The second criterion is the (C2) Terrain elevation (m), which measures the height of the terrain above or below sea level. Higher elevations often receive more direct irradiation, enhancing solar power output. Similarly, wind turbines on elevated terrain tend to generate more power than those on flat ground. However, flat or gently sloping terrain also impacts installation and maintenance. Hence, this criterion is considered better when it is higher for both solar and wind evaluations. Next, the third criterion is the (C3) Direct normal irradiation (DNI) (kWh/m2) defined as the average monthly direct normal irradiation, representing the amount of solar radiation per unit area. Higher irradiance increases solar output and power generation. Additionally, uneven solar heating and the earth’s irregular surfaces influence wind patterns. Therefore, a higher DNI is considered better for solar evaluation.
In addition, the fourth criterion is the (C4) Photovoltaic power (kWh/kWp), which is derived based on the average monthly photovoltaic electricity (AC) delivered by a PV system and is normalized to 1 kWp of installed capacity. Thus, higher values are preferable, especially for solar evaluation. The fifth criterion is the (C5) Power density (W/m2), which measures mean wind power density, indicating wind resource quality. Higher densities suggest better wind resources. Therefore, this criterion is considered better when higher, particularly for wind farm evaluation. Finally, the sixth criterion is the (C6) Wind speed (m/s), which represents the mean wind speed, reflecting wind resource quality. Higher wind speeds usually indicate better wind resources. Additionally, PV panels with wind speed can generate more power than without. However, caution is required for high wind events that may impact system structure. Thus, this criterion is considered better when it is higher, especially for wind farm evaluation.
We next discuss data collection from the GSA and the GWA related to how different alternatives perform under each criterion. Specifically, the GSA is a map-based tool that offers global information on solar resources and photovoltaic power potential. This platform is provided by the Energy Sector Management Assistance Program (ESMAP), funded and administered by the World Bank, and developed under contract by Solargis. Similarly, the GWA is a web-based application designed to identify high-wind areas for global wind power generation. Initially developed under the Clean Energy Ministerial framework led by Germany, Spain, and Denmark, the GWA platform is now managed by the World Bank to ensure that it is updated and aligned with the GSA. Figure 7 illustrates the GIS-based heat map data for the air temperature (i.e., C1), terrain elevation (i.e., C2), direct normal irradiation (i.e., C3), photovoltaic power (i.e., C4), power density (i.e., C5), and wind speed (i.e., C6) for all the district areas of the selected DMU16, respectively. The data are then disaggregated at the district alternatives level and are presented in Table 6.
We now present the results of applying the TOPSIS technique to evaluate upstream strategic decisions for solar and wind farm areas in the GHSC context. As mentioned earlier, equal weights are assigned to all the GIS-based evaluated criteria in this study. Next, we computed the separations for each alternative from both the PIS and the NIS. Finally, the relative closeness values are calculated, as shown in Table 7. These values, ranging from 0 to 1, reflect the importance of each alternative’s separation from the PIS and NIS. The alternatives can then be ranked based on their relative closeness to these ideal solutions, with higher values indicating a better rank as presented in the table. The obtained results suggest the ranking list for all the district alternatives under evaluation. In particular, the top five alternatives are found to be A11 (i.e., Kut Khaopun district), followed by A16 (i.e., Pho Sai district), A22 (i.e., Na Tan district), A2 (i.e., Si Mueang Mai district), and A5 (i.e., Khemarat district), respectively.

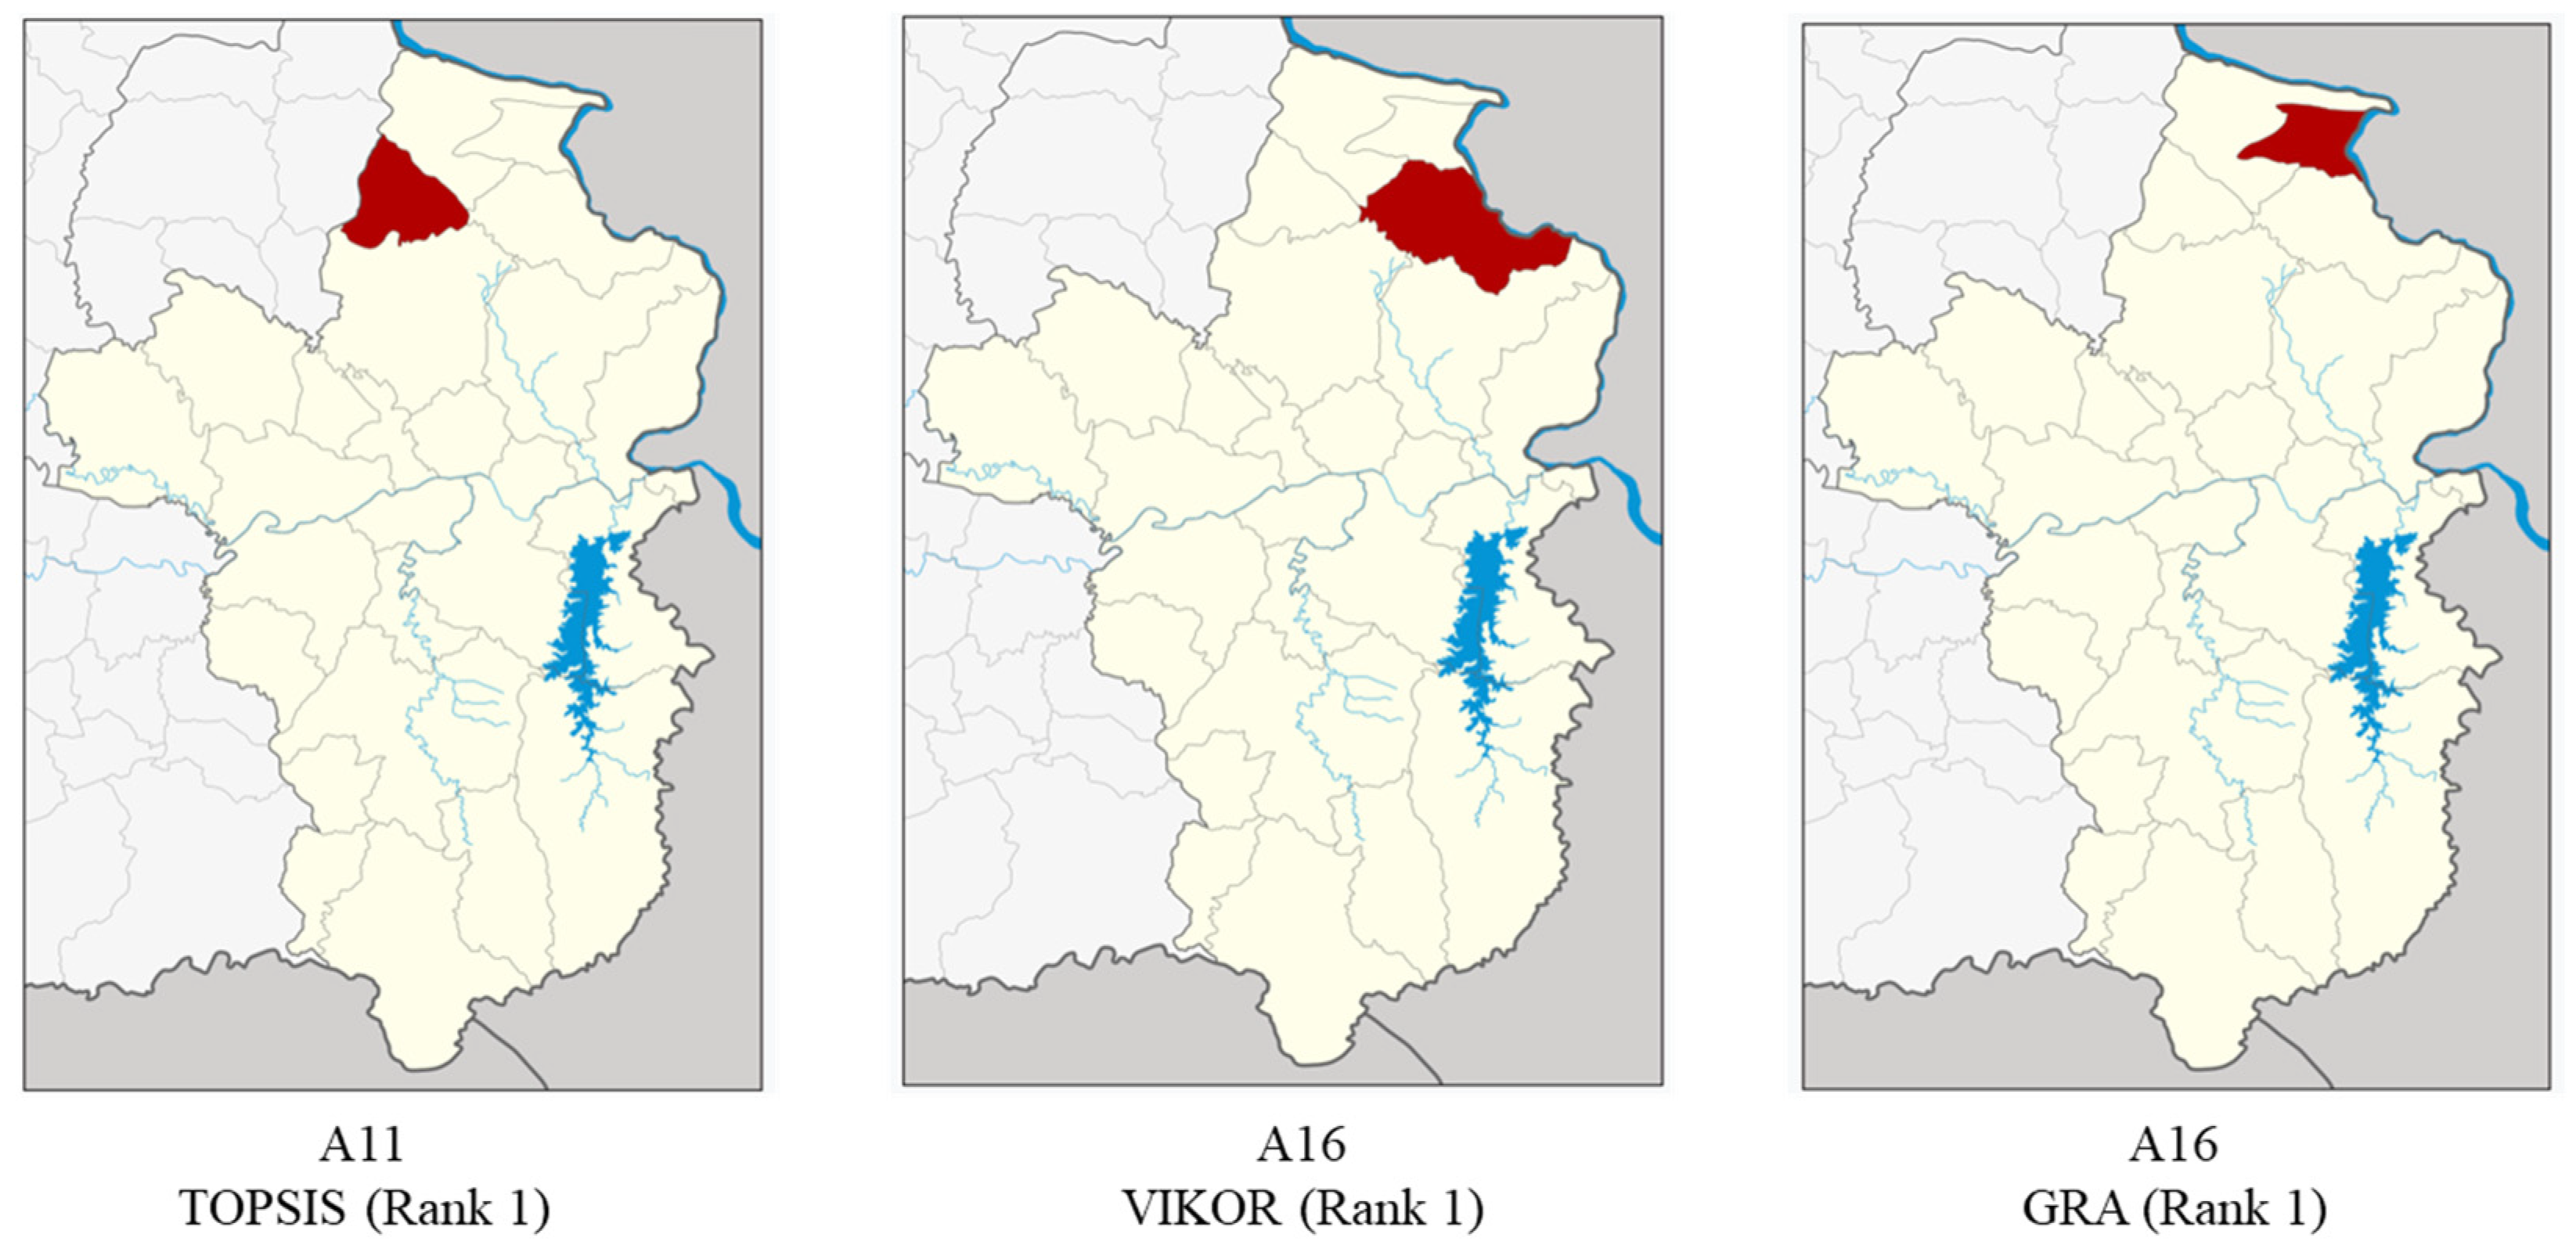
4.3. Results Verification

We next discuss the verification of results obtained from the evaluation of renewable energy sites based on the TOPSIS analysis in this subsection. As suggested by recent MCDA researchers, integrating multiple MCDA tools is necessary to tackle the drawbacks of each particular tool and to ensure consistency across obtained results. Additionally, appropriate and different normalization techniques can be applied to ensure comparability between different criteria [73]. Thus, both the GRA and VIKOR methods are further applied to evaluate the robustness of the results in our analysis. We refer readers to recent studies for more details related to GRA and VIKOR (e.g., [74,75,76]). That is, the TOPSIS technique will utilize vector normalization during the decision process, ranking alternatives by choosing the alternative that has the shortest distance to the PIS and the longest to the NIS. In contrast, the VIKOR method is known as the compromise ranking method, which implements the linear normalization technique and ranks alternatives by determining a possible solution closest to the ideal solution. Both the concepts of the maximum group utility and minimum individual regret are used in the VIKOR method during the ranking procedure. The VIKOR index computed from the utility and regret data can then be used to rank alternatives in decreasing order.
In contrast, the GRA method is based on the gray system theory, which deals with systems with uncertain or incomplete information and then measures the degree of similarity between sequences. The GRA, in particular, uses gray relational normalization to normalize data to establish a comparability sequence, then determines the gray relational coefficient to reflect the correlation between ideal and actual normalized data sequences, ultimately computing the gray relational grade for ranking. The computed gray relational grade is then used to rank alternatives, in which the high grade implies a higher rank. Table 8 presents the analyzed comparative results obtained from the VIKOR and GRA compared to the TOPSIS method presented earlier. The first ranked district area based on each particular method is also shown in Figure 8. We note that the top three results from the TOPSIS, VIKOR, and GRA are found to be slightly interchangeable. In particular, the top three districts from the TOPSIS method are A11 (i.e., Kut Khaopun district), followed by A16 (i.e., Pho Sai district), and A22 (i.e., Na Tan district). In addition, the results from the VIKOR method are found to be A16 followed by A11 and A22, whereas the results from the GRA method are ranked A22, followed by A11 and A16, respectively.

5. Managerial Insights

The demand for green hydrogen energy has increased at a steady rate, particularly in niche applications within the industrial, buildings, energy, and transport sectors. With significant breakthroughs and ongoing advancements in green hydrogen technologies, improvements in both technical and economic aspects can be anticipated. Infrastructure network design is also essential for integrating renewable energy sites with the existing grid infrastructure, thereby providing an opportunity for efficient and effective clean energy to communities in a sustainable way. This study focuses on the critical aspect of examining provincial efficiency within a sustainability context and then assessing potential renewable energy sites for the electrolysis process in the upstream production of GHSC. The two-stage integrated MCDA methodology using DEA and TOPSIS provided in this study can ensure that the sustainability paradigm is assessed at a high-level strategic decision and then supports the complex low-level decisions for the evaluation of renewable energy sites in a systematic way. However, other studies also horizontally integrate the upstream, midstream, and downstream processes in the HSCN under sustainability objectives (e.g., [77,78,79]), which can benefit from the vertical evaluation with the two-phase methodology used in this study.
Moreover, several studies point out that multiple MCDA tools with varied normalization techniques can be applied to ensure consistency across obtained results. Additionally, the sensitivity analysis with varied weight settings can also be evaluated when more criteria relevant to policy implications are added to better understand the impact of expert judgments. In this study, the results obtained from the TOPSIS technique are further compared with two well-known MCDA tools, namely VIKOR and GRA methods, in this study. It is worth noting that the ranking lists generated by the above methods can differ due to variations in their methodologies and underlying assumptions related to normalization techniques, distance metrics used, and aggregation techniques to obtain the ranking list. Thus, several studies suggest that the consistency of obtained results can be checked as to whether the top-ranked alternatives are consistently identified across the methods, thereby enhancing robustness [80,81,82,83]. Furthermore, other techniques, such as the sensitivity analysis from diverse weighting schemes, can also be used to further provide insights into the stability and reliability of the results. Additionally, we note that regional case studies are also important in the context of GHSC, given that prevalent case reports in developing countries are mostly concerned with gray and blue hydrogen types and the effective transition to green hydrogen is essential.

6. Conclusions and Future Research

The global hydrogen economy is based on the idea of utilizing hydrogen as a low-carbon, alternative energy source to provide a significant portion of national energy sustainably. The success of this hydrogen economy hinges on various factors and challenges related to key operations in the GHSC. This study focuses on evaluating the upstream process of the GHSC using a two-phase approach. First, provincial efficiency is assessed within a sustainability framework, followed by a systematic evaluation of district areas to identify suitable renewable energy sites. In particular, we highlight the application of the integrated MCDA framework based on the DEA and TOPSIS methods, which is later verified with other well-known MCDA tools, namely VIKOR and GRA, to evaluate the robustness of the results using a case study from the northeastern part of Thailand. Our study shows that about 60% of all the evaluated provinces are relatively efficient in terms of the sustainability evaluation, and can be considered strategic provinces to initiate the renewable energy projects. Then, the district evaluation is demonstrated for Ubon Ratchathani province, one of the efficient provinces, to further select the best district to locate renewable energy projects related to solar and wind farms in the area. In particular, the top three district areas are found to be Kut Khaopun district, followed by Pho Sai district, and Na Tan district, respectively. Furthermore, the verified results obtained from other MCDA tools also confirm the top three district areas with interchangeable ranks.
Our analysis provides a practical framework for policymakers and decision-makers involved in the strategic planning and design of the GHSC. Nevertheless, we further note related future research directions and the current work limitations as follows. Given that this study based its assessment on selective criteria for the proposed two-phase MCDA framework, it is evident that other criteria and sub-criteria may be further integrated and/or compared. It is also interesting to consider the criteria relevant to technology acceptance, especially for countries that are still new to green hydrogen. In addition, it is expected that the outcome of this study can be further used as input data to model the GHSC supply network involving the upstream, midstream, and downstream operations.

Author Contributions

Conceptualization, K.R. and H.Z.; methodology, K.R.; validation, J.J.; formal analysis, K.R.; writing—original draft preparation, K.R.; writing—review and editing, J.J.; visualization, H.Z. All authors have read and agreed to the published version of the manuscript.

Funding

This research received no external funding.

Data Availability Statement

The original contributions presented in the study are included in the article, further inquiries can be directed to the corresponding author.

Conflicts of Interest

The authors declare no conflict of interest.

References

  1. International Energy Agency (IEA). Renewables 2022 Analysis and Forecast to 2027. 2023. Available online: https://www.iea.org/reports/renewables-2022 (accessed on 1 September 2023).
  2. Hydrogen Insights. The State of the Global Hydrogen Economy, with a Deep Dive into Renewable Hydrogen. 2023. Available online: https://hydrogencouncil.com/ (accessed on 1 September 2023).
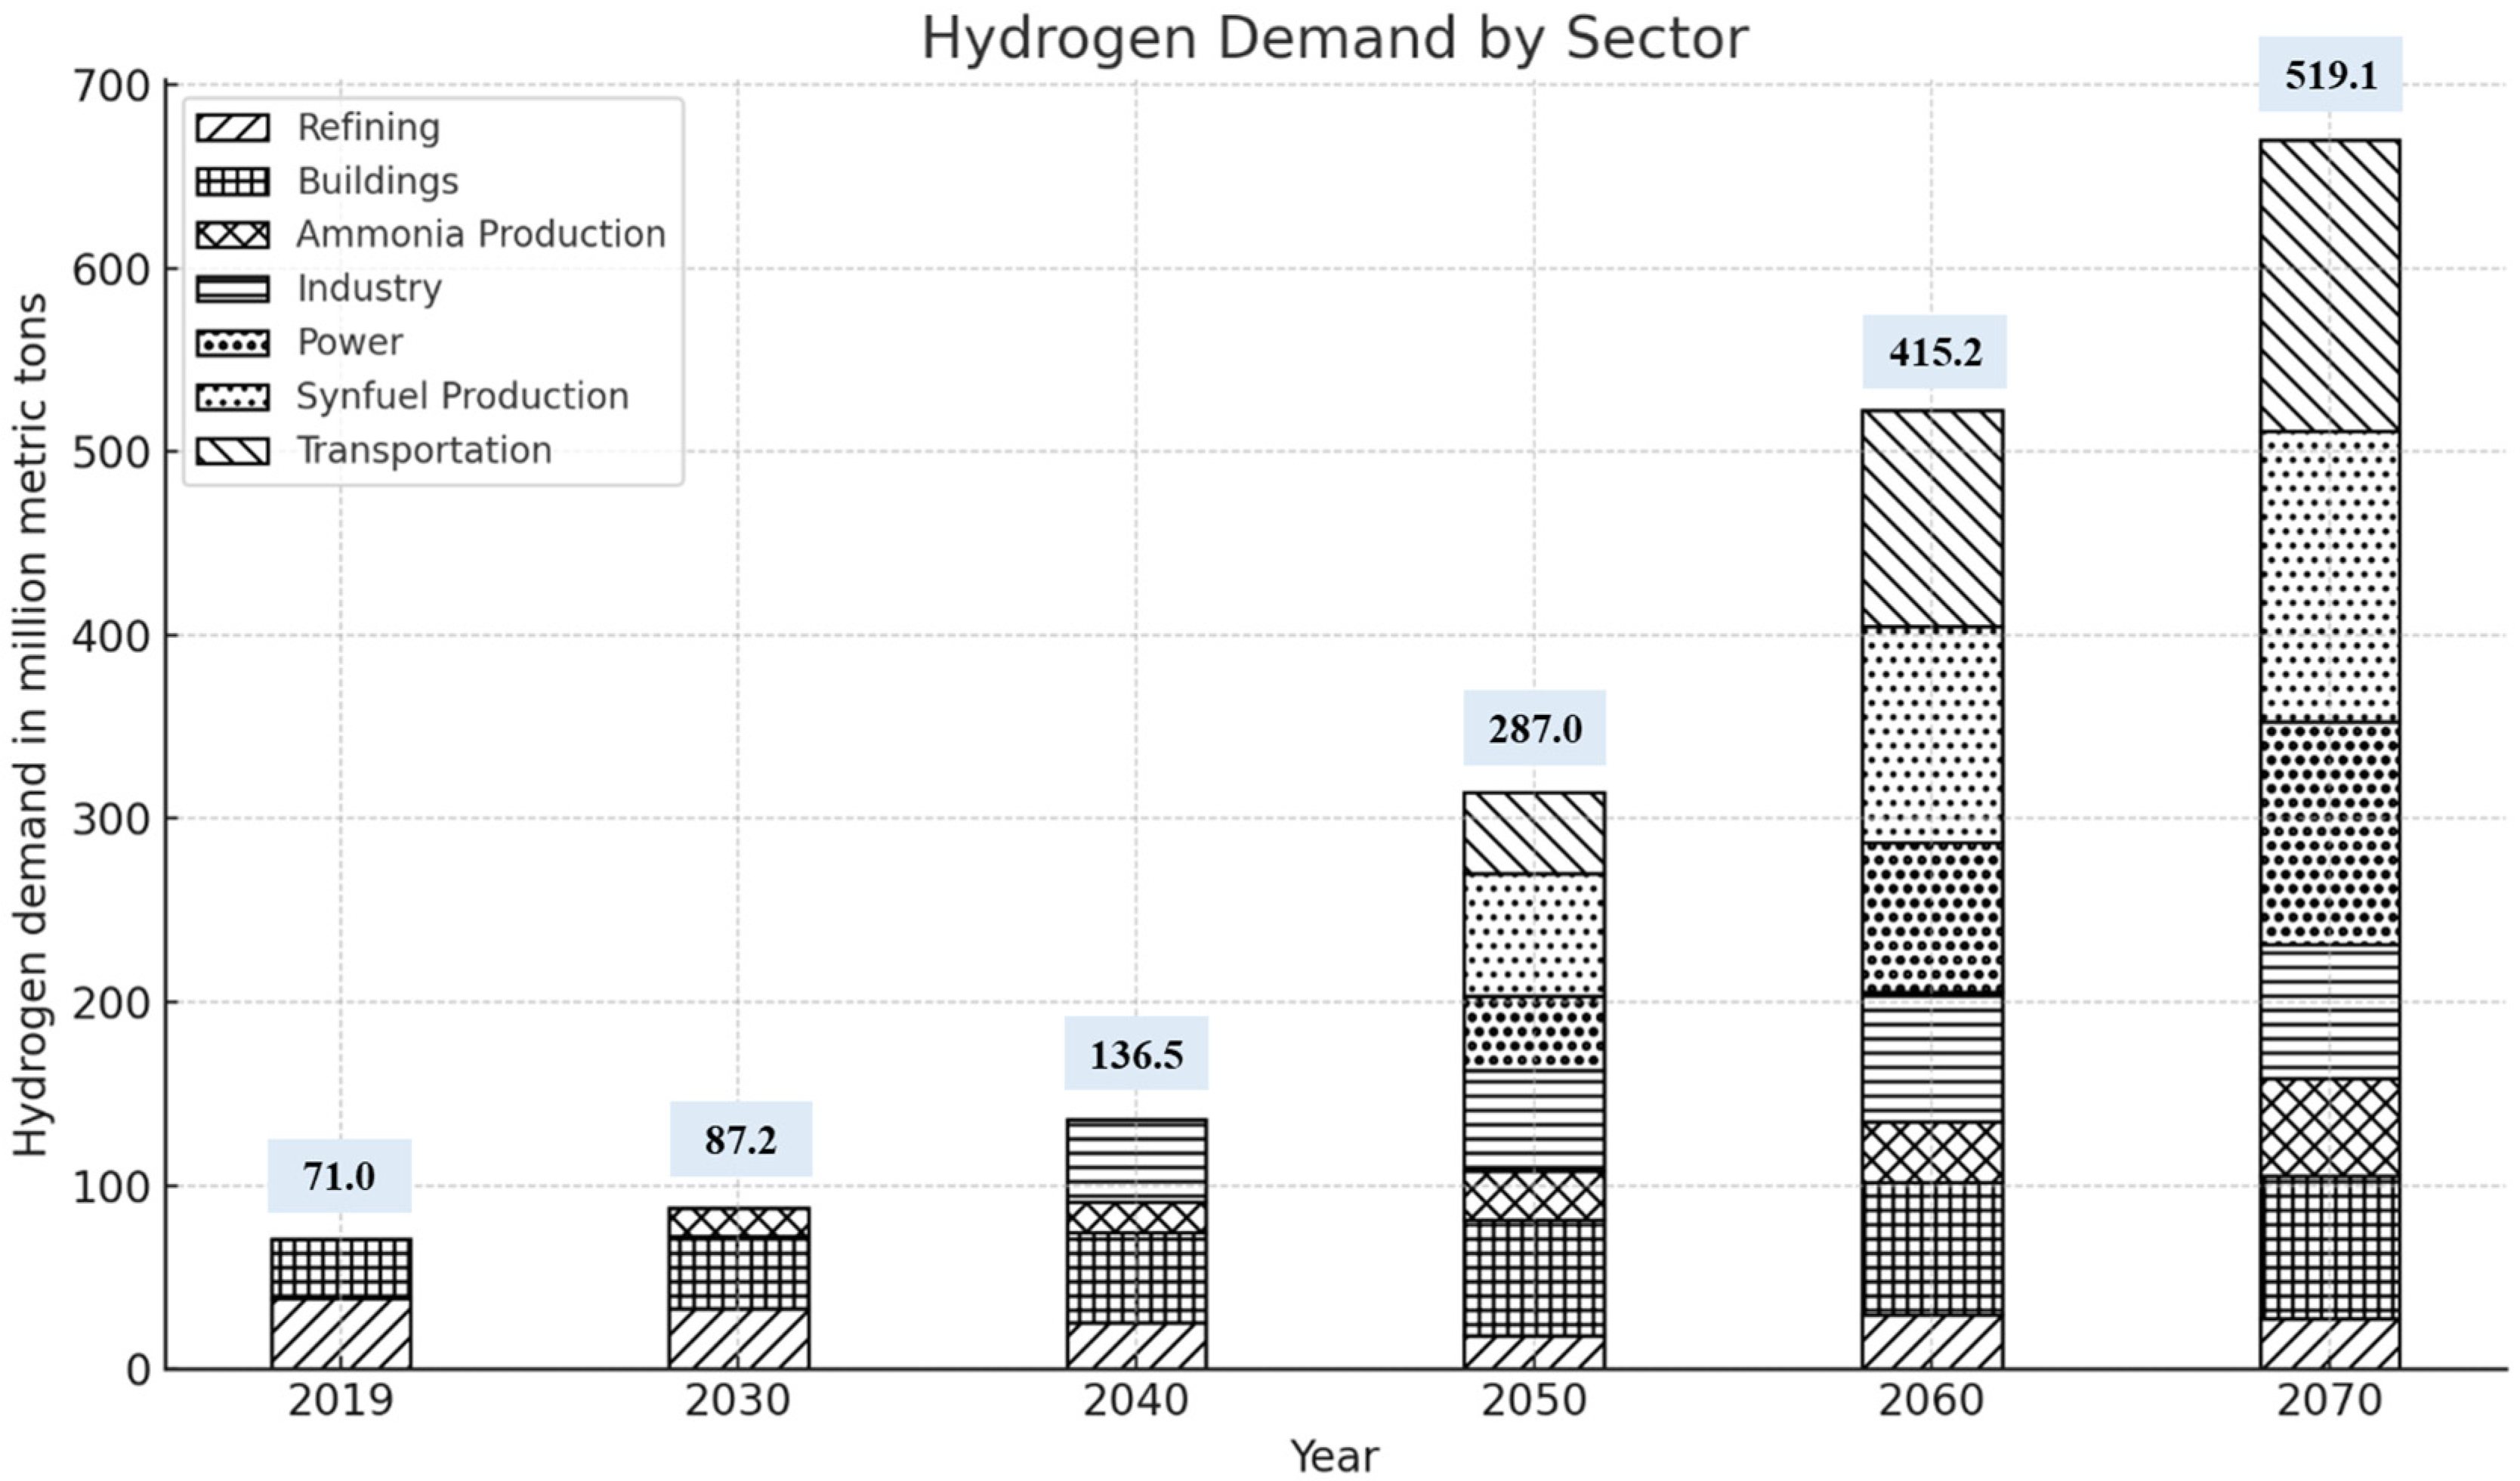
  3. Statista. Forecast Global Hydrogen Sector Demand in Sustainable Development Scenario 2019–2070. 2024. Available online: https://www.statista.com/statistics/760001/global-hydrogen-demand-by-sector-sustainable-scenario (accessed on 1 March 2024).
  4. Saha, P.; Akash, F.A.; Shovon, S.M.; Monir, M.U.; Ahmed, M.T.; Khan, M.F.H.; Sarkar, S.M.; Islam, M.K.; Hasan, M.M.; Vo, D.V.; et al. Grey, blue, and green hydrogen: A comprehensive review of production methods and prospects for zero-emission energy. Int. J. Green Energy 2024, 21, 1383–1397. [Google Scholar] [CrossRef]
  5. Zainal, B.S.; Ker, P.J.; Mohamed, H.; Ong, H.C.; Fattah, I.M.R.; Rahman, S.A.; Nghiem, L.D.; Mahlia, T.I. Recent advancement and assessment of green hydrogen production technologies. Renew. Sustain. Energy Rev. 2024, 189, 113941. [Google Scholar] [CrossRef]
  6. Hassan, Q.; Algburi, S.; Sameen, A.Z.; Salman, H.M.; Jaszczur, M. Green hydrogen: A pathway to a sustainable energy future. Int. J. Hydrogen Energy 2024, 50, 310–333. [Google Scholar] [CrossRef]
  7. Abad, A.V.; Dodds, P.E. Green hydrogen characterisation initiatives: Definitions, standards, guarantees of origin, and challenges. Energy Policy 2020, 138, 111300. [Google Scholar] [CrossRef]
  8. Monteiro, E.; Brito, P.S. Hydrogen supply chain: Current status and prospects. Energy Storage 2023, 5, e466. [Google Scholar] [CrossRef]
  9. Ransikarbum, K.; Pitakaso, R.; Kim, N.; Ma, J. Multicriteria decision analysis framework for part orientation analysis in additive manufacturing. J. Comput. Des. Eng. 2021, 8, 1141–1157. [Google Scholar] [CrossRef]
  10. Sahoo, S.K.; Goswami, S.S. A comprehensive review of multiple criteria decision-making (MCDM) Methods: Advancements, applications, and future directions. Decis. Mak. Adv. 2023, 1, 25–48. [Google Scholar] [CrossRef]
  11. Ransikarbum, K.; Kim, N. Importance of Multi-objective Evaluation in 3D Printing. In Industrial Strategies and Solutions for 3D Printing: Applications and Optimization; Wiley: Hoboken, NJ, USA, 2024. [Google Scholar]
  12. Wattanasaeng, N.; Ransikarbum, K. Sustainable planning and design for eco-industrial parks using integrated multi-objective optimization and fuzzy analytic hierarchy process. J. Ind. Prod. Eng. 2024, 41, 256–275. [Google Scholar] [CrossRef]
  13. Yap, J.; McLellan, B. A historical analysis of hydrogen economy research, development, and expectations, 1972 to 2020. Environments 2023, 10, 11. [Google Scholar] [CrossRef]
  14. Koneczna, R.; Cader, J. Towards effective monitoring of hydrogen economy development: A European perspective. Int. J. Hydrogen Energy 2024, 59, 430–446. [Google Scholar] [CrossRef]
  15. Le, T.T.; Sharma, P.; Bora, B.J.; Tran, V.D.; Truong, T.H.; Le, H.C.; Nguyen, P.Q.P. Fueling the future: A comprehensive review of hydrogen energy systems and their challenges. Int. J. Hydrogen Energy 2023, 54, 791–816. [Google Scholar] [CrossRef]
  16. Husarek, D.; Schmugge, J.; Niessen, S. Hydrogen supply chain scenarios for the decarbonisation of a German multi-modal energy system. Int. J. Hydrogen Energy 2021, 46, 38008–38025. [Google Scholar] [CrossRef]
  17. Riera, J.A.; Lima, R.M.; Knio, O.M. A review of hydrogen production and supply chain modeling and optimization. Int. J. Hydrogen Energy 2023, 48, 13731–13755. [Google Scholar] [CrossRef]
  18. Ransikarbum, K.; Chanthakhot, W.; Glimm, T.; Janmontree, J. Evaluation of sourcing decision for hydrogen supply chain using an integrated multi-criteria decision analysis (MCDA) tool. Resources 2023, 12, 48. [Google Scholar] [CrossRef]
  19. Li, F.; Liu, D.; Sun, K.; Yang, S.; Peng, F.; Zhang, K.; Guo, G.; Si, Y. Towards a Future Hydrogen Supply Chain: A Review of Technologies and Challenges. Sustainability 2024, 16, 1890. [Google Scholar] [CrossRef]
  20. Liu, J.; Zhou, Y.; Yang, H.; Wu, H. Net-zero energy management and optimization of commercial building sectors with hybrid renewable energy systems integrated with energy storage of pumped hydro and hydrogen taxis. Appl. Energy 2022, 321, 119312. [Google Scholar] [CrossRef]
  21. Zhou, Y. Transition towards carbon-neutral districts based on storage techniques and spatiotemporal energy sharing with electrification and hydrogenation. Renew. Sustain. Energy Rev. 2022, 162, 112444. [Google Scholar] [CrossRef]
  22. Zhou, L.; Zhou, Y. Study on thermo-electric-hydrogen conversion mechanisms and synergistic operation on hydrogen fuel cell and electrochemical battery in energy flexible buildings. Energy Convers. Manag. 2023, 277, 116610. [Google Scholar] [CrossRef]
  23. Zhou, L.; Song, A.; Zhou, Y. Electrification and hydrogenation on a PV-battery-hydrogen energy flexible community for carbon–neutral transformation with transient aging and collaboration operation. Energy Convers. Manag. 2024, 300, 117984. [Google Scholar] [CrossRef]
  24. Ikuerowo, T.; Bade, S.O.; Akinmoladun, A.; Oni, B.A. The integration of wind and solar power to water electrolyzer for green hydrogen production. Int. J. Hydrogen Energy 2024, 76, 75–96. [Google Scholar] [CrossRef]
  25. Kumar, S.S.; Lim, H. An overview of water electrolysis technologies for green hydrogen production. Energy Rep. 2022, 8, 13793–13813. [Google Scholar] [CrossRef]
  26. Chu, C.; Wu, K.; Luo, B.; Cao, Q.; Zhang, H. Hydrogen storage by liquid organic hydrogen carriers: Catalyst, renewable carrier, and technology–a review. Carbon Resour. Convers. 2023, 6, 334–351. [Google Scholar] [CrossRef]
  27. Bárkányi, Á.; Tarcsay, B.L.; Lovas, L.; Mérő, T.; Chován, T.; Egedy, A. Future of hydrogen economy: Simulation-based comparison of LOHC systems. Clean Technol. Environ. Policy 2024, 26, 1521–1536. [Google Scholar] [CrossRef]
  28. Spatolisano, E.; Restelli, F.; Matichecchia, A.; Pellegrini, L.A.; de Angelis, A.R.; Cattaneo, S.; Roccaro, E. Assessing opportunities and weaknesses of green hydrogen transport via LOHC through a detailed techno-economic analysis. Int. J. Hydrogen Energy 2024, 52, 703–717. [Google Scholar] [CrossRef]
  29. Jiang, Y.; Ren, Z.; Li, W. Committed carbon emission operation region for integrated energy systems: Concepts and analyses. IEEE Trans. Sustain. Energy 2023, 15, 1194–1209. [Google Scholar] [CrossRef]
  30. Zhang, R.; Chen, Y.; Li, Z.; Jiang, T.; Li, X. Two-stage robust operation of electricity-gas-heat integrated multi-energy microgrids considering heterogeneous uncertainties. Appl. Energy 2024, 371, 123690. [Google Scholar] [CrossRef]
  31. Zheng, X.; Khodayar, M.E.; Wang, J.; Yue, M.; Zhou, A. Distributionally robust multistage dispatch with discrete recourse of energy storage systems. IEEE Trans. Power Syst. 2024. [Google Scholar] [CrossRef]
  32. Pawelczyk, E.; Łukasik, N.; Wysocka, I.; Rogala, A.; Gębicki, J. Recent progress on hydrogen storage and production using chemical hydrogen carriers. Energies 2022, 15, 4964. [Google Scholar] [CrossRef]
  33. Bosu, S.; Rajamohan, N. Recent advancements in hydrogen storage-Comparative review on methods, operating conditions and challenges. Int. J. Hydrogen Energy 2024, 52, 352–370. [Google Scholar] [CrossRef]
  34. Kim, C.; Cho, S.H.; Cho, S.M.; Na, Y.; Kim, S.; Kim, D.K. Review of hydrogen infrastructure: The current status and roll-out strategy. Int. J. Hydrogen Energy 2023, 48, 1701–1716. [Google Scholar] [CrossRef]
  35. Lundblad, T.; Taljegard, M.; Johnsson, F. Centralized and decentralized electrolysis-based hydrogen supply systems for road transportation–A modeling study of current and future costs. Int. J. Hydrogen Energy 2023, 48, 4830–4844. [Google Scholar] [CrossRef]
  36. Mostafaeipour, A.; Rezayat, H.; Rezaei, M. A thorough investigation of solar-powered hydrogen potential and accurate location planning for big cities: A case study. Int. J. Hydrogen Energy 2020, 45, 31599–31611. [Google Scholar] [CrossRef]
  37. Lin, R.H.; Ye, Z.Z.; Wu, B.D. A review of hydrogen station location models. Int. J. Hydrogen Energy 2020, 45, 20176–20183. [Google Scholar] [CrossRef]
  38. Almutairi, K.; Dehshiri, S.S.H.; Dehshiri, S.J.H.; Mostafaeipour, A.; Techato, K. An economic investigation of the wind-hydrogen projects: A case study. Int. J. Hydrogen Energy 2022, 47, 25880–25898. [Google Scholar] [CrossRef]
  39. Olabi, A.G.; Abdelkareem, M.A.; Mahmoud, M.S.; Elsaid, K.; Obaideen, K.; Rezk, H.; Wilberforce, T.; Eisa, T.; Chae, K.-J.; Sayed, E.T. Green hydrogen: Pathways, roadmap, and role in achieving sustainable development goals. Process Saf. Environ. Prot. 2023, 177, 664–687. [Google Scholar] [CrossRef]
  40. Gyanwali, K.; Bhattarai, A.; Bajracharya, T.R.; Komiyama, R.; Fujii, Y. Assessing green energy growth in Nepal with a hydropower-hydrogen integrated power grid model. Int. J. Hydrogen Energy 2022, 47, 15133–15148. [Google Scholar] [CrossRef]
  41. Rabiee, A.; Keane, A.; Soroudi, A. Technical barriers for harnessing the green hydrogen: A power system perspective. Renew. Energy 2021, 163, 1580–1587. [Google Scholar] [CrossRef]
  42. Eicke, L.; De Blasio, N. Green hydrogen value chains in the industrial sector—Geopolitical and market implications. Energy Res. Soc. Sci. 2022, 93, 102847. [Google Scholar] [CrossRef]
  43. Kar, S.K.; Harichandan, S.; Roy, B. Bibliometric analysis of the research on hydrogen economy: An analysis of current findings and roadmap ahead. Int. J. Hydrogen Energy 2022, 47, 10803–10824. [Google Scholar] [CrossRef]
  44. Scheller, F.; Wald, S.; Kondziella, H.; Gunkel, P.A.; Bruckner, T.; Keles, D. Future role and economic benefits of hydrogen and synthetic energy carriers in Germany: A review of long-term energy scenarios. Sustain. Energy Technol. Assess. 2023, 56, 103037. [Google Scholar] [CrossRef]
  45. International Renewable Energy Agency (IREC). Making the Breakthrough: Green Hydrogen Policies and Technology Costs. 2021. Available online: https://www.irena.org/ (accessed on 1 September 2023).
  46. Blohm, M.; Dettner, F. Green hydrogen production: Integrating environmental and social criteria to ensure sustainability. Smart Energy 2023, 11, 100112. [Google Scholar] [CrossRef]
  47. Ren, J.T.; Chen, L.; Wang, H.Y.; Tian, W.W.; Yuan, Z.Y. Water electrolysis for hydrogen production: From hybrid systems to self-powered/catalyzed devices. Energy Environ. Sci. 2024, 17, 49–113. [Google Scholar] [CrossRef]
  48. Trattner, A.; Höglinger, M.; Macherhammer, M.G.; Sartory, M. Renewable hydrogen: Modular concepts from production over storage to the consumer. Chem. Ing. Tech. 2021, 93, 706–716. [Google Scholar] [CrossRef]
  49. Panigrahy, B.; Narayan, K.; Rao, B.R. Green hydrogen production by water electrolysis: A renewable energy perspective. Mater. Today Proc. 2022, 67, 1310–1314. [Google Scholar] [CrossRef]
  50. Arsad, A.Z.; Hannan, M.A.; Al-Shetwi, A.Q.; Begum, R.A.; Hossain, M.J.; Ker, P.J.; Mahlia, T.I. Hydrogen electrolyser technologies and their modelling for sustainable energy production: A comprehensive review and suggestions. Int. J. Hydrogen Energy 2023, 48, 27841–27871. [Google Scholar] [CrossRef]
  51. Samal, S.; Dash, R. An empirical comparison of TOPSIS and VIKOR for ranking decision-making models. In Intelligent and Cloud Computing: Proceedings of ICICC 2021; Springer Nature: Singapore, 2022; pp. 429–437. [Google Scholar]
  52. Demir, G.; Chatterjee, P.; Pamucar, D. Sensitivity analysis in multi-criteria decision making: A state-of-the-art research perspective using bibliometric analysis. Expert Syst. Appl. 2024, 237, 121660. [Google Scholar] [CrossRef]
  53. Ransikarbum, K.; Chaiyaphan, C.; Suksee, S.; Sinthuchao, S. Efficiency optimization for operational performance in green supply chain sourcing using data envelopment analysis: An empirical study. In Proceedings of the 18th International Conference on Computing and Information Technology (IC2IT 2022), Kanchanaburi, Thailand, 19–20 May 2022; Springer International Publishing: Cham, Switzerland, 2022; pp. 152–162. [Google Scholar]
  54. Nannar, S.; Sindhuchao, S.; Chaiyaphan, C.; Ransikarbum, K. Optimization of the sustainable food supply chain with integrative data envelopment analysis approach. Int. J. Manag. Sci. Eng. Manag. 2024, 1–16. [Google Scholar] [CrossRef]
  55. Ransikarbum, K.; Pitakaso, R. Multi-objective optimization design of sustainable biofuel network with integrated fuzzy analytic hierarchy process. Expert Syst. Appl. 2024, 240, 122586. [Google Scholar] [CrossRef]
  56. Amirteimoori, A.; Sahoo, B.K.; Charles, V.; Mehdizadeh, S. An introduction to data envelopment analysis. In Stochastic Benchmarking: Theory and Applications; Springer: Cham, Switzerland, 2022; pp. 13–29. [Google Scholar]
  57. Chanthakhot, W.; Ransikarbum, K. Integrated IEW-TOPSIS and fire dynamics simulation for agent-based evacuation modeling in industrial safety. Safety 2021, 7, 47. [Google Scholar] [CrossRef]
  58. Ransikarbum, K.; Khamhong, P. Integrated fuzzy analytic hierarchy process and technique for order of preference by similarity to ideal solution for additive manufacturing printer selection. J. Mater. Eng. Perform. 2021, 30, 6481–6492. [Google Scholar] [CrossRef]
  59. Shih, H.S.; Olson, D.L. TOPSIS and Its Extensions: A Distance-Based MCDM Approach; Springer: Cham, Switzerland, 2022; Volume 447, pp. 1–215. [Google Scholar]
  60. Pandey, V.; Komal; Dincer, H. A review on TOPSIS method and its extensions for different applications with recent development. Soft Comput. 2023, 27, 18011–18039. [Google Scholar] [CrossRef]
  61. Office of the National Economic and Social Development Council, Thailand. Indicators for Provincial and Regional Development. 2023. Available online: https://sdgs.nesdc.go.th/wp-content/ (accessed on 1 September 2023). (In Thai).
  62. Pizzi, S.; Caputo, A.; Corvino, A.; Venturelli, A. Management research and the UN sustainable development goals (SDGs): A bibliometric investigation and systematic review. J. Clean. Prod. 2020, 276, 124033. [Google Scholar] [CrossRef]
  63. United Nations: The Sustainable Development Goals Report 2023: Special Edition. 2023. Available online: https://unstats.un.org/sdgs/report/2023/ (accessed on 1 September 2023).
  64. Ahmad, L.; Khordehgah, N.; Malinauskaite, J.; Jouhara, H. Recent advances and applications of solar photovoltaics and thermal technologies. Energy 2020, 207, 118254. [Google Scholar] [CrossRef]
  65. Kotowicz, J.; Jurczyk, M.; Węcel, D. The possibilities of cooperation between a hydrogen generator and a wind farm. Int. J. Hydrogen Energy 2021, 46, 7047–7059. [Google Scholar] [CrossRef]
  66. Hasan, K.; Yousuf, S.B.; Tushar, M.S.H.K.; Das, B.K.; Das, P.; Islam, M.S. Effects of different environmental and operational factors on the PV performance: A comprehensive review. Energy Sci. Eng. 2022, 10, 656–675. [Google Scholar] [CrossRef]
  67. Parthiban, R.; Ponnambalam, P. An enhancement of the solar panel efficiency: A comprehensive review. Front. Energy Res. 2022, 10, 937155. [Google Scholar] [CrossRef]
  68. Kamil, K.R.; Samuel, B.O.; Khan, U. Green hydrogen production from photovoltaic power station as a road map to climate change mitigation. Clean Energy 2024, 8, 156–167. [Google Scholar] [CrossRef]
  69. Temiz, M.; Dincer, I. Development of solar and wind based hydrogen energy systems for sustainable communities. Energy Convers. Manag. 2022, 269, 116090. [Google Scholar] [CrossRef]
  70. Uchman, W.; Kotowicz, J.; Sekret, R. Investigation on green hydrogen generation devices dedicated for integrated renewable energy farm: Solar and wind. Appl. Energy 2022, 328, 120170. [Google Scholar] [CrossRef]
  71. Global Solar Atlas. Available online: https://globalsolaratlas.info/map (accessed on 1 March 2024).
  72. Global Wind Atlas. Available online: https://globalwindatlas.info/en (accessed on 1 March 2024).
  73. Sałabun, W.; Wątróbski, J.; Shekhovtsov, A. Are mcda methods benchmarkable? A comparative study of topsis, vikor, copras, and promethee ii methods. Symmetry 2020, 12, 1549. [Google Scholar] [CrossRef]
  74. Rane, N.; Achari, A.; Choudhary, S. Multi-Criteria Decision-Making (MCDM) as a powerful tool for sustainable development: Effective applications of AHP, FAHP, TOPSIS, ELECTRE, and VIKOR in sustainability. Int. Res. J. Mod. Eng. Technol. Sci. 2023, 5, 2654–2670. [Google Scholar]
  75. Jain, P.; Abhishek, K.; Chatterjee, P. (Eds.) Decision-Making Models and Applications in Manufacturing Environments; CRC Press: Boca Raton, FL, USA, 2024. [Google Scholar]
  76. Javed, S.A.; Gunasekaran, A.; Mahmoudi, A. DGRA: Multi-sourcing and supplier classification through Dynamic Grey Relational Analysis method. Comput. Ind. Eng. 2022, 173, 108674. [Google Scholar] [CrossRef]
  77. Khan, T.; Yu, M.; Waseem, M. Review on recent optimization strategies for hybrid renewable energy system with hydrogen technologies: State of the art, trends and future directions. Int. J. Hydrogen Energy 2022, 47, 25155–25201. [Google Scholar] [CrossRef]
  78. Gorji, S.A. Challenges and opportunities in green hydrogen supply chain through metaheuristic optimization. J. Comput. Des. Eng. 2023, 10, 1143–1157. [Google Scholar] [CrossRef]
  79. Özbek, B.T.; Güler, M.G. A multi period and multi objective stochastic hydrogen supply chain for Turkey. Int. J. Hydrogen Energy 2024. [Google Scholar] [CrossRef]
  80. Sahabuddin, M.; Khan, I. Multi-criteria decision analysis methods for energy sector’s sustainability assessment: Robustness analysis through criteria weight change. Sustain. Energy Technol. Assess. 2021, 47, 101380. [Google Scholar] [CrossRef]
  81. Nabavi, S.R.; Wang, Z.; Rangaiah, G.P. Sensitivity analysis of multi-criteria decision-making methods for engineering applications. Ind. Eng. Chem. Res. 2023, 62, 6707–6722. [Google Scholar] [CrossRef]
  82. Wiȩckowski, J.; Sałabun, W. Sensitivity analysis approaches in multi-criteria decision analysis: A systematic review. Appl. Soft Comput. 2023, 148, 110915. [Google Scholar] [CrossRef]
  83. Więckowski, J.; Sałabun, W.; Kizielewicz, B.; Bączkiewicz, A.; Shekhovtsov, A.; Paradowski, B.; Wątróbski, J. Recent advances in multi-criteria decision analysis: A comprehensive review of applications and trends. Int. J. Knowl.-Based Intell. Eng. Syst. 2023, 27, 367–393. [Google Scholar] [CrossRef]
Figure 1. Expected global hydrogen demand for diverse applications (adapted from [3]).
Energies 17 04073 g001
Figure 2. The schematic of the GHSC.
Energies 17 04073 g002
Figure 3. The schematic flow of the integrative MCDA research methodology.
Energies 17 04073 g003
Figure 4. Twenty provincial alternatives for the first-phase analysis.
Energies 17 04073 g004
Figure 5. Results from DEA analysis for provincial alternatives.
Energies 17 04073 g005
Figure 6. Twenty-five district areas of the efficient DMU16 for the second-phase analysis.
Energies 17 04073 g006
Figure 7. Geographic Information System (GIS)-based heat map for (a) C1, (b) C2, (c) C3, (d) C4, (e) C5, and (f) C6.
Energies 17 04073 g007
Figure 8. The first-ranked district area based on the TOPSIS, VIKOR, and GRA methods.
Energies 17 04073 g008
Table 1. Provincial DMUs’ description for the first-phase framework.
DMUsDescriptionLatitude, Longitude
DMU1Bueng Kan province18.3254, 103.6704
DMU2Nong Khai province17.8815, 102.7416
DMU3Loei province17.4866, 101.7194
DMU4Nongbua Lamphu province17.2041, 102.4444
DMU5Udon Thani province17.4166, 102.7515
DMU6Sakon Nakhon province17.1563, 104.1455
DMU7Nakhon Phanom province17.4069, 104.7808
DMU8Mukdahan province16.5430, 104.7227
DMU9Kalasin province16.4325, 103.5069
DMU10Chaiyaphum province15.8055, 102.0311
DMU11Khon Kaen province16.4333, 102.8333
DMU12Maha Sarakham province16.1772, 103.3008
DMU13Roi Et province16.0530, 103.6511
DMU14Yasothon province15.7972, 104.1430
DMU15Amnat Charoen province15.8526, 104.6333
DMU16Ubon Ratchathani province15.2288, 104.8541
DMU17Sisaket province15.1069, 104.3294
DMU18Surin province14.8851, 103.4882
DMU19Buriram province14.9941, 103.10222
DMU20Nakhon Ratchasima province14.9805, 102.1013
Table 2. Input and output criteria for the first-phase framework.
CriteriaDetails
I1Provincial areas (km2)
I2Population density (people/km2)
I3GDP value (billion Baht)
I4Minimum land cost (Baht)
I5Maximum land cost (Baht)
O1People score
  • Percentage of the population under the poverty line
  • Percentage of newborns that are underweight
  • Percentage of sick population who are inpatients
  • Population-to-doctor ratio
  • Total high school/vocational enrolment rate
  • Average number of years of education
  • Average score for upper secondary school
O2Prosperity score
  • Rate of change in average household income
  • Rate of change in provincial gross product
  • Unemployment rate
  • Ratio of average debt to average household income
  • Labor productivity
  • Household electricity consumption per population
  • Ratio of industrial fuel volume to industrial GPP
  • Percentage of people in the social security system
  • Percentage of households that own houses and land
  • Percentage of villages with a usable main road
  • Income distribution coefficient
O3Planet score
  • Rate of change in forest area in the province
  • Amount of waste correctly disposed
  • Percentage of households with access to tap water
  • Percentage of the population affected by flooding
  • Percentage of the population affected by drought
O4Peace score
  • Reporting life and property crimes cases
  • Number of prisoners (per 100,000 people)
  • Number of police officers (per 100,000 people)
  • Suicide rate (per 100,000 people)
  • Number of detainees awaiting sentencing
O5Partnership score
  • Percentage of the population with Internet access
  • Percentage of local taxes collected to total income
  • Provincial budget disbursement ability
  • Proportion of community organizations per 100,000 people
Table 3. Collected data of provincial DMUs for the first-phase framework.
DMUsI1I2I3I4I5O1O2O3O4O5
DMU140031062720017,50046.8149.9144.8363.2751.24
DMU232751604020045,00057.3652.3951.2471.6550.44
DMU310,500615315055,00054.6454.5345.2762.3436.93
DMU440991252520035,00050.7242.8446.6460.8449.73
DMU511,072143111250180,00060.4256.0254.5164.8252.5
DMU695801215623075,00053.7251.5437.8169.1844.3
DMU756371274320050,00051.4449.4345.864.2350.39
DMU84126872621035,00052.5254.2741.3767.4347.75
DMU969361425625033,50047.3552.6846.2663.7236.43
DMU1012,69891607553,50056.5348.150.6765.9351.71
DMU1110,659169204110200,00067.7750.5958.8962.3235.77
DMU1256071725625060,00062.0549.1445.5667.4539.87
DMU1378731667310080,00059.2451.1846.5263.9345.21
DMU1441311302620044,00059.3752.7743.5369.1751.44
DMU1532901151823020,00051.8953.0647.4466.1154.99
DMU1615,62612012050110,00050.4347.6449.1665.1844.69
DMU1789361657013040,00051.7651.3545.2961.1131.32
DMU1888541577313060,00043.9049.1346.4169.8439.79
DMU1910,0801598415050,00049.7448.447.6261.1946.92
DMU2020,736127275100130,00056.2347.1348.2466.4338.23
Table 4. Analyzed efficient scores of provincial DMUs for the first-phase framework.
DMU1DMU2DMU3DMU4DMU5DMU6DMU7DMU8DMU9DMU10
CRS 1.0001.0001.0001.0000.9450.7520.9101.0000.7751.000
VRS1.0001.0001.0001.0001.0000.9690.9231.0000.7751.000
SE1.0001.0001.0001.0000.9450.7760.9861.0001.0001.000
DMU11DMU12DMU13DMU14DMU15DMU16DMU17DMU18DMU19DMU20
CRS 1.0000.8281.0001.0001.0001.0000.8950.9631.0000.842
VRS1.0001.0001.0001.0001.0001.0000.8971.0001.0000.871
SE1.0000.8281.0001.0001.0001.0000.9980.9631.0000.967
Table 5. Districts’ description of the efficient DMU16 for the second-phase framework.
AlternativesDescriptionLatitude, Longitude
A1Mueang Ubon Ratchathani District15.3188, 105.4955
A2Si Mueang Mai District15.3894, 104.5513
A3Khong Chiam District16.0421, 105.2235
A4Khueang Nai District14.9030, 105.0763
A5Khemarat District14.5213, 105.2461
A6Det Udom District14.4891, 105.0008
A7Na Chaluai District14.7566, 105.4113
A8Nam Yuen District15.6122, 105.0219
A9Buntharik District15.7916, 104.9966
A10Trakan Phuet Phon District15.5108, 104.7263
A11Kut Khaopun District15.2025, 104.8675
A12Muang Sam Sip District15.2444, 105.2288
A13Warin Chamrap District15.3155, 105.1552
A14Phibun Mangsahan District15.8258, 105.2608
A15Tan Sum District15.0083, 104.7822
A16Pho Sai District15.3790, 105.0278
A17Samrong District15.2016, 105.3983
A18Don Mot Daeng District14.7333, 104.9122
A19Sirindhorn District15.0594, 105.0602
A20Thung Si Udom District15.8974, 105.2931
A21Na Yia District15.4066, 104.9233
A22Na Tan District15.2413, 105.0922
A23Lao Suea Kok District14.5833, 104.9253
A24Sawang Wirawong District15.3188, 105.4955
A25Nam Khun District15.3894, 104.5513
Table 6. Collected data of district areas for the second-phase framework.
AlternativesC1C2C3C4C5C6
A127.31251539.61394.32425.89
A2271461520.11370.23476.55
A327.31141471.61298.13046.13
A427.31271549.21406.12395.86
A526.71381506.51367.83576.95
A627.31371529.61376.51605.21
A726.61961488.91308.11134.58
A826.81861503.31338.61845.37
A9271591506.71344.71554.99
A10271351533.51392.73596.66
A1126.81541534.61394.13606.84
A1227.11421540.61392.32626.01
A1327.31331535.41392.82065.54
A1427.31281527.51383.51965.43
A1527.31281520.81364.72475.82
A1626.716015251387.73356.77
A1727.31381541.11393.41715.34
A1827.21261533.613882295.79
A1927.11541518.61368.72085.48
A2027.11621522.91363.71485.09
A2127.31381524.413651795.33
A2226.61471523.21390.13526.84
A2327.11471539.51393.12525.95
A2427.21381524.51369.12145.59
A2526.91831507.813391344.98
Table 7. Ranking list of district areas for renewable energy sites using TOPSIS.
AlternativesSeparation Measure from the PISSeparation Measure from the NISRelative Closeness ScoreRanking list
A10.023330.019120.45011
A20.011760.034010.7434
A30.020830.026950.5647
A40.023340.018810.44612
A50.013230.035700.7305
A60.031460.009200.22625
A70.035700.018620.34318
A80.025310.019450.43513
A90.030750.011960.28023
A100.013950.035300.7176
A110.009560.036610.7931
A120.018710.022560.5478
A130.026290.014480.35517
A140.028150.012720.31120
A150.022550.019570.46510
A160.008910.033880.7922
A170.029890.010770.26524
A180.024530.017350.41414
A190.023950.016530.40815
A200.031190.012350.28421
A210.029030.011370.28122
A220.011200.035280.7593
A230.019080.021640.5319
A240.024770.015760.38916
A250.032350.016120.33319
Table 8. Detailed results verification among TOPSIS, VIKOR, and GRA methods.
AlternativesTOPSIS
Ranking
VIKOR IndexVIKOR RankingGRA
Index
GRA Ranking
A1110.77415170.5601511
A240.2930840.623616
A371.00000250.4353925
A4120.74024150.622007
A550.3300650.704884
A6250.88588230.4734222
A7180.87048220.5689010
A8130.5149790.5306214
A9230.73516140.4483724
A1060.3628060.696185
A1110.0652120.765022
A1280.4292470.595598
A13170.81263180.5282115
A14200.86159210.4872318
A15100.84546200.4811620
A1620.0142410.728623
A17240.82518190.5339212
A18140.65782110.5317613
A19150.54558100.4917017
A20210.71780130.4786421
A21220.89080240.4589023
A2230.1436330.779991
A2390.4309380.591519
A24160.70026120.4851419
A25190.76607160.4927316
Disclaimer/Publisher’s Note: The statements, opinions and data contained in all publications are solely those of the individual author(s) and contributor(s) and not of MDPI and/or the editor(s). MDPI and/or the editor(s) disclaim responsibility for any injury to people or property resulting from any ideas, methods, instructions or products referred to in the content.

